Bayshore, NC
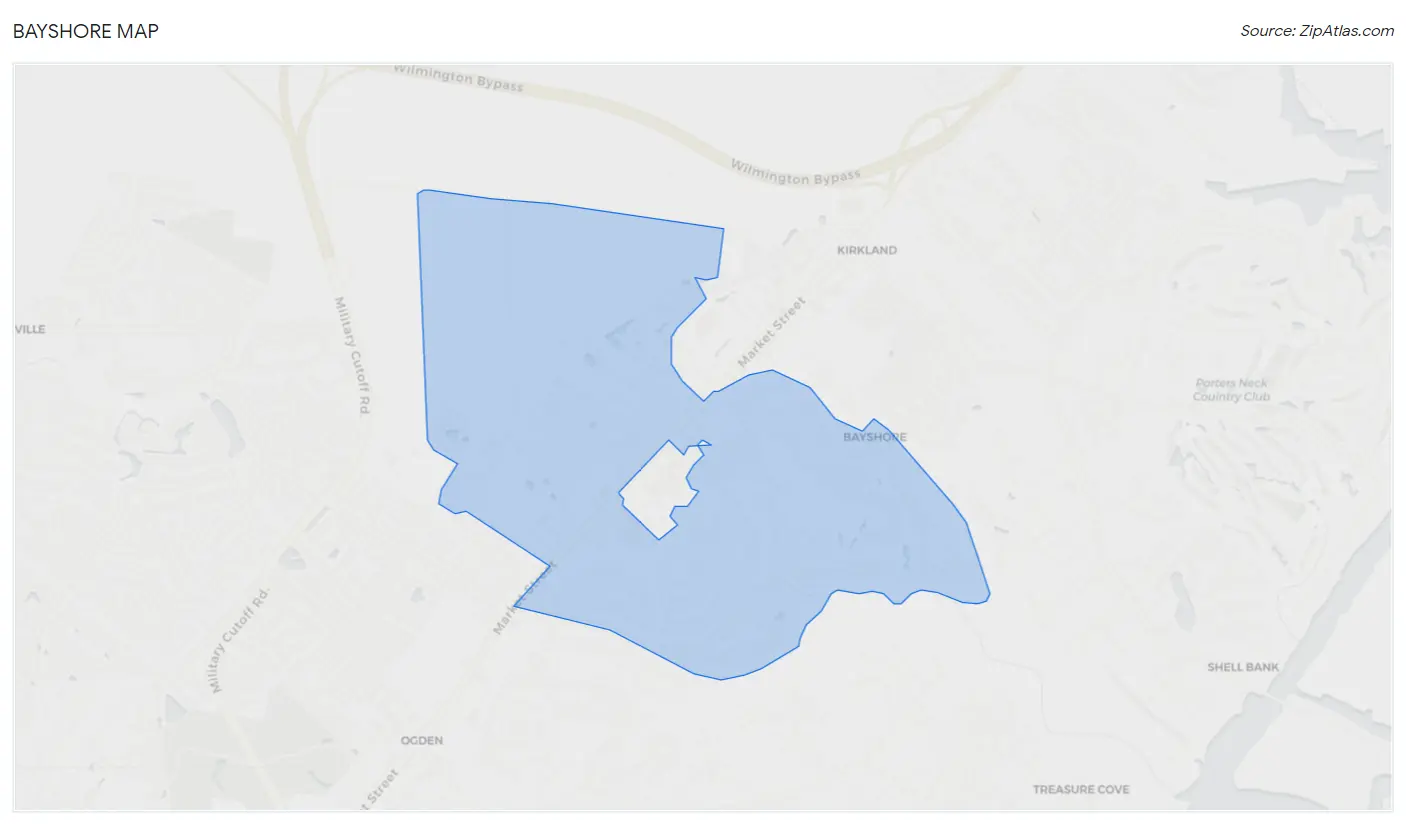
Bayshore Map
Bayshore Overview
3,066
TOTAL POPULATION
1,651
MALE POPULATION
1,415
FEMALE POPULATION
116.68
MALES / 100 FEMALES
85.71
FEMALES / 100 MALES
41.1
MEDIAN AGE
2.7
AVG FAMILY SIZE
2.6
AVG HOUSEHOLD SIZE
$50,734
PER CAPITA INCOME
$128,216
AVG FAMILY INCOME
$115,347
AVG HOUSEHOLD INCOME
3.4%
WAGE / INCOME GAP [ % ]
96.6¢/ $1
WAGE / INCOME GAP [ $ ]
0.30
INEQUALITY / GINI INDEX
1,824
LABOR FORCE [ PEOPLE ]
77.7%
PERCENT IN LABOR FORCE
2.1%
UNEMPLOYMENT RATE
Race in Bayshore
The most populous races in Bayshore are White / Caucasian (2,891 | 94.3%), Two or more Races (119 | 3.9%), and Asian (56 | 1.8%).
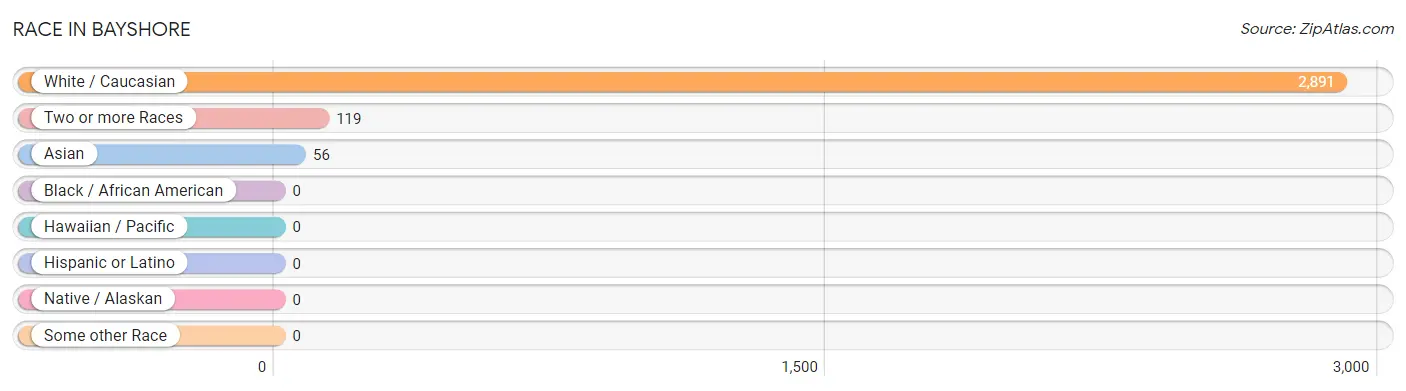
| Race | # Population | % Population |
| Asian | 56 | 1.8% |
| Black / African American | 0 | 0.0% |
| Hawaiian / Pacific | 0 | 0.0% |
| Hispanic or Latino | 0 | 0.0% |
| Native / Alaskan | 0 | 0.0% |
| White / Caucasian | 2,891 | 94.3% |
| Two or more Races | 119 | 3.9% |
| Some other Race | 0 | 0.0% |
| Total | 3,066 | 100.0% |
Ancestry in Bayshore
The most populous ancestries reported in Bayshore are Irish (359 | 11.7%), English (320 | 10.4%), American (239 | 7.8%), German (217 | 7.1%), and Polish (153 | 5.0%), together accounting for 42.0% of all Bayshore residents.
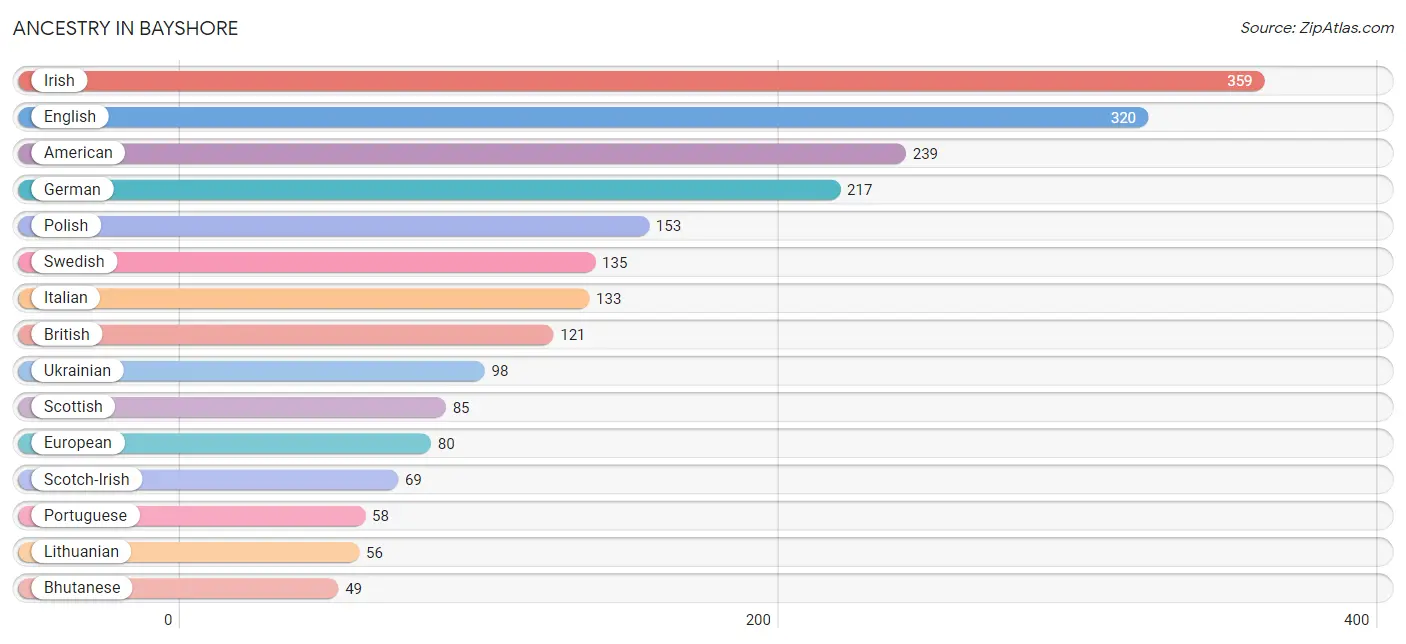
| Ancestry | # Population | % Population |
| American | 239 | 7.8% |
| Basque | 23 | 0.7% |
| Bhutanese | 49 | 1.6% |
| British | 121 | 4.0% |
| Eastern European | 44 | 1.4% |
| English | 320 | 10.4% |
| European | 80 | 2.6% |
| German | 217 | 7.1% |
| Greek | 24 | 0.8% |
| Irish | 359 | 11.7% |
| Italian | 133 | 4.3% |
| Lithuanian | 56 | 1.8% |
| Polish | 153 | 5.0% |
| Portuguese | 58 | 1.9% |
| Russian | 43 | 1.4% |
| Scotch-Irish | 69 | 2.2% |
| Scottish | 85 | 2.8% |
| Sri Lankan | 7 | 0.2% |
| Swedish | 135 | 4.4% |
| Thai | 28 | 0.9% |
| Ukrainian | 98 | 3.2% |
| Welsh | 14 | 0.5% | View All 22 Rows |
Immigrants in Bayshore
The most numerous immigrant groups reported in Bayshore came from Brazil (58 | 1.9%), Latin America (58 | 1.9%), South America (58 | 1.9%), Europe (51 | 1.7%), and Asia (49 | 1.6%), together accounting for 8.9% of all Bayshore residents.
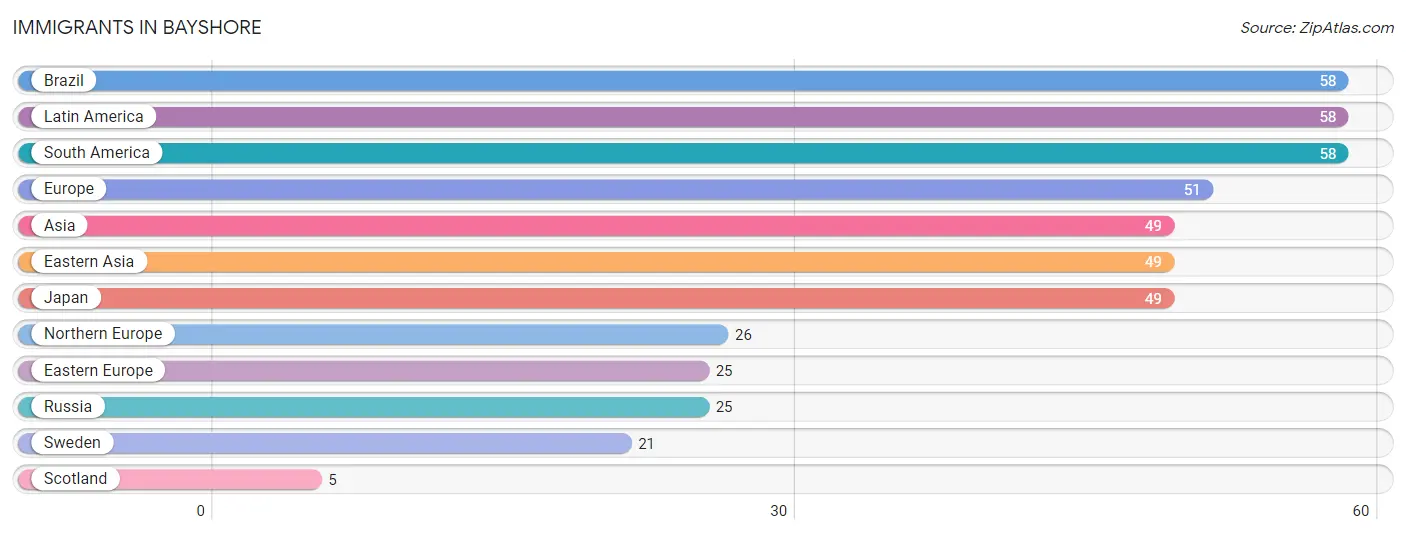
| Immigration Origin | # Population | % Population |
| Asia | 49 | 1.6% |
| Brazil | 58 | 1.9% |
| Eastern Asia | 49 | 1.6% |
| Eastern Europe | 25 | 0.8% |
| Europe | 51 | 1.7% |
| Japan | 49 | 1.6% |
| Latin America | 58 | 1.9% |
| Northern Europe | 26 | 0.9% |
| Russia | 25 | 0.8% |
| Scotland | 5 | 0.2% |
| South America | 58 | 1.9% |
| Sweden | 21 | 0.7% | View All 12 Rows |
Sex and Age in Bayshore
Sex and Age in Bayshore
The most populous age groups in Bayshore are 35 to 39 Years (169 | 10.2%) for men and 40 to 44 Years (242 | 17.1%) for women.
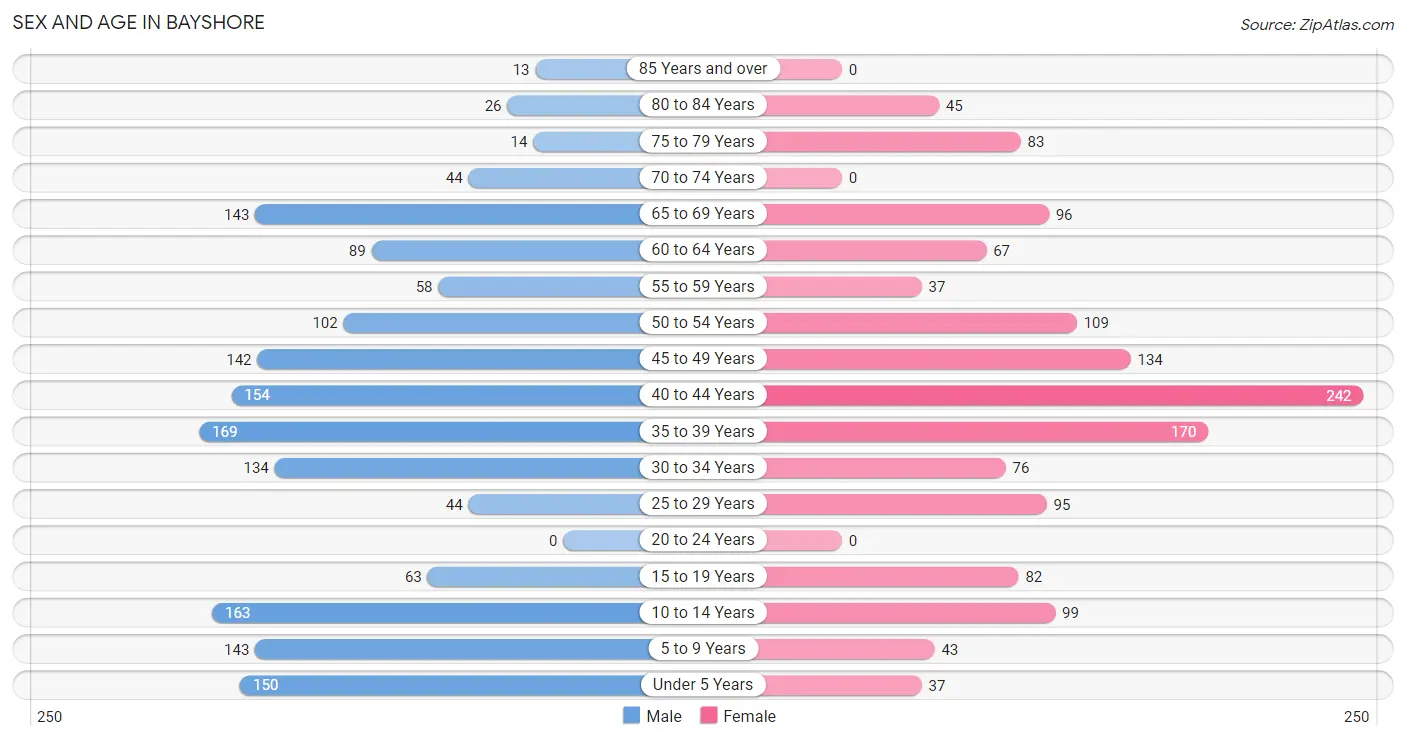
| Age Bracket | Male | Female |
| Under 5 Years | 150 (9.1%) | 37 (2.6%) |
| 5 to 9 Years | 143 (8.7%) | 43 (3.0%) |
| 10 to 14 Years | 163 (9.9%) | 99 (7.0%) |
| 15 to 19 Years | 63 (3.8%) | 82 (5.8%) |
| 20 to 24 Years | 0 (0.0%) | 0 (0.0%) |
| 25 to 29 Years | 44 (2.7%) | 95 (6.7%) |
| 30 to 34 Years | 134 (8.1%) | 76 (5.4%) |
| 35 to 39 Years | 169 (10.2%) | 170 (12.0%) |
| 40 to 44 Years | 154 (9.3%) | 242 (17.1%) |
| 45 to 49 Years | 142 (8.6%) | 134 (9.5%) |
| 50 to 54 Years | 102 (6.2%) | 109 (7.7%) |
| 55 to 59 Years | 58 (3.5%) | 37 (2.6%) |
| 60 to 64 Years | 89 (5.4%) | 67 (4.7%) |
| 65 to 69 Years | 143 (8.7%) | 96 (6.8%) |
| 70 to 74 Years | 44 (2.7%) | 0 (0.0%) |
| 75 to 79 Years | 14 (0.9%) | 83 (5.9%) |
| 80 to 84 Years | 26 (1.6%) | 45 (3.2%) |
| 85 Years and over | 13 (0.8%) | 0 (0.0%) |
| Total | 1,651 (100.0%) | 1,415 (100.0%) |
Families and Households in Bayshore
Median Family Size in Bayshore
The median family size in Bayshore is 2.73 persons per family, with single female/mother families (77 | 8.3%) accounting for the largest median family size of 3.25 persons per family. On the other hand, married-couple families (771 | 83.5%) represent the smallest median family size with 2.63 persons per family.
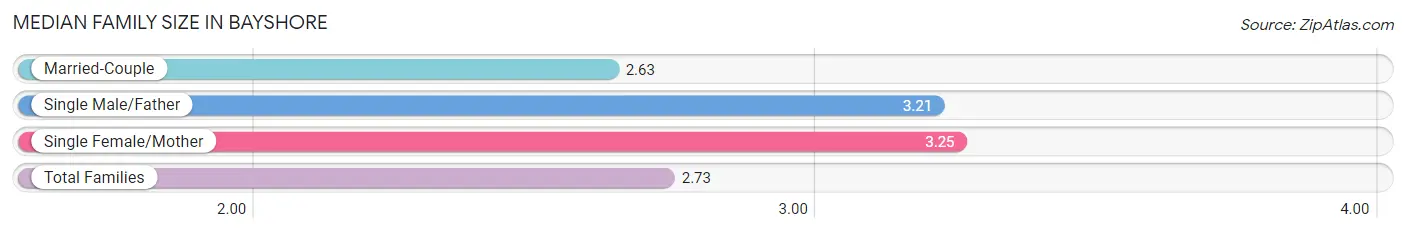
| Family Type | # Families | Family Size |
| Married-Couple | 771 (83.5%) | 2.63 |
| Single Male/Father | 75 (8.1%) | 3.21 |
| Single Female/Mother | 77 (8.3%) | 3.25 |
| Total Families | 923 (100.0%) | 2.73 |
Median Household Size in Bayshore
The median household size in Bayshore is 2.62 persons per household, with single male/father households (75 | 6.4%) accounting for the largest median household size of 4.47 persons per household. non-family households (247 | 21.1%) represent the smallest median household size with 1.50 persons per household.
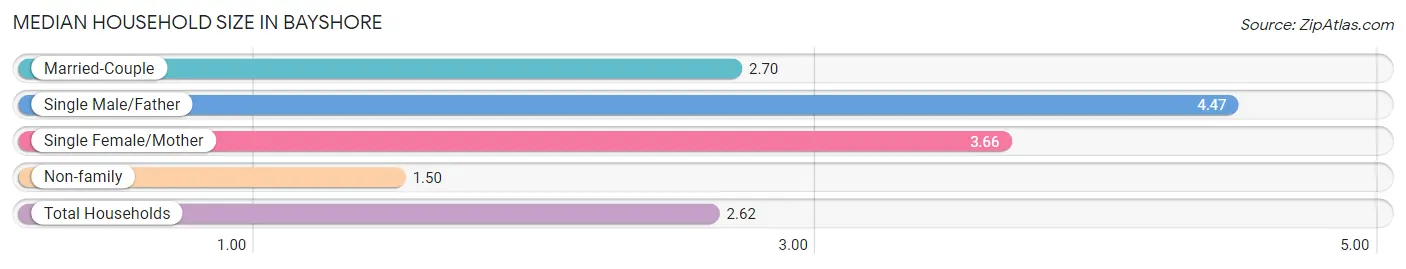
| Household Type | # Households | Household Size |
| Married-Couple | 771 (65.9%) | 2.70 |
| Single Male/Father | 75 (6.4%) | 4.47 |
| Single Female/Mother | 77 (6.6%) | 3.66 |
| Non-family | 247 (21.1%) | 1.50 |
| Total Households | 1,170 (100.0%) | 2.62 |
Household Size by Marriage Status in Bayshore
Out of a total of 1,170 households in Bayshore, 923 (78.9%) are family households, while 247 (21.1%) are nonfamily households. The most numerous type of family households are 2-person households, comprising 453, and the most common type of nonfamily households are 1-person households, comprising 160.
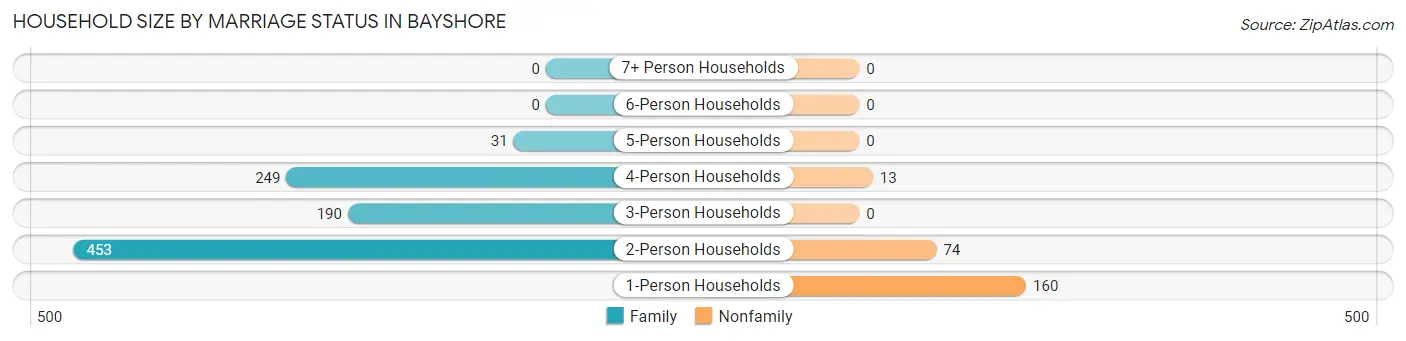
| Household Size | Family Households | Nonfamily Households |
| 1-Person Households | - | 160 (13.7%) |
| 2-Person Households | 453 (38.7%) | 74 (6.3%) |
| 3-Person Households | 190 (16.2%) | 0 (0.0%) |
| 4-Person Households | 249 (21.3%) | 13 (1.1%) |
| 5-Person Households | 31 (2.6%) | 0 (0.0%) |
| 6-Person Households | 0 (0.0%) | 0 (0.0%) |
| 7+ Person Households | 0 (0.0%) | 0 (0.0%) |
| Total | 923 (78.9%) | 247 (21.1%) |
Female Fertility in Bayshore
Fertility by Age in Bayshore
Average fertility rate in Bayshore is 16.0 births per 1,000 women. Women in the age bracket of 20 to 34 years have the highest fertility rate with 82.0 births per 1,000 women. Women in the age bracket of 20 to 34 years acount for 100.0% of all women with births.
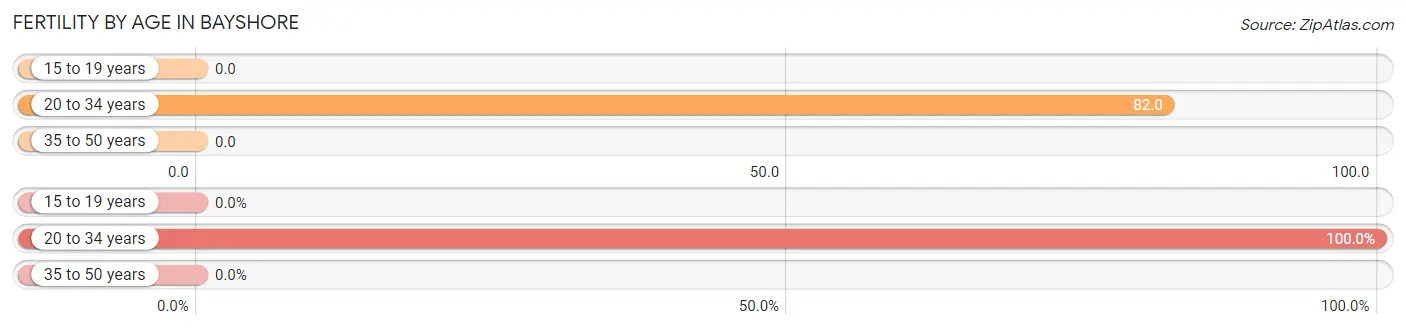
| Age Bracket | Women with Births | Births / 1,000 Women |
| 15 to 19 years | 0 (0.0%) | 0.0 |
| 20 to 34 years | 14 (100.0%) | 82.0 |
| 35 to 50 years | 0 (0.0%) | 0.0 |
| Total | 14 (100.0%) | 16.0 |
Fertility by Age by Marriage Status in Bayshore
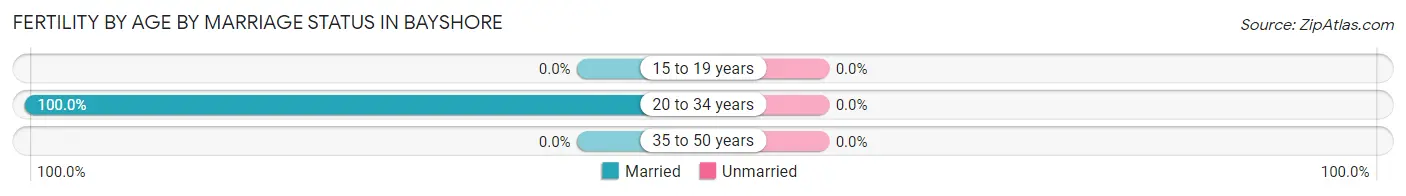
| Age Bracket | Married | Unmarried |
| 15 to 19 years | 0 (0.0%) | 0 (0.0%) |
| 20 to 34 years | 14 (100.0%) | 0 (0.0%) |
| 35 to 50 years | 0 (0.0%) | 0 (0.0%) |
| Total | 14 (100.0%) | 0 (0.0%) |
Fertility by Education in Bayshore
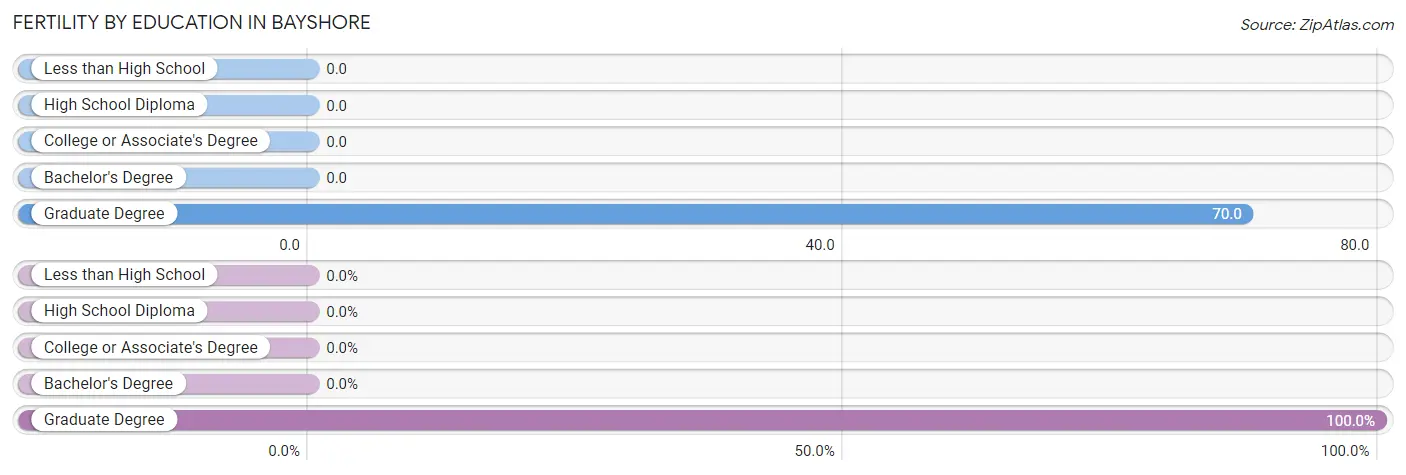
| Educational Attainment | Women with Births | Births / 1,000 Women |
| Less than High School | 0 (0.0%) | 0.0 |
| High School Diploma | 0 (0.0%) | 0.0 |
| College or Associate's Degree | 0 (0.0%) | 0.0 |
| Bachelor's Degree | 0 (0.0%) | 0.0 |
| Graduate Degree | 14 (100.0%) | 70.0 |
| Total | 14 (100.0%) | 16.0 |
Fertility by Education by Marriage Status in Bayshore
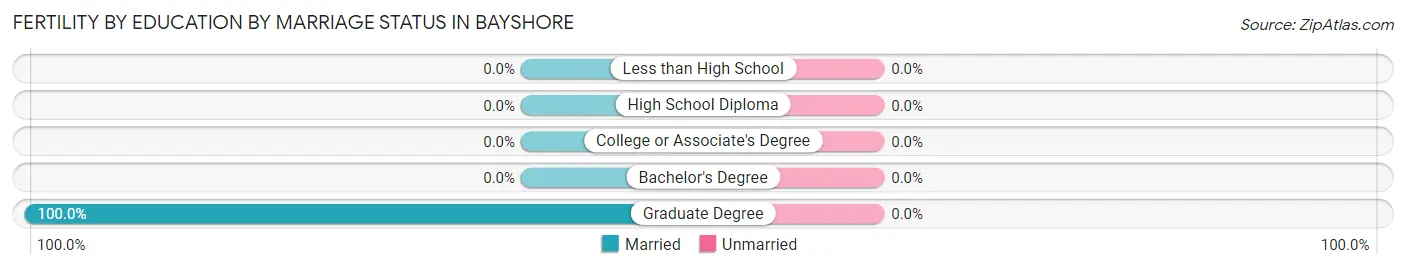
| Educational Attainment | Married | Unmarried |
| Less than High School | 0 (0.0%) | 0 (0.0%) |
| High School Diploma | 0 (0.0%) | 0 (0.0%) |
| College or Associate's Degree | 0 (0.0%) | 0 (0.0%) |
| Bachelor's Degree | 0 (0.0%) | 0 (0.0%) |
| Graduate Degree | 14 (100.0%) | 0 (0.0%) |
| Total | 14 (100.0%) | 0 (0.0%) |
Income in Bayshore
Income Overview in Bayshore
Per Capita Income in Bayshore is $50,734, while median incomes of families and households are $128,216 and $115,347 respectively.
| Characteristic | Number | Measure |
| Per Capita Income | 3,066 | $50,734 |
| Median Family Income | 923 | $128,216 |
| Mean Family Income | 923 | $143,061 |
| Median Household Income | 1,170 | $115,347 |
| Mean Household Income | 1,170 | $133,749 |
| Income Deficit | 923 | $0 |
| Wage / Income Gap (%) | 3,066 | 3.38% |
| Wage / Income Gap ($) | 3,066 | 96.62¢ per $1 |
| Gini / Inequality Index | 3,066 | 0.30 |
Earnings by Sex in Bayshore
Average Earnings in Bayshore are $54,188, $54,705 for men and $52,857 for women, a difference of 3.4%.
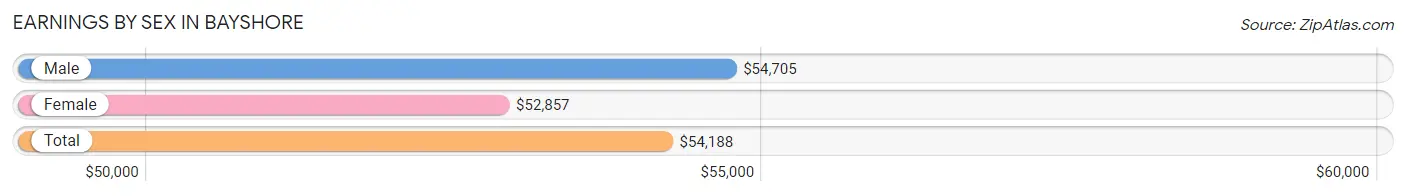
| Sex | Number | Average Earnings |
| Male | 875 (47.0%) | $54,705 |
| Female | 988 (53.0%) | $52,857 |
| Total | 1,863 (100.0%) | $54,188 |
Earnings by Sex by Income Bracket in Bayshore
The most common earnings brackets in Bayshore are $100,000+ for men (201 | 23.0%) and $45,000 to $49,999 for women (147 | 14.9%).
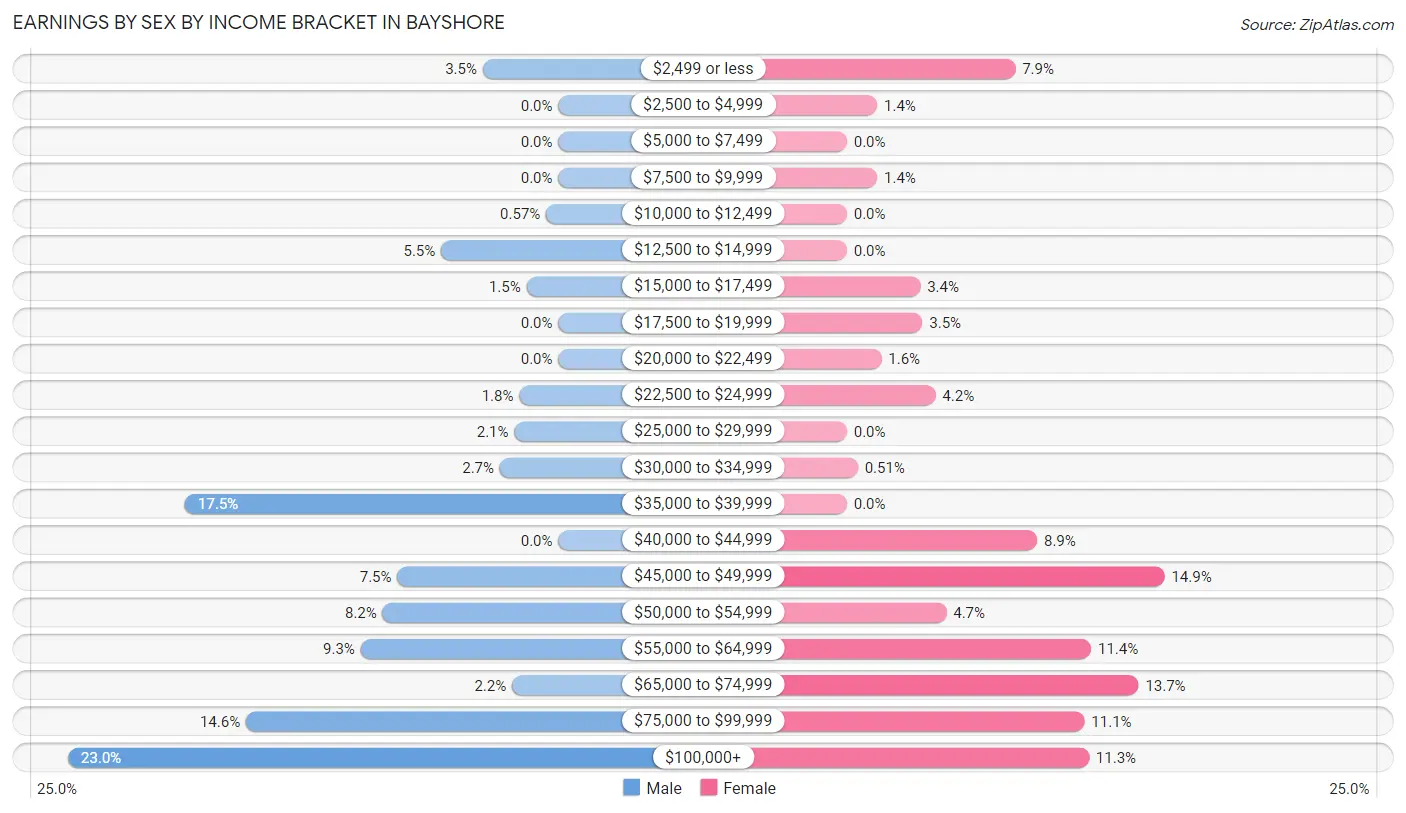
| Income | Male | Female |
| $2,499 or less | 31 (3.5%) | 78 (7.9%) |
| $2,500 to $4,999 | 0 (0.0%) | 14 (1.4%) |
| $5,000 to $7,499 | 0 (0.0%) | 0 (0.0%) |
| $7,500 to $9,999 | 0 (0.0%) | 14 (1.4%) |
| $10,000 to $12,499 | 5 (0.6%) | 0 (0.0%) |
| $12,500 to $14,999 | 48 (5.5%) | 0 (0.0%) |
| $15,000 to $17,499 | 13 (1.5%) | 34 (3.4%) |
| $17,500 to $19,999 | 0 (0.0%) | 35 (3.5%) |
| $20,000 to $22,499 | 0 (0.0%) | 16 (1.6%) |
| $22,500 to $24,999 | 16 (1.8%) | 41 (4.2%) |
| $25,000 to $29,999 | 18 (2.1%) | 0 (0.0%) |
| $30,000 to $34,999 | 24 (2.7%) | 5 (0.5%) |
| $35,000 to $39,999 | 153 (17.5%) | 0 (0.0%) |
| $40,000 to $44,999 | 0 (0.0%) | 88 (8.9%) |
| $45,000 to $49,999 | 66 (7.5%) | 147 (14.9%) |
| $50,000 to $54,999 | 72 (8.2%) | 46 (4.7%) |
| $55,000 to $64,999 | 81 (9.3%) | 113 (11.4%) |
| $65,000 to $74,999 | 19 (2.2%) | 135 (13.7%) |
| $75,000 to $99,999 | 128 (14.6%) | 110 (11.1%) |
| $100,000+ | 201 (23.0%) | 112 (11.3%) |
| Total | 875 (100.0%) | 988 (100.0%) |
Earnings by Sex by Educational Attainment in Bayshore
Average earnings in Bayshore are $54,705 for men and $57,677 for women, a difference of 5.1%. Men with an educational attainment of bachelor's degree enjoy the highest average annual earnings of $81,633, while those with college or associate's degree education earn the least with $54,289. Women with an educational attainment of graduate degree earn the most with the average annual earnings of $60,893, while those with college or associate's degree education have the smallest earnings of $44,500.
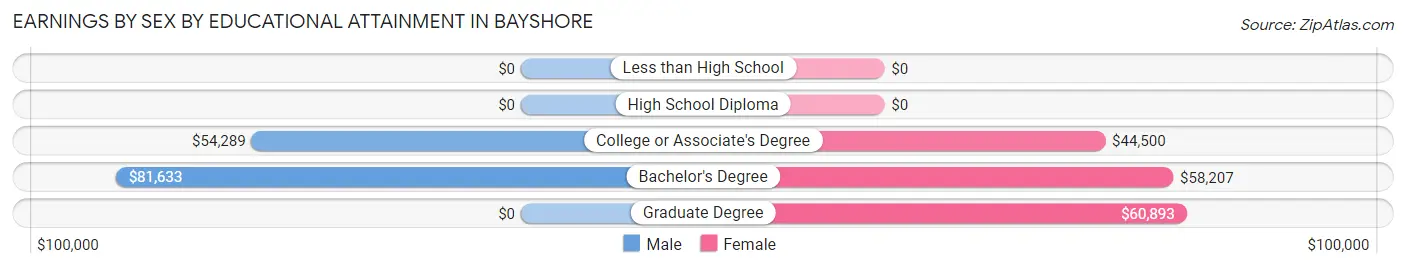
| Educational Attainment | Male Income | Female Income |
| Less than High School | - | - |
| High School Diploma | - | - |
| College or Associate's Degree | $54,289 | $44,500 |
| Bachelor's Degree | $81,633 | $58,207 |
| Graduate Degree | - | - |
| Total | $54,705 | $57,677 |
Family Income in Bayshore
Family Income Brackets in Bayshore
According to the Bayshore family income data, there are 286 families falling into the $100,000 to $149,999 income range, which is the most common income bracket and makes up 31.0% of all families.
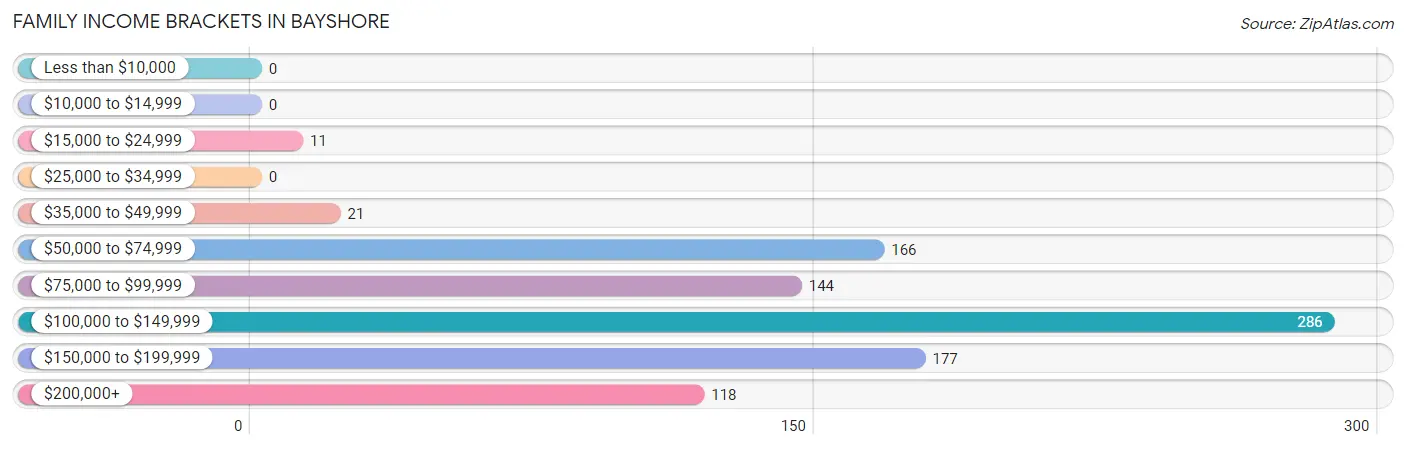
| Income Bracket | # Families | % Families |
| Less than $10,000 | 0 | 0.0% |
| $10,000 to $14,999 | 0 | 0.0% |
| $15,000 to $24,999 | 11 | 1.2% |
| $25,000 to $34,999 | 0 | 0.0% |
| $35,000 to $49,999 | 21 | 2.3% |
| $50,000 to $74,999 | 166 | 18.0% |
| $75,000 to $99,999 | 144 | 15.6% |
| $100,000 to $149,999 | 286 | 31.0% |
| $150,000 to $199,999 | 177 | 19.2% |
| $200,000+ | 118 | 12.8% |
Family Income by Famaliy Size in Bayshore
4-person families (165 | 17.9%) account for the highest median family income in Bayshore with $166,827 per family, while 2-person families (500 | 54.2%) have the highest median income of $64,360 per family member.
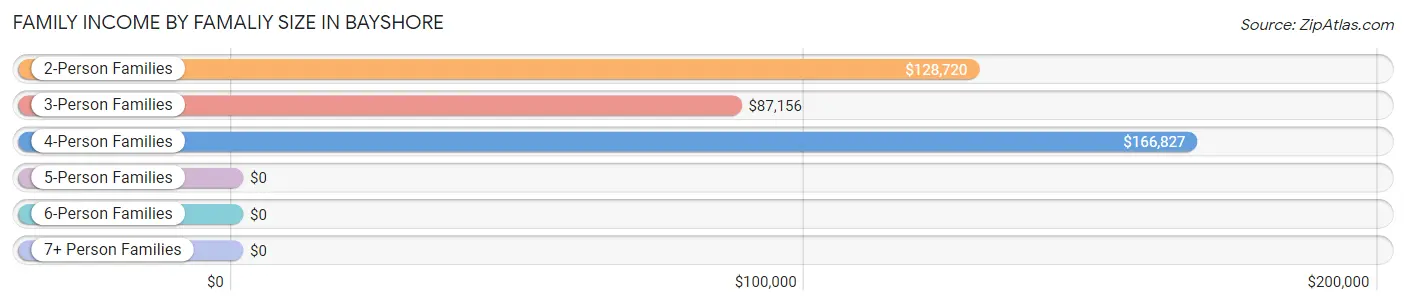
| Income Bracket | # Families | Median Income |
| 2-Person Families | 500 (54.2%) | $128,720 |
| 3-Person Families | 241 (26.1%) | $87,156 |
| 4-Person Families | 165 (17.9%) | $166,827 |
| 5-Person Families | 17 (1.8%) | $0 |
| 6-Person Families | 0 (0.0%) | $0 |
| 7+ Person Families | 0 (0.0%) | $0 |
| Total | 923 (100.0%) | $128,216 |
Family Income by Number of Earners in Bayshore
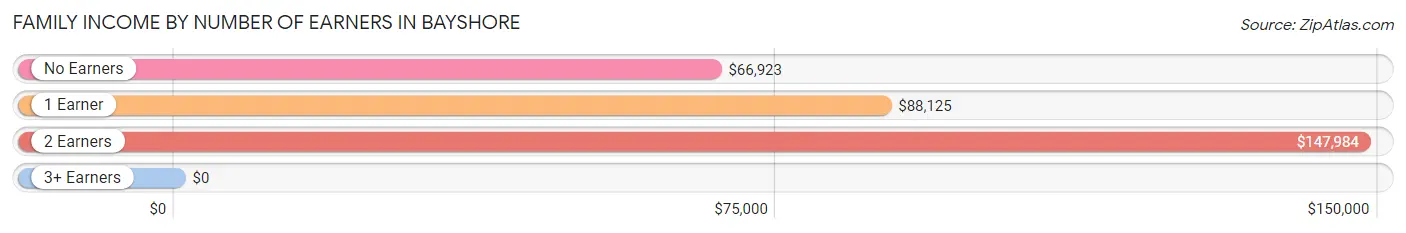
| Number of Earners | # Families | Median Income |
| No Earners | 90 (9.8%) | $66,923 |
| 1 Earner | 249 (27.0%) | $88,125 |
| 2 Earners | 542 (58.7%) | $147,984 |
| 3+ Earners | 42 (4.5%) | $0 |
| Total | 923 (100.0%) | $128,216 |
Household Income in Bayshore
Household Income Brackets in Bayshore
With 426 households falling in the category, the $100,000 to $149,999 income range is the most frequent in Bayshore, accounting for 36.4% of all households.
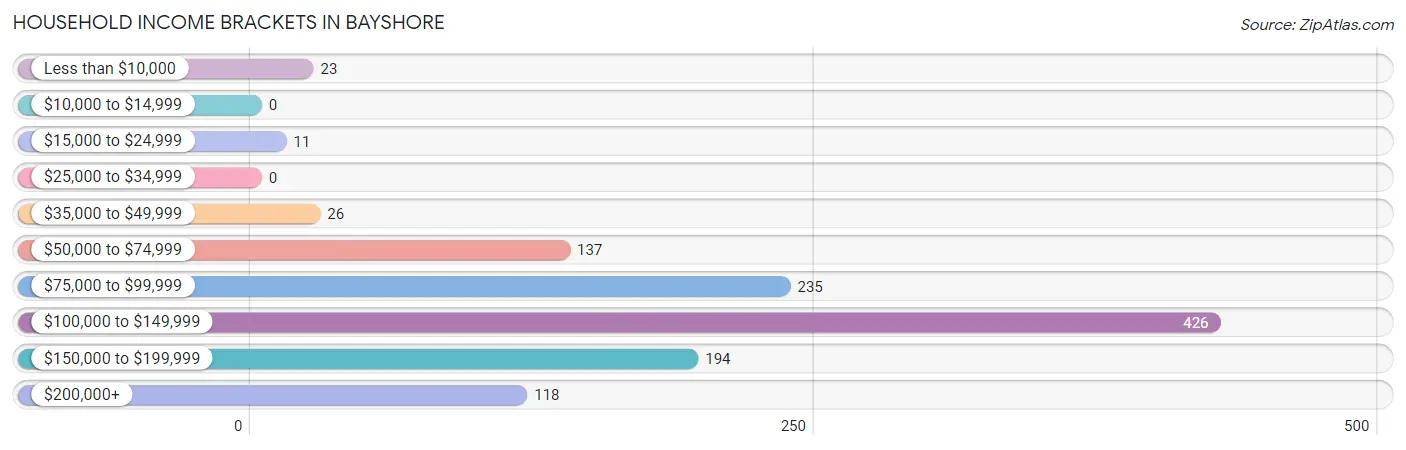
| Income Bracket | # Households | % Households |
| Less than $10,000 | 23 | 2.0% |
| $10,000 to $14,999 | 0 | 0.0% |
| $15,000 to $24,999 | 11 | 0.9% |
| $25,000 to $34,999 | 0 | 0.0% |
| $35,000 to $49,999 | 26 | 2.2% |
| $50,000 to $74,999 | 137 | 11.7% |
| $75,000 to $99,999 | 235 | 20.1% |
| $100,000 to $149,999 | 426 | 36.4% |
| $150,000 to $199,999 | 194 | 16.6% |
| $200,000+ | 118 | 10.1% |
Household Income by Householder Age in Bayshore
The median household income in Bayshore is $115,347, with the highest median household income of $129,935 found in the 45 to 64 years age bracket for the primary householder. A total of 391 households (33.4%) fall into this category.
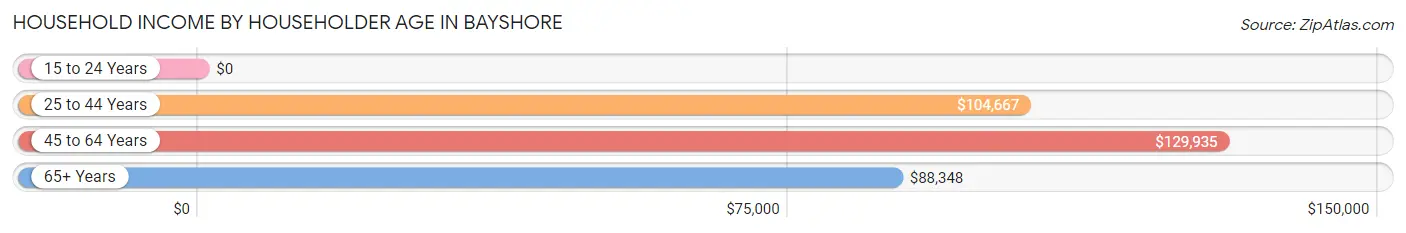
| Income Bracket | # Households | Median Income |
| 15 to 24 Years | 0 (0.0%) | $0 |
| 25 to 44 Years | 460 (39.3%) | $104,667 |
| 45 to 64 Years | 391 (33.4%) | $129,935 |
| 65+ Years | 319 (27.3%) | $88,348 |
| Total | 1,170 (100.0%) | $115,347 |
Poverty in Bayshore
Income Below Poverty by Sex and Age in Bayshore
With 5.8% poverty level for males and 1.1% for females among the residents of Bayshore, 25 to 34 year old males and 35 to 44 year old females are the most vulnerable to poverty, with 47 males (26.4%) and 16 females (3.9%) in their respective age groups living below the poverty level.
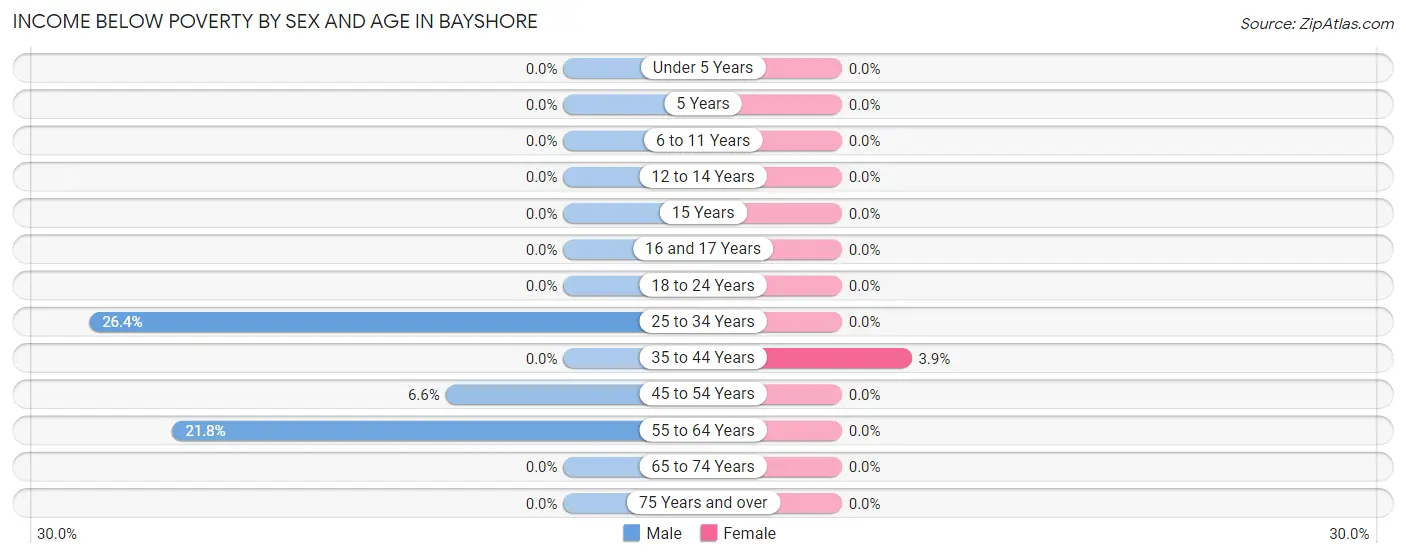
| Age Bracket | Male | Female |
| Under 5 Years | 0 (0.0%) | 0 (0.0%) |
| 5 Years | 0 (0.0%) | 0 (0.0%) |
| 6 to 11 Years | 0 (0.0%) | 0 (0.0%) |
| 12 to 14 Years | 0 (0.0%) | 0 (0.0%) |
| 15 Years | 0 (0.0%) | 0 (0.0%) |
| 16 and 17 Years | 0 (0.0%) | 0 (0.0%) |
| 18 to 24 Years | 0 (0.0%) | 0 (0.0%) |
| 25 to 34 Years | 47 (26.4%) | 0 (0.0%) |
| 35 to 44 Years | 0 (0.0%) | 16 (3.9%) |
| 45 to 54 Years | 16 (6.6%) | 0 (0.0%) |
| 55 to 64 Years | 32 (21.8%) | 0 (0.0%) |
| 65 to 74 Years | 0 (0.0%) | 0 (0.0%) |
| 75 Years and over | 0 (0.0%) | 0 (0.0%) |
| Total | 95 (5.8%) | 16 (1.1%) |
Income Above Poverty by Sex and Age in Bayshore
According to the poverty statistics in Bayshore, males aged under 5 years and females aged under 5 years are the age groups that are most secure financially, with 100.0% of males and 100.0% of females in these age groups living above the poverty line.
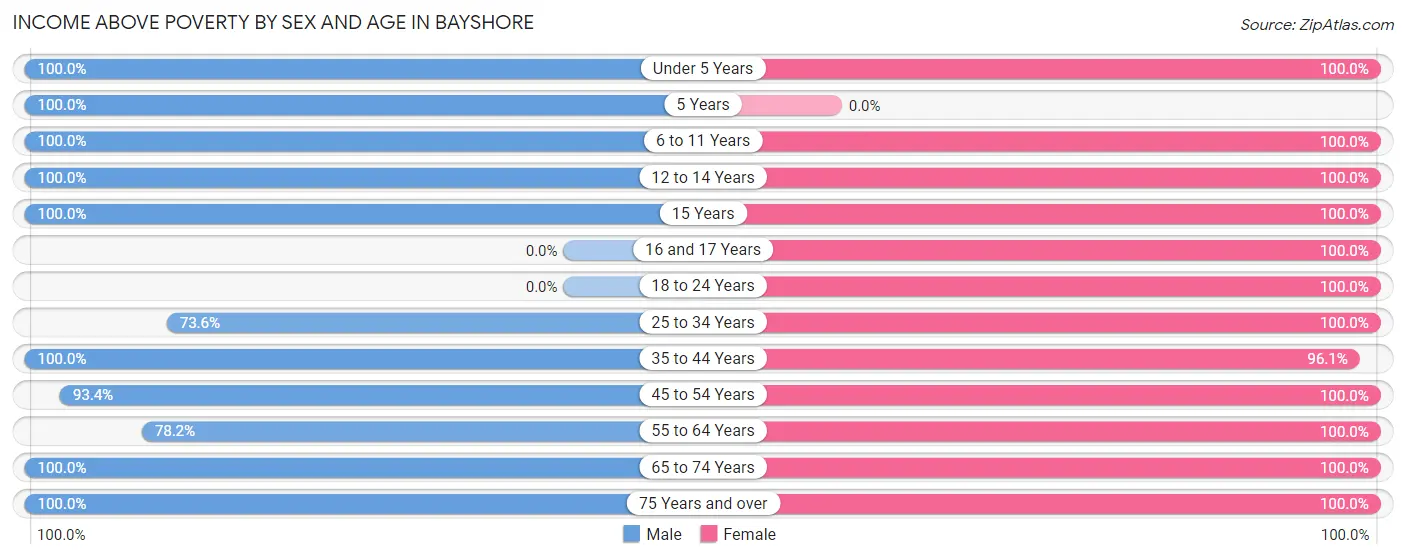
| Age Bracket | Male | Female |
| Under 5 Years | 150 (100.0%) | 37 (100.0%) |
| 5 Years | 14 (100.0%) | 0 (0.0%) |
| 6 to 11 Years | 239 (100.0%) | 97 (100.0%) |
| 12 to 14 Years | 53 (100.0%) | 45 (100.0%) |
| 15 Years | 63 (100.0%) | 20 (100.0%) |
| 16 and 17 Years | 0 (0.0%) | 37 (100.0%) |
| 18 to 24 Years | 0 (0.0%) | 25 (100.0%) |
| 25 to 34 Years | 131 (73.6%) | 171 (100.0%) |
| 35 to 44 Years | 323 (100.0%) | 396 (96.1%) |
| 45 to 54 Years | 228 (93.4%) | 243 (100.0%) |
| 55 to 64 Years | 115 (78.2%) | 104 (100.0%) |
| 65 to 74 Years | 187 (100.0%) | 96 (100.0%) |
| 75 Years and over | 53 (100.0%) | 128 (100.0%) |
| Total | 1,556 (94.3%) | 1,399 (98.9%) |
Income Below Poverty Among Married-Couple Families in Bayshore
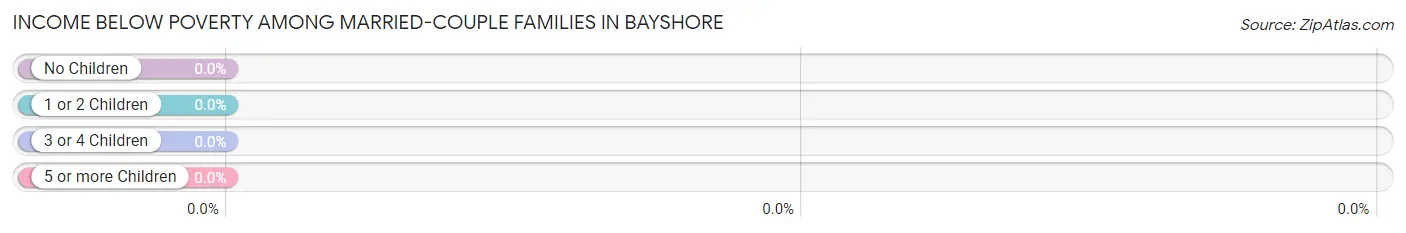
| Children | Above Poverty | Below Poverty |
| No Children | 499 (100.0%) | 0 (0.0%) |
| 1 or 2 Children | 255 (100.0%) | 0 (0.0%) |
| 3 or 4 Children | 17 (100.0%) | 0 (0.0%) |
| 5 or more Children | 0 (0.0%) | 0 (0.0%) |
| Total | 771 (100.0%) | 0 (0.0%) |
Income Below Poverty Among Single-Parent Households in Bayshore
| Children | Single Father | Single Mother |
| No Children | 0 (0.0%) | 0 (0.0%) |
| 1 or 2 Children | 0 (0.0%) | 0 (0.0%) |
| 3 or 4 Children | 0 (0.0%) | 0 (0.0%) |
| 5 or more Children | 0 (0.0%) | 0 (0.0%) |
| Total | 0 (0.0%) | 0 (0.0%) |
Income Below Poverty Among Married-Couple vs Single-Parent Households in Bayshore
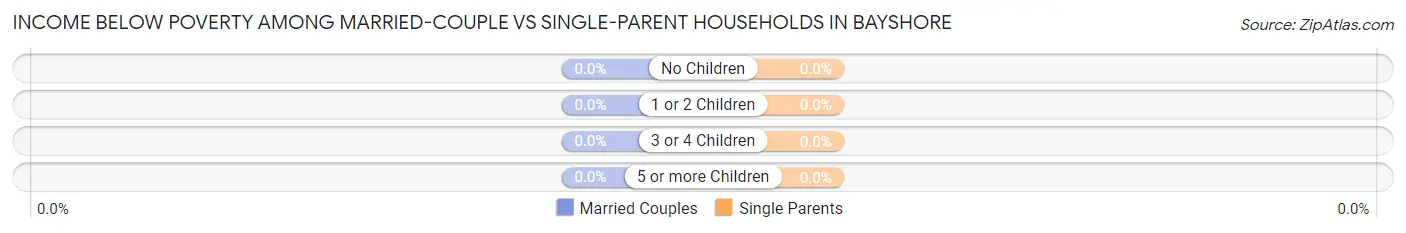
| Children | Married-Couple Families | Single-Parent Households |
| No Children | 0 (0.0%) | 0 (0.0%) |
| 1 or 2 Children | 0 (0.0%) | 0 (0.0%) |
| 3 or 4 Children | 0 (0.0%) | 0 (0.0%) |
| 5 or more Children | 0 (0.0%) | 0 (0.0%) |
| Total | 0 (0.0%) | 0 (0.0%) |
Employment Characteristics in Bayshore
Employment by Class of Employer in Bayshore
Among the 1,734 employed individuals in Bayshore, private company employees (1,101 | 63.5%), self-employed (incorporated) (191 | 11.0%), and local government employees (164 | 9.5%) make up the most common classes of employment.
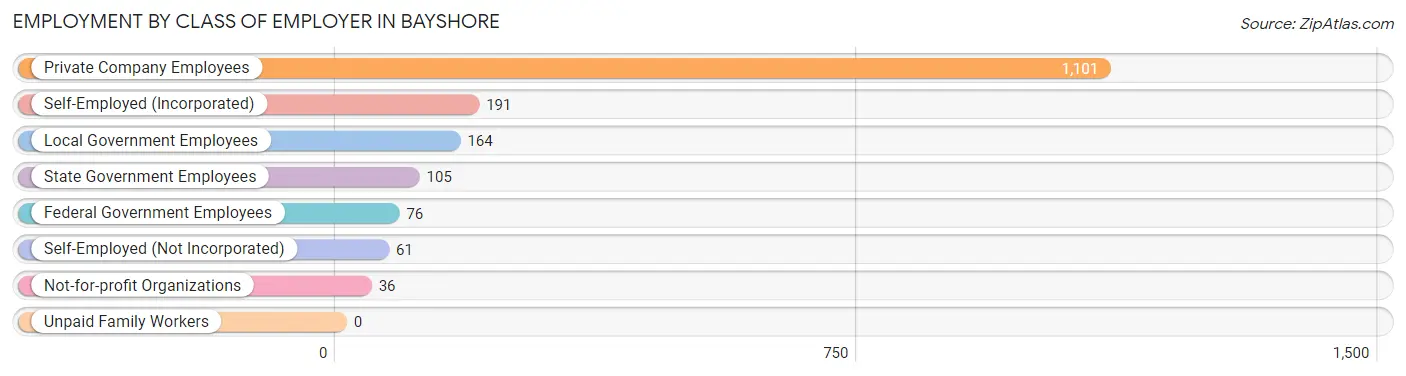
| Employer Class | # Employees | % Employees |
| Private Company Employees | 1,101 | 63.5% |
| Self-Employed (Incorporated) | 191 | 11.0% |
| Self-Employed (Not Incorporated) | 61 | 3.5% |
| Not-for-profit Organizations | 36 | 2.1% |
| Local Government Employees | 164 | 9.5% |
| State Government Employees | 105 | 6.1% |
| Federal Government Employees | 76 | 4.4% |
| Unpaid Family Workers | 0 | 0.0% |
| Total | 1,734 | 100.0% |
Employment Status by Age in Bayshore
According to the labor force statistics for Bayshore, out of the total population over 16 years of age (2,348), 77.7% or 1,824 individuals are in the labor force, with 2.1% or 38 of them unemployed. The age group with the highest labor force participation rate is 25 to 29 years, with 100.0% or 139 individuals in the labor force. Within the labor force, the 16 to 19 years age range has the highest percentage of unemployed individuals, with 100.0% or 25 of them being unemployed.
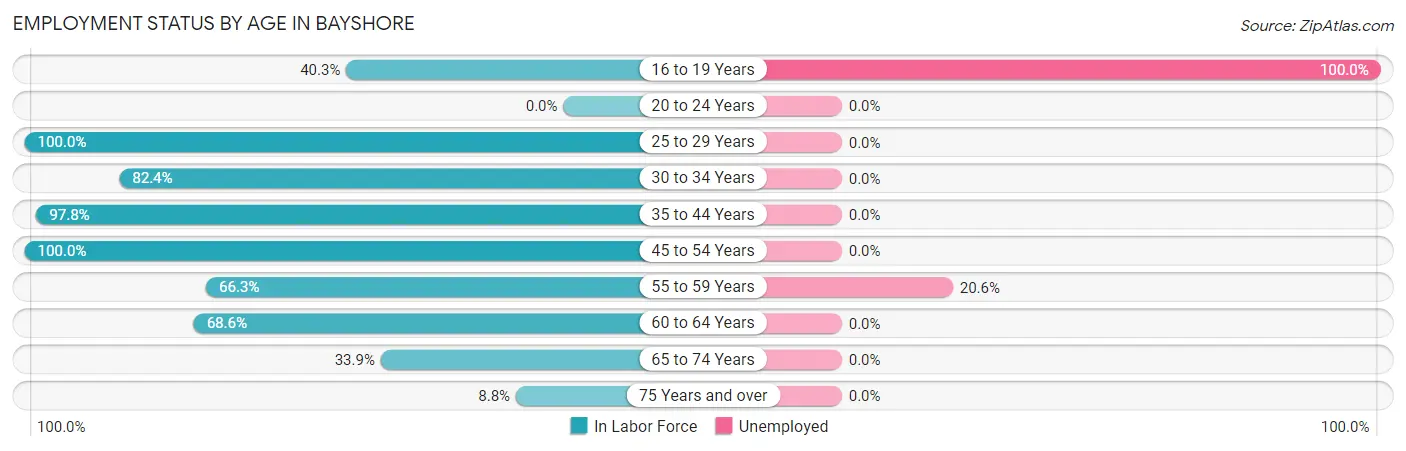
| Age Bracket | In Labor Force | Unemployed |
| 16 to 19 Years | 25 (40.3%) | 25 (100.0%) |
| 20 to 24 Years | 0 (0.0%) | 0 (0.0%) |
| 25 to 29 Years | 139 (100.0%) | 0 (0.0%) |
| 30 to 34 Years | 173 (82.4%) | 0 (0.0%) |
| 35 to 44 Years | 719 (97.8%) | 0 (0.0%) |
| 45 to 54 Years | 487 (100.0%) | 0 (0.0%) |
| 55 to 59 Years | 63 (66.3%) | 13 (20.6%) |
| 60 to 64 Years | 107 (68.6%) | 0 (0.0%) |
| 65 to 74 Years | 96 (33.9%) | 0 (0.0%) |
| 75 Years and over | 16 (8.8%) | 0 (0.0%) |
| Total | 1,824 (77.7%) | 38 (2.1%) |
Employment Status by Educational Attainment in Bayshore
According to labor force statistics for Bayshore, 92.6% of individuals (1,687) out of the total population between 25 and 64 years of age (1,822) are in the labor force, with 0.8% or 13 of them being unemployed. The group with the highest labor force participation rate are those with the educational attainment of less than high school, with 100.0% or 50 individuals in the labor force. Within the labor force, individuals with high school diploma education have the highest percentage of unemployment, with 10.6% or 13 of them being unemployed.
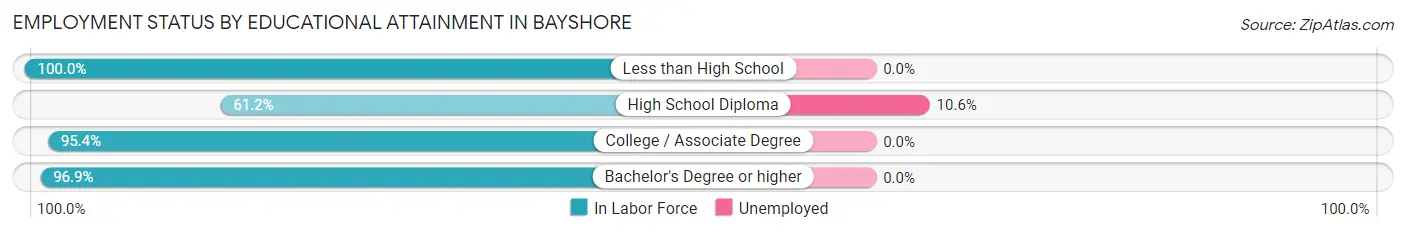
| Educational Attainment | In Labor Force | Unemployed |
| Less than High School | 50 (100.0%) | 0 (0.0%) |
| High School Diploma | 123 (61.2%) | 21 (10.6%) |
| College / Associate Degree | 478 (95.4%) | 0 (0.0%) |
| Bachelor's Degree or higher | 1,037 (96.9%) | 0 (0.0%) |
| Total | 1,687 (92.6%) | 15 (0.8%) |
Employment Occupations by Sex in Bayshore
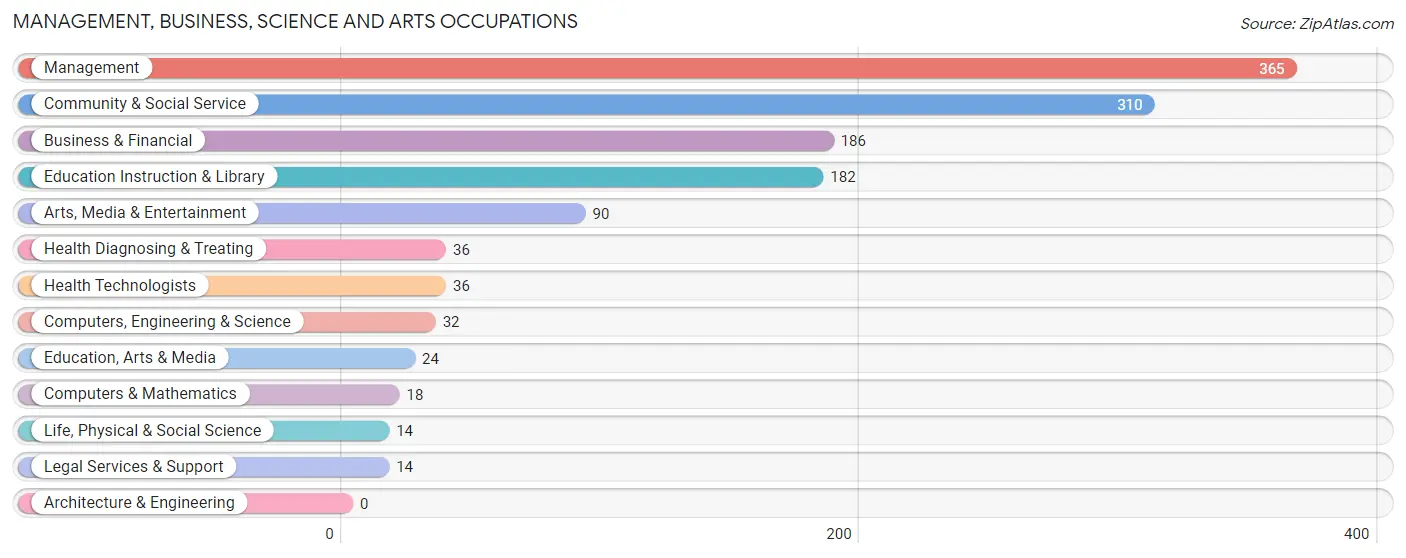
Management, Business, Science and Arts Occupations
The most common Management, Business, Science and Arts occupations in Bayshore are Management (365 | 20.4%), Community & Social Service (310 | 17.3%), Business & Financial (186 | 10.4%), Education Instruction & Library (182 | 10.2%), and Arts, Media & Entertainment (90 | 5.0%).
Management, Business, Science and Arts Occupations by Sex
Within the Management, Business, Science and Arts occupations in Bayshore, the most male-oriented occupations are Computers, Engineering & Science (100.0%), Computers & Mathematics (100.0%), and Life, Physical & Social Science (100.0%), while the most female-oriented occupations are Education, Arts & Media (100.0%), Legal Services & Support (100.0%), and Health Diagnosing & Treating (100.0%).
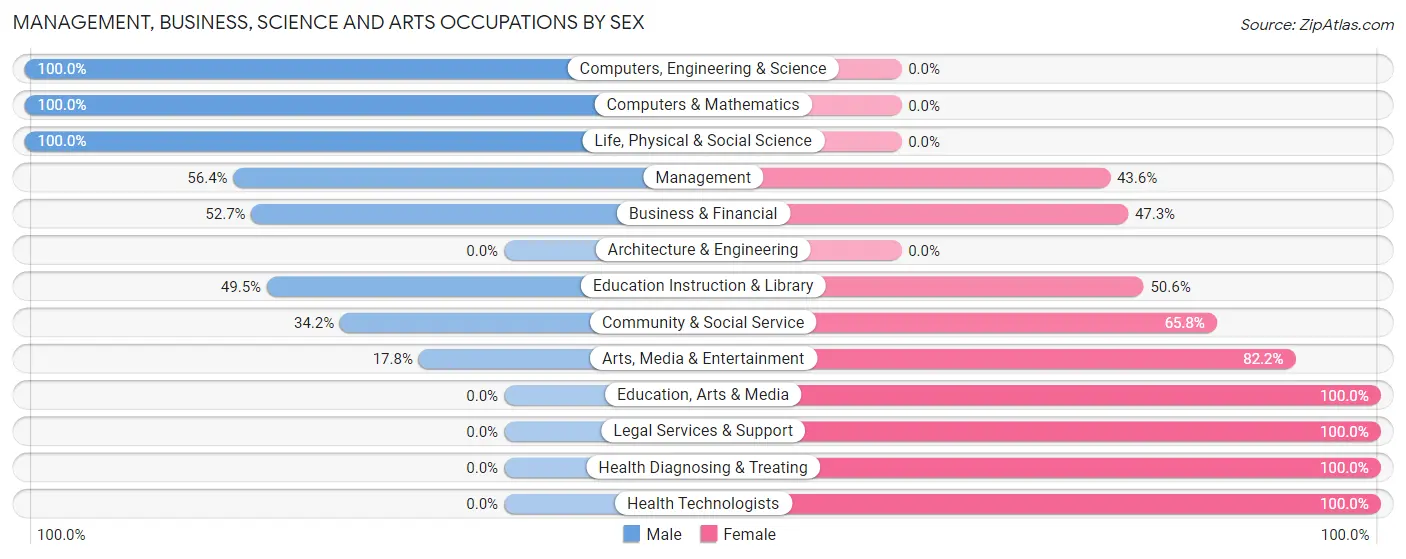
| Occupation | Male | Female |
| Management | 206 (56.4%) | 159 (43.6%) |
| Business & Financial | 98 (52.7%) | 88 (47.3%) |
| Computers, Engineering & Science | 32 (100.0%) | 0 (0.0%) |
| Computers & Mathematics | 18 (100.0%) | 0 (0.0%) |
| Architecture & Engineering | 0 (0.0%) | 0 (0.0%) |
| Life, Physical & Social Science | 14 (100.0%) | 0 (0.0%) |
| Community & Social Service | 106 (34.2%) | 204 (65.8%) |
| Education, Arts & Media | 0 (0.0%) | 24 (100.0%) |
| Legal Services & Support | 0 (0.0%) | 14 (100.0%) |
| Education Instruction & Library | 90 (49.4%) | 92 (50.5%) |
| Arts, Media & Entertainment | 16 (17.8%) | 74 (82.2%) |
| Health Diagnosing & Treating | 0 (0.0%) | 36 (100.0%) |
| Health Technologists | 0 (0.0%) | 36 (100.0%) |
| Total (Category) | 442 (47.6%) | 487 (52.4%) |
| Total (Overall) | 875 (49.0%) | 912 (51.0%) |
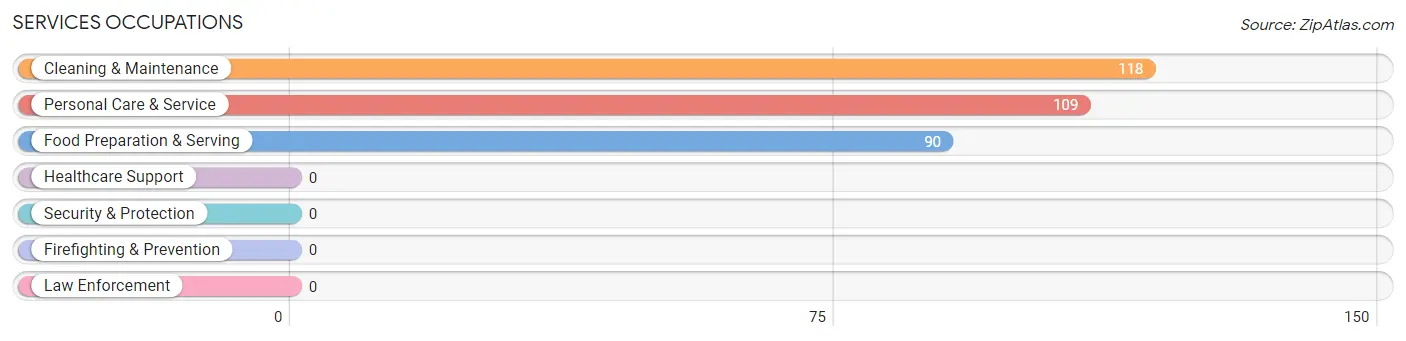
Services Occupations
The most common Services occupations in Bayshore are Cleaning & Maintenance (118 | 6.6%), Personal Care & Service (109 | 6.1%), and Food Preparation & Serving (90 | 5.0%).
Services Occupations by Sex
Within the Services occupations in Bayshore, the most male-oriented occupations are Cleaning & Maintenance (86.4%), and Food Preparation & Serving (73.3%), while the most female-oriented occupations are Personal Care & Service (100.0%), Food Preparation & Serving (26.7%), and Cleaning & Maintenance (13.6%).
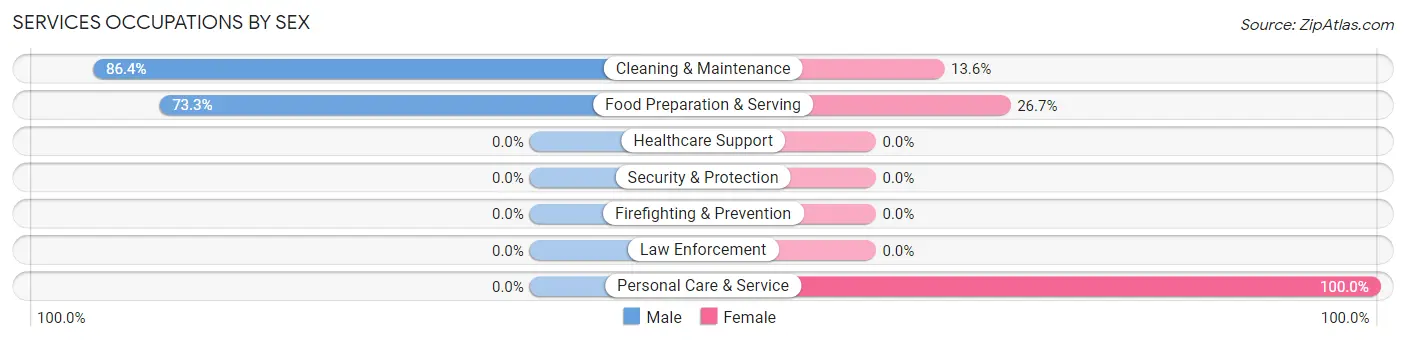
| Occupation | Male | Female |
| Healthcare Support | 0 (0.0%) | 0 (0.0%) |
| Security & Protection | 0 (0.0%) | 0 (0.0%) |
| Firefighting & Prevention | 0 (0.0%) | 0 (0.0%) |
| Law Enforcement | 0 (0.0%) | 0 (0.0%) |
| Food Preparation & Serving | 66 (73.3%) | 24 (26.7%) |
| Cleaning & Maintenance | 102 (86.4%) | 16 (13.6%) |
| Personal Care & Service | 0 (0.0%) | 109 (100.0%) |
| Total (Category) | 168 (53.0%) | 149 (47.0%) |
| Total (Overall) | 875 (49.0%) | 912 (51.0%) |
Sales and Office Occupations
The most common Sales and Office occupations in Bayshore are Office & Administration (177 | 9.9%), and Sales & Related (117 | 6.6%).
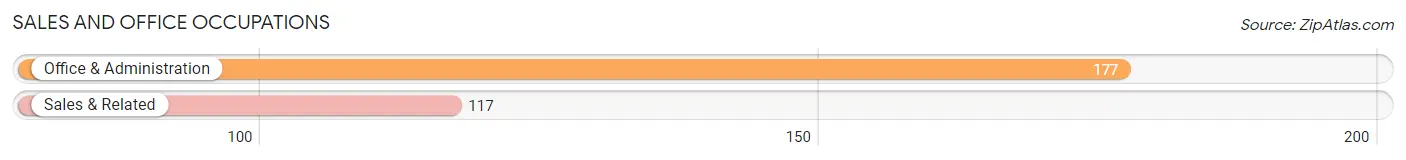
Sales and Office Occupations by Sex
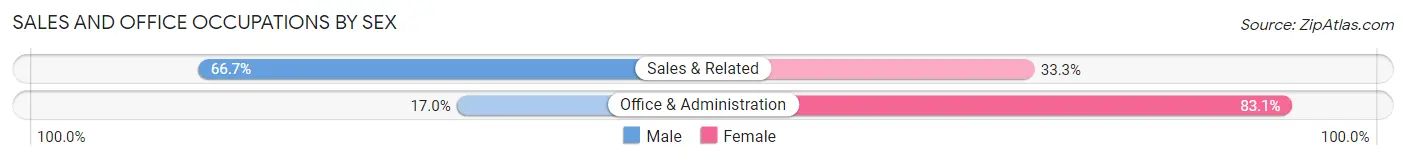
| Occupation | Male | Female |
| Sales & Related | 78 (66.7%) | 39 (33.3%) |
| Office & Administration | 30 (17.0%) | 147 (83.1%) |
| Total (Category) | 108 (36.7%) | 186 (63.3%) |
| Total (Overall) | 875 (49.0%) | 912 (51.0%) |
Natural Resources, Construction and Maintenance Occupations
The most common Natural Resources, Construction and Maintenance occupations in Bayshore are Installation, Maintenance & Repair (50 | 2.8%), and Construction & Extraction (27 | 1.5%).
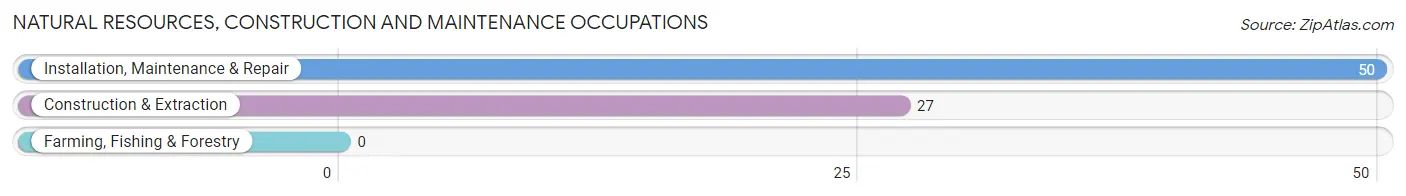
Natural Resources, Construction and Maintenance Occupations by Sex
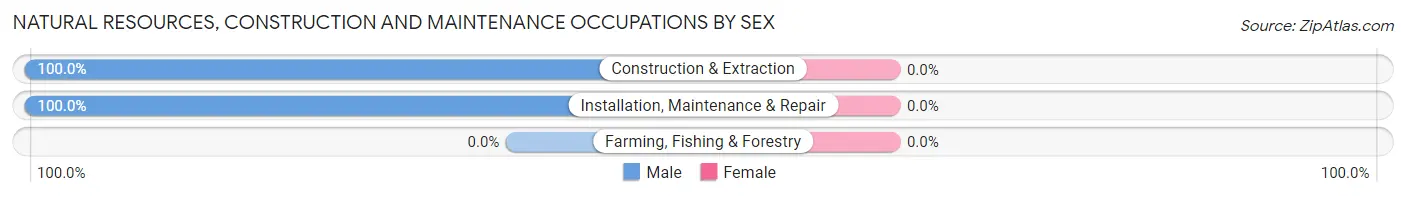
| Occupation | Male | Female |
| Farming, Fishing & Forestry | 0 (0.0%) | 0 (0.0%) |
| Construction & Extraction | 27 (100.0%) | 0 (0.0%) |
| Installation, Maintenance & Repair | 50 (100.0%) | 0 (0.0%) |
| Total (Category) | 77 (100.0%) | 0 (0.0%) |
| Total (Overall) | 875 (49.0%) | 912 (51.0%) |
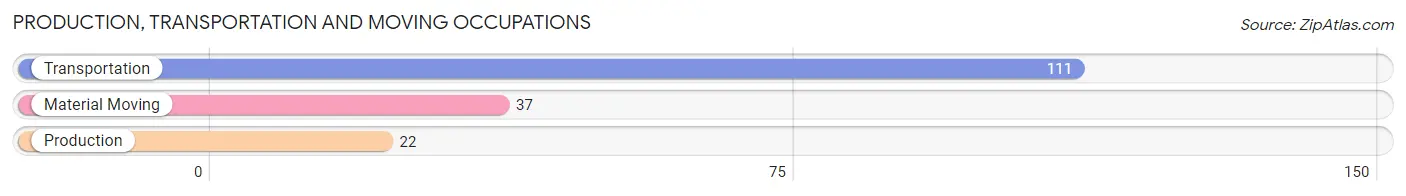
Production, Transportation and Moving Occupations
The most common Production, Transportation and Moving occupations in Bayshore are Transportation (111 | 6.2%), Material Moving (37 | 2.1%), and Production (22 | 1.2%).
Production, Transportation and Moving Occupations by Sex
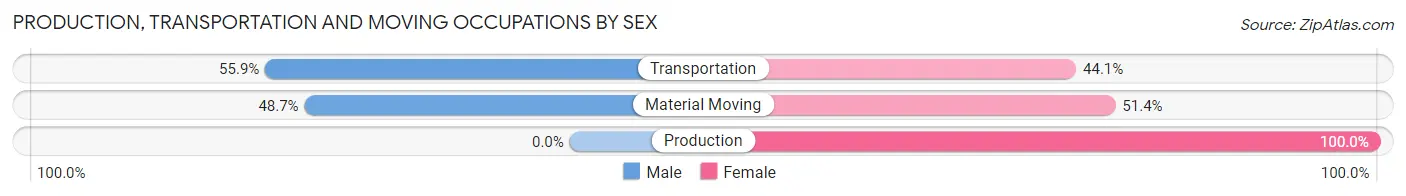
| Occupation | Male | Female |
| Production | 0 (0.0%) | 22 (100.0%) |
| Transportation | 62 (55.9%) | 49 (44.1%) |
| Material Moving | 18 (48.6%) | 19 (51.3%) |
| Total (Category) | 80 (47.1%) | 90 (52.9%) |
| Total (Overall) | 875 (49.0%) | 912 (51.0%) |
Employment Industries by Sex in Bayshore
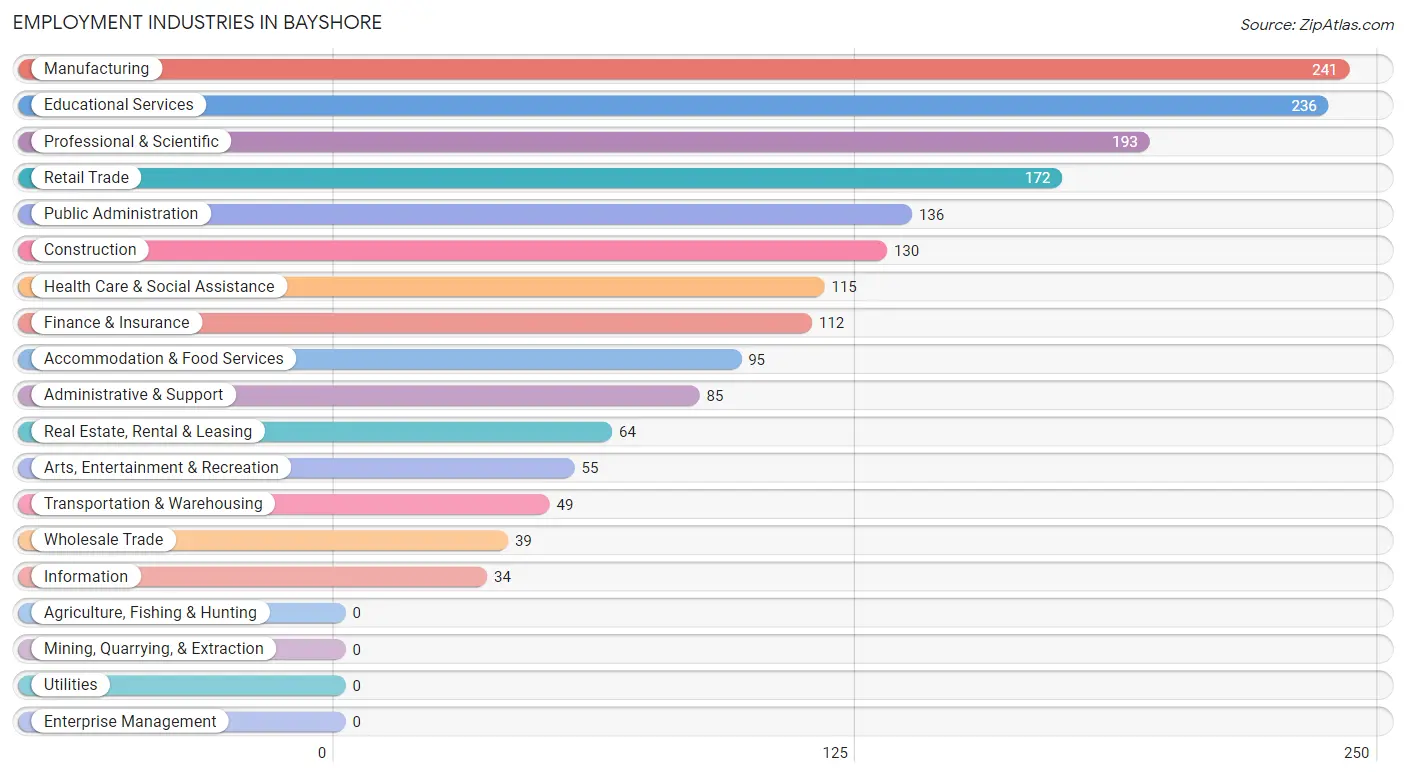
Employment Industries in Bayshore
The major employment industries in Bayshore include Manufacturing (241 | 13.5%), Educational Services (236 | 13.2%), Professional & Scientific (193 | 10.8%), Retail Trade (172 | 9.6%), and Public Administration (136 | 7.6%).
Employment Industries by Sex in Bayshore
The Bayshore industries that see more men than women are Wholesale Trade (100.0%), Information (100.0%), and Administrative & Support (100.0%), whereas the industries that tend to have a higher number of women are Transportation & Warehousing (100.0%), Real Estate, Rental & Leasing (100.0%), and Health Care & Social Assistance (100.0%).
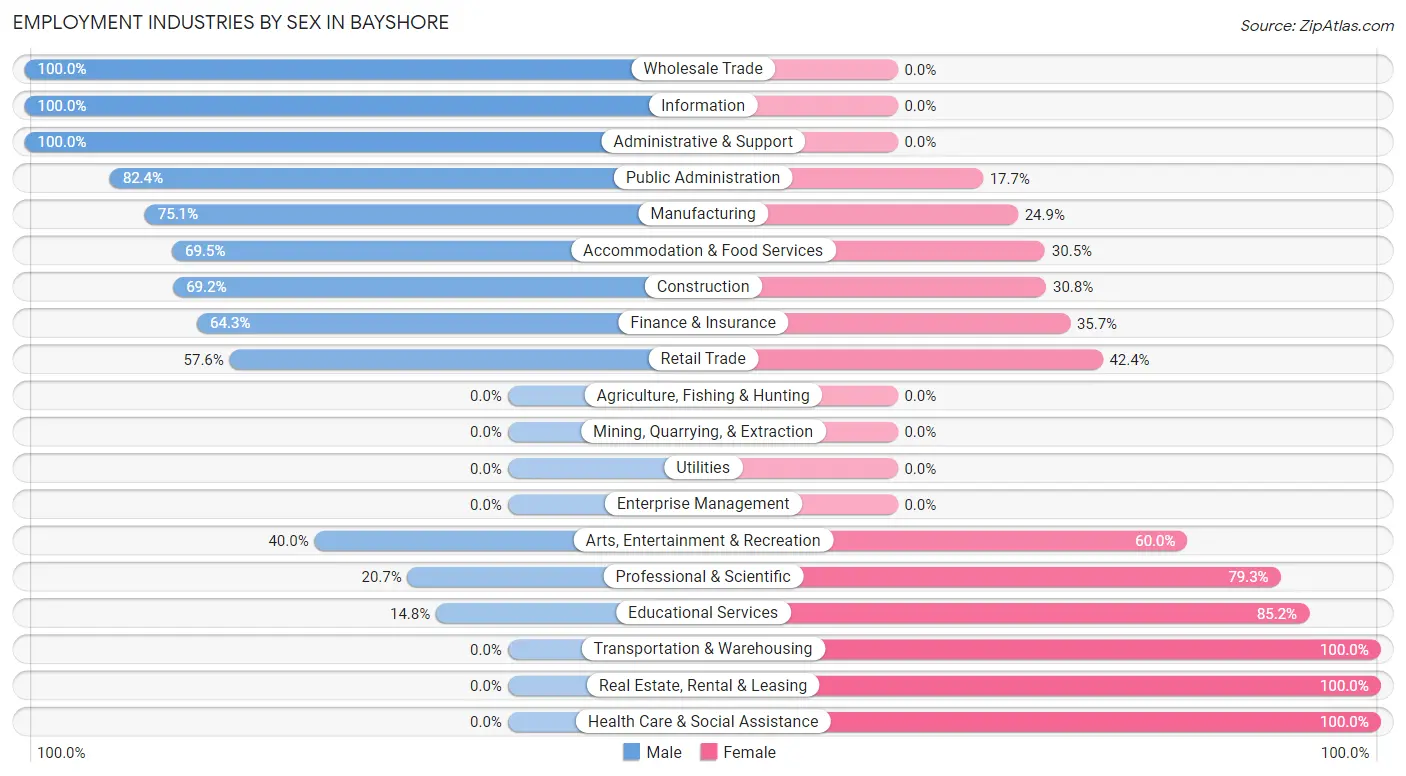
| Industry | Male | Female |
| Agriculture, Fishing & Hunting | 0 (0.0%) | 0 (0.0%) |
| Mining, Quarrying, & Extraction | 0 (0.0%) | 0 (0.0%) |
| Construction | 90 (69.2%) | 40 (30.8%) |
| Manufacturing | 181 (75.1%) | 60 (24.9%) |
| Wholesale Trade | 39 (100.0%) | 0 (0.0%) |
| Retail Trade | 99 (57.6%) | 73 (42.4%) |
| Transportation & Warehousing | 0 (0.0%) | 49 (100.0%) |
| Utilities | 0 (0.0%) | 0 (0.0%) |
| Information | 34 (100.0%) | 0 (0.0%) |
| Finance & Insurance | 72 (64.3%) | 40 (35.7%) |
| Real Estate, Rental & Leasing | 0 (0.0%) | 64 (100.0%) |
| Professional & Scientific | 40 (20.7%) | 153 (79.3%) |
| Enterprise Management | 0 (0.0%) | 0 (0.0%) |
| Administrative & Support | 85 (100.0%) | 0 (0.0%) |
| Educational Services | 35 (14.8%) | 201 (85.2%) |
| Health Care & Social Assistance | 0 (0.0%) | 115 (100.0%) |
| Arts, Entertainment & Recreation | 22 (40.0%) | 33 (60.0%) |
| Accommodation & Food Services | 66 (69.5%) | 29 (30.5%) |
| Public Administration | 112 (82.4%) | 24 (17.6%) |
| Total | 875 (49.0%) | 912 (51.0%) |
Education in Bayshore
School Enrollment in Bayshore
The most common levels of schooling among the 677 students in Bayshore are high school (165 | 24.4%), middle school (162 | 23.9%), and elementary school (154 | 22.8%).
| School Level | # Students | % Students |
| Nursery / Preschool | 92 | 13.6% |
| Kindergarten | 14 | 2.1% |
| Elementary School | 154 | 22.8% |
| Middle School | 162 | 23.9% |
| High School | 165 | 24.4% |
| College / Undergraduate | 73 | 10.8% |
| Graduate / Professional | 17 | 2.5% |
| Total | 677 | 100.0% |
School Enrollment by Age by Funding Source in Bayshore
Out of a total of 677 students who are enrolled in schools in Bayshore, 105 (15.5%) attend a private institution, while the remaining 572 (84.5%) are enrolled in public schools. The age group of 18 to 19 year olds has the highest likelihood of being enrolled in private schools, with 25 (100.0% in the age bracket) enrolled. Conversely, the age group of 3 to 4 year olds has the lowest likelihood of being enrolled in a private school, with 19 (100.0% in the age bracket) attending a public institution.
| Age Bracket | Public School | Private School |
| 3 to 4 Year Olds | 19 (100.0%) | 0 (0.0%) |
| 5 to 9 Year Old | 186 (100.0%) | 0 (0.0%) |
| 10 to 14 Year Olds | 237 (90.5%) | 25 (9.5%) |
| 15 to 17 Year Olds | 97 (80.8%) | 23 (19.2%) |
| 18 to 19 Year Olds | 0 (0.0%) | 25 (100.0%) |
| 20 to 24 Year Olds | 0 (0.0%) | 0 (0.0%) |
| 25 to 34 Year Olds | 0 (0.0%) | 0 (0.0%) |
| 35 Years and over | 33 (50.8%) | 32 (49.2%) |
| Total | 572 (84.5%) | 105 (15.5%) |
Educational Attainment by Field of Study in Bayshore
Business (360 | 27.8%), literature & languages (226 | 17.5%), education (161 | 12.4%), communications (105 | 8.1%), and arts & humanities (99 | 7.7%) are the most common fields of study among 1,293 individuals in Bayshore who have obtained a bachelor's degree or higher.
| Field of Study | # Graduates | % Graduates |
| Computers & Mathematics | 32 | 2.5% |
| Bio, Nature & Agricultural | 47 | 3.6% |
| Physical & Health Sciences | 50 | 3.9% |
| Psychology | 86 | 6.7% |
| Social Sciences | 18 | 1.4% |
| Engineering | 13 | 1.0% |
| Multidisciplinary Studies | 0 | 0.0% |
| Science & Technology | 31 | 2.4% |
| Business | 360 | 27.8% |
| Education | 161 | 12.4% |
| Literature & Languages | 226 | 17.5% |
| Liberal Arts & History | 49 | 3.8% |
| Visual & Performing Arts | 16 | 1.2% |
| Communications | 105 | 8.1% |
| Arts & Humanities | 99 | 7.7% |
| Total | 1,293 | 100.0% |
Transportation & Commute in Bayshore
Vehicle Availability by Sex in Bayshore
The most prevalent vehicle ownership categories in Bayshore are males with 2 vehicles (434, accounting for 51.5%) and females with 2 vehicles (426, making up 48.7%).
| Vehicles Available | Male | Female |
| No Vehicle | 0 (0.0%) | 0 (0.0%) |
| 1 Vehicle | 65 (7.7%) | 163 (18.3%) |
| 2 Vehicles | 434 (51.5%) | 426 (47.8%) |
| 3 Vehicles | 140 (16.6%) | 130 (14.6%) |
| 4 Vehicles | 204 (24.2%) | 172 (19.3%) |
| 5 or more Vehicles | 0 (0.0%) | 0 (0.0%) |
| Total | 843 (100.0%) | 891 (100.0%) |
Commute Time in Bayshore
The most frequently occuring commute durations in Bayshore are 15 to 19 minutes (316 commuters, 21.5%), 10 to 14 minutes (258 commuters, 17.5%), and 20 to 24 minutes (240 commuters, 16.3%).
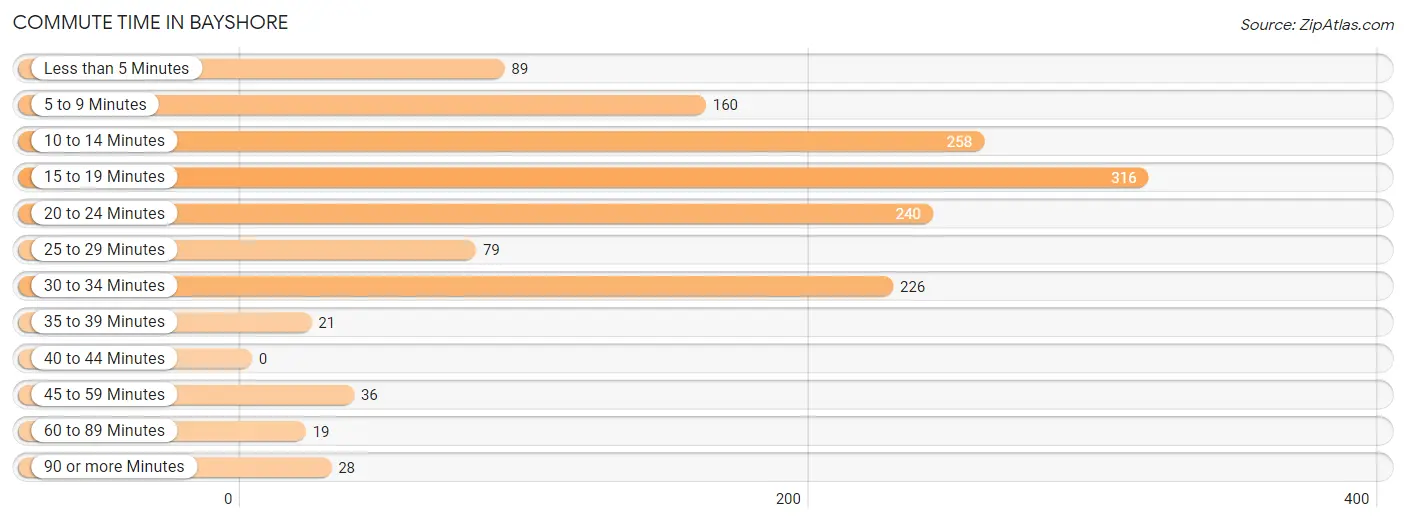
| Commute Time | # Commuters | % Commuters |
| Less than 5 Minutes | 89 | 6.0% |
| 5 to 9 Minutes | 160 | 10.9% |
| 10 to 14 Minutes | 258 | 17.5% |
| 15 to 19 Minutes | 316 | 21.5% |
| 20 to 24 Minutes | 240 | 16.3% |
| 25 to 29 Minutes | 79 | 5.4% |
| 30 to 34 Minutes | 226 | 15.3% |
| 35 to 39 Minutes | 21 | 1.4% |
| 40 to 44 Minutes | 0 | 0.0% |
| 45 to 59 Minutes | 36 | 2.5% |
| 60 to 89 Minutes | 19 | 1.3% |
| 90 or more Minutes | 28 | 1.9% |
Commute Time by Sex in Bayshore
The most common commute times in Bayshore are 15 to 19 minutes (170 commuters, 23.1%) for males and 10 to 14 minutes (159 commuters, 21.6%) for females.
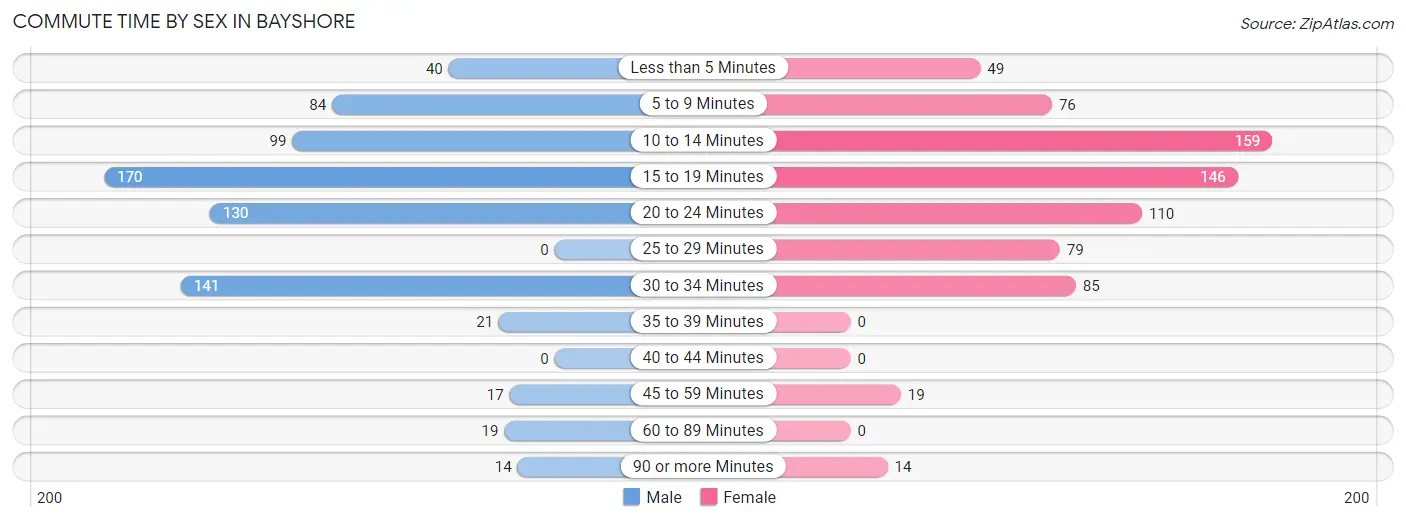
| Commute Time | Male | Female |
| Less than 5 Minutes | 40 (5.4%) | 49 (6.7%) |
| 5 to 9 Minutes | 84 (11.4%) | 76 (10.3%) |
| 10 to 14 Minutes | 99 (13.5%) | 159 (21.6%) |
| 15 to 19 Minutes | 170 (23.1%) | 146 (19.8%) |
| 20 to 24 Minutes | 130 (17.7%) | 110 (14.9%) |
| 25 to 29 Minutes | 0 (0.0%) | 79 (10.7%) |
| 30 to 34 Minutes | 141 (19.2%) | 85 (11.5%) |
| 35 to 39 Minutes | 21 (2.9%) | 0 (0.0%) |
| 40 to 44 Minutes | 0 (0.0%) | 0 (0.0%) |
| 45 to 59 Minutes | 17 (2.3%) | 19 (2.6%) |
| 60 to 89 Minutes | 19 (2.6%) | 0 (0.0%) |
| 90 or more Minutes | 14 (1.9%) | 14 (1.9%) |
Time of Departure to Work by Sex in Bayshore
The most frequent times of departure to work in Bayshore are 7:30 AM to 7:59 AM (184, 25.0%) for males and 7:00 AM to 7:29 AM (190, 25.8%) for females.
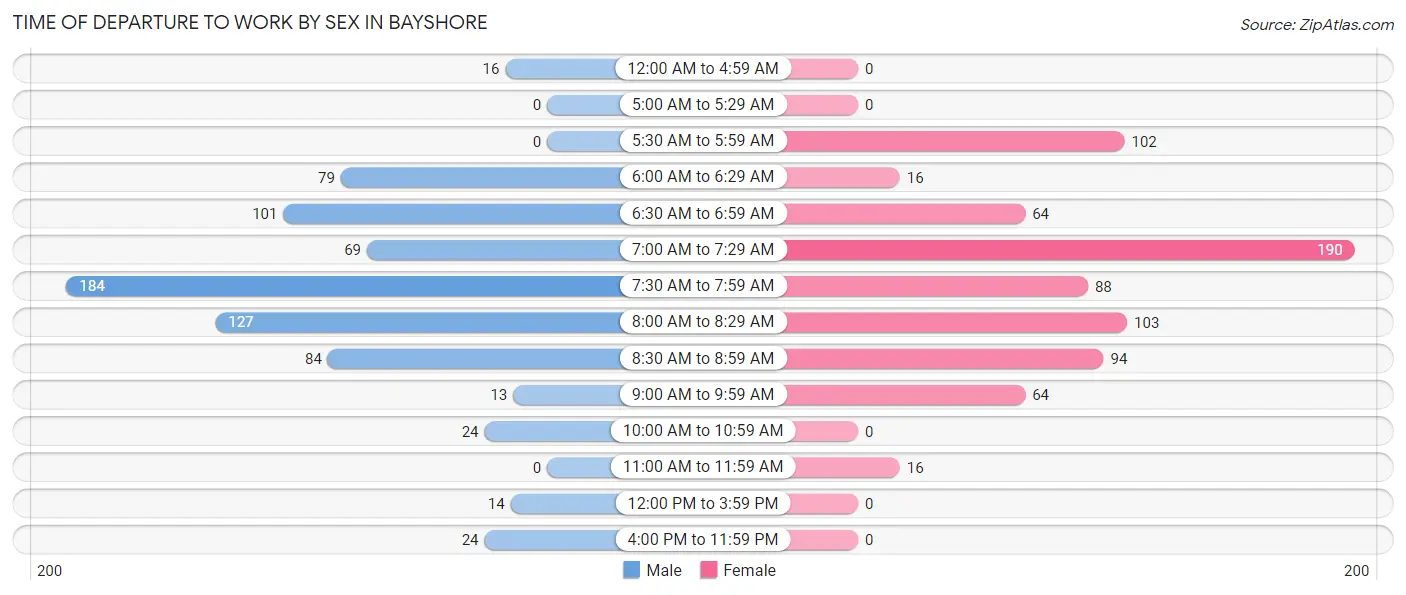
| Time of Departure | Male | Female |
| 12:00 AM to 4:59 AM | 16 (2.2%) | 0 (0.0%) |
| 5:00 AM to 5:29 AM | 0 (0.0%) | 0 (0.0%) |
| 5:30 AM to 5:59 AM | 0 (0.0%) | 102 (13.8%) |
| 6:00 AM to 6:29 AM | 79 (10.7%) | 16 (2.2%) |
| 6:30 AM to 6:59 AM | 101 (13.7%) | 64 (8.7%) |
| 7:00 AM to 7:29 AM | 69 (9.4%) | 190 (25.8%) |
| 7:30 AM to 7:59 AM | 184 (25.0%) | 88 (11.9%) |
| 8:00 AM to 8:29 AM | 127 (17.3%) | 103 (14.0%) |
| 8:30 AM to 8:59 AM | 84 (11.4%) | 94 (12.8%) |
| 9:00 AM to 9:59 AM | 13 (1.8%) | 64 (8.7%) |
| 10:00 AM to 10:59 AM | 24 (3.3%) | 0 (0.0%) |
| 11:00 AM to 11:59 AM | 0 (0.0%) | 16 (2.2%) |
| 12:00 PM to 3:59 PM | 14 (1.9%) | 0 (0.0%) |
| 4:00 PM to 11:59 PM | 24 (3.3%) | 0 (0.0%) |
| Total | 735 (100.0%) | 737 (100.0%) |
Housing Occupancy in Bayshore
Occupancy by Ownership in Bayshore
Of the total 1,170 dwellings in Bayshore, owner-occupied units account for 955 (81.6%), while renter-occupied units make up 215 (18.4%).
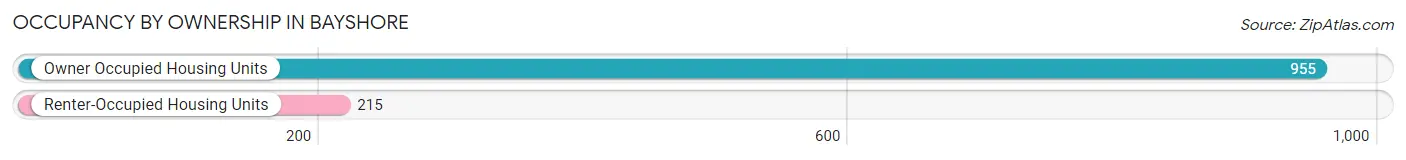
| Occupancy | # Housing Units | % Housing Units |
| Owner Occupied Housing Units | 955 | 81.6% |
| Renter-Occupied Housing Units | 215 | 18.4% |
| Total Occupied Housing Units | 1,170 | 100.0% |
Occupancy by Household Size in Bayshore
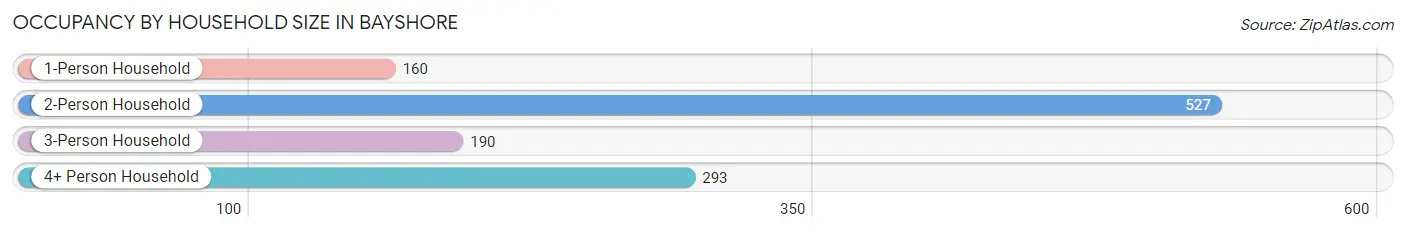
| Household Size | # Housing Units | % Housing Units |
| 1-Person Household | 160 | 13.7% |
| 2-Person Household | 527 | 45.0% |
| 3-Person Household | 190 | 16.2% |
| 4+ Person Household | 293 | 25.0% |
| Total Housing Units | 1,170 | 100.0% |
Occupancy by Ownership by Household Size in Bayshore
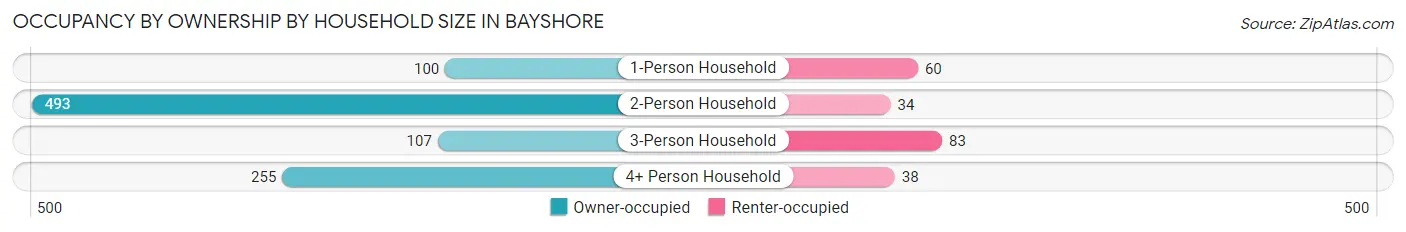
| Household Size | Owner-occupied | Renter-occupied |
| 1-Person Household | 100 (62.5%) | 60 (37.5%) |
| 2-Person Household | 493 (93.5%) | 34 (6.5%) |
| 3-Person Household | 107 (56.3%) | 83 (43.7%) |
| 4+ Person Household | 255 (87.0%) | 38 (13.0%) |
| Total Housing Units | 955 (81.6%) | 215 (18.4%) |
Occupancy by Educational Attainment in Bayshore
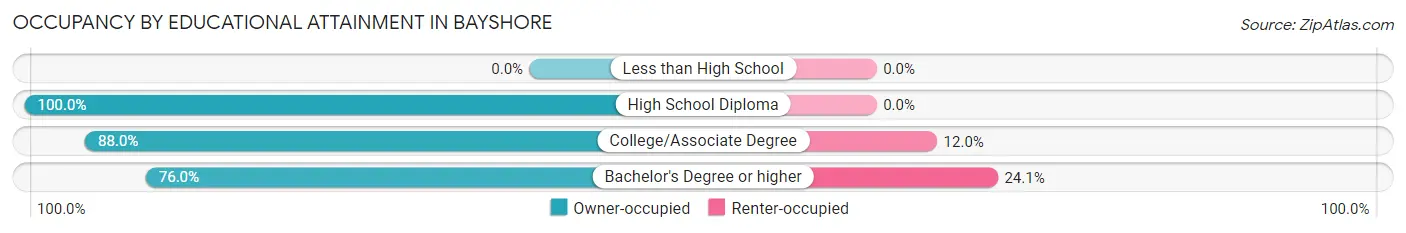
| Household Size | Owner-occupied | Renter-occupied |
| Less than High School | 0 (0.0%) | 0 (0.0%) |
| High School Diploma | 92 (100.0%) | 0 (0.0%) |
| College/Associate Degree | 323 (88.0%) | 44 (12.0%) |
| Bachelor's Degree or higher | 540 (75.9%) | 171 (24.0%) |
Occupancy by Age of Householder in Bayshore
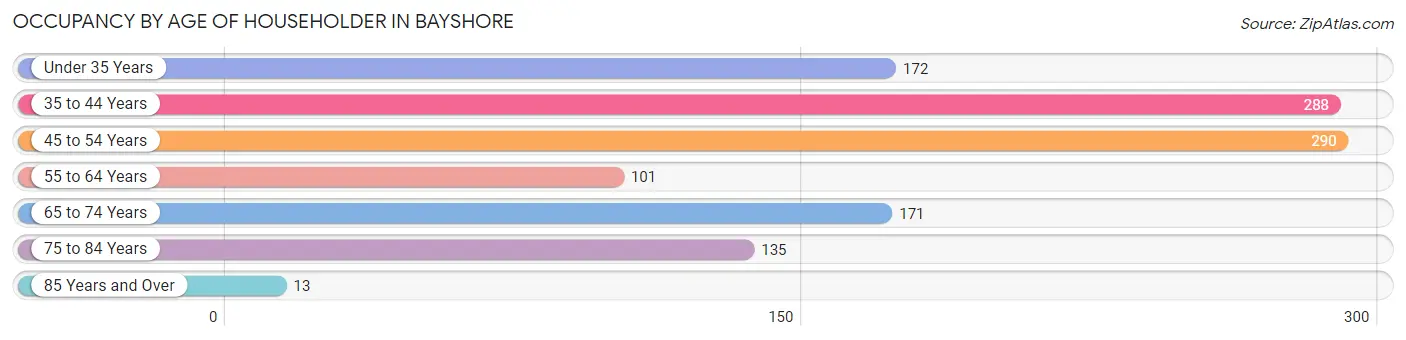
| Age Bracket | # Households | % Households |
| Under 35 Years | 172 | 14.7% |
| 35 to 44 Years | 288 | 24.6% |
| 45 to 54 Years | 290 | 24.8% |
| 55 to 64 Years | 101 | 8.6% |
| 65 to 74 Years | 171 | 14.6% |
| 75 to 84 Years | 135 | 11.5% |
| 85 Years and Over | 13 | 1.1% |
| Total | 1,170 | 100.0% |
Housing Finances in Bayshore
Median Income by Occupancy in Bayshore
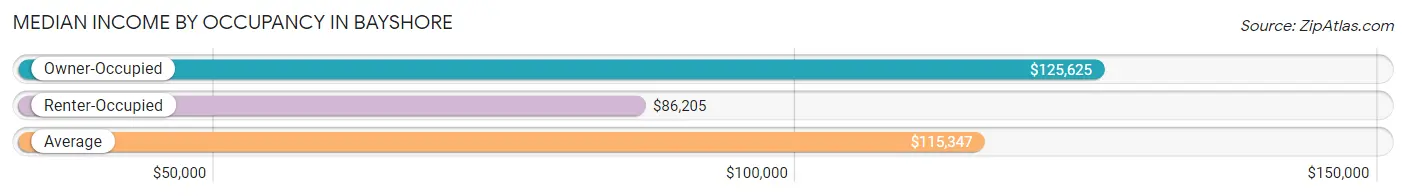
| Occupancy Type | # Households | Median Income |
| Owner-Occupied | 955 (81.6%) | $125,625 |
| Renter-Occupied | 215 (18.4%) | $86,205 |
| Average | 1,170 (100.0%) | $115,347 |
Occupancy by Householder Income Bracket in Bayshore
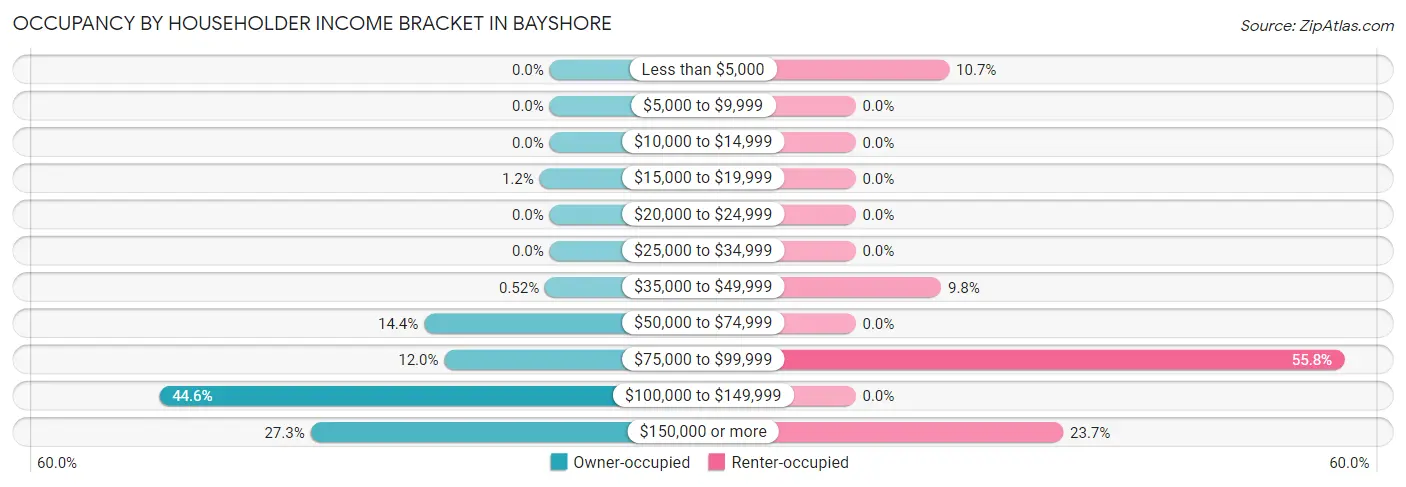
| Income Bracket | Owner-occupied | Renter-occupied |
| Less than $5,000 | 0 (0.0%) | 23 (10.7%) |
| $5,000 to $9,999 | 0 (0.0%) | 0 (0.0%) |
| $10,000 to $14,999 | 0 (0.0%) | 0 (0.0%) |
| $15,000 to $19,999 | 11 (1.1%) | 0 (0.0%) |
| $20,000 to $24,999 | 0 (0.0%) | 0 (0.0%) |
| $25,000 to $34,999 | 0 (0.0%) | 0 (0.0%) |
| $35,000 to $49,999 | 5 (0.5%) | 21 (9.8%) |
| $50,000 to $74,999 | 137 (14.3%) | 0 (0.0%) |
| $75,000 to $99,999 | 115 (12.0%) | 120 (55.8%) |
| $100,000 to $149,999 | 426 (44.6%) | 0 (0.0%) |
| $150,000 or more | 261 (27.3%) | 51 (23.7%) |
| Total | 955 (100.0%) | 215 (100.0%) |
Monthly Housing Cost Tiers in Bayshore

| Monthly Cost | Owner-occupied | Renter-occupied |
| Less than $300 | 0 (0.0%) | 0 (0.0%) |
| $300 to $499 | 16 (1.7%) | 55 (25.6%) |
| $500 to $799 | 149 (15.6%) | 0 (0.0%) |
| $800 to $999 | 37 (3.9%) | 0 (0.0%) |
| $1,000 to $1,499 | 186 (19.5%) | 103 (47.9%) |
| $1,500 to $1,999 | 160 (16.8%) | 40 (18.6%) |
| $2,000 to $2,499 | 171 (17.9%) | 0 (0.0%) |
| $2,500 to $2,999 | 96 (10.1%) | 0 (0.0%) |
| $3,000 or more | 140 (14.7%) | 0 (0.0%) |
| Total | 955 (100.0%) | 215 (100.0%) |
Physical Housing Characteristics in Bayshore
Housing Structures in Bayshore
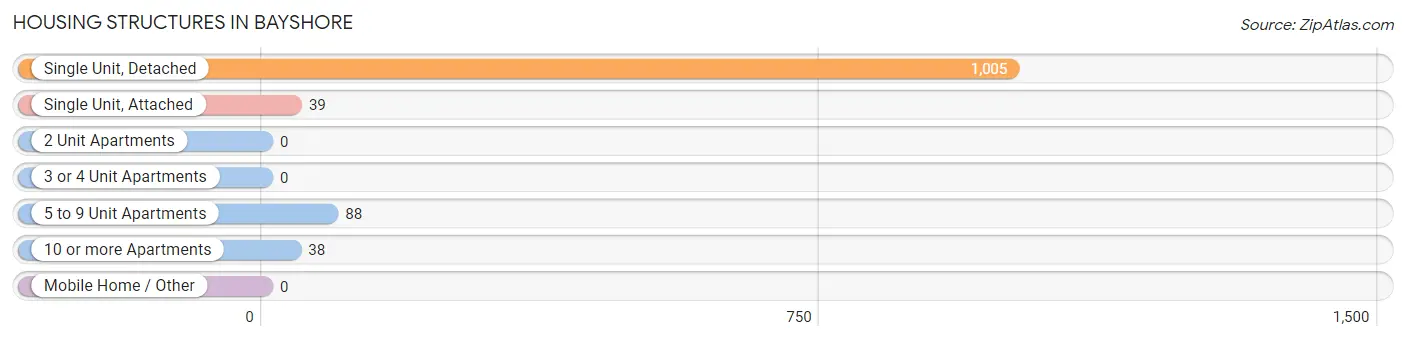
| Structure Type | # Housing Units | % Housing Units |
| Single Unit, Detached | 1,005 | 85.9% |
| Single Unit, Attached | 39 | 3.3% |
| 2 Unit Apartments | 0 | 0.0% |
| 3 or 4 Unit Apartments | 0 | 0.0% |
| 5 to 9 Unit Apartments | 88 | 7.5% |
| 10 or more Apartments | 38 | 3.3% |
| Mobile Home / Other | 0 | 0.0% |
| Total | 1,170 | 100.0% |
Housing Structures by Occupancy in Bayshore
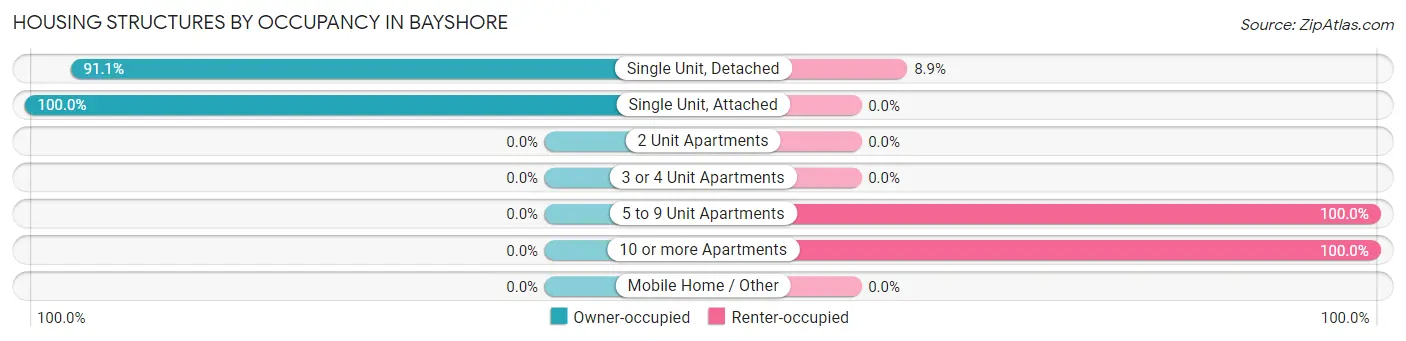
| Structure Type | Owner-occupied | Renter-occupied |
| Single Unit, Detached | 916 (91.1%) | 89 (8.9%) |
| Single Unit, Attached | 39 (100.0%) | 0 (0.0%) |
| 2 Unit Apartments | 0 (0.0%) | 0 (0.0%) |
| 3 or 4 Unit Apartments | 0 (0.0%) | 0 (0.0%) |
| 5 to 9 Unit Apartments | 0 (0.0%) | 88 (100.0%) |
| 10 or more Apartments | 0 (0.0%) | 38 (100.0%) |
| Mobile Home / Other | 0 (0.0%) | 0 (0.0%) |
| Total | 955 (81.6%) | 215 (18.4%) |
Housing Structures by Number of Rooms in Bayshore
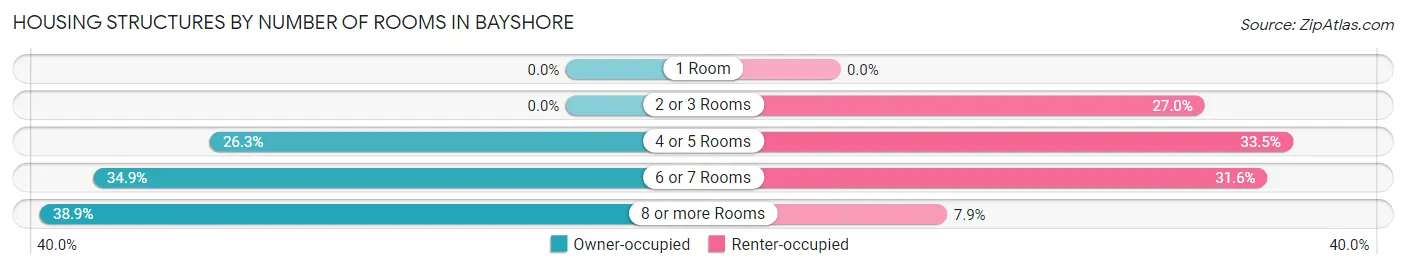
| Number of Rooms | Owner-occupied | Renter-occupied |
| 1 Room | 0 (0.0%) | 0 (0.0%) |
| 2 or 3 Rooms | 0 (0.0%) | 58 (27.0%) |
| 4 or 5 Rooms | 251 (26.3%) | 72 (33.5%) |
| 6 or 7 Rooms | 333 (34.9%) | 68 (31.6%) |
| 8 or more Rooms | 371 (38.9%) | 17 (7.9%) |
| Total | 955 (100.0%) | 215 (100.0%) |
Housing Structure by Heating Type in Bayshore
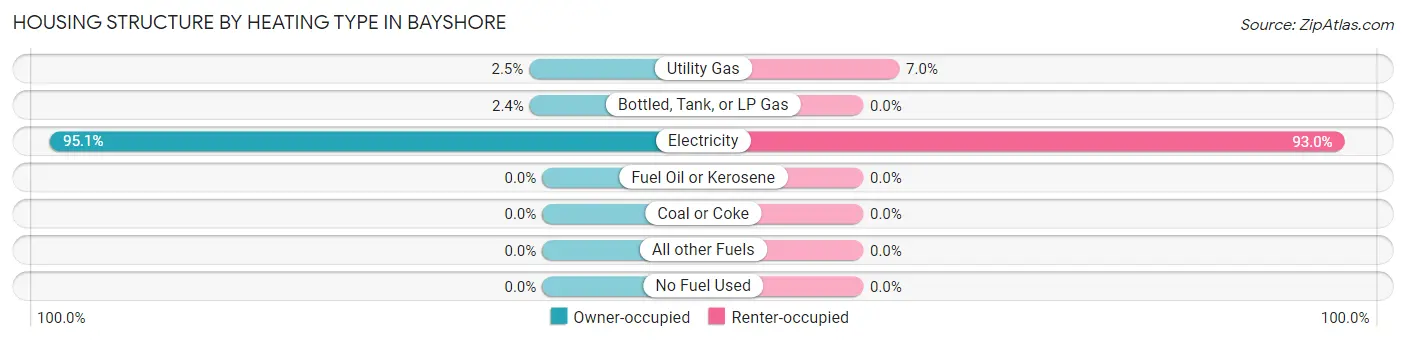
| Heating Type | Owner-occupied | Renter-occupied |
| Utility Gas | 24 (2.5%) | 15 (7.0%) |
| Bottled, Tank, or LP Gas | 23 (2.4%) | 0 (0.0%) |
| Electricity | 908 (95.1%) | 200 (93.0%) |
| Fuel Oil or Kerosene | 0 (0.0%) | 0 (0.0%) |
| Coal or Coke | 0 (0.0%) | 0 (0.0%) |
| All other Fuels | 0 (0.0%) | 0 (0.0%) |
| No Fuel Used | 0 (0.0%) | 0 (0.0%) |
| Total | 955 (100.0%) | 215 (100.0%) |
Household Vehicle Usage in Bayshore
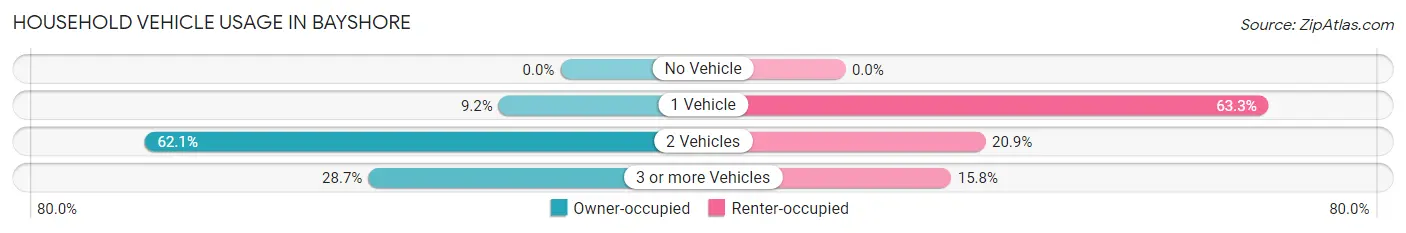
| Vehicles per Household | Owner-occupied | Renter-occupied |
| No Vehicle | 0 (0.0%) | 0 (0.0%) |
| 1 Vehicle | 88 (9.2%) | 136 (63.3%) |
| 2 Vehicles | 593 (62.1%) | 45 (20.9%) |
| 3 or more Vehicles | 274 (28.7%) | 34 (15.8%) |
| Total | 955 (100.0%) | 215 (100.0%) |
Real Estate & Mortgages in Bayshore
Real Estate and Mortgage Overview in Bayshore
| Characteristic | Without Mortgage | With Mortgage |
| Housing Units | 203 | 752 |
| Median Property Value | $437,600 | $446,600 |
| Median Household Income | $148,085 | $207 |
| Monthly Housing Costs | $781 | $140 |
| Real Estate Taxes | $2,575 | $0 |
Property Value by Mortgage Status in Bayshore
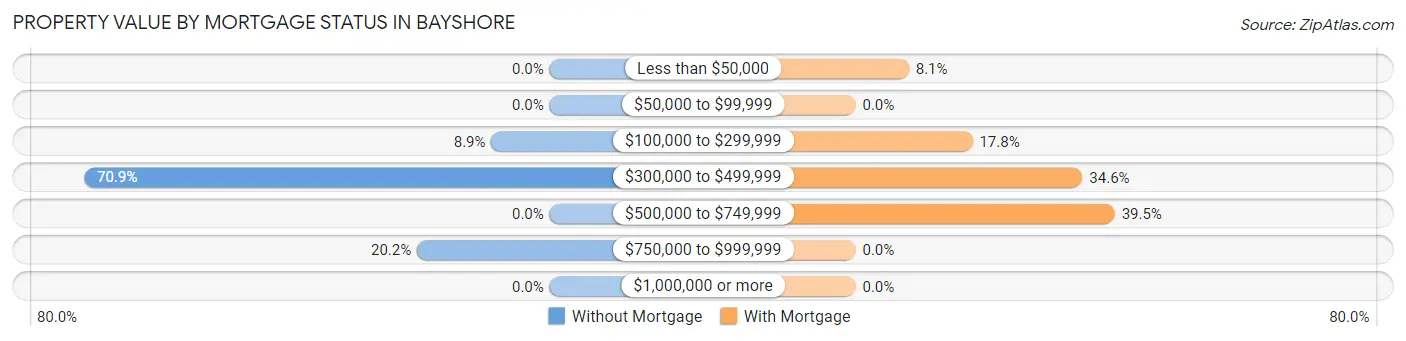
| Property Value | Without Mortgage | With Mortgage |
| Less than $50,000 | 0 (0.0%) | 61 (8.1%) |
| $50,000 to $99,999 | 0 (0.0%) | 0 (0.0%) |
| $100,000 to $299,999 | 18 (8.9%) | 134 (17.8%) |
| $300,000 to $499,999 | 144 (70.9%) | 260 (34.6%) |
| $500,000 to $749,999 | 0 (0.0%) | 297 (39.5%) |
| $750,000 to $999,999 | 41 (20.2%) | 0 (0.0%) |
| $1,000,000 or more | 0 (0.0%) | 0 (0.0%) |
| Total | 203 (100.0%) | 752 (100.0%) |
Household Income by Mortgage Status in Bayshore
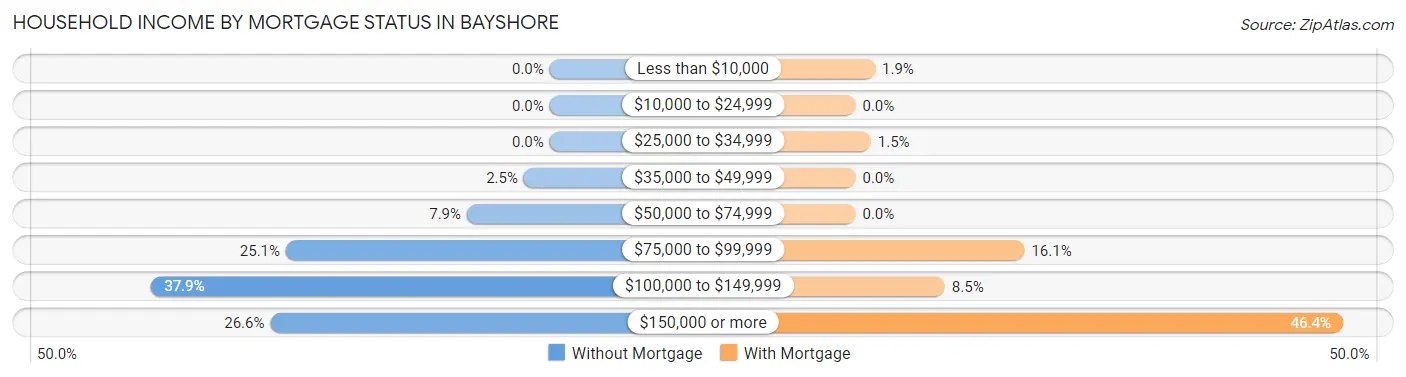
| Household Income | Without Mortgage | With Mortgage |
| Less than $10,000 | 0 (0.0%) | 14 (1.9%) |
| $10,000 to $24,999 | 0 (0.0%) | 0 (0.0%) |
| $25,000 to $34,999 | 0 (0.0%) | 11 (1.5%) |
| $35,000 to $49,999 | 5 (2.5%) | 0 (0.0%) |
| $50,000 to $74,999 | 16 (7.9%) | 0 (0.0%) |
| $75,000 to $99,999 | 51 (25.1%) | 121 (16.1%) |
| $100,000 to $149,999 | 77 (37.9%) | 64 (8.5%) |
| $150,000 or more | 54 (26.6%) | 349 (46.4%) |
| Total | 203 (100.0%) | 752 (100.0%) |
Property Value to Household Income Ratio in Bayshore
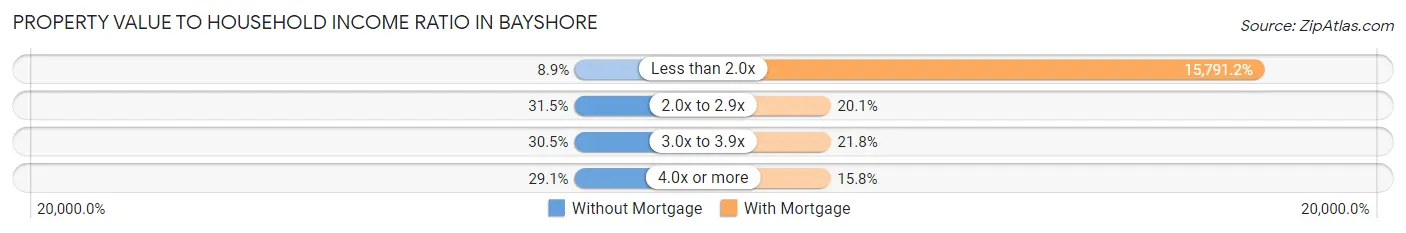
| Value-to-Income Ratio | Without Mortgage | With Mortgage |
| Less than 2.0x | 18 (8.9%) | 118,750 (15,791.2%) |
| 2.0x to 2.9x | 64 (31.5%) | 151 (20.1%) |
| 3.0x to 3.9x | 62 (30.5%) | 164 (21.8%) |
| 4.0x or more | 59 (29.1%) | 119 (15.8%) |
| Total | 203 (100.0%) | 752 (100.0%) |
Real Estate Taxes by Mortgage Status in Bayshore
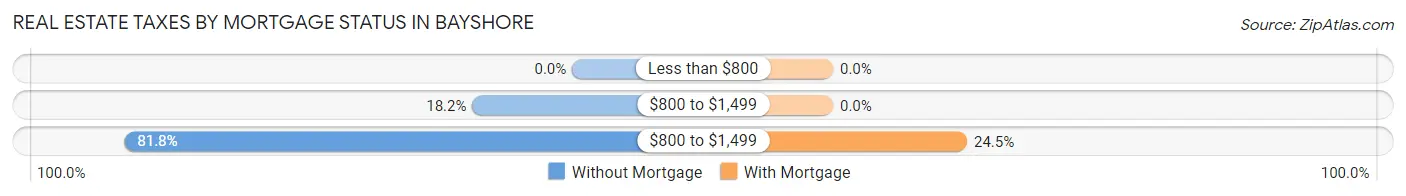
| Property Taxes | Without Mortgage | With Mortgage |
| Less than $800 | 0 (0.0%) | 0 (0.0%) |
| $800 to $1,499 | 37 (18.2%) | 0 (0.0%) |
| $800 to $1,499 | 166 (81.8%) | 184 (24.5%) |
| Total | 203 (100.0%) | 752 (100.0%) |
Health & Disability in Bayshore
Health Insurance Coverage by Age in Bayshore
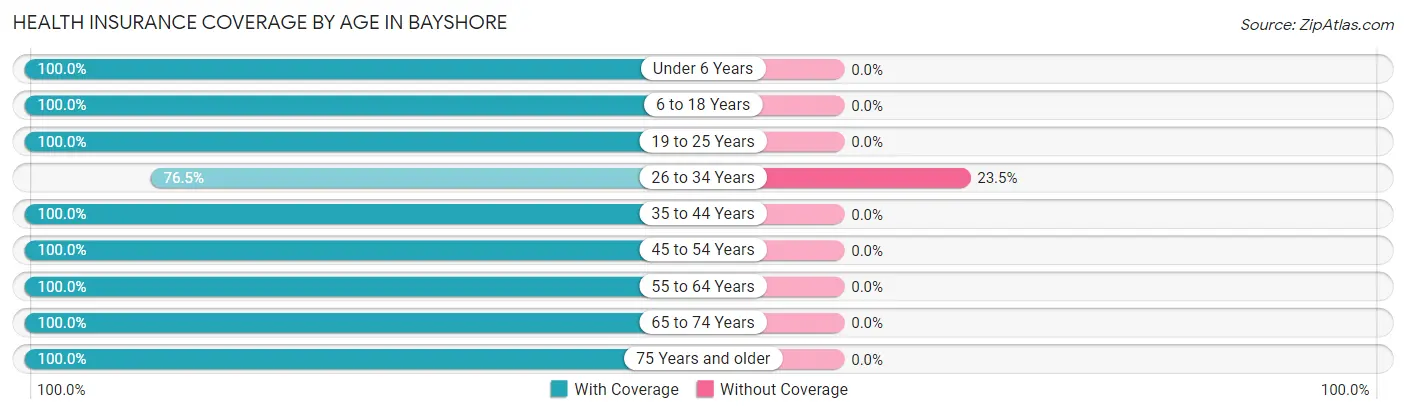
| Age Bracket | With Coverage | Without Coverage |
| Under 6 Years | 201 (100.0%) | 0 (0.0%) |
| 6 to 18 Years | 554 (100.0%) | 0 (0.0%) |
| 19 to 25 Years | 25 (100.0%) | 0 (0.0%) |
| 26 to 34 Years | 267 (76.5%) | 82 (23.5%) |
| 35 to 44 Years | 735 (100.0%) | 0 (0.0%) |
| 45 to 54 Years | 487 (100.0%) | 0 (0.0%) |
| 55 to 64 Years | 251 (100.0%) | 0 (0.0%) |
| 65 to 74 Years | 283 (100.0%) | 0 (0.0%) |
| 75 Years and older | 181 (100.0%) | 0 (0.0%) |
| Total | 2,984 (97.3%) | 82 (2.7%) |
Health Insurance Coverage by Citizenship Status in Bayshore
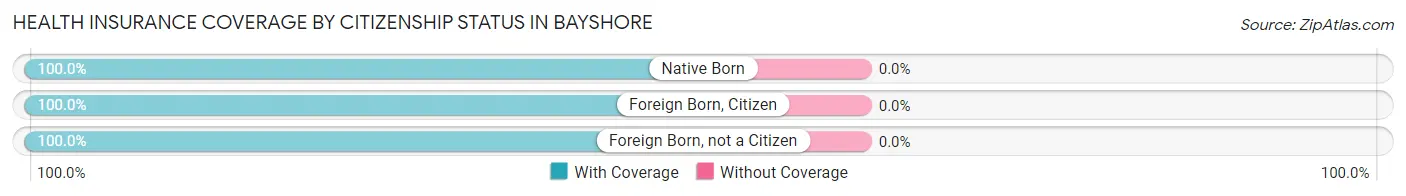
| Citizenship Status | With Coverage | Without Coverage |
| Native Born | 201 (100.0%) | 0 (0.0%) |
| Foreign Born, Citizen | 554 (100.0%) | 0 (0.0%) |
| Foreign Born, not a Citizen | 25 (100.0%) | 0 (0.0%) |
Health Insurance Coverage by Household Income in Bayshore
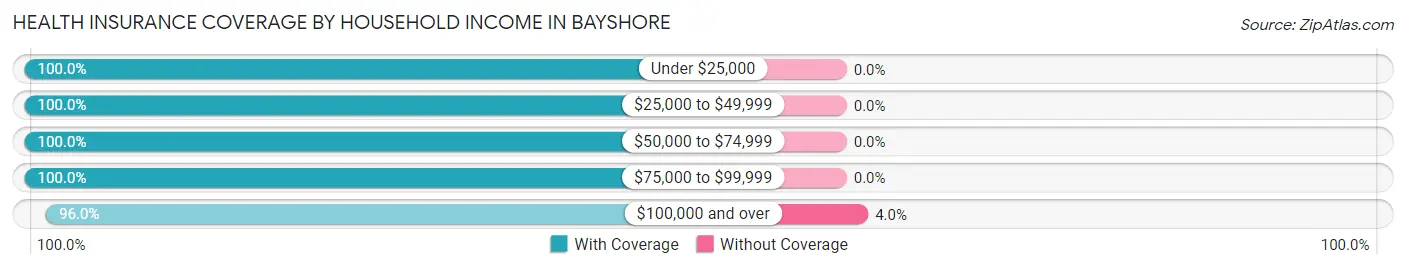
| Household Income | With Coverage | Without Coverage |
| Under $25,000 | 47 (100.0%) | 0 (0.0%) |
| $25,000 to $49,999 | 89 (100.0%) | 0 (0.0%) |
| $50,000 to $74,999 | 197 (100.0%) | 0 (0.0%) |
| $75,000 to $99,999 | 691 (100.0%) | 0 (0.0%) |
| $100,000 and over | 1,960 (96.0%) | 82 (4.0%) |
Public vs Private Health Insurance Coverage by Age in Bayshore
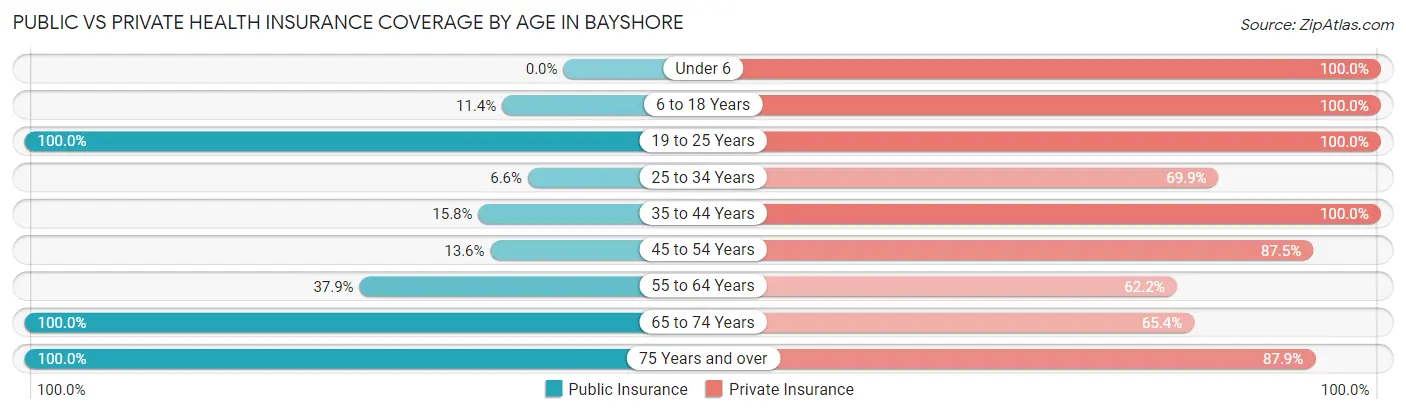
| Age Bracket | Public Insurance | Private Insurance |
| Under 6 | 0 (0.0%) | 201 (100.0%) |
| 6 to 18 Years | 63 (11.4%) | 554 (100.0%) |
| 19 to 25 Years | 25 (100.0%) | 25 (100.0%) |
| 25 to 34 Years | 23 (6.6%) | 244 (69.9%) |
| 35 to 44 Years | 116 (15.8%) | 735 (100.0%) |
| 45 to 54 Years | 66 (13.6%) | 426 (87.5%) |
| 55 to 64 Years | 95 (37.9%) | 156 (62.2%) |
| 65 to 74 Years | 283 (100.0%) | 185 (65.4%) |
| 75 Years and over | 181 (100.0%) | 159 (87.8%) |
| Total | 852 (27.8%) | 2,685 (87.6%) |
Disability Status by Sex by Age in Bayshore
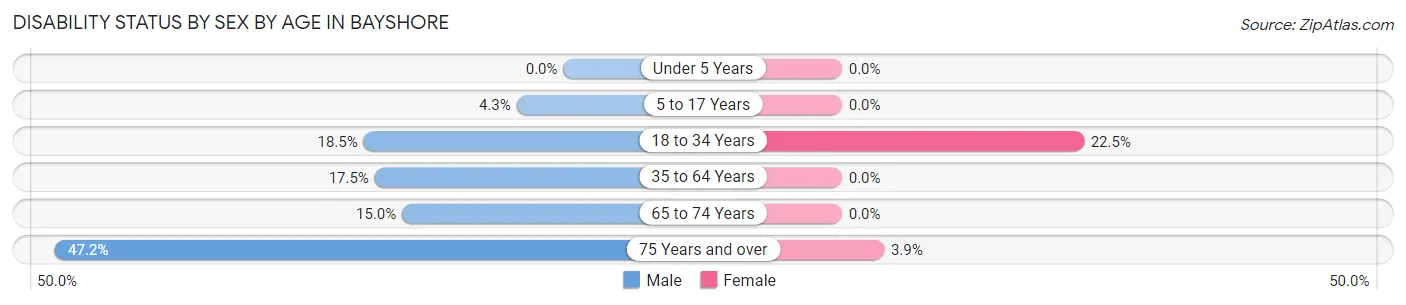
| Age Bracket | Male | Female |
| Under 5 Years | 0 (0.0%) | 0 (0.0%) |
| 5 to 17 Years | 16 (4.3%) | 0 (0.0%) |
| 18 to 34 Years | 33 (18.5%) | 44 (22.5%) |
| 35 to 64 Years | 125 (17.5%) | 0 (0.0%) |
| 65 to 74 Years | 28 (15.0%) | 0 (0.0%) |
| 75 Years and over | 25 (47.2%) | 5 (3.9%) |
Disability Class by Sex by Age in Bayshore
Disability Class: Hearing Difficulty
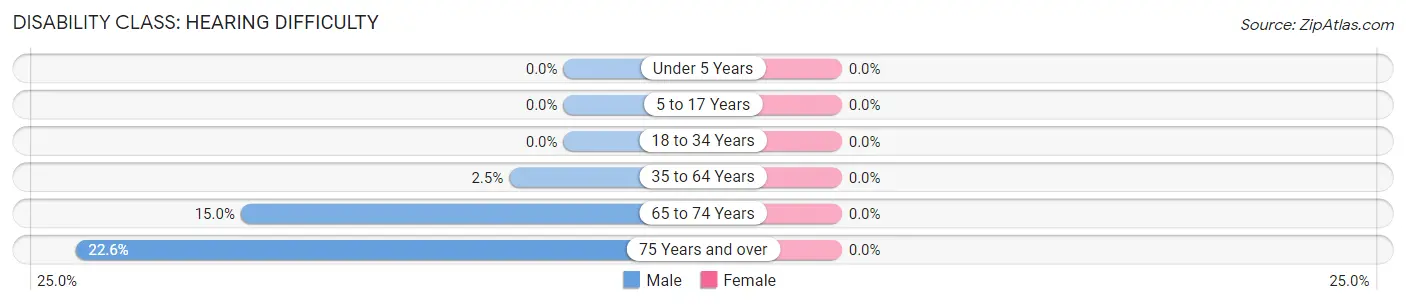
| Age Bracket | Male | Female |
| Under 5 Years | 0 (0.0%) | 0 (0.0%) |
| 5 to 17 Years | 0 (0.0%) | 0 (0.0%) |
| 18 to 34 Years | 0 (0.0%) | 0 (0.0%) |
| 35 to 64 Years | 18 (2.5%) | 0 (0.0%) |
| 65 to 74 Years | 28 (15.0%) | 0 (0.0%) |
| 75 Years and over | 12 (22.6%) | 0 (0.0%) |
Disability Class: Vision Difficulty
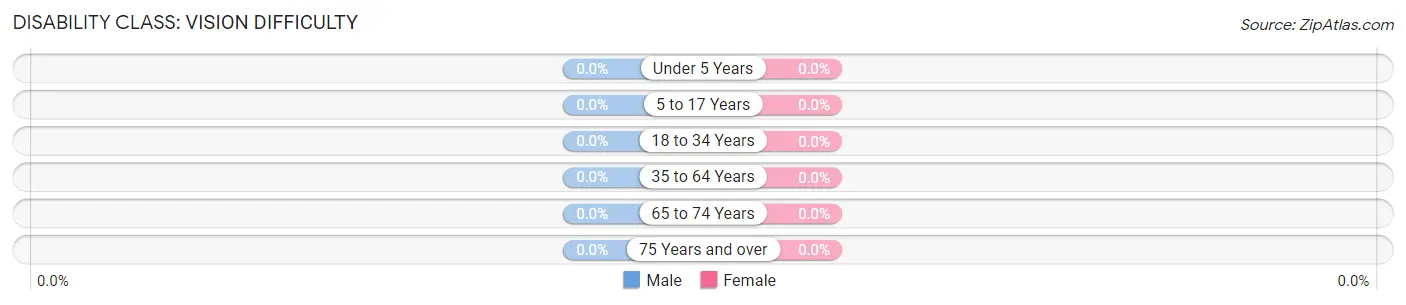
| Age Bracket | Male | Female |
| Under 5 Years | 0 (0.0%) | 0 (0.0%) |
| 5 to 17 Years | 0 (0.0%) | 0 (0.0%) |
| 18 to 34 Years | 0 (0.0%) | 0 (0.0%) |
| 35 to 64 Years | 0 (0.0%) | 0 (0.0%) |
| 65 to 74 Years | 0 (0.0%) | 0 (0.0%) |
| 75 Years and over | 0 (0.0%) | 0 (0.0%) |
Disability Class: Cognitive Difficulty
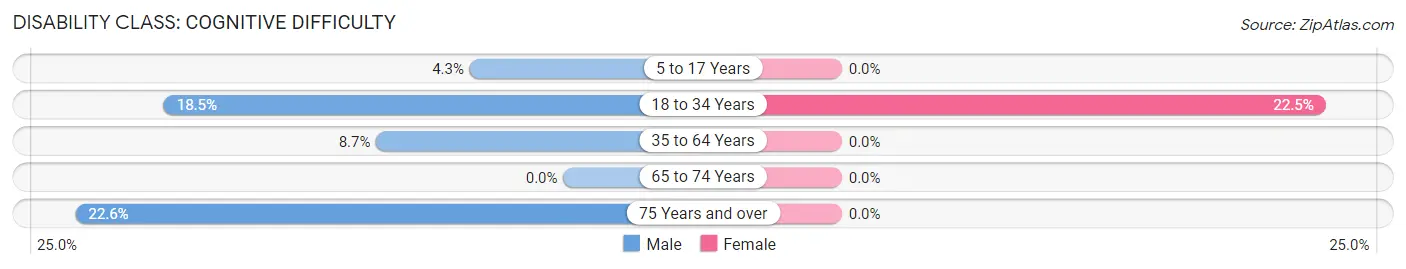
| Age Bracket | Male | Female |
| 5 to 17 Years | 16 (4.3%) | 0 (0.0%) |
| 18 to 34 Years | 33 (18.5%) | 44 (22.5%) |
| 35 to 64 Years | 62 (8.7%) | 0 (0.0%) |
| 65 to 74 Years | 0 (0.0%) | 0 (0.0%) |
| 75 Years and over | 12 (22.6%) | 0 (0.0%) |
Disability Class: Ambulatory Difficulty
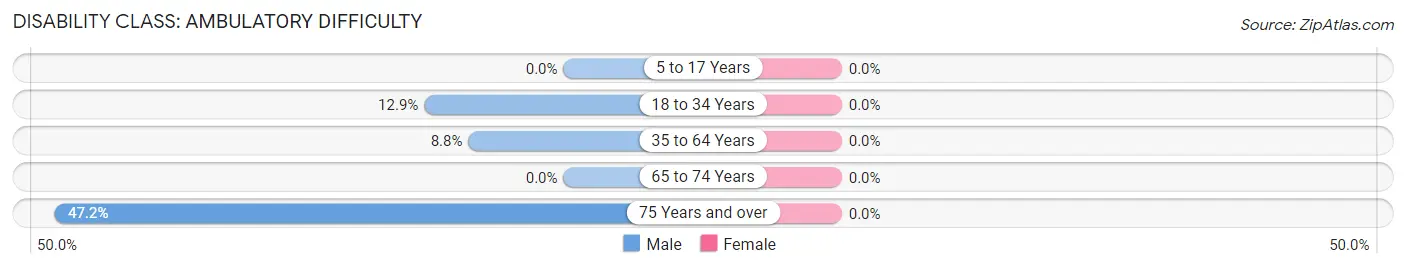
| Age Bracket | Male | Female |
| 5 to 17 Years | 0 (0.0%) | 0 (0.0%) |
| 18 to 34 Years | 23 (12.9%) | 0 (0.0%) |
| 35 to 64 Years | 63 (8.8%) | 0 (0.0%) |
| 65 to 74 Years | 0 (0.0%) | 0 (0.0%) |
| 75 Years and over | 25 (47.2%) | 0 (0.0%) |
Disability Class: Self-Care Difficulty
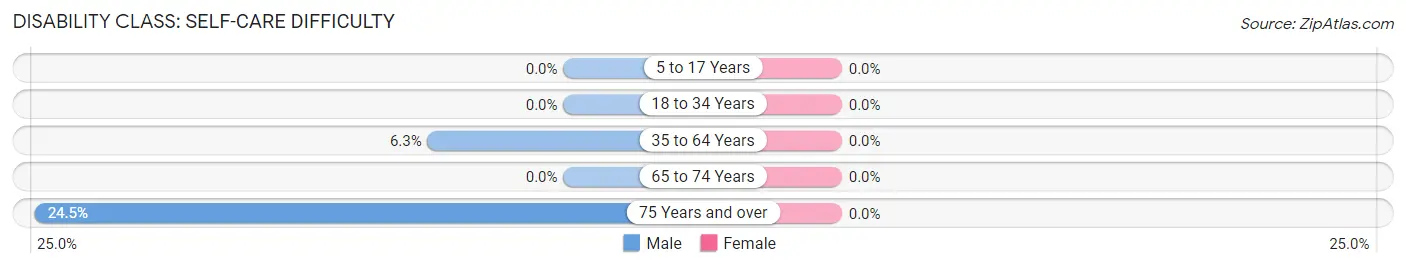
| Age Bracket | Male | Female |
| 5 to 17 Years | 0 (0.0%) | 0 (0.0%) |
| 18 to 34 Years | 0 (0.0%) | 0 (0.0%) |
| 35 to 64 Years | 45 (6.3%) | 0 (0.0%) |
| 65 to 74 Years | 0 (0.0%) | 0 (0.0%) |
| 75 Years and over | 13 (24.5%) | 0 (0.0%) |
Technology Access in Bayshore
Computing Device Access in Bayshore
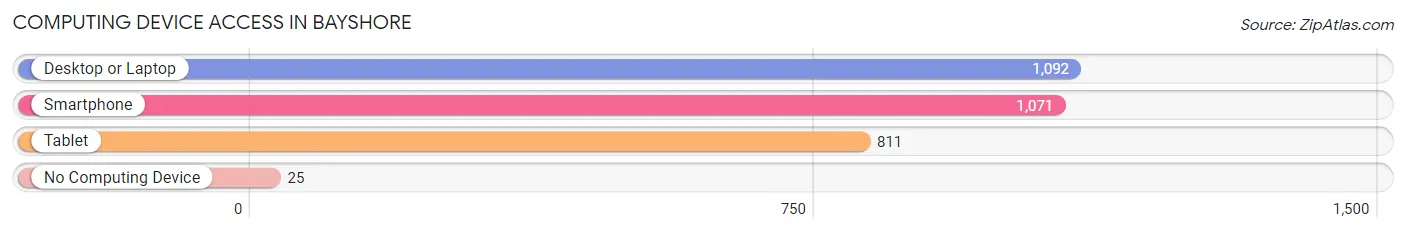
| Device Type | # Households | % Households |
| Desktop or Laptop | 1,092 | 93.3% |
| Smartphone | 1,071 | 91.5% |
| Tablet | 811 | 69.3% |
| No Computing Device | 25 | 2.1% |
| Total | 1,170 | 100.0% |
Internet Access in Bayshore
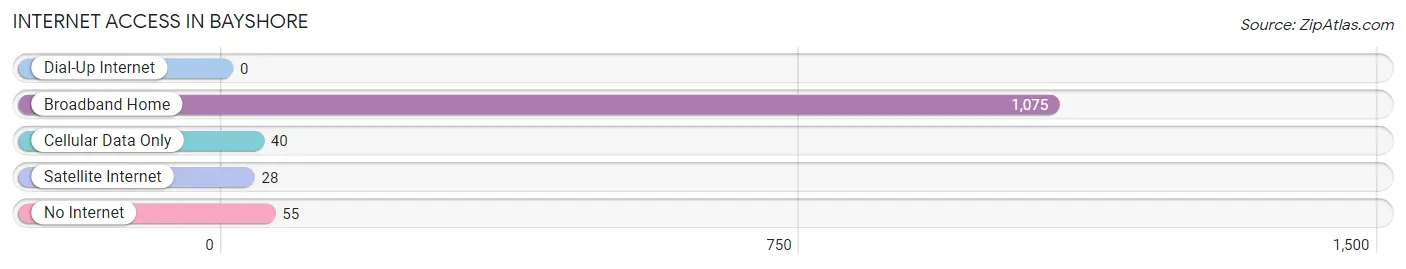
| Internet Type | # Households | % Households |
| Dial-Up Internet | 0 | 0.0% |
| Broadband Home | 1,075 | 91.9% |
| Cellular Data Only | 40 | 3.4% |
| Satellite Internet | 28 | 2.4% |
| No Internet | 55 | 4.7% |
| Total | 1,170 | 100.0% |
Bayshore Summary
Bayshore is a small unincorporated community located in Carteret County, North Carolina. It is situated on the western shore of Bogue Sound, just south of the town of Morehead City. The community is home to a variety of businesses, including a marina, a seafood market, and a few restaurants. Bayshore is also home to a number of residential neighborhoods, as well as a few vacation rental properties.
History
The area now known as Bayshore was first settled in the late 1700s by a group of settlers from the nearby town of Beaufort. The settlers were attracted to the area due to its abundance of fish and wildlife, as well as its proximity to the sound. The area was originally known as “Bogue Sound”, but the name was changed to “Bayshore” in the early 1900s.
In the early 1900s, the area began to develop as a fishing and shrimping community. The first commercial fishing boats were built in the area in the 1920s, and the first seafood market opened in the 1930s. The area also became a popular vacation destination, with many visitors coming to enjoy the area’s natural beauty and abundant seafood.
In the 1950s, the area began to experience rapid growth as more and more people moved to the area. This growth was fueled by the construction of the nearby Morehead City port, which brought an influx of new businesses and residents to the area.
Geography
Bayshore is located on the western shore of Bogue Sound, just south of the town of Morehead City. The area is bordered by the Atlantic Ocean to the east and the Intracoastal Waterway to the west. The area is characterized by its flat terrain and sandy beaches.
The climate in Bayshore is mild and humid, with temperatures ranging from the mid-50s in the winter to the mid-80s in the summer. The area receives an average of 50 inches of rain per year, with most of the rain falling in the summer months.
Economy
The economy of Bayshore is largely based on tourism and fishing. The area is home to a number of seafood markets, restaurants, and marinas, as well as a few vacation rental properties. The area is also home to a number of small businesses, including a few retail stores and a few service-based businesses.
Demographics
As of the 2010 census, the population of Bayshore was 1,845. The population is largely white (90.3%), with a small percentage of African Americans (4.2%) and Hispanics (2.7%). The median household income in the area is $41,944, and the median home value is $179,400. The area is largely rural, with most of the population living in single-family homes.
Common Questions
What is the Total Population of Bayshore?
Total Population of Bayshore is 3,066.
What is the Total Male Population of Bayshore?
Total Male Population of Bayshore is 1,651.
What is the Total Female Population of Bayshore?
Total Female Population of Bayshore is 1,415.
What is the Ratio of Males per 100 Females in Bayshore?
There are 116.68 Males per 100 Females in Bayshore.
What is the Ratio of Females per 100 Males in Bayshore?
There are 85.71 Females per 100 Males in Bayshore.
What is the Median Population Age in Bayshore?
Median Population Age in Bayshore is 41.1 Years.
What is the Average Family Size in Bayshore
Average Family Size in Bayshore is 2.7 People.
What is the Average Household Size in Bayshore
Average Household Size in Bayshore is 2.6 People.
What is Per Capita Income in Bayshore?
Per Capita income in Bayshore is $50,734.
What is the Median Family Income in Bayshore?
Median Family Income in Bayshore is $128,216.
What is the Median Household income in Bayshore?
Median Household Income in Bayshore is $115,347.
What is Income or Wage Gap in Bayshore?
Income or Wage Gap in Bayshore is 3.4%.
Women in Bayshore earn 96.6 cents for every dollar earned by a man.
What is Inequality or Gini Index in Bayshore?
Inequality or Gini Index in Bayshore is 0.30.
How Large is the Labor Force in Bayshore?
There are 1,824 People in the Labor Forcein in Bayshore.
What is the Percentage of People in the Labor Force in Bayshore?
77.7% of People are in the Labor Force in Bayshore.
What is the Unemployment Rate in Bayshore?
Unemployment Rate in Bayshore is 2.1%.