Goldsboro, NC
Goldsboro Map
Goldsboro Overview
33,566
TOTAL POPULATION
16,326
MALE POPULATION
17,240
FEMALE POPULATION
94.70
MALES / 100 FEMALES
105.60
FEMALES / 100 MALES
36.7
MEDIAN AGE
2.9
AVG FAMILY SIZE
2.1
AVG HOUSEHOLD SIZE
$29,622
PER CAPITA INCOME
$56,897
AVG FAMILY INCOME
$44,196
AVG HOUSEHOLD INCOME
31.2%
WAGE / INCOME GAP [ % ]
68.8¢/ $1
WAGE / INCOME GAP [ $ ]
$11,292
FAMILY INCOME DEFICIT
0.50
INEQUALITY / GINI INDEX
15,915
LABOR FORCE [ PEOPLE ]
58.8%
PERCENT IN LABOR FORCE
7.5%
UNEMPLOYMENT RATE
Goldsboro Area Codes
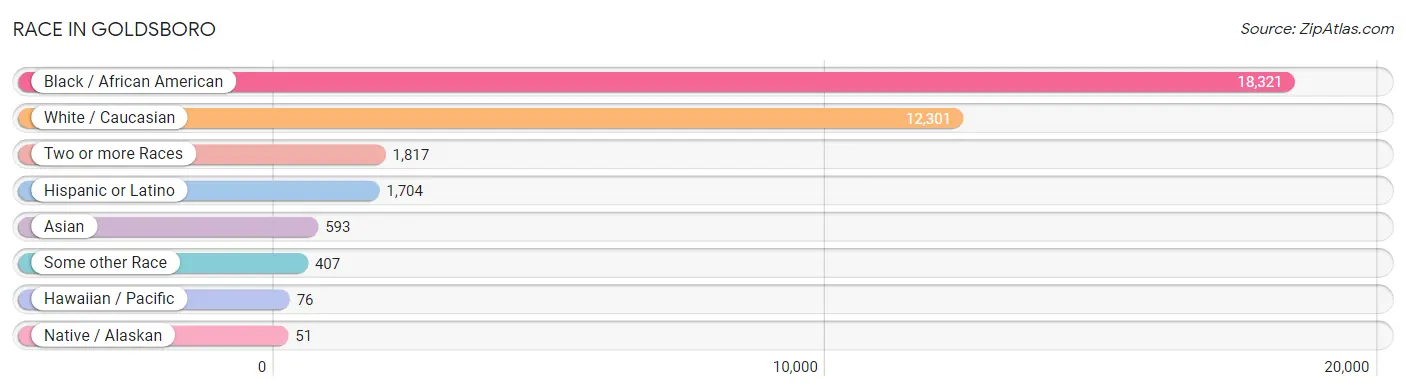
Race in Goldsboro
The most populous races in Goldsboro are Black / African American (18,321 | 54.6%), White / Caucasian (12,301 | 36.6%), and Two or more Races (1,817 | 5.4%).
| Race | # Population | % Population |
| Asian | 593 | 1.8% |
| Black / African American | 18,321 | 54.6% |
| Hawaiian / Pacific | 76 | 0.2% |
| Hispanic or Latino | 1,704 | 5.1% |
| Native / Alaskan | 51 | 0.2% |
| White / Caucasian | 12,301 | 36.6% |
| Two or more Races | 1,817 | 5.4% |
| Some other Race | 407 | 1.2% |
| Total | 33,566 | 100.0% |
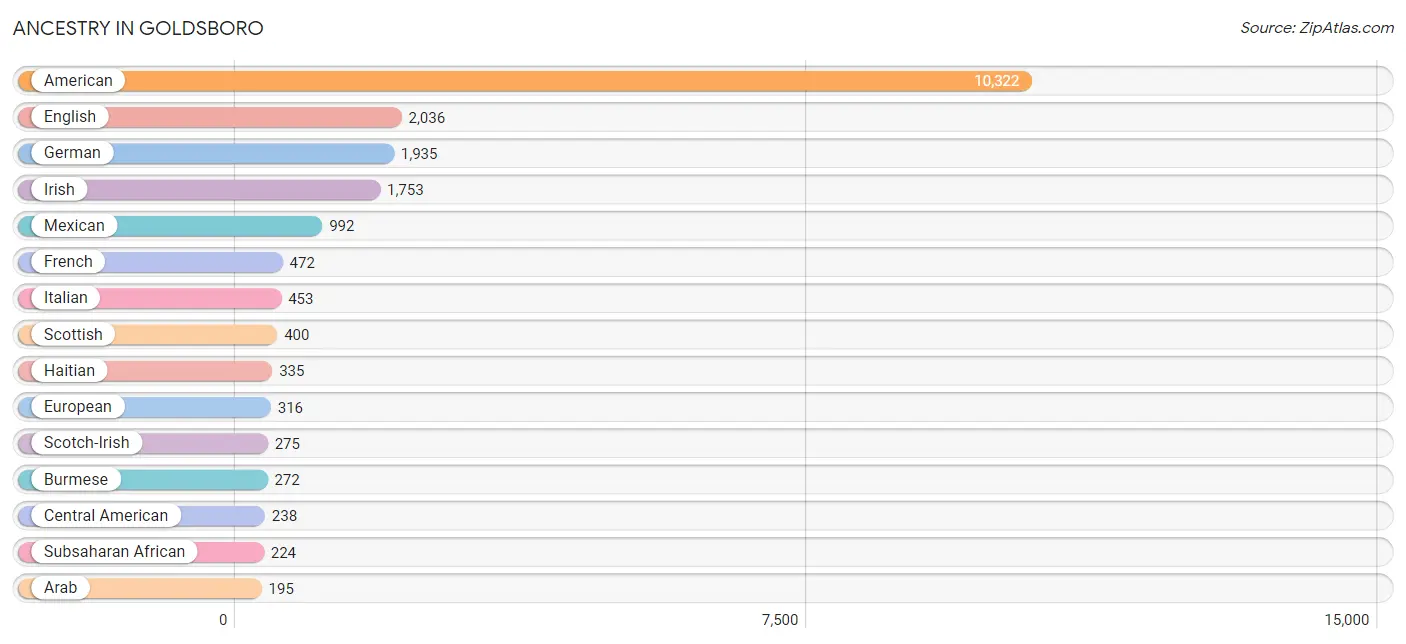
Ancestry in Goldsboro
The most populous ancestries reported in Goldsboro are American (10,322 | 30.7%), English (2,036 | 6.1%), German (1,935 | 5.8%), Irish (1,753 | 5.2%), and Mexican (992 | 3.0%), together accounting for 50.8% of all Goldsboro residents.
| Ancestry | # Population | % Population |
| African | 152 | 0.4% |
| American | 10,322 | 30.7% |
| Arab | 195 | 0.6% |
| Bangladeshi | 41 | 0.1% |
| Belgian | 38 | 0.1% |
| Bhutanese | 28 | 0.1% |
| Blackfeet | 21 | 0.1% |
| Brazilian | 20 | 0.1% |
| British | 179 | 0.5% |
| Burmese | 272 | 0.8% |
| Cajun | 2 | 0.0% |
| Cambodian | 2 | 0.0% |
| Cape Verdean | 14 | 0.0% |
| Central American | 238 | 0.7% |
| Cherokee | 131 | 0.4% |
| Colombian | 27 | 0.1% |
| Cuban | 15 | 0.0% |
| Czech | 8 | 0.0% |
| Dominican | 55 | 0.2% |
| Dutch | 169 | 0.5% |
| Eastern European | 41 | 0.1% |
| Ecuadorian | 47 | 0.1% |
| English | 2,036 | 6.1% |
| European | 316 | 0.9% |
| French | 472 | 1.4% |
| French Canadian | 64 | 0.2% |
| German | 1,935 | 5.8% |
| Ghanaian | 52 | 0.2% |
| Greek | 54 | 0.2% |
| Guamanian / Chamorro | 42 | 0.1% |
| Guatemalan | 11 | 0.0% |
| Haitian | 335 | 1.0% |
| Honduran | 100 | 0.3% |
| Hungarian | 24 | 0.1% |
| Indian (Asian) | 161 | 0.5% |
| Inupiat | 9 | 0.0% |
| Irish | 1,753 | 5.2% |
| Italian | 453 | 1.3% |
| Jamaican | 145 | 0.4% |
| Japanese | 9 | 0.0% |
| Kenyan | 2 | 0.0% |
| Korean | 195 | 0.6% |
| Laotian | 30 | 0.1% |
| Lebanese | 27 | 0.1% |
| Lumbee | 32 | 0.1% |
| Malaysian | 8 | 0.0% |
| Mexican | 992 | 3.0% |
| Mexican American Indian | 2 | 0.0% |
| Native Hawaiian | 60 | 0.2% |
| Northern European | 7 | 0.0% |
| Norwegian | 91 | 0.3% |
| Osage | 25 | 0.1% |
| Pakistani | 131 | 0.4% |
| Palestinian | 13 | 0.0% |
| Polish | 44 | 0.1% |
| Portuguese | 48 | 0.1% |
| Puerto Rican | 153 | 0.5% |
| Russian | 34 | 0.1% |
| Salvadoran | 127 | 0.4% |
| Samoan | 50 | 0.2% |
| Scandinavian | 19 | 0.1% |
| Scotch-Irish | 275 | 0.8% |
| Scottish | 400 | 1.2% |
| Sioux | 17 | 0.1% |
| Slovak | 53 | 0.2% |
| Slovene | 7 | 0.0% |
| South American | 107 | 0.3% |
| Spaniard | 58 | 0.2% |
| Spanish | 39 | 0.1% |
| Sri Lankan | 36 | 0.1% |
| Subsaharan African | 224 | 0.7% |
| Swedish | 89 | 0.3% |
| Swiss | 39 | 0.1% |
| Thai | 188 | 0.6% |
| Tongan | 15 | 0.0% |
| Ugandan | 10 | 0.0% |
| Ukrainian | 10 | 0.0% |
| Venezuelan | 33 | 0.1% |
| Welsh | 82 | 0.2% |
| West Indian | 80 | 0.2% | View All 80 Rows |
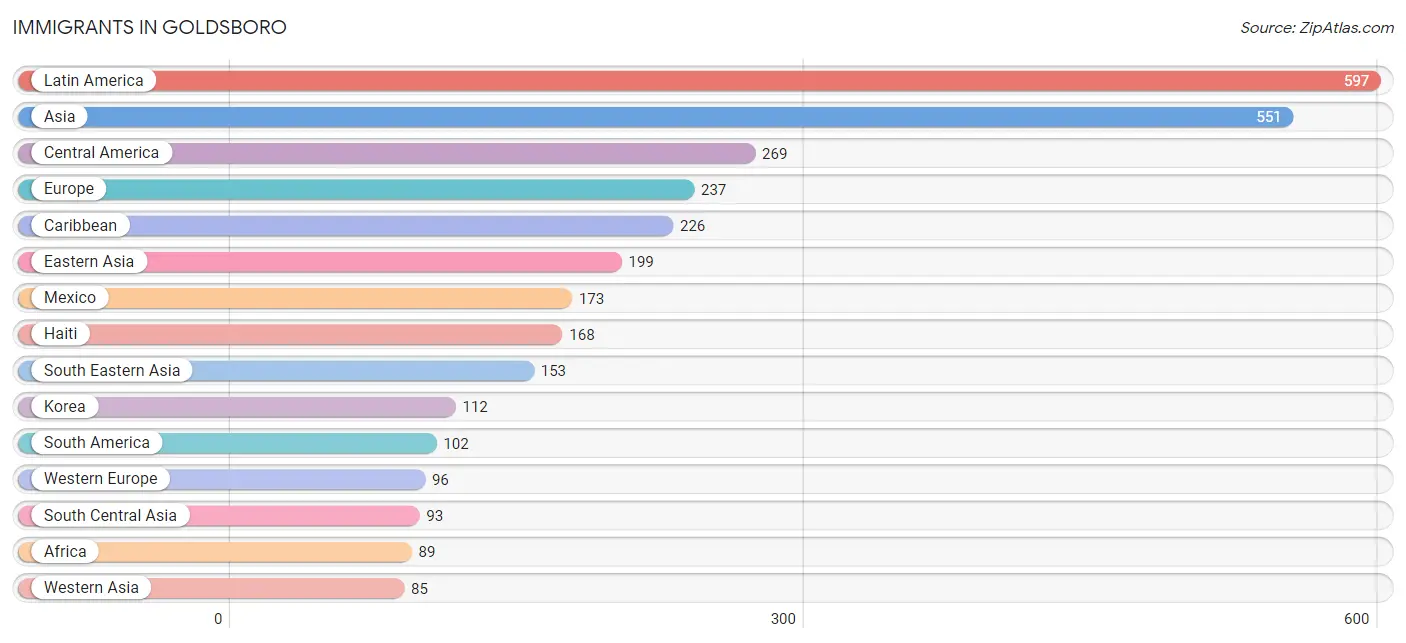
Immigrants in Goldsboro
The most numerous immigrant groups reported in Goldsboro came from Latin America (597 | 1.8%), Asia (551 | 1.6%), Central America (269 | 0.8%), Europe (237 | 0.7%), and Caribbean (226 | 0.7%), together accounting for 5.6% of all Goldsboro residents.
| Immigration Origin | # Population | % Population |
| Africa | 89 | 0.3% |
| Asia | 551 | 1.6% |
| Bangladesh | 15 | 0.0% |
| Belgium | 8 | 0.0% |
| Brazil | 28 | 0.1% |
| Caribbean | 226 | 0.7% |
| Central America | 269 | 0.8% |
| China | 53 | 0.2% |
| Colombia | 27 | 0.1% |
| Dominican Republic | 10 | 0.0% |
| Eastern Africa | 12 | 0.0% |
| Eastern Asia | 199 | 0.6% |
| Eastern Europe | 60 | 0.2% |
| Ecuador | 34 | 0.1% |
| El Salvador | 47 | 0.1% |
| Europe | 237 | 0.7% |
| Germany | 77 | 0.2% |
| Ghana | 77 | 0.2% |
| Guatemala | 11 | 0.0% |
| Haiti | 168 | 0.5% |
| Honduras | 38 | 0.1% |
| India | 76 | 0.2% |
| Indonesia | 83 | 0.3% |
| Italy | 4 | 0.0% |
| Jamaica | 48 | 0.1% |
| Japan | 34 | 0.1% |
| Kazakhstan | 2 | 0.0% |
| Kenya | 2 | 0.0% |
| Korea | 112 | 0.3% |
| Laos | 3 | 0.0% |
| Latin America | 597 | 1.8% |
| Latvia | 38 | 0.1% |
| Mexico | 173 | 0.5% |
| Netherlands | 11 | 0.0% |
| Northern Europe | 17 | 0.1% |
| Oceania | 27 | 0.1% |
| Philippines | 41 | 0.1% |
| Russia | 22 | 0.1% |
| Scotland | 5 | 0.0% |
| South America | 102 | 0.3% |
| South Central Asia | 93 | 0.3% |
| South Eastern Asia | 153 | 0.5% |
| Southern Europe | 64 | 0.2% |
| Spain | 60 | 0.2% |
| Taiwan | 7 | 0.0% |
| Thailand | 23 | 0.1% |
| Uganda | 10 | 0.0% |
| Venezuela | 13 | 0.0% |
| Vietnam | 3 | 0.0% |
| Western Africa | 77 | 0.2% |
| Western Asia | 85 | 0.3% |
| Western Europe | 96 | 0.3% |
| Yemen | 85 | 0.3% | View All 53 Rows |
Sex and Age in Goldsboro
Sex and Age in Goldsboro
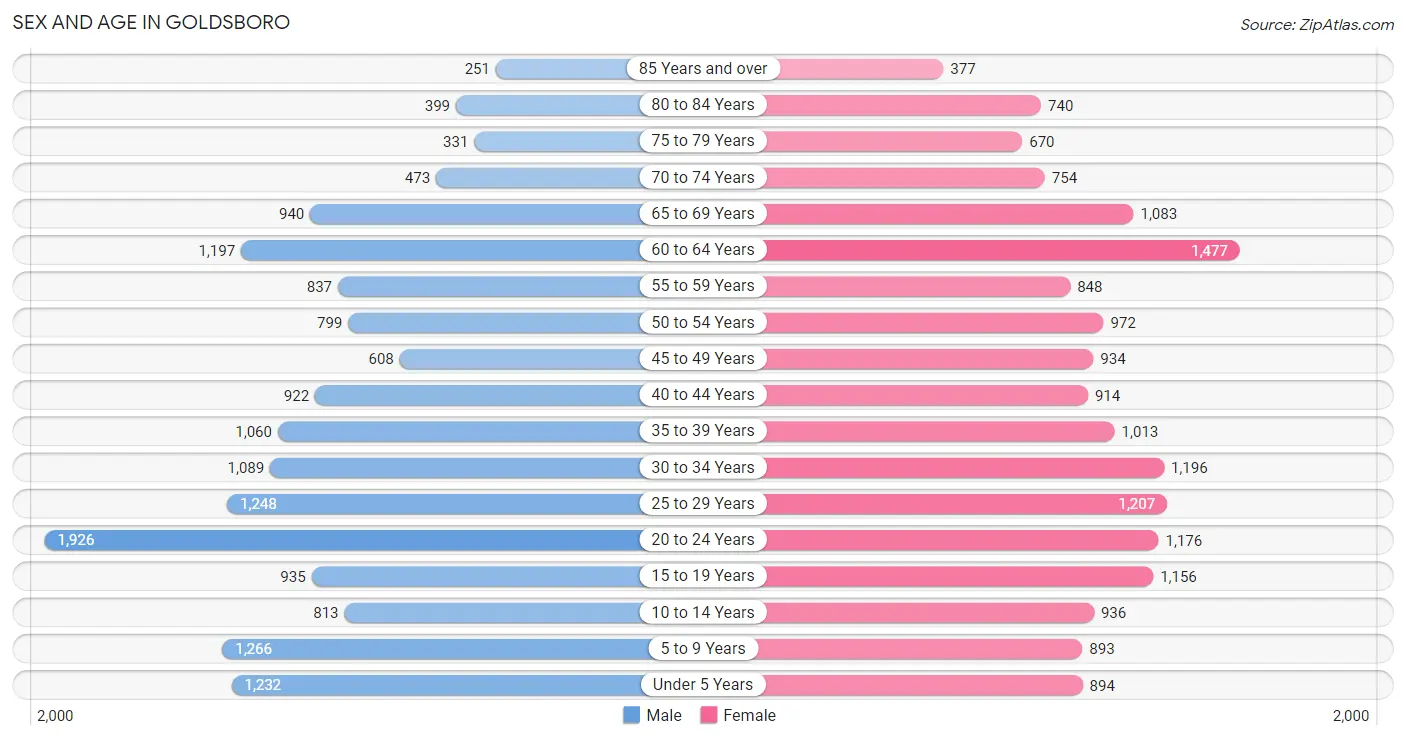
The most populous age groups in Goldsboro are 20 to 24 Years (1,926 | 11.8%) for men and 60 to 64 Years (1,477 | 8.6%) for women.
| Age Bracket | Male | Female |
| Under 5 Years | 1,232 (7.5%) | 894 (5.2%) |
| 5 to 9 Years | 1,266 (7.7%) | 893 (5.2%) |
| 10 to 14 Years | 813 (5.0%) | 936 (5.4%) |
| 15 to 19 Years | 935 (5.7%) | 1,156 (6.7%) |
| 20 to 24 Years | 1,926 (11.8%) | 1,176 (6.8%) |
| 25 to 29 Years | 1,248 (7.6%) | 1,207 (7.0%) |
| 30 to 34 Years | 1,089 (6.7%) | 1,196 (6.9%) |
| 35 to 39 Years | 1,060 (6.5%) | 1,013 (5.9%) |
| 40 to 44 Years | 922 (5.7%) | 914 (5.3%) |
| 45 to 49 Years | 608 (3.7%) | 934 (5.4%) |
| 50 to 54 Years | 799 (4.9%) | 972 (5.6%) |
| 55 to 59 Years | 837 (5.1%) | 848 (4.9%) |
| 60 to 64 Years | 1,197 (7.3%) | 1,477 (8.6%) |
| 65 to 69 Years | 940 (5.8%) | 1,083 (6.3%) |
| 70 to 74 Years | 473 (2.9%) | 754 (4.4%) |
| 75 to 79 Years | 331 (2.0%) | 670 (3.9%) |
| 80 to 84 Years | 399 (2.4%) | 740 (4.3%) |
| 85 Years and over | 251 (1.5%) | 377 (2.2%) |
| Total | 16,326 (100.0%) | 17,240 (100.0%) |
Families and Households in Goldsboro
Median Family Size in Goldsboro
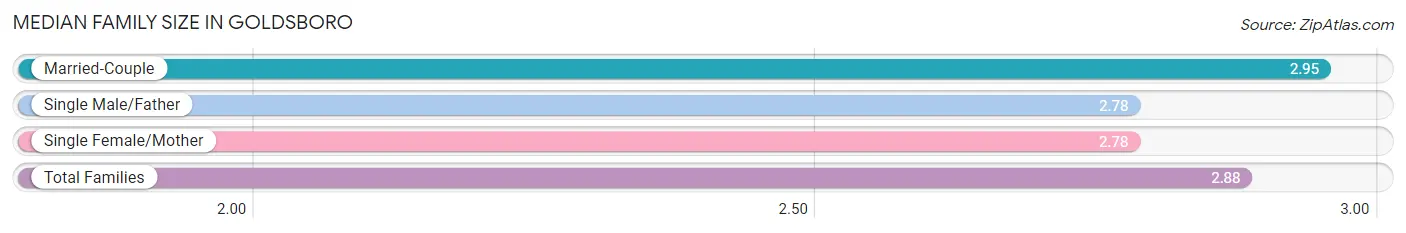
The median family size in Goldsboro is 2.88 persons per family, with married-couple families (4,650 | 56.9%) accounting for the largest median family size of 2.95 persons per family. On the other hand, single male/father families (476 | 5.8%) represent the smallest median family size with 2.78 persons per family.
| Family Type | # Families | Family Size |
| Married-Couple | 4,650 (56.9%) | 2.95 |
| Single Male/Father | 476 (5.8%) | 2.78 |
| Single Female/Mother | 3,054 (37.3%) | 2.78 |
| Total Families | 8,180 (100.0%) | 2.88 |
Median Household Size in Goldsboro
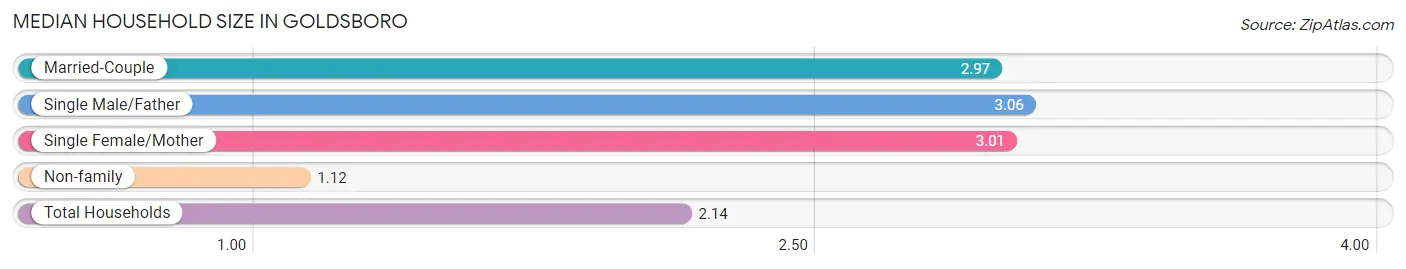
The median household size in Goldsboro is 2.14 persons per household, with single male/father households (476 | 3.2%) accounting for the largest median household size of 3.06 persons per household. non-family households (6,731 | 45.1%) represent the smallest median household size with 1.12 persons per household.
| Household Type | # Households | Household Size |
| Married-Couple | 4,650 (31.2%) | 2.97 |
| Single Male/Father | 476 (3.2%) | 3.06 |
| Single Female/Mother | 3,054 (20.5%) | 3.01 |
| Non-family | 6,731 (45.1%) | 1.12 |
| Total Households | 14,911 (100.0%) | 2.14 |
Household Size by Marriage Status in Goldsboro
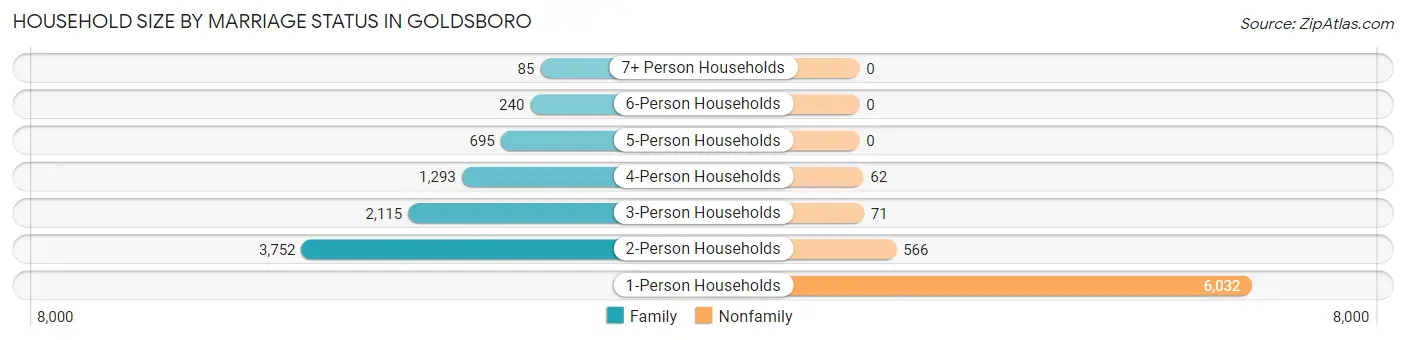
Out of a total of 14,911 households in Goldsboro, 8,180 (54.9%) are family households, while 6,731 (45.1%) are nonfamily households. The most numerous type of family households are 2-person households, comprising 3,752, and the most common type of nonfamily households are 1-person households, comprising 6,032.
| Household Size | Family Households | Nonfamily Households |
| 1-Person Households | - | 6,032 (40.5%) |
| 2-Person Households | 3,752 (25.2%) | 566 (3.8%) |
| 3-Person Households | 2,115 (14.2%) | 71 (0.5%) |
| 4-Person Households | 1,293 (8.7%) | 62 (0.4%) |
| 5-Person Households | 695 (4.7%) | 0 (0.0%) |
| 6-Person Households | 240 (1.6%) | 0 (0.0%) |
| 7+ Person Households | 85 (0.6%) | 0 (0.0%) |
| Total | 8,180 (54.9%) | 6,731 (45.1%) |
Female Fertility in Goldsboro
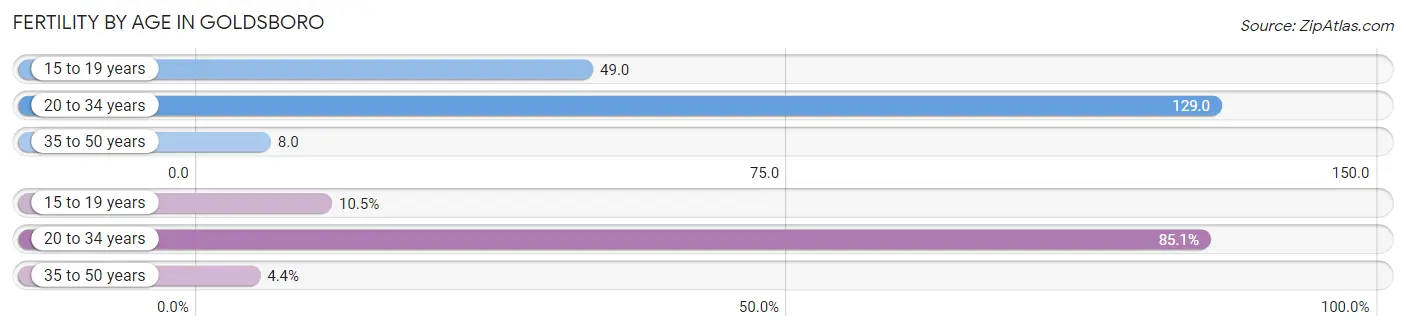
Fertility by Age in Goldsboro
Average fertility rate in Goldsboro is 70.0 births per 1,000 women. Women in the age bracket of 20 to 34 years have the highest fertility rate with 129.0 births per 1,000 women. Women in the age bracket of 20 to 34 years acount for 85.1% of all women with births.
| Age Bracket | Women with Births | Births / 1,000 Women |
| 15 to 19 years | 57 (10.5%) | 49.0 |
| 20 to 34 years | 461 (85.1%) | 129.0 |
| 35 to 50 years | 24 (4.4%) | 8.0 |
| Total | 542 (100.0%) | 70.0 |
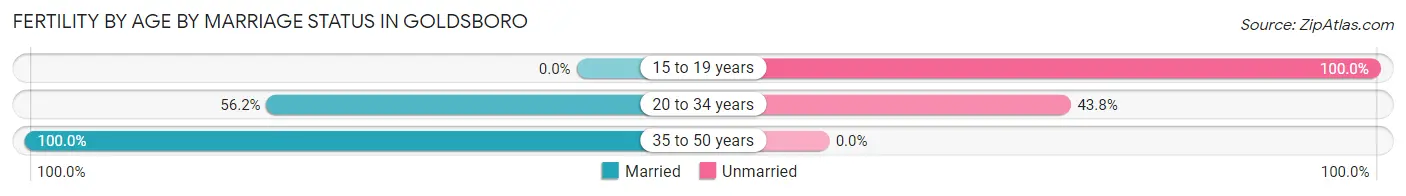
Fertility by Age by Marriage Status in Goldsboro
52.2% of women with births (542) in Goldsboro are married. The highest percentage of unmarried women with births falls into 15 to 19 years age bracket with 100.0% of them unmarried at the time of birth, while the lowest percentage of unmarried women with births belong to 35 to 50 years age bracket with 0.0% of them unmarried.
| Age Bracket | Married | Unmarried |
| 15 to 19 years | 0 (0.0%) | 57 (100.0%) |
| 20 to 34 years | 259 (56.2%) | 202 (43.8%) |
| 35 to 50 years | 24 (100.0%) | 0 (0.0%) |
| Total | 283 (52.2%) | 259 (47.8%) |
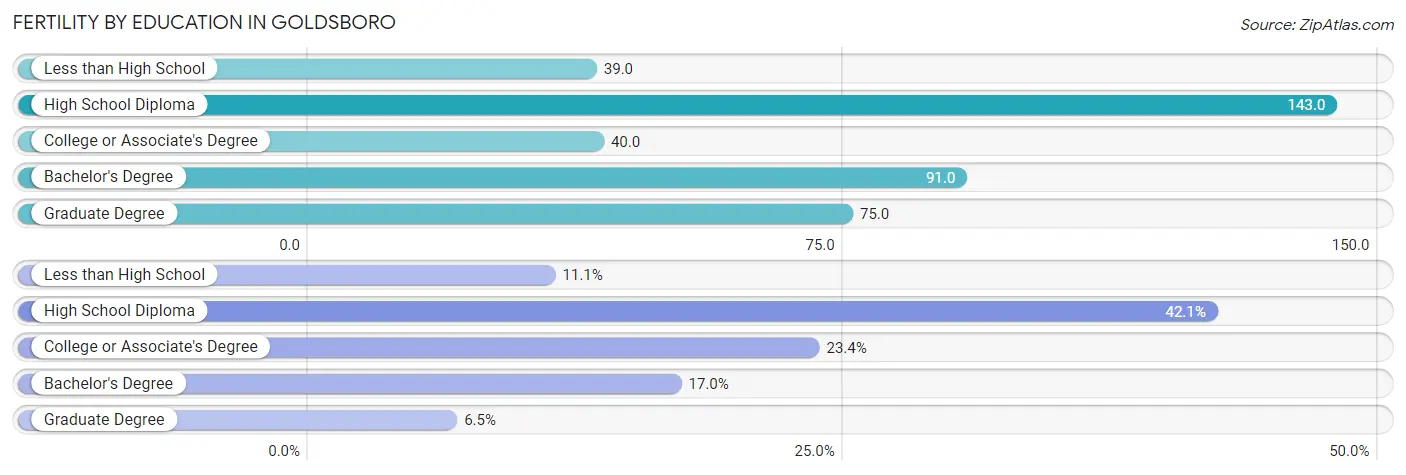
Fertility by Education in Goldsboro
Average fertility rate in Goldsboro is 70.0 births per 1,000 women. Women with the education attainment of high school diploma have the highest fertility rate of 143.0 births per 1,000 women, while women with the education attainment of less than high school have the lowest fertility at 39.0 births per 1,000 women. Women with the education attainment of high school diploma represent 42.1% of all women with births.
| Educational Attainment | Women with Births | Births / 1,000 Women |
| Less than High School | 60 (11.1%) | 39.0 |
| High School Diploma | 228 (42.1%) | 143.0 |
| College or Associate's Degree | 127 (23.4%) | 40.0 |
| Bachelor's Degree | 92 (17.0%) | 91.0 |
| Graduate Degree | 35 (6.5%) | 75.0 |
| Total | 542 (100.0%) | 70.0 |
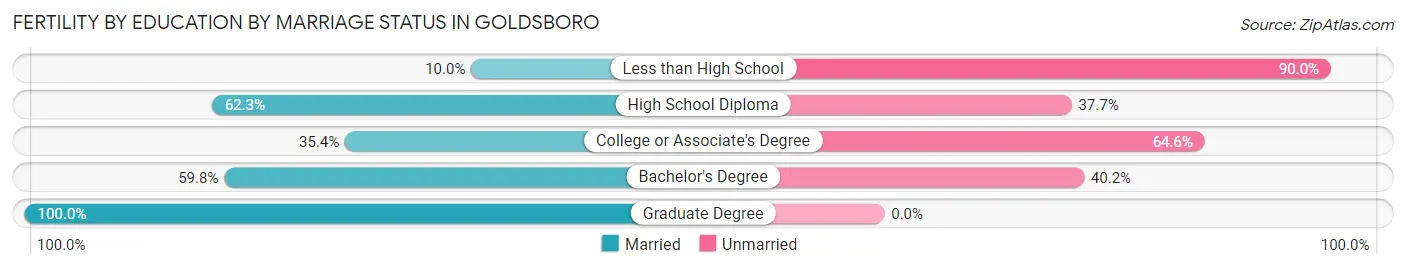
Fertility by Education by Marriage Status in Goldsboro
47.8% of women with births in Goldsboro are unmarried. Women with the educational attainment of graduate degree are most likely to be married with 100.0% of them married at childbirth, while women with the educational attainment of less than high school are least likely to be married with 90.0% of them unmarried at childbirth.
| Educational Attainment | Married | Unmarried |
| Less than High School | 6 (10.0%) | 54 (90.0%) |
| High School Diploma | 142 (62.3%) | 86 (37.7%) |
| College or Associate's Degree | 45 (35.4%) | 82 (64.6%) |
| Bachelor's Degree | 55 (59.8%) | 37 (40.2%) |
| Graduate Degree | 35 (100.0%) | 0 (0.0%) |
| Total | 283 (52.2%) | 259 (47.8%) |
Income in Goldsboro
Income Overview in Goldsboro
Per Capita Income in Goldsboro is $29,622, while median incomes of families and households are $56,897 and $44,196 respectively.
| Characteristic | Number | Measure |
| Per Capita Income | 33,566 | $29,622 |
| Median Family Income | 8,180 | $56,897 |
| Mean Family Income | 8,180 | $84,663 |
| Median Household Income | 14,911 | $44,196 |
| Mean Household Income | 14,911 | $64,659 |
| Income Deficit | 8,180 | $11,292 |
| Wage / Income Gap (%) | 33,566 | 31.17% |
| Wage / Income Gap ($) | 33,566 | 68.83¢ per $1 |
| Gini / Inequality Index | 33,566 | 0.50 |
Earnings by Sex in Goldsboro
Average Earnings in Goldsboro are $28,726, $34,234 for men and $23,562 for women, a difference of 31.2%.
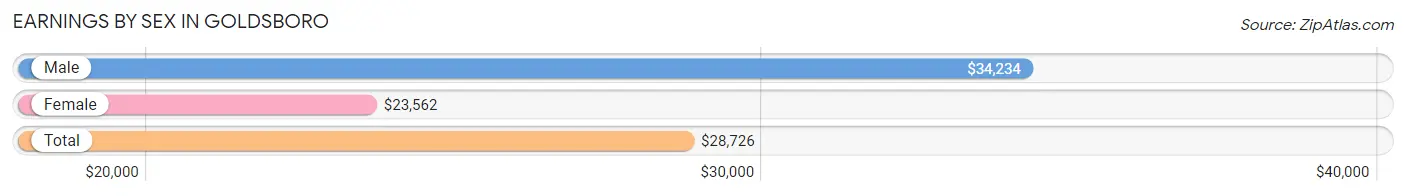
| Sex | Number | Average Earnings |
| Male | 8,343 (50.9%) | $34,234 |
| Female | 8,059 (49.1%) | $23,562 |
| Total | 16,402 (100.0%) | $28,726 |
Earnings by Sex by Income Bracket in Goldsboro
The most common earnings brackets in Goldsboro are $25,000 to $29,999 for men (876 | 10.5%) and $5,000 to $7,499 for women (762 | 9.5%).
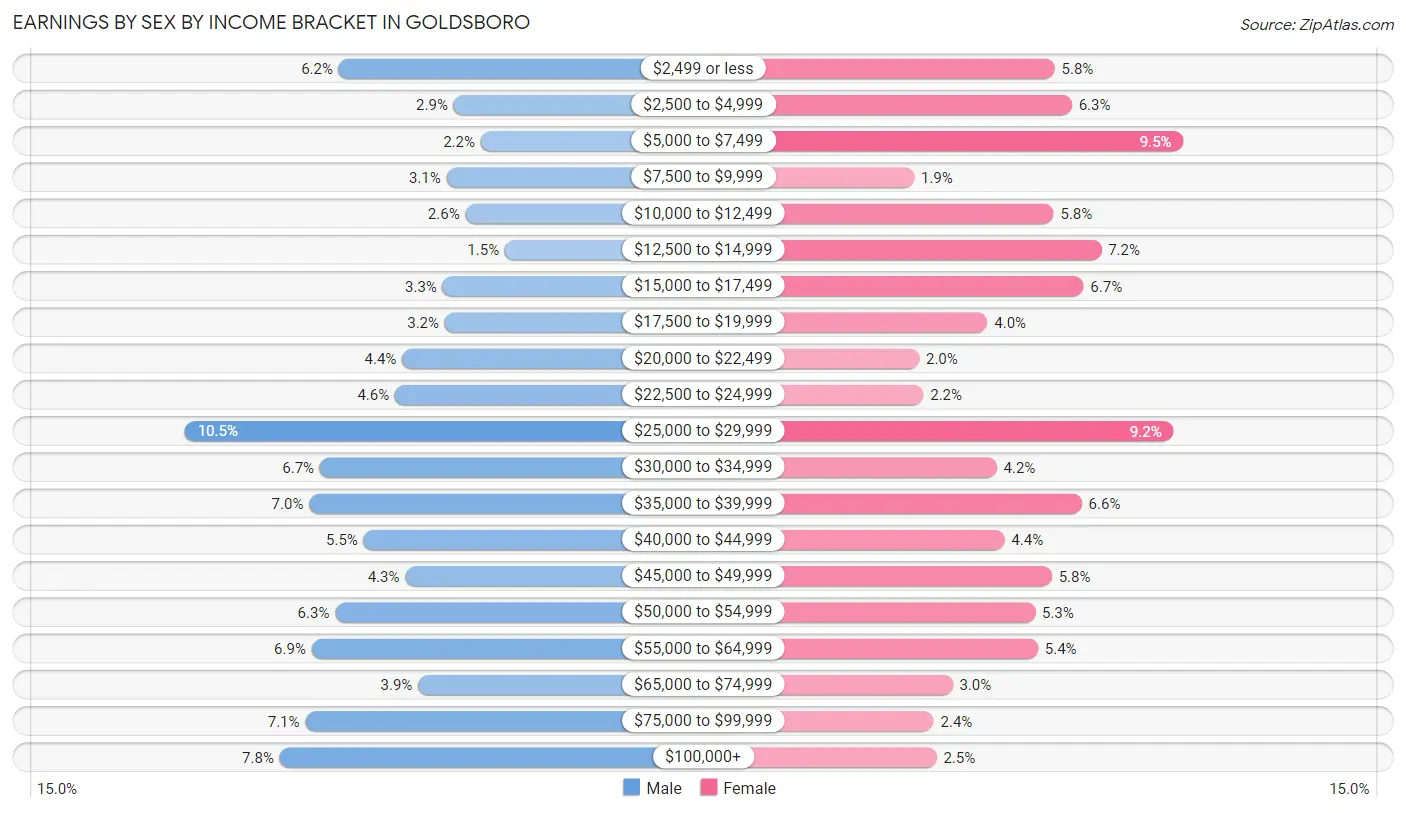
| Income | Male | Female |
| $2,499 or less | 515 (6.2%) | 471 (5.8%) |
| $2,500 to $4,999 | 245 (2.9%) | 509 (6.3%) |
| $5,000 to $7,499 | 182 (2.2%) | 762 (9.5%) |
| $7,500 to $9,999 | 262 (3.1%) | 152 (1.9%) |
| $10,000 to $12,499 | 218 (2.6%) | 468 (5.8%) |
| $12,500 to $14,999 | 125 (1.5%) | 576 (7.1%) |
| $15,000 to $17,499 | 271 (3.3%) | 536 (6.7%) |
| $17,500 to $19,999 | 266 (3.2%) | 318 (4.0%) |
| $20,000 to $22,499 | 366 (4.4%) | 164 (2.0%) |
| $22,500 to $24,999 | 383 (4.6%) | 173 (2.1%) |
| $25,000 to $29,999 | 876 (10.5%) | 740 (9.2%) |
| $30,000 to $34,999 | 559 (6.7%) | 339 (4.2%) |
| $35,000 to $39,999 | 584 (7.0%) | 532 (6.6%) |
| $40,000 to $44,999 | 456 (5.5%) | 357 (4.4%) |
| $45,000 to $49,999 | 359 (4.3%) | 464 (5.8%) |
| $50,000 to $54,999 | 523 (6.3%) | 426 (5.3%) |
| $55,000 to $64,999 | 578 (6.9%) | 433 (5.4%) |
| $65,000 to $74,999 | 329 (3.9%) | 239 (3.0%) |
| $75,000 to $99,999 | 593 (7.1%) | 197 (2.4%) |
| $100,000+ | 653 (7.8%) | 203 (2.5%) |
| Total | 8,343 (100.0%) | 8,059 (100.0%) |
Earnings by Sex by Educational Attainment in Goldsboro
Average earnings in Goldsboro are $40,110 for men and $27,894 for women, a difference of 30.5%. Men with an educational attainment of graduate degree enjoy the highest average annual earnings of $91,092, while those with less than high school education earn the least with $19,246. Women with an educational attainment of graduate degree earn the most with the average annual earnings of $49,676, while those with less than high school education have the smallest earnings of $15,275.
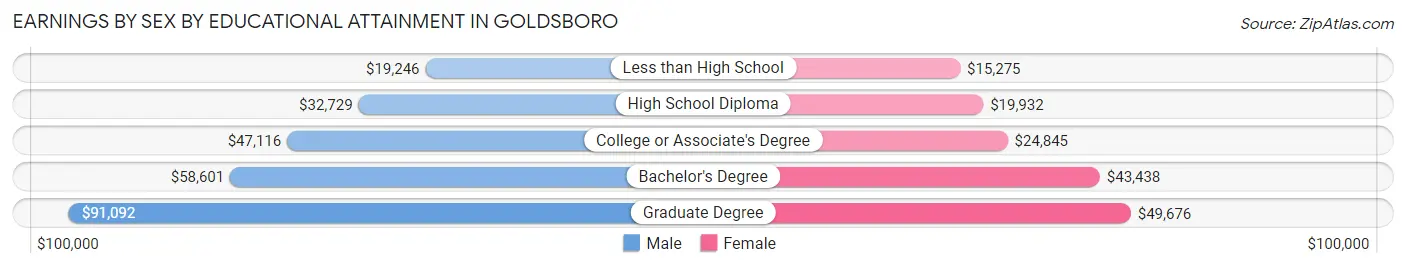
| Educational Attainment | Male Income | Female Income |
| Less than High School | $19,246 | $15,275 |
| High School Diploma | $32,729 | $19,932 |
| College or Associate's Degree | $47,116 | $24,845 |
| Bachelor's Degree | $58,601 | $43,438 |
| Graduate Degree | $91,092 | $49,676 |
| Total | $40,110 | $27,894 |
Family Income in Goldsboro
Family Income Brackets in Goldsboro
According to the Goldsboro family income data, there are 1,423 families falling into the $50,000 to $74,999 income range, which is the most common income bracket and makes up 17.4% of all families. Conversely, the $10,000 to $14,999 income bracket is the least frequent group with only 319 families (3.9%) belonging to this category.
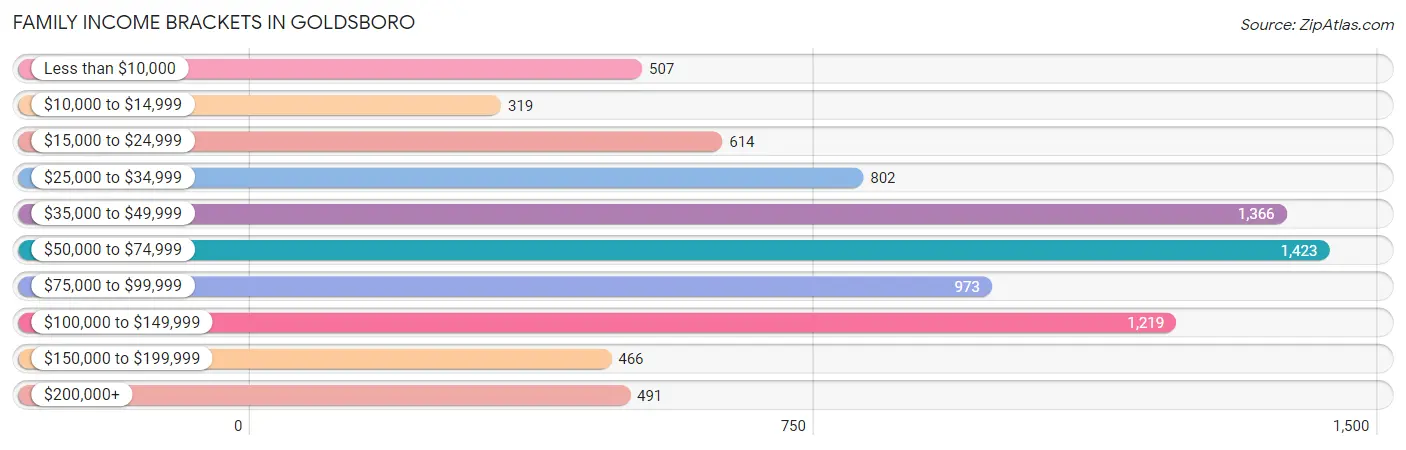
| Income Bracket | # Families | % Families |
| Less than $10,000 | 507 | 6.2% |
| $10,000 to $14,999 | 319 | 3.9% |
| $15,000 to $24,999 | 614 | 7.5% |
| $25,000 to $34,999 | 802 | 9.8% |
| $35,000 to $49,999 | 1,366 | 16.7% |
| $50,000 to $74,999 | 1,423 | 17.4% |
| $75,000 to $99,999 | 973 | 11.9% |
| $100,000 to $149,999 | 1,219 | 14.9% |
| $150,000 to $199,999 | 466 | 5.7% |
| $200,000+ | 491 | 6.0% |
Family Income by Famaliy Size in Goldsboro
5-person families (695 | 8.5%) account for the highest median family income in Goldsboro with $92,983 per family, while 2-person families (4,212 | 51.5%) have the highest median income of $26,990 per family member.
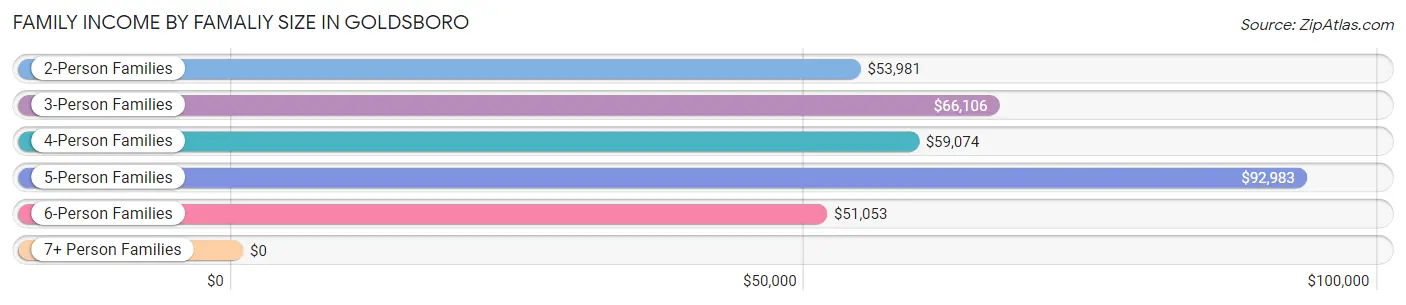
| Income Bracket | # Families | Median Income |
| 2-Person Families | 4,212 (51.5%) | $53,981 |
| 3-Person Families | 1,887 (23.1%) | $66,106 |
| 4-Person Families | 1,122 (13.7%) | $59,074 |
| 5-Person Families | 695 (8.5%) | $92,983 |
| 6-Person Families | 198 (2.4%) | $51,053 |
| 7+ Person Families | 66 (0.8%) | $0 |
| Total | 8,180 (100.0%) | $56,897 |
Family Income by Number of Earners in Goldsboro
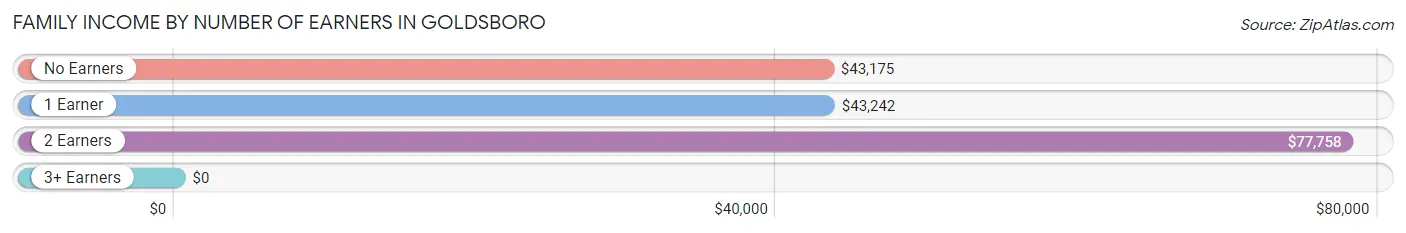
| Number of Earners | # Families | Median Income |
| No Earners | 1,156 (14.1%) | $43,175 |
| 1 Earner | 3,831 (46.8%) | $43,242 |
| 2 Earners | 2,698 (33.0%) | $77,758 |
| 3+ Earners | 495 (6.0%) | $0 |
| Total | 8,180 (100.0%) | $56,897 |
Household Income in Goldsboro
Household Income Brackets in Goldsboro
With 2,684 households falling in the category, the $50,000 to $74,999 income range is the most frequent in Goldsboro, accounting for 18.0% of all households. In contrast, only 522 households (3.5%) fall into the $200,000+ income bracket, making it the least populous group.
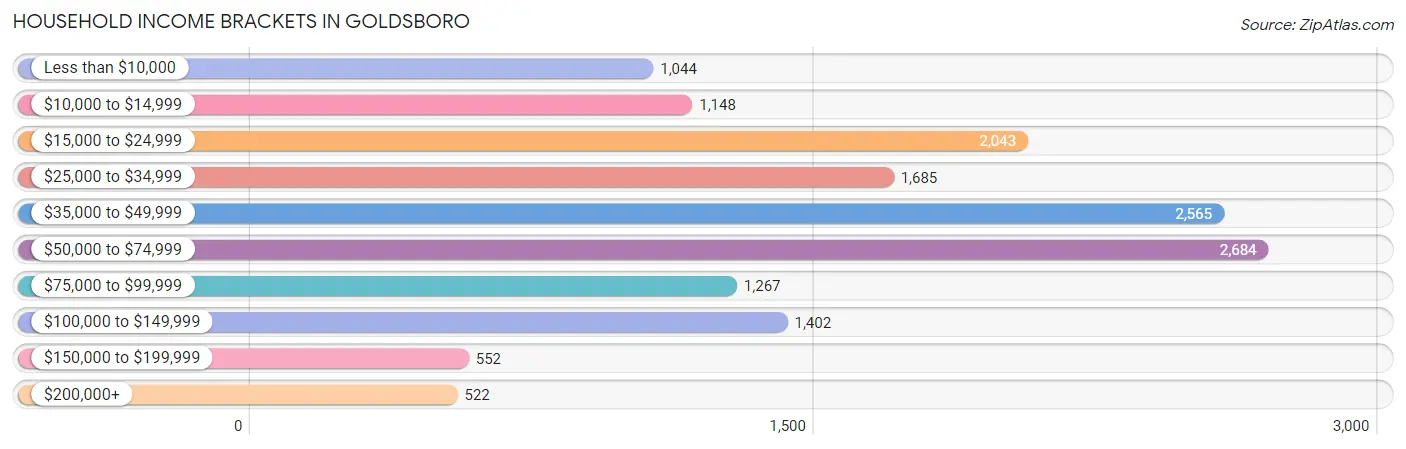
| Income Bracket | # Households | % Households |
| Less than $10,000 | 1,044 | 7.0% |
| $10,000 to $14,999 | 1,148 | 7.7% |
| $15,000 to $24,999 | 2,043 | 13.7% |
| $25,000 to $34,999 | 1,685 | 11.3% |
| $35,000 to $49,999 | 2,565 | 17.2% |
| $50,000 to $74,999 | 2,684 | 18.0% |
| $75,000 to $99,999 | 1,267 | 8.5% |
| $100,000 to $149,999 | 1,402 | 9.4% |
| $150,000 to $199,999 | 552 | 3.7% |
| $200,000+ | 522 | 3.5% |
Household Income by Householder Age in Goldsboro
The median household income in Goldsboro is $44,196, with the highest median household income of $47,917 found in the 45 to 64 years age bracket for the primary householder. A total of 4,448 households (29.8%) fall into this category. Meanwhile, the 15 to 24 years age bracket for the primary householder has the lowest median household income of $37,284, with 1,055 households (7.1%) in this group.
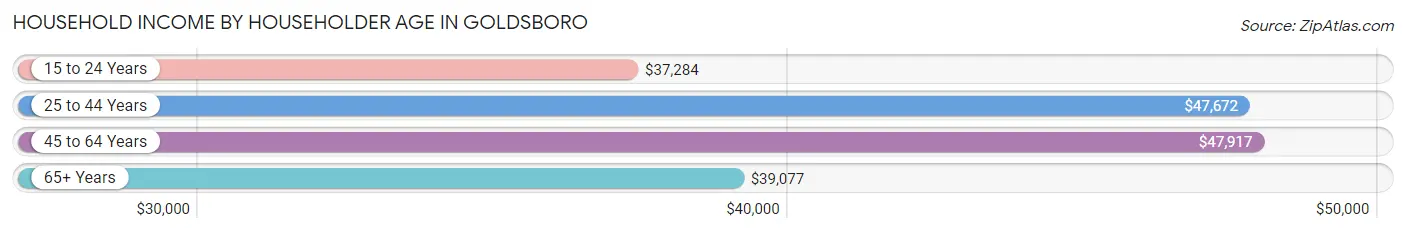
| Income Bracket | # Households | Median Income |
| 15 to 24 Years | 1,055 (7.1%) | $37,284 |
| 25 to 44 Years | 4,950 (33.2%) | $47,672 |
| 45 to 64 Years | 4,448 (29.8%) | $47,917 |
| 65+ Years | 4,458 (29.9%) | $39,077 |
| Total | 14,911 (100.0%) | $44,196 |
Poverty in Goldsboro
Income Below Poverty by Sex and Age in Goldsboro
With 18.3% poverty level for males and 23.3% for females among the residents of Goldsboro, 15 year old males and 5 year old females are the most vulnerable to poverty, with 85 males (64.9%) and 87 females (54.0%) in their respective age groups living below the poverty level.
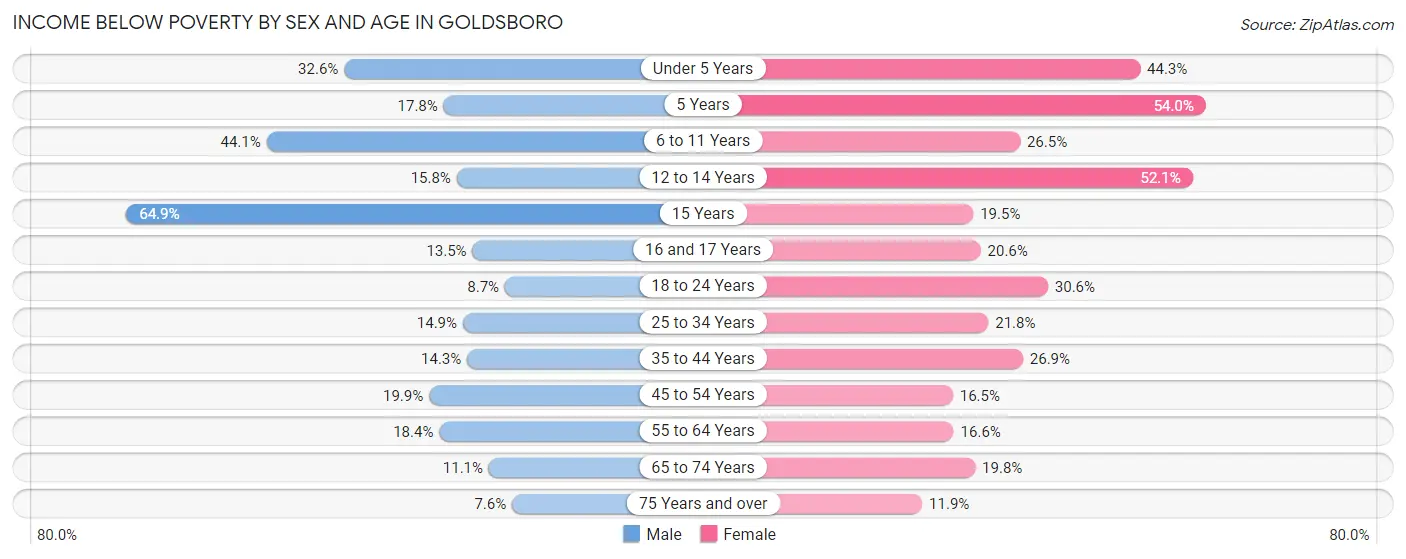
| Age Bracket | Male | Female |
| Under 5 Years | 401 (32.6%) | 396 (44.3%) |
| 5 Years | 56 (17.8%) | 87 (54.0%) |
| 6 to 11 Years | 513 (44.1%) | 286 (26.5%) |
| 12 to 14 Years | 86 (15.8%) | 276 (52.1%) |
| 15 Years | 85 (64.9%) | 65 (19.5%) |
| 16 and 17 Years | 49 (13.5%) | 81 (20.6%) |
| 18 to 24 Years | 153 (8.7%) | 466 (30.6%) |
| 25 to 34 Years | 329 (14.9%) | 521 (21.7%) |
| 35 to 44 Years | 269 (14.3%) | 512 (26.9%) |
| 45 to 54 Years | 269 (19.9%) | 310 (16.5%) |
| 55 to 64 Years | 358 (18.4%) | 382 (16.6%) |
| 65 to 74 Years | 155 (11.1%) | 361 (19.8%) |
| 75 Years and over | 74 (7.6%) | 207 (11.9%) |
| Total | 2,797 (18.3%) | 3,950 (23.3%) |
Income Above Poverty by Sex and Age in Goldsboro
According to the poverty statistics in Goldsboro, males aged 75 years and over and females aged 75 years and over are the age groups that are most secure financially, with 92.4% of males and 88.1% of females in these age groups living above the poverty line.
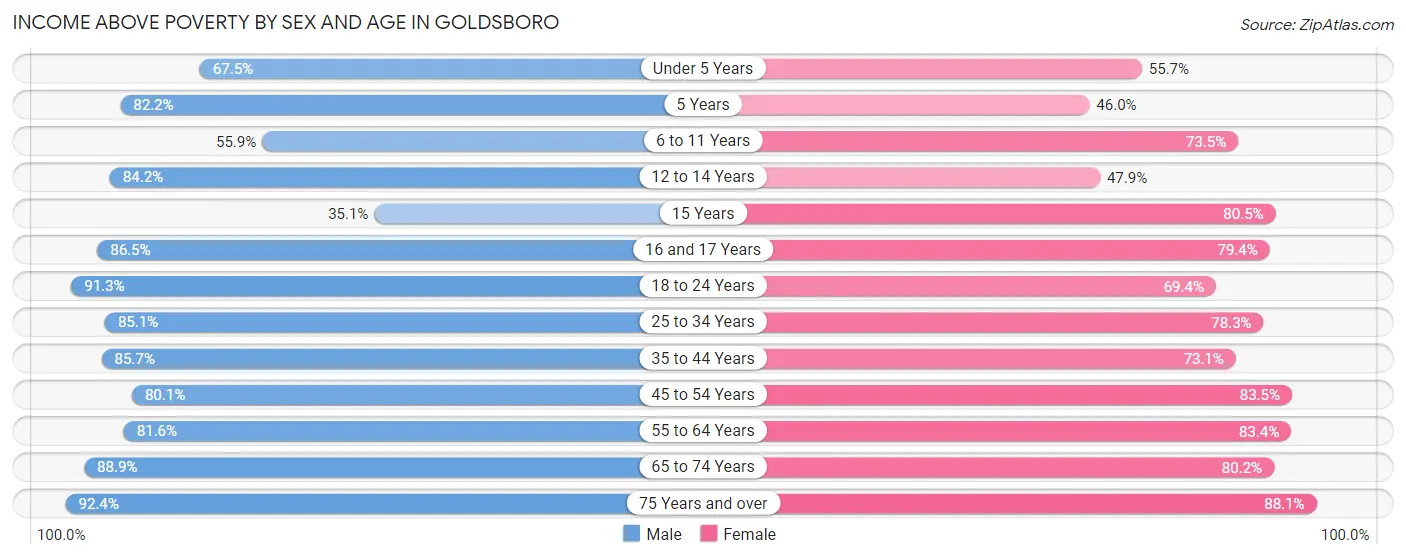
| Age Bracket | Male | Female |
| Under 5 Years | 831 (67.4%) | 498 (55.7%) |
| 5 Years | 259 (82.2%) | 74 (46.0%) |
| 6 to 11 Years | 651 (55.9%) | 795 (73.5%) |
| 12 to 14 Years | 457 (84.2%) | 254 (47.9%) |
| 15 Years | 46 (35.1%) | 268 (80.5%) |
| 16 and 17 Years | 314 (86.5%) | 312 (79.4%) |
| 18 to 24 Years | 1,611 (91.3%) | 1,057 (69.4%) |
| 25 to 34 Years | 1,876 (85.1%) | 1,874 (78.2%) |
| 35 to 44 Years | 1,613 (85.7%) | 1,392 (73.1%) |
| 45 to 54 Years | 1,080 (80.1%) | 1,571 (83.5%) |
| 55 to 64 Years | 1,584 (81.6%) | 1,918 (83.4%) |
| 65 to 74 Years | 1,247 (88.9%) | 1,462 (80.2%) |
| 75 Years and over | 897 (92.4%) | 1,528 (88.1%) |
| Total | 12,466 (81.7%) | 13,003 (76.7%) |
Income Below Poverty Among Married-Couple Families in Goldsboro
The poverty statistics for married-couple families in Goldsboro show that 4.2% or 194 of the total 4,650 families live below the poverty line. Families with 5 or more children have the highest poverty rate of 100.0%, comprising of 32 families. On the other hand, families with 3 or 4 children have the lowest poverty rate of 2.2%, which includes 8 families.
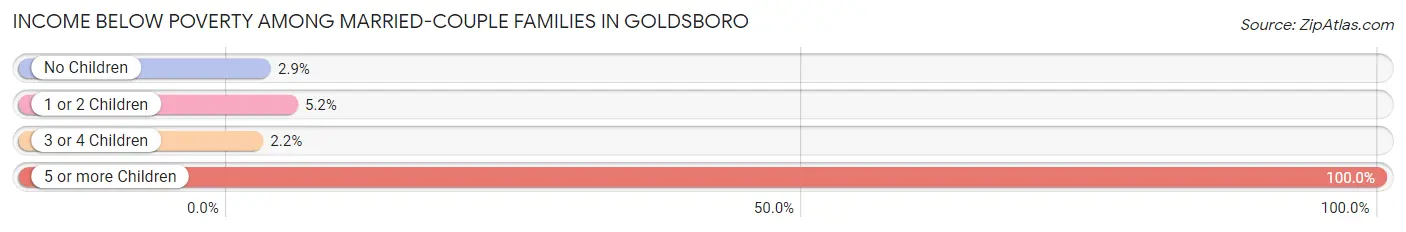
| Children | Above Poverty | Below Poverty |
| No Children | 2,830 (97.1%) | 84 (2.9%) |
| 1 or 2 Children | 1,272 (94.8%) | 70 (5.2%) |
| 3 or 4 Children | 354 (97.8%) | 8 (2.2%) |
| 5 or more Children | 0 (0.0%) | 32 (100.0%) |
| Total | 4,456 (95.8%) | 194 (4.2%) |
Income Below Poverty Among Single-Parent Households in Goldsboro
According to the poverty data in Goldsboro, 16.8% or 80 single-father households and 34.1% or 1,041 single-mother households are living below the poverty line. Among single-father households, those with 5 or more children have the highest poverty rate, with 19 households (100.0%) experiencing poverty. Likewise, among single-mother households, those with 3 or 4 children have the highest poverty rate, with 227 households (61.5%) falling below the poverty line.
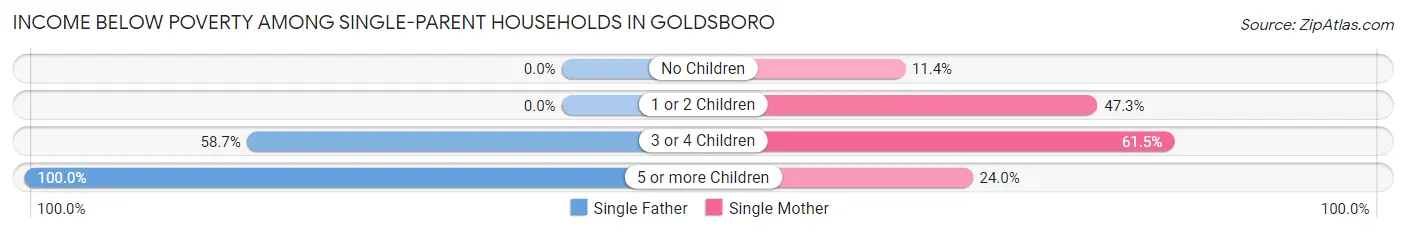
| Children | Single Father | Single Mother |
| No Children | 0 (0.0%) | 141 (11.4%) |
| 1 or 2 Children | 0 (0.0%) | 661 (47.2%) |
| 3 or 4 Children | 61 (58.7%) | 227 (61.5%) |
| 5 or more Children | 19 (100.0%) | 12 (24.0%) |
| Total | 80 (16.8%) | 1,041 (34.1%) |
Income Below Poverty Among Married-Couple vs Single-Parent Households in Goldsboro
The poverty data for Goldsboro shows that 194 of the married-couple family households (4.2%) and 1,121 of the single-parent households (31.8%) are living below the poverty level. Within the married-couple family households, those with 5 or more children have the highest poverty rate, with 32 households (100.0%) falling below the poverty line. Among the single-parent households, those with 3 or 4 children have the highest poverty rate, with 288 household (60.9%) living below poverty.
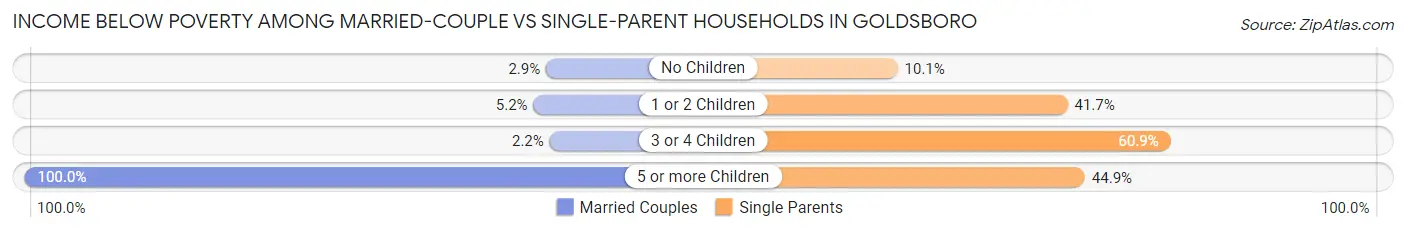
| Children | Married-Couple Families | Single-Parent Households |
| No Children | 84 (2.9%) | 141 (10.1%) |
| 1 or 2 Children | 70 (5.2%) | 661 (41.7%) |
| 3 or 4 Children | 8 (2.2%) | 288 (60.9%) |
| 5 or more Children | 32 (100.0%) | 31 (44.9%) |
| Total | 194 (4.2%) | 1,121 (31.8%) |
Employment Characteristics in Goldsboro
Employment by Class of Employer in Goldsboro
Among the 14,612 employed individuals in Goldsboro, private company employees (7,926 | 54.2%), federal government employees (3,236 | 22.2%), and state government employees (1,248 | 8.5%) make up the most common classes of employment.
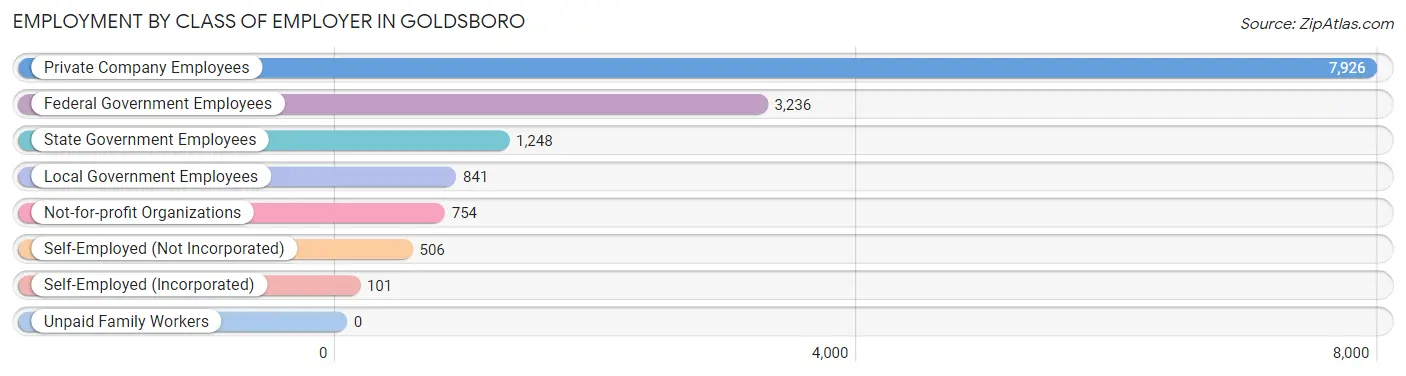
| Employer Class | # Employees | % Employees |
| Private Company Employees | 7,926 | 54.2% |
| Self-Employed (Incorporated) | 101 | 0.7% |
| Self-Employed (Not Incorporated) | 506 | 3.5% |
| Not-for-profit Organizations | 754 | 5.2% |
| Local Government Employees | 841 | 5.8% |
| State Government Employees | 1,248 | 8.5% |
| Federal Government Employees | 3,236 | 22.2% |
| Unpaid Family Workers | 0 | 0.0% |
| Total | 14,612 | 100.0% |
Employment Status by Age in Goldsboro
According to the labor force statistics for Goldsboro, out of the total population over 16 years of age (27,067), 58.8% or 15,915 individuals are in the labor force, with 7.5% or 1,194 of them unemployed. The age group with the highest labor force participation rate is 20 to 24 years, with 88.0% or 2,730 individuals in the labor force. Within the labor force, the 25 to 29 years age range has the highest percentage of unemployed individuals, with 17.9% or 373 of them being unemployed.
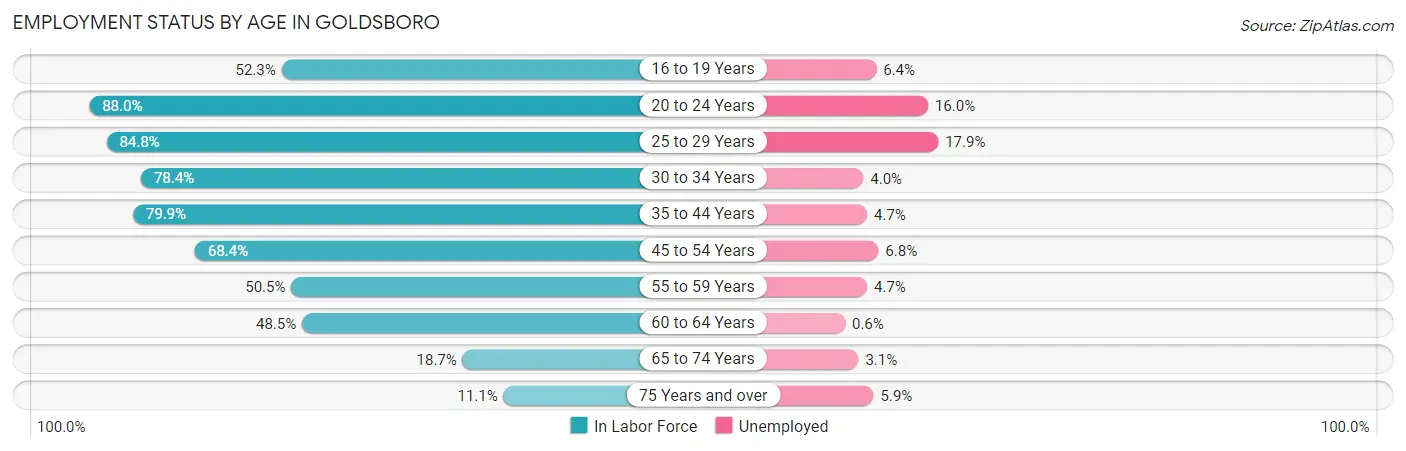
| Age Bracket | In Labor Force | Unemployed |
| 16 to 19 Years | 850 (52.3%) | 54 (6.4%) |
| 20 to 24 Years | 2,730 (88.0%) | 437 (16.0%) |
| 25 to 29 Years | 2,082 (84.8%) | 373 (17.9%) |
| 30 to 34 Years | 1,791 (78.4%) | 72 (4.0%) |
| 35 to 44 Years | 3,123 (79.9%) | 147 (4.7%) |
| 45 to 54 Years | 2,266 (68.4%) | 154 (6.8%) |
| 55 to 59 Years | 851 (50.5%) | 40 (4.7%) |
| 60 to 64 Years | 1,297 (48.5%) | 8 (0.6%) |
| 65 to 74 Years | 608 (18.7%) | 19 (3.1%) |
| 75 Years and over | 307 (11.1%) | 18 (5.9%) |
| Total | 15,915 (58.8%) | 1,194 (7.5%) |
Employment Status by Educational Attainment in Goldsboro
According to labor force statistics for Goldsboro, 69.9% of individuals (11,408) out of the total population between 25 and 64 years of age (16,321) are in the labor force, with 6.5% or 742 of them being unemployed. The group with the highest labor force participation rate are those with the educational attainment of bachelor's degree or higher, with 82.9% or 2,736 individuals in the labor force. Within the labor force, individuals with less than high school education have the highest percentage of unemployment, with 10.1% or 98 of them being unemployed.
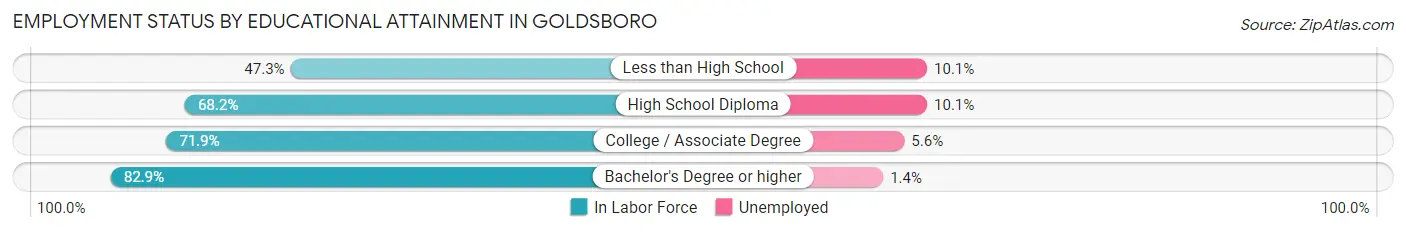
| Educational Attainment | In Labor Force | Unemployed |
| Less than High School | 972 (47.3%) | 207 (10.1%) |
| High School Diploma | 3,384 (68.2%) | 501 (10.1%) |
| College / Associate Degree | 4,318 (71.9%) | 336 (5.6%) |
| Bachelor's Degree or higher | 2,736 (82.9%) | 46 (1.4%) |
| Total | 11,408 (69.9%) | 1,061 (6.5%) |
Employment Occupations by Sex in Goldsboro
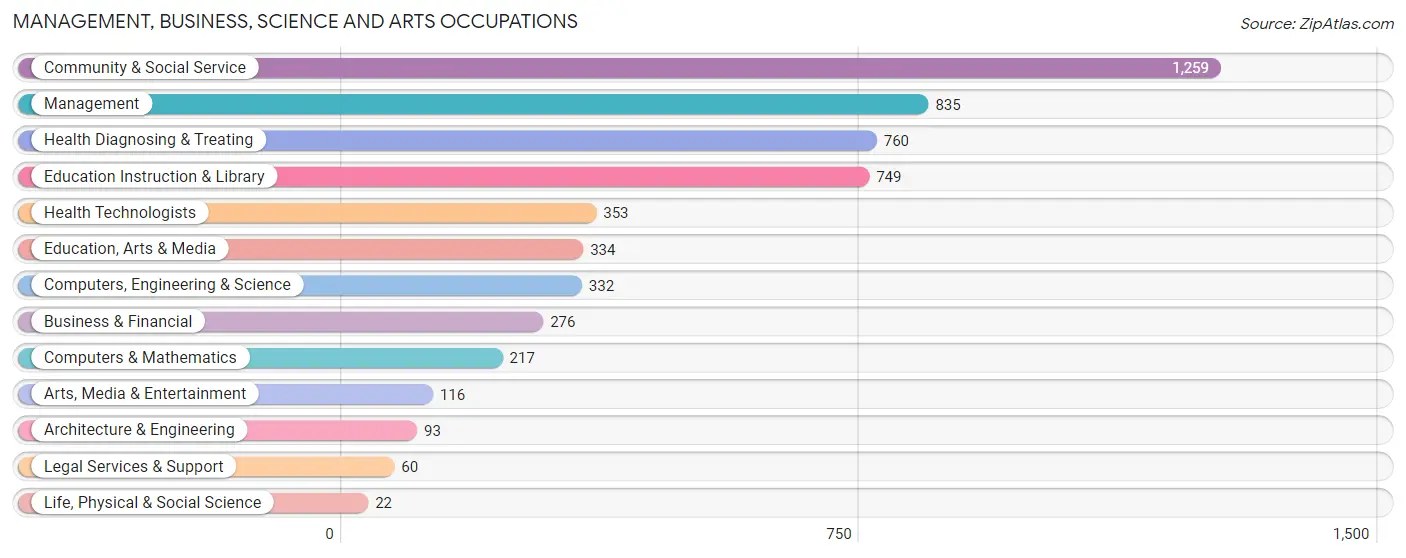
Management, Business, Science and Arts Occupations
The most common Management, Business, Science and Arts occupations in Goldsboro are Community & Social Service (1,259 | 10.1%), Management (835 | 6.7%), Health Diagnosing & Treating (760 | 6.1%), Education Instruction & Library (749 | 6.0%), and Health Technologists (353 | 2.8%).
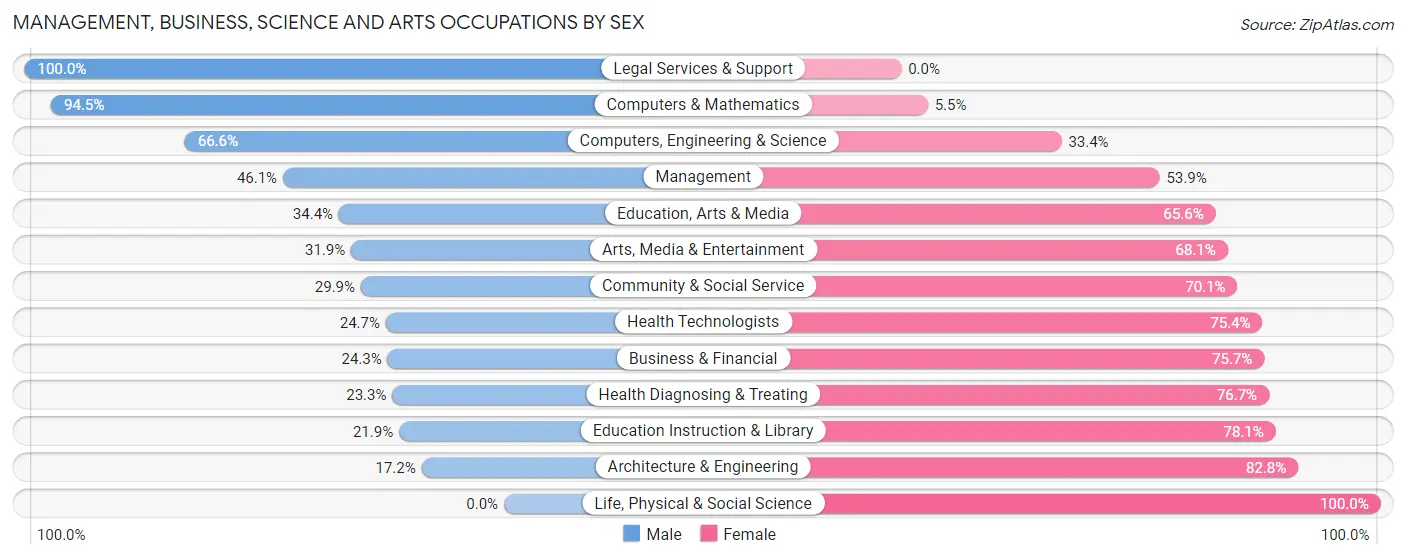
Management, Business, Science and Arts Occupations by Sex
Within the Management, Business, Science and Arts occupations in Goldsboro, the most male-oriented occupations are Legal Services & Support (100.0%), Computers & Mathematics (94.5%), and Computers, Engineering & Science (66.6%), while the most female-oriented occupations are Life, Physical & Social Science (100.0%), Architecture & Engineering (82.8%), and Education Instruction & Library (78.1%).
| Occupation | Male | Female |
| Management | 385 (46.1%) | 450 (53.9%) |
| Business & Financial | 67 (24.3%) | 209 (75.7%) |
| Computers, Engineering & Science | 221 (66.6%) | 111 (33.4%) |
| Computers & Mathematics | 205 (94.5%) | 12 (5.5%) |
| Architecture & Engineering | 16 (17.2%) | 77 (82.8%) |
| Life, Physical & Social Science | 0 (0.0%) | 22 (100.0%) |
| Community & Social Service | 376 (29.9%) | 883 (70.1%) |
| Education, Arts & Media | 115 (34.4%) | 219 (65.6%) |
| Legal Services & Support | 60 (100.0%) | 0 (0.0%) |
| Education Instruction & Library | 164 (21.9%) | 585 (78.1%) |
| Arts, Media & Entertainment | 37 (31.9%) | 79 (68.1%) |
| Health Diagnosing & Treating | 177 (23.3%) | 583 (76.7%) |
| Health Technologists | 87 (24.6%) | 266 (75.3%) |
| Total (Category) | 1,226 (35.4%) | 2,236 (64.6%) |
| Total (Overall) | 5,661 (45.3%) | 6,836 (54.7%) |
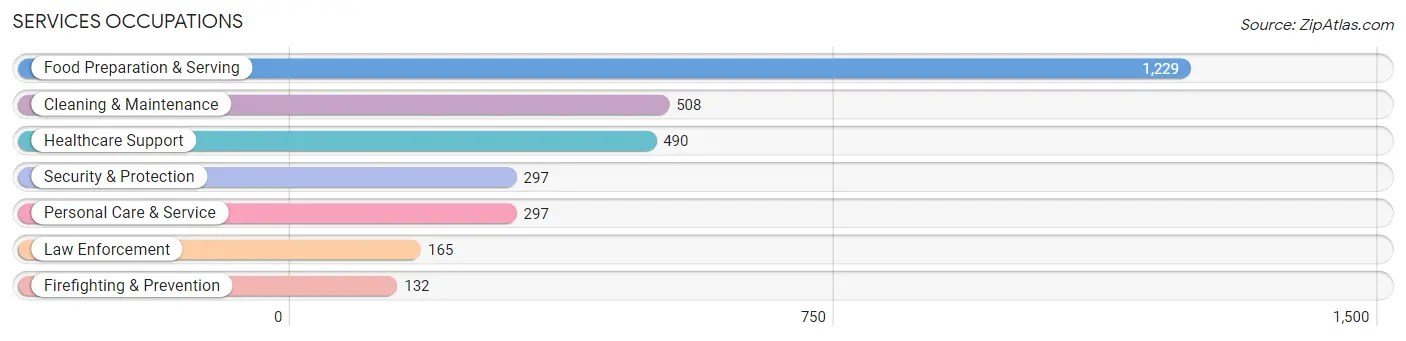
Services Occupations
The most common Services occupations in Goldsboro are Food Preparation & Serving (1,229 | 9.8%), Cleaning & Maintenance (508 | 4.1%), Healthcare Support (490 | 3.9%), Security & Protection (297 | 2.4%), and Personal Care & Service (297 | 2.4%).
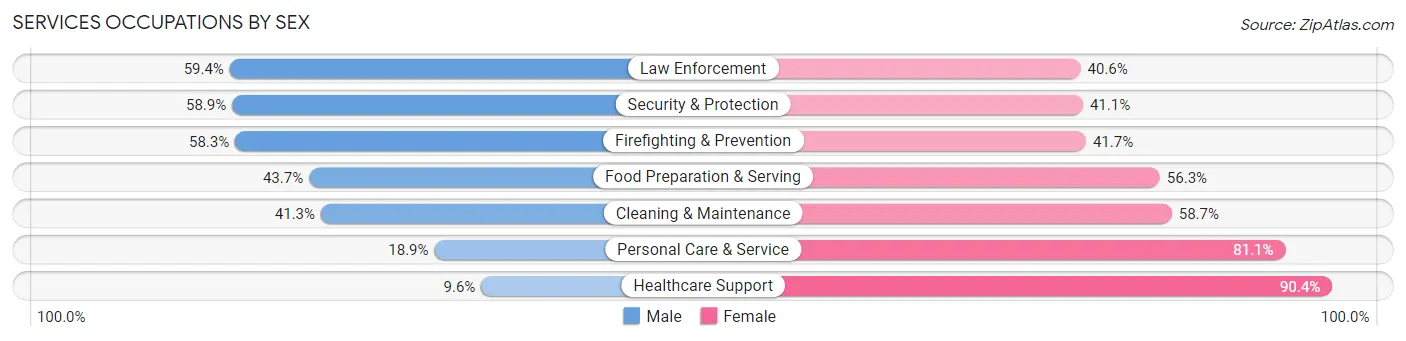
Services Occupations by Sex
Within the Services occupations in Goldsboro, the most male-oriented occupations are Law Enforcement (59.4%), Security & Protection (58.9%), and Firefighting & Prevention (58.3%), while the most female-oriented occupations are Healthcare Support (90.4%), Personal Care & Service (81.1%), and Cleaning & Maintenance (58.7%).
| Occupation | Male | Female |
| Healthcare Support | 47 (9.6%) | 443 (90.4%) |
| Security & Protection | 175 (58.9%) | 122 (41.1%) |
| Firefighting & Prevention | 77 (58.3%) | 55 (41.7%) |
| Law Enforcement | 98 (59.4%) | 67 (40.6%) |
| Food Preparation & Serving | 537 (43.7%) | 692 (56.3%) |
| Cleaning & Maintenance | 210 (41.3%) | 298 (58.7%) |
| Personal Care & Service | 56 (18.9%) | 241 (81.1%) |
| Total (Category) | 1,025 (36.3%) | 1,796 (63.7%) |
| Total (Overall) | 5,661 (45.3%) | 6,836 (54.7%) |
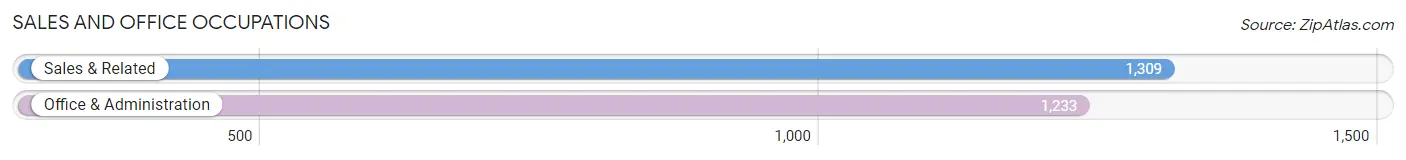
Sales and Office Occupations
The most common Sales and Office occupations in Goldsboro are Sales & Related (1,309 | 10.5%), and Office & Administration (1,233 | 9.9%).
Sales and Office Occupations by Sex
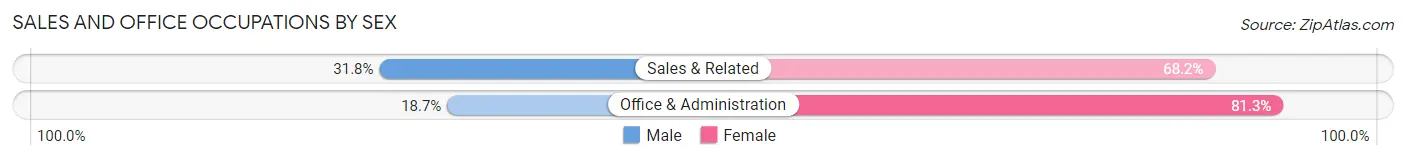
| Occupation | Male | Female |
| Sales & Related | 416 (31.8%) | 893 (68.2%) |
| Office & Administration | 231 (18.7%) | 1,002 (81.3%) |
| Total (Category) | 647 (25.5%) | 1,895 (74.6%) |
| Total (Overall) | 5,661 (45.3%) | 6,836 (54.7%) |
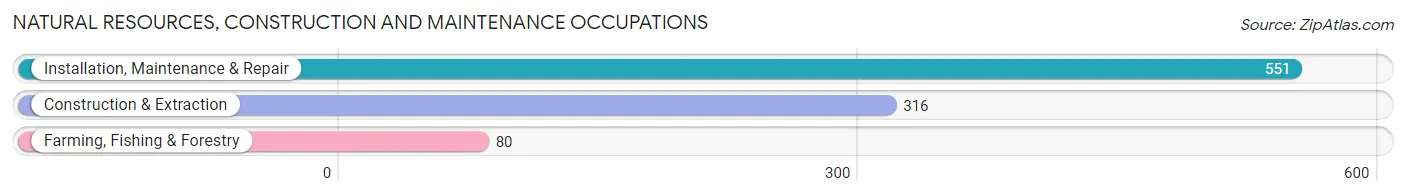
Natural Resources, Construction and Maintenance Occupations
The most common Natural Resources, Construction and Maintenance occupations in Goldsboro are Installation, Maintenance & Repair (551 | 4.4%), Construction & Extraction (316 | 2.5%), and Farming, Fishing & Forestry (80 | 0.6%).
Natural Resources, Construction and Maintenance Occupations by Sex
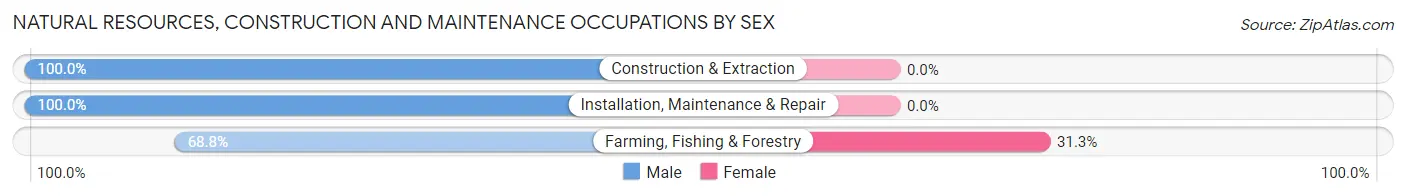
| Occupation | Male | Female |
| Farming, Fishing & Forestry | 55 (68.8%) | 25 (31.2%) |
| Construction & Extraction | 316 (100.0%) | 0 (0.0%) |
| Installation, Maintenance & Repair | 551 (100.0%) | 0 (0.0%) |
| Total (Category) | 922 (97.4%) | 25 (2.6%) |
| Total (Overall) | 5,661 (45.3%) | 6,836 (54.7%) |
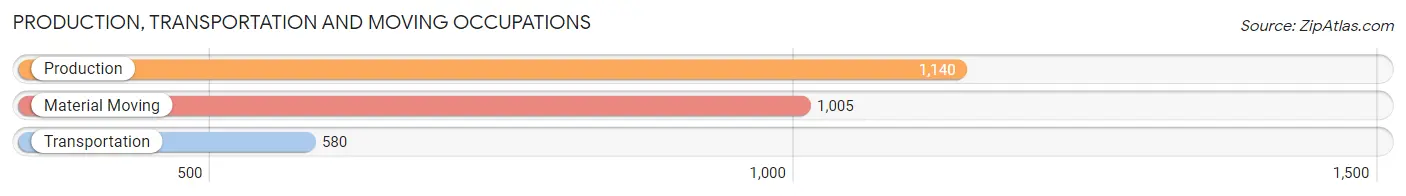
Production, Transportation and Moving Occupations
The most common Production, Transportation and Moving occupations in Goldsboro are Production (1,140 | 9.1%), Material Moving (1,005 | 8.0%), and Transportation (580 | 4.6%).
Production, Transportation and Moving Occupations by Sex
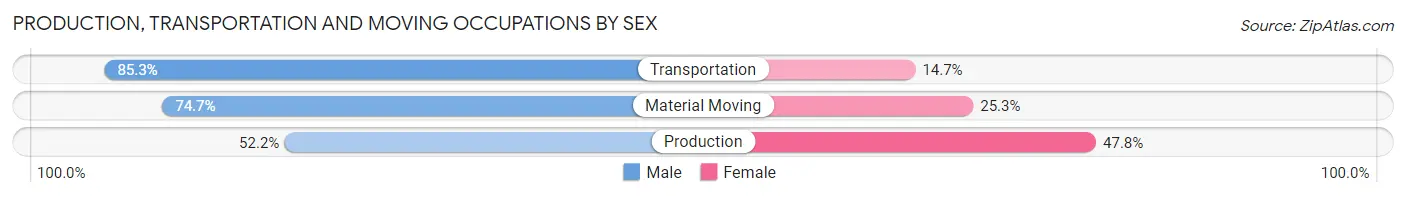
| Occupation | Male | Female |
| Production | 595 (52.2%) | 545 (47.8%) |
| Transportation | 495 (85.3%) | 85 (14.7%) |
| Material Moving | 751 (74.7%) | 254 (25.3%) |
| Total (Category) | 1,841 (67.6%) | 884 (32.4%) |
| Total (Overall) | 5,661 (45.3%) | 6,836 (54.7%) |
Employment Industries by Sex in Goldsboro
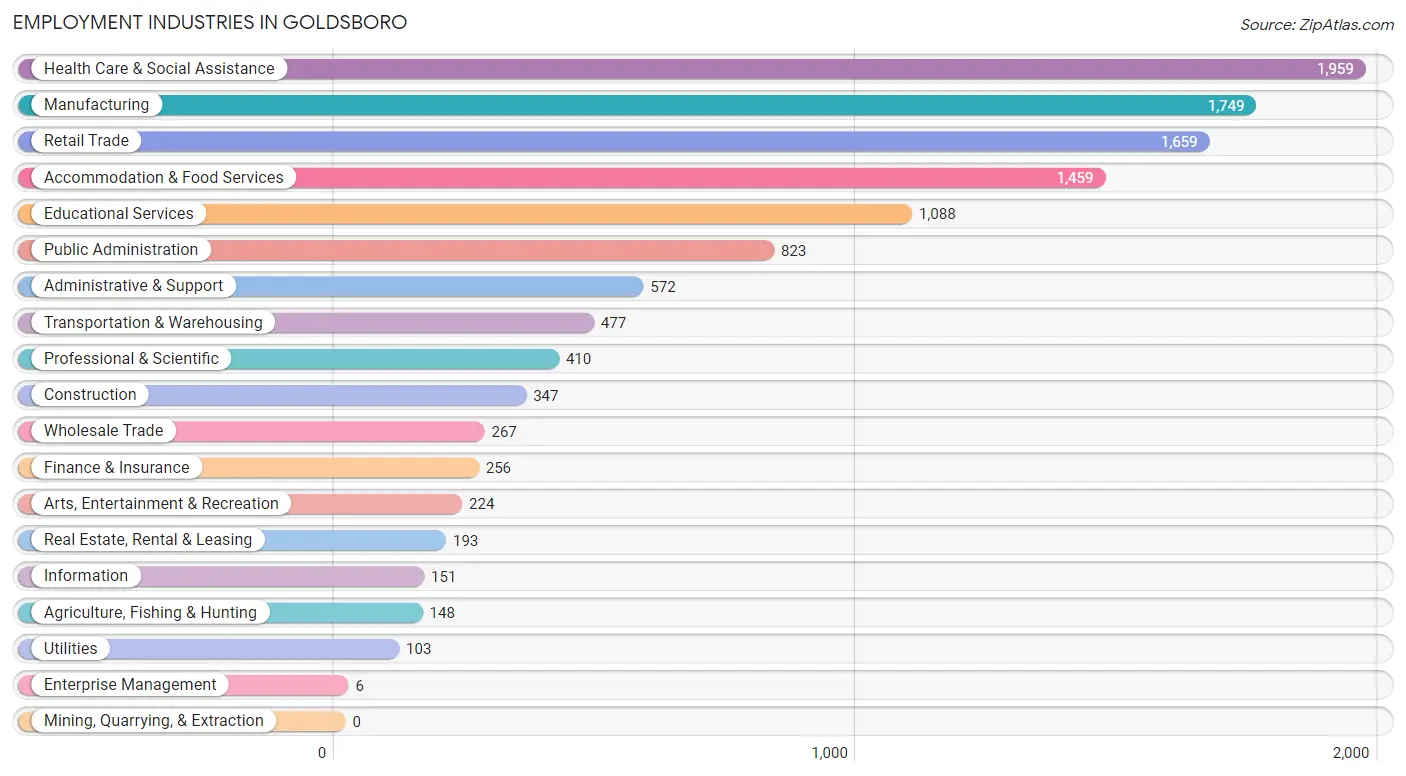
Employment Industries in Goldsboro
The major employment industries in Goldsboro include Health Care & Social Assistance (1,959 | 15.7%), Manufacturing (1,749 | 14.0%), Retail Trade (1,659 | 13.3%), Accommodation & Food Services (1,459 | 11.7%), and Educational Services (1,088 | 8.7%).
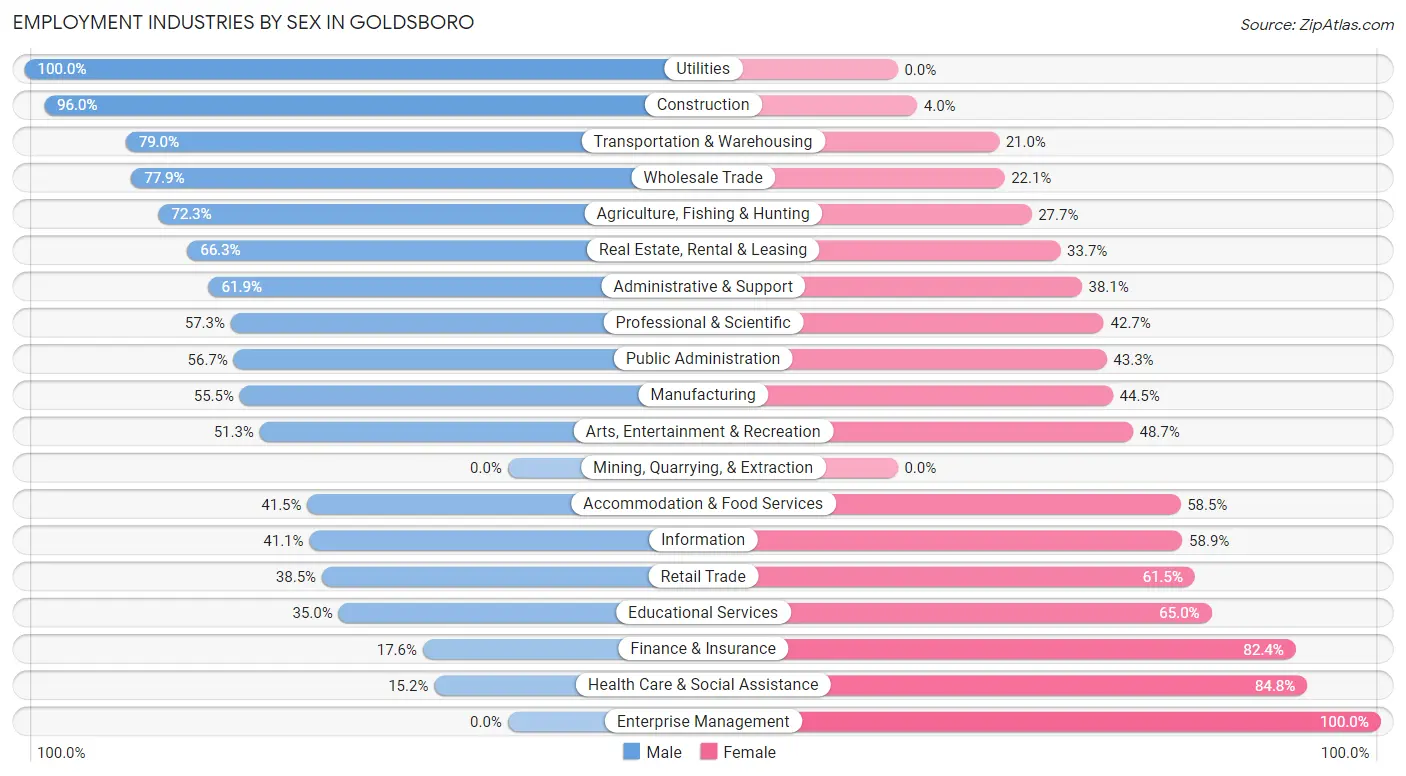
Employment Industries by Sex in Goldsboro
The Goldsboro industries that see more men than women are Utilities (100.0%), Construction (96.0%), and Transportation & Warehousing (79.0%), whereas the industries that tend to have a higher number of women are Enterprise Management (100.0%), Health Care & Social Assistance (84.8%), and Finance & Insurance (82.4%).
| Industry | Male | Female |
| Agriculture, Fishing & Hunting | 107 (72.3%) | 41 (27.7%) |
| Mining, Quarrying, & Extraction | 0 (0.0%) | 0 (0.0%) |
| Construction | 333 (96.0%) | 14 (4.0%) |
| Manufacturing | 970 (55.5%) | 779 (44.5%) |
| Wholesale Trade | 208 (77.9%) | 59 (22.1%) |
| Retail Trade | 638 (38.5%) | 1,021 (61.5%) |
| Transportation & Warehousing | 377 (79.0%) | 100 (21.0%) |
| Utilities | 103 (100.0%) | 0 (0.0%) |
| Information | 62 (41.1%) | 89 (58.9%) |
| Finance & Insurance | 45 (17.6%) | 211 (82.4%) |
| Real Estate, Rental & Leasing | 128 (66.3%) | 65 (33.7%) |
| Professional & Scientific | 235 (57.3%) | 175 (42.7%) |
| Enterprise Management | 0 (0.0%) | 6 (100.0%) |
| Administrative & Support | 354 (61.9%) | 218 (38.1%) |
| Educational Services | 381 (35.0%) | 707 (65.0%) |
| Health Care & Social Assistance | 298 (15.2%) | 1,661 (84.8%) |
| Arts, Entertainment & Recreation | 115 (51.3%) | 109 (48.7%) |
| Accommodation & Food Services | 605 (41.5%) | 854 (58.5%) |
| Public Administration | 467 (56.7%) | 356 (43.3%) |
| Total | 5,661 (45.3%) | 6,836 (54.7%) |
Education in Goldsboro
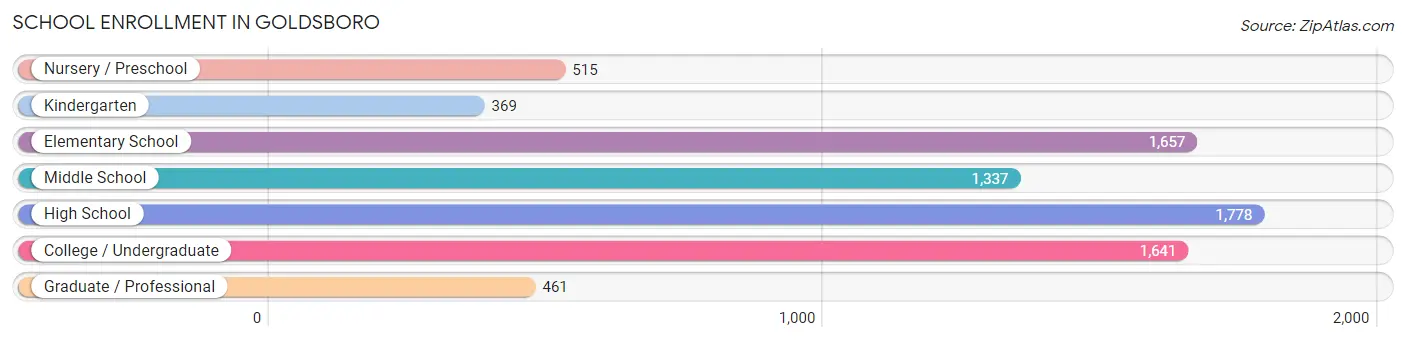
School Enrollment in Goldsboro
The most common levels of schooling among the 7,758 students in Goldsboro are high school (1,778 | 22.9%), elementary school (1,657 | 21.4%), and college / undergraduate (1,641 | 21.1%).
| School Level | # Students | % Students |
| Nursery / Preschool | 515 | 6.6% |
| Kindergarten | 369 | 4.8% |
| Elementary School | 1,657 | 21.4% |
| Middle School | 1,337 | 17.2% |
| High School | 1,778 | 22.9% |
| College / Undergraduate | 1,641 | 21.1% |
| Graduate / Professional | 461 | 5.9% |
| Total | 7,758 | 100.0% |
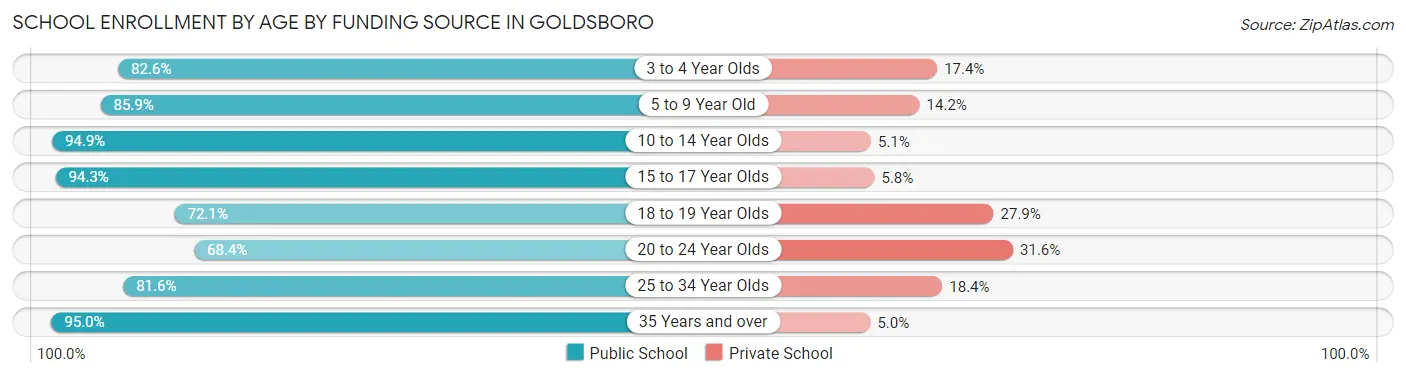
School Enrollment by Age by Funding Source in Goldsboro
Out of a total of 7,758 students who are enrolled in schools in Goldsboro, 1,032 (13.3%) attend a private institution, while the remaining 6,726 (86.7%) are enrolled in public schools. The age group of 20 to 24 year olds has the highest likelihood of being enrolled in private schools, with 232 (31.6% in the age bracket) enrolled. Conversely, the age group of 35 years and over has the lowest likelihood of being enrolled in a private school, with 419 (95.0% in the age bracket) attending a public institution.
| Age Bracket | Public School | Private School |
| 3 to 4 Year Olds | 256 (82.6%) | 54 (17.4%) |
| 5 to 9 Year Old | 1,766 (85.9%) | 291 (14.1%) |
| 10 to 14 Year Olds | 1,639 (94.9%) | 88 (5.1%) |
| 15 to 17 Year Olds | 1,164 (94.3%) | 71 (5.8%) |
| 18 to 19 Year Olds | 307 (72.1%) | 119 (27.9%) |
| 20 to 24 Year Olds | 503 (68.4%) | 232 (31.6%) |
| 25 to 34 Year Olds | 675 (81.6%) | 152 (18.4%) |
| 35 Years and over | 419 (95.0%) | 22 (5.0%) |
| Total | 6,726 (86.7%) | 1,032 (13.3%) |
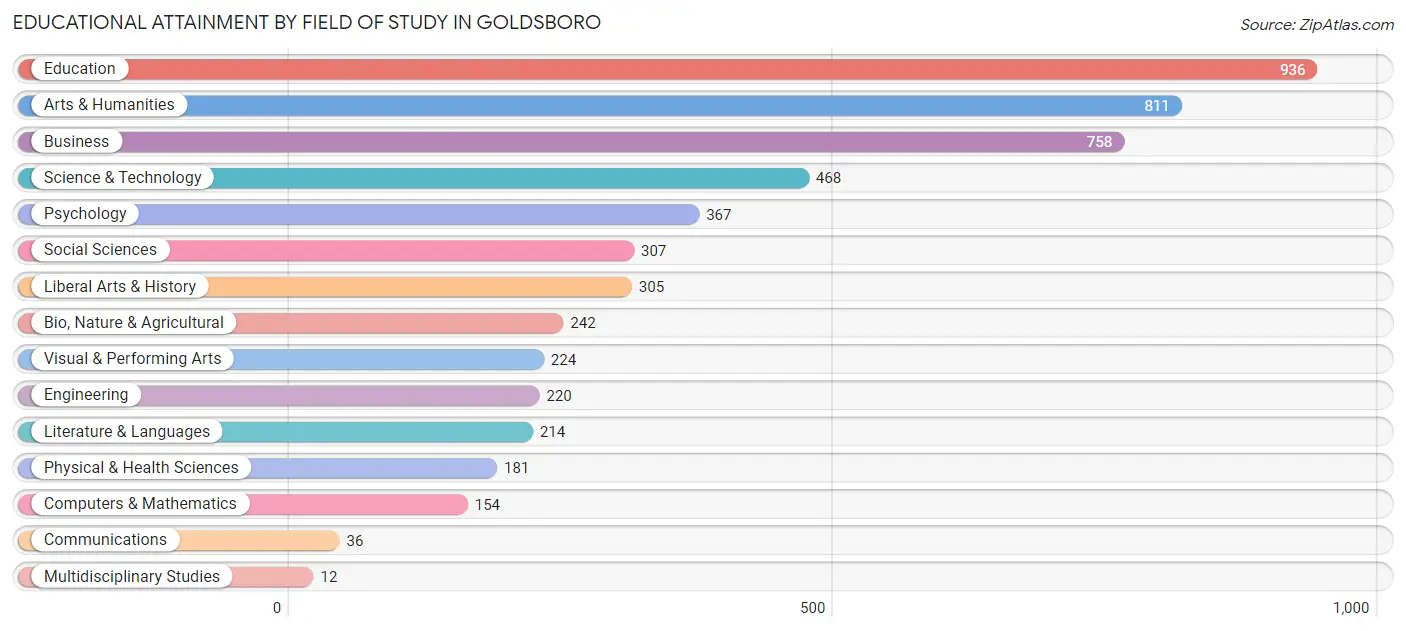
Educational Attainment by Field of Study in Goldsboro
Education (936 | 17.9%), arts & humanities (811 | 15.5%), business (758 | 14.5%), science & technology (468 | 8.9%), and psychology (367 | 7.0%) are the most common fields of study among 5,235 individuals in Goldsboro who have obtained a bachelor's degree or higher.
| Field of Study | # Graduates | % Graduates |
| Computers & Mathematics | 154 | 2.9% |
| Bio, Nature & Agricultural | 242 | 4.6% |
| Physical & Health Sciences | 181 | 3.5% |
| Psychology | 367 | 7.0% |
| Social Sciences | 307 | 5.9% |
| Engineering | 220 | 4.2% |
| Multidisciplinary Studies | 12 | 0.2% |
| Science & Technology | 468 | 8.9% |
| Business | 758 | 14.5% |
| Education | 936 | 17.9% |
| Literature & Languages | 214 | 4.1% |
| Liberal Arts & History | 305 | 5.8% |
| Visual & Performing Arts | 224 | 4.3% |
| Communications | 36 | 0.7% |
| Arts & Humanities | 811 | 15.5% |
| Total | 5,235 | 100.0% |
Transportation & Commute in Goldsboro
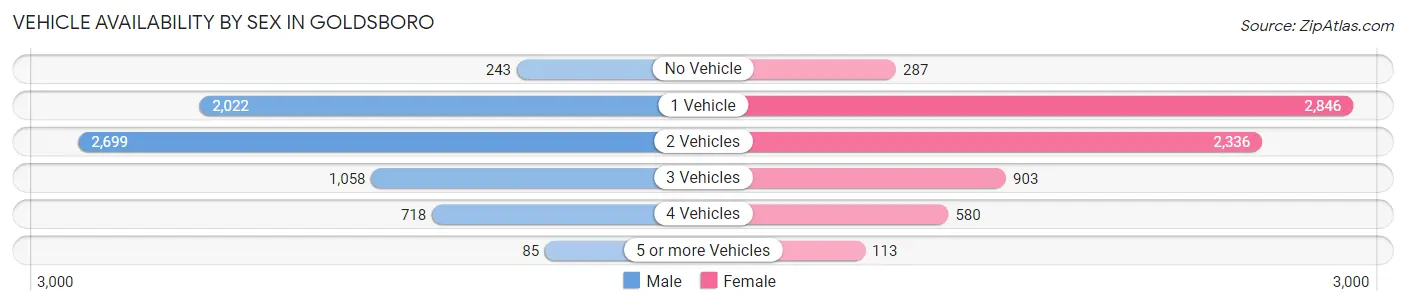
Vehicle Availability by Sex in Goldsboro
The most prevalent vehicle ownership categories in Goldsboro are males with 2 vehicles (2,699, accounting for 39.6%) and females with 2 vehicles (2,336, making up 38.2%).
| Vehicles Available | Male | Female |
| No Vehicle | 243 (3.6%) | 287 (4.1%) |
| 1 Vehicle | 2,022 (29.6%) | 2,846 (40.3%) |
| 2 Vehicles | 2,699 (39.6%) | 2,336 (33.1%) |
| 3 Vehicles | 1,058 (15.5%) | 903 (12.8%) |
| 4 Vehicles | 718 (10.5%) | 580 (8.2%) |
| 5 or more Vehicles | 85 (1.3%) | 113 (1.6%) |
| Total | 6,825 (100.0%) | 7,065 (100.0%) |
Commute Time in Goldsboro
The most frequently occuring commute durations in Goldsboro are 5 to 9 minutes (3,766 commuters, 26.6%), 10 to 14 minutes (3,382 commuters, 23.9%), and 15 to 19 minutes (2,150 commuters, 15.2%).
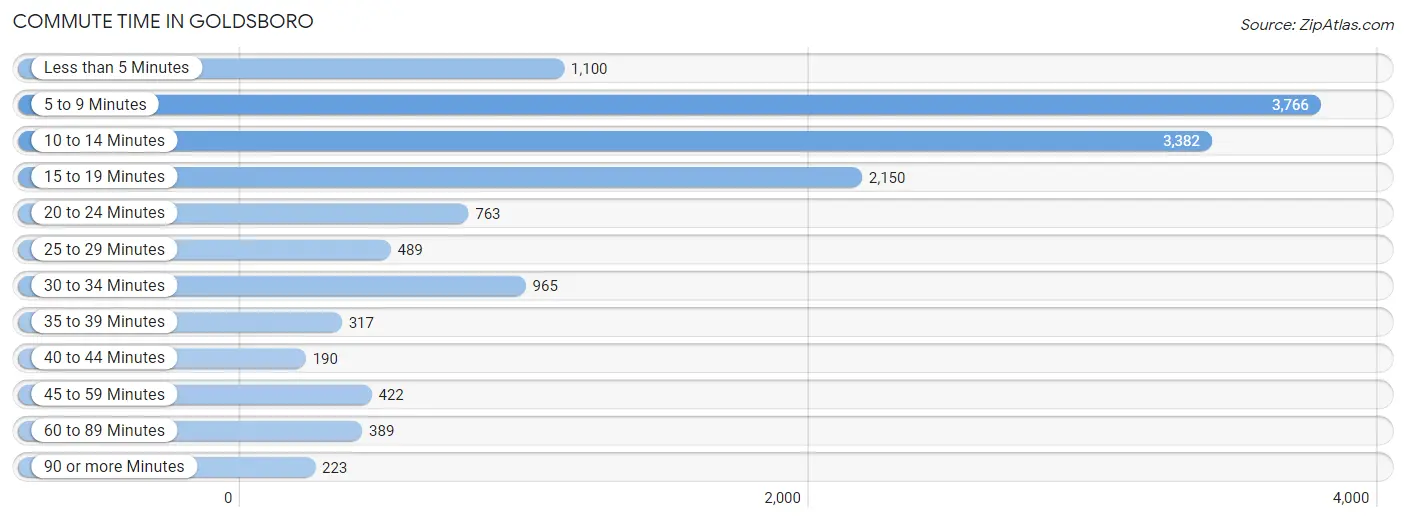
| Commute Time | # Commuters | % Commuters |
| Less than 5 Minutes | 1,100 | 7.8% |
| 5 to 9 Minutes | 3,766 | 26.6% |
| 10 to 14 Minutes | 3,382 | 23.9% |
| 15 to 19 Minutes | 2,150 | 15.2% |
| 20 to 24 Minutes | 763 | 5.4% |
| 25 to 29 Minutes | 489 | 3.5% |
| 30 to 34 Minutes | 965 | 6.8% |
| 35 to 39 Minutes | 317 | 2.2% |
| 40 to 44 Minutes | 190 | 1.3% |
| 45 to 59 Minutes | 422 | 3.0% |
| 60 to 89 Minutes | 389 | 2.8% |
| 90 or more Minutes | 223 | 1.6% |
Commute Time by Sex in Goldsboro
The most common commute times in Goldsboro are 5 to 9 minutes (1,840 commuters, 25.0%) for males and 10 to 14 minutes (2,065 commuters, 30.4%) for females.
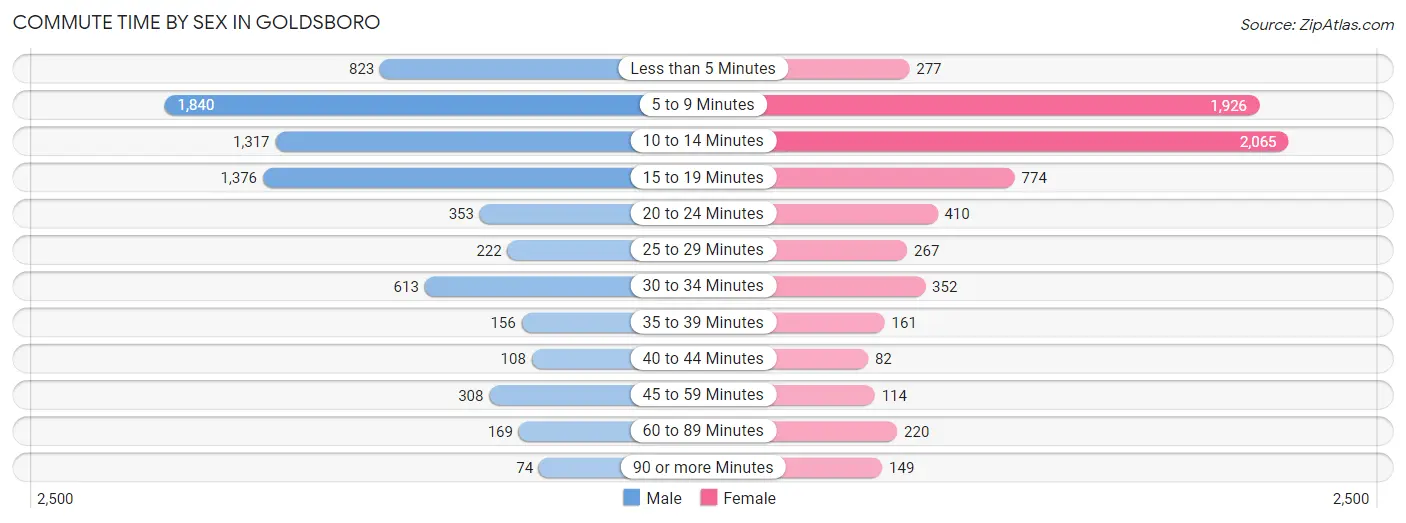
| Commute Time | Male | Female |
| Less than 5 Minutes | 823 (11.2%) | 277 (4.1%) |
| 5 to 9 Minutes | 1,840 (25.0%) | 1,926 (28.3%) |
| 10 to 14 Minutes | 1,317 (17.9%) | 2,065 (30.4%) |
| 15 to 19 Minutes | 1,376 (18.7%) | 774 (11.4%) |
| 20 to 24 Minutes | 353 (4.8%) | 410 (6.0%) |
| 25 to 29 Minutes | 222 (3.0%) | 267 (3.9%) |
| 30 to 34 Minutes | 613 (8.3%) | 352 (5.2%) |
| 35 to 39 Minutes | 156 (2.1%) | 161 (2.4%) |
| 40 to 44 Minutes | 108 (1.5%) | 82 (1.2%) |
| 45 to 59 Minutes | 308 (4.2%) | 114 (1.7%) |
| 60 to 89 Minutes | 169 (2.3%) | 220 (3.2%) |
| 90 or more Minutes | 74 (1.0%) | 149 (2.2%) |
Time of Departure to Work by Sex in Goldsboro
The most frequent times of departure to work in Goldsboro are 12:00 PM to 3:59 PM (995, 13.5%) for males and 7:00 AM to 7:29 AM (1,198, 17.6%) for females.
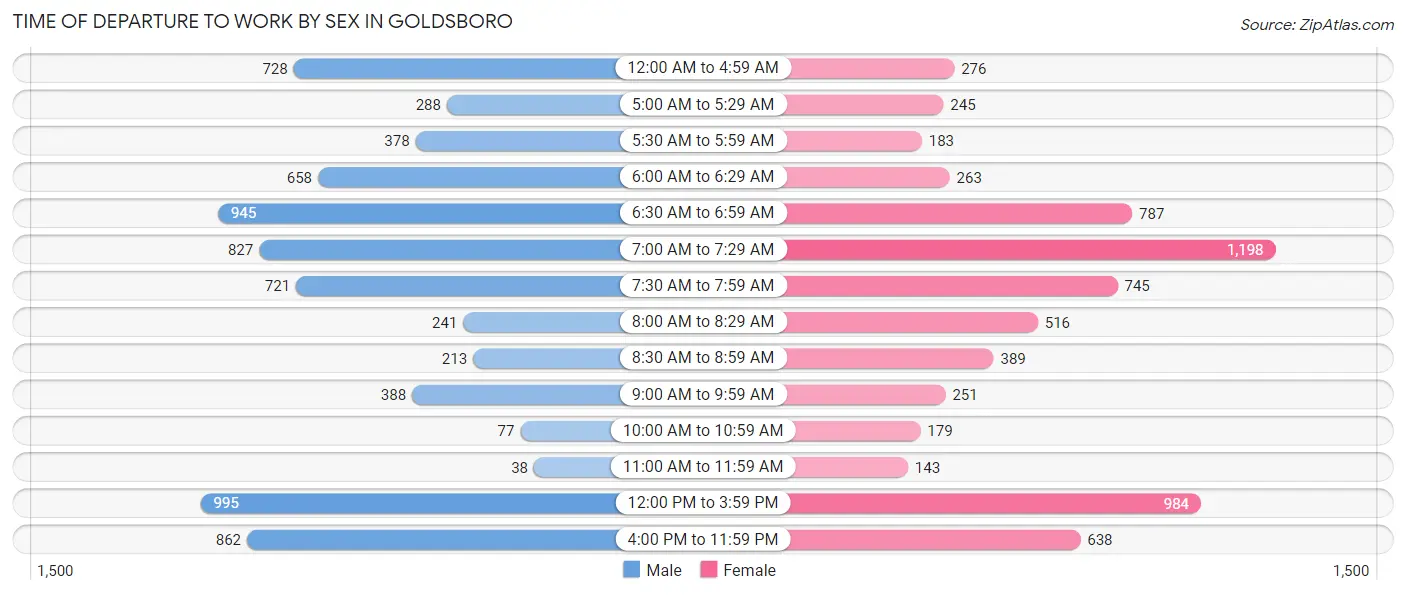
| Time of Departure | Male | Female |
| 12:00 AM to 4:59 AM | 728 (9.9%) | 276 (4.1%) |
| 5:00 AM to 5:29 AM | 288 (3.9%) | 245 (3.6%) |
| 5:30 AM to 5:59 AM | 378 (5.1%) | 183 (2.7%) |
| 6:00 AM to 6:29 AM | 658 (8.9%) | 263 (3.9%) |
| 6:30 AM to 6:59 AM | 945 (12.8%) | 787 (11.6%) |
| 7:00 AM to 7:29 AM | 827 (11.2%) | 1,198 (17.6%) |
| 7:30 AM to 7:59 AM | 721 (9.8%) | 745 (11.0%) |
| 8:00 AM to 8:29 AM | 241 (3.3%) | 516 (7.6%) |
| 8:30 AM to 8:59 AM | 213 (2.9%) | 389 (5.7%) |
| 9:00 AM to 9:59 AM | 388 (5.3%) | 251 (3.7%) |
| 10:00 AM to 10:59 AM | 77 (1.1%) | 179 (2.6%) |
| 11:00 AM to 11:59 AM | 38 (0.5%) | 143 (2.1%) |
| 12:00 PM to 3:59 PM | 995 (13.5%) | 984 (14.5%) |
| 4:00 PM to 11:59 PM | 862 (11.7%) | 638 (9.4%) |
| Total | 7,359 (100.0%) | 6,797 (100.0%) |
Housing Occupancy in Goldsboro
Occupancy by Ownership in Goldsboro
Of the total 14,911 dwellings in Goldsboro, owner-occupied units account for 5,836 (39.1%), while renter-occupied units make up 9,075 (60.9%).
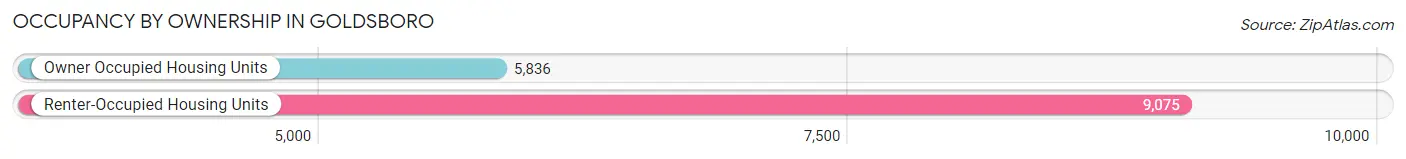
| Occupancy | # Housing Units | % Housing Units |
| Owner Occupied Housing Units | 5,836 | 39.1% |
| Renter-Occupied Housing Units | 9,075 | 60.9% |
| Total Occupied Housing Units | 14,911 | 100.0% |
Occupancy by Household Size in Goldsboro
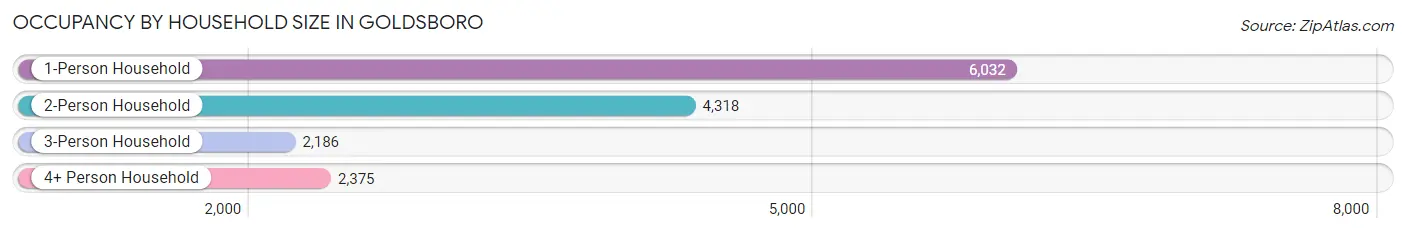
| Household Size | # Housing Units | % Housing Units |
| 1-Person Household | 6,032 | 40.5% |
| 2-Person Household | 4,318 | 29.0% |
| 3-Person Household | 2,186 | 14.7% |
| 4+ Person Household | 2,375 | 15.9% |
| Total Housing Units | 14,911 | 100.0% |
Occupancy by Ownership by Household Size in Goldsboro
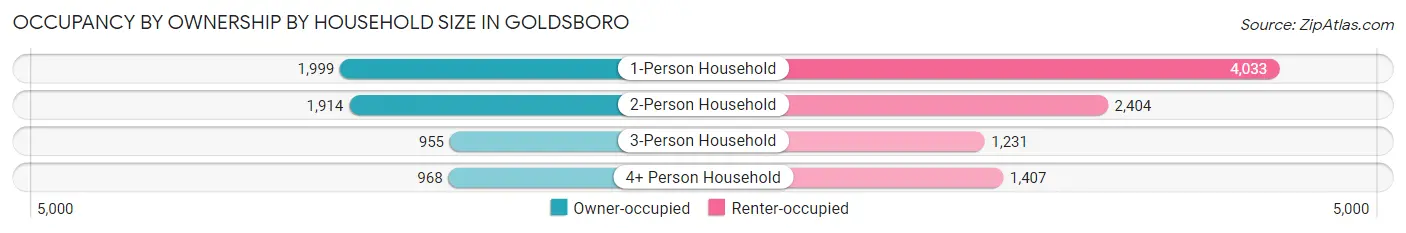
| Household Size | Owner-occupied | Renter-occupied |
| 1-Person Household | 1,999 (33.1%) | 4,033 (66.9%) |
| 2-Person Household | 1,914 (44.3%) | 2,404 (55.7%) |
| 3-Person Household | 955 (43.7%) | 1,231 (56.3%) |
| 4+ Person Household | 968 (40.8%) | 1,407 (59.2%) |
| Total Housing Units | 5,836 (39.1%) | 9,075 (60.9%) |
Occupancy by Educational Attainment in Goldsboro
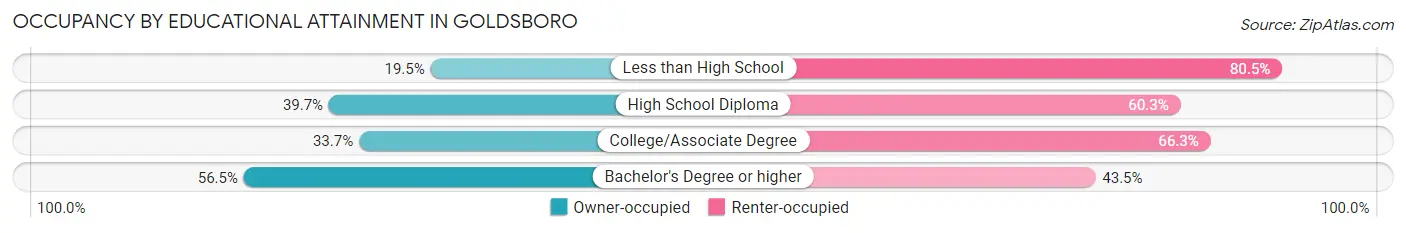
| Household Size | Owner-occupied | Renter-occupied |
| Less than High School | 286 (19.5%) | 1,180 (80.5%) |
| High School Diploma | 1,659 (39.7%) | 2,524 (60.3%) |
| College/Associate Degree | 1,986 (33.7%) | 3,907 (66.3%) |
| Bachelor's Degree or higher | 1,905 (56.5%) | 1,464 (43.5%) |
Occupancy by Age of Householder in Goldsboro
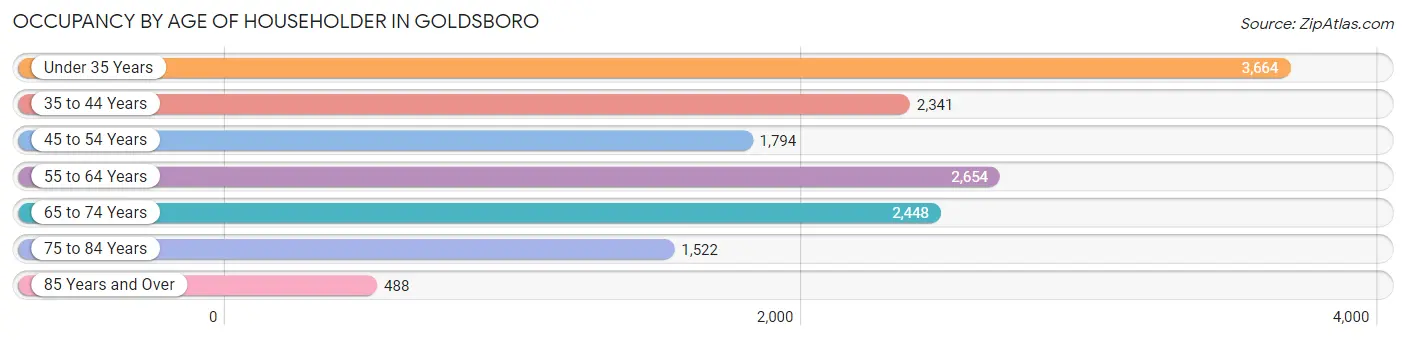
| Age Bracket | # Households | % Households |
| Under 35 Years | 3,664 | 24.6% |
| 35 to 44 Years | 2,341 | 15.7% |
| 45 to 54 Years | 1,794 | 12.0% |
| 55 to 64 Years | 2,654 | 17.8% |
| 65 to 74 Years | 2,448 | 16.4% |
| 75 to 84 Years | 1,522 | 10.2% |
| 85 Years and Over | 488 | 3.3% |
| Total | 14,911 | 100.0% |
Housing Finances in Goldsboro
Median Income by Occupancy in Goldsboro
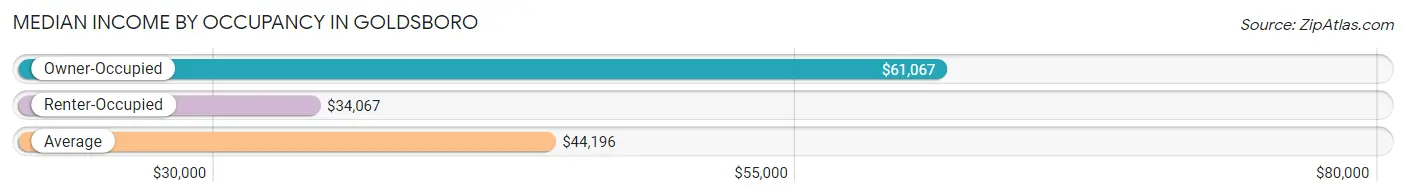
| Occupancy Type | # Households | Median Income |
| Owner-Occupied | 5,836 (39.1%) | $61,067 |
| Renter-Occupied | 9,075 (60.9%) | $34,067 |
| Average | 14,911 (100.0%) | $44,196 |
Occupancy by Householder Income Bracket in Goldsboro
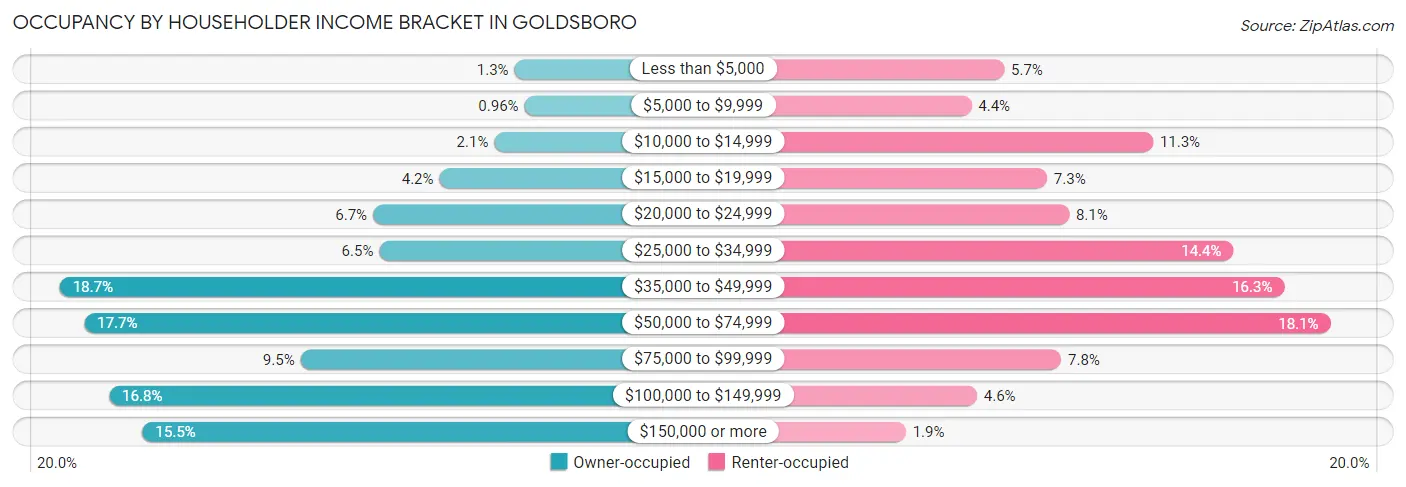
| Income Bracket | Owner-occupied | Renter-occupied |
| Less than $5,000 | 78 (1.3%) | 514 (5.7%) |
| $5,000 to $9,999 | 56 (1.0%) | 400 (4.4%) |
| $10,000 to $14,999 | 123 (2.1%) | 1,028 (11.3%) |
| $15,000 to $19,999 | 245 (4.2%) | 662 (7.3%) |
| $20,000 to $24,999 | 393 (6.7%) | 738 (8.1%) |
| $25,000 to $34,999 | 379 (6.5%) | 1,306 (14.4%) |
| $35,000 to $49,999 | 1,089 (18.7%) | 1,482 (16.3%) |
| $50,000 to $74,999 | 1,035 (17.7%) | 1,642 (18.1%) |
| $75,000 to $99,999 | 554 (9.5%) | 711 (7.8%) |
| $100,000 to $149,999 | 979 (16.8%) | 419 (4.6%) |
| $150,000 or more | 905 (15.5%) | 173 (1.9%) |
| Total | 5,836 (100.0%) | 9,075 (100.0%) |
Monthly Housing Cost Tiers in Goldsboro
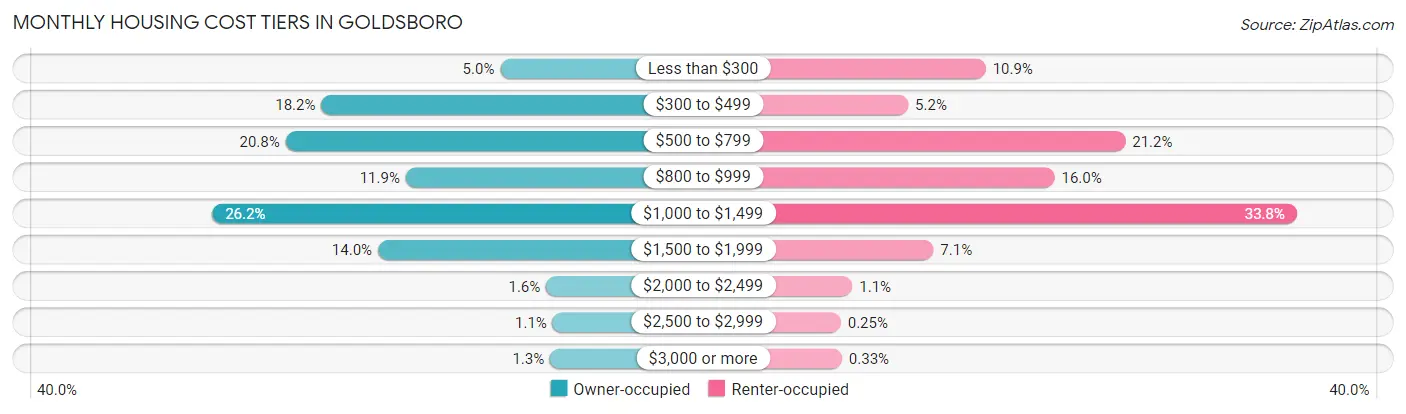
| Monthly Cost | Owner-occupied | Renter-occupied |
| Less than $300 | 290 (5.0%) | 991 (10.9%) |
| $300 to $499 | 1,059 (18.1%) | 473 (5.2%) |
| $500 to $799 | 1,213 (20.8%) | 1,924 (21.2%) |
| $800 to $999 | 696 (11.9%) | 1,451 (16.0%) |
| $1,000 to $1,499 | 1,528 (26.2%) | 3,070 (33.8%) |
| $1,500 to $1,999 | 816 (14.0%) | 642 (7.1%) |
| $2,000 to $2,499 | 93 (1.6%) | 100 (1.1%) |
| $2,500 to $2,999 | 65 (1.1%) | 23 (0.3%) |
| $3,000 or more | 76 (1.3%) | 30 (0.3%) |
| Total | 5,836 (100.0%) | 9,075 (100.0%) |
Physical Housing Characteristics in Goldsboro
Housing Structures in Goldsboro
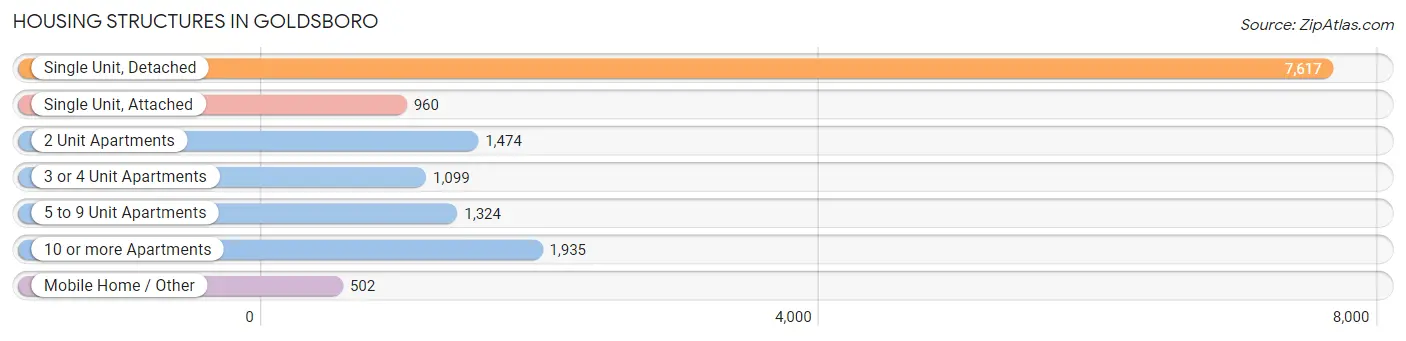
| Structure Type | # Housing Units | % Housing Units |
| Single Unit, Detached | 7,617 | 51.1% |
| Single Unit, Attached | 960 | 6.4% |
| 2 Unit Apartments | 1,474 | 9.9% |
| 3 or 4 Unit Apartments | 1,099 | 7.4% |
| 5 to 9 Unit Apartments | 1,324 | 8.9% |
| 10 or more Apartments | 1,935 | 13.0% |
| Mobile Home / Other | 502 | 3.4% |
| Total | 14,911 | 100.0% |
Housing Structures by Occupancy in Goldsboro
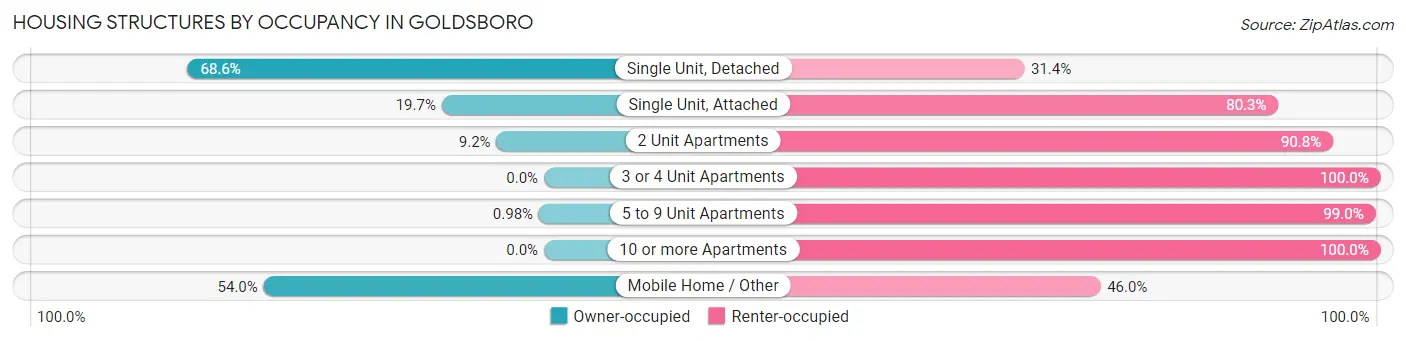
| Structure Type | Owner-occupied | Renter-occupied |
| Single Unit, Detached | 5,228 (68.6%) | 2,389 (31.4%) |
| Single Unit, Attached | 189 (19.7%) | 771 (80.3%) |
| 2 Unit Apartments | 135 (9.2%) | 1,339 (90.8%) |
| 3 or 4 Unit Apartments | 0 (0.0%) | 1,099 (100.0%) |
| 5 to 9 Unit Apartments | 13 (1.0%) | 1,311 (99.0%) |
| 10 or more Apartments | 0 (0.0%) | 1,935 (100.0%) |
| Mobile Home / Other | 271 (54.0%) | 231 (46.0%) |
| Total | 5,836 (39.1%) | 9,075 (60.9%) |
Housing Structures by Number of Rooms in Goldsboro
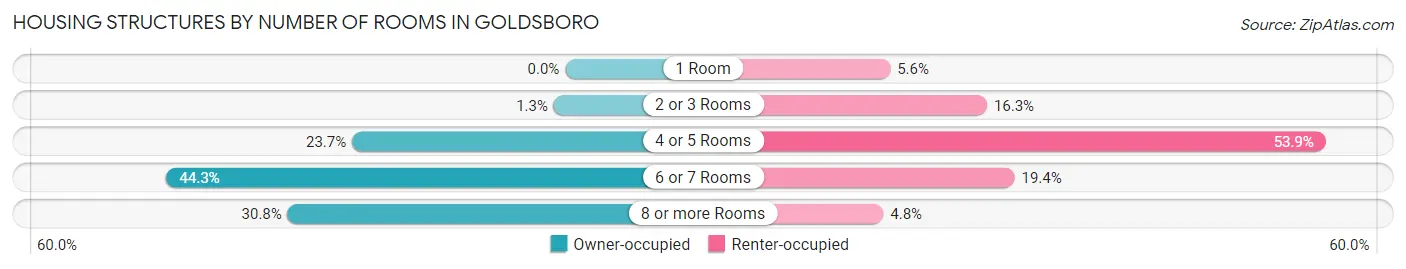
| Number of Rooms | Owner-occupied | Renter-occupied |
| 1 Room | 0 (0.0%) | 506 (5.6%) |
| 2 or 3 Rooms | 74 (1.3%) | 1,481 (16.3%) |
| 4 or 5 Rooms | 1,381 (23.7%) | 4,892 (53.9%) |
| 6 or 7 Rooms | 2,583 (44.3%) | 1,759 (19.4%) |
| 8 or more Rooms | 1,798 (30.8%) | 437 (4.8%) |
| Total | 5,836 (100.0%) | 9,075 (100.0%) |
Housing Structure by Heating Type in Goldsboro
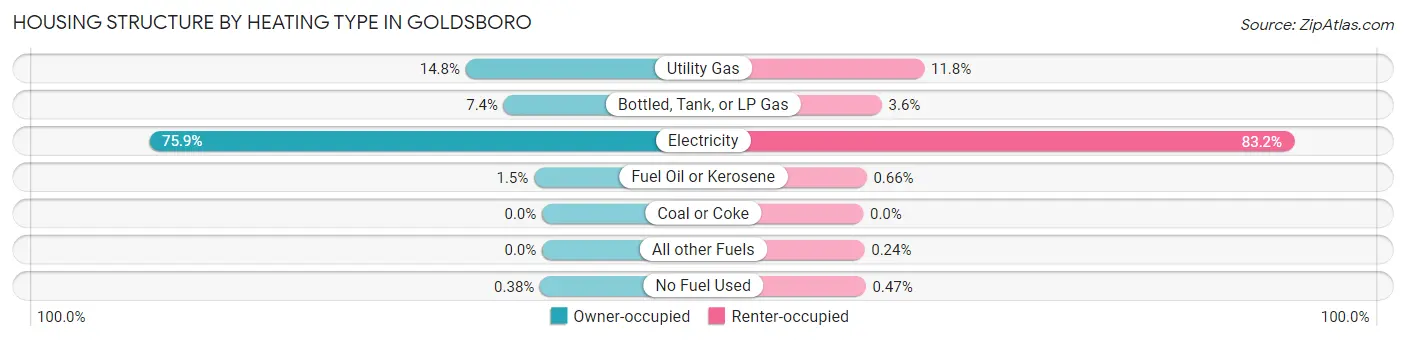
| Heating Type | Owner-occupied | Renter-occupied |
| Utility Gas | 861 (14.7%) | 1,070 (11.8%) |
| Bottled, Tank, or LP Gas | 431 (7.4%) | 326 (3.6%) |
| Electricity | 4,432 (75.9%) | 7,554 (83.2%) |
| Fuel Oil or Kerosene | 90 (1.5%) | 60 (0.7%) |
| Coal or Coke | 0 (0.0%) | 0 (0.0%) |
| All other Fuels | 0 (0.0%) | 22 (0.2%) |
| No Fuel Used | 22 (0.4%) | 43 (0.5%) |
| Total | 5,836 (100.0%) | 9,075 (100.0%) |
Household Vehicle Usage in Goldsboro
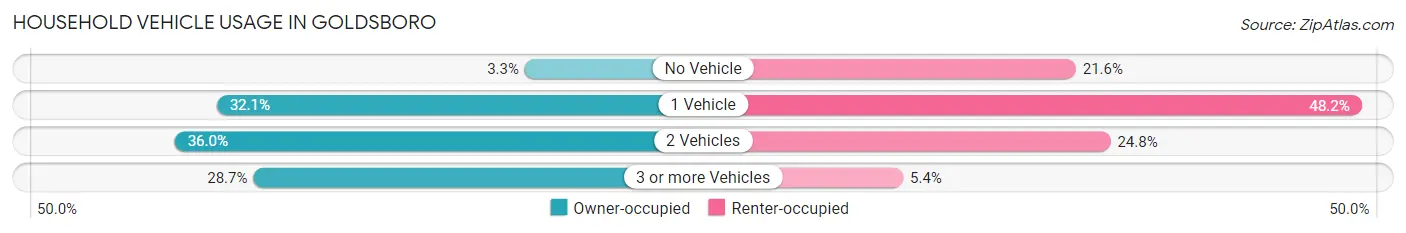
| Vehicles per Household | Owner-occupied | Renter-occupied |
| No Vehicle | 193 (3.3%) | 1,956 (21.5%) |
| 1 Vehicle | 1,871 (32.1%) | 4,376 (48.2%) |
| 2 Vehicles | 2,100 (36.0%) | 2,250 (24.8%) |
| 3 or more Vehicles | 1,672 (28.6%) | 493 (5.4%) |
| Total | 5,836 (100.0%) | 9,075 (100.0%) |
Real Estate & Mortgages in Goldsboro
Real Estate and Mortgage Overview in Goldsboro
| Characteristic | Without Mortgage | With Mortgage |
| Housing Units | 2,684 | 3,152 |
| Median Property Value | $155,500 | $165,400 |
| Median Household Income | $46,487 | $655 |
| Monthly Housing Costs | $501 | $76 |
| Real Estate Taxes | $1,595 | $86 |
Property Value by Mortgage Status in Goldsboro
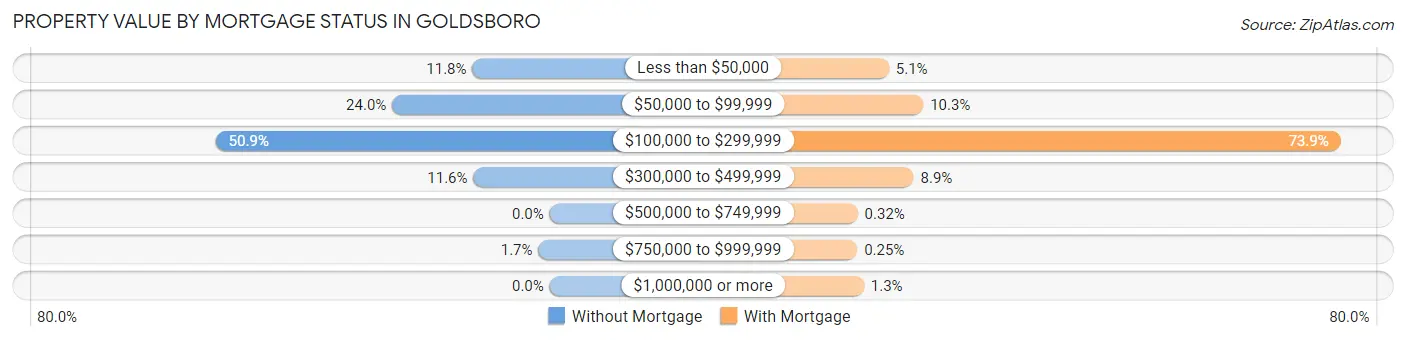
| Property Value | Without Mortgage | With Mortgage |
| Less than $50,000 | 316 (11.8%) | 160 (5.1%) |
| $50,000 to $99,999 | 644 (24.0%) | 325 (10.3%) |
| $100,000 to $299,999 | 1,366 (50.9%) | 2,330 (73.9%) |
| $300,000 to $499,999 | 312 (11.6%) | 279 (8.8%) |
| $500,000 to $749,999 | 0 (0.0%) | 10 (0.3%) |
| $750,000 to $999,999 | 46 (1.7%) | 8 (0.3%) |
| $1,000,000 or more | 0 (0.0%) | 40 (1.3%) |
| Total | 2,684 (100.0%) | 3,152 (100.0%) |
Household Income by Mortgage Status in Goldsboro
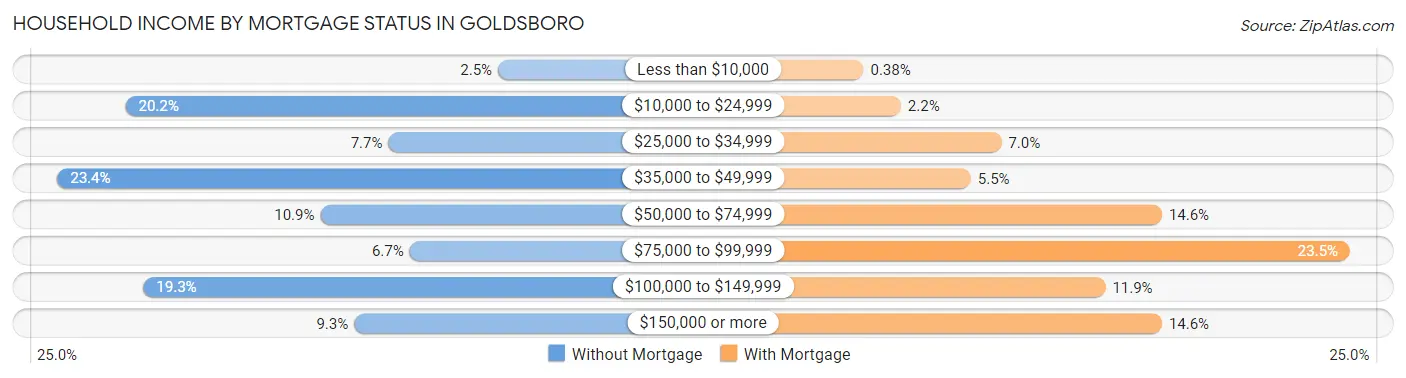
| Household Income | Without Mortgage | With Mortgage |
| Less than $10,000 | 66 (2.5%) | 12 (0.4%) |
| $10,000 to $24,999 | 542 (20.2%) | 68 (2.2%) |
| $25,000 to $34,999 | 206 (7.7%) | 219 (7.0%) |
| $35,000 to $49,999 | 629 (23.4%) | 173 (5.5%) |
| $50,000 to $74,999 | 293 (10.9%) | 460 (14.6%) |
| $75,000 to $99,999 | 179 (6.7%) | 742 (23.5%) |
| $100,000 to $149,999 | 519 (19.3%) | 375 (11.9%) |
| $150,000 or more | 250 (9.3%) | 460 (14.6%) |
| Total | 2,684 (100.0%) | 3,152 (100.0%) |
Property Value to Household Income Ratio in Goldsboro
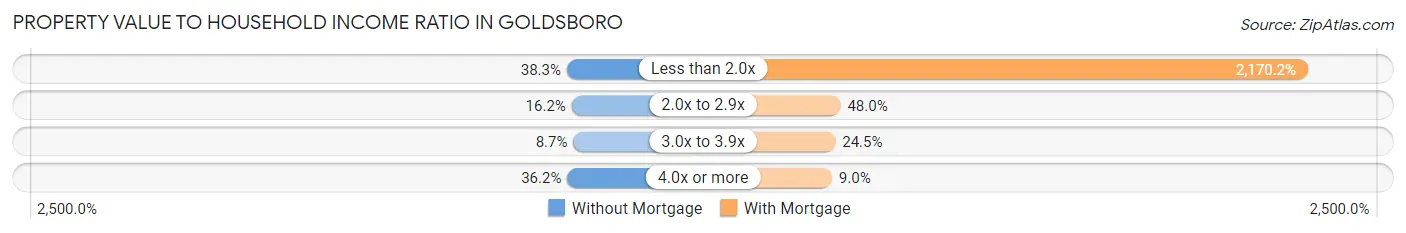
| Value-to-Income Ratio | Without Mortgage | With Mortgage |
| Less than 2.0x | 1,028 (38.3%) | 68,405 (2,170.2%) |
| 2.0x to 2.9x | 436 (16.2%) | 1,514 (48.0%) |
| 3.0x to 3.9x | 233 (8.7%) | 772 (24.5%) |
| 4.0x or more | 972 (36.2%) | 284 (9.0%) |
| Total | 2,684 (100.0%) | 3,152 (100.0%) |
Real Estate Taxes by Mortgage Status in Goldsboro
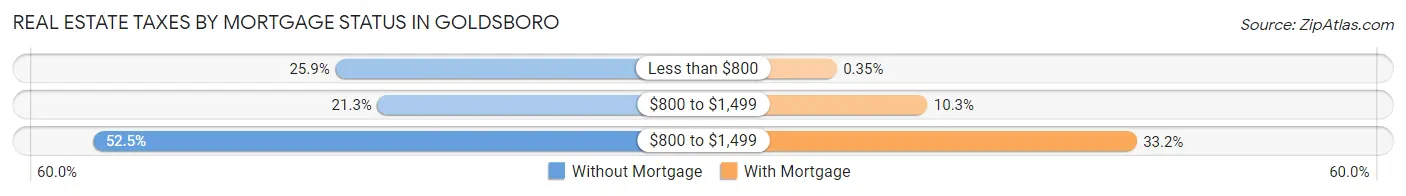
| Property Taxes | Without Mortgage | With Mortgage |
| Less than $800 | 696 (25.9%) | 11 (0.4%) |
| $800 to $1,499 | 572 (21.3%) | 324 (10.3%) |
| $800 to $1,499 | 1,410 (52.5%) | 1,047 (33.2%) |
| Total | 2,684 (100.0%) | 3,152 (100.0%) |
Health & Disability in Goldsboro
Health Insurance Coverage by Age in Goldsboro
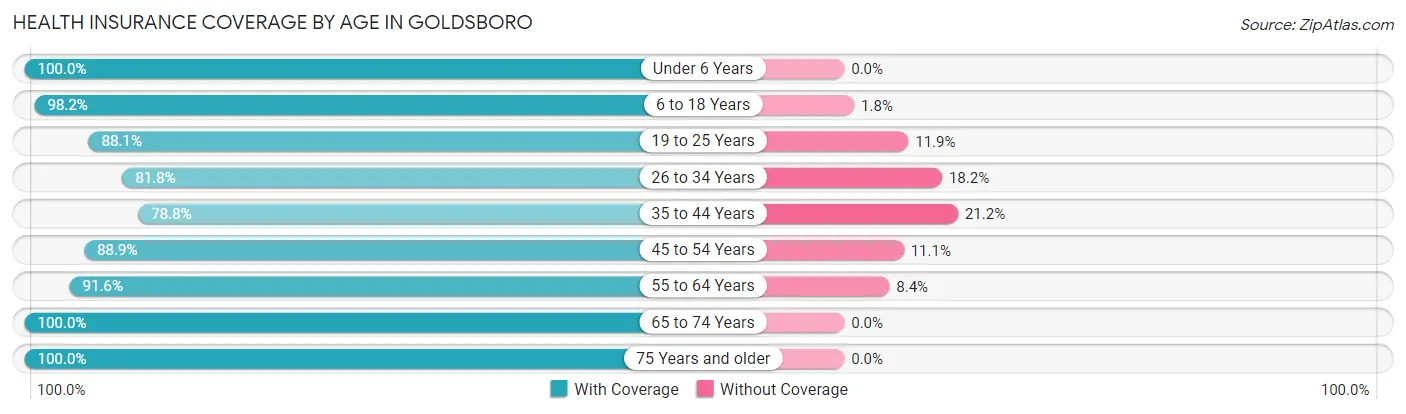
| Age Bracket | With Coverage | Without Coverage |
| Under 6 Years | 2,611 (100.0%) | 0 (0.0%) |
| 6 to 18 Years | 5,023 (98.2%) | 94 (1.8%) |
| 19 to 25 Years | 2,258 (88.1%) | 306 (11.9%) |
| 26 to 34 Years | 2,797 (81.8%) | 623 (18.2%) |
| 35 to 44 Years | 2,781 (78.8%) | 748 (21.2%) |
| 45 to 54 Years | 2,850 (88.9%) | 355 (11.1%) |
| 55 to 64 Years | 3,873 (91.6%) | 355 (8.4%) |
| 65 to 74 Years | 3,225 (100.0%) | 0 (0.0%) |
| 75 Years and older | 2,706 (100.0%) | 0 (0.0%) |
| Total | 28,124 (91.9%) | 2,481 (8.1%) |
Health Insurance Coverage by Citizenship Status in Goldsboro
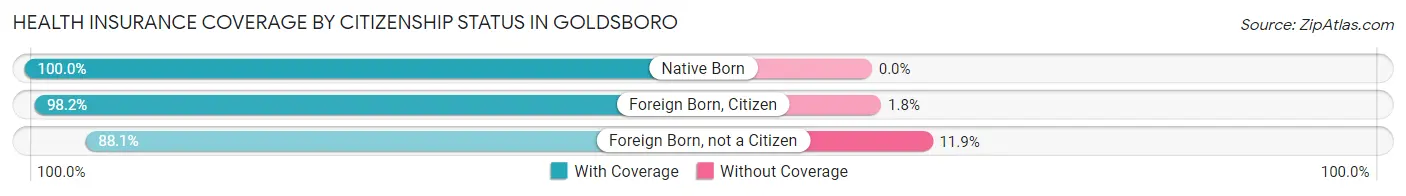
| Citizenship Status | With Coverage | Without Coverage |
| Native Born | 2,611 (100.0%) | 0 (0.0%) |
| Foreign Born, Citizen | 5,023 (98.2%) | 94 (1.8%) |
| Foreign Born, not a Citizen | 2,258 (88.1%) | 306 (11.9%) |
Health Insurance Coverage by Household Income in Goldsboro
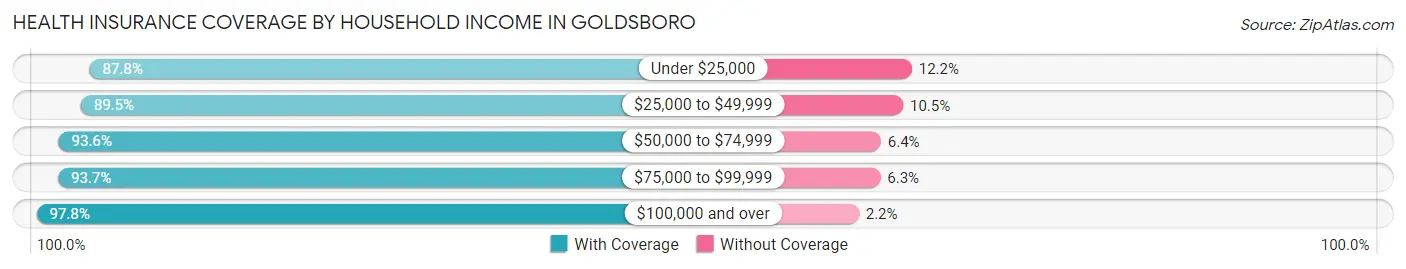
| Household Income | With Coverage | Without Coverage |
| Under $25,000 | 6,083 (87.8%) | 844 (12.2%) |
| $25,000 to $49,999 | 7,436 (89.5%) | 876 (10.5%) |
| $50,000 to $74,999 | 4,447 (93.6%) | 303 (6.4%) |
| $75,000 to $99,999 | 3,233 (93.7%) | 217 (6.3%) |
| $100,000 and over | 6,669 (97.8%) | 153 (2.2%) |
Public vs Private Health Insurance Coverage by Age in Goldsboro
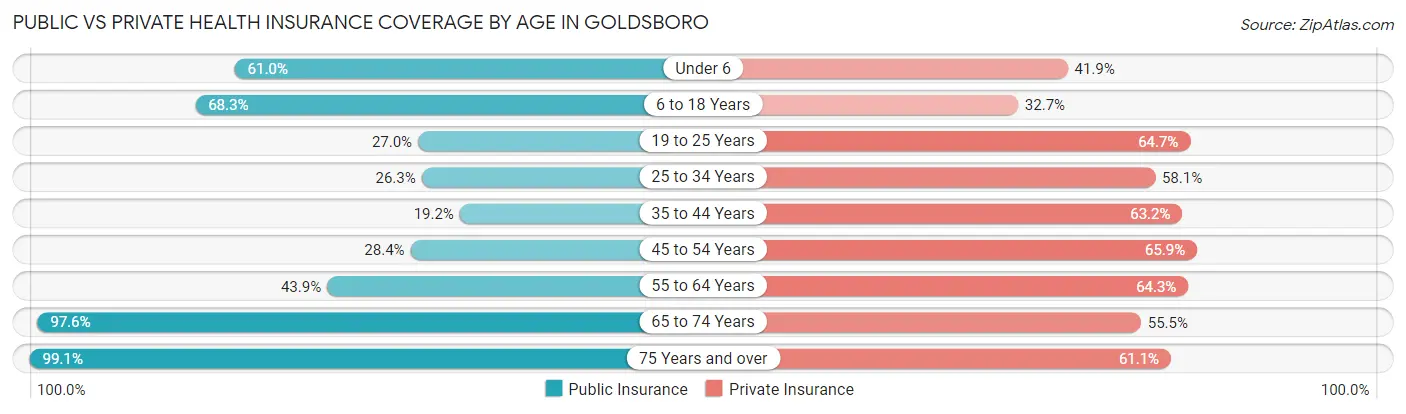
| Age Bracket | Public Insurance | Private Insurance |
| Under 6 | 1,593 (61.0%) | 1,094 (41.9%) |
| 6 to 18 Years | 3,496 (68.3%) | 1,673 (32.7%) |
| 19 to 25 Years | 692 (27.0%) | 1,658 (64.7%) |
| 25 to 34 Years | 900 (26.3%) | 1,988 (58.1%) |
| 35 to 44 Years | 679 (19.2%) | 2,230 (63.2%) |
| 45 to 54 Years | 910 (28.4%) | 2,113 (65.9%) |
| 55 to 64 Years | 1,855 (43.9%) | 2,718 (64.3%) |
| 65 to 74 Years | 3,149 (97.6%) | 1,790 (55.5%) |
| 75 Years and over | 2,681 (99.1%) | 1,653 (61.1%) |
| Total | 15,955 (52.1%) | 16,917 (55.3%) |
Disability Status by Sex by Age in Goldsboro
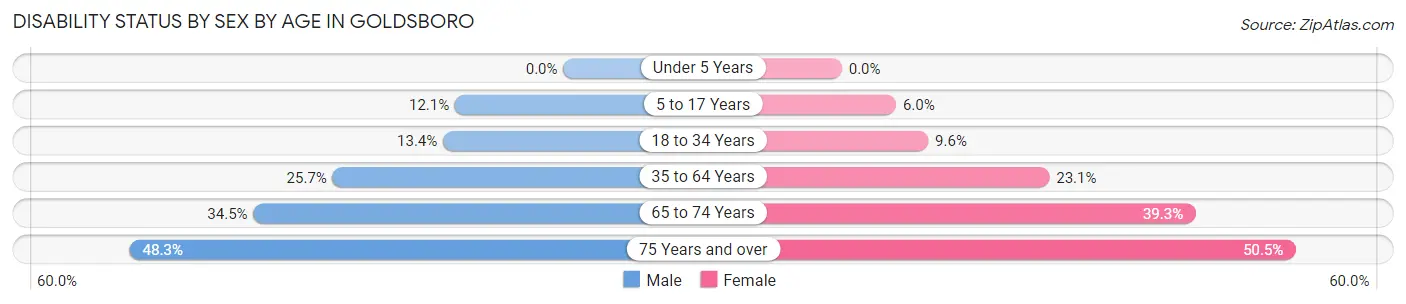
| Age Bracket | Male | Female |
| Under 5 Years | 0 (0.0%) | 0 (0.0%) |
| 5 to 17 Years | 310 (12.1%) | 154 (6.0%) |
| 18 to 34 Years | 392 (13.4%) | 340 (9.6%) |
| 35 to 64 Years | 1,265 (25.7%) | 1,395 (23.1%) |
| 65 to 74 Years | 484 (34.5%) | 717 (39.3%) |
| 75 Years and over | 469 (48.3%) | 876 (50.5%) |
Disability Class by Sex by Age in Goldsboro
Disability Class: Hearing Difficulty
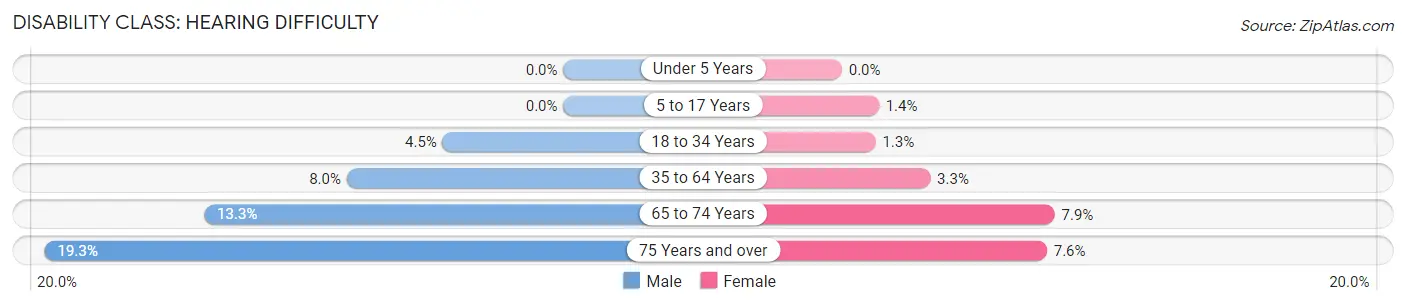
| Age Bracket | Male | Female |
| Under 5 Years | 0 (0.0%) | 0 (0.0%) |
| 5 to 17 Years | 0 (0.0%) | 35 (1.4%) |
| 18 to 34 Years | 131 (4.5%) | 44 (1.3%) |
| 35 to 64 Years | 396 (8.0%) | 198 (3.3%) |
| 65 to 74 Years | 187 (13.3%) | 144 (7.9%) |
| 75 Years and over | 187 (19.3%) | 132 (7.6%) |
Disability Class: Vision Difficulty
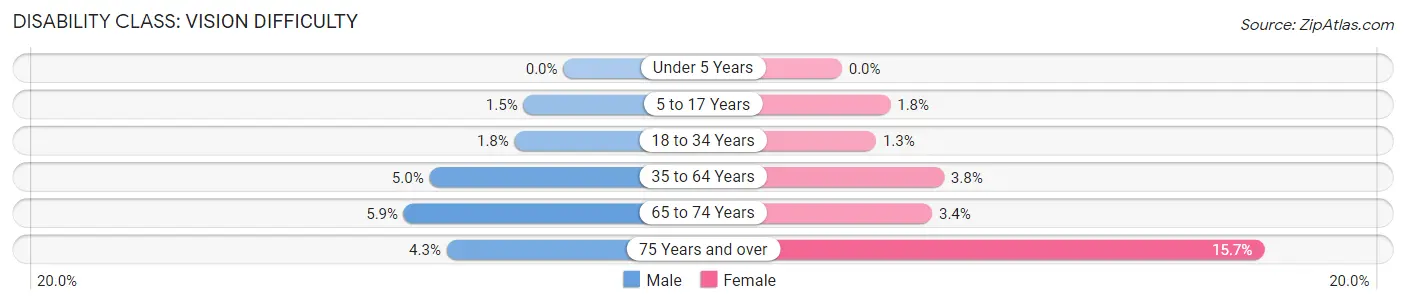
| Age Bracket | Male | Female |
| Under 5 Years | 0 (0.0%) | 0 (0.0%) |
| 5 to 17 Years | 38 (1.5%) | 46 (1.8%) |
| 18 to 34 Years | 53 (1.8%) | 45 (1.3%) |
| 35 to 64 Years | 245 (5.0%) | 229 (3.8%) |
| 65 to 74 Years | 83 (5.9%) | 61 (3.4%) |
| 75 Years and over | 42 (4.3%) | 272 (15.7%) |
Disability Class: Cognitive Difficulty
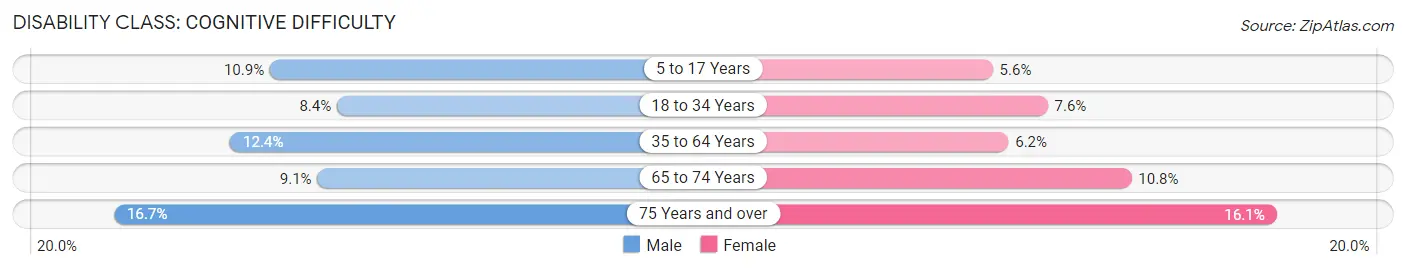
| Age Bracket | Male | Female |
| 5 to 17 Years | 280 (10.9%) | 143 (5.6%) |
| 18 to 34 Years | 246 (8.4%) | 270 (7.6%) |
| 35 to 64 Years | 609 (12.4%) | 373 (6.2%) |
| 65 to 74 Years | 128 (9.1%) | 196 (10.7%) |
| 75 Years and over | 162 (16.7%) | 280 (16.1%) |
Disability Class: Ambulatory Difficulty
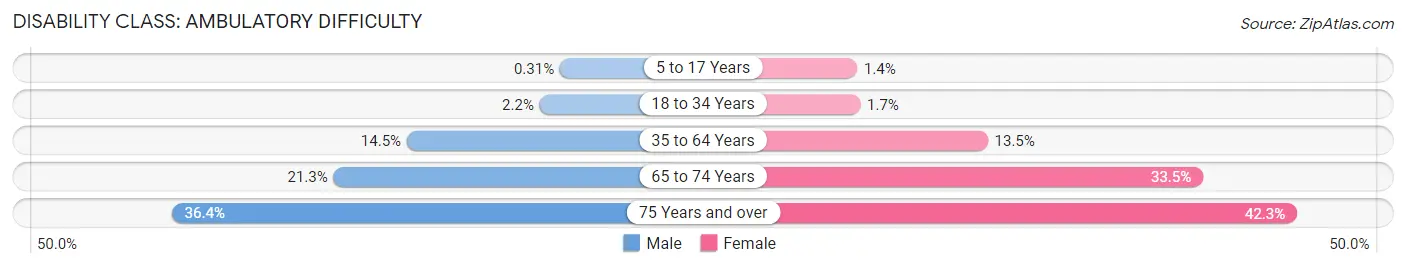
| Age Bracket | Male | Female |
| 5 to 17 Years | 8 (0.3%) | 36 (1.4%) |
| 18 to 34 Years | 64 (2.2%) | 60 (1.7%) |
| 35 to 64 Years | 715 (14.5%) | 817 (13.5%) |
| 65 to 74 Years | 299 (21.3%) | 611 (33.5%) |
| 75 Years and over | 353 (36.3%) | 733 (42.2%) |
Disability Class: Self-Care Difficulty
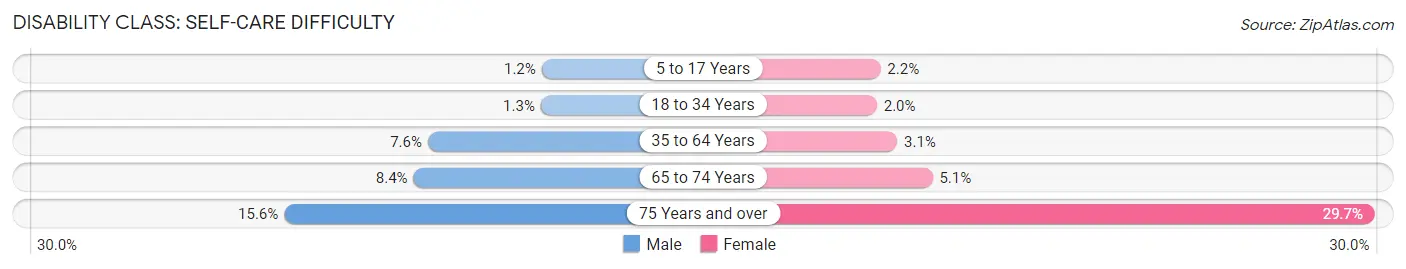
| Age Bracket | Male | Female |
| 5 to 17 Years | 31 (1.2%) | 55 (2.1%) |
| 18 to 34 Years | 37 (1.3%) | 69 (1.9%) |
| 35 to 64 Years | 372 (7.5%) | 186 (3.1%) |
| 65 to 74 Years | 117 (8.4%) | 92 (5.1%) |
| 75 Years and over | 151 (15.5%) | 515 (29.7%) |
Technology Access in Goldsboro
Computing Device Access in Goldsboro
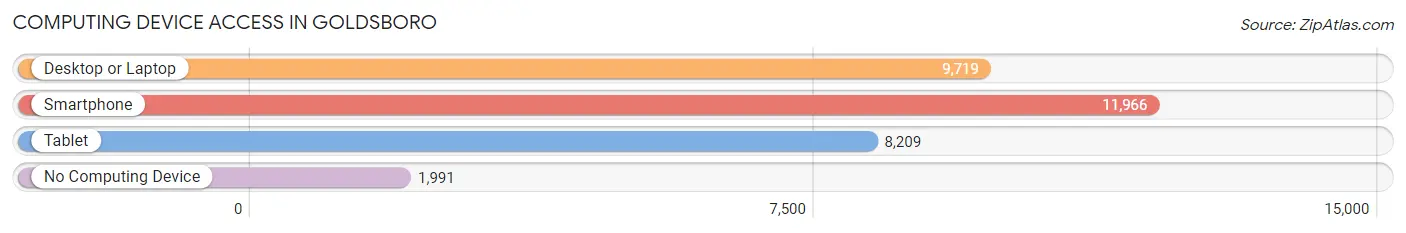
| Device Type | # Households | % Households |
| Desktop or Laptop | 9,719 | 65.2% |
| Smartphone | 11,966 | 80.2% |
| Tablet | 8,209 | 55.0% |
| No Computing Device | 1,991 | 13.4% |
| Total | 14,911 | 100.0% |
Internet Access in Goldsboro
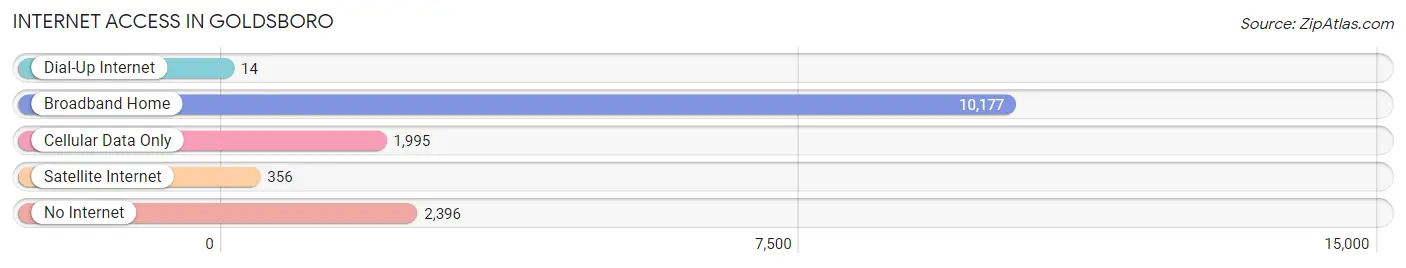
| Internet Type | # Households | % Households |
| Dial-Up Internet | 14 | 0.1% |
| Broadband Home | 10,177 | 68.2% |
| Cellular Data Only | 1,995 | 13.4% |
| Satellite Internet | 356 | 2.4% |
| No Internet | 2,396 | 16.1% |
| Total | 14,911 | 100.0% |
Goldsboro Summary
Goldsboro is a city located in Wayne County, North Carolina, United States. The population was 36,437 at the 2010 census. It is the principal city of and is included in the Goldsboro, North Carolina Metropolitan Statistical Area. The city is situated in the heart of Eastern North Carolina, approximately 36 miles southwest of Greenville and 55 miles southeast of Raleigh, the state capital.
Geography
Goldsboro is located at 35°20'25" North, 77°58'17" West (35.340278, -77.971444). According to the United States Census Bureau, the city has a total area of 28.2 square miles (73.1 km2), of which 28.1 square miles (72.9 km2) is land and 0.1 square miles (0.2 km2) (0.39%) is water.
Goldsboro is located in the coastal plain region of North Carolina, and is bordered by the Neuse River to the north and the Little River to the south. The city is located in the eastern part of Wayne County, and is situated between the cities of Kinston and Wilmington.
Climate
Goldsboro has a humid subtropical climate, with hot, humid summers and mild winters. The average annual temperature is 61.3°F (16.3°C), with an average high of 79.2°F (26.2°C) and an average low of 43.4°F (6.3°C). The average annual precipitation is 46.2 inches (1173 mm).
Demographics
As of the census of 2010, there were 36,437 people, 14,817 households, and 9,717 families residing in the city. The population density was 1,288.7 people per square mile (497.7/km2). There were 16,717 housing units at an average density of 595.3 per square mile (230.2/km2). The racial makeup of the city was 51.2% White, 43.2% African American, 0.4% Native American, 1.2% Asian, 0.1% Pacific Islander, 2.2% from other races, and 1.8% from two or more races. Hispanic or Latino of any race were 4.2% of the population.
Economy
Goldsboro is home to several major employers, including Seymour Johnson Air Force Base, Wayne Memorial Hospital, and Wayne County Public Schools. The city is also home to several small businesses, including retail stores, restaurants, and professional services.
The city's economy is largely driven by the military, healthcare, and education sectors. The city is also home to several manufacturing companies, including Goldsboro Milling Company, which produces animal feed, and Goldsboro Machine Works, which produces industrial machinery.
In addition, Goldsboro is home to several agricultural operations, including poultry farms, hog farms, and vegetable farms. The city is also home to several wineries and vineyards, as well as a number of craft breweries.
Conclusion
Goldsboro is a city located in Wayne County, North Carolina, United States. The population was 36,437 at the 2010 census. It is the principal city of and is included in the Goldsboro, North Carolina Metropolitan Statistical Area. The city is situated in the heart of Eastern North Carolina, approximately 36 miles southwest of Greenville and 55 miles southeast of Raleigh, the state capital. Goldsboro has a humid subtropical climate, with hot, humid summers and mild winters. The city's economy is largely driven by the military, healthcare, and education sectors, as well as several manufacturing companies, agricultural operations, wineries, and craft breweries.
Common Questions
What is the Total Population of Goldsboro?
Total Population of Goldsboro is 33,566.
What is the Total Male Population of Goldsboro?
Total Male Population of Goldsboro is 16,326.
What is the Total Female Population of Goldsboro?
Total Female Population of Goldsboro is 17,240.
What is the Ratio of Males per 100 Females in Goldsboro?
There are 94.70 Males per 100 Females in Goldsboro.
What is the Ratio of Females per 100 Males in Goldsboro?
There are 105.60 Females per 100 Males in Goldsboro.
What is the Median Population Age in Goldsboro?
Median Population Age in Goldsboro is 36.7 Years.
What is the Average Family Size in Goldsboro
Average Family Size in Goldsboro is 2.9 People.
What is the Average Household Size in Goldsboro
Average Household Size in Goldsboro is 2.1 People.
What is Per Capita Income in Goldsboro?
Per Capita income in Goldsboro is $29,622.
What is the Median Family Income in Goldsboro?
Median Family Income in Goldsboro is $56,897.
What is the Median Household income in Goldsboro?
Median Household Income in Goldsboro is $44,196.
What is Income or Wage Gap in Goldsboro?
Income or Wage Gap in Goldsboro is 31.2%.
Women in Goldsboro earn 68.8 cents for every dollar earned by a man.
What is Family Income Deficit in Goldsboro?
Family Income Deficit in Goldsboro is $11,292.
Families that are below poverty line in Goldsboro earn $11,292 less on average than the poverty threshold level.
What is Inequality or Gini Index in Goldsboro?
Inequality or Gini Index in Goldsboro is 0.50.
How Large is the Labor Force in Goldsboro?
There are 15,915 People in the Labor Forcein in Goldsboro.
What is the Percentage of People in the Labor Force in Goldsboro?
58.8% of People are in the Labor Force in Goldsboro.
What is the Unemployment Rate in Goldsboro?
Unemployment Rate in Goldsboro is 7.5%.