Denton, NC
Denton Map
Denton Overview
1,307
TOTAL POPULATION
629
MALE POPULATION
678
FEMALE POPULATION
92.77
MALES / 100 FEMALES
107.79
FEMALES / 100 MALES
35.9
MEDIAN AGE
3.0
AVG FAMILY SIZE
2.3
AVG HOUSEHOLD SIZE
$22,987
PER CAPITA INCOME
$53,125
AVG FAMILY INCOME
$44,539
AVG HOUSEHOLD INCOME
34.6%
WAGE / INCOME GAP [ % ]
65.4¢/ $1
WAGE / INCOME GAP [ $ ]
0.39
INEQUALITY / GINI INDEX
630
LABOR FORCE [ PEOPLE ]
60.8%
PERCENT IN LABOR FORCE
6.8%
UNEMPLOYMENT RATE
Denton Zip Codes
Denton Area Codes
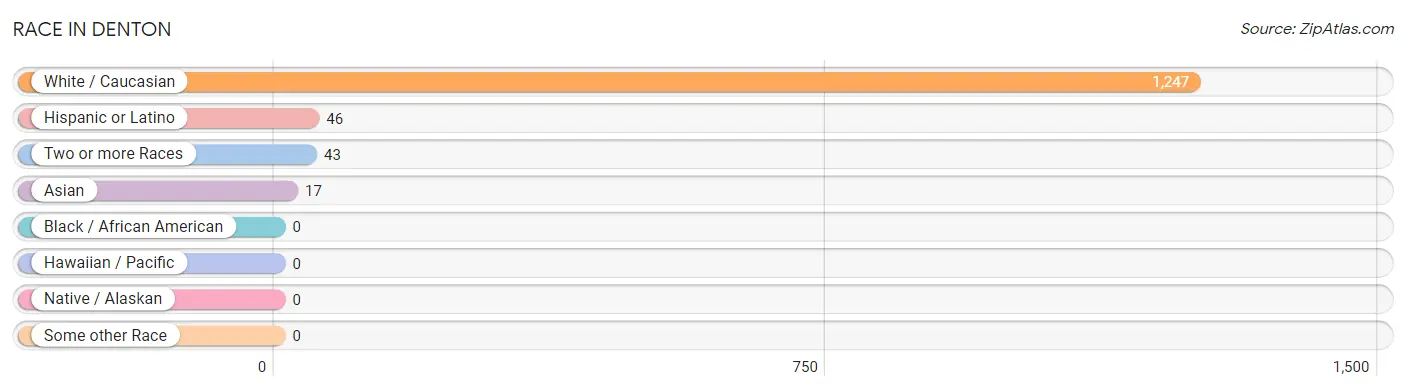
Race in Denton
The most populous races in Denton are White / Caucasian (1,247 | 95.4%), Hispanic or Latino (46 | 3.5%), and Two or more Races (43 | 3.3%).
| Race | # Population | % Population |
| Asian | 17 | 1.3% |
| Black / African American | 0 | 0.0% |
| Hawaiian / Pacific | 0 | 0.0% |
| Hispanic or Latino | 46 | 3.5% |
| Native / Alaskan | 0 | 0.0% |
| White / Caucasian | 1,247 | 95.4% |
| Two or more Races | 43 | 3.3% |
| Some other Race | 0 | 0.0% |
| Total | 1,307 | 100.0% |
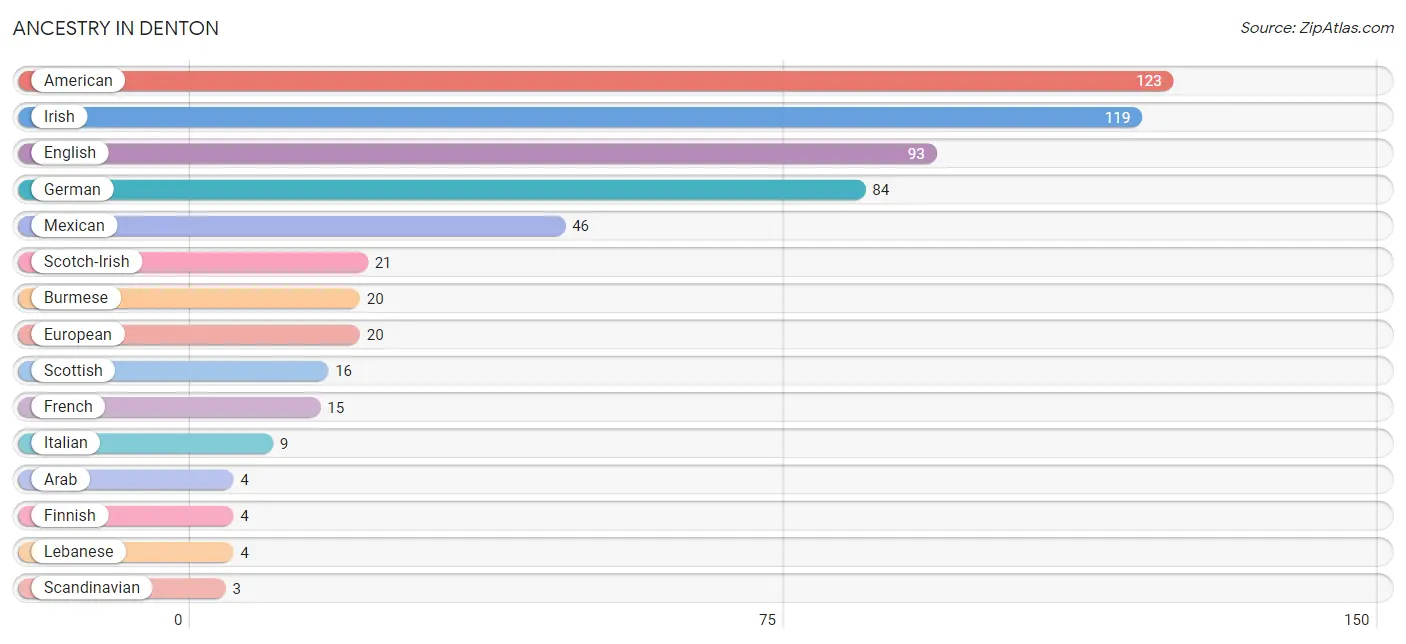
Ancestry in Denton
The most populous ancestries reported in Denton are American (123 | 9.4%), Irish (119 | 9.1%), English (93 | 7.1%), German (84 | 6.4%), and Mexican (46 | 3.5%), together accounting for 35.6% of all Denton residents.
| Ancestry | # Population | % Population |
| American | 123 | 9.4% |
| Arab | 4 | 0.3% |
| Burmese | 20 | 1.5% |
| English | 93 | 7.1% |
| European | 20 | 1.5% |
| Finnish | 4 | 0.3% |
| French | 15 | 1.1% |
| German | 84 | 6.4% |
| Irish | 119 | 9.1% |
| Italian | 9 | 0.7% |
| Lebanese | 4 | 0.3% |
| Mexican | 46 | 3.5% |
| Norwegian | 1 | 0.1% |
| Scandinavian | 3 | 0.2% |
| Scotch-Irish | 21 | 1.6% |
| Scottish | 16 | 1.2% | View All 16 Rows |
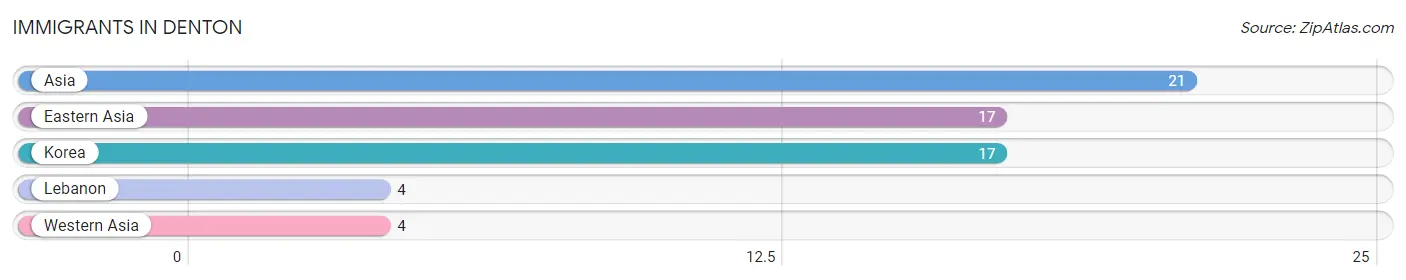
Immigrants in Denton
The most numerous immigrant groups reported in Denton came from Asia (21 | 1.6%), Eastern Asia (17 | 1.3%), Korea (17 | 1.3%), Lebanon (4 | 0.3%), and Western Asia (4 | 0.3%), together accounting for 4.8% of all Denton residents.
| Immigration Origin | # Population | % Population |
| Asia | 21 | 1.6% |
| Eastern Asia | 17 | 1.3% |
| Korea | 17 | 1.3% |
| Lebanon | 4 | 0.3% |
| Western Asia | 4 | 0.3% | View All 5 Rows |
Sex and Age in Denton
Sex and Age in Denton
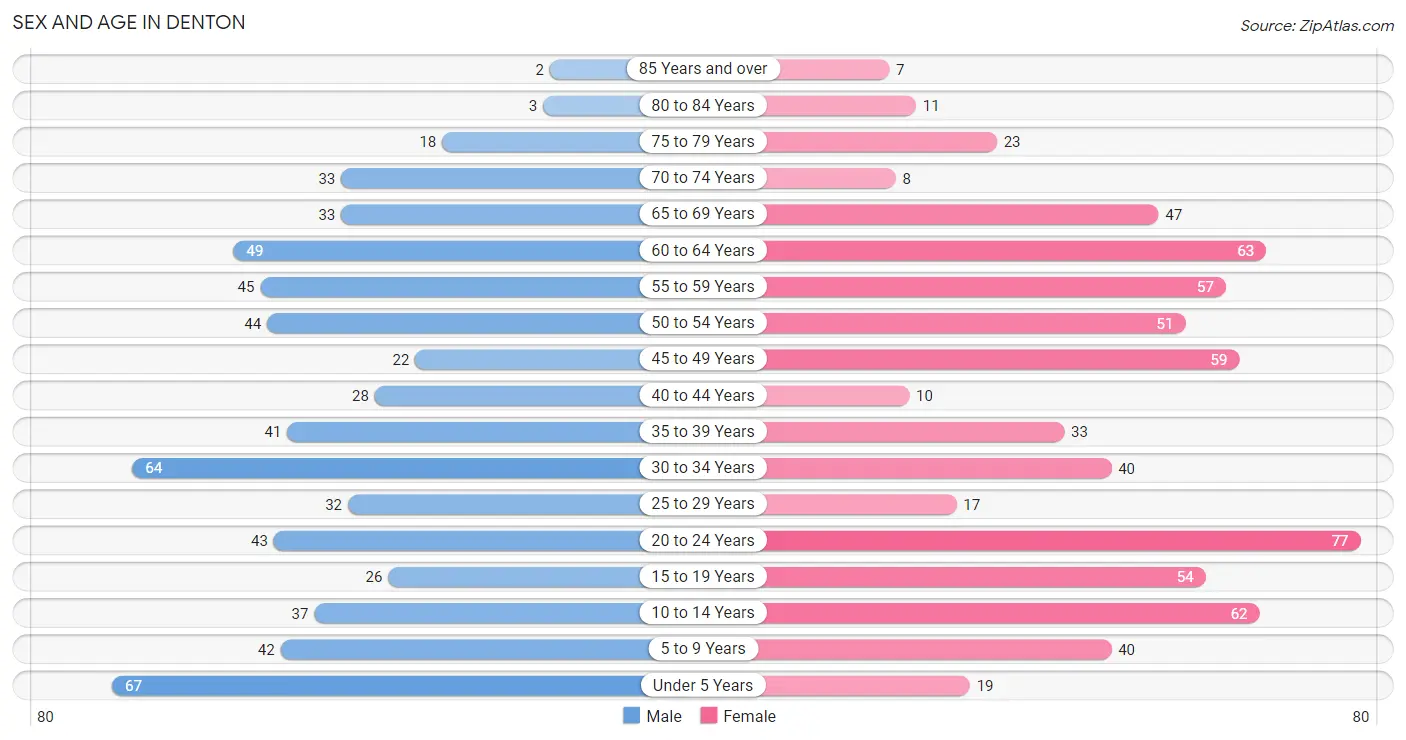
The most populous age groups in Denton are Under 5 Years (67 | 10.6%) for men and 20 to 24 Years (77 | 11.4%) for women.
| Age Bracket | Male | Female |
| Under 5 Years | 67 (10.6%) | 19 (2.8%) |
| 5 to 9 Years | 42 (6.7%) | 40 (5.9%) |
| 10 to 14 Years | 37 (5.9%) | 62 (9.1%) |
| 15 to 19 Years | 26 (4.1%) | 54 (8.0%) |
| 20 to 24 Years | 43 (6.8%) | 77 (11.4%) |
| 25 to 29 Years | 32 (5.1%) | 17 (2.5%) |
| 30 to 34 Years | 64 (10.2%) | 40 (5.9%) |
| 35 to 39 Years | 41 (6.5%) | 33 (4.9%) |
| 40 to 44 Years | 28 (4.4%) | 10 (1.5%) |
| 45 to 49 Years | 22 (3.5%) | 59 (8.7%) |
| 50 to 54 Years | 44 (7.0%) | 51 (7.5%) |
| 55 to 59 Years | 45 (7.1%) | 57 (8.4%) |
| 60 to 64 Years | 49 (7.8%) | 63 (9.3%) |
| 65 to 69 Years | 33 (5.2%) | 47 (6.9%) |
| 70 to 74 Years | 33 (5.2%) | 8 (1.2%) |
| 75 to 79 Years | 18 (2.9%) | 23 (3.4%) |
| 80 to 84 Years | 3 (0.5%) | 11 (1.6%) |
| 85 Years and over | 2 (0.3%) | 7 (1.0%) |
| Total | 629 (100.0%) | 678 (100.0%) |
Families and Households in Denton
Median Family Size in Denton
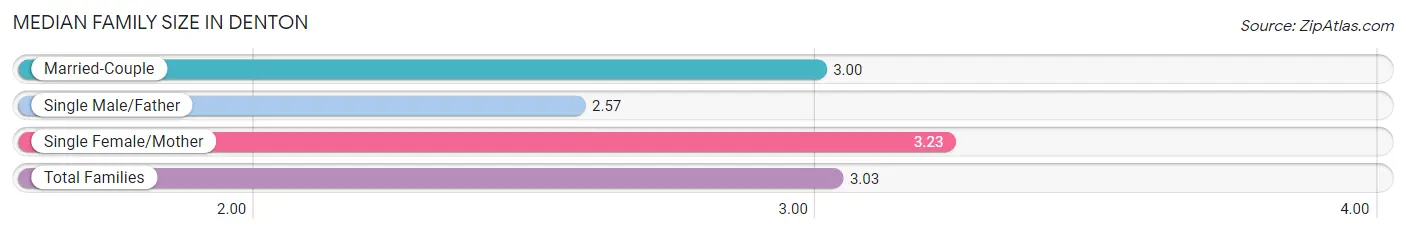
The median family size in Denton is 3.03 persons per family, with single female/mother families (57 | 17.6%) accounting for the largest median family size of 3.23 persons per family. On the other hand, single male/father families (7 | 2.2%) represent the smallest median family size with 2.57 persons per family.
| Family Type | # Families | Family Size |
| Married-Couple | 259 (80.2%) | 3.00 |
| Single Male/Father | 7 (2.2%) | 2.57 |
| Single Female/Mother | 57 (17.6%) | 3.23 |
| Total Families | 323 (100.0%) | 3.03 |
Median Household Size in Denton
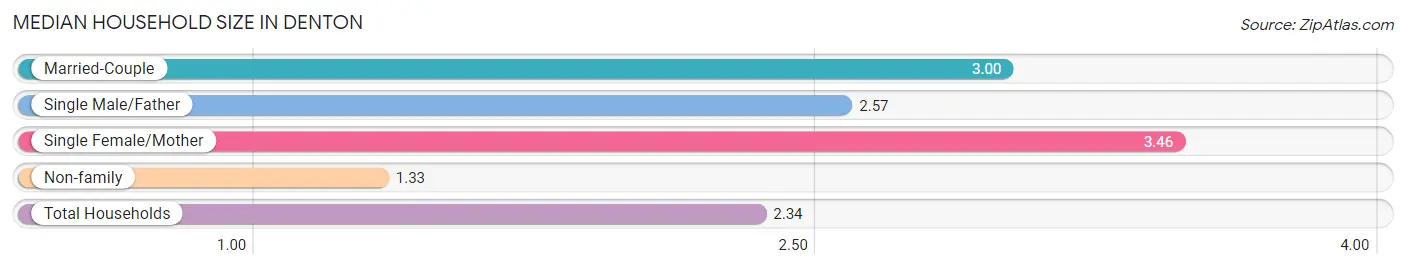
The median household size in Denton is 2.34 persons per household, with single female/mother households (57 | 10.2%) accounting for the largest median household size of 3.46 persons per household. non-family households (236 | 42.2%) represent the smallest median household size with 1.33 persons per household.
| Household Type | # Households | Household Size |
| Married-Couple | 259 (46.3%) | 3.00 |
| Single Male/Father | 7 (1.3%) | 2.57 |
| Single Female/Mother | 57 (10.2%) | 3.46 |
| Non-family | 236 (42.2%) | 1.33 |
| Total Households | 559 (100.0%) | 2.34 |
Household Size by Marriage Status in Denton
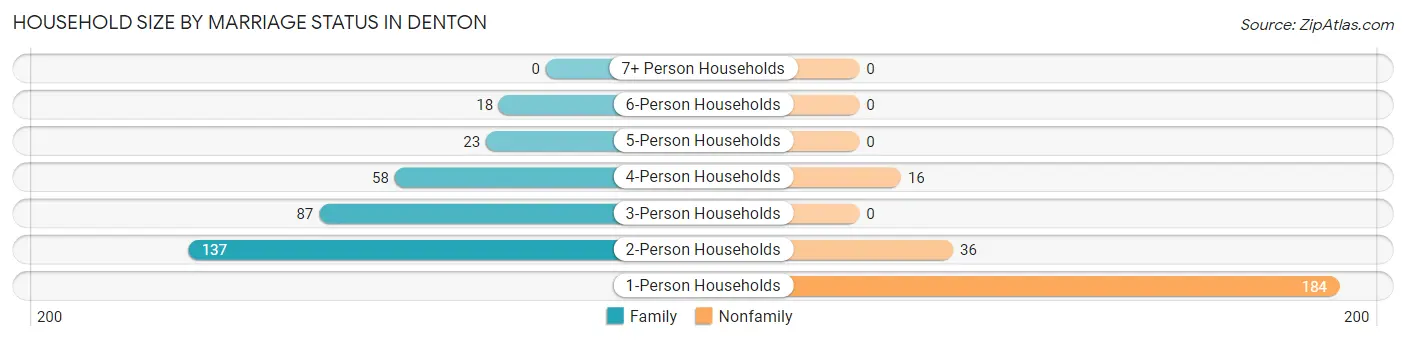
Out of a total of 559 households in Denton, 323 (57.8%) are family households, while 236 (42.2%) are nonfamily households. The most numerous type of family households are 2-person households, comprising 137, and the most common type of nonfamily households are 1-person households, comprising 184.
| Household Size | Family Households | Nonfamily Households |
| 1-Person Households | - | 184 (32.9%) |
| 2-Person Households | 137 (24.5%) | 36 (6.4%) |
| 3-Person Households | 87 (15.6%) | 0 (0.0%) |
| 4-Person Households | 58 (10.4%) | 16 (2.9%) |
| 5-Person Households | 23 (4.1%) | 0 (0.0%) |
| 6-Person Households | 18 (3.2%) | 0 (0.0%) |
| 7+ Person Households | 0 (0.0%) | 0 (0.0%) |
| Total | 323 (57.8%) | 236 (42.2%) |
Female Fertility in Denton
Fertility by Age in Denton
Average fertility rate in Denton is 76.0 births per 1,000 women. Women in the age bracket of 20 to 34 years have the highest fertility rate with 164.0 births per 1,000 women. Women in the age bracket of 20 to 34 years acount for 100.0% of all women with births.
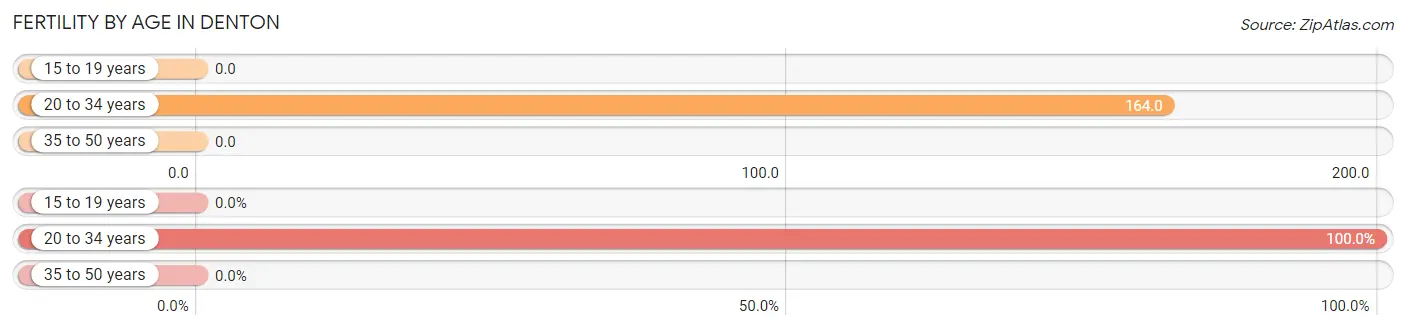
| Age Bracket | Women with Births | Births / 1,000 Women |
| 15 to 19 years | 0 (0.0%) | 0.0 |
| 20 to 34 years | 22 (100.0%) | 164.0 |
| 35 to 50 years | 0 (0.0%) | 0.0 |
| Total | 22 (100.0%) | 76.0 |
Fertility by Age by Marriage Status in Denton
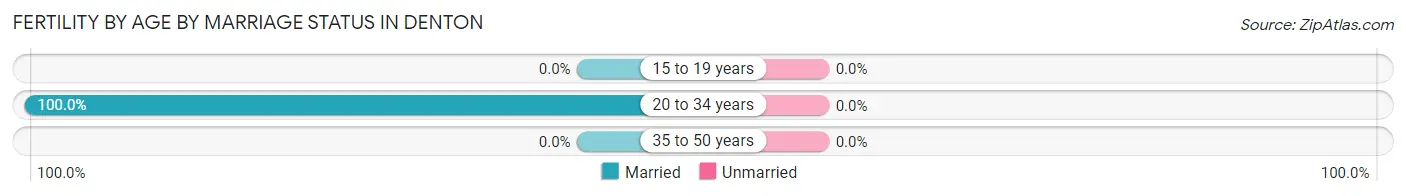
| Age Bracket | Married | Unmarried |
| 15 to 19 years | 0 (0.0%) | 0 (0.0%) |
| 20 to 34 years | 22 (100.0%) | 0 (0.0%) |
| 35 to 50 years | 0 (0.0%) | 0 (0.0%) |
| Total | 22 (100.0%) | 0 (0.0%) |
Fertility by Education in Denton
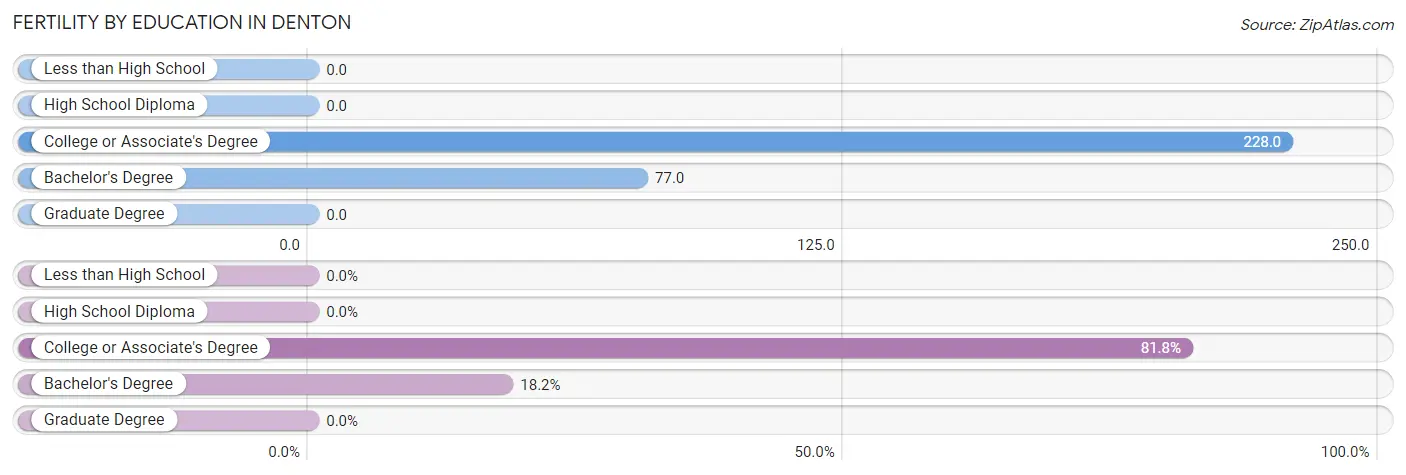
| Educational Attainment | Women with Births | Births / 1,000 Women |
| Less than High School | 0 (0.0%) | 0.0 |
| High School Diploma | 0 (0.0%) | 0.0 |
| College or Associate's Degree | 18 (81.8%) | 228.0 |
| Bachelor's Degree | 4 (18.2%) | 77.0 |
| Graduate Degree | 0 (0.0%) | 0.0 |
| Total | 22 (100.0%) | 76.0 |
Fertility by Education by Marriage Status in Denton
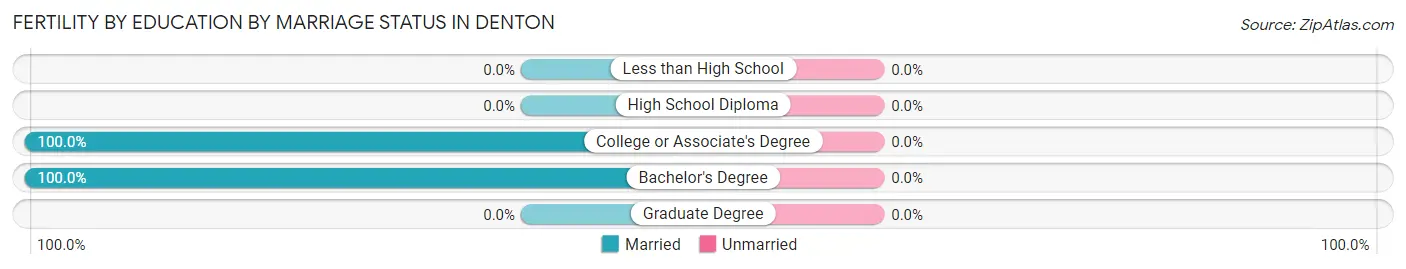
| Educational Attainment | Married | Unmarried |
| Less than High School | 0 (0.0%) | 0 (0.0%) |
| High School Diploma | 0 (0.0%) | 0 (0.0%) |
| College or Associate's Degree | 18 (100.0%) | 0 (0.0%) |
| Bachelor's Degree | 4 (100.0%) | 0 (0.0%) |
| Graduate Degree | 0 (0.0%) | 0 (0.0%) |
| Total | 22 (100.0%) | 0 (0.0%) |
Income in Denton
Income Overview in Denton
Per Capita Income in Denton is $22,987, while median incomes of families and households are $53,125 and $44,539 respectively.
| Characteristic | Number | Measure |
| Per Capita Income | 1,307 | $22,987 |
| Median Family Income | 323 | $53,125 |
| Mean Family Income | 323 | $63,178 |
| Median Household Income | 559 | $44,539 |
| Mean Household Income | 559 | $53,336 |
| Income Deficit | 323 | $0 |
| Wage / Income Gap (%) | 1,307 | 34.62% |
| Wage / Income Gap ($) | 1,307 | 65.38¢ per $1 |
| Gini / Inequality Index | 1,307 | 0.39 |
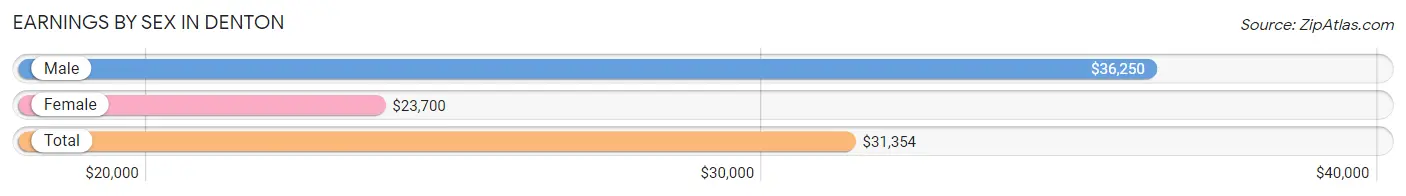
Earnings by Sex in Denton
Average Earnings in Denton are $31,354, $36,250 for men and $23,700 for women, a difference of 34.6%.
| Sex | Number | Average Earnings |
| Male | 339 (50.8%) | $36,250 |
| Female | 328 (49.2%) | $23,700 |
| Total | 667 (100.0%) | $31,354 |
Earnings by Sex by Income Bracket in Denton
The most common earnings brackets in Denton are $35,000 to $39,999 for men (59 | 17.4%) and $17,500 to $19,999 for women (43 | 13.1%).
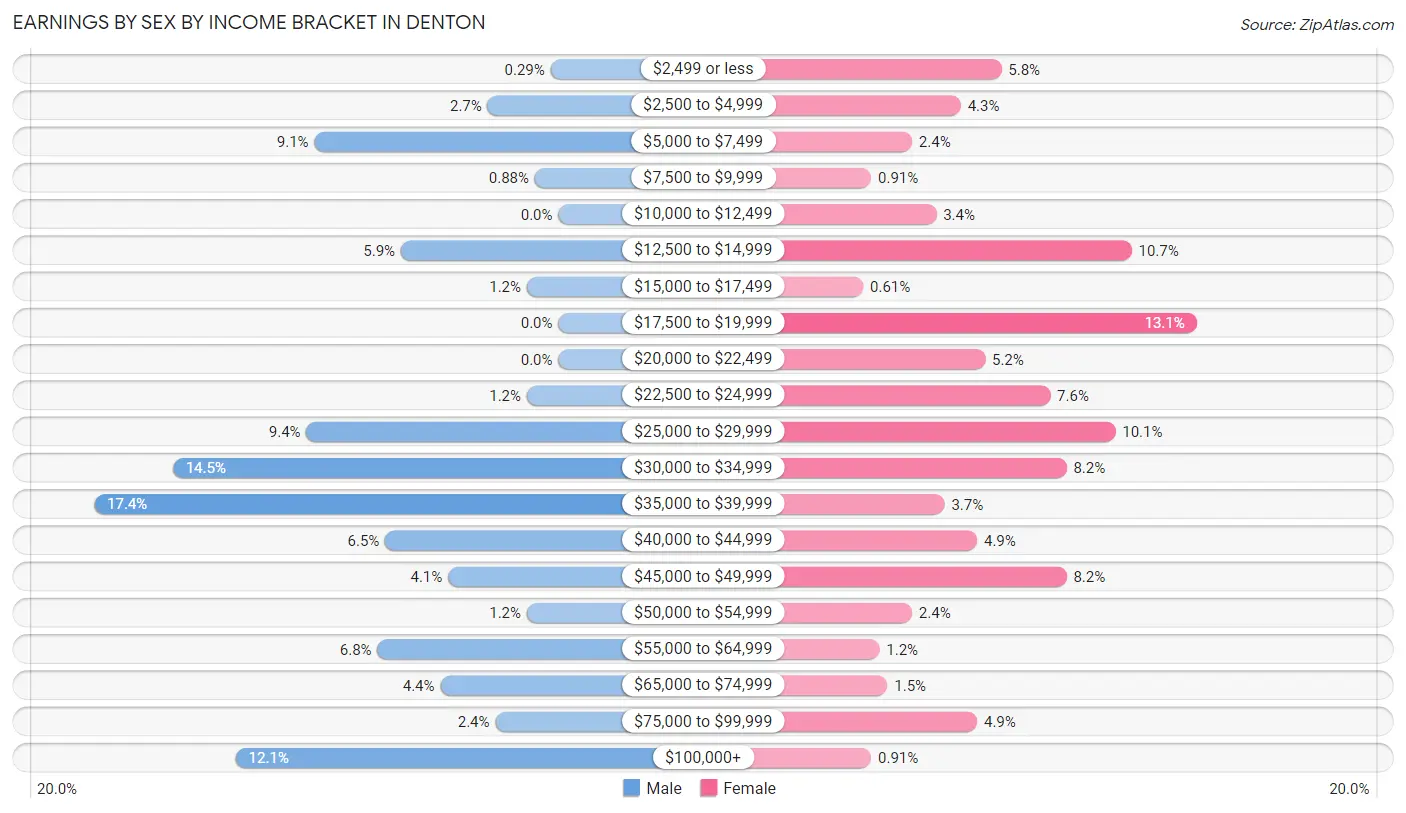
| Income | Male | Female |
| $2,499 or less | 1 (0.3%) | 19 (5.8%) |
| $2,500 to $4,999 | 9 (2.6%) | 14 (4.3%) |
| $5,000 to $7,499 | 31 (9.1%) | 8 (2.4%) |
| $7,500 to $9,999 | 3 (0.9%) | 3 (0.9%) |
| $10,000 to $12,499 | 0 (0.0%) | 11 (3.4%) |
| $12,500 to $14,999 | 20 (5.9%) | 35 (10.7%) |
| $15,000 to $17,499 | 4 (1.2%) | 2 (0.6%) |
| $17,500 to $19,999 | 0 (0.0%) | 43 (13.1%) |
| $20,000 to $22,499 | 0 (0.0%) | 17 (5.2%) |
| $22,500 to $24,999 | 4 (1.2%) | 25 (7.6%) |
| $25,000 to $29,999 | 32 (9.4%) | 33 (10.1%) |
| $30,000 to $34,999 | 49 (14.4%) | 27 (8.2%) |
| $35,000 to $39,999 | 59 (17.4%) | 12 (3.7%) |
| $40,000 to $44,999 | 22 (6.5%) | 16 (4.9%) |
| $45,000 to $49,999 | 14 (4.1%) | 27 (8.2%) |
| $50,000 to $54,999 | 4 (1.2%) | 8 (2.4%) |
| $55,000 to $64,999 | 23 (6.8%) | 4 (1.2%) |
| $65,000 to $74,999 | 15 (4.4%) | 5 (1.5%) |
| $75,000 to $99,999 | 8 (2.4%) | 16 (4.9%) |
| $100,000+ | 41 (12.1%) | 3 (0.9%) |
| Total | 339 (100.0%) | 328 (100.0%) |
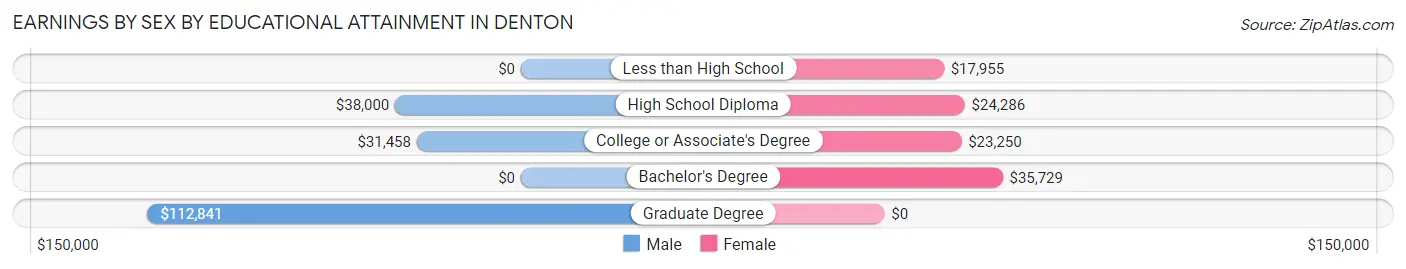
Earnings by Sex by Educational Attainment in Denton
Average earnings in Denton are $36,780 for men and $27,404 for women, a difference of 25.5%. Men with an educational attainment of graduate degree enjoy the highest average annual earnings of $112,841, while those with college or associate's degree education earn the least with $31,458. Women with an educational attainment of bachelor's degree earn the most with the average annual earnings of $35,729, while those with less than high school education have the smallest earnings of $17,955.
| Educational Attainment | Male Income | Female Income |
| Less than High School | - | - |
| High School Diploma | $38,000 | $24,286 |
| College or Associate's Degree | $31,458 | $23,250 |
| Bachelor's Degree | - | - |
| Graduate Degree | $112,841 | $0 |
| Total | $36,780 | $27,404 |
Family Income in Denton
Family Income Brackets in Denton
According to the Denton family income data, there are 76 families falling into the $35,000 to $49,999 income range, which is the most common income bracket and makes up 23.5% of all families.
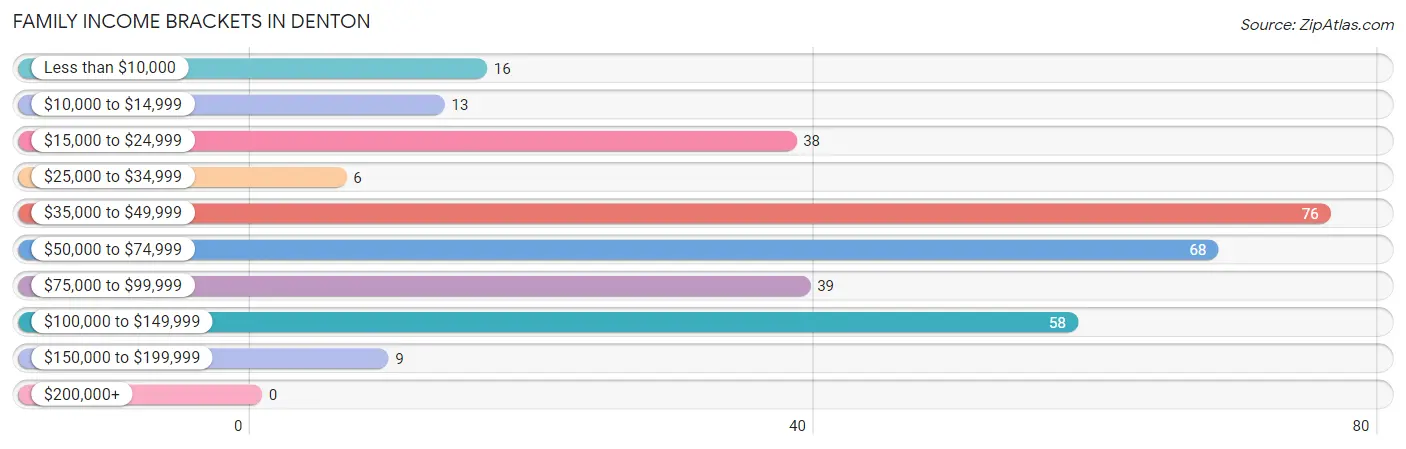
| Income Bracket | # Families | % Families |
| Less than $10,000 | 16 | 5.0% |
| $10,000 to $14,999 | 13 | 4.0% |
| $15,000 to $24,999 | 38 | 11.8% |
| $25,000 to $34,999 | 6 | 1.9% |
| $35,000 to $49,999 | 76 | 23.5% |
| $50,000 to $74,999 | 68 | 21.1% |
| $75,000 to $99,999 | 39 | 12.1% |
| $100,000 to $149,999 | 58 | 18.0% |
| $150,000 to $199,999 | 9 | 2.8% |
| $200,000+ | 0 | 0.0% |
Family Income by Famaliy Size in Denton
5-person families (17 | 5.3%) account for the highest median family income in Denton with $113,068 per family, while 2-person families (137 | 42.4%) have the highest median income of $24,532 per family member.
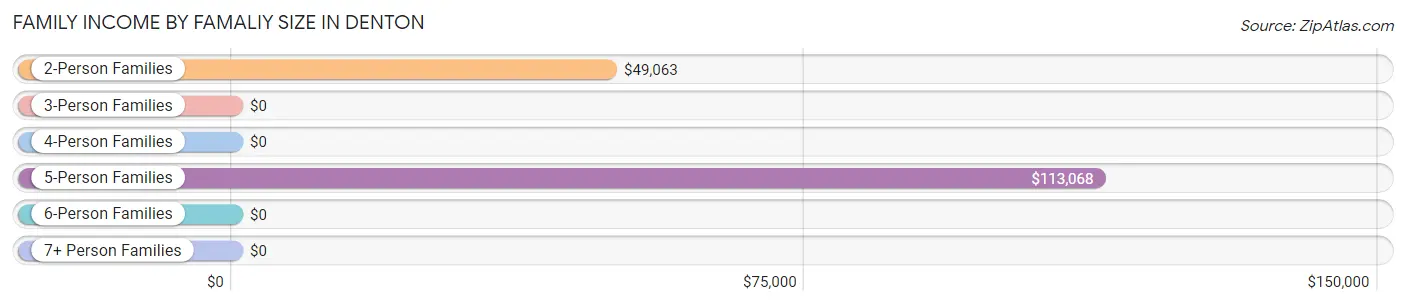
| Income Bracket | # Families | Median Income |
| 2-Person Families | 137 (42.4%) | $49,063 |
| 3-Person Families | 93 (28.8%) | $0 |
| 4-Person Families | 58 (18.0%) | $0 |
| 5-Person Families | 17 (5.3%) | $113,068 |
| 6-Person Families | 18 (5.6%) | $0 |
| 7+ Person Families | 0 (0.0%) | $0 |
| Total | 323 (100.0%) | $53,125 |
Family Income by Number of Earners in Denton
The median family income in Denton is $53,125, with families comprising 2 earners (115) having the highest median family income of $90,313, while families with no earners (62) have the lowest median family income of $21,042, accounting for 35.6% and 19.2% of families, respectively.
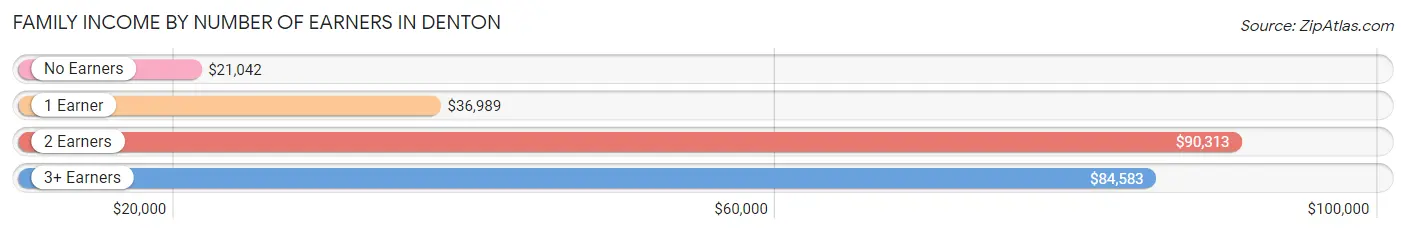
| Number of Earners | # Families | Median Income |
| No Earners | 62 (19.2%) | $21,042 |
| 1 Earner | 99 (30.6%) | $36,989 |
| 2 Earners | 115 (35.6%) | $90,313 |
| 3+ Earners | 47 (14.5%) | $84,583 |
| Total | 323 (100.0%) | $53,125 |
Household Income in Denton
Household Income Brackets in Denton
With 121 households falling in the category, the $35,000 to $49,999 income range is the most frequent in Denton, accounting for 21.6% of all households.
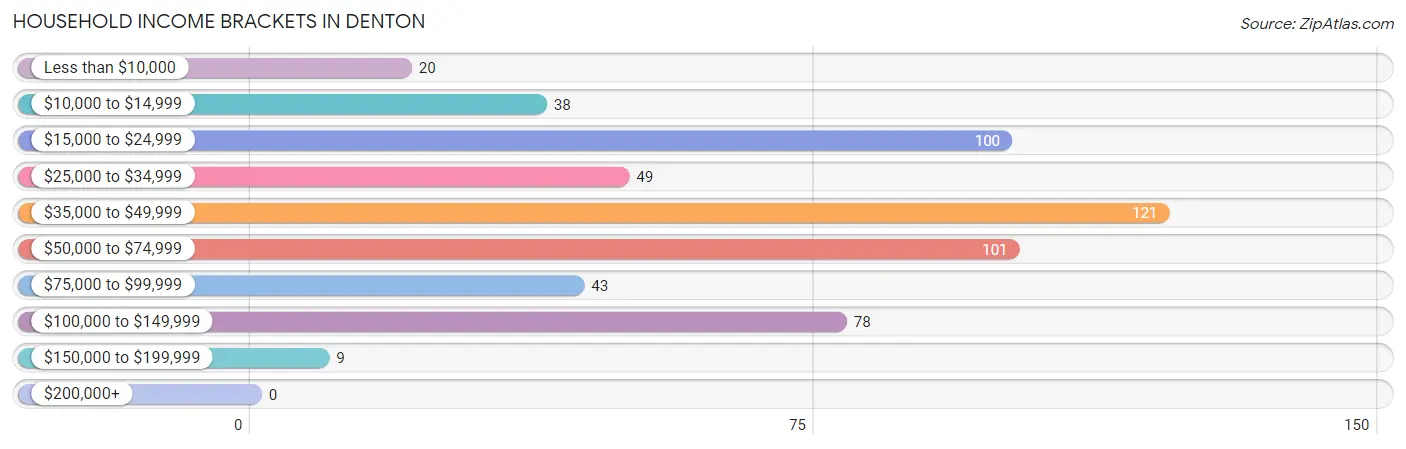
| Income Bracket | # Households | % Households |
| Less than $10,000 | 20 | 3.6% |
| $10,000 to $14,999 | 38 | 6.8% |
| $15,000 to $24,999 | 100 | 17.9% |
| $25,000 to $34,999 | 49 | 8.8% |
| $35,000 to $49,999 | 121 | 21.6% |
| $50,000 to $74,999 | 101 | 18.1% |
| $75,000 to $99,999 | 43 | 7.7% |
| $100,000 to $149,999 | 78 | 14.0% |
| $150,000 to $199,999 | 9 | 1.6% |
| $200,000+ | 0 | 0.0% |
Household Income by Householder Age in Denton
The median household income in Denton is $44,539, with the highest median household income of $58,214 found in the 25 to 44 years age bracket for the primary householder. A total of 142 households (25.4%) fall into this category. Meanwhile, the 65+ years age bracket for the primary householder has the lowest median household income of $33,750, with 125 households (22.4%) in this group.
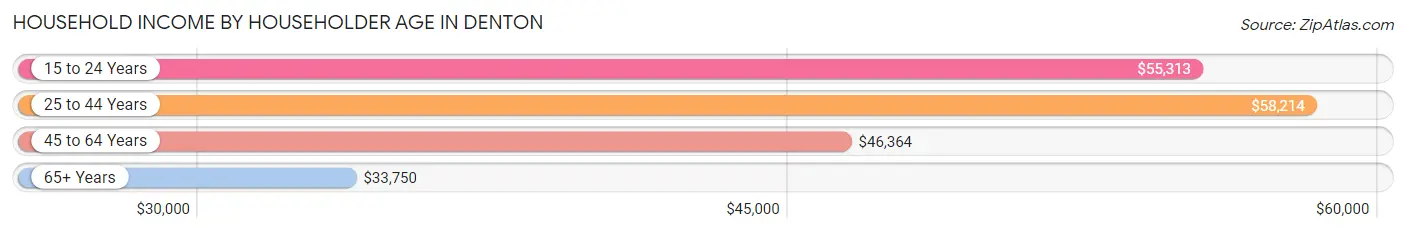
| Income Bracket | # Households | Median Income |
| 15 to 24 Years | 58 (10.4%) | $55,313 |
| 25 to 44 Years | 142 (25.4%) | $58,214 |
| 45 to 64 Years | 234 (41.9%) | $46,364 |
| 65+ Years | 125 (22.4%) | $33,750 |
| Total | 559 (100.0%) | $44,539 |
Poverty in Denton
Income Below Poverty by Sex and Age in Denton
With 17.3% poverty level for males and 15.9% for females among the residents of Denton, under 5 year old males and under 5 year old females are the most vulnerable to poverty, with 33 males (49.2%) and 9 females (47.4%) in their respective age groups living below the poverty level.
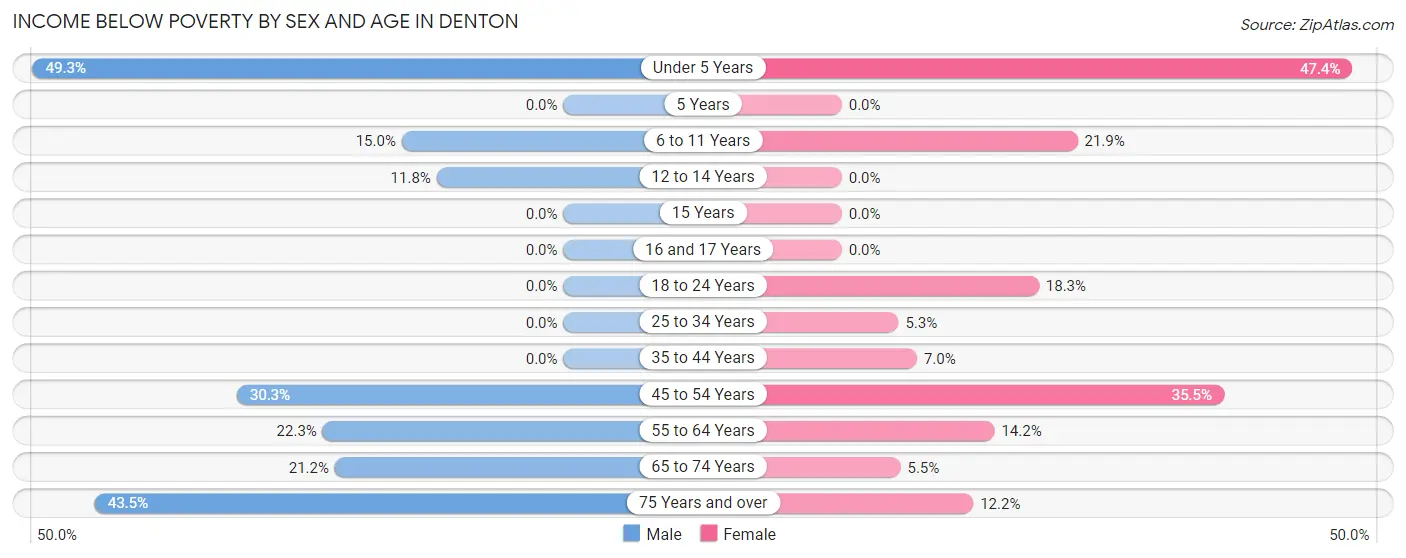
| Age Bracket | Male | Female |
| Under 5 Years | 33 (49.2%) | 9 (47.4%) |
| 5 Years | 0 (0.0%) | 0 (0.0%) |
| 6 to 11 Years | 3 (15.0%) | 14 (21.9%) |
| 12 to 14 Years | 4 (11.8%) | 0 (0.0%) |
| 15 Years | 0 (0.0%) | 0 (0.0%) |
| 16 and 17 Years | 0 (0.0%) | 0 (0.0%) |
| 18 to 24 Years | 0 (0.0%) | 15 (18.3%) |
| 25 to 34 Years | 0 (0.0%) | 3 (5.3%) |
| 35 to 44 Years | 0 (0.0%) | 3 (7.0%) |
| 45 to 54 Years | 20 (30.3%) | 39 (35.4%) |
| 55 to 64 Years | 21 (22.3%) | 17 (14.2%) |
| 65 to 74 Years | 14 (21.2%) | 3 (5.4%) |
| 75 Years and over | 10 (43.5%) | 5 (12.2%) |
| Total | 105 (17.3%) | 108 (15.9%) |
Income Above Poverty by Sex and Age in Denton
According to the poverty statistics in Denton, males aged 5 years and females aged 12 to 14 years are the age groups that are most secure financially, with 100.0% of males and 100.0% of females in these age groups living above the poverty line.
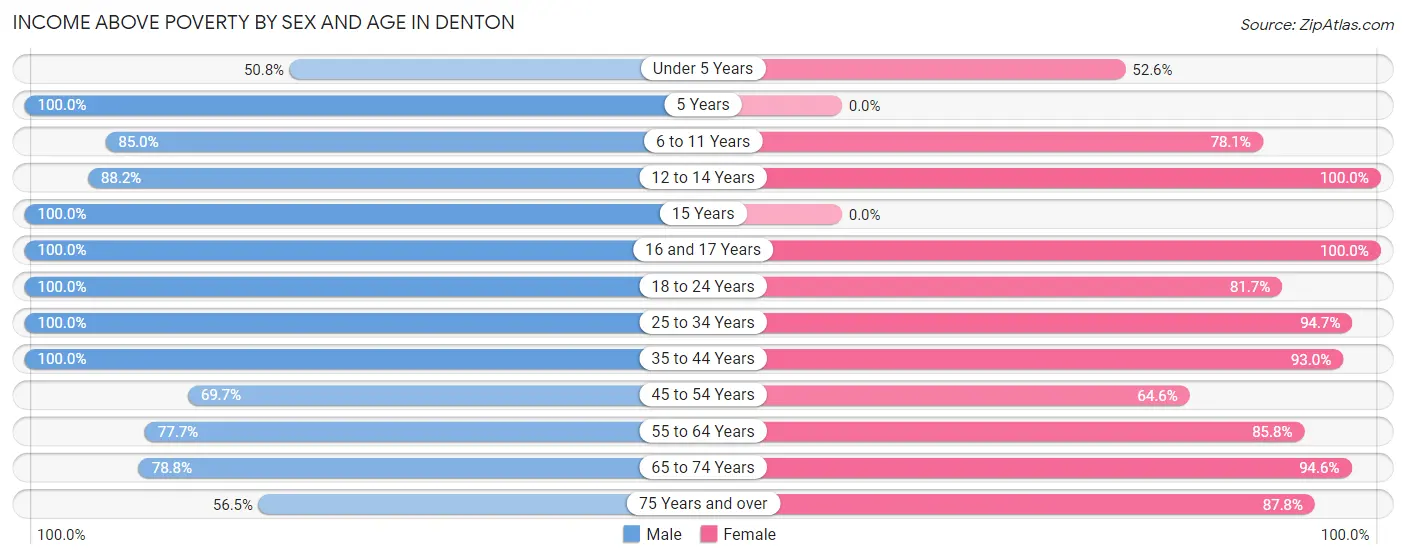
| Age Bracket | Male | Female |
| Under 5 Years | 34 (50.7%) | 10 (52.6%) |
| 5 Years | 3 (100.0%) | 0 (0.0%) |
| 6 to 11 Years | 17 (85.0%) | 50 (78.1%) |
| 12 to 14 Years | 30 (88.2%) | 38 (100.0%) |
| 15 Years | 3 (100.0%) | 0 (0.0%) |
| 16 and 17 Years | 14 (100.0%) | 49 (100.0%) |
| 18 to 24 Years | 52 (100.0%) | 67 (81.7%) |
| 25 to 34 Years | 96 (100.0%) | 54 (94.7%) |
| 35 to 44 Years | 69 (100.0%) | 40 (93.0%) |
| 45 to 54 Years | 46 (69.7%) | 71 (64.5%) |
| 55 to 64 Years | 73 (77.7%) | 103 (85.8%) |
| 65 to 74 Years | 52 (78.8%) | 52 (94.6%) |
| 75 Years and over | 13 (56.5%) | 36 (87.8%) |
| Total | 502 (82.7%) | 570 (84.1%) |
Income Below Poverty Among Married-Couple Families in Denton
The poverty statistics for married-couple families in Denton show that 12.4% or 32 of the total 259 families live below the poverty line. Families with no children have the highest poverty rate of 14.6%, comprising of 20 families. On the other hand, families with 3 or 4 children have the lowest poverty rate of 0.0%, which includes 0 families.
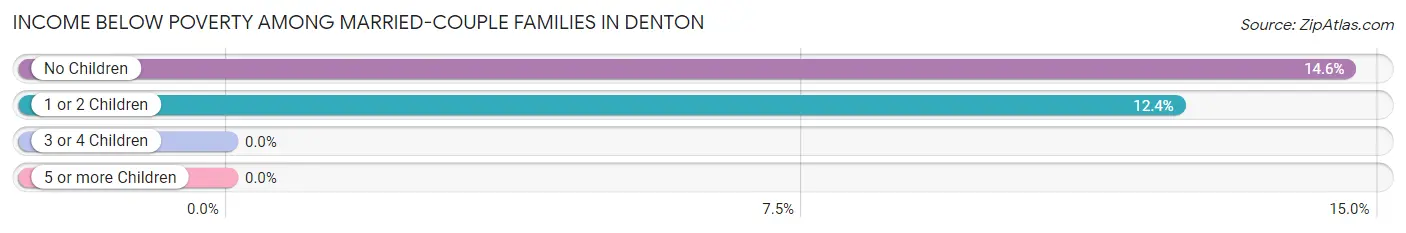
| Children | Above Poverty | Below Poverty |
| No Children | 117 (85.4%) | 20 (14.6%) |
| 1 or 2 Children | 85 (87.6%) | 12 (12.4%) |
| 3 or 4 Children | 25 (100.0%) | 0 (0.0%) |
| 5 or more Children | 0 (0.0%) | 0 (0.0%) |
| Total | 227 (87.6%) | 32 (12.4%) |
Income Below Poverty Among Single-Parent Households in Denton
According to the poverty data in Denton, 57.1% or 4 single-father households and 40.4% or 23 single-mother households are living below the poverty line. Among single-father households, those with 1 or 2 children have the highest poverty rate, with 4 households (57.1%) experiencing poverty. Likewise, among single-mother households, those with 3 or 4 children have the highest poverty rate, with 15 households (100.0%) falling below the poverty line.
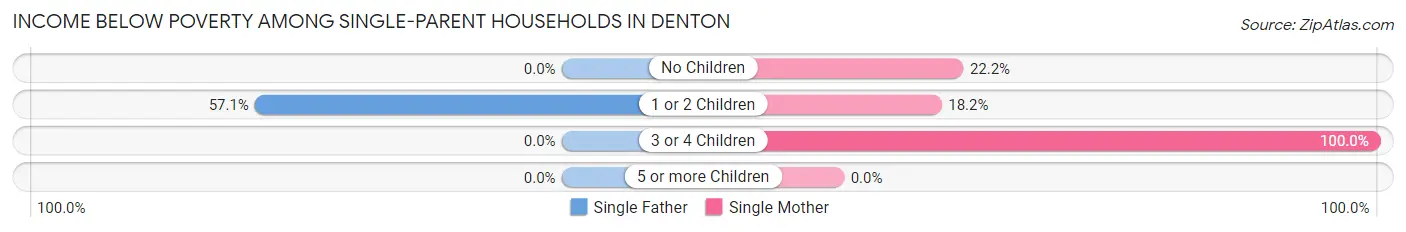
| Children | Single Father | Single Mother |
| No Children | 0 (0.0%) | 2 (22.2%) |
| 1 or 2 Children | 4 (57.1%) | 6 (18.2%) |
| 3 or 4 Children | 0 (0.0%) | 15 (100.0%) |
| 5 or more Children | 0 (0.0%) | 0 (0.0%) |
| Total | 4 (57.1%) | 23 (40.4%) |
Income Below Poverty Among Married-Couple vs Single-Parent Households in Denton
The poverty data for Denton shows that 32 of the married-couple family households (12.4%) and 27 of the single-parent households (42.2%) are living below the poverty level. Within the married-couple family households, those with no children have the highest poverty rate, with 20 households (14.6%) falling below the poverty line. Among the single-parent households, those with 3 or 4 children have the highest poverty rate, with 15 household (100.0%) living below poverty.
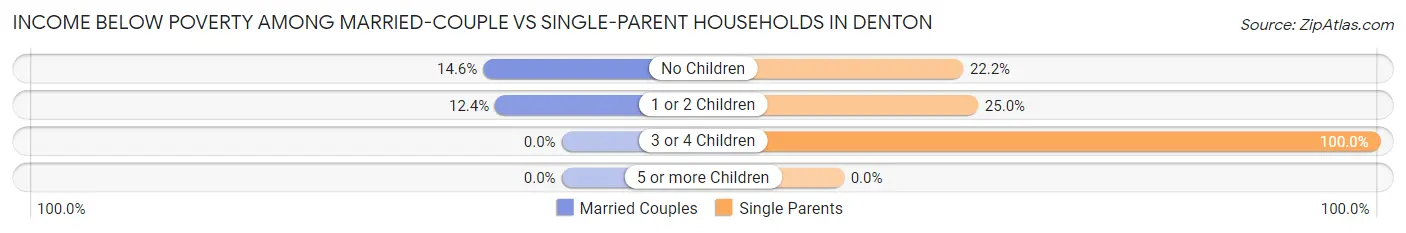
| Children | Married-Couple Families | Single-Parent Households |
| No Children | 20 (14.6%) | 2 (22.2%) |
| 1 or 2 Children | 12 (12.4%) | 10 (25.0%) |
| 3 or 4 Children | 0 (0.0%) | 15 (100.0%) |
| 5 or more Children | 0 (0.0%) | 0 (0.0%) |
| Total | 32 (12.4%) | 27 (42.2%) |
Employment Characteristics in Denton
Employment by Class of Employer in Denton
Among the 585 employed individuals in Denton, private company employees (442 | 75.6%), not-for-profit organizations (69 | 11.8%), and state government employees (33 | 5.6%) make up the most common classes of employment.
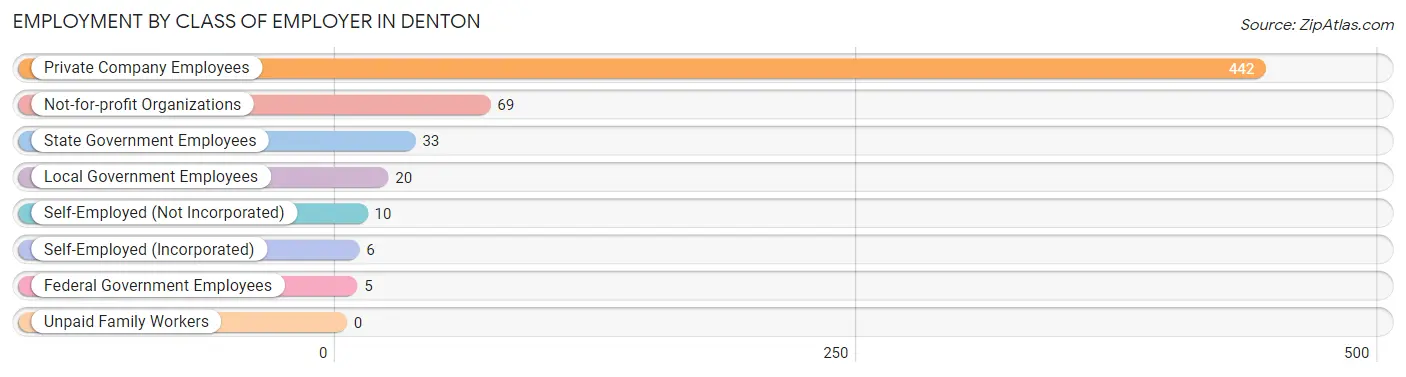
| Employer Class | # Employees | % Employees |
| Private Company Employees | 442 | 75.6% |
| Self-Employed (Incorporated) | 6 | 1.0% |
| Self-Employed (Not Incorporated) | 10 | 1.7% |
| Not-for-profit Organizations | 69 | 11.8% |
| Local Government Employees | 20 | 3.4% |
| State Government Employees | 33 | 5.6% |
| Federal Government Employees | 5 | 0.9% |
| Unpaid Family Workers | 0 | 0.0% |
| Total | 585 | 100.0% |
Employment Status by Age in Denton
According to the labor force statistics for Denton, out of the total population over 16 years of age (1,037), 60.8% or 630 individuals are in the labor force, with 6.8% or 43 of them unemployed. The age group with the highest labor force participation rate is 25 to 29 years, with 100.0% or 49 individuals in the labor force. Within the labor force, the 25 to 29 years age range has the highest percentage of unemployed individuals, with 44.9% or 22 of them being unemployed.
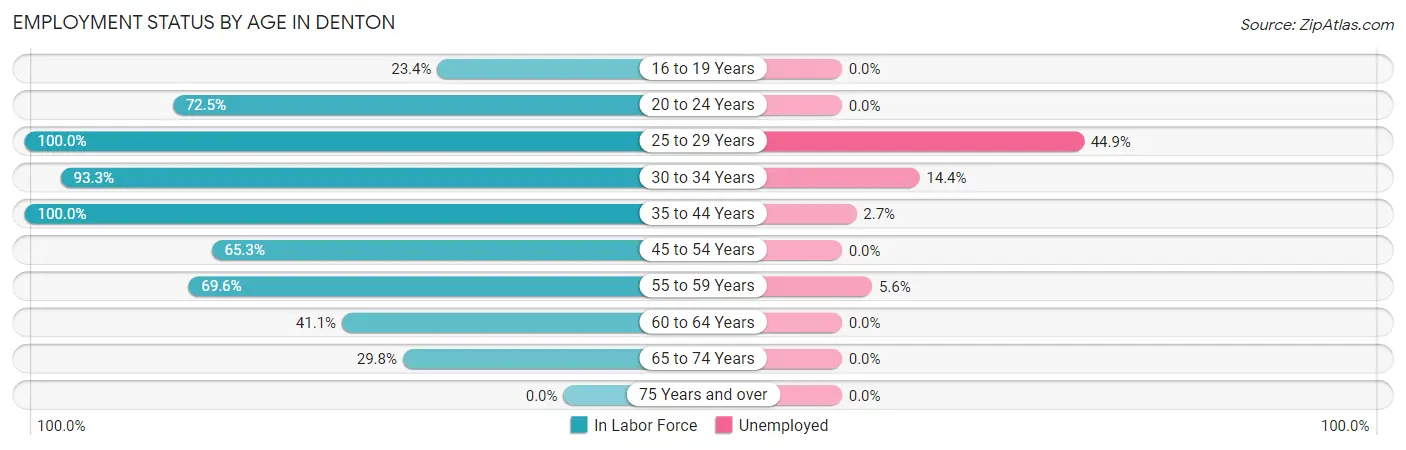
| Age Bracket | In Labor Force | Unemployed |
| 16 to 19 Years | 18 (23.4%) | 0 (0.0%) |
| 20 to 24 Years | 87 (72.5%) | 0 (0.0%) |
| 25 to 29 Years | 49 (100.0%) | 22 (44.9%) |
| 30 to 34 Years | 97 (93.3%) | 14 (14.4%) |
| 35 to 44 Years | 112 (100.0%) | 3 (2.7%) |
| 45 to 54 Years | 115 (65.3%) | 0 (0.0%) |
| 55 to 59 Years | 71 (69.6%) | 4 (5.6%) |
| 60 to 64 Years | 46 (41.1%) | 0 (0.0%) |
| 65 to 74 Years | 36 (29.8%) | 0 (0.0%) |
| 75 Years and over | 0 (0.0%) | 0 (0.0%) |
| Total | 630 (60.8%) | 43 (6.8%) |
Employment Status by Educational Attainment in Denton
According to labor force statistics for Denton, 74.8% of individuals (490) out of the total population between 25 and 64 years of age (655) are in the labor force, with 8.8% or 43 of them being unemployed. The group with the highest labor force participation rate are those with the educational attainment of bachelor's degree or higher, with 94.1% or 111 individuals in the labor force. Within the labor force, individuals with less than high school education have the highest percentage of unemployment, with 32.4% or 22 of them being unemployed.
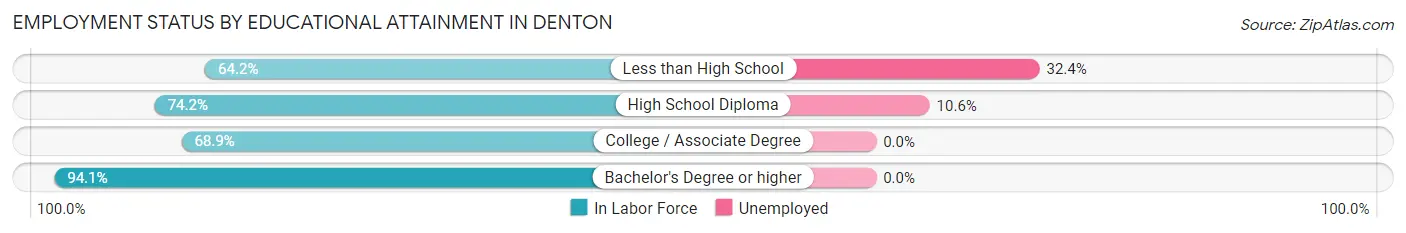
| Educational Attainment | In Labor Force | Unemployed |
| Less than High School | 68 (64.2%) | 34 (32.4%) |
| High School Diploma | 198 (74.2%) | 28 (10.6%) |
| College / Associate Degree | 113 (68.9%) | 0 (0.0%) |
| Bachelor's Degree or higher | 111 (94.1%) | 0 (0.0%) |
| Total | 490 (74.8%) | 58 (8.8%) |
Employment Occupations by Sex in Denton
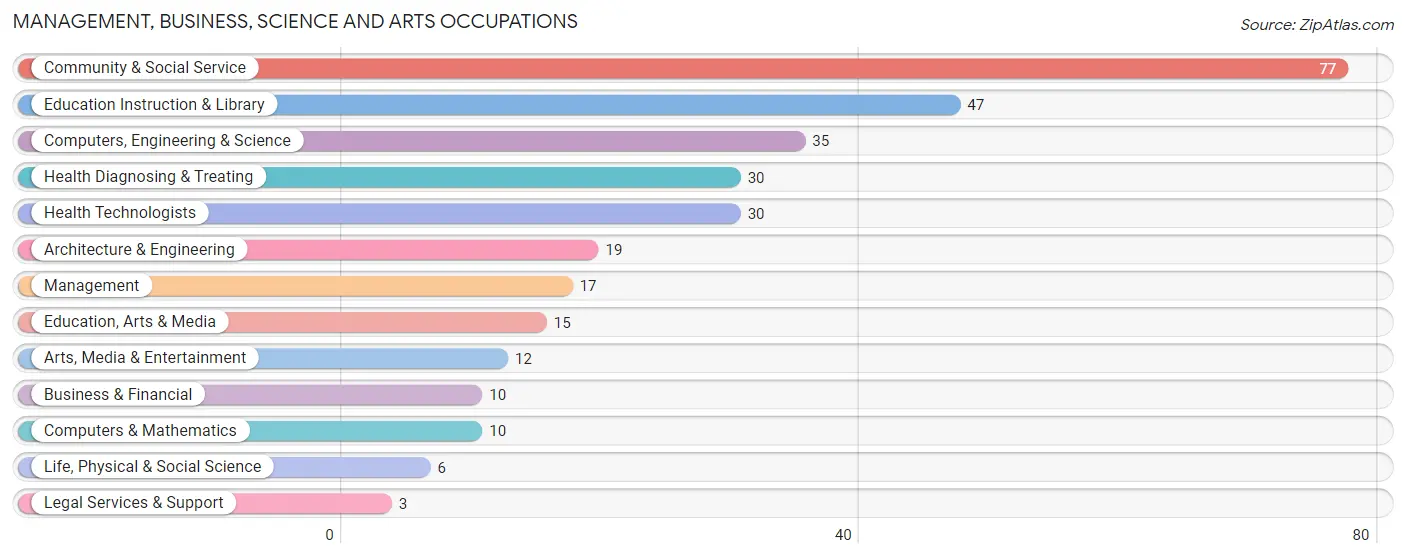
Management, Business, Science and Arts Occupations
The most common Management, Business, Science and Arts occupations in Denton are Community & Social Service (77 | 13.1%), Education Instruction & Library (47 | 8.0%), Computers, Engineering & Science (35 | 5.9%), Health Diagnosing & Treating (30 | 5.1%), and Health Technologists (30 | 5.1%).
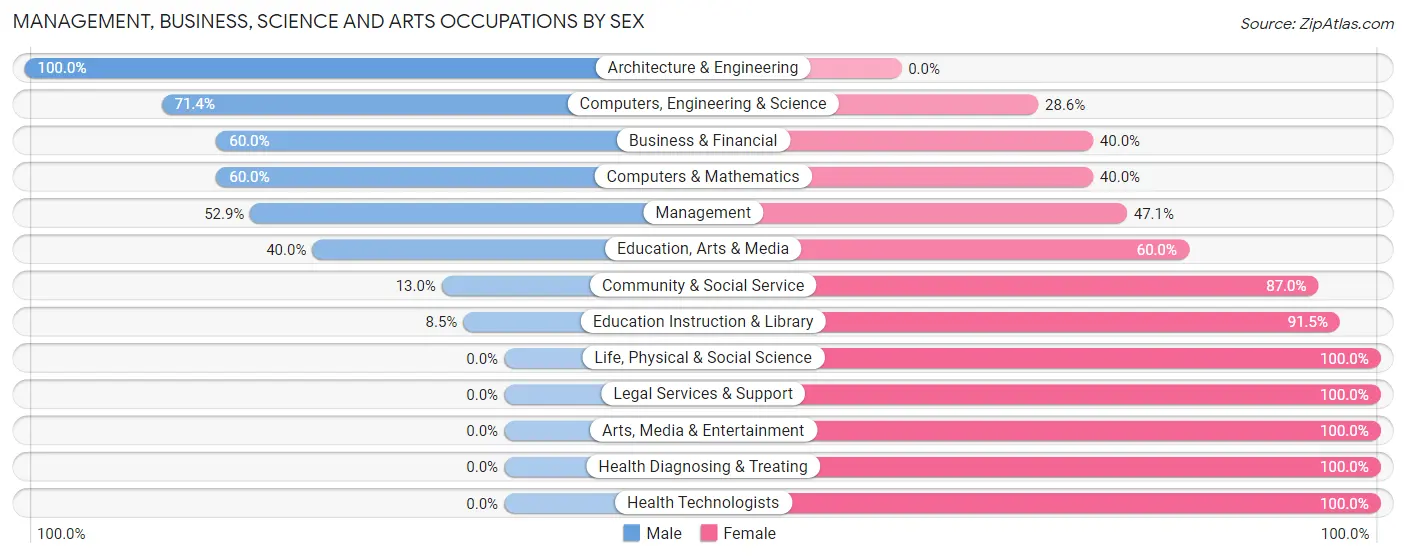
Management, Business, Science and Arts Occupations by Sex
Within the Management, Business, Science and Arts occupations in Denton, the most male-oriented occupations are Architecture & Engineering (100.0%), Computers, Engineering & Science (71.4%), and Business & Financial (60.0%), while the most female-oriented occupations are Life, Physical & Social Science (100.0%), Legal Services & Support (100.0%), and Arts, Media & Entertainment (100.0%).
| Occupation | Male | Female |
| Management | 9 (52.9%) | 8 (47.1%) |
| Business & Financial | 6 (60.0%) | 4 (40.0%) |
| Computers, Engineering & Science | 25 (71.4%) | 10 (28.6%) |
| Computers & Mathematics | 6 (60.0%) | 4 (40.0%) |
| Architecture & Engineering | 19 (100.0%) | 0 (0.0%) |
| Life, Physical & Social Science | 0 (0.0%) | 6 (100.0%) |
| Community & Social Service | 10 (13.0%) | 67 (87.0%) |
| Education, Arts & Media | 6 (40.0%) | 9 (60.0%) |
| Legal Services & Support | 0 (0.0%) | 3 (100.0%) |
| Education Instruction & Library | 4 (8.5%) | 43 (91.5%) |
| Arts, Media & Entertainment | 0 (0.0%) | 12 (100.0%) |
| Health Diagnosing & Treating | 0 (0.0%) | 30 (100.0%) |
| Health Technologists | 0 (0.0%) | 30 (100.0%) |
| Total (Category) | 50 (29.6%) | 119 (70.4%) |
| Total (Overall) | 295 (50.2%) | 293 (49.8%) |
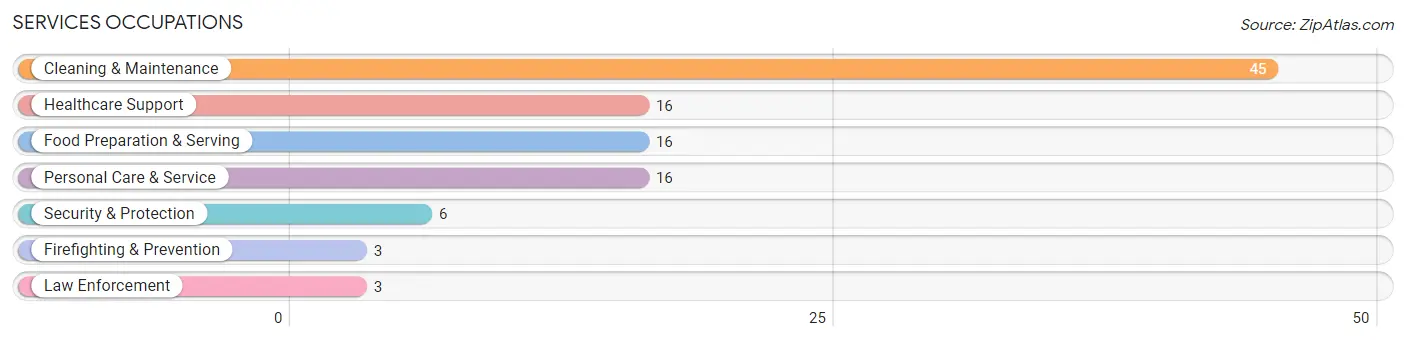
Services Occupations
The most common Services occupations in Denton are Cleaning & Maintenance (45 | 7.6%), Healthcare Support (16 | 2.7%), Food Preparation & Serving (16 | 2.7%), Personal Care & Service (16 | 2.7%), and Security & Protection (6 | 1.0%).
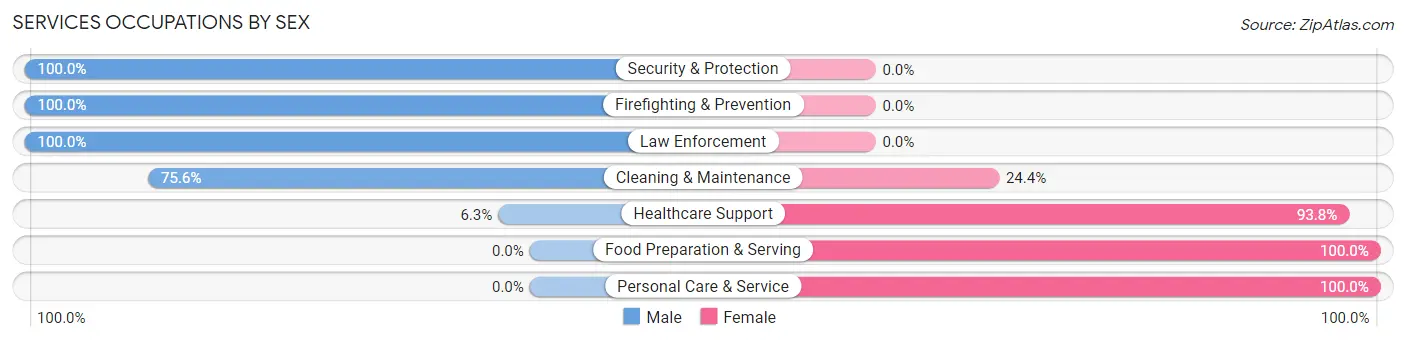
Services Occupations by Sex
Within the Services occupations in Denton, the most male-oriented occupations are Security & Protection (100.0%), Firefighting & Prevention (100.0%), and Law Enforcement (100.0%), while the most female-oriented occupations are Food Preparation & Serving (100.0%), Personal Care & Service (100.0%), and Healthcare Support (93.8%).
| Occupation | Male | Female |
| Healthcare Support | 1 (6.2%) | 15 (93.8%) |
| Security & Protection | 6 (100.0%) | 0 (0.0%) |
| Firefighting & Prevention | 3 (100.0%) | 0 (0.0%) |
| Law Enforcement | 3 (100.0%) | 0 (0.0%) |
| Food Preparation & Serving | 0 (0.0%) | 16 (100.0%) |
| Cleaning & Maintenance | 34 (75.6%) | 11 (24.4%) |
| Personal Care & Service | 0 (0.0%) | 16 (100.0%) |
| Total (Category) | 41 (41.4%) | 58 (58.6%) |
| Total (Overall) | 295 (50.2%) | 293 (49.8%) |
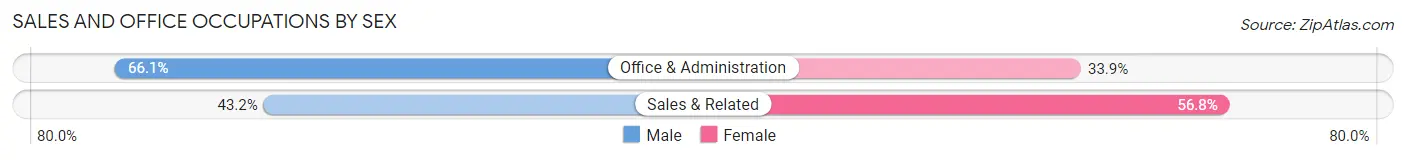
Sales and Office Occupations
The most common Sales and Office occupations in Denton are Office & Administration (56 | 9.5%), and Sales & Related (37 | 6.3%).
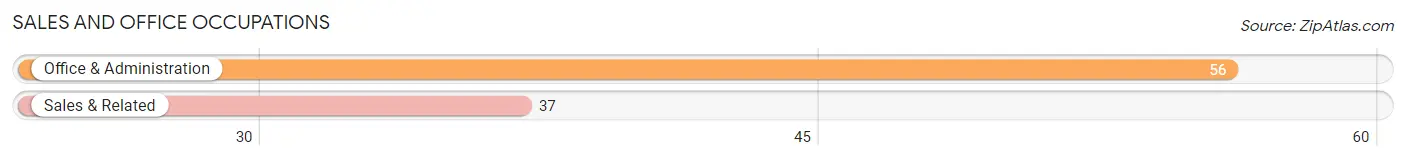
Sales and Office Occupations by Sex
| Occupation | Male | Female |
| Sales & Related | 16 (43.2%) | 21 (56.8%) |
| Office & Administration | 37 (66.1%) | 19 (33.9%) |
| Total (Category) | 53 (57.0%) | 40 (43.0%) |
| Total (Overall) | 295 (50.2%) | 293 (49.8%) |
Natural Resources, Construction and Maintenance Occupations
The most common Natural Resources, Construction and Maintenance occupations in Denton are Installation, Maintenance & Repair (50 | 8.5%), and Construction & Extraction (30 | 5.1%).
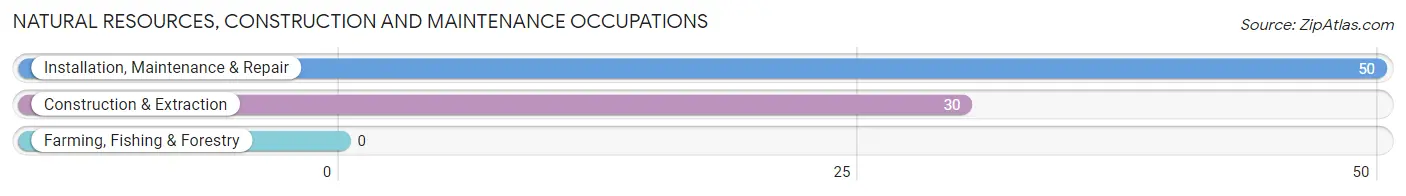
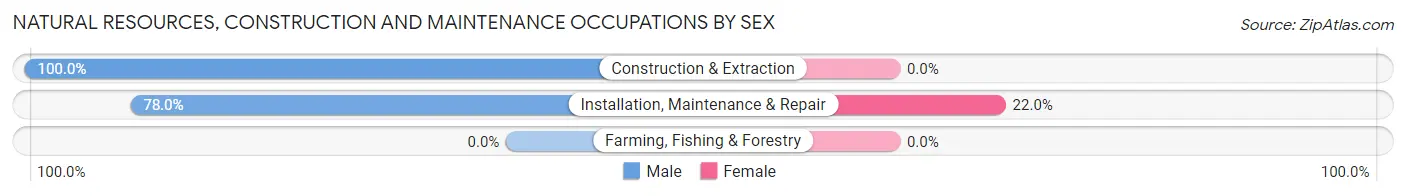
Natural Resources, Construction and Maintenance Occupations by Sex
| Occupation | Male | Female |
| Farming, Fishing & Forestry | 0 (0.0%) | 0 (0.0%) |
| Construction & Extraction | 30 (100.0%) | 0 (0.0%) |
| Installation, Maintenance & Repair | 39 (78.0%) | 11 (22.0%) |
| Total (Category) | 69 (86.3%) | 11 (13.8%) |
| Total (Overall) | 295 (50.2%) | 293 (49.8%) |
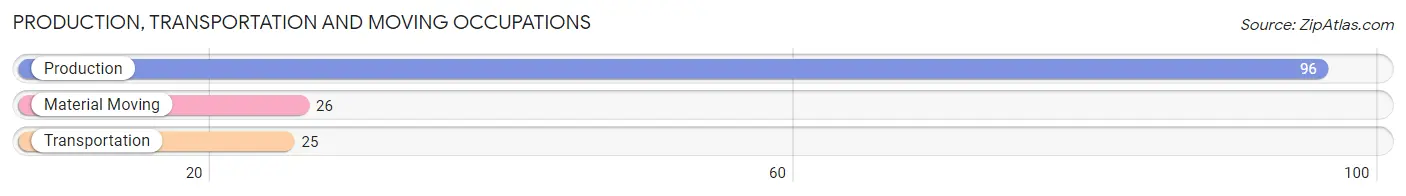
Production, Transportation and Moving Occupations
The most common Production, Transportation and Moving occupations in Denton are Production (96 | 16.3%), Material Moving (26 | 4.4%), and Transportation (25 | 4.3%).
Production, Transportation and Moving Occupations by Sex
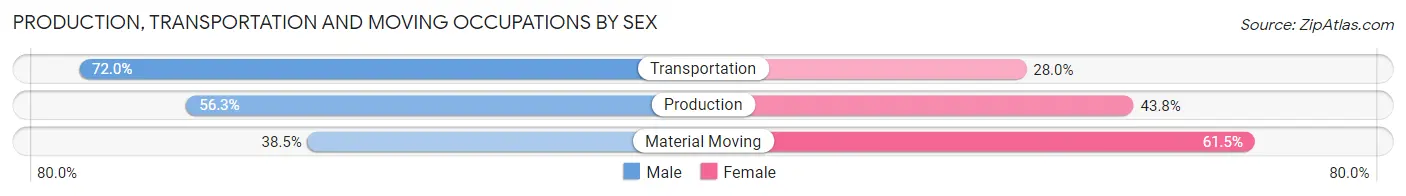
| Occupation | Male | Female |
| Production | 54 (56.2%) | 42 (43.8%) |
| Transportation | 18 (72.0%) | 7 (28.0%) |
| Material Moving | 10 (38.5%) | 16 (61.5%) |
| Total (Category) | 82 (55.8%) | 65 (44.2%) |
| Total (Overall) | 295 (50.2%) | 293 (49.8%) |
Employment Industries by Sex in Denton
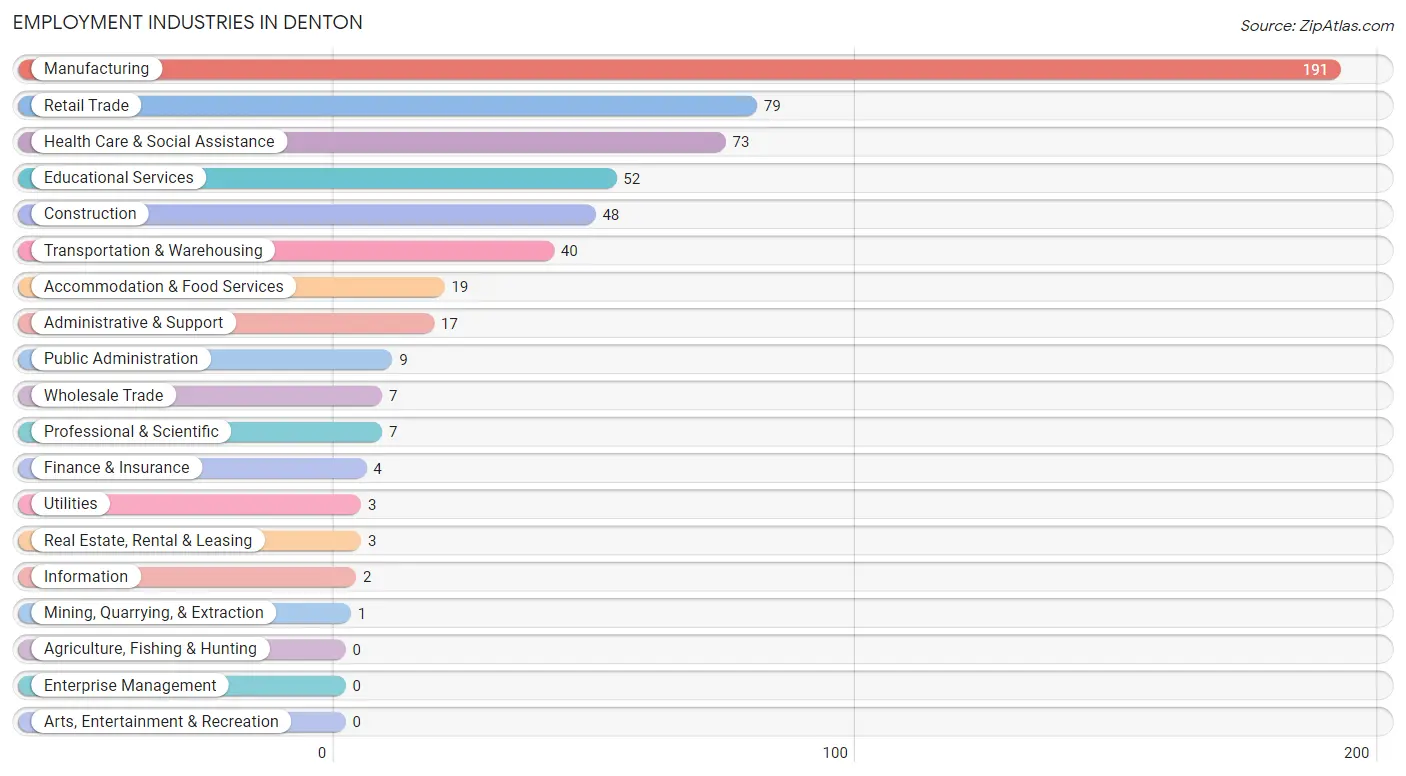
Employment Industries in Denton
The major employment industries in Denton include Manufacturing (191 | 32.5%), Retail Trade (79 | 13.4%), Health Care & Social Assistance (73 | 12.4%), Educational Services (52 | 8.8%), and Construction (48 | 8.2%).
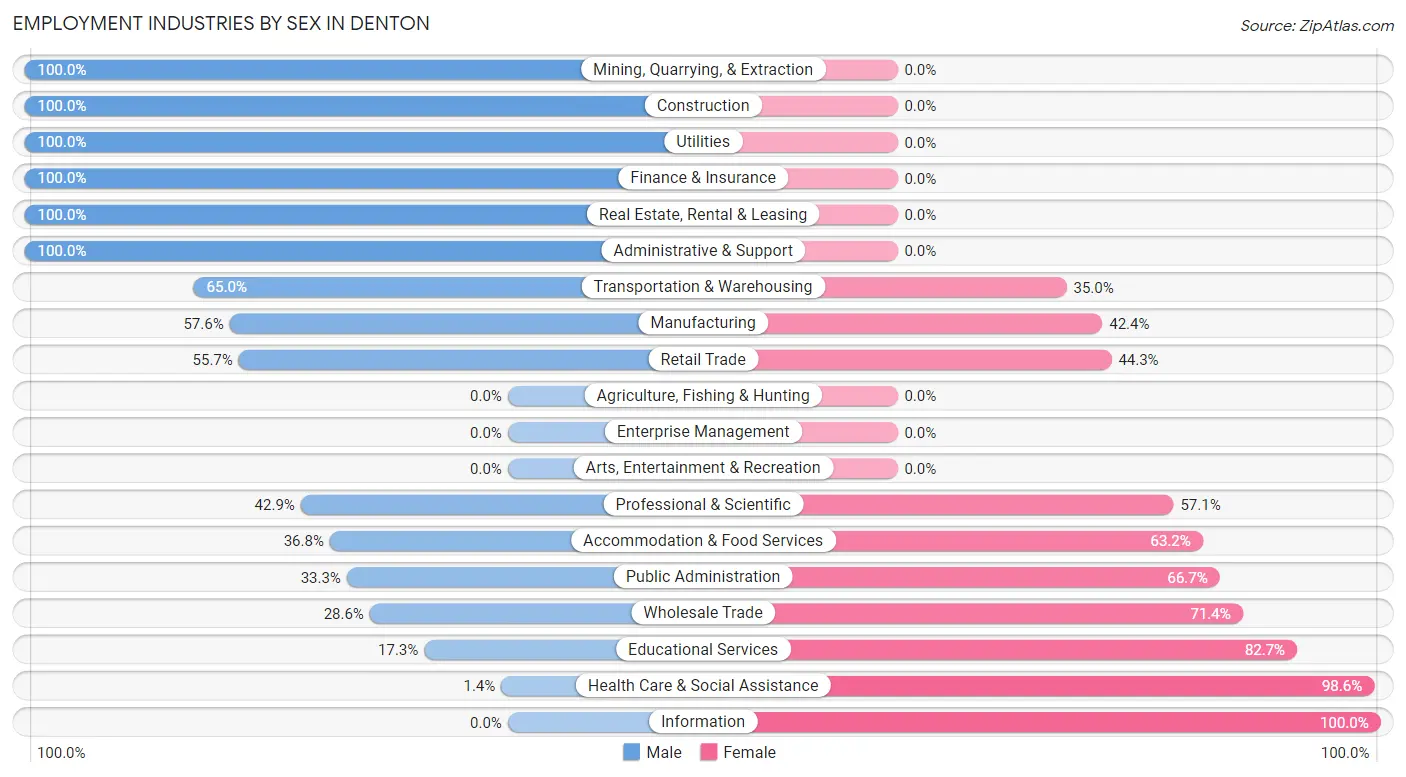
Employment Industries by Sex in Denton
The Denton industries that see more men than women are Mining, Quarrying, & Extraction (100.0%), Construction (100.0%), and Utilities (100.0%), whereas the industries that tend to have a higher number of women are Information (100.0%), Health Care & Social Assistance (98.6%), and Educational Services (82.7%).
| Industry | Male | Female |
| Agriculture, Fishing & Hunting | 0 (0.0%) | 0 (0.0%) |
| Mining, Quarrying, & Extraction | 1 (100.0%) | 0 (0.0%) |
| Construction | 48 (100.0%) | 0 (0.0%) |
| Manufacturing | 110 (57.6%) | 81 (42.4%) |
| Wholesale Trade | 2 (28.6%) | 5 (71.4%) |
| Retail Trade | 44 (55.7%) | 35 (44.3%) |
| Transportation & Warehousing | 26 (65.0%) | 14 (35.0%) |
| Utilities | 3 (100.0%) | 0 (0.0%) |
| Information | 0 (0.0%) | 2 (100.0%) |
| Finance & Insurance | 4 (100.0%) | 0 (0.0%) |
| Real Estate, Rental & Leasing | 3 (100.0%) | 0 (0.0%) |
| Professional & Scientific | 3 (42.9%) | 4 (57.1%) |
| Enterprise Management | 0 (0.0%) | 0 (0.0%) |
| Administrative & Support | 17 (100.0%) | 0 (0.0%) |
| Educational Services | 9 (17.3%) | 43 (82.7%) |
| Health Care & Social Assistance | 1 (1.4%) | 72 (98.6%) |
| Arts, Entertainment & Recreation | 0 (0.0%) | 0 (0.0%) |
| Accommodation & Food Services | 7 (36.8%) | 12 (63.2%) |
| Public Administration | 3 (33.3%) | 6 (66.7%) |
| Total | 295 (50.2%) | 293 (49.8%) |
Education in Denton
School Enrollment in Denton
The most common levels of schooling among the 285 students in Denton are middle school (79 | 27.7%), high school (72 | 25.3%), and elementary school (62 | 21.7%).
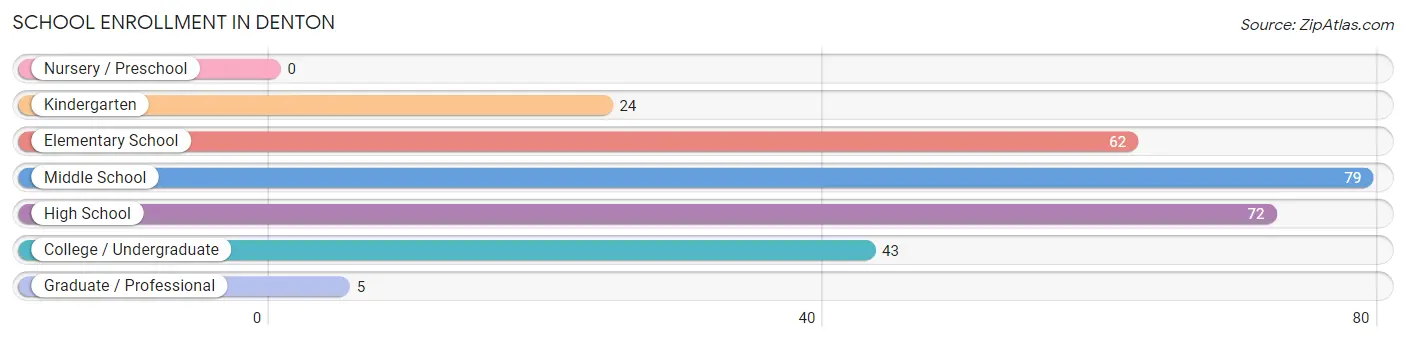
| School Level | # Students | % Students |
| Nursery / Preschool | 0 | 0.0% |
| Kindergarten | 24 | 8.4% |
| Elementary School | 62 | 21.7% |
| Middle School | 79 | 27.7% |
| High School | 72 | 25.3% |
| College / Undergraduate | 43 | 15.1% |
| Graduate / Professional | 5 | 1.8% |
| Total | 285 | 100.0% |
School Enrollment by Age by Funding Source in Denton
Out of a total of 285 students who are enrolled in schools in Denton, 32 (11.2%) attend a private institution, while the remaining 253 (88.8%) are enrolled in public schools. The age group of 20 to 24 year olds has the highest likelihood of being enrolled in private schools, with 9 (47.4% in the age bracket) enrolled. Conversely, the age group of 5 to 9 year old has the lowest likelihood of being enrolled in a private school, with 79 (100.0% in the age bracket) attending a public institution.
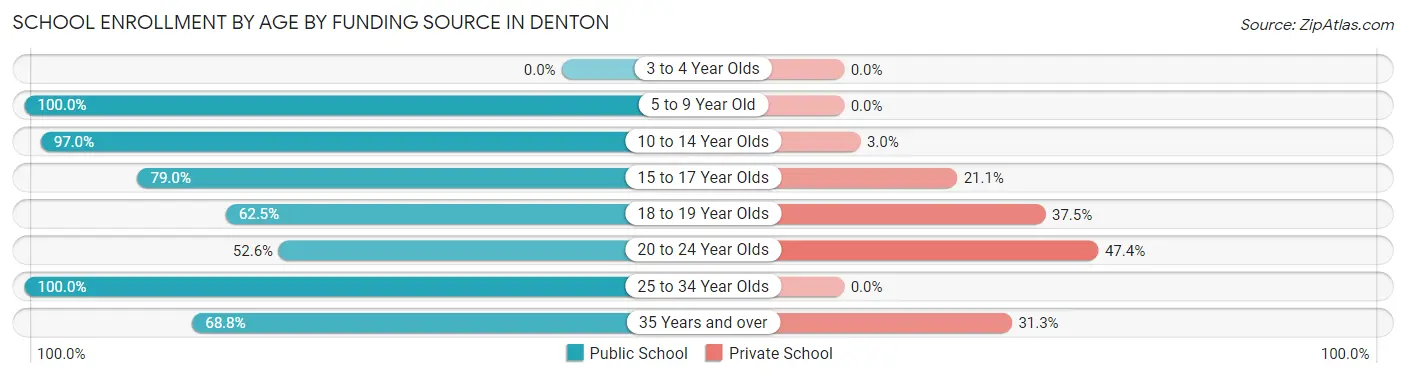
| Age Bracket | Public School | Private School |
| 3 to 4 Year Olds | 0 (0.0%) | 0 (0.0%) |
| 5 to 9 Year Old | 79 (100.0%) | 0 (0.0%) |
| 10 to 14 Year Olds | 96 (97.0%) | 3 (3.0%) |
| 15 to 17 Year Olds | 45 (78.9%) | 12 (21.0%) |
| 18 to 19 Year Olds | 5 (62.5%) | 3 (37.5%) |
| 20 to 24 Year Olds | 10 (52.6%) | 9 (47.4%) |
| 25 to 34 Year Olds | 7 (100.0%) | 0 (0.0%) |
| 35 Years and over | 11 (68.8%) | 5 (31.2%) |
| Total | 253 (88.8%) | 32 (11.2%) |
Educational Attainment by Field of Study in Denton
Education (39 | 29.1%), engineering (19 | 14.2%), science & technology (16 | 11.9%), arts & humanities (15 | 11.2%), and visual & performing arts (12 | 9.0%) are the most common fields of study among 134 individuals in Denton who have obtained a bachelor's degree or higher.
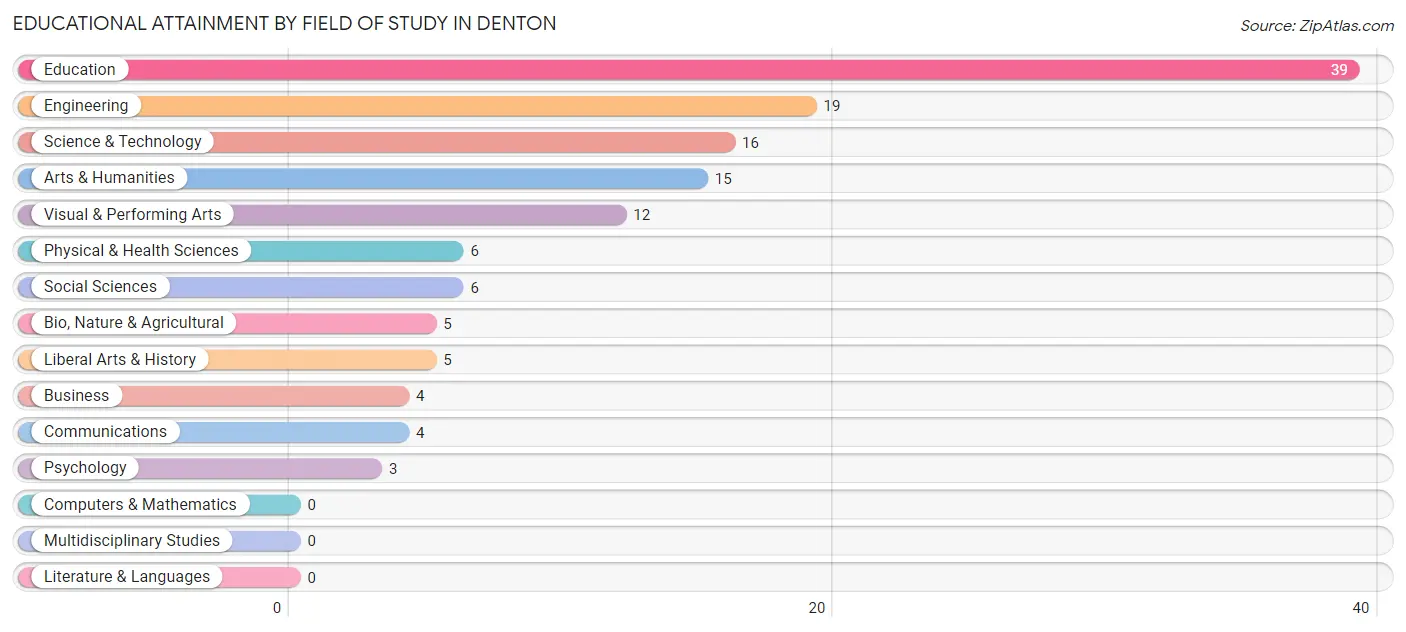
| Field of Study | # Graduates | % Graduates |
| Computers & Mathematics | 0 | 0.0% |
| Bio, Nature & Agricultural | 5 | 3.7% |
| Physical & Health Sciences | 6 | 4.5% |
| Psychology | 3 | 2.2% |
| Social Sciences | 6 | 4.5% |
| Engineering | 19 | 14.2% |
| Multidisciplinary Studies | 0 | 0.0% |
| Science & Technology | 16 | 11.9% |
| Business | 4 | 3.0% |
| Education | 39 | 29.1% |
| Literature & Languages | 0 | 0.0% |
| Liberal Arts & History | 5 | 3.7% |
| Visual & Performing Arts | 12 | 9.0% |
| Communications | 4 | 3.0% |
| Arts & Humanities | 15 | 11.2% |
| Total | 134 | 100.0% |
Transportation & Commute in Denton
Vehicle Availability by Sex in Denton
The most prevalent vehicle ownership categories in Denton are males with 2 vehicles (120, accounting for 40.7%) and females with 2 vehicles (144, making up 41.4%).
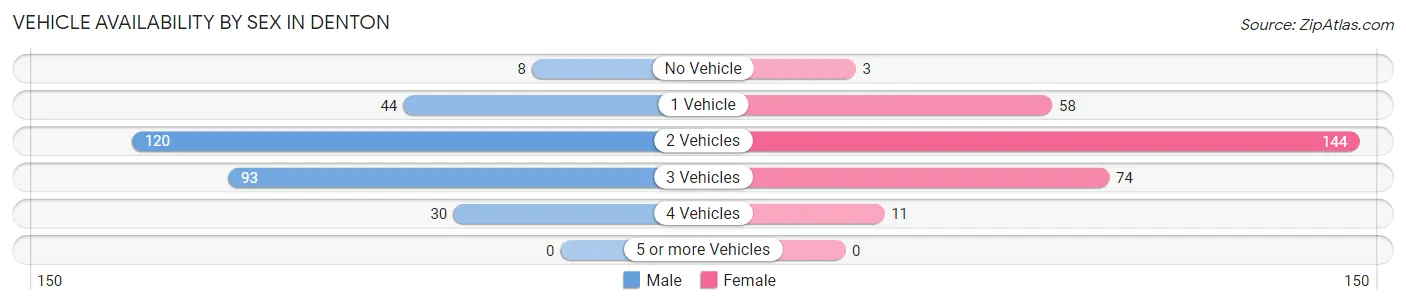
| Vehicles Available | Male | Female |
| No Vehicle | 8 (2.7%) | 3 (1.0%) |
| 1 Vehicle | 44 (14.9%) | 58 (20.0%) |
| 2 Vehicles | 120 (40.7%) | 144 (49.7%) |
| 3 Vehicles | 93 (31.5%) | 74 (25.5%) |
| 4 Vehicles | 30 (10.2%) | 11 (3.8%) |
| 5 or more Vehicles | 0 (0.0%) | 0 (0.0%) |
| Total | 295 (100.0%) | 290 (100.0%) |
Commute Time in Denton
The most frequently occuring commute durations in Denton are 5 to 9 minutes (110 commuters, 19.5%), 30 to 34 minutes (103 commuters, 18.3%), and 45 to 59 minutes (82 commuters, 14.5%).
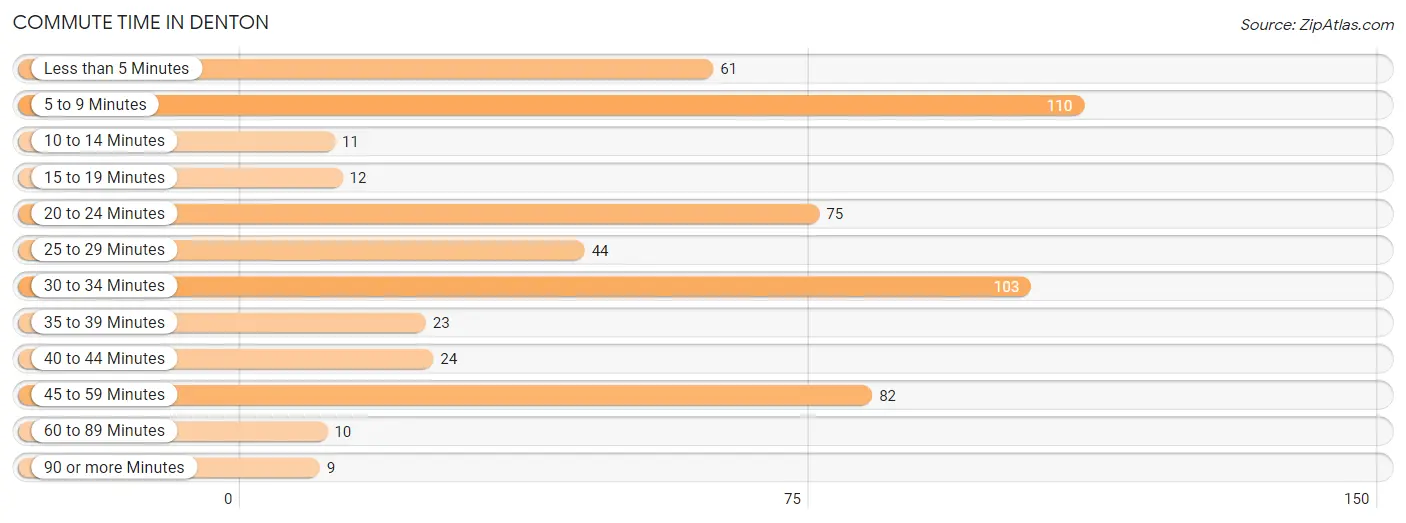
| Commute Time | # Commuters | % Commuters |
| Less than 5 Minutes | 61 | 10.8% |
| 5 to 9 Minutes | 110 | 19.5% |
| 10 to 14 Minutes | 11 | 1.9% |
| 15 to 19 Minutes | 12 | 2.1% |
| 20 to 24 Minutes | 75 | 13.3% |
| 25 to 29 Minutes | 44 | 7.8% |
| 30 to 34 Minutes | 103 | 18.3% |
| 35 to 39 Minutes | 23 | 4.1% |
| 40 to 44 Minutes | 24 | 4.3% |
| 45 to 59 Minutes | 82 | 14.5% |
| 60 to 89 Minutes | 10 | 1.8% |
| 90 or more Minutes | 9 | 1.6% |
Commute Time by Sex in Denton
The most common commute times in Denton are 45 to 59 minutes (78 commuters, 27.5%) for males and 30 to 34 minutes (67 commuters, 23.9%) for females.
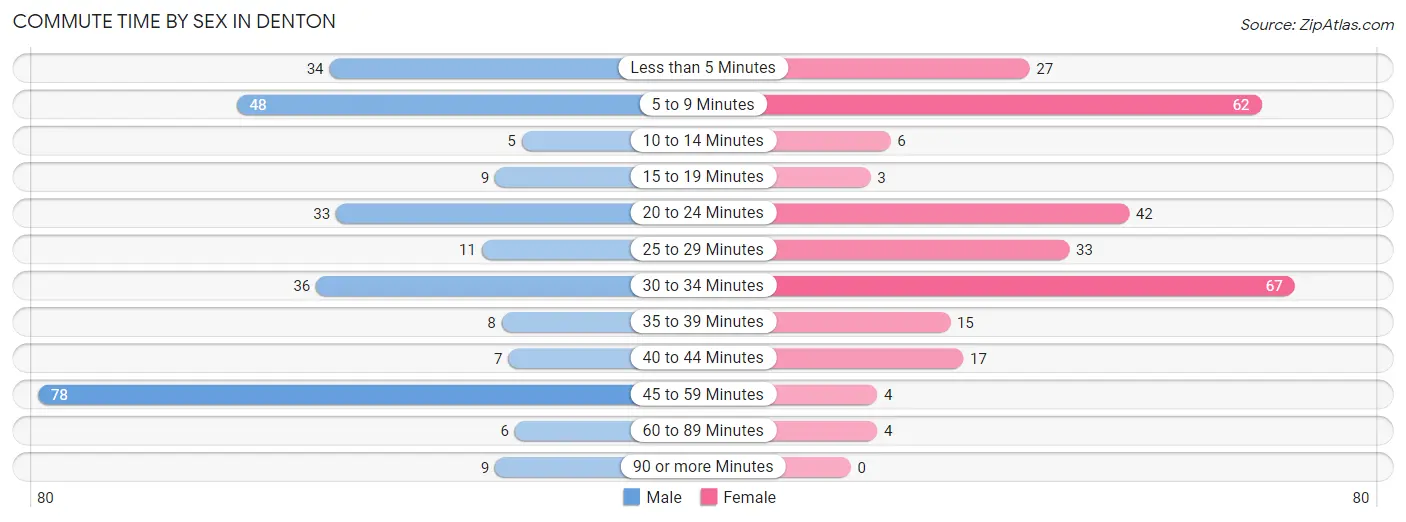
| Commute Time | Male | Female |
| Less than 5 Minutes | 34 (12.0%) | 27 (9.6%) |
| 5 to 9 Minutes | 48 (16.9%) | 62 (22.1%) |
| 10 to 14 Minutes | 5 (1.8%) | 6 (2.1%) |
| 15 to 19 Minutes | 9 (3.2%) | 3 (1.1%) |
| 20 to 24 Minutes | 33 (11.6%) | 42 (15.0%) |
| 25 to 29 Minutes | 11 (3.9%) | 33 (11.8%) |
| 30 to 34 Minutes | 36 (12.7%) | 67 (23.9%) |
| 35 to 39 Minutes | 8 (2.8%) | 15 (5.4%) |
| 40 to 44 Minutes | 7 (2.5%) | 17 (6.1%) |
| 45 to 59 Minutes | 78 (27.5%) | 4 (1.4%) |
| 60 to 89 Minutes | 6 (2.1%) | 4 (1.4%) |
| 90 or more Minutes | 9 (3.2%) | 0 (0.0%) |
Time of Departure to Work by Sex in Denton
The most frequent times of departure to work in Denton are 6:00 AM to 6:29 AM (67, 23.6%) for males and 6:00 AM to 6:29 AM (70, 25.0%) for females.
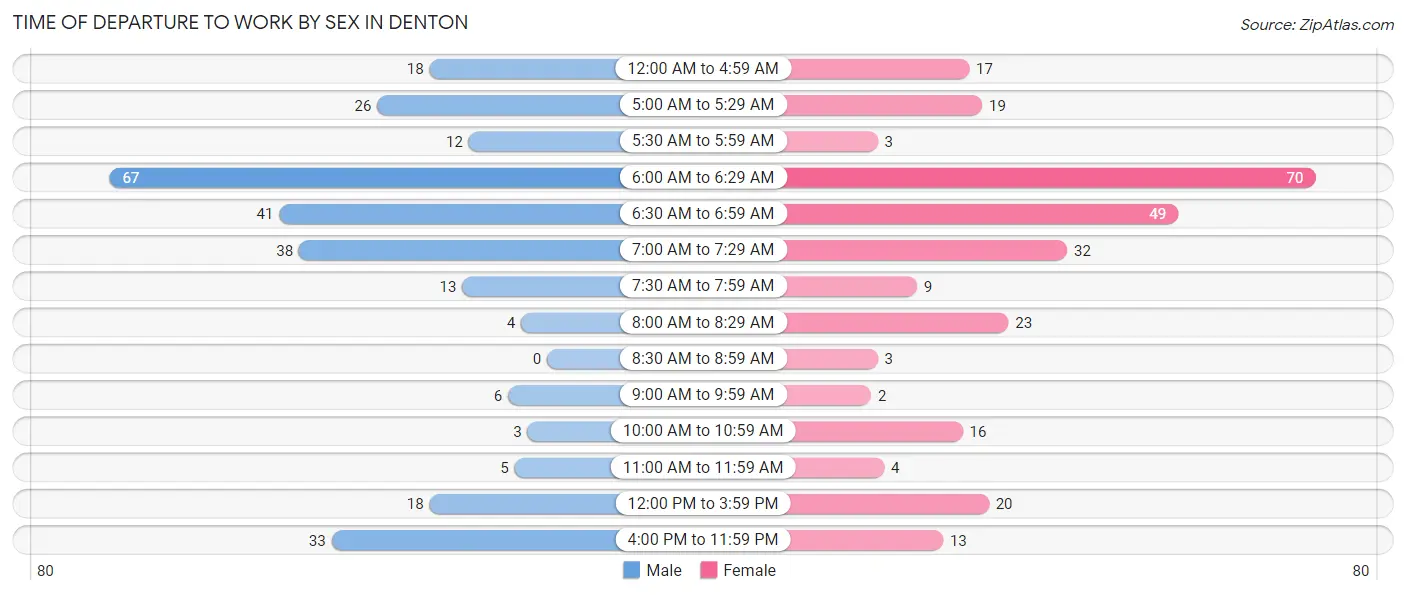
| Time of Departure | Male | Female |
| 12:00 AM to 4:59 AM | 18 (6.3%) | 17 (6.1%) |
| 5:00 AM to 5:29 AM | 26 (9.1%) | 19 (6.8%) |
| 5:30 AM to 5:59 AM | 12 (4.2%) | 3 (1.1%) |
| 6:00 AM to 6:29 AM | 67 (23.6%) | 70 (25.0%) |
| 6:30 AM to 6:59 AM | 41 (14.4%) | 49 (17.5%) |
| 7:00 AM to 7:29 AM | 38 (13.4%) | 32 (11.4%) |
| 7:30 AM to 7:59 AM | 13 (4.6%) | 9 (3.2%) |
| 8:00 AM to 8:29 AM | 4 (1.4%) | 23 (8.2%) |
| 8:30 AM to 8:59 AM | 0 (0.0%) | 3 (1.1%) |
| 9:00 AM to 9:59 AM | 6 (2.1%) | 2 (0.7%) |
| 10:00 AM to 10:59 AM | 3 (1.1%) | 16 (5.7%) |
| 11:00 AM to 11:59 AM | 5 (1.8%) | 4 (1.4%) |
| 12:00 PM to 3:59 PM | 18 (6.3%) | 20 (7.1%) |
| 4:00 PM to 11:59 PM | 33 (11.6%) | 13 (4.6%) |
| Total | 284 (100.0%) | 280 (100.0%) |
Housing Occupancy in Denton
Occupancy by Ownership in Denton
Of the total 559 dwellings in Denton, owner-occupied units account for 319 (57.1%), while renter-occupied units make up 240 (42.9%).
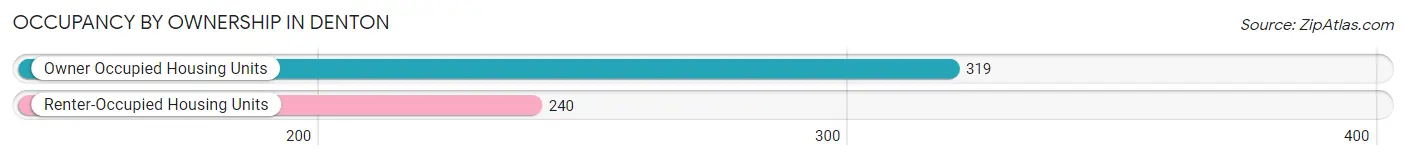
| Occupancy | # Housing Units | % Housing Units |
| Owner Occupied Housing Units | 319 | 57.1% |
| Renter-Occupied Housing Units | 240 | 42.9% |
| Total Occupied Housing Units | 559 | 100.0% |
Occupancy by Household Size in Denton
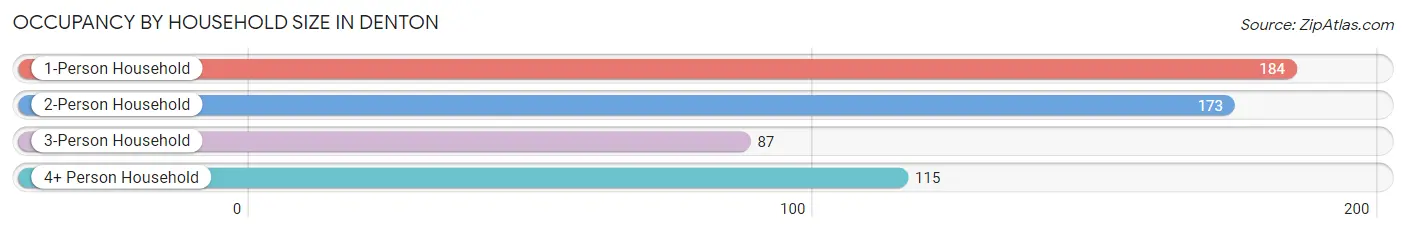
| Household Size | # Housing Units | % Housing Units |
| 1-Person Household | 184 | 32.9% |
| 2-Person Household | 173 | 30.9% |
| 3-Person Household | 87 | 15.6% |
| 4+ Person Household | 115 | 20.6% |
| Total Housing Units | 559 | 100.0% |
Occupancy by Ownership by Household Size in Denton
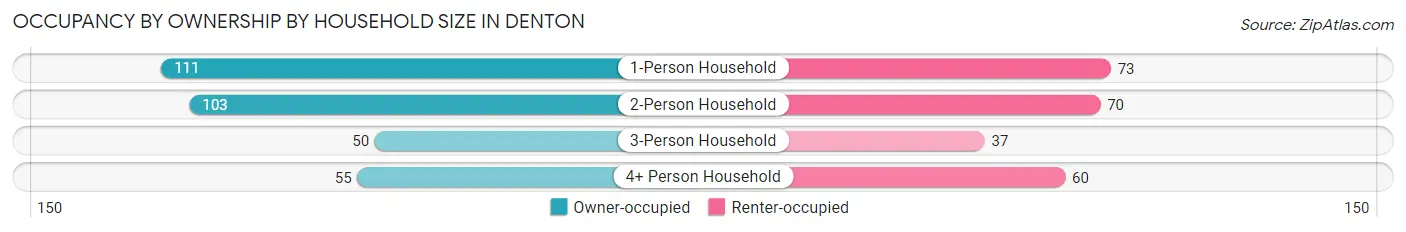
| Household Size | Owner-occupied | Renter-occupied |
| 1-Person Household | 111 (60.3%) | 73 (39.7%) |
| 2-Person Household | 103 (59.5%) | 70 (40.5%) |
| 3-Person Household | 50 (57.5%) | 37 (42.5%) |
| 4+ Person Household | 55 (47.8%) | 60 (52.2%) |
| Total Housing Units | 319 (57.1%) | 240 (42.9%) |
Occupancy by Educational Attainment in Denton
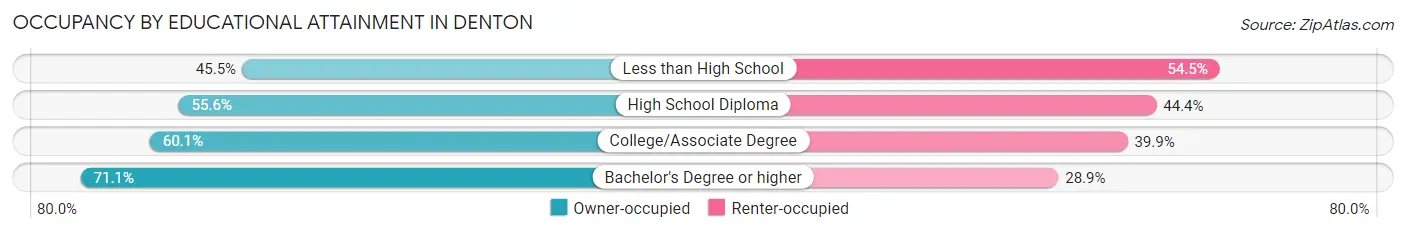
| Household Size | Owner-occupied | Renter-occupied |
| Less than High School | 56 (45.5%) | 67 (54.5%) |
| High School Diploma | 110 (55.6%) | 88 (44.4%) |
| College/Associate Degree | 89 (60.1%) | 59 (39.9%) |
| Bachelor's Degree or higher | 64 (71.1%) | 26 (28.9%) |
Occupancy by Age of Householder in Denton
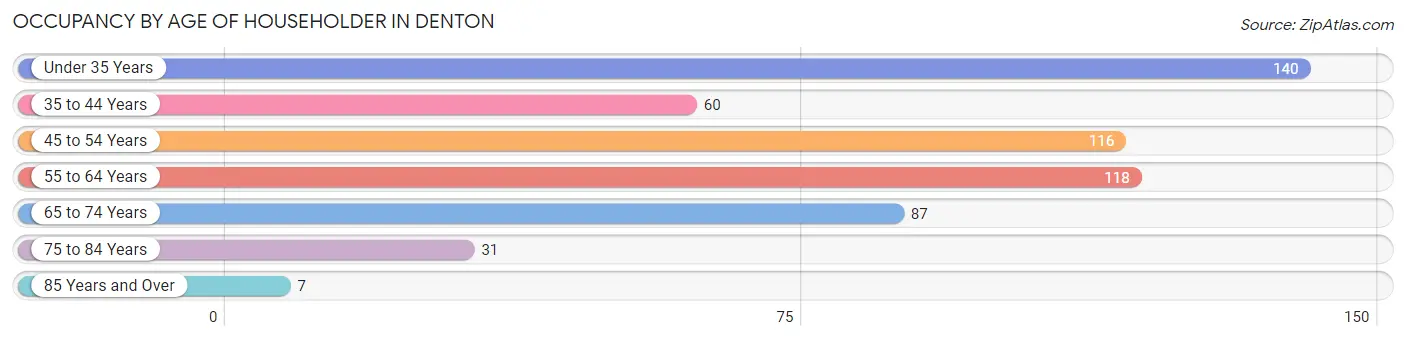
| Age Bracket | # Households | % Households |
| Under 35 Years | 140 | 25.0% |
| 35 to 44 Years | 60 | 10.7% |
| 45 to 54 Years | 116 | 20.7% |
| 55 to 64 Years | 118 | 21.1% |
| 65 to 74 Years | 87 | 15.6% |
| 75 to 84 Years | 31 | 5.6% |
| 85 Years and Over | 7 | 1.3% |
| Total | 559 | 100.0% |
Housing Finances in Denton
Median Income by Occupancy in Denton
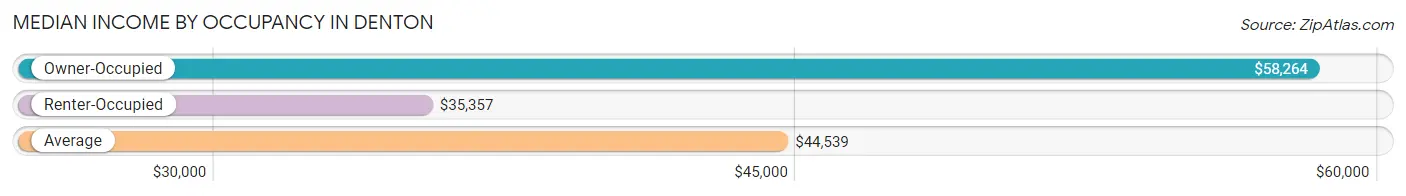
| Occupancy Type | # Households | Median Income |
| Owner-Occupied | 319 (57.1%) | $58,264 |
| Renter-Occupied | 240 (42.9%) | $35,357 |
| Average | 559 (100.0%) | $44,539 |
Occupancy by Householder Income Bracket in Denton
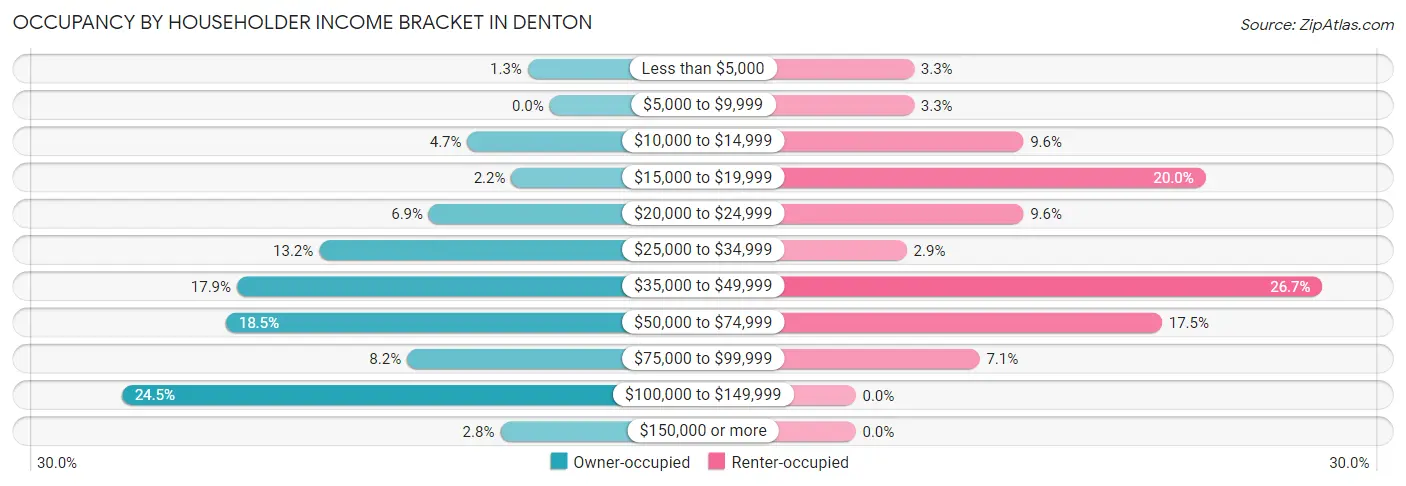
| Income Bracket | Owner-occupied | Renter-occupied |
| Less than $5,000 | 4 (1.3%) | 8 (3.3%) |
| $5,000 to $9,999 | 0 (0.0%) | 8 (3.3%) |
| $10,000 to $14,999 | 15 (4.7%) | 23 (9.6%) |
| $15,000 to $19,999 | 7 (2.2%) | 48 (20.0%) |
| $20,000 to $24,999 | 22 (6.9%) | 23 (9.6%) |
| $25,000 to $34,999 | 42 (13.2%) | 7 (2.9%) |
| $35,000 to $49,999 | 57 (17.9%) | 64 (26.7%) |
| $50,000 to $74,999 | 59 (18.5%) | 42 (17.5%) |
| $75,000 to $99,999 | 26 (8.2%) | 17 (7.1%) |
| $100,000 to $149,999 | 78 (24.4%) | 0 (0.0%) |
| $150,000 or more | 9 (2.8%) | 0 (0.0%) |
| Total | 319 (100.0%) | 240 (100.0%) |
Monthly Housing Cost Tiers in Denton
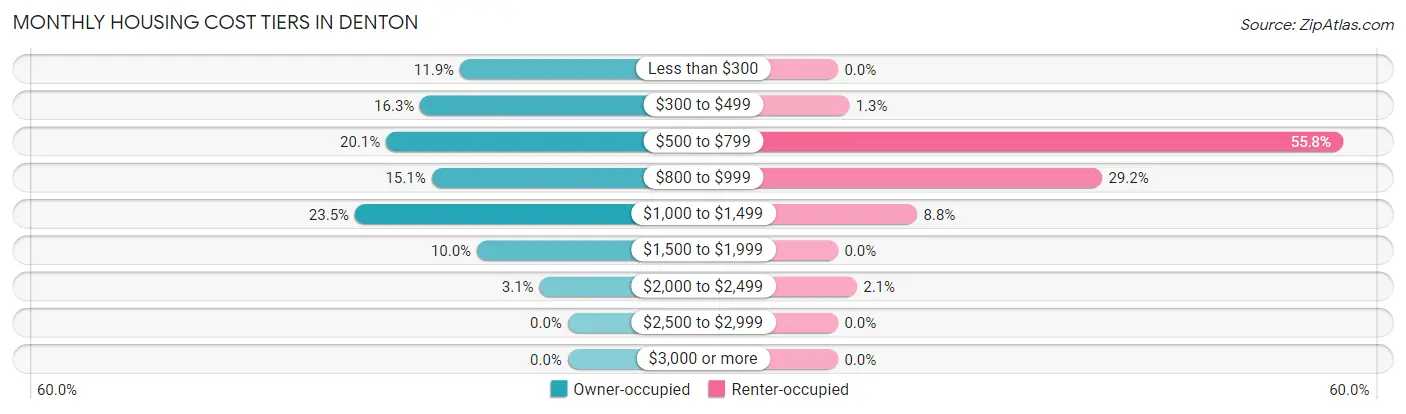
| Monthly Cost | Owner-occupied | Renter-occupied |
| Less than $300 | 38 (11.9%) | 0 (0.0%) |
| $300 to $499 | 52 (16.3%) | 3 (1.3%) |
| $500 to $799 | 64 (20.1%) | 134 (55.8%) |
| $800 to $999 | 48 (15.0%) | 70 (29.2%) |
| $1,000 to $1,499 | 75 (23.5%) | 21 (8.7%) |
| $1,500 to $1,999 | 32 (10.0%) | 0 (0.0%) |
| $2,000 to $2,499 | 10 (3.1%) | 5 (2.1%) |
| $2,500 to $2,999 | 0 (0.0%) | 0 (0.0%) |
| $3,000 or more | 0 (0.0%) | 0 (0.0%) |
| Total | 319 (100.0%) | 240 (100.0%) |
Physical Housing Characteristics in Denton
Housing Structures in Denton
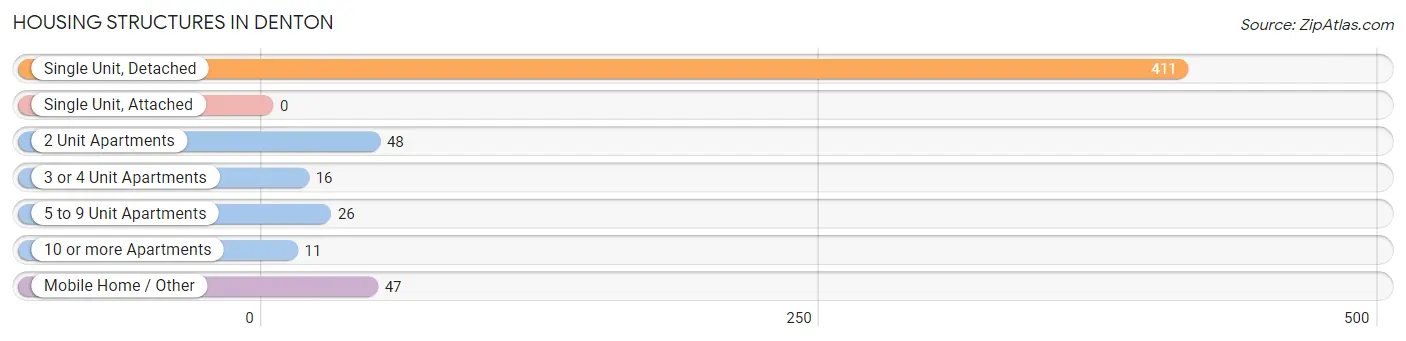
| Structure Type | # Housing Units | % Housing Units |
| Single Unit, Detached | 411 | 73.5% |
| Single Unit, Attached | 0 | 0.0% |
| 2 Unit Apartments | 48 | 8.6% |
| 3 or 4 Unit Apartments | 16 | 2.9% |
| 5 to 9 Unit Apartments | 26 | 4.6% |
| 10 or more Apartments | 11 | 2.0% |
| Mobile Home / Other | 47 | 8.4% |
| Total | 559 | 100.0% |
Housing Structures by Occupancy in Denton
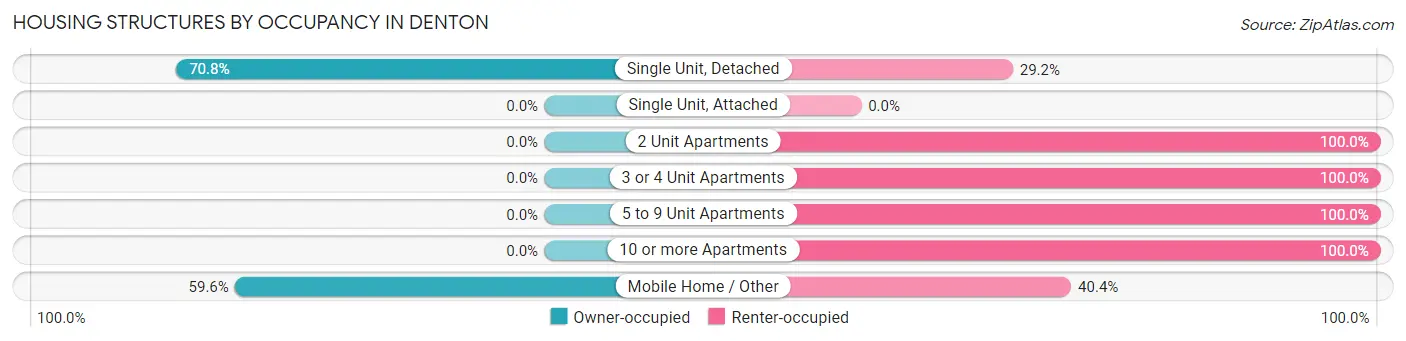
| Structure Type | Owner-occupied | Renter-occupied |
| Single Unit, Detached | 291 (70.8%) | 120 (29.2%) |
| Single Unit, Attached | 0 (0.0%) | 0 (0.0%) |
| 2 Unit Apartments | 0 (0.0%) | 48 (100.0%) |
| 3 or 4 Unit Apartments | 0 (0.0%) | 16 (100.0%) |
| 5 to 9 Unit Apartments | 0 (0.0%) | 26 (100.0%) |
| 10 or more Apartments | 0 (0.0%) | 11 (100.0%) |
| Mobile Home / Other | 28 (59.6%) | 19 (40.4%) |
| Total | 319 (57.1%) | 240 (42.9%) |
Housing Structures by Number of Rooms in Denton
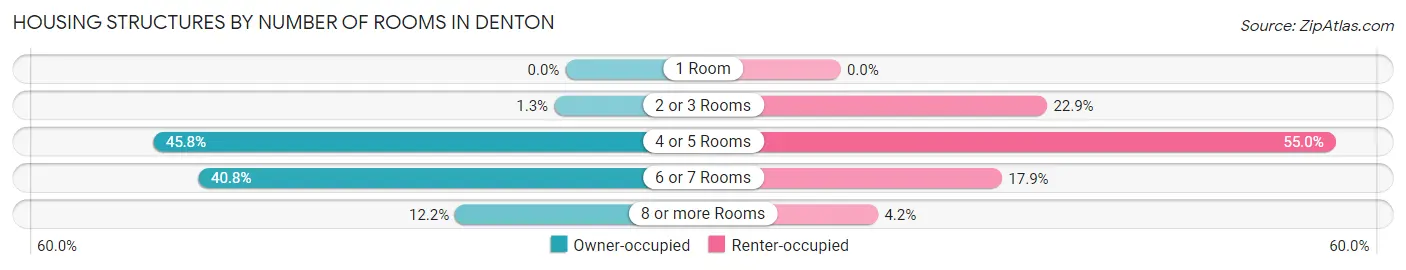
| Number of Rooms | Owner-occupied | Renter-occupied |
| 1 Room | 0 (0.0%) | 0 (0.0%) |
| 2 or 3 Rooms | 4 (1.3%) | 55 (22.9%) |
| 4 or 5 Rooms | 146 (45.8%) | 132 (55.0%) |
| 6 or 7 Rooms | 130 (40.7%) | 43 (17.9%) |
| 8 or more Rooms | 39 (12.2%) | 10 (4.2%) |
| Total | 319 (100.0%) | 240 (100.0%) |
Housing Structure by Heating Type in Denton
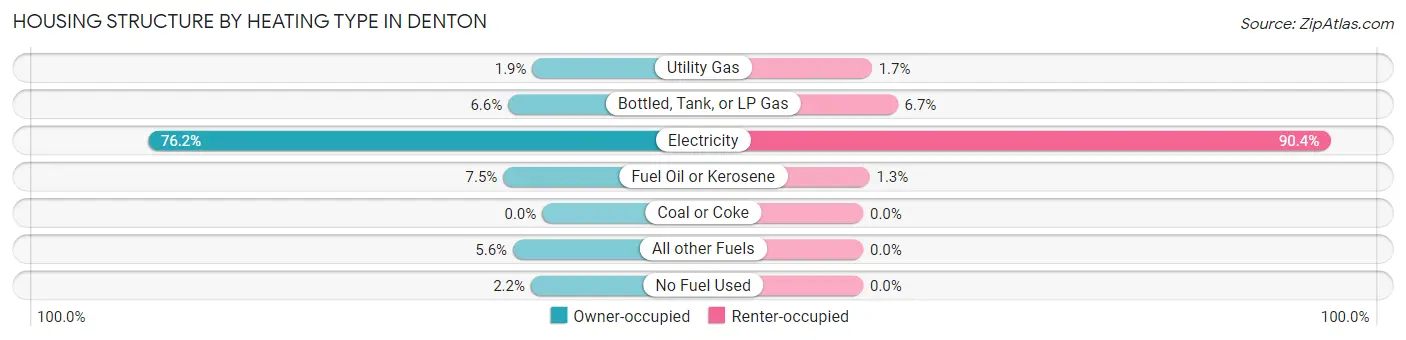
| Heating Type | Owner-occupied | Renter-occupied |
| Utility Gas | 6 (1.9%) | 4 (1.7%) |
| Bottled, Tank, or LP Gas | 21 (6.6%) | 16 (6.7%) |
| Electricity | 243 (76.2%) | 217 (90.4%) |
| Fuel Oil or Kerosene | 24 (7.5%) | 3 (1.3%) |
| Coal or Coke | 0 (0.0%) | 0 (0.0%) |
| All other Fuels | 18 (5.6%) | 0 (0.0%) |
| No Fuel Used | 7 (2.2%) | 0 (0.0%) |
| Total | 319 (100.0%) | 240 (100.0%) |
Household Vehicle Usage in Denton
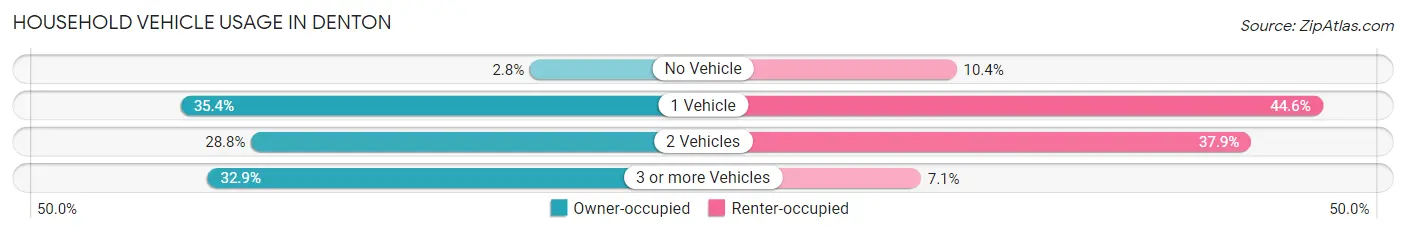
| Vehicles per Household | Owner-occupied | Renter-occupied |
| No Vehicle | 9 (2.8%) | 25 (10.4%) |
| 1 Vehicle | 113 (35.4%) | 107 (44.6%) |
| 2 Vehicles | 92 (28.8%) | 91 (37.9%) |
| 3 or more Vehicles | 105 (32.9%) | 17 (7.1%) |
| Total | 319 (100.0%) | 240 (100.0%) |
Real Estate & Mortgages in Denton
Real Estate and Mortgage Overview in Denton
| Characteristic | Without Mortgage | With Mortgage |
| Housing Units | 140 | 179 |
| Median Property Value | $98,500 | $144,000 |
| Median Household Income | $35,625 | $6 |
| Monthly Housing Costs | $462 | $0 |
| Real Estate Taxes | $1,127 | $3 |
Property Value by Mortgage Status in Denton
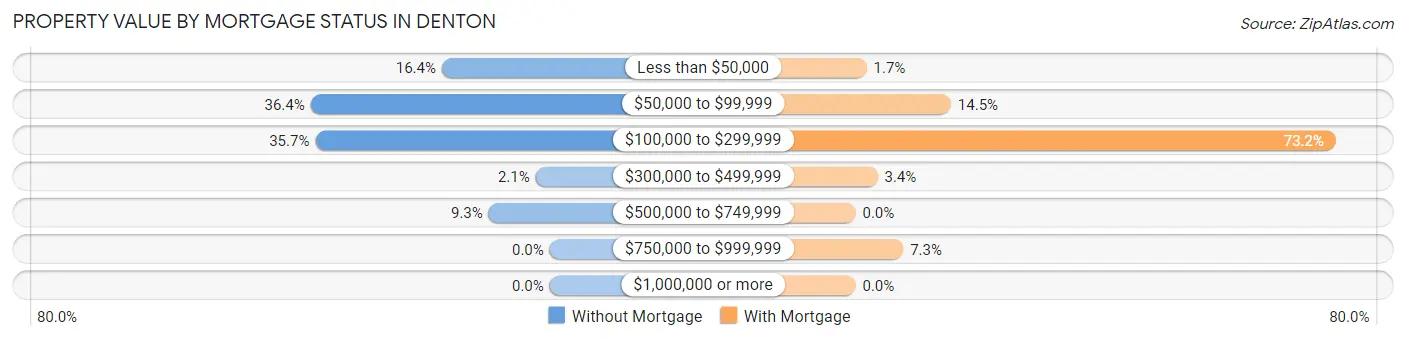
| Property Value | Without Mortgage | With Mortgage |
| Less than $50,000 | 23 (16.4%) | 3 (1.7%) |
| $50,000 to $99,999 | 51 (36.4%) | 26 (14.5%) |
| $100,000 to $299,999 | 50 (35.7%) | 131 (73.2%) |
| $300,000 to $499,999 | 3 (2.1%) | 6 (3.4%) |
| $500,000 to $749,999 | 13 (9.3%) | 0 (0.0%) |
| $750,000 to $999,999 | 0 (0.0%) | 13 (7.3%) |
| $1,000,000 or more | 0 (0.0%) | 0 (0.0%) |
| Total | 140 (100.0%) | 179 (100.0%) |
Household Income by Mortgage Status in Denton
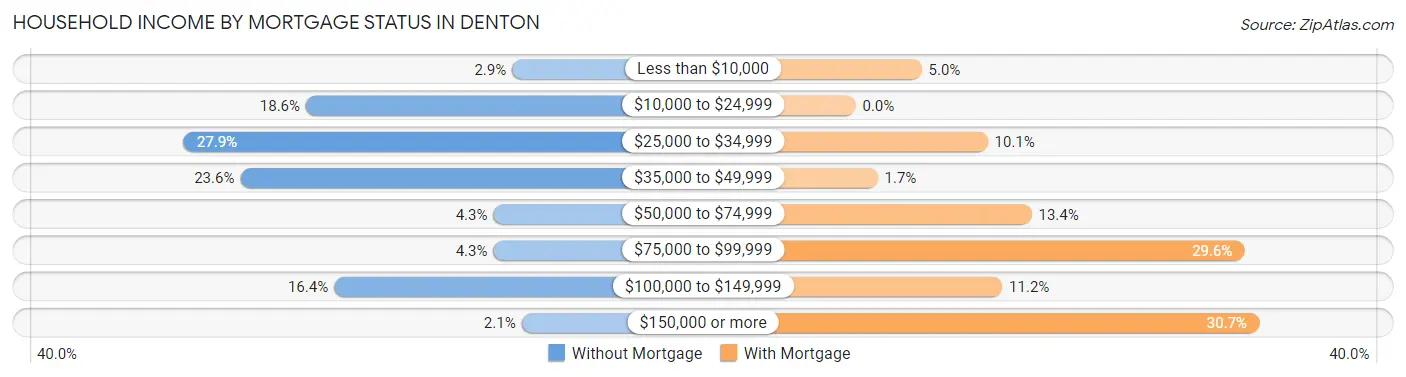
| Household Income | Without Mortgage | With Mortgage |
| Less than $10,000 | 4 (2.9%) | 9 (5.0%) |
| $10,000 to $24,999 | 26 (18.6%) | 0 (0.0%) |
| $25,000 to $34,999 | 39 (27.9%) | 18 (10.1%) |
| $35,000 to $49,999 | 33 (23.6%) | 3 (1.7%) |
| $50,000 to $74,999 | 6 (4.3%) | 24 (13.4%) |
| $75,000 to $99,999 | 6 (4.3%) | 53 (29.6%) |
| $100,000 to $149,999 | 23 (16.4%) | 20 (11.2%) |
| $150,000 or more | 3 (2.1%) | 55 (30.7%) |
| Total | 140 (100.0%) | 179 (100.0%) |
Property Value to Household Income Ratio in Denton
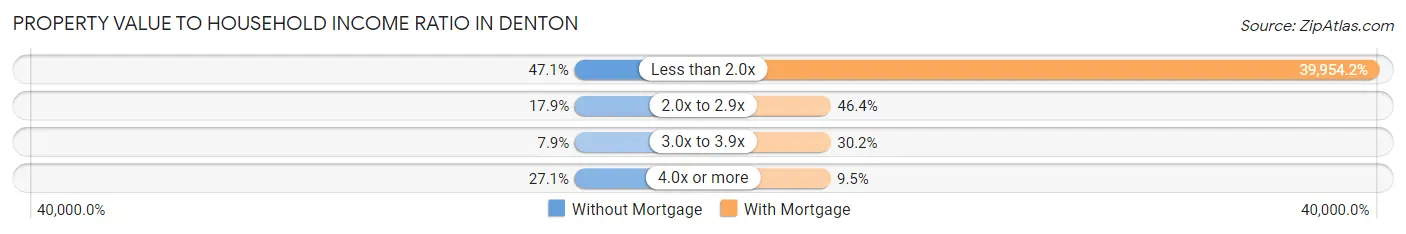
| Value-to-Income Ratio | Without Mortgage | With Mortgage |
| Less than 2.0x | 66 (47.1%) | 71,518 (39,954.2%) |
| 2.0x to 2.9x | 25 (17.9%) | 83 (46.4%) |
| 3.0x to 3.9x | 11 (7.9%) | 54 (30.2%) |
| 4.0x or more | 38 (27.1%) | 17 (9.5%) |
| Total | 140 (100.0%) | 179 (100.0%) |
Real Estate Taxes by Mortgage Status in Denton
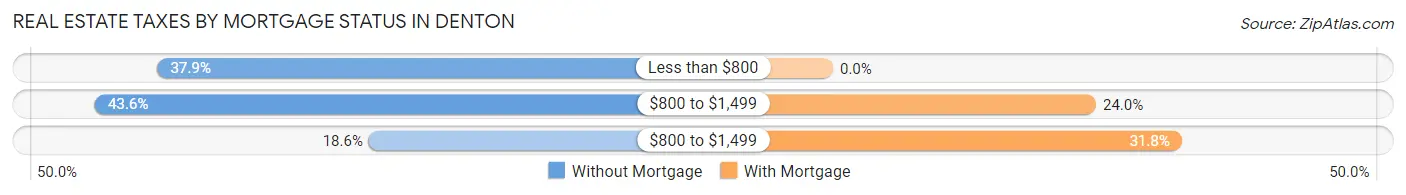
| Property Taxes | Without Mortgage | With Mortgage |
| Less than $800 | 53 (37.9%) | 0 (0.0%) |
| $800 to $1,499 | 61 (43.6%) | 43 (24.0%) |
| $800 to $1,499 | 26 (18.6%) | 57 (31.8%) |
| Total | 140 (100.0%) | 179 (100.0%) |
Health & Disability in Denton
Health Insurance Coverage by Age in Denton
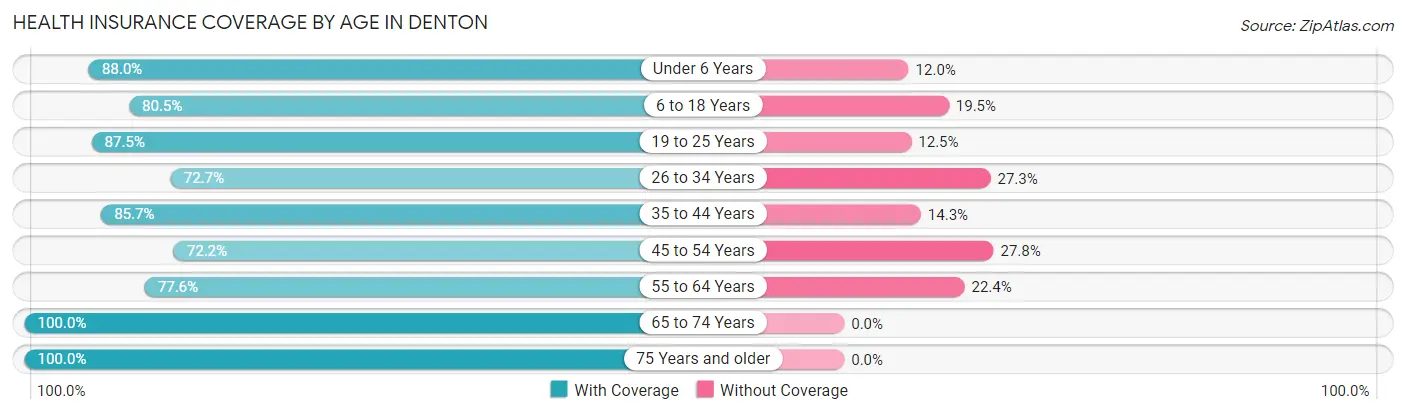
| Age Bracket | With Coverage | Without Coverage |
| Under 6 Years | 88 (88.0%) | 12 (12.0%) |
| 6 to 18 Years | 194 (80.5%) | 47 (19.5%) |
| 19 to 25 Years | 119 (87.5%) | 17 (12.5%) |
| 26 to 34 Years | 104 (72.7%) | 39 (27.3%) |
| 35 to 44 Years | 96 (85.7%) | 16 (14.3%) |
| 45 to 54 Years | 127 (72.2%) | 49 (27.8%) |
| 55 to 64 Years | 166 (77.6%) | 48 (22.4%) |
| 65 to 74 Years | 121 (100.0%) | 0 (0.0%) |
| 75 Years and older | 64 (100.0%) | 0 (0.0%) |
| Total | 1,079 (82.6%) | 228 (17.4%) |
Health Insurance Coverage by Citizenship Status in Denton
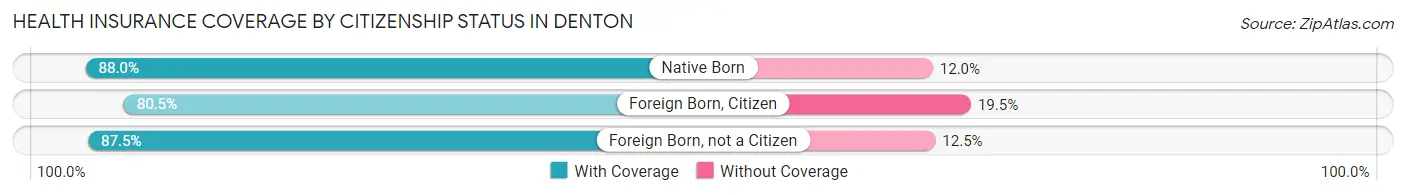
| Citizenship Status | With Coverage | Without Coverage |
| Native Born | 88 (88.0%) | 12 (12.0%) |
| Foreign Born, Citizen | 194 (80.5%) | 47 (19.5%) |
| Foreign Born, not a Citizen | 119 (87.5%) | 17 (12.5%) |
Health Insurance Coverage by Household Income in Denton
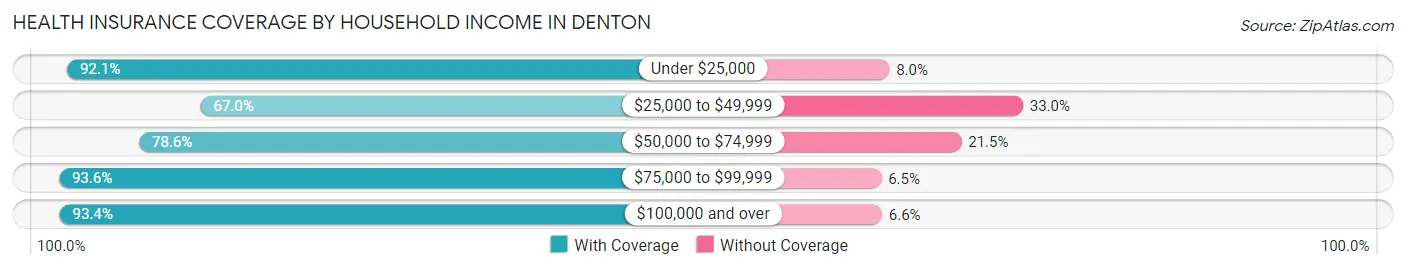
| Household Income | With Coverage | Without Coverage |
| Under $25,000 | 243 (92.0%) | 21 (8.0%) |
| $25,000 to $49,999 | 248 (67.0%) | 122 (33.0%) |
| $50,000 to $74,999 | 216 (78.5%) | 59 (21.4%) |
| $75,000 to $99,999 | 116 (93.5%) | 8 (6.5%) |
| $100,000 and over | 256 (93.4%) | 18 (6.6%) |
Public vs Private Health Insurance Coverage by Age in Denton
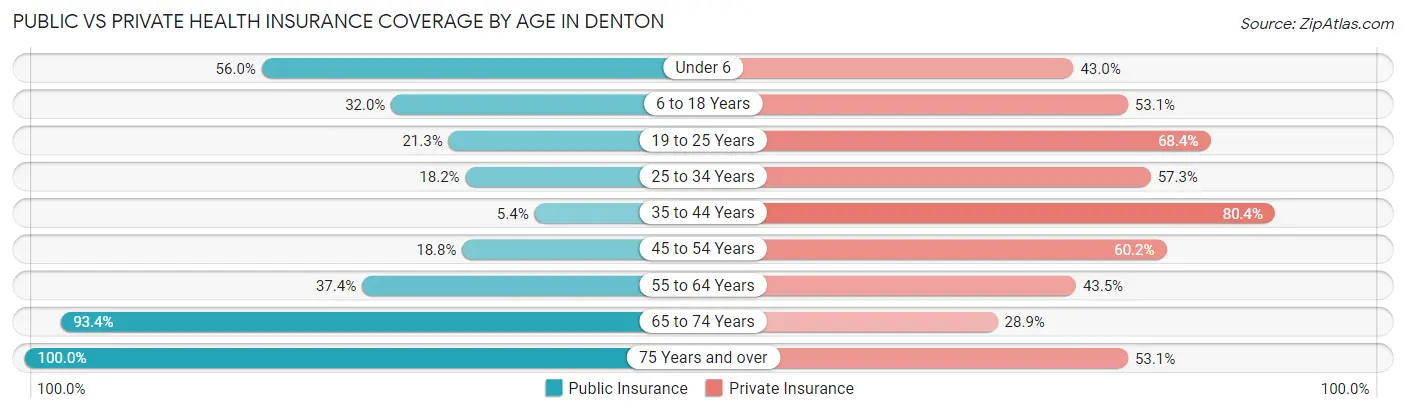
| Age Bracket | Public Insurance | Private Insurance |
| Under 6 | 56 (56.0%) | 43 (43.0%) |
| 6 to 18 Years | 77 (32.0%) | 128 (53.1%) |
| 19 to 25 Years | 29 (21.3%) | 93 (68.4%) |
| 25 to 34 Years | 26 (18.2%) | 82 (57.3%) |
| 35 to 44 Years | 6 (5.4%) | 90 (80.4%) |
| 45 to 54 Years | 33 (18.8%) | 106 (60.2%) |
| 55 to 64 Years | 80 (37.4%) | 93 (43.5%) |
| 65 to 74 Years | 113 (93.4%) | 35 (28.9%) |
| 75 Years and over | 64 (100.0%) | 34 (53.1%) |
| Total | 484 (37.0%) | 704 (53.9%) |
Disability Status by Sex by Age in Denton
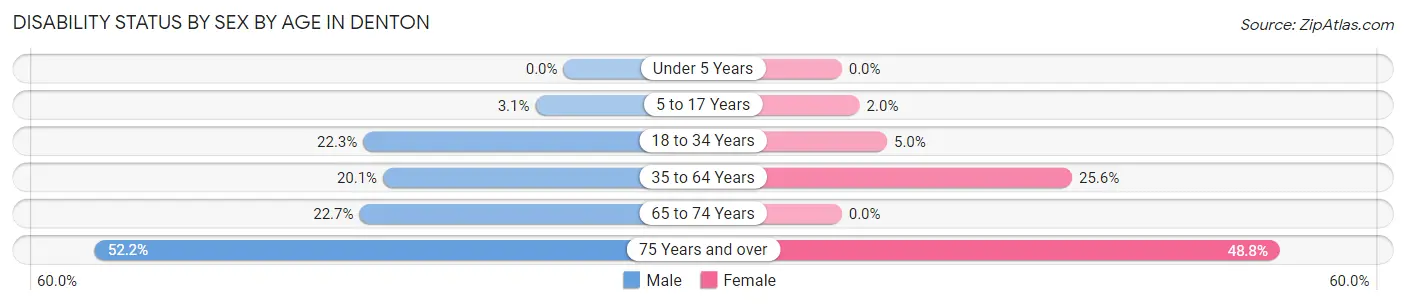
| Age Bracket | Male | Female |
| Under 5 Years | 0 (0.0%) | 0 (0.0%) |
| 5 to 17 Years | 3 (3.1%) | 3 (2.0%) |
| 18 to 34 Years | 33 (22.3%) | 7 (5.0%) |
| 35 to 64 Years | 46 (20.1%) | 70 (25.6%) |
| 65 to 74 Years | 15 (22.7%) | 0 (0.0%) |
| 75 Years and over | 12 (52.2%) | 20 (48.8%) |
Disability Class by Sex by Age in Denton
Disability Class: Hearing Difficulty
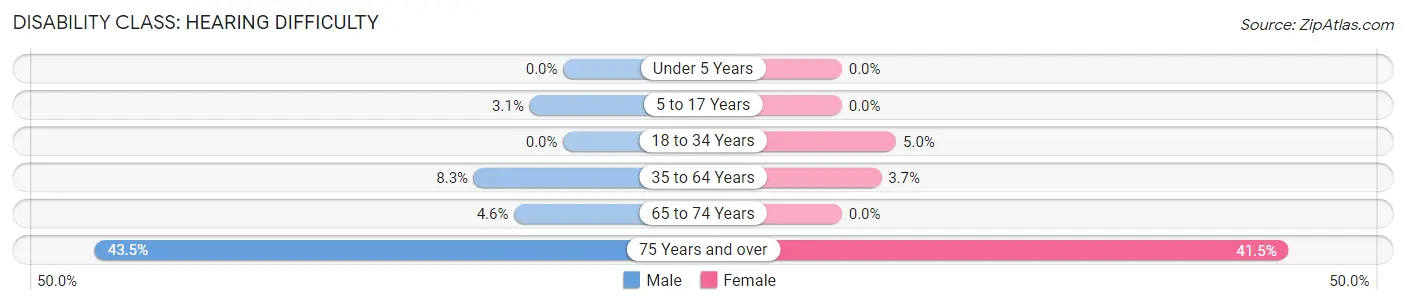
| Age Bracket | Male | Female |
| Under 5 Years | 0 (0.0%) | 0 (0.0%) |
| 5 to 17 Years | 3 (3.1%) | 0 (0.0%) |
| 18 to 34 Years | 0 (0.0%) | 7 (5.0%) |
| 35 to 64 Years | 19 (8.3%) | 10 (3.7%) |
| 65 to 74 Years | 3 (4.5%) | 0 (0.0%) |
| 75 Years and over | 10 (43.5%) | 17 (41.5%) |
Disability Class: Vision Difficulty
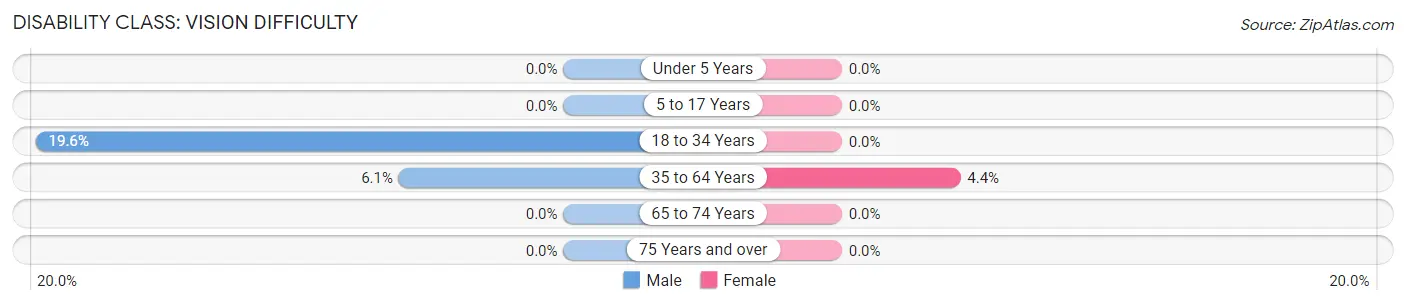
| Age Bracket | Male | Female |
| Under 5 Years | 0 (0.0%) | 0 (0.0%) |
| 5 to 17 Years | 0 (0.0%) | 0 (0.0%) |
| 18 to 34 Years | 29 (19.6%) | 0 (0.0%) |
| 35 to 64 Years | 14 (6.1%) | 12 (4.4%) |
| 65 to 74 Years | 0 (0.0%) | 0 (0.0%) |
| 75 Years and over | 0 (0.0%) | 0 (0.0%) |
Disability Class: Cognitive Difficulty
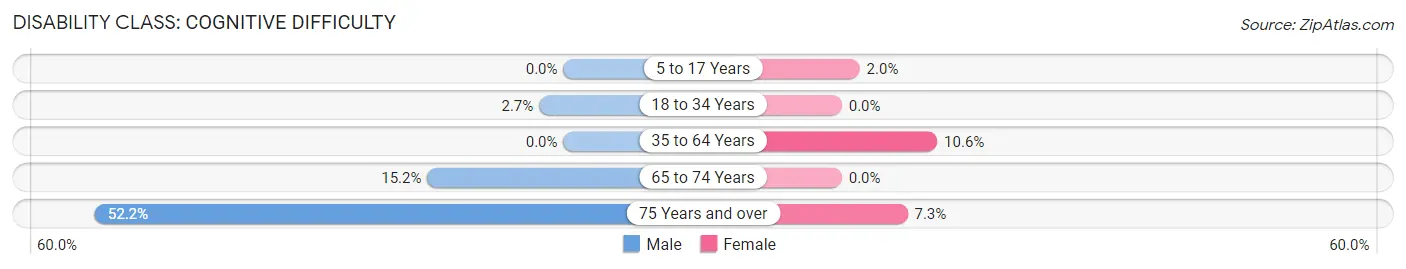
| Age Bracket | Male | Female |
| 5 to 17 Years | 0 (0.0%) | 3 (2.0%) |
| 18 to 34 Years | 4 (2.7%) | 0 (0.0%) |
| 35 to 64 Years | 0 (0.0%) | 29 (10.6%) |
| 65 to 74 Years | 10 (15.1%) | 0 (0.0%) |
| 75 Years and over | 12 (52.2%) | 3 (7.3%) |
Disability Class: Ambulatory Difficulty
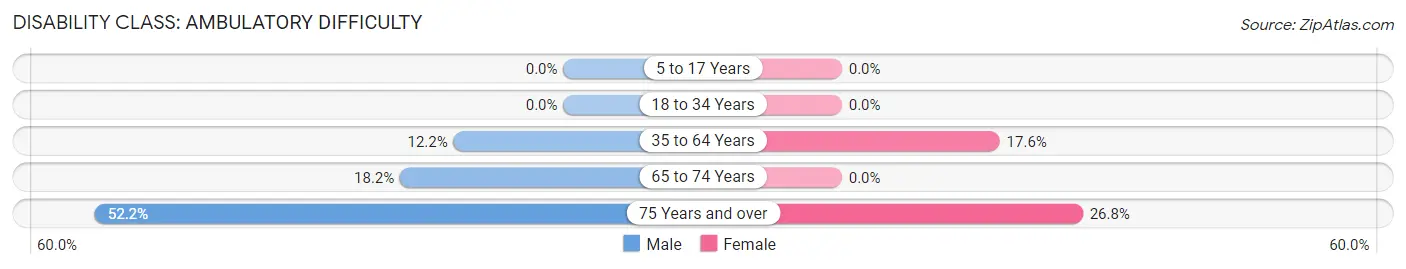
| Age Bracket | Male | Female |
| 5 to 17 Years | 0 (0.0%) | 0 (0.0%) |
| 18 to 34 Years | 0 (0.0%) | 0 (0.0%) |
| 35 to 64 Years | 28 (12.2%) | 48 (17.6%) |
| 65 to 74 Years | 12 (18.2%) | 0 (0.0%) |
| 75 Years and over | 12 (52.2%) | 11 (26.8%) |
Disability Class: Self-Care Difficulty
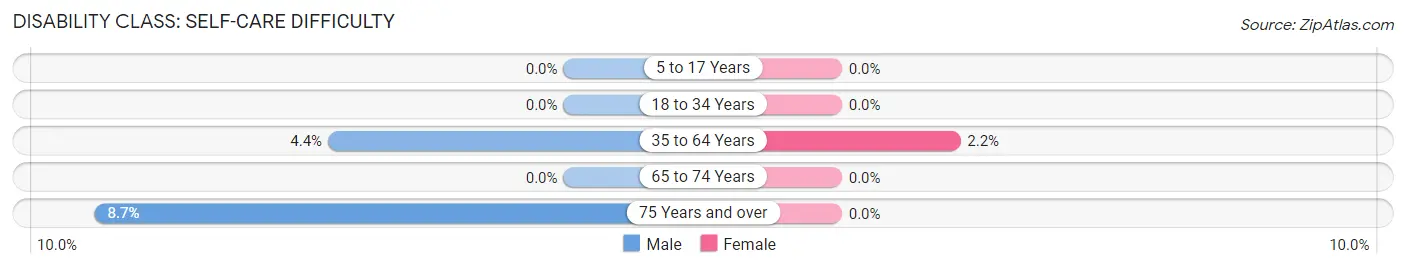
| Age Bracket | Male | Female |
| 5 to 17 Years | 0 (0.0%) | 0 (0.0%) |
| 18 to 34 Years | 0 (0.0%) | 0 (0.0%) |
| 35 to 64 Years | 10 (4.4%) | 6 (2.2%) |
| 65 to 74 Years | 0 (0.0%) | 0 (0.0%) |
| 75 Years and over | 2 (8.7%) | 0 (0.0%) |
Technology Access in Denton
Computing Device Access in Denton
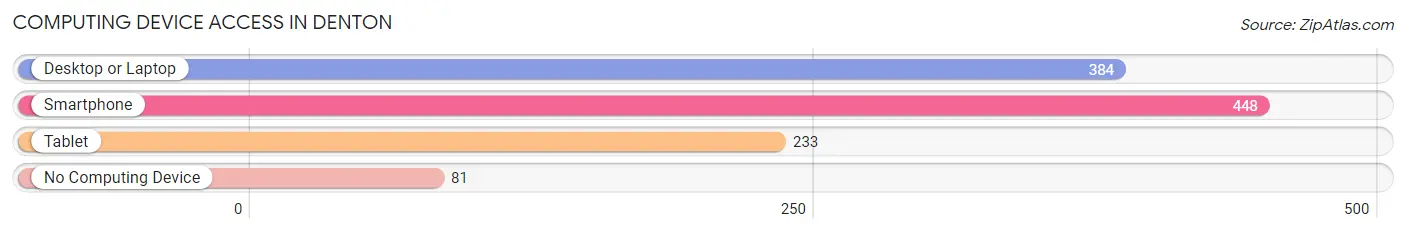
| Device Type | # Households | % Households |
| Desktop or Laptop | 384 | 68.7% |
| Smartphone | 448 | 80.1% |
| Tablet | 233 | 41.7% |
| No Computing Device | 81 | 14.5% |
| Total | 559 | 100.0% |
Internet Access in Denton
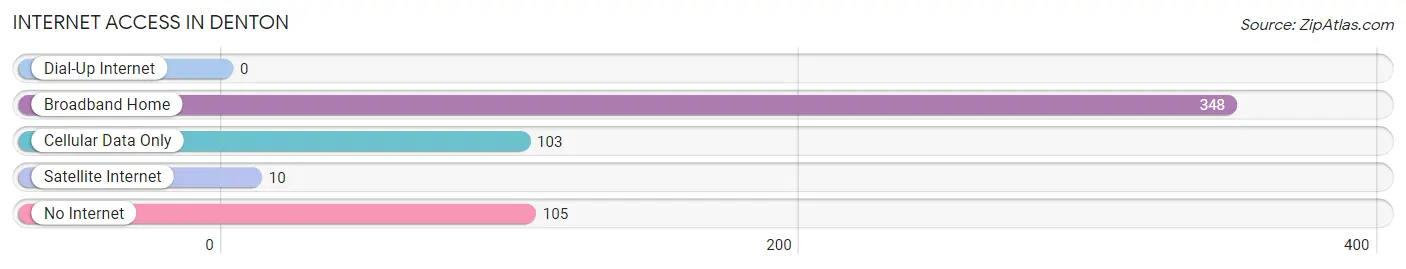
| Internet Type | # Households | % Households |
| Dial-Up Internet | 0 | 0.0% |
| Broadband Home | 348 | 62.3% |
| Cellular Data Only | 103 | 18.4% |
| Satellite Internet | 10 | 1.8% |
| No Internet | 105 | 18.8% |
| Total | 559 | 100.0% |
Denton Summary
Denton is a small town located in Davidson County, North Carolina. It is situated in the Piedmont region of the state, approximately 30 miles north of Winston-Salem. The town was founded in 1836 and has a population of approximately 1,500 people.
Geography
Denton is located in the Piedmont region of North Carolina, which is characterized by rolling hills and flat plains. The town is situated on the banks of the Yadkin River, which is a major tributary of the Catawba River. The town is surrounded by several small towns and rural communities, including Lexington, Thomasville, and High Point. The town is located in the foothills of the Blue Ridge Mountains, which are located to the west.
The climate in Denton is humid subtropical, with hot, humid summers and mild winters. The average annual temperature is around 60 degrees Fahrenheit, with an average high of around 80 degrees in the summer and an average low of around 40 degrees in the winter. The town receives an average of around 45 inches of precipitation per year, with most of it falling in the spring and summer months.
History
Denton was founded in 1836 by a group of settlers from Pennsylvania. The town was named after the nearby Denton Creek, which was named after a local Native American chief. The town was originally a farming community, with the main crops being cotton, tobacco, and corn. The town was also home to several mills, which were used to process the crops.
In the late 19th century, the town began to grow and develop. The railroad was extended to the town in 1887, which allowed for the transportation of goods and people. The town also became a popular tourist destination, with several hotels and resorts being built in the area.
Economy
The economy of Denton is largely based on agriculture and tourism. The town is home to several farms, which produce a variety of crops, including corn, soybeans, and tobacco. The town is also home to several wineries, which produce a variety of wines.
The town is also home to several small businesses, including restaurants, shops, and other services. The town is also home to several manufacturing companies, which produce a variety of products, including furniture, textiles, and electronics.
Demographics
As of the 2010 census, the population of Denton was 1,500 people. The racial makeup of the town was 95.3% White, 2.7% African American, 0.3% Native American, 0.3% Asian, and 1.3% from other races. The median household income was $37,500, and the median family income was $45,000.
Conclusion
Denton is a small town located in Davidson County, North Carolina. It is situated in the Piedmont region of the state, approximately 30 miles north of Winston-Salem. The town was founded in 1836 and has a population of approximately 1,500 people. The economy of Denton is largely based on agriculture and tourism, and the town is home to several small businesses, manufacturing companies, and wineries. The racial makeup of the town is 95.3% White, 2.7% African American, 0.3% Native American, 0.3% Asian, and 1.3% from other races. The median household income was $37,500, and the median family income was $45,000.
Common Questions
What is the Total Population of Denton?
Total Population of Denton is 1,307.
What is the Total Male Population of Denton?
Total Male Population of Denton is 629.
What is the Total Female Population of Denton?
Total Female Population of Denton is 678.
What is the Ratio of Males per 100 Females in Denton?
There are 92.77 Males per 100 Females in Denton.
What is the Ratio of Females per 100 Males in Denton?
There are 107.79 Females per 100 Males in Denton.
What is the Median Population Age in Denton?
Median Population Age in Denton is 35.9 Years.
What is the Average Family Size in Denton
Average Family Size in Denton is 3.0 People.
What is the Average Household Size in Denton
Average Household Size in Denton is 2.3 People.
What is Per Capita Income in Denton?
Per Capita income in Denton is $22,987.
What is the Median Family Income in Denton?
Median Family Income in Denton is $53,125.
What is the Median Household income in Denton?
Median Household Income in Denton is $44,539.
What is Income or Wage Gap in Denton?
Income or Wage Gap in Denton is 34.6%.
Women in Denton earn 65.4 cents for every dollar earned by a man.
What is Inequality or Gini Index in Denton?
Inequality or Gini Index in Denton is 0.39.
How Large is the Labor Force in Denton?
There are 630 People in the Labor Forcein in Denton.
What is the Percentage of People in the Labor Force in Denton?
60.8% of People are in the Labor Force in Denton.
What is the Unemployment Rate in Denton?
Unemployment Rate in Denton is 6.8%.