Barker Heights, NC
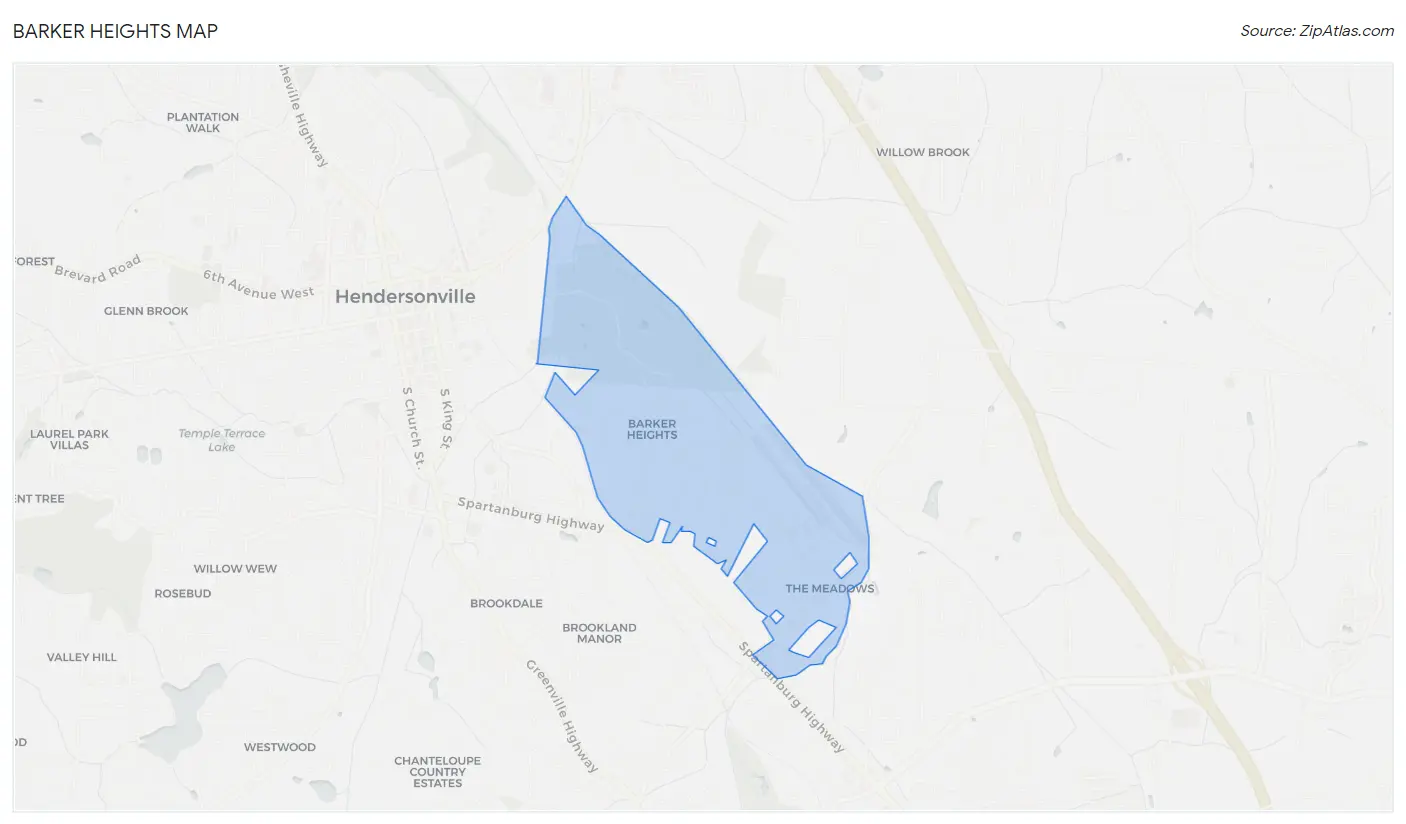
Barker Heights Map
Barker Heights Overview
978
TOTAL POPULATION
533
MALE POPULATION
445
FEMALE POPULATION
119.78
MALES / 100 FEMALES
83.49
FEMALES / 100 MALES
42.6
MEDIAN AGE
2.5
AVG FAMILY SIZE
2.1
AVG HOUSEHOLD SIZE
$24,419
PER CAPITA INCOME
20.7%
WAGE / INCOME GAP [ % ]
79.3¢/ $1
WAGE / INCOME GAP [ $ ]
0.40
INEQUALITY / GINI INDEX
508
LABOR FORCE [ PEOPLE ]
64.5%
PERCENT IN LABOR FORCE
1.2%
UNEMPLOYMENT RATE
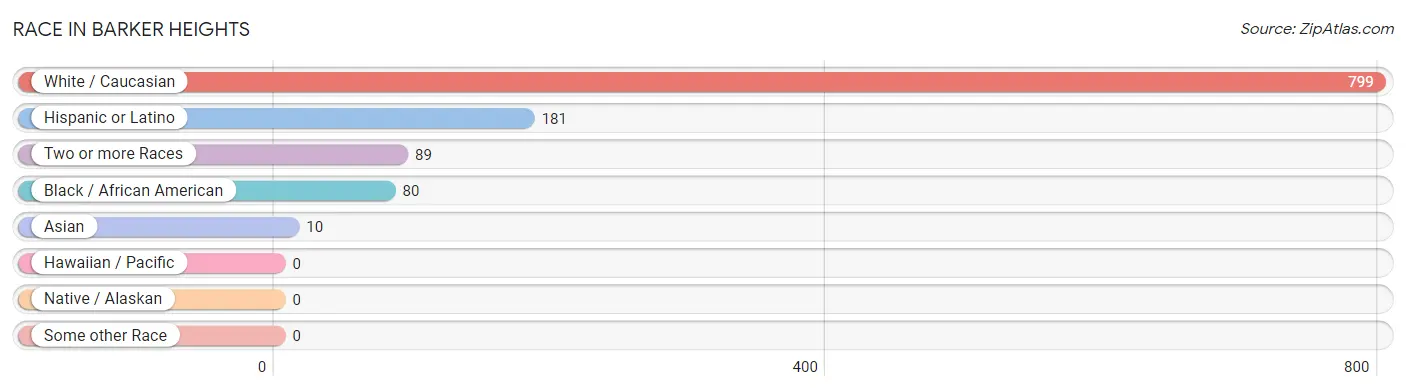
Race in Barker Heights
The most populous races in Barker Heights are White / Caucasian (799 | 81.7%), Hispanic or Latino (181 | 18.5%), and Two or more Races (89 | 9.1%).
| Race | # Population | % Population |
| Asian | 10 | 1.0% |
| Black / African American | 80 | 8.2% |
| Hawaiian / Pacific | 0 | 0.0% |
| Hispanic or Latino | 181 | 18.5% |
| Native / Alaskan | 0 | 0.0% |
| White / Caucasian | 799 | 81.7% |
| Two or more Races | 89 | 9.1% |
| Some other Race | 0 | 0.0% |
| Total | 978 | 100.0% |
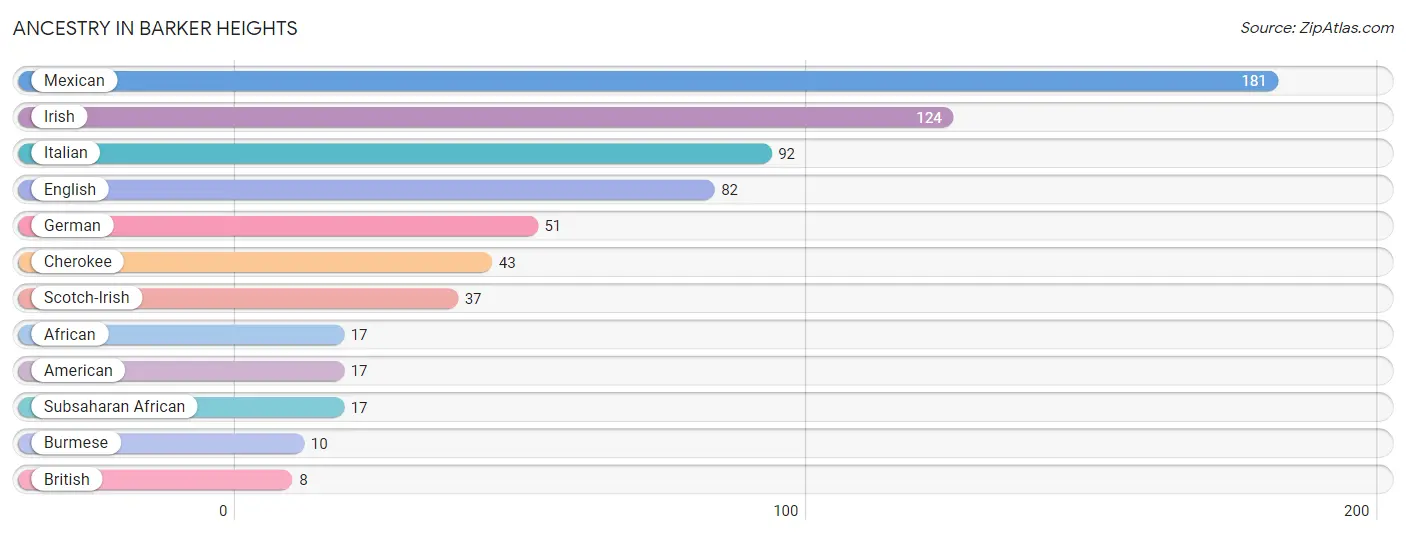
Ancestry in Barker Heights
The most populous ancestries reported in Barker Heights are Mexican (181 | 18.5%), Irish (124 | 12.7%), Italian (92 | 9.4%), English (82 | 8.4%), and German (51 | 5.2%), together accounting for 54.2% of all Barker Heights residents.
| Ancestry | # Population | % Population |
| African | 17 | 1.7% |
| American | 17 | 1.7% |
| British | 8 | 0.8% |
| Burmese | 10 | 1.0% |
| Cherokee | 43 | 4.4% |
| English | 82 | 8.4% |
| German | 51 | 5.2% |
| Irish | 124 | 12.7% |
| Italian | 92 | 9.4% |
| Mexican | 181 | 18.5% |
| Scotch-Irish | 37 | 3.8% |
| Subsaharan African | 17 | 1.7% | View All 12 Rows |
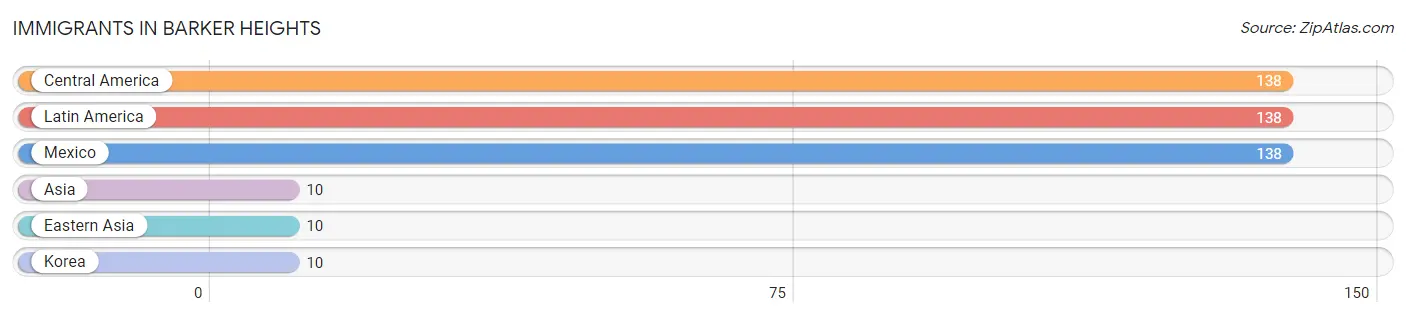
Immigrants in Barker Heights
The most numerous immigrant groups reported in Barker Heights came from Central America (138 | 14.1%), Latin America (138 | 14.1%), Mexico (138 | 14.1%), Asia (10 | 1.0%), and Eastern Asia (10 | 1.0%), together accounting for 44.4% of all Barker Heights residents.
| Immigration Origin | # Population | % Population |
| Asia | 10 | 1.0% |
| Central America | 138 | 14.1% |
| Eastern Asia | 10 | 1.0% |
| Korea | 10 | 1.0% |
| Latin America | 138 | 14.1% |
| Mexico | 138 | 14.1% | View All 6 Rows |
Sex and Age in Barker Heights
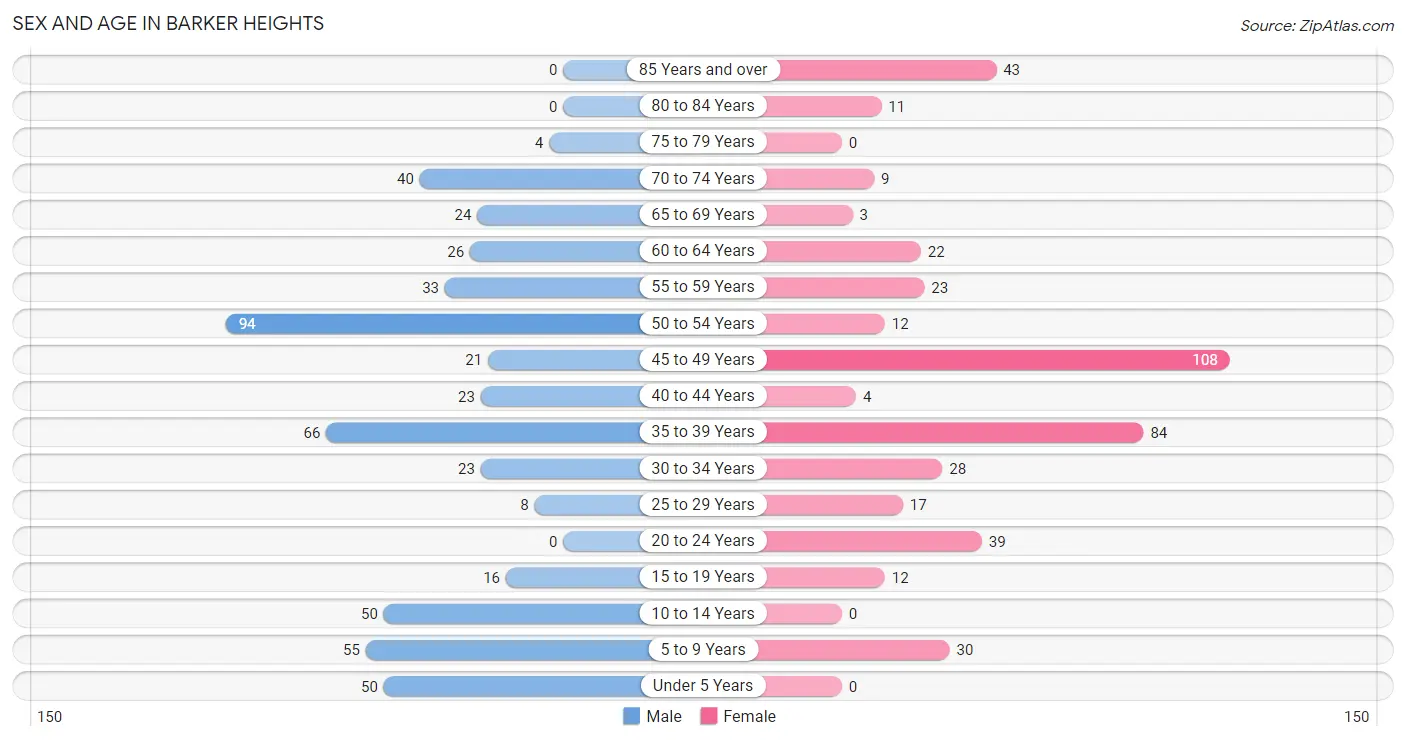
Sex and Age in Barker Heights
The most populous age groups in Barker Heights are 50 to 54 Years (94 | 17.6%) for men and 45 to 49 Years (108 | 24.3%) for women.
| Age Bracket | Male | Female |
| Under 5 Years | 50 (9.4%) | 0 (0.0%) |
| 5 to 9 Years | 55 (10.3%) | 30 (6.7%) |
| 10 to 14 Years | 50 (9.4%) | 0 (0.0%) |
| 15 to 19 Years | 16 (3.0%) | 12 (2.7%) |
| 20 to 24 Years | 0 (0.0%) | 39 (8.8%) |
| 25 to 29 Years | 8 (1.5%) | 17 (3.8%) |
| 30 to 34 Years | 23 (4.3%) | 28 (6.3%) |
| 35 to 39 Years | 66 (12.4%) | 84 (18.9%) |
| 40 to 44 Years | 23 (4.3%) | 4 (0.9%) |
| 45 to 49 Years | 21 (3.9%) | 108 (24.3%) |
| 50 to 54 Years | 94 (17.6%) | 12 (2.7%) |
| 55 to 59 Years | 33 (6.2%) | 23 (5.2%) |
| 60 to 64 Years | 26 (4.9%) | 22 (4.9%) |
| 65 to 69 Years | 24 (4.5%) | 3 (0.7%) |
| 70 to 74 Years | 40 (7.5%) | 9 (2.0%) |
| 75 to 79 Years | 4 (0.7%) | 0 (0.0%) |
| 80 to 84 Years | 0 (0.0%) | 11 (2.5%) |
| 85 Years and over | 0 (0.0%) | 43 (9.7%) |
| Total | 533 (100.0%) | 445 (100.0%) |
Families and Households in Barker Heights
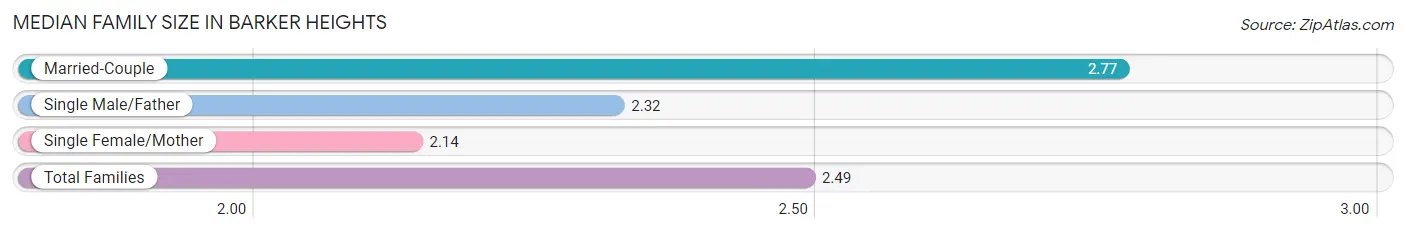
Median Family Size in Barker Heights
The median family size in Barker Heights is 2.49 persons per family, with married-couple families (168 | 52.0%) accounting for the largest median family size of 2.77 persons per family. On the other hand, single female/mother families (117 | 36.2%) represent the smallest median family size with 2.14 persons per family.
| Family Type | # Families | Family Size |
| Married-Couple | 168 (52.0%) | 2.77 |
| Single Male/Father | 38 (11.8%) | 2.32 |
| Single Female/Mother | 117 (36.2%) | 2.14 |
| Total Families | 323 (100.0%) | 2.49 |
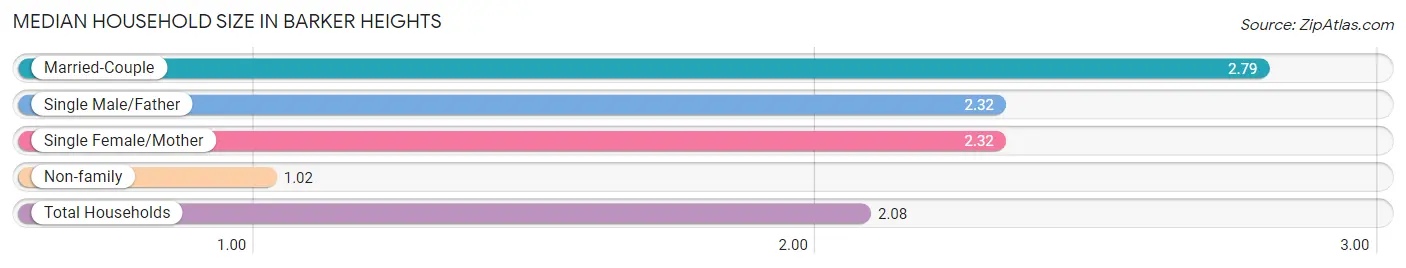
Median Household Size in Barker Heights
The median household size in Barker Heights is 2.08 persons per household, with married-couple households (168 | 35.7%) accounting for the largest median household size of 2.79 persons per household. non-family households (147 | 31.3%) represent the smallest median household size with 1.02 persons per household.
| Household Type | # Households | Household Size |
| Married-Couple | 168 (35.7%) | 2.79 |
| Single Male/Father | 38 (8.1%) | 2.32 |
| Single Female/Mother | 117 (24.9%) | 2.32 |
| Non-family | 147 (31.3%) | 1.02 |
| Total Households | 470 (100.0%) | 2.08 |
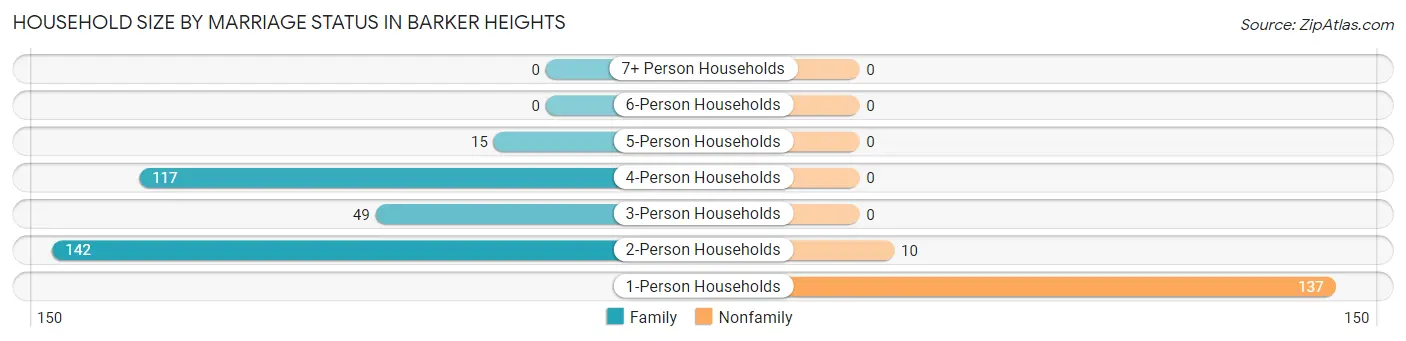
Household Size by Marriage Status in Barker Heights
Out of a total of 470 households in Barker Heights, 323 (68.7%) are family households, while 147 (31.3%) are nonfamily households. The most numerous type of family households are 2-person households, comprising 142, and the most common type of nonfamily households are 1-person households, comprising 137.
| Household Size | Family Households | Nonfamily Households |
| 1-Person Households | - | 137 (29.1%) |
| 2-Person Households | 142 (30.2%) | 10 (2.1%) |
| 3-Person Households | 49 (10.4%) | 0 (0.0%) |
| 4-Person Households | 117 (24.9%) | 0 (0.0%) |
| 5-Person Households | 15 (3.2%) | 0 (0.0%) |
| 6-Person Households | 0 (0.0%) | 0 (0.0%) |
| 7+ Person Households | 0 (0.0%) | 0 (0.0%) |
| Total | 323 (68.7%) | 147 (31.3%) |
Female Fertility in Barker Heights
Fertility by Age in Barker Heights
Average fertility rate in Barker Heights is 48.0 births per 1,000 women. Women in the age bracket of 20 to 34 years have the highest fertility rate with 167.0 births per 1,000 women. Women in the age bracket of 20 to 34 years acount for 100.0% of all women with births.
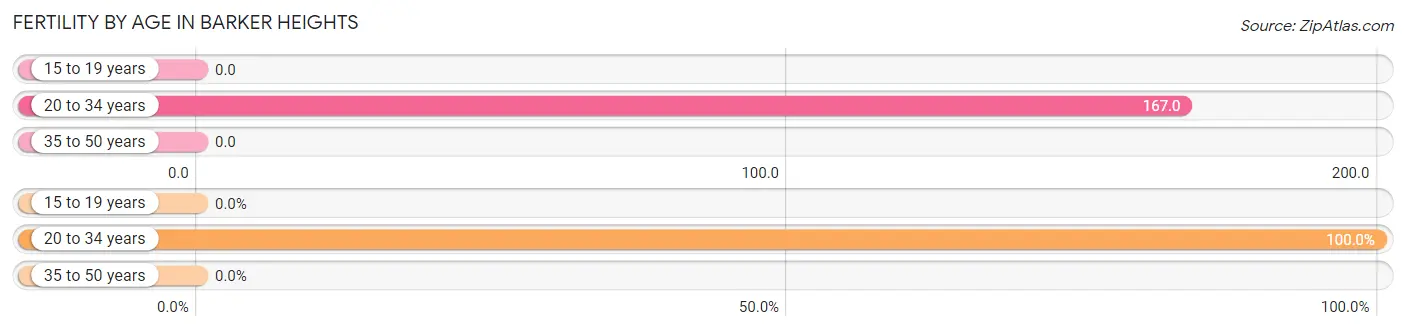
| Age Bracket | Women with Births | Births / 1,000 Women |
| 15 to 19 years | 0 (0.0%) | 0.0 |
| 20 to 34 years | 14 (100.0%) | 167.0 |
| 35 to 50 years | 0 (0.0%) | 0.0 |
| Total | 14 (100.0%) | 48.0 |
Fertility by Age by Marriage Status in Barker Heights
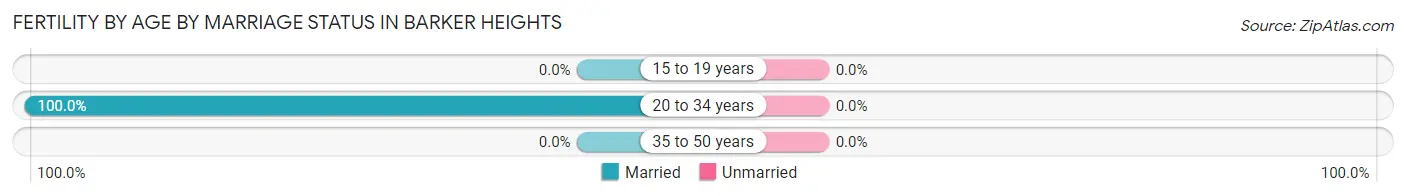
| Age Bracket | Married | Unmarried |
| 15 to 19 years | 0 (0.0%) | 0 (0.0%) |
| 20 to 34 years | 14 (100.0%) | 0 (0.0%) |
| 35 to 50 years | 0 (0.0%) | 0 (0.0%) |
| Total | 14 (100.0%) | 0 (0.0%) |
Fertility by Education in Barker Heights
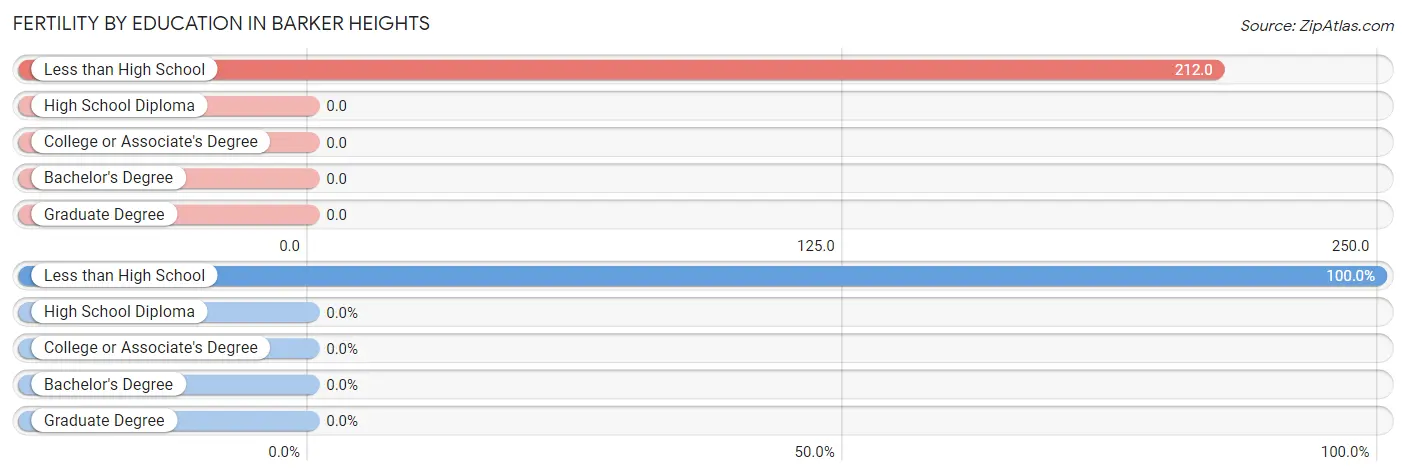
| Educational Attainment | Women with Births | Births / 1,000 Women |
| Less than High School | 14 (100.0%) | 212.0 |
| High School Diploma | 0 (0.0%) | 0.0 |
| College or Associate's Degree | 0 (0.0%) | 0.0 |
| Bachelor's Degree | 0 (0.0%) | 0.0 |
| Graduate Degree | 0 (0.0%) | 0.0 |
| Total | 14 (100.0%) | 48.0 |
Fertility by Education by Marriage Status in Barker Heights
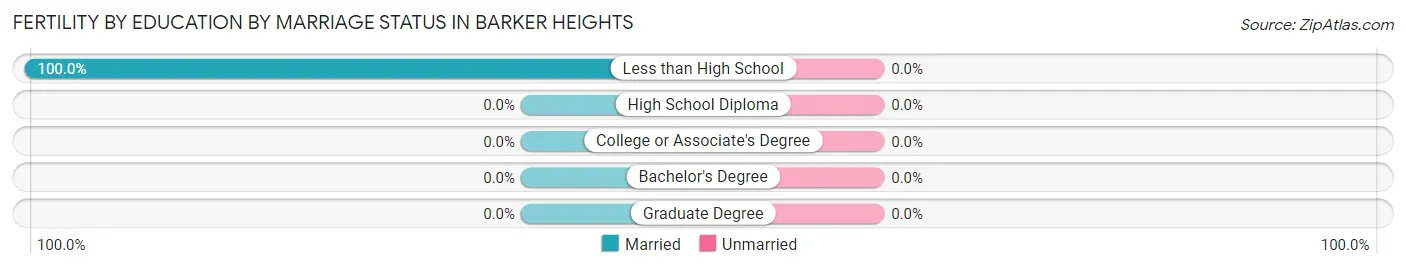
| Educational Attainment | Married | Unmarried |
| Less than High School | 14 (100.0%) | 0 (0.0%) |
| High School Diploma | 0 (0.0%) | 0 (0.0%) |
| College or Associate's Degree | 0 (0.0%) | 0 (0.0%) |
| Bachelor's Degree | 0 (0.0%) | 0 (0.0%) |
| Graduate Degree | 0 (0.0%) | 0 (0.0%) |
| Total | 14 (100.0%) | 0 (0.0%) |
Income in Barker Heights
Income Overview in Barker Heights
| Characteristic | Number | Measure |
| Per Capita Income | 978 | $24,419 |
| Median Family Income | 323 | $0 |
| Mean Family Income | 323 | $54,476 |
| Median Household Income | 470 | $0 |
| Mean Household Income | 470 | $52,884 |
| Income Deficit | 323 | $0 |
| Wage / Income Gap (%) | 978 | 20.67% |
| Wage / Income Gap ($) | 978 | 79.33¢ per $1 |
| Gini / Inequality Index | 978 | 0.40 |
Earnings by Sex in Barker Heights
Average Earnings in Barker Heights are $28,995, $35,750 for men and $28,359 for women, a difference of 20.7%.
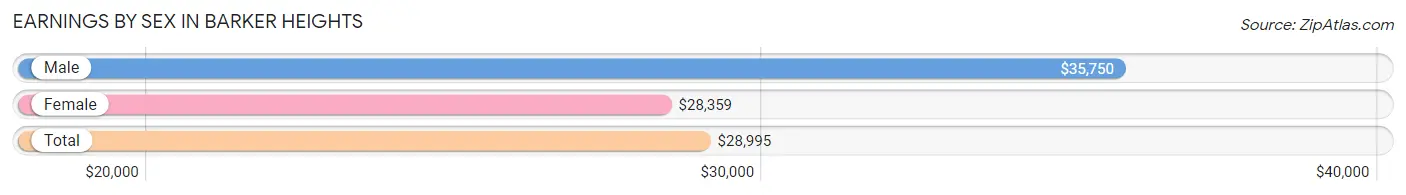
| Sex | Number | Average Earnings |
| Male | 284 (53.6%) | $35,750 |
| Female | 246 (46.4%) | $28,359 |
| Total | 530 (100.0%) | $28,995 |
Earnings by Sex by Income Bracket in Barker Heights
The most common earnings brackets in Barker Heights are $12,500 to $14,999 for men (89 | 31.3%) and $25,000 to $29,999 for women (64 | 26.0%).
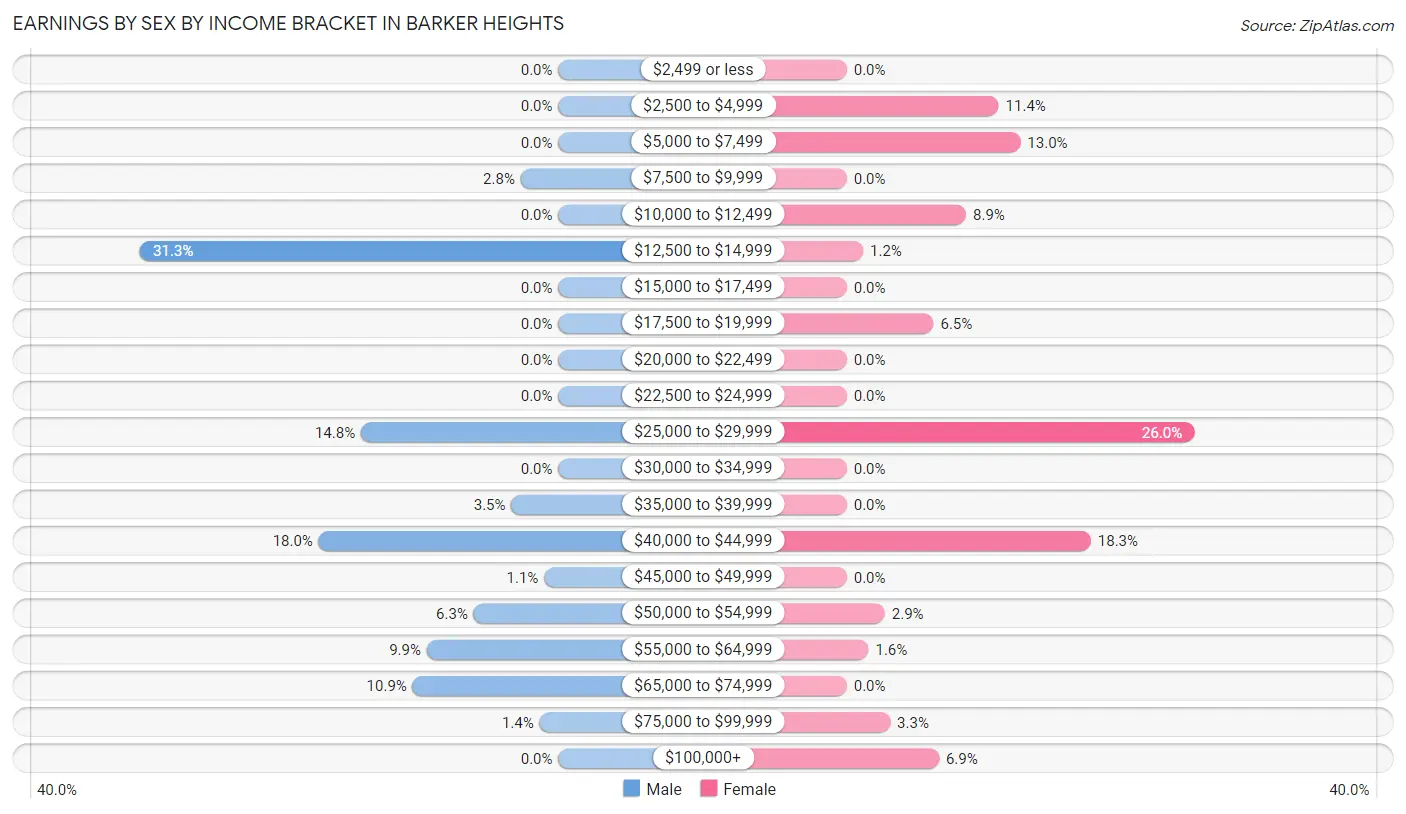
| Income | Male | Female |
| $2,499 or less | 0 (0.0%) | 0 (0.0%) |
| $2,500 to $4,999 | 0 (0.0%) | 28 (11.4%) |
| $5,000 to $7,499 | 0 (0.0%) | 32 (13.0%) |
| $7,500 to $9,999 | 8 (2.8%) | 0 (0.0%) |
| $10,000 to $12,499 | 0 (0.0%) | 22 (8.9%) |
| $12,500 to $14,999 | 89 (31.3%) | 3 (1.2%) |
| $15,000 to $17,499 | 0 (0.0%) | 0 (0.0%) |
| $17,500 to $19,999 | 0 (0.0%) | 16 (6.5%) |
| $20,000 to $22,499 | 0 (0.0%) | 0 (0.0%) |
| $22,500 to $24,999 | 0 (0.0%) | 0 (0.0%) |
| $25,000 to $29,999 | 42 (14.8%) | 64 (26.0%) |
| $30,000 to $34,999 | 0 (0.0%) | 0 (0.0%) |
| $35,000 to $39,999 | 10 (3.5%) | 0 (0.0%) |
| $40,000 to $44,999 | 51 (18.0%) | 45 (18.3%) |
| $45,000 to $49,999 | 3 (1.1%) | 0 (0.0%) |
| $50,000 to $54,999 | 18 (6.3%) | 7 (2.9%) |
| $55,000 to $64,999 | 28 (9.9%) | 4 (1.6%) |
| $65,000 to $74,999 | 31 (10.9%) | 0 (0.0%) |
| $75,000 to $99,999 | 4 (1.4%) | 8 (3.3%) |
| $100,000+ | 0 (0.0%) | 17 (6.9%) |
| Total | 284 (100.0%) | 246 (100.0%) |
Earnings by Sex by Educational Attainment in Barker Heights
Average earnings in Barker Heights are $35,750 for men and $27,750 for women, a difference of 22.4%. Men with an educational attainment of high school diploma enjoy the highest average annual earnings of $43,333, while those with high school diploma education earn the least with $43,333. Women with an educational attainment of college or associate's degree earn the most with the average annual earnings of $41,149, while those with high school diploma education have the smallest earnings of $18,750.
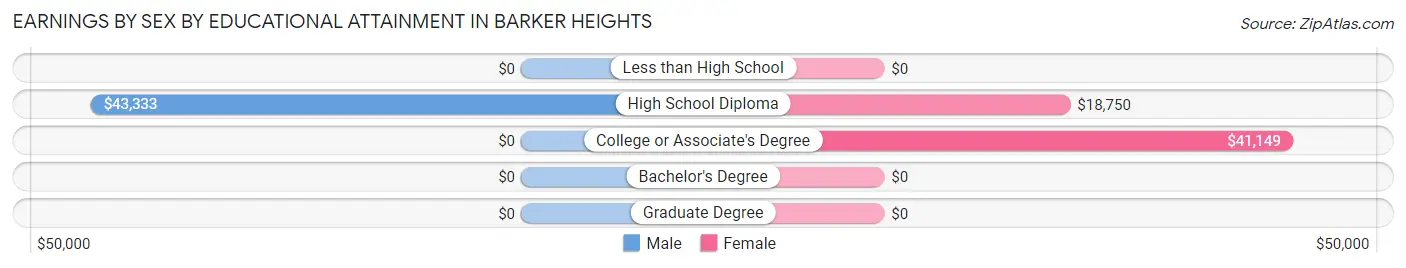
| Educational Attainment | Male Income | Female Income |
| Less than High School | - | - |
| High School Diploma | $43,333 | $18,750 |
| College or Associate's Degree | - | - |
| Bachelor's Degree | - | - |
| Graduate Degree | - | - |
| Total | $35,750 | $27,750 |
Family Income in Barker Heights
Family Income Brackets in Barker Heights
According to the Barker Heights family income data, there are 93 families falling into the $75,000 to $99,999 income range, which is the most common income bracket and makes up 28.8% of all families.
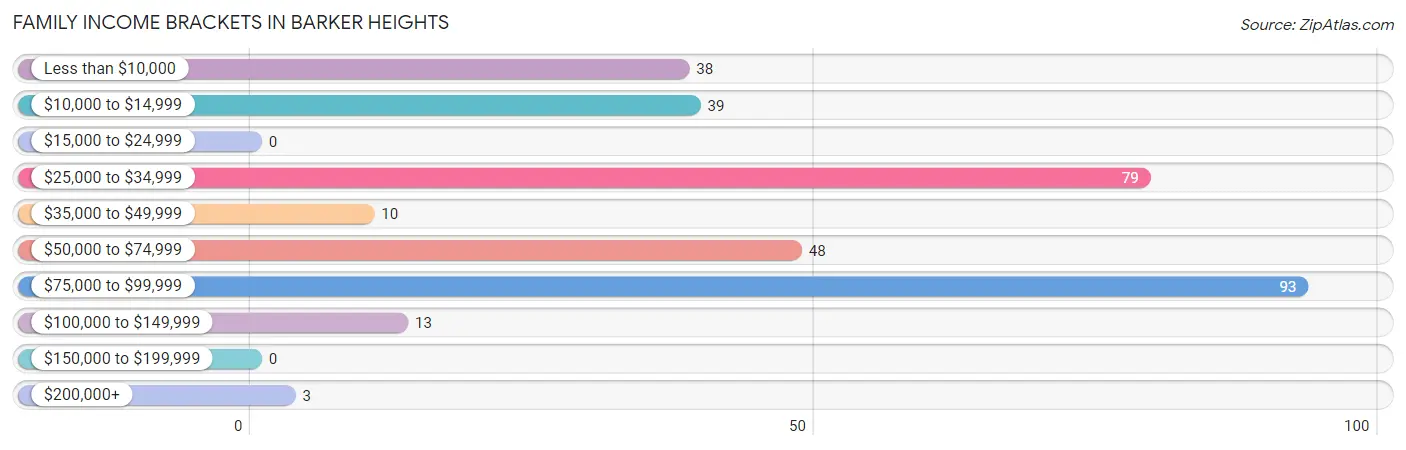
| Income Bracket | # Families | % Families |
| Less than $10,000 | 38 | 11.8% |
| $10,000 to $14,999 | 39 | 12.1% |
| $15,000 to $24,999 | 0 | 0.0% |
| $25,000 to $34,999 | 79 | 24.5% |
| $35,000 to $49,999 | 10 | 3.1% |
| $50,000 to $74,999 | 48 | 14.9% |
| $75,000 to $99,999 | 93 | 28.8% |
| $100,000 to $149,999 | 13 | 4.0% |
| $150,000 to $199,999 | 0 | 0.0% |
| $200,000+ | 3 | 0.9% |
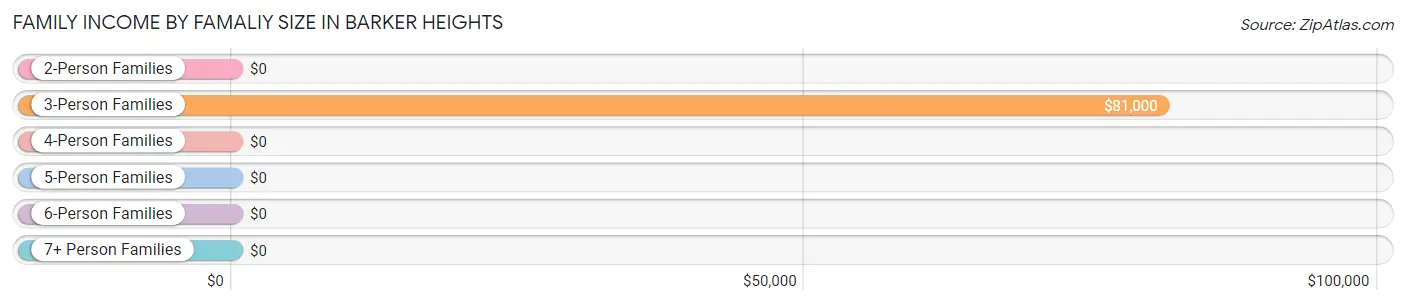
Family Income by Famaliy Size in Barker Heights
3-person families (28 | 8.7%) account for the highest median family income in Barker Heights with $81,000 per family, while 3-person families (28 | 8.7%) have the highest median income of $27,000 per family member.
| Income Bracket | # Families | Median Income |
| 2-Person Families | 166 (51.4%) | $0 |
| 3-Person Families | 28 (8.7%) | $81,000 |
| 4-Person Families | 114 (35.3%) | $0 |
| 5-Person Families | 15 (4.6%) | $0 |
| 6-Person Families | 0 (0.0%) | $0 |
| 7+ Person Families | 0 (0.0%) | $0 |
| Total | 323 (100.0%) | $0 |
Family Income by Number of Earners in Barker Heights
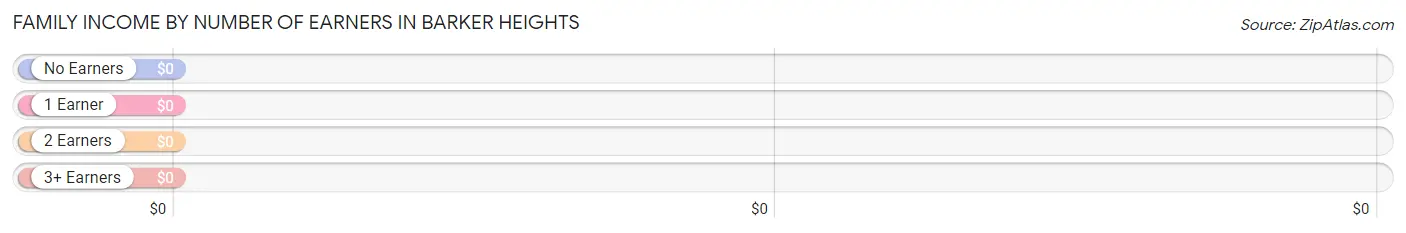
| Number of Earners | # Families | Median Income |
| No Earners | 39 (12.1%) | $0 |
| 1 Earner | 131 (40.6%) | $0 |
| 2 Earners | 153 (47.4%) | $0 |
| 3+ Earners | 0 (0.0%) | $0 |
| Total | 323 (100.0%) | $0 |
Household Income in Barker Heights
Household Income Brackets in Barker Heights
With 147 households falling in the category, the $25,000 to $34,999 income range is the most frequent in Barker Heights, accounting for 31.3% of all households.
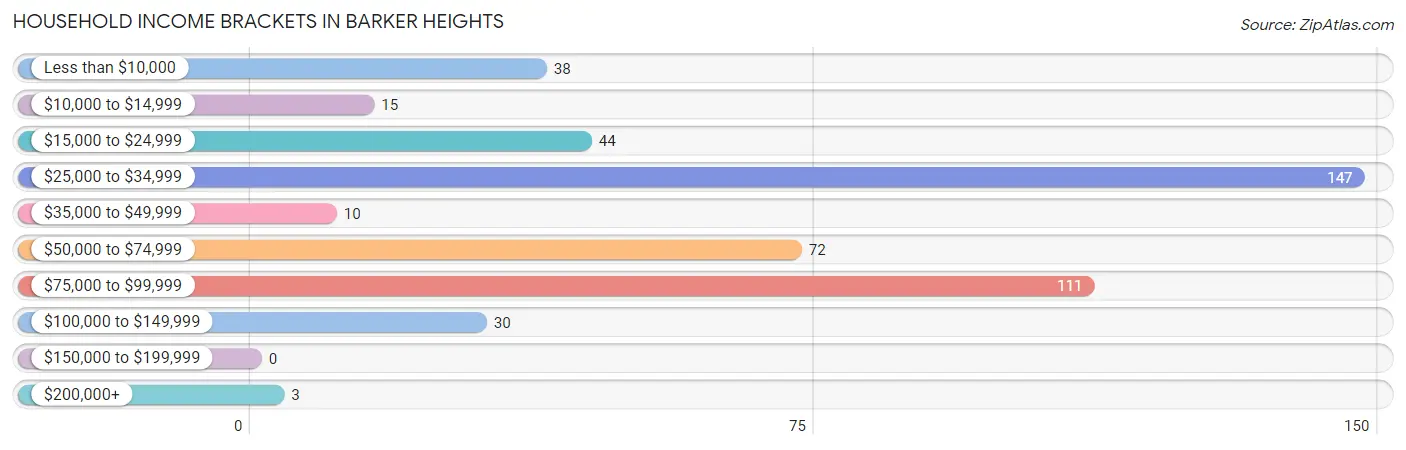
| Income Bracket | # Households | % Households |
| Less than $10,000 | 38 | 8.1% |
| $10,000 to $14,999 | 15 | 3.2% |
| $15,000 to $24,999 | 44 | 9.4% |
| $25,000 to $34,999 | 147 | 31.3% |
| $35,000 to $49,999 | 10 | 2.1% |
| $50,000 to $74,999 | 72 | 15.3% |
| $75,000 to $99,999 | 111 | 23.6% |
| $100,000 to $149,999 | 30 | 6.4% |
| $150,000 to $199,999 | 0 | 0.0% |
| $200,000+ | 3 | 0.6% |
Household Income by Householder Age in Barker Heights
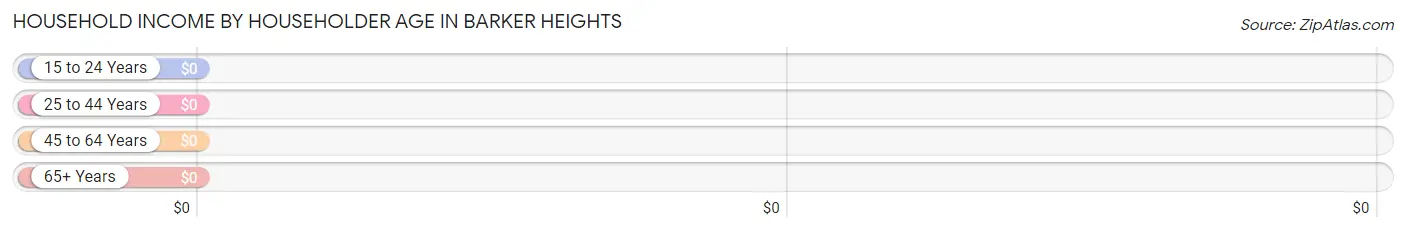
| Income Bracket | # Households | Median Income |
| 15 to 24 Years | 39 (8.3%) | $0 |
| 25 to 44 Years | 155 (33.0%) | $0 |
| 45 to 64 Years | 185 (39.4%) | $0 |
| 65+ Years | 91 (19.4%) | $0 |
| Total | 470 (100.0%) | $0 |
Poverty in Barker Heights
Income Below Poverty by Sex and Age in Barker Heights
With 27.0% poverty level for males and 40.0% for females among the residents of Barker Heights, 12 to 14 year old males and 6 to 11 year old females are the most vulnerable to poverty, with 50 males (100.0%) and 30 females (100.0%) in their respective age groups living below the poverty level.
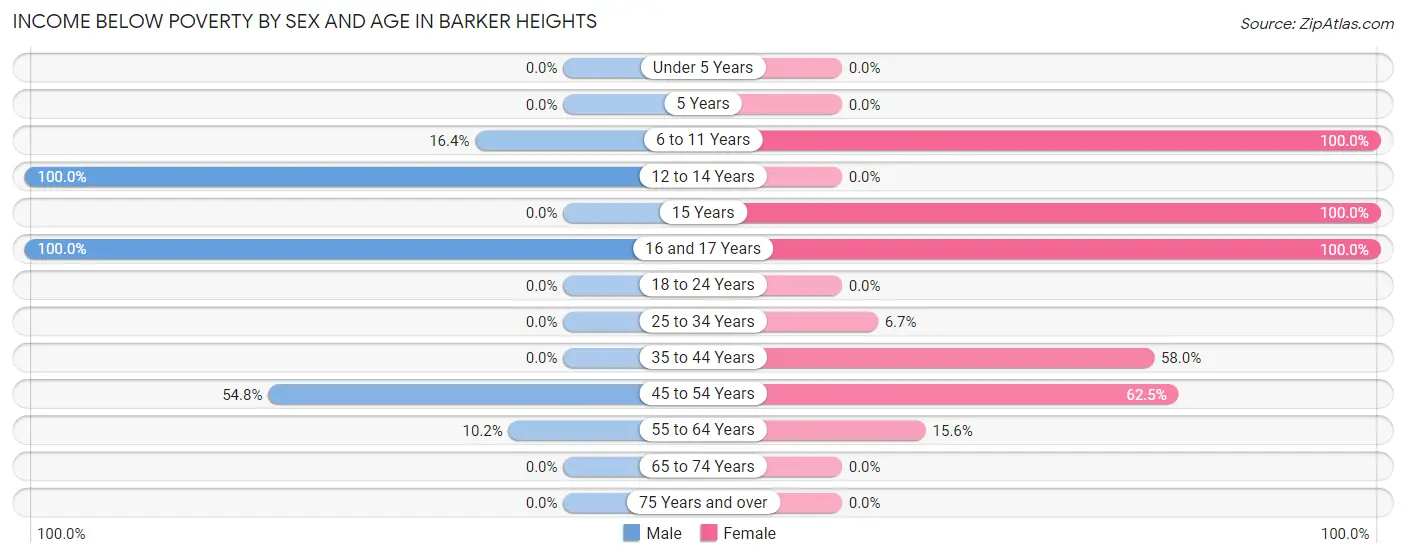
| Age Bracket | Male | Female |
| Under 5 Years | 0 (0.0%) | 0 (0.0%) |
| 5 Years | 0 (0.0%) | 0 (0.0%) |
| 6 to 11 Years | 9 (16.4%) | 30 (100.0%) |
| 12 to 14 Years | 50 (100.0%) | 0 (0.0%) |
| 15 Years | 0 (0.0%) | 6 (100.0%) |
| 16 and 17 Years | 16 (100.0%) | 6 (100.0%) |
| 18 to 24 Years | 0 (0.0%) | 0 (0.0%) |
| 25 to 34 Years | 0 (0.0%) | 3 (6.7%) |
| 35 to 44 Years | 0 (0.0%) | 51 (58.0%) |
| 45 to 54 Years | 63 (54.8%) | 75 (62.5%) |
| 55 to 64 Years | 6 (10.2%) | 7 (15.6%) |
| 65 to 74 Years | 0 (0.0%) | 0 (0.0%) |
| 75 Years and over | 0 (0.0%) | 0 (0.0%) |
| Total | 144 (27.0%) | 178 (40.0%) |
Income Above Poverty by Sex and Age in Barker Heights
According to the poverty statistics in Barker Heights, males aged under 5 years and females aged 18 to 24 years are the age groups that are most secure financially, with 100.0% of males and 100.0% of females in these age groups living above the poverty line.
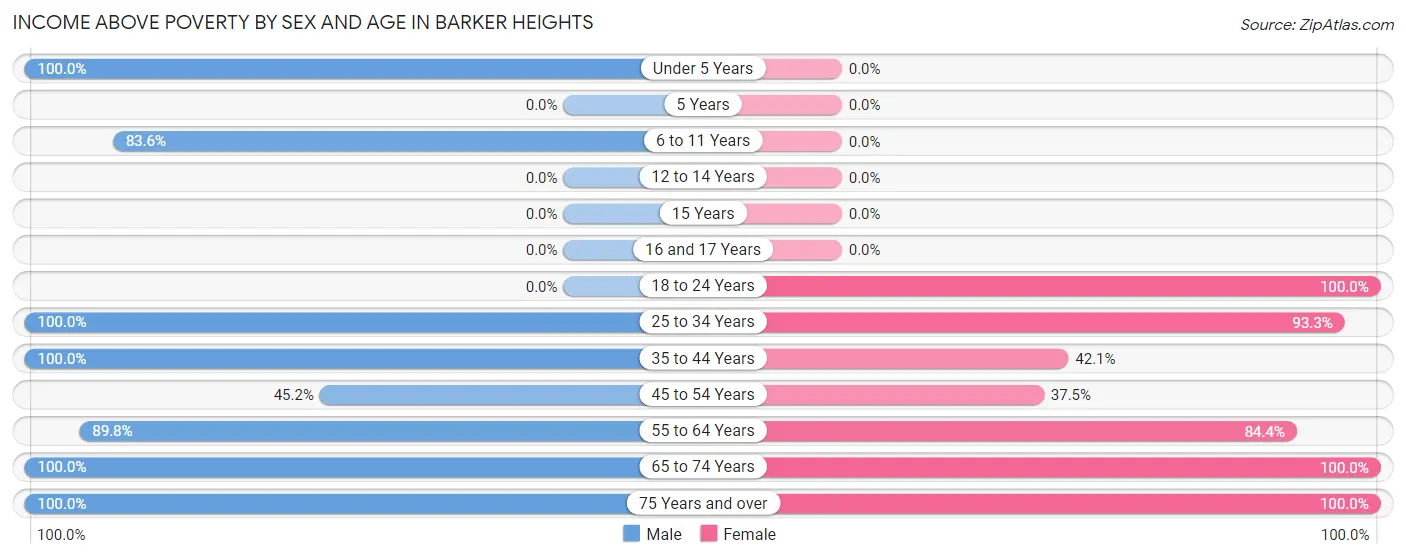
| Age Bracket | Male | Female |
| Under 5 Years | 50 (100.0%) | 0 (0.0%) |
| 5 Years | 0 (0.0%) | 0 (0.0%) |
| 6 to 11 Years | 46 (83.6%) | 0 (0.0%) |
| 12 to 14 Years | 0 (0.0%) | 0 (0.0%) |
| 15 Years | 0 (0.0%) | 0 (0.0%) |
| 16 and 17 Years | 0 (0.0%) | 0 (0.0%) |
| 18 to 24 Years | 0 (0.0%) | 39 (100.0%) |
| 25 to 34 Years | 31 (100.0%) | 42 (93.3%) |
| 35 to 44 Years | 89 (100.0%) | 37 (42.0%) |
| 45 to 54 Years | 52 (45.2%) | 45 (37.5%) |
| 55 to 64 Years | 53 (89.8%) | 38 (84.4%) |
| 65 to 74 Years | 64 (100.0%) | 12 (100.0%) |
| 75 Years and over | 4 (100.0%) | 54 (100.0%) |
| Total | 389 (73.0%) | 267 (60.0%) |
Income Below Poverty Among Married-Couple Families in Barker Heights
The poverty statistics for married-couple families in Barker Heights show that 41.1% or 69 of the total 168 families live below the poverty line. Families with 1 or 2 children have the highest poverty rate of 50.8%, comprising of 63 families. On the other hand, families with no children have the lowest poverty rate of 13.6%, which includes 6 families.
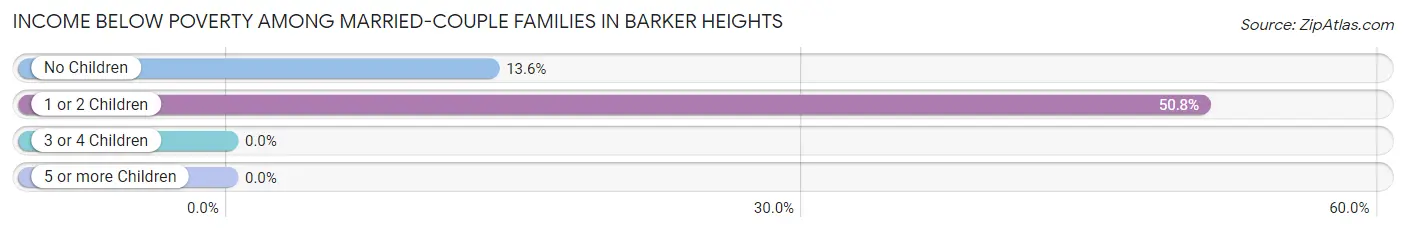
| Children | Above Poverty | Below Poverty |
| No Children | 38 (86.4%) | 6 (13.6%) |
| 1 or 2 Children | 61 (49.2%) | 63 (50.8%) |
| 3 or 4 Children | 0 (0.0%) | 0 (0.0%) |
| 5 or more Children | 0 (0.0%) | 0 (0.0%) |
| Total | 99 (58.9%) | 69 (41.1%) |
Income Below Poverty Among Single-Parent Households in Barker Heights

| Children | Single Father | Single Mother |
| No Children | 0 (0.0%) | 0 (0.0%) |
| 1 or 2 Children | 0 (0.0%) | 56 (100.0%) |
| 3 or 4 Children | 0 (0.0%) | 15 (100.0%) |
| 5 or more Children | 0 (0.0%) | 0 (0.0%) |
| Total | 0 (0.0%) | 71 (60.7%) |
Income Below Poverty Among Married-Couple vs Single-Parent Households in Barker Heights
The poverty data for Barker Heights shows that 69 of the married-couple family households (41.1%) and 71 of the single-parent households (45.8%) are living below the poverty level. Within the married-couple family households, those with 1 or 2 children have the highest poverty rate, with 63 households (50.8%) falling below the poverty line. Among the single-parent households, those with 1 or 2 children have the highest poverty rate, with 56 household (100.0%) living below poverty.
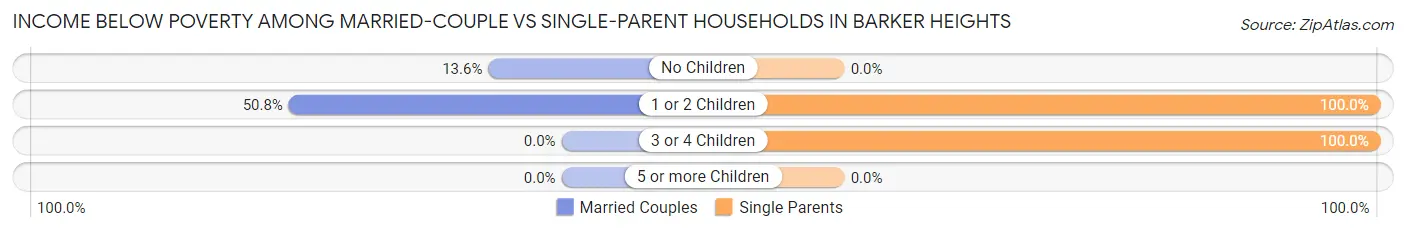
| Children | Married-Couple Families | Single-Parent Households |
| No Children | 6 (13.6%) | 0 (0.0%) |
| 1 or 2 Children | 63 (50.8%) | 56 (100.0%) |
| 3 or 4 Children | 0 (0.0%) | 15 (100.0%) |
| 5 or more Children | 0 (0.0%) | 0 (0.0%) |
| Total | 69 (41.1%) | 71 (45.8%) |
Employment Characteristics in Barker Heights
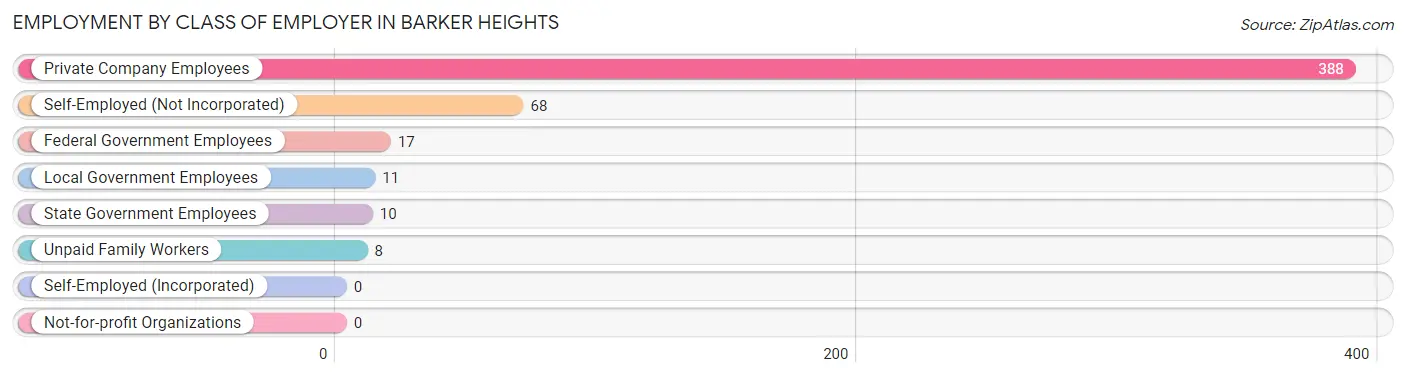
Employment by Class of Employer in Barker Heights
Among the 502 employed individuals in Barker Heights, private company employees (388 | 77.3%), self-employed (not incorporated) (68 | 13.6%), and federal government employees (17 | 3.4%) make up the most common classes of employment.
| Employer Class | # Employees | % Employees |
| Private Company Employees | 388 | 77.3% |
| Self-Employed (Incorporated) | 0 | 0.0% |
| Self-Employed (Not Incorporated) | 68 | 13.6% |
| Not-for-profit Organizations | 0 | 0.0% |
| Local Government Employees | 11 | 2.2% |
| State Government Employees | 10 | 2.0% |
| Federal Government Employees | 17 | 3.4% |
| Unpaid Family Workers | 8 | 1.6% |
| Total | 502 | 100.0% |
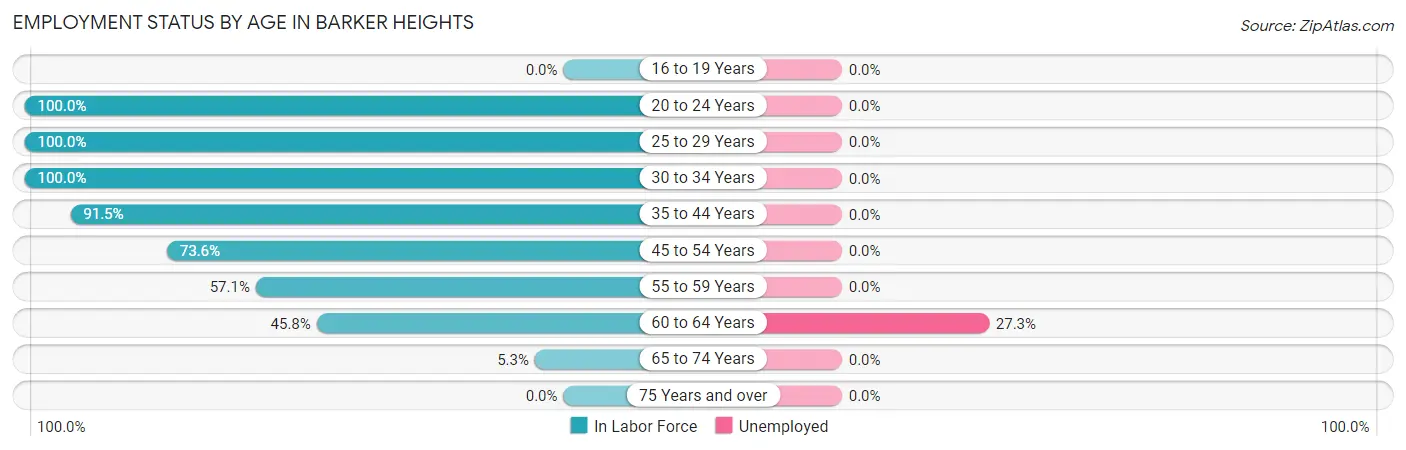
Employment Status by Age in Barker Heights
According to the labor force statistics for Barker Heights, out of the total population over 16 years of age (787), 64.5% or 508 individuals are in the labor force, with 1.2% or 6 of them unemployed. The age group with the highest labor force participation rate is 20 to 24 years, with 100.0% or 39 individuals in the labor force. Within the labor force, the 60 to 64 years age range has the highest percentage of unemployed individuals, with 27.3% or 6 of them being unemployed.
| Age Bracket | In Labor Force | Unemployed |
| 16 to 19 Years | 0 (0.0%) | 0 (0.0%) |
| 20 to 24 Years | 39 (100.0%) | 0 (0.0%) |
| 25 to 29 Years | 25 (100.0%) | 0 (0.0%) |
| 30 to 34 Years | 51 (100.0%) | 0 (0.0%) |
| 35 to 44 Years | 162 (91.5%) | 0 (0.0%) |
| 45 to 54 Years | 173 (73.6%) | 0 (0.0%) |
| 55 to 59 Years | 32 (57.1%) | 0 (0.0%) |
| 60 to 64 Years | 22 (45.8%) | 6 (27.3%) |
| 65 to 74 Years | 4 (5.3%) | 0 (0.0%) |
| 75 Years and over | 0 (0.0%) | 0 (0.0%) |
| Total | 508 (64.5%) | 6 (1.2%) |
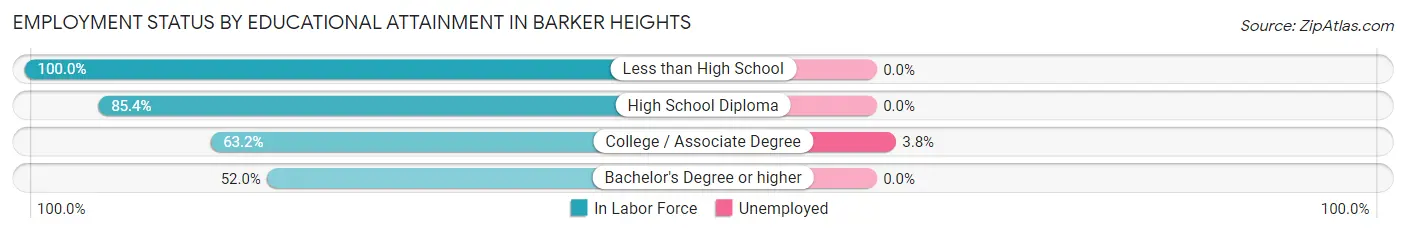
Employment Status by Educational Attainment in Barker Heights
According to labor force statistics for Barker Heights, 78.5% of individuals (465) out of the total population between 25 and 64 years of age (592) are in the labor force, with 1.3% or 6 of them being unemployed. The group with the highest labor force participation rate are those with the educational attainment of less than high school, with 100.0% or 156 individuals in the labor force. Within the labor force, individuals with college / associate degree education have the highest percentage of unemployment, with 3.8% or 6 of them being unemployed.
| Educational Attainment | In Labor Force | Unemployed |
| Less than High School | 156 (100.0%) | 0 (0.0%) |
| High School Diploma | 140 (85.4%) | 0 (0.0%) |
| College / Associate Degree | 156 (63.2%) | 9 (3.8%) |
| Bachelor's Degree or higher | 13 (52.0%) | 0 (0.0%) |
| Total | 465 (78.5%) | 8 (1.3%) |
Employment Occupations by Sex in Barker Heights
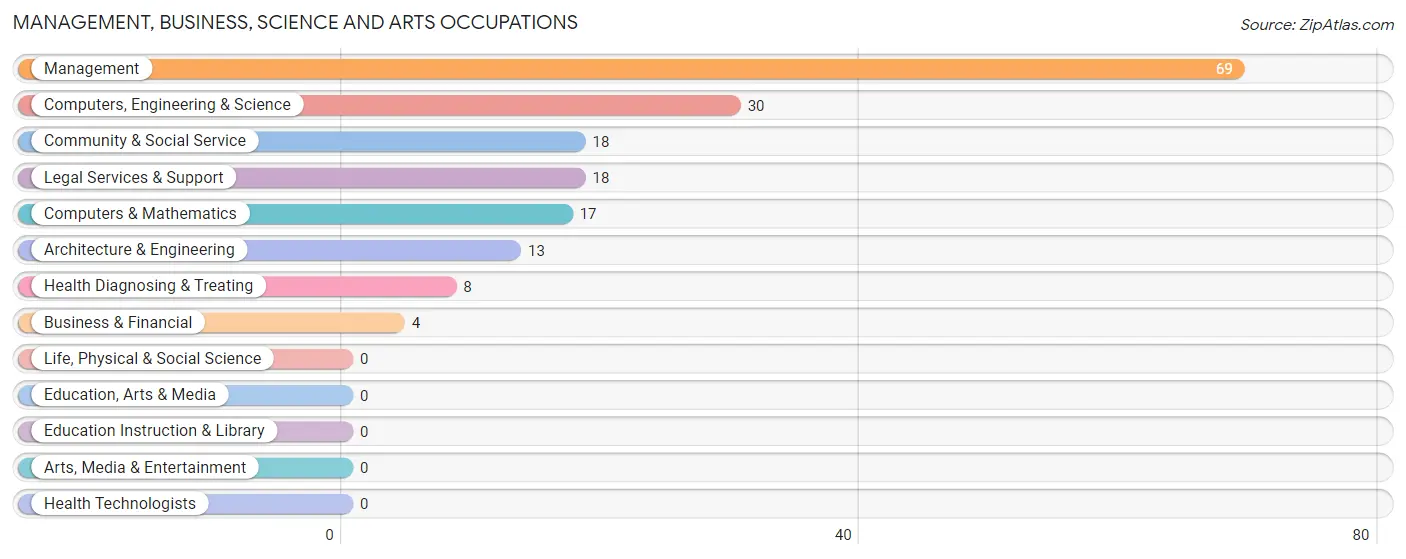
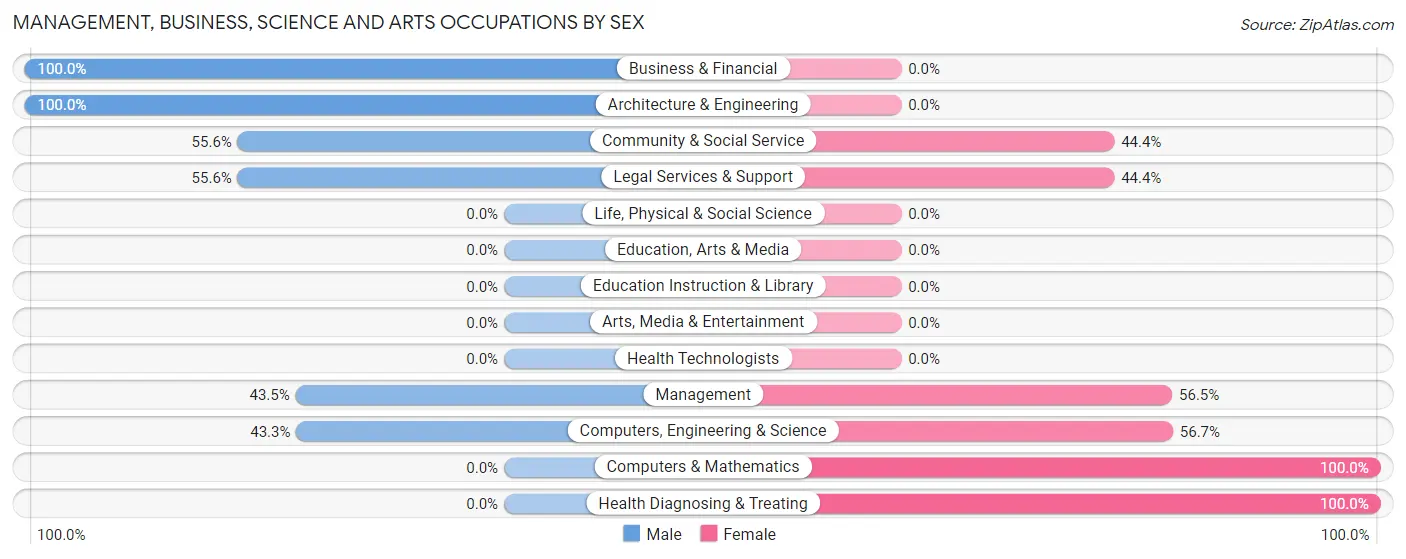
Management, Business, Science and Arts Occupations
The most common Management, Business, Science and Arts occupations in Barker Heights are Management (69 | 13.8%), Computers, Engineering & Science (30 | 6.0%), Community & Social Service (18 | 3.6%), Legal Services & Support (18 | 3.6%), and Computers & Mathematics (17 | 3.4%).
Management, Business, Science and Arts Occupations by Sex
Within the Management, Business, Science and Arts occupations in Barker Heights, the most male-oriented occupations are Business & Financial (100.0%), Architecture & Engineering (100.0%), and Community & Social Service (55.6%), while the most female-oriented occupations are Computers & Mathematics (100.0%), Health Diagnosing & Treating (100.0%), and Computers, Engineering & Science (56.7%).
| Occupation | Male | Female |
| Management | 30 (43.5%) | 39 (56.5%) |
| Business & Financial | 4 (100.0%) | 0 (0.0%) |
| Computers, Engineering & Science | 13 (43.3%) | 17 (56.7%) |
| Computers & Mathematics | 0 (0.0%) | 17 (100.0%) |
| Architecture & Engineering | 13 (100.0%) | 0 (0.0%) |
| Life, Physical & Social Science | 0 (0.0%) | 0 (0.0%) |
| Community & Social Service | 10 (55.6%) | 8 (44.4%) |
| Education, Arts & Media | 0 (0.0%) | 0 (0.0%) |
| Legal Services & Support | 10 (55.6%) | 8 (44.4%) |
| Education Instruction & Library | 0 (0.0%) | 0 (0.0%) |
| Arts, Media & Entertainment | 0 (0.0%) | 0 (0.0%) |
| Health Diagnosing & Treating | 0 (0.0%) | 8 (100.0%) |
| Health Technologists | 0 (0.0%) | 0 (0.0%) |
| Total (Category) | 57 (44.2%) | 72 (55.8%) |
| Total (Overall) | 256 (51.0%) | 246 (49.0%) |
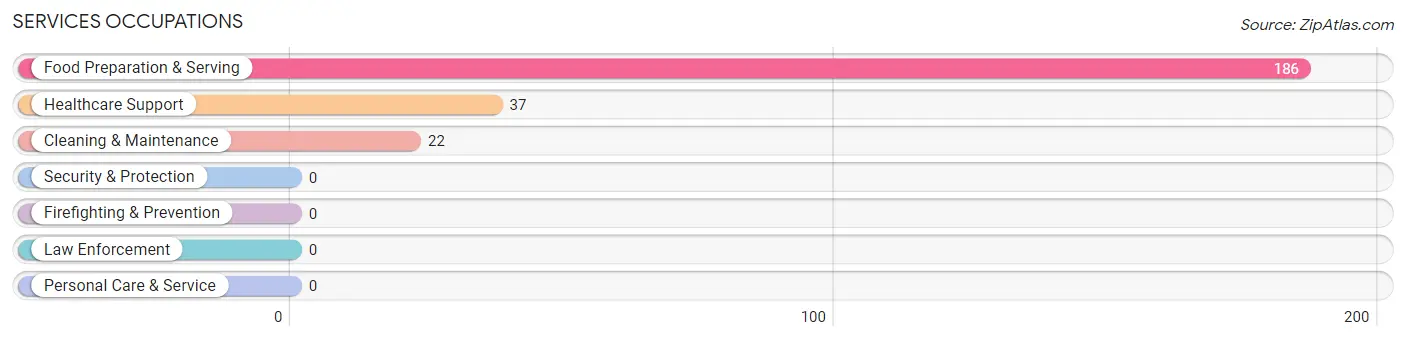
Services Occupations
The most common Services occupations in Barker Heights are Food Preparation & Serving (186 | 37.0%), Healthcare Support (37 | 7.4%), and Cleaning & Maintenance (22 | 4.4%).
Services Occupations by Sex
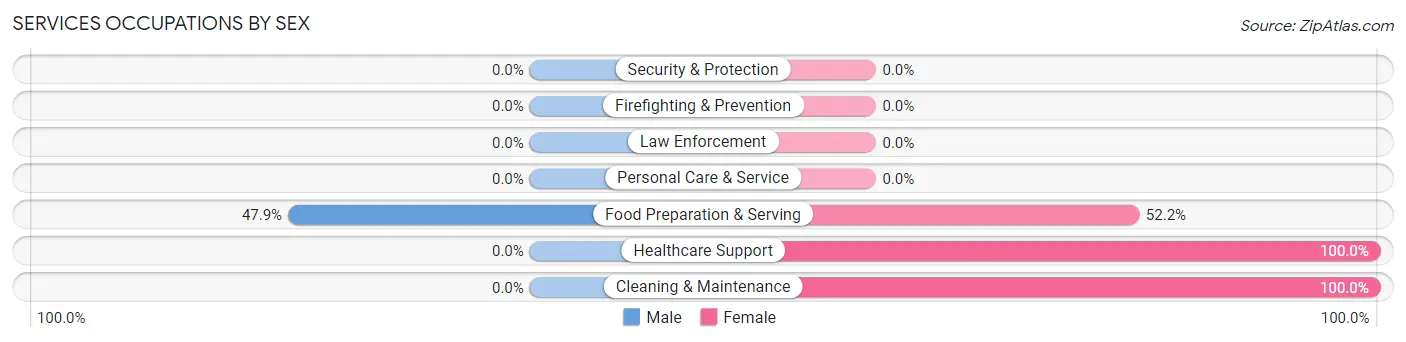
| Occupation | Male | Female |
| Healthcare Support | 0 (0.0%) | 37 (100.0%) |
| Security & Protection | 0 (0.0%) | 0 (0.0%) |
| Firefighting & Prevention | 0 (0.0%) | 0 (0.0%) |
| Law Enforcement | 0 (0.0%) | 0 (0.0%) |
| Food Preparation & Serving | 89 (47.8%) | 97 (52.1%) |
| Cleaning & Maintenance | 0 (0.0%) | 22 (100.0%) |
| Personal Care & Service | 0 (0.0%) | 0 (0.0%) |
| Total (Category) | 89 (36.3%) | 156 (63.7%) |
| Total (Overall) | 256 (51.0%) | 246 (49.0%) |
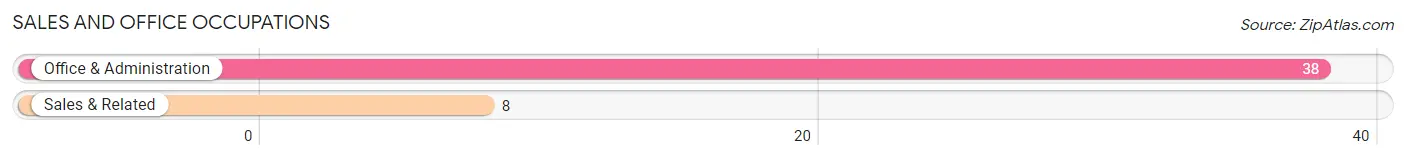
Sales and Office Occupations
The most common Sales and Office occupations in Barker Heights are Office & Administration (38 | 7.6%), and Sales & Related (8 | 1.6%).
Sales and Office Occupations by Sex

| Occupation | Male | Female |
| Sales & Related | 8 (100.0%) | 0 (0.0%) |
| Office & Administration | 20 (52.6%) | 18 (47.4%) |
| Total (Category) | 28 (60.9%) | 18 (39.1%) |
| Total (Overall) | 256 (51.0%) | 246 (49.0%) |
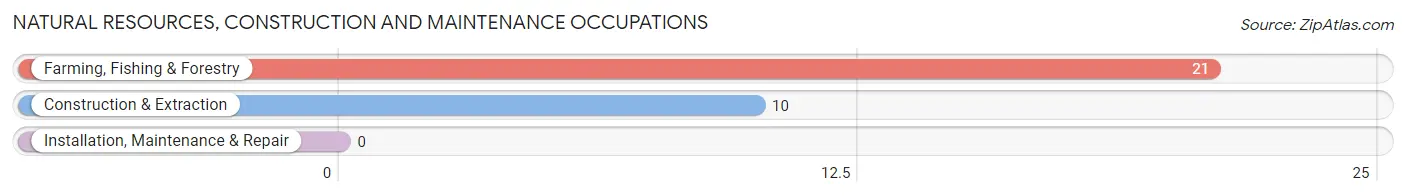
Natural Resources, Construction and Maintenance Occupations
The most common Natural Resources, Construction and Maintenance occupations in Barker Heights are Farming, Fishing & Forestry (21 | 4.2%), and Construction & Extraction (10 | 2.0%).
Natural Resources, Construction and Maintenance Occupations by Sex
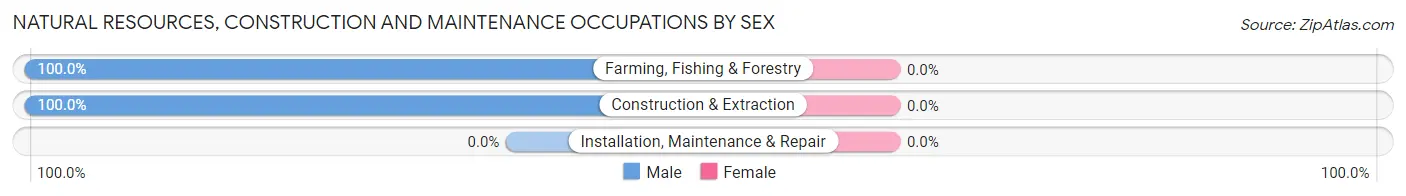
| Occupation | Male | Female |
| Farming, Fishing & Forestry | 21 (100.0%) | 0 (0.0%) |
| Construction & Extraction | 10 (100.0%) | 0 (0.0%) |
| Installation, Maintenance & Repair | 0 (0.0%) | 0 (0.0%) |
| Total (Category) | 31 (100.0%) | 0 (0.0%) |
| Total (Overall) | 256 (51.0%) | 246 (49.0%) |
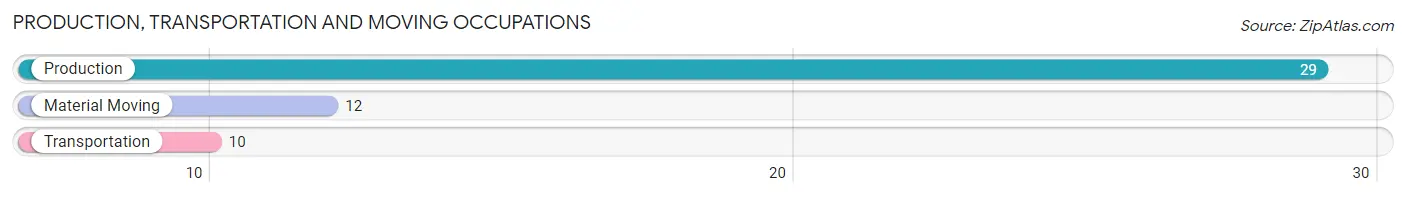
Production, Transportation and Moving Occupations
The most common Production, Transportation and Moving occupations in Barker Heights are Production (29 | 5.8%), Material Moving (12 | 2.4%), and Transportation (10 | 2.0%).
Production, Transportation and Moving Occupations by Sex
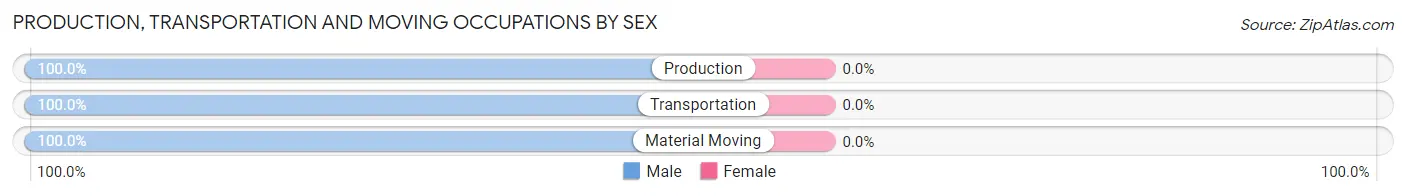
| Occupation | Male | Female |
| Production | 29 (100.0%) | 0 (0.0%) |
| Transportation | 10 (100.0%) | 0 (0.0%) |
| Material Moving | 12 (100.0%) | 0 (0.0%) |
| Total (Category) | 51 (100.0%) | 0 (0.0%) |
| Total (Overall) | 256 (51.0%) | 246 (49.0%) |
Employment Industries by Sex in Barker Heights
Employment Industries in Barker Heights
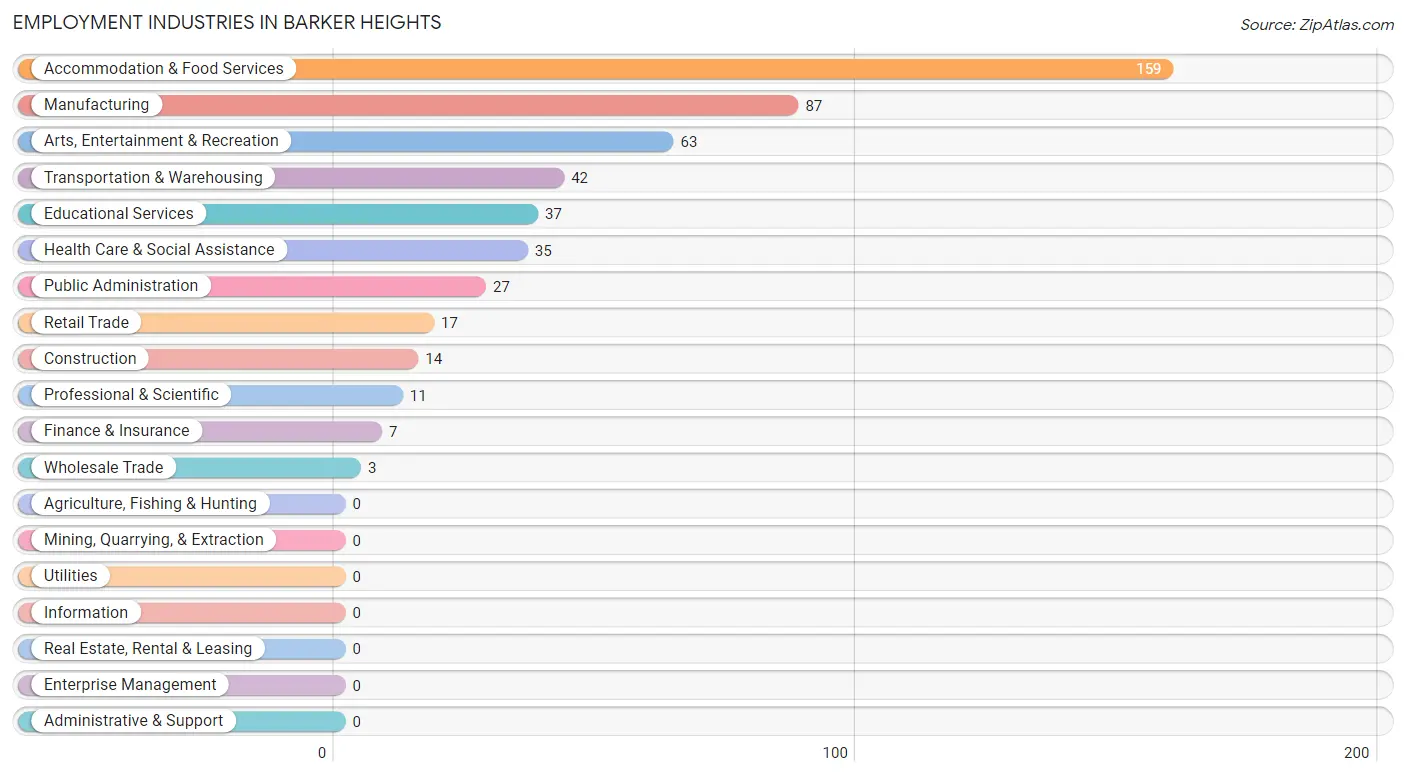
The major employment industries in Barker Heights include Accommodation & Food Services (159 | 31.7%), Manufacturing (87 | 17.3%), Arts, Entertainment & Recreation (63 | 12.6%), Transportation & Warehousing (42 | 8.4%), and Educational Services (37 | 7.4%).
Employment Industries by Sex in Barker Heights
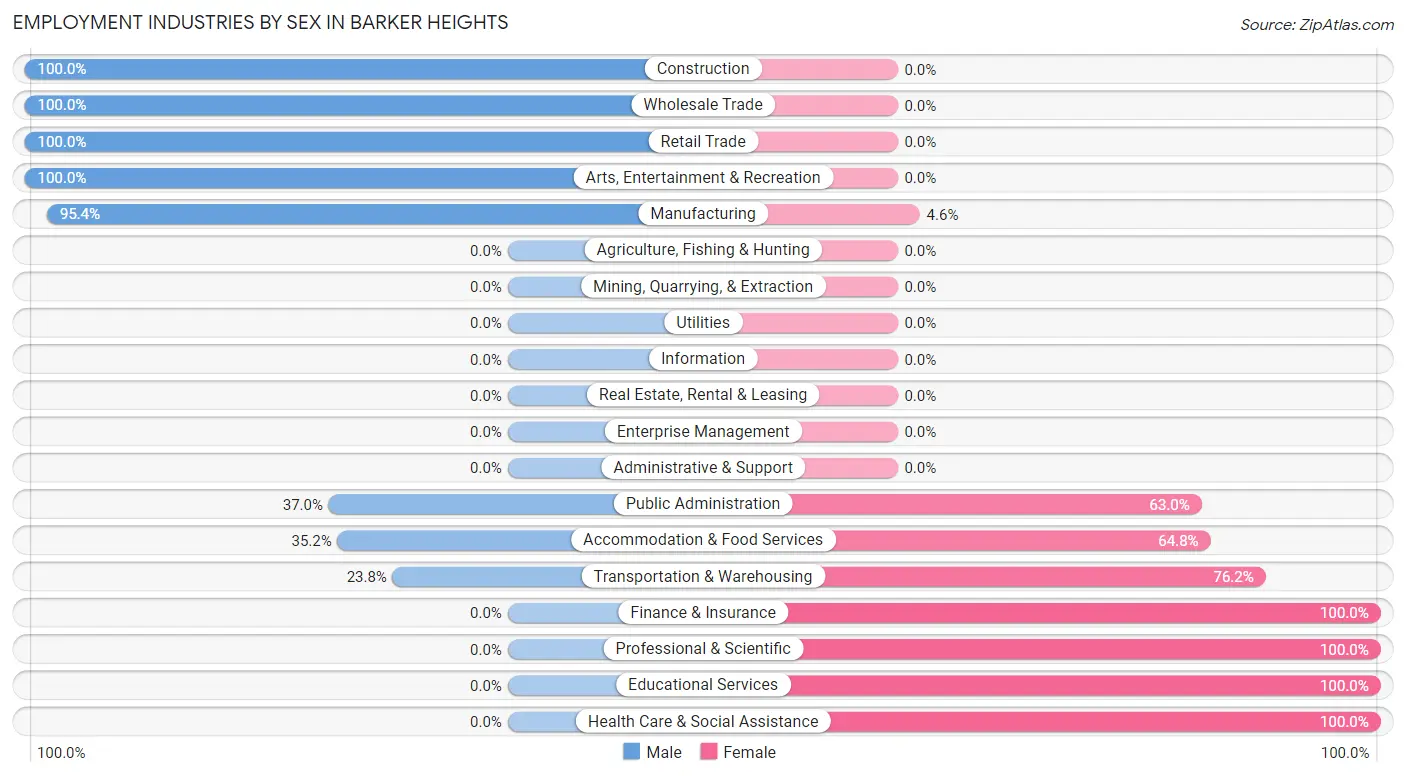
The Barker Heights industries that see more men than women are Construction (100.0%), Wholesale Trade (100.0%), and Retail Trade (100.0%), whereas the industries that tend to have a higher number of women are Finance & Insurance (100.0%), Professional & Scientific (100.0%), and Educational Services (100.0%).
| Industry | Male | Female |
| Agriculture, Fishing & Hunting | 0 (0.0%) | 0 (0.0%) |
| Mining, Quarrying, & Extraction | 0 (0.0%) | 0 (0.0%) |
| Construction | 14 (100.0%) | 0 (0.0%) |
| Manufacturing | 83 (95.4%) | 4 (4.6%) |
| Wholesale Trade | 3 (100.0%) | 0 (0.0%) |
| Retail Trade | 17 (100.0%) | 0 (0.0%) |
| Transportation & Warehousing | 10 (23.8%) | 32 (76.2%) |
| Utilities | 0 (0.0%) | 0 (0.0%) |
| Information | 0 (0.0%) | 0 (0.0%) |
| Finance & Insurance | 0 (0.0%) | 7 (100.0%) |
| Real Estate, Rental & Leasing | 0 (0.0%) | 0 (0.0%) |
| Professional & Scientific | 0 (0.0%) | 11 (100.0%) |
| Enterprise Management | 0 (0.0%) | 0 (0.0%) |
| Administrative & Support | 0 (0.0%) | 0 (0.0%) |
| Educational Services | 0 (0.0%) | 37 (100.0%) |
| Health Care & Social Assistance | 0 (0.0%) | 35 (100.0%) |
| Arts, Entertainment & Recreation | 63 (100.0%) | 0 (0.0%) |
| Accommodation & Food Services | 56 (35.2%) | 103 (64.8%) |
| Public Administration | 10 (37.0%) | 17 (63.0%) |
| Total | 256 (51.0%) | 246 (49.0%) |
Education in Barker Heights
School Enrollment in Barker Heights
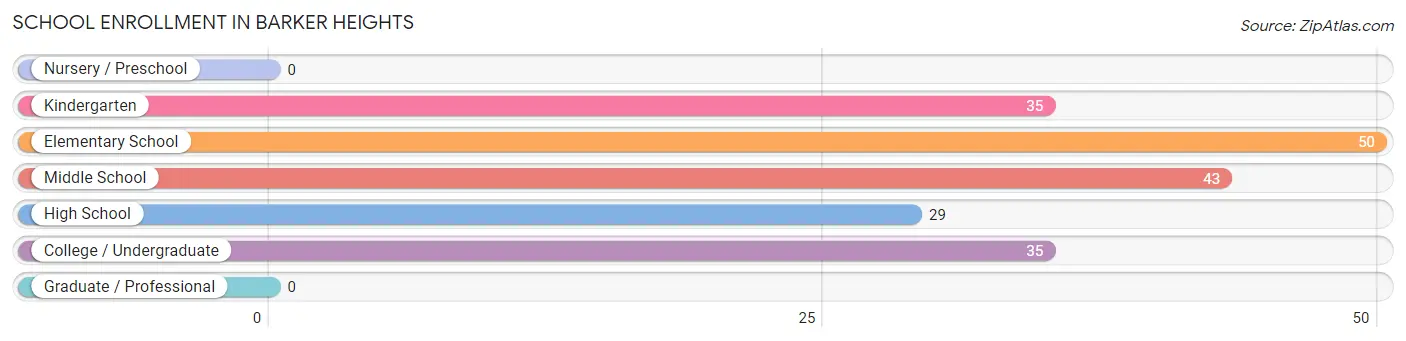
The most common levels of schooling among the 192 students in Barker Heights are elementary school (50 | 26.0%), middle school (43 | 22.4%), and kindergarten (35 | 18.2%).
| School Level | # Students | % Students |
| Nursery / Preschool | 0 | 0.0% |
| Kindergarten | 35 | 18.2% |
| Elementary School | 50 | 26.0% |
| Middle School | 43 | 22.4% |
| High School | 29 | 15.1% |
| College / Undergraduate | 35 | 18.2% |
| Graduate / Professional | 0 | 0.0% |
| Total | 192 | 100.0% |
School Enrollment by Age by Funding Source in Barker Heights
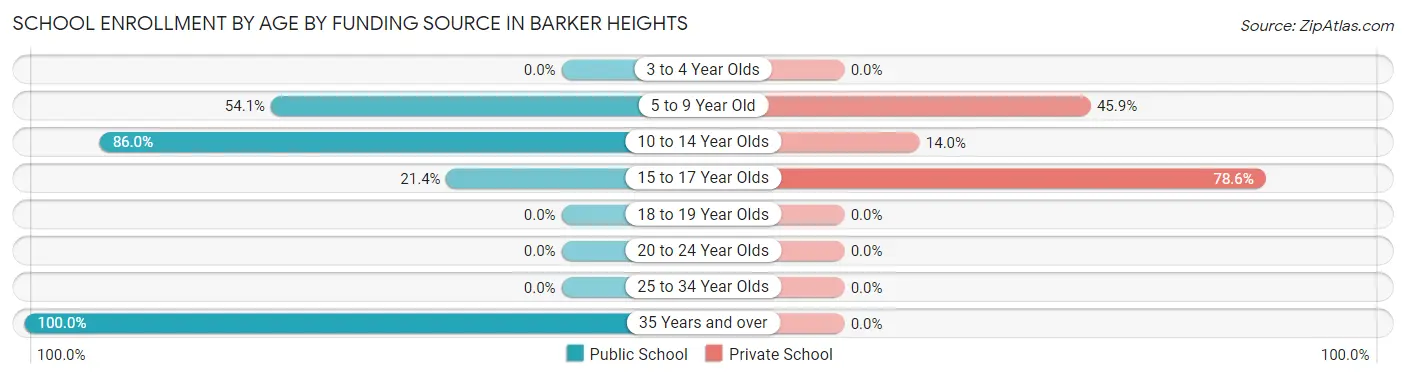
Out of a total of 192 students who are enrolled in schools in Barker Heights, 68 (35.4%) attend a private institution, while the remaining 124 (64.6%) are enrolled in public schools. The age group of 15 to 17 year olds has the highest likelihood of being enrolled in private schools, with 22 (78.6% in the age bracket) enrolled. Conversely, the age group of 35 years and over has the lowest likelihood of being enrolled in a private school, with 29 (100.0% in the age bracket) attending a public institution.
| Age Bracket | Public School | Private School |
| 3 to 4 Year Olds | 0 (0.0%) | 0 (0.0%) |
| 5 to 9 Year Old | 46 (54.1%) | 39 (45.9%) |
| 10 to 14 Year Olds | 43 (86.0%) | 7 (14.0%) |
| 15 to 17 Year Olds | 6 (21.4%) | 22 (78.6%) |
| 18 to 19 Year Olds | 0 (0.0%) | 0 (0.0%) |
| 20 to 24 Year Olds | 0 (0.0%) | 0 (0.0%) |
| 25 to 34 Year Olds | 0 (0.0%) | 0 (0.0%) |
| 35 Years and over | 29 (100.0%) | 0 (0.0%) |
| Total | 124 (64.6%) | 68 (35.4%) |
Educational Attainment by Field of Study in Barker Heights
Social sciences (22 | 88.0%), and literature & languages (3 | 12.0%) are the most common fields of study among 25 individuals in Barker Heights who have obtained a bachelor's degree or higher.
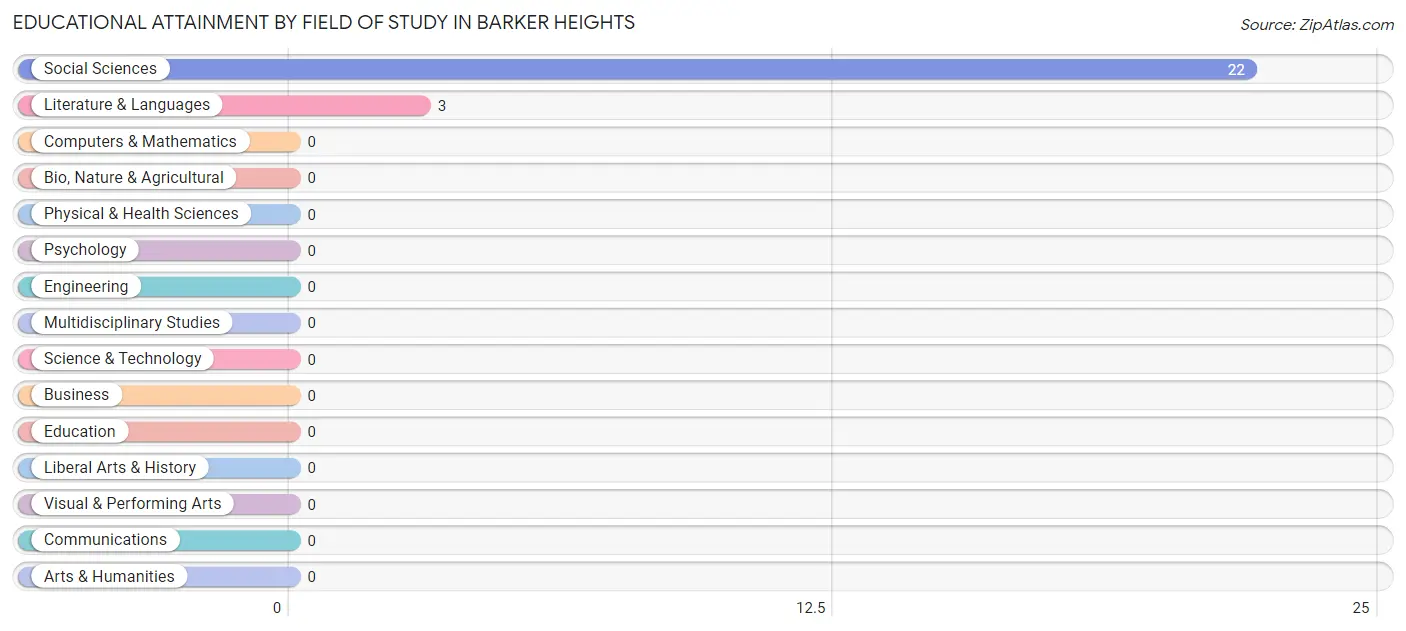
| Field of Study | # Graduates | % Graduates |
| Computers & Mathematics | 0 | 0.0% |
| Bio, Nature & Agricultural | 0 | 0.0% |
| Physical & Health Sciences | 0 | 0.0% |
| Psychology | 0 | 0.0% |
| Social Sciences | 22 | 88.0% |
| Engineering | 0 | 0.0% |
| Multidisciplinary Studies | 0 | 0.0% |
| Science & Technology | 0 | 0.0% |
| Business | 0 | 0.0% |
| Education | 0 | 0.0% |
| Literature & Languages | 3 | 12.0% |
| Liberal Arts & History | 0 | 0.0% |
| Visual & Performing Arts | 0 | 0.0% |
| Communications | 0 | 0.0% |
| Arts & Humanities | 0 | 0.0% |
| Total | 25 | 100.0% |
Transportation & Commute in Barker Heights
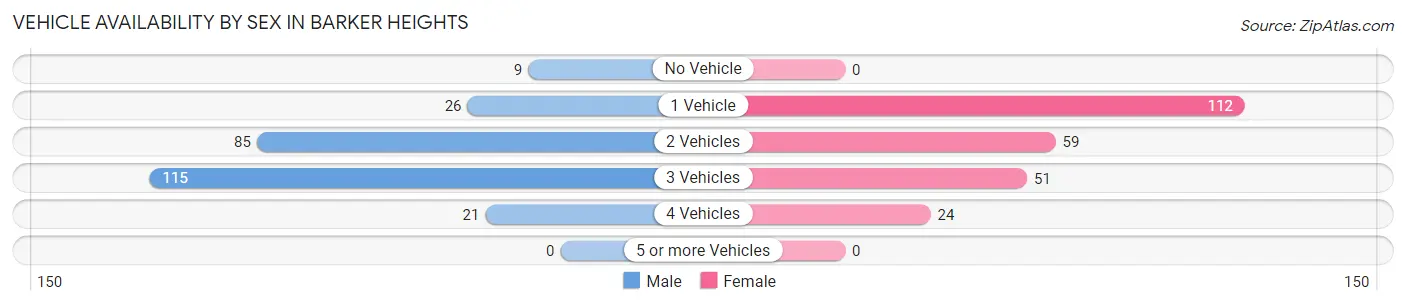
Vehicle Availability by Sex in Barker Heights
The most prevalent vehicle ownership categories in Barker Heights are males with 3 vehicles (115, accounting for 44.9%) and females with 3 vehicles (51, making up 46.8%).
| Vehicles Available | Male | Female |
| No Vehicle | 9 (3.5%) | 0 (0.0%) |
| 1 Vehicle | 26 (10.2%) | 112 (45.5%) |
| 2 Vehicles | 85 (33.2%) | 59 (24.0%) |
| 3 Vehicles | 115 (44.9%) | 51 (20.7%) |
| 4 Vehicles | 21 (8.2%) | 24 (9.8%) |
| 5 or more Vehicles | 0 (0.0%) | 0 (0.0%) |
| Total | 256 (100.0%) | 246 (100.0%) |
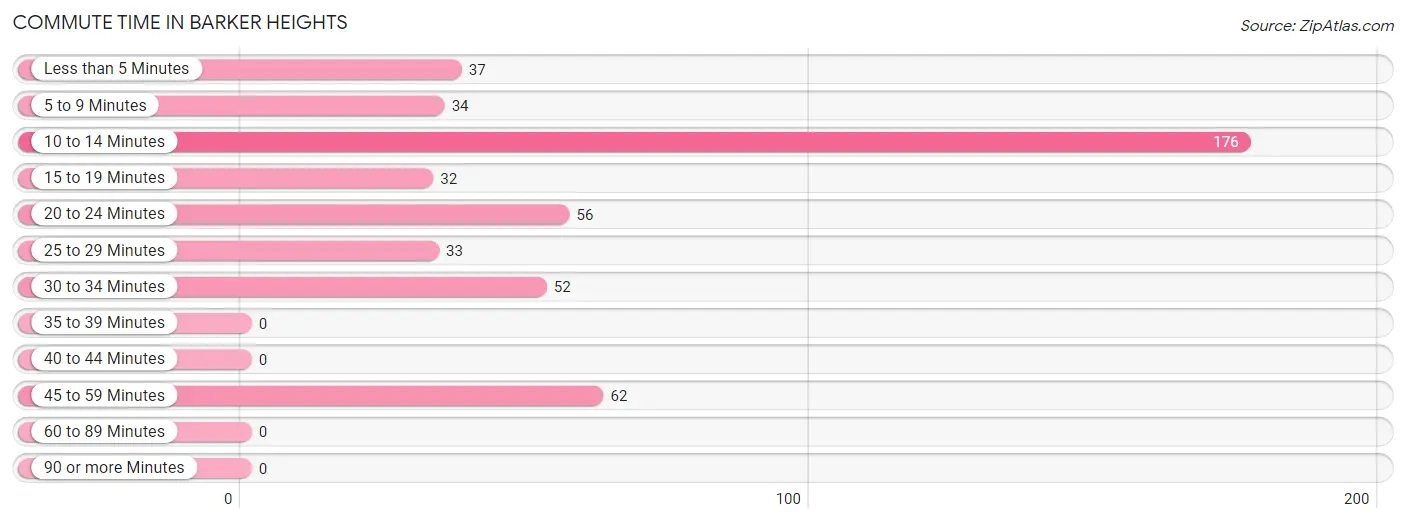
Commute Time in Barker Heights
The most frequently occuring commute durations in Barker Heights are 10 to 14 minutes (176 commuters, 36.5%), 45 to 59 minutes (62 commuters, 12.9%), and 20 to 24 minutes (56 commuters, 11.6%).
| Commute Time | # Commuters | % Commuters |
| Less than 5 Minutes | 37 | 7.7% |
| 5 to 9 Minutes | 34 | 7.0% |
| 10 to 14 Minutes | 176 | 36.5% |
| 15 to 19 Minutes | 32 | 6.6% |
| 20 to 24 Minutes | 56 | 11.6% |
| 25 to 29 Minutes | 33 | 6.9% |
| 30 to 34 Minutes | 52 | 10.8% |
| 35 to 39 Minutes | 0 | 0.0% |
| 40 to 44 Minutes | 0 | 0.0% |
| 45 to 59 Minutes | 62 | 12.9% |
| 60 to 89 Minutes | 0 | 0.0% |
| 90 or more Minutes | 0 | 0.0% |
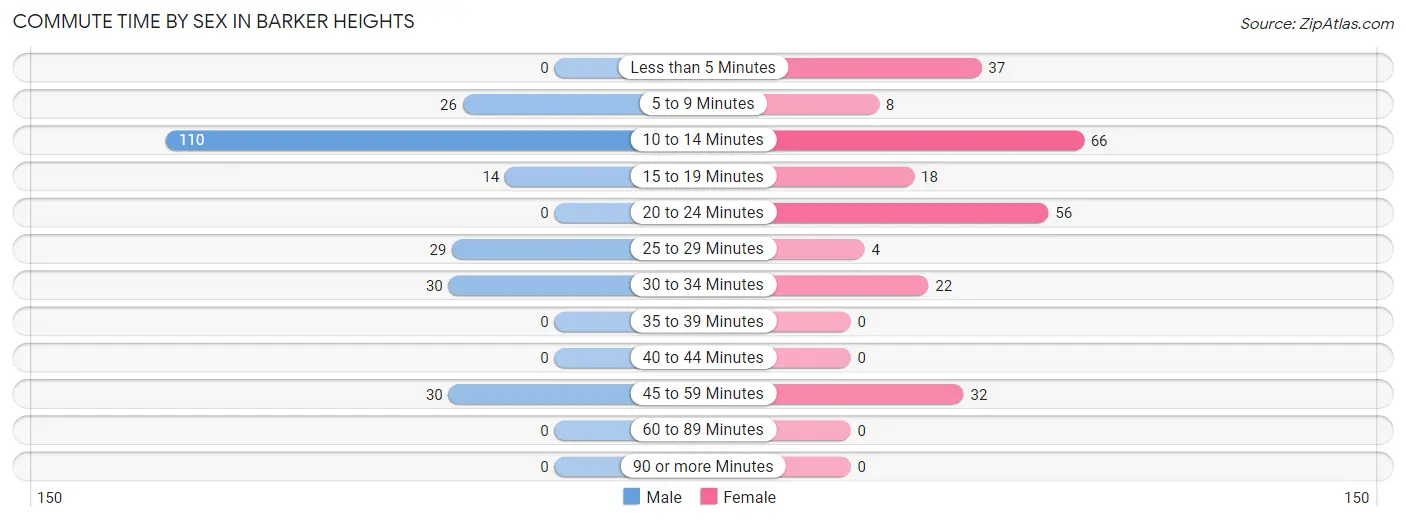
Commute Time by Sex in Barker Heights
The most common commute times in Barker Heights are 10 to 14 minutes (110 commuters, 46.0%) for males and 10 to 14 minutes (66 commuters, 27.2%) for females.
| Commute Time | Male | Female |
| Less than 5 Minutes | 0 (0.0%) | 37 (15.2%) |
| 5 to 9 Minutes | 26 (10.9%) | 8 (3.3%) |
| 10 to 14 Minutes | 110 (46.0%) | 66 (27.2%) |
| 15 to 19 Minutes | 14 (5.9%) | 18 (7.4%) |
| 20 to 24 Minutes | 0 (0.0%) | 56 (23.1%) |
| 25 to 29 Minutes | 29 (12.1%) | 4 (1.7%) |
| 30 to 34 Minutes | 30 (12.6%) | 22 (9.0%) |
| 35 to 39 Minutes | 0 (0.0%) | 0 (0.0%) |
| 40 to 44 Minutes | 0 (0.0%) | 0 (0.0%) |
| 45 to 59 Minutes | 30 (12.6%) | 32 (13.2%) |
| 60 to 89 Minutes | 0 (0.0%) | 0 (0.0%) |
| 90 or more Minutes | 0 (0.0%) | 0 (0.0%) |
Time of Departure to Work by Sex in Barker Heights
The most frequent times of departure to work in Barker Heights are 7:00 AM to 7:29 AM (93, 38.9%) for males and 6:30 AM to 6:59 AM (55, 22.6%) for females.
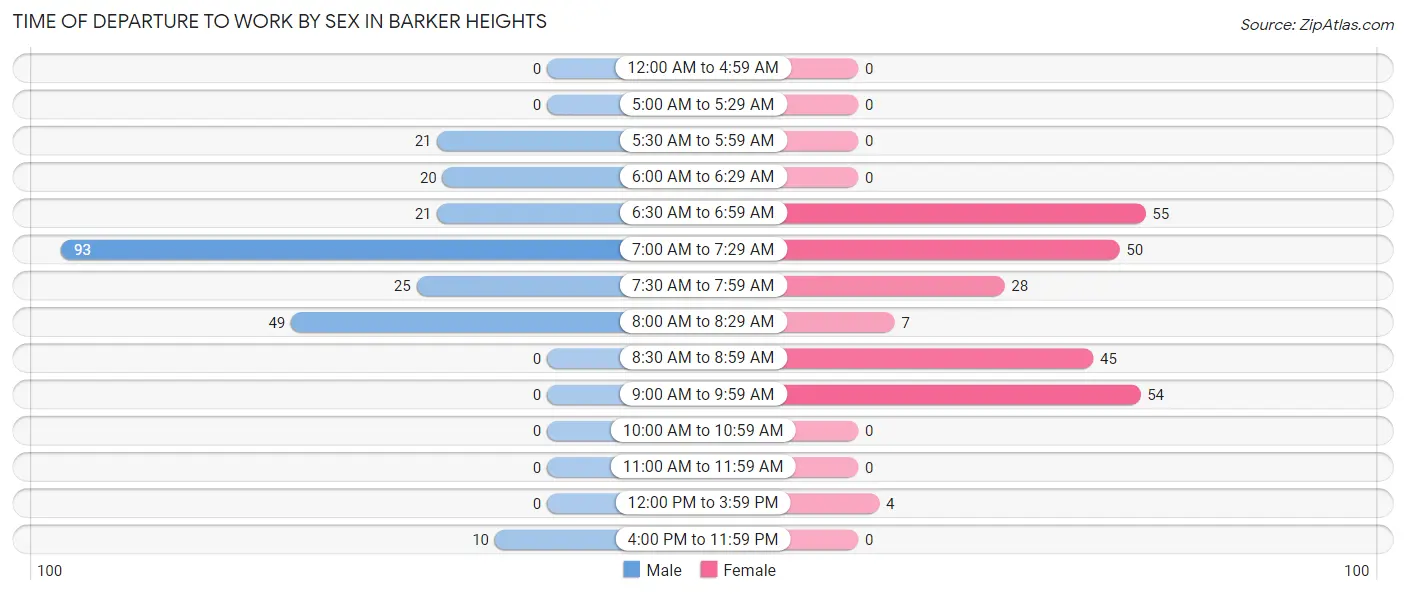
| Time of Departure | Male | Female |
| 12:00 AM to 4:59 AM | 0 (0.0%) | 0 (0.0%) |
| 5:00 AM to 5:29 AM | 0 (0.0%) | 0 (0.0%) |
| 5:30 AM to 5:59 AM | 21 (8.8%) | 0 (0.0%) |
| 6:00 AM to 6:29 AM | 20 (8.4%) | 0 (0.0%) |
| 6:30 AM to 6:59 AM | 21 (8.8%) | 55 (22.6%) |
| 7:00 AM to 7:29 AM | 93 (38.9%) | 50 (20.6%) |
| 7:30 AM to 7:59 AM | 25 (10.5%) | 28 (11.5%) |
| 8:00 AM to 8:29 AM | 49 (20.5%) | 7 (2.9%) |
| 8:30 AM to 8:59 AM | 0 (0.0%) | 45 (18.5%) |
| 9:00 AM to 9:59 AM | 0 (0.0%) | 54 (22.2%) |
| 10:00 AM to 10:59 AM | 0 (0.0%) | 0 (0.0%) |
| 11:00 AM to 11:59 AM | 0 (0.0%) | 0 (0.0%) |
| 12:00 PM to 3:59 PM | 0 (0.0%) | 4 (1.7%) |
| 4:00 PM to 11:59 PM | 10 (4.2%) | 0 (0.0%) |
| Total | 239 (100.0%) | 243 (100.0%) |
Housing Occupancy in Barker Heights
Occupancy by Ownership in Barker Heights
Of the total 470 dwellings in Barker Heights, owner-occupied units account for 250 (53.2%), while renter-occupied units make up 220 (46.8%).
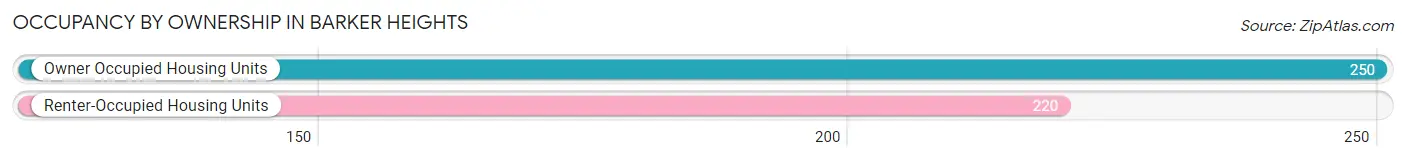
| Occupancy | # Housing Units | % Housing Units |
| Owner Occupied Housing Units | 250 | 53.2% |
| Renter-Occupied Housing Units | 220 | 46.8% |
| Total Occupied Housing Units | 470 | 100.0% |
Occupancy by Household Size in Barker Heights
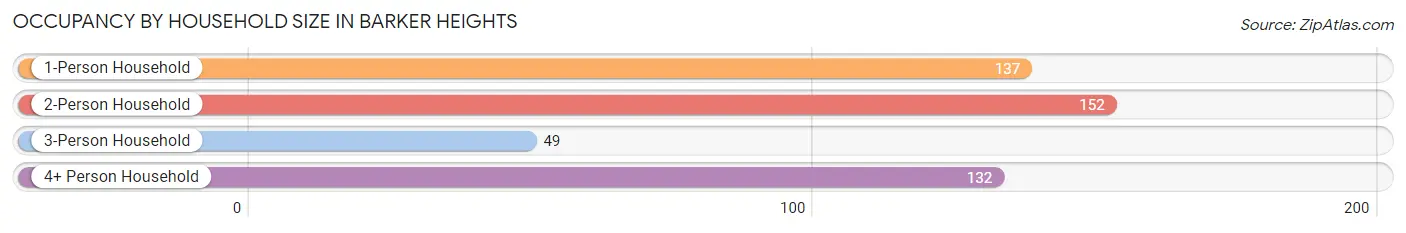
| Household Size | # Housing Units | % Housing Units |
| 1-Person Household | 137 | 29.1% |
| 2-Person Household | 152 | 32.3% |
| 3-Person Household | 49 | 10.4% |
| 4+ Person Household | 132 | 28.1% |
| Total Housing Units | 470 | 100.0% |
Occupancy by Ownership by Household Size in Barker Heights
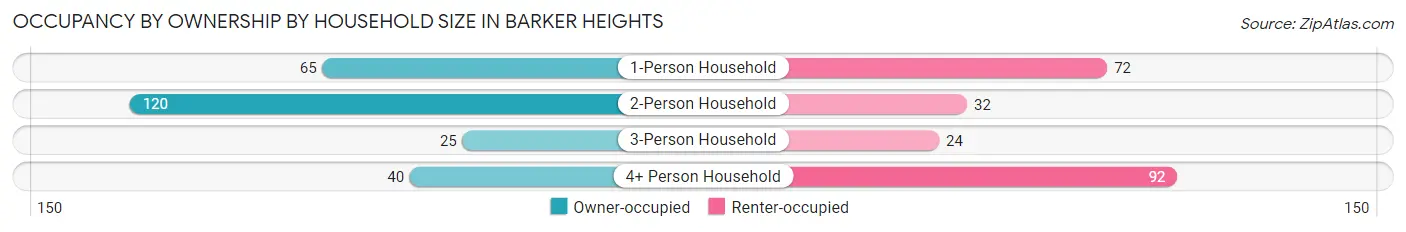
| Household Size | Owner-occupied | Renter-occupied |
| 1-Person Household | 65 (47.4%) | 72 (52.5%) |
| 2-Person Household | 120 (78.9%) | 32 (21.0%) |
| 3-Person Household | 25 (51.0%) | 24 (49.0%) |
| 4+ Person Household | 40 (30.3%) | 92 (69.7%) |
| Total Housing Units | 250 (53.2%) | 220 (46.8%) |
Occupancy by Educational Attainment in Barker Heights
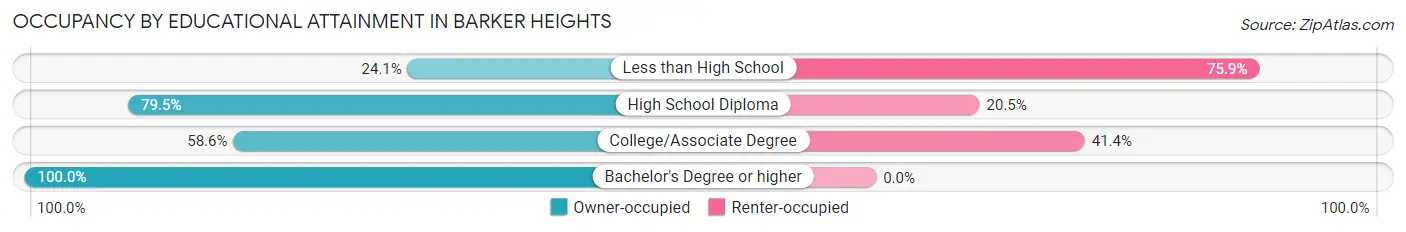
| Household Size | Owner-occupied | Renter-occupied |
| Less than High School | 32 (24.1%) | 101 (75.9%) |
| High School Diploma | 62 (79.5%) | 16 (20.5%) |
| College/Associate Degree | 146 (58.6%) | 103 (41.4%) |
| Bachelor's Degree or higher | 10 (100.0%) | 0 (0.0%) |
Occupancy by Age of Householder in Barker Heights
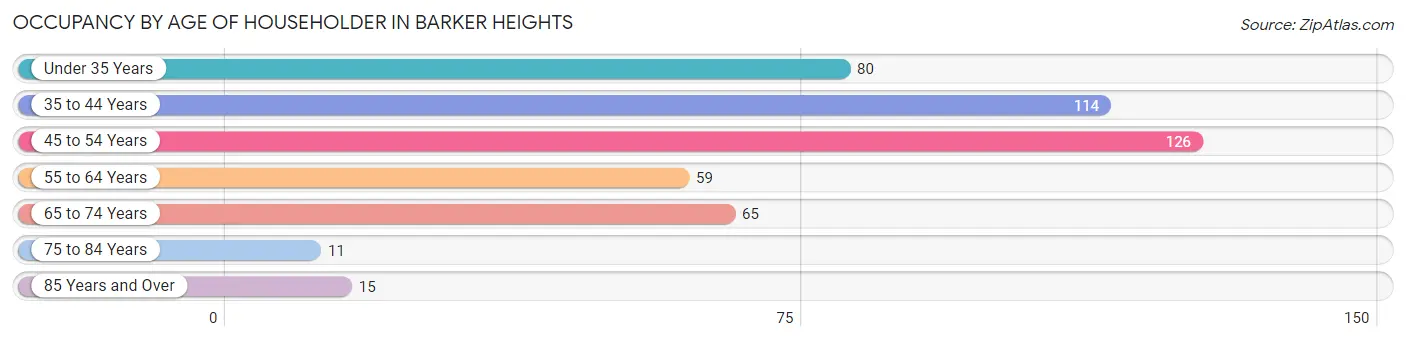
| Age Bracket | # Households | % Households |
| Under 35 Years | 80 | 17.0% |
| 35 to 44 Years | 114 | 24.3% |
| 45 to 54 Years | 126 | 26.8% |
| 55 to 64 Years | 59 | 12.6% |
| 65 to 74 Years | 65 | 13.8% |
| 75 to 84 Years | 11 | 2.3% |
| 85 Years and Over | 15 | 3.2% |
| Total | 470 | 100.0% |
Housing Finances in Barker Heights
Median Income by Occupancy in Barker Heights
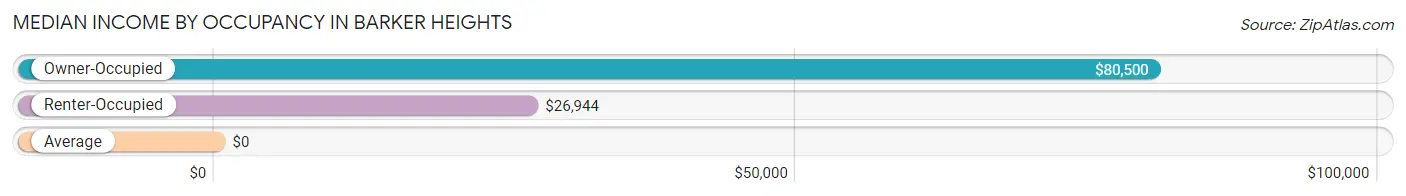
| Occupancy Type | # Households | Median Income |
| Owner-Occupied | 250 (53.2%) | $80,500 |
| Renter-Occupied | 220 (46.8%) | $26,944 |
| Average | 470 (100.0%) | $0 |
Occupancy by Householder Income Bracket in Barker Heights
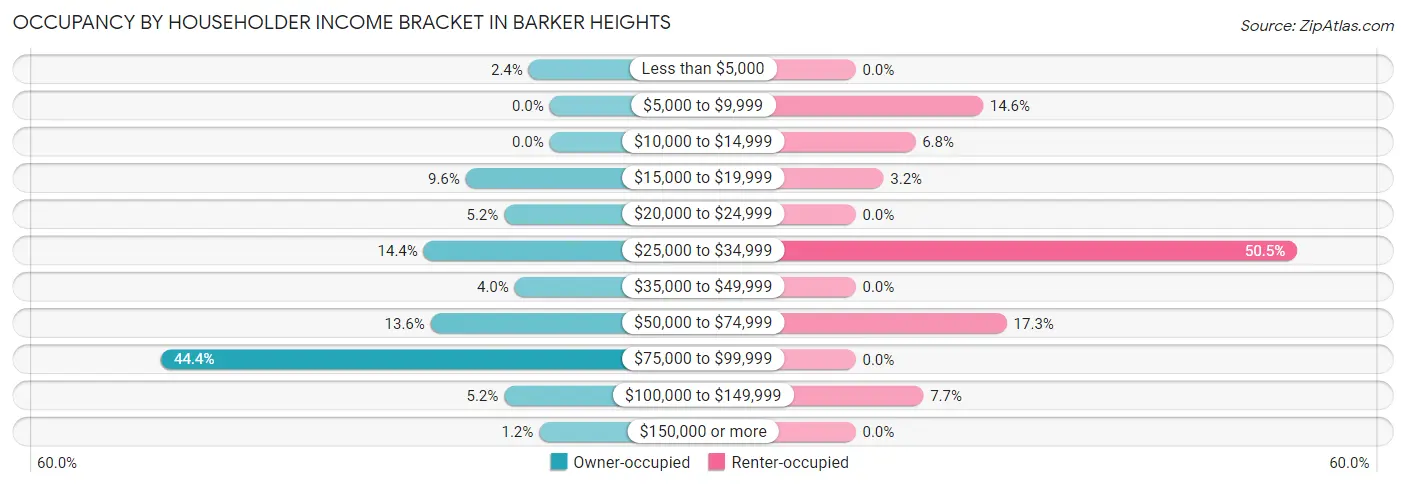
| Income Bracket | Owner-occupied | Renter-occupied |
| Less than $5,000 | 6 (2.4%) | 0 (0.0%) |
| $5,000 to $9,999 | 0 (0.0%) | 32 (14.5%) |
| $10,000 to $14,999 | 0 (0.0%) | 15 (6.8%) |
| $15,000 to $19,999 | 24 (9.6%) | 7 (3.2%) |
| $20,000 to $24,999 | 13 (5.2%) | 0 (0.0%) |
| $25,000 to $34,999 | 36 (14.4%) | 111 (50.4%) |
| $35,000 to $49,999 | 10 (4.0%) | 0 (0.0%) |
| $50,000 to $74,999 | 34 (13.6%) | 38 (17.3%) |
| $75,000 to $99,999 | 111 (44.4%) | 0 (0.0%) |
| $100,000 to $149,999 | 13 (5.2%) | 17 (7.7%) |
| $150,000 or more | 3 (1.2%) | 0 (0.0%) |
| Total | 250 (100.0%) | 220 (100.0%) |
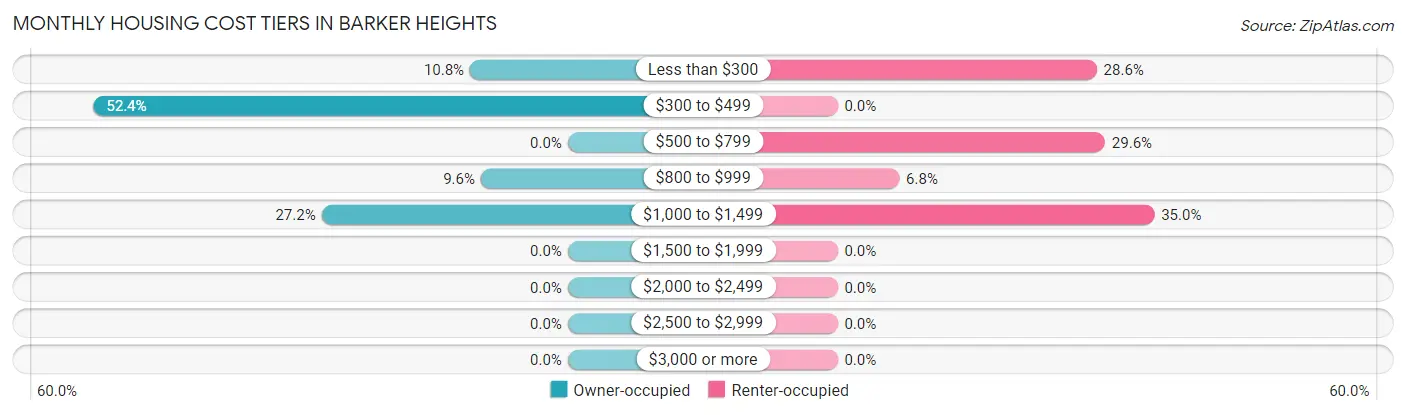
Monthly Housing Cost Tiers in Barker Heights
| Monthly Cost | Owner-occupied | Renter-occupied |
| Less than $300 | 27 (10.8%) | 63 (28.6%) |
| $300 to $499 | 131 (52.4%) | 0 (0.0%) |
| $500 to $799 | 0 (0.0%) | 65 (29.5%) |
| $800 to $999 | 24 (9.6%) | 15 (6.8%) |
| $1,000 to $1,499 | 68 (27.2%) | 77 (35.0%) |
| $1,500 to $1,999 | 0 (0.0%) | 0 (0.0%) |
| $2,000 to $2,499 | 0 (0.0%) | 0 (0.0%) |
| $2,500 to $2,999 | 0 (0.0%) | 0 (0.0%) |
| $3,000 or more | 0 (0.0%) | 0 (0.0%) |
| Total | 250 (100.0%) | 220 (100.0%) |
Physical Housing Characteristics in Barker Heights
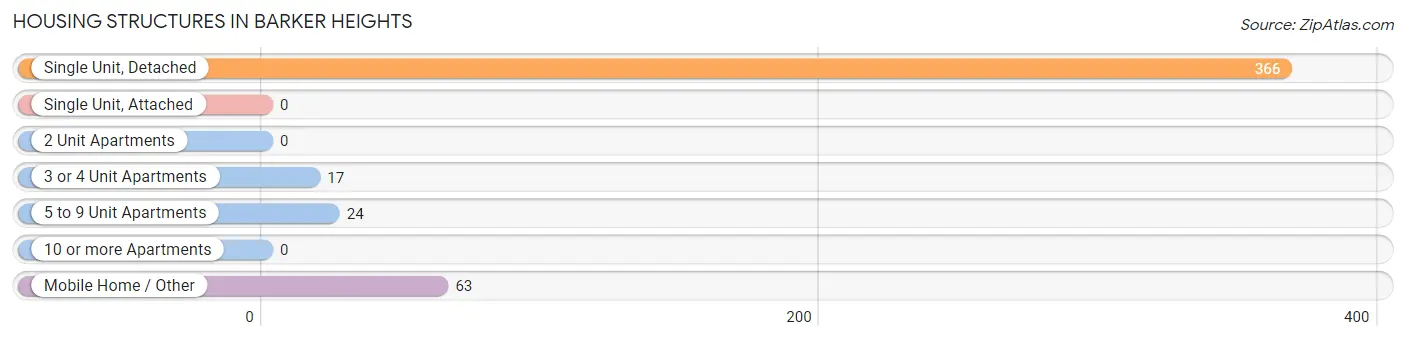
Housing Structures in Barker Heights
| Structure Type | # Housing Units | % Housing Units |
| Single Unit, Detached | 366 | 77.9% |
| Single Unit, Attached | 0 | 0.0% |
| 2 Unit Apartments | 0 | 0.0% |
| 3 or 4 Unit Apartments | 17 | 3.6% |
| 5 to 9 Unit Apartments | 24 | 5.1% |
| 10 or more Apartments | 0 | 0.0% |
| Mobile Home / Other | 63 | 13.4% |
| Total | 470 | 100.0% |
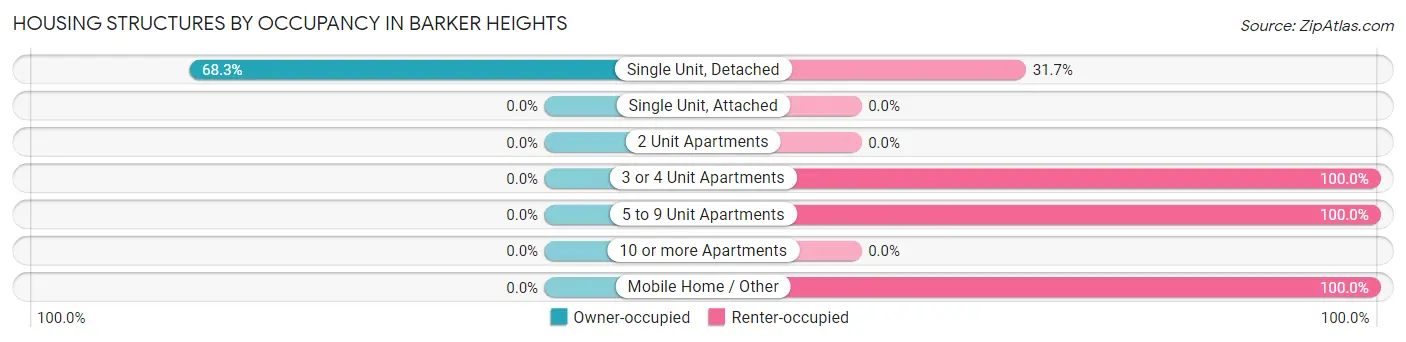
Housing Structures by Occupancy in Barker Heights
| Structure Type | Owner-occupied | Renter-occupied |
| Single Unit, Detached | 250 (68.3%) | 116 (31.7%) |
| Single Unit, Attached | 0 (0.0%) | 0 (0.0%) |
| 2 Unit Apartments | 0 (0.0%) | 0 (0.0%) |
| 3 or 4 Unit Apartments | 0 (0.0%) | 17 (100.0%) |
| 5 to 9 Unit Apartments | 0 (0.0%) | 24 (100.0%) |
| 10 or more Apartments | 0 (0.0%) | 0 (0.0%) |
| Mobile Home / Other | 0 (0.0%) | 63 (100.0%) |
| Total | 250 (53.2%) | 220 (46.8%) |
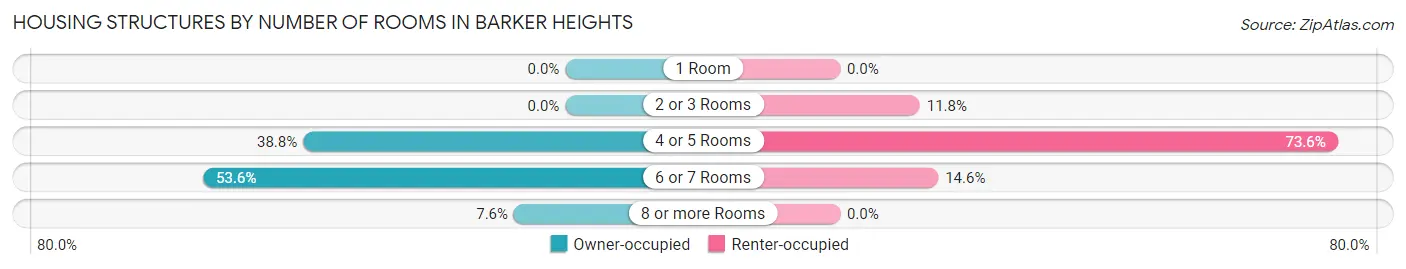
Housing Structures by Number of Rooms in Barker Heights
| Number of Rooms | Owner-occupied | Renter-occupied |
| 1 Room | 0 (0.0%) | 0 (0.0%) |
| 2 or 3 Rooms | 0 (0.0%) | 26 (11.8%) |
| 4 or 5 Rooms | 97 (38.8%) | 162 (73.6%) |
| 6 or 7 Rooms | 134 (53.6%) | 32 (14.5%) |
| 8 or more Rooms | 19 (7.6%) | 0 (0.0%) |
| Total | 250 (100.0%) | 220 (100.0%) |
Housing Structure by Heating Type in Barker Heights
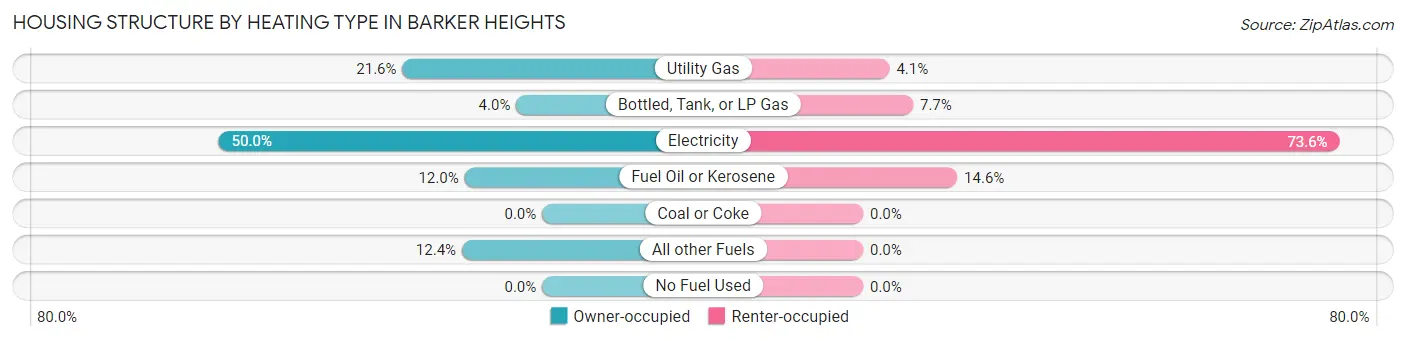
| Heating Type | Owner-occupied | Renter-occupied |
| Utility Gas | 54 (21.6%) | 9 (4.1%) |
| Bottled, Tank, or LP Gas | 10 (4.0%) | 17 (7.7%) |
| Electricity | 125 (50.0%) | 162 (73.6%) |
| Fuel Oil or Kerosene | 30 (12.0%) | 32 (14.5%) |
| Coal or Coke | 0 (0.0%) | 0 (0.0%) |
| All other Fuels | 31 (12.4%) | 0 (0.0%) |
| No Fuel Used | 0 (0.0%) | 0 (0.0%) |
| Total | 250 (100.0%) | 220 (100.0%) |
Household Vehicle Usage in Barker Heights
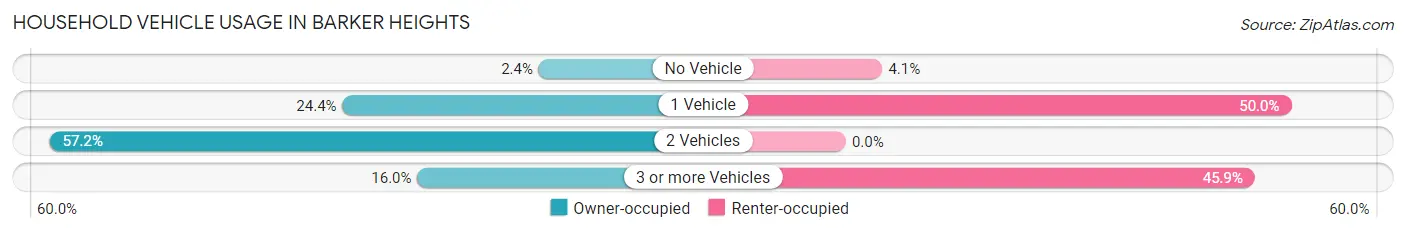
| Vehicles per Household | Owner-occupied | Renter-occupied |
| No Vehicle | 6 (2.4%) | 9 (4.1%) |
| 1 Vehicle | 61 (24.4%) | 110 (50.0%) |
| 2 Vehicles | 143 (57.2%) | 0 (0.0%) |
| 3 or more Vehicles | 40 (16.0%) | 101 (45.9%) |
| Total | 250 (100.0%) | 220 (100.0%) |
Real Estate & Mortgages in Barker Heights
Real Estate and Mortgage Overview in Barker Heights
| Characteristic | Without Mortgage | With Mortgage |
| Housing Units | 150 | 100 |
| Median Property Value | $199,400 | $216,000 |
| Median Household Income | - | - |
| Monthly Housing Costs | $341 | $0 |
| Real Estate Taxes | $886 | $0 |
Property Value by Mortgage Status in Barker Heights
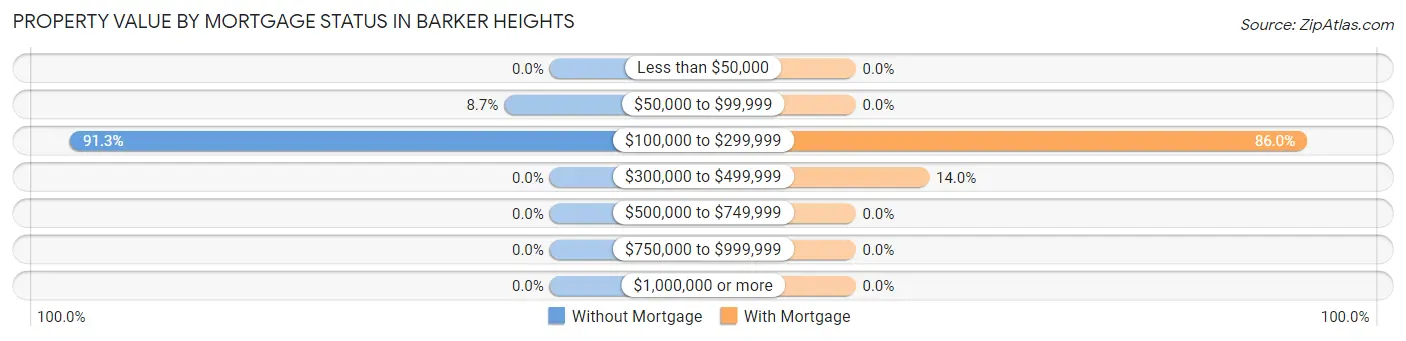
| Property Value | Without Mortgage | With Mortgage |
| Less than $50,000 | 0 (0.0%) | 0 (0.0%) |
| $50,000 to $99,999 | 13 (8.7%) | 0 (0.0%) |
| $100,000 to $299,999 | 137 (91.3%) | 86 (86.0%) |
| $300,000 to $499,999 | 0 (0.0%) | 14 (14.0%) |
| $500,000 to $749,999 | 0 (0.0%) | 0 (0.0%) |
| $750,000 to $999,999 | 0 (0.0%) | 0 (0.0%) |
| $1,000,000 or more | 0 (0.0%) | 0 (0.0%) |
| Total | 150 (100.0%) | 100 (100.0%) |
Household Income by Mortgage Status in Barker Heights
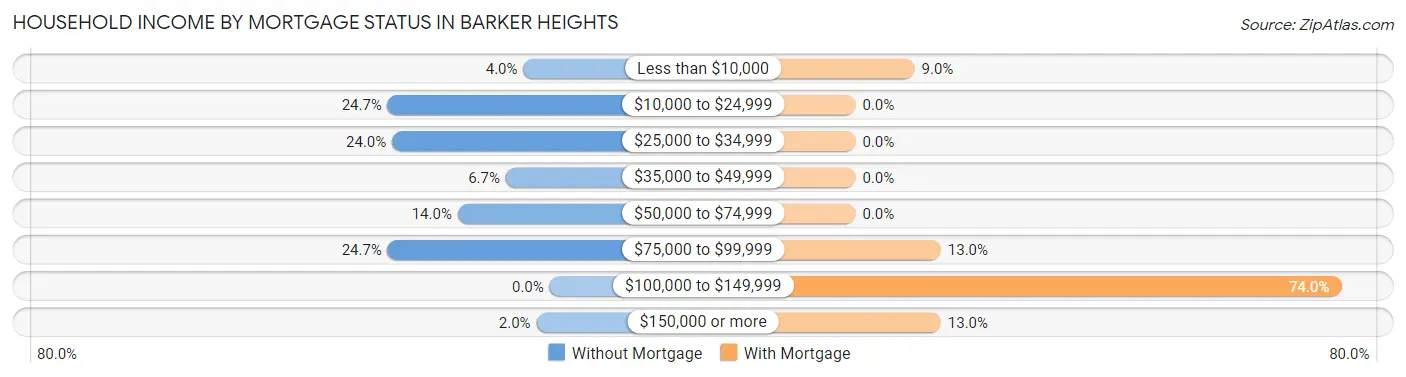
| Household Income | Without Mortgage | With Mortgage |
| Less than $10,000 | 6 (4.0%) | 9 (9.0%) |
| $10,000 to $24,999 | 37 (24.7%) | 0 (0.0%) |
| $25,000 to $34,999 | 36 (24.0%) | 0 (0.0%) |
| $35,000 to $49,999 | 10 (6.7%) | 0 (0.0%) |
| $50,000 to $74,999 | 21 (14.0%) | 0 (0.0%) |
| $75,000 to $99,999 | 37 (24.7%) | 13 (13.0%) |
| $100,000 to $149,999 | 0 (0.0%) | 74 (74.0%) |
| $150,000 or more | 3 (2.0%) | 13 (13.0%) |
| Total | 150 (100.0%) | 100 (100.0%) |
Property Value to Household Income Ratio in Barker Heights
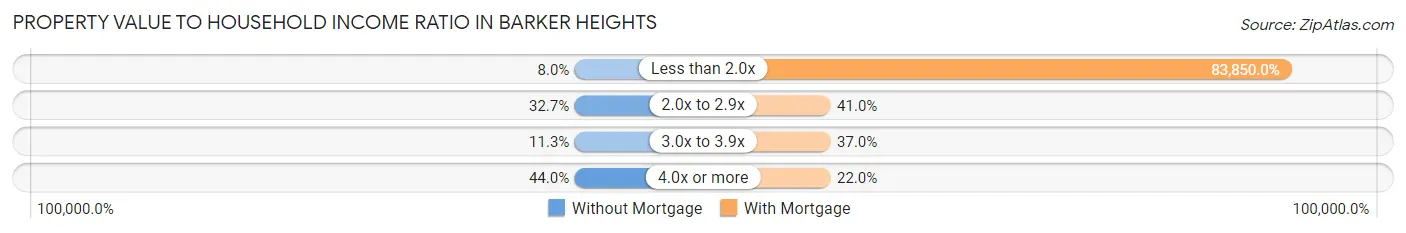
| Value-to-Income Ratio | Without Mortgage | With Mortgage |
| Less than 2.0x | 12 (8.0%) | 83,850 (83,850.0%) |
| 2.0x to 2.9x | 49 (32.7%) | 41 (41.0%) |
| 3.0x to 3.9x | 17 (11.3%) | 37 (37.0%) |
| 4.0x or more | 66 (44.0%) | 22 (22.0%) |
| Total | 150 (100.0%) | 100 (100.0%) |
Real Estate Taxes by Mortgage Status in Barker Heights
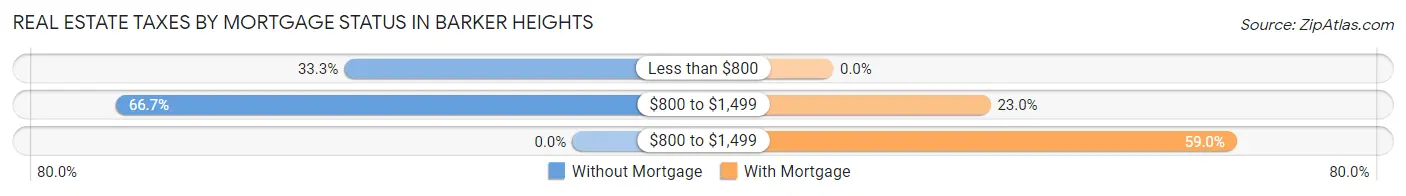
| Property Taxes | Without Mortgage | With Mortgage |
| Less than $800 | 50 (33.3%) | 0 (0.0%) |
| $800 to $1,499 | 100 (66.7%) | 23 (23.0%) |
| $800 to $1,499 | 0 (0.0%) | 59 (59.0%) |
| Total | 150 (100.0%) | 100 (100.0%) |
Health & Disability in Barker Heights
Health Insurance Coverage by Age in Barker Heights
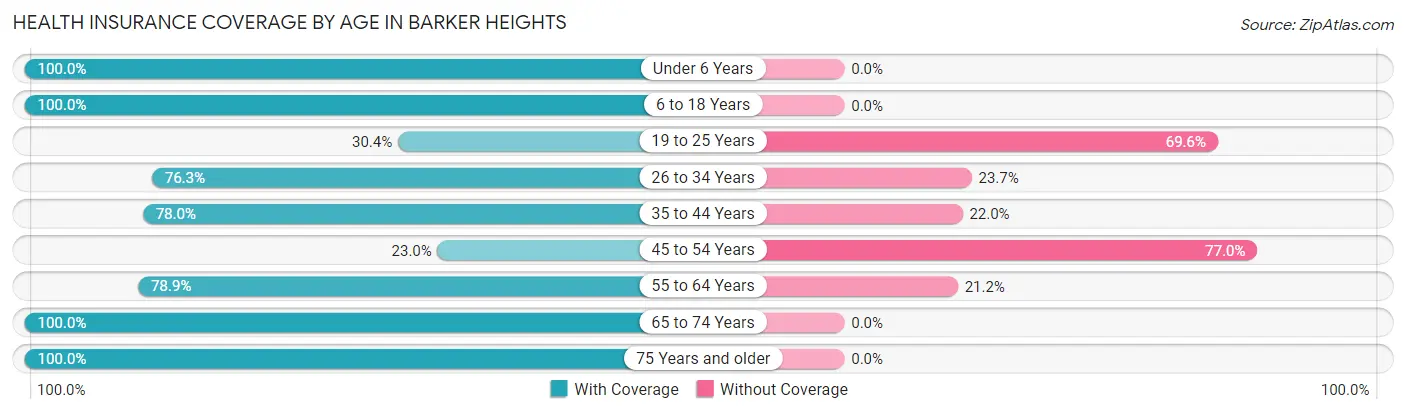
| Age Bracket | With Coverage | Without Coverage |
| Under 6 Years | 50 (100.0%) | 0 (0.0%) |
| 6 to 18 Years | 163 (100.0%) | 0 (0.0%) |
| 19 to 25 Years | 17 (30.4%) | 39 (69.6%) |
| 26 to 34 Years | 45 (76.3%) | 14 (23.7%) |
| 35 to 44 Years | 138 (78.0%) | 39 (22.0%) |
| 45 to 54 Years | 54 (23.0%) | 181 (77.0%) |
| 55 to 64 Years | 82 (78.8%) | 22 (21.1%) |
| 65 to 74 Years | 76 (100.0%) | 0 (0.0%) |
| 75 Years and older | 58 (100.0%) | 0 (0.0%) |
| Total | 683 (69.8%) | 295 (30.2%) |
Health Insurance Coverage by Citizenship Status in Barker Heights
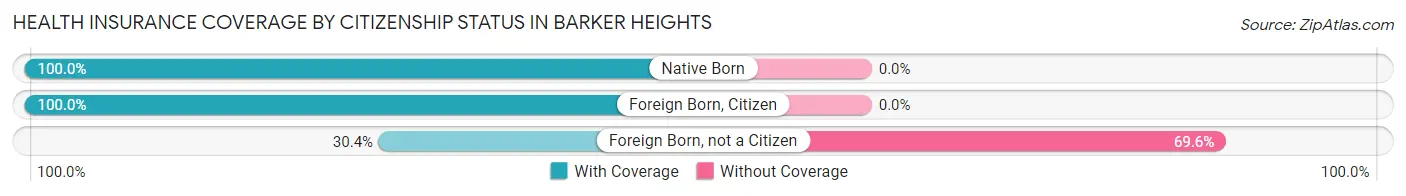
| Citizenship Status | With Coverage | Without Coverage |
| Native Born | 50 (100.0%) | 0 (0.0%) |
| Foreign Born, Citizen | 163 (100.0%) | 0 (0.0%) |
| Foreign Born, not a Citizen | 17 (30.4%) | 39 (69.6%) |
Health Insurance Coverage by Household Income in Barker Heights
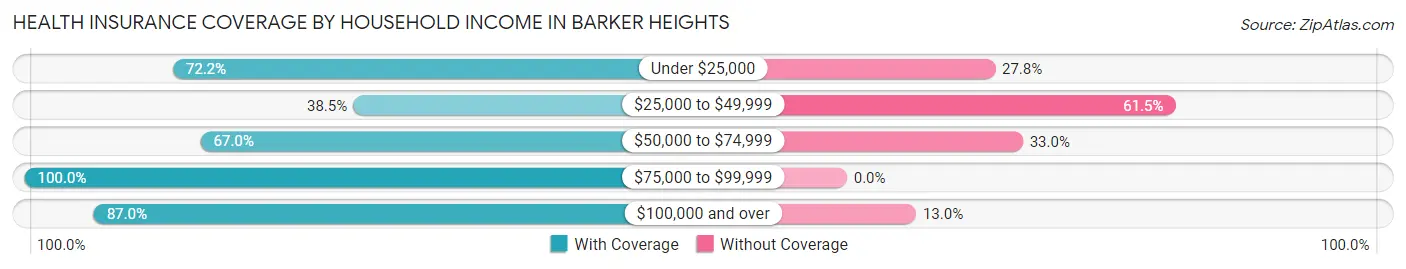
| Household Income | With Coverage | Without Coverage |
| Under $25,000 | 117 (72.2%) | 45 (27.8%) |
| $25,000 to $49,999 | 115 (38.5%) | 184 (61.5%) |
| $50,000 to $74,999 | 120 (67.0%) | 59 (33.0%) |
| $75,000 to $99,999 | 284 (100.0%) | 0 (0.0%) |
| $100,000 and over | 47 (87.0%) | 7 (13.0%) |
Public vs Private Health Insurance Coverage by Age in Barker Heights
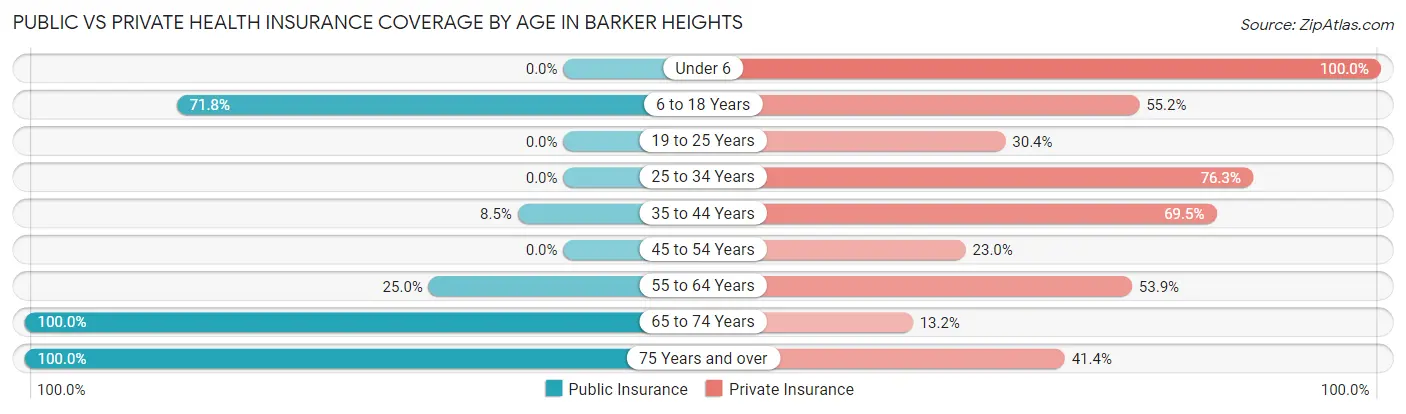
| Age Bracket | Public Insurance | Private Insurance |
| Under 6 | 0 (0.0%) | 50 (100.0%) |
| 6 to 18 Years | 117 (71.8%) | 90 (55.2%) |
| 19 to 25 Years | 0 (0.0%) | 17 (30.4%) |
| 25 to 34 Years | 0 (0.0%) | 45 (76.3%) |
| 35 to 44 Years | 15 (8.5%) | 123 (69.5%) |
| 45 to 54 Years | 0 (0.0%) | 54 (23.0%) |
| 55 to 64 Years | 26 (25.0%) | 56 (53.8%) |
| 65 to 74 Years | 76 (100.0%) | 10 (13.2%) |
| 75 Years and over | 58 (100.0%) | 24 (41.4%) |
| Total | 292 (29.9%) | 469 (48.0%) |
Disability Status by Sex by Age in Barker Heights
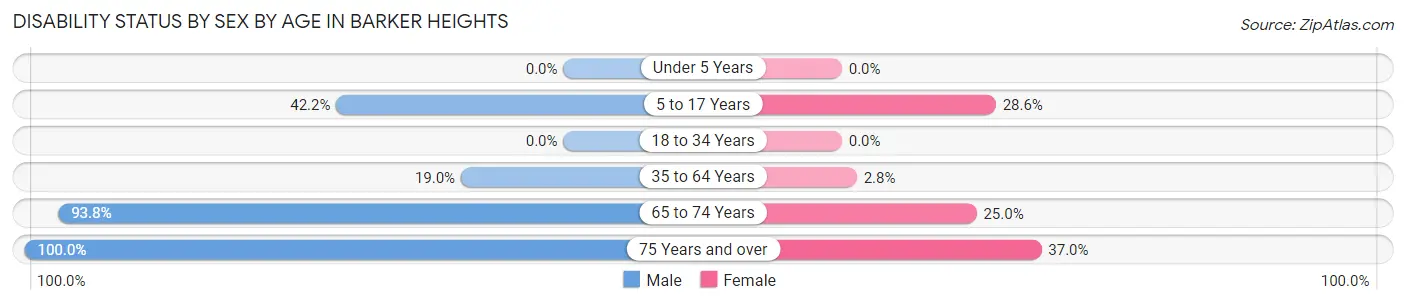
| Age Bracket | Male | Female |
| Under 5 Years | 0 (0.0%) | 0 (0.0%) |
| 5 to 17 Years | 51 (42.1%) | 12 (28.6%) |
| 18 to 34 Years | 0 (0.0%) | 0 (0.0%) |
| 35 to 64 Years | 50 (19.0%) | 7 (2.8%) |
| 65 to 74 Years | 60 (93.8%) | 3 (25.0%) |
| 75 Years and over | 4 (100.0%) | 20 (37.0%) |
Disability Class by Sex by Age in Barker Heights
Disability Class: Hearing Difficulty
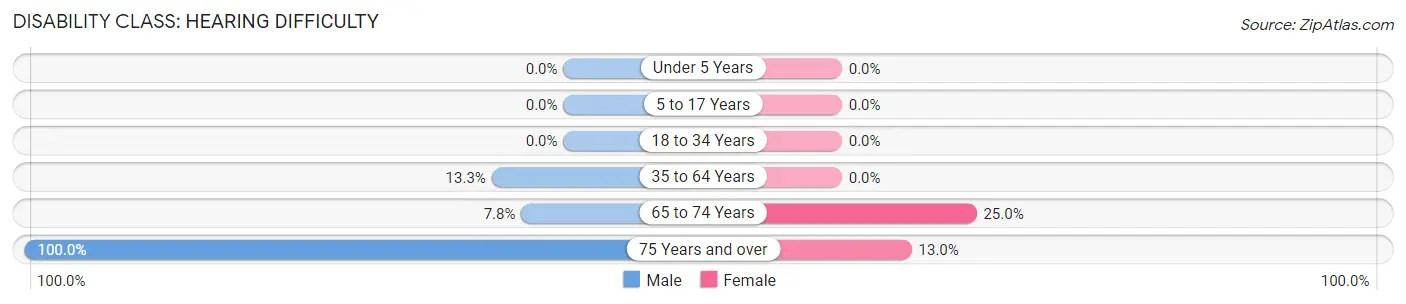
| Age Bracket | Male | Female |
| Under 5 Years | 0 (0.0%) | 0 (0.0%) |
| 5 to 17 Years | 0 (0.0%) | 0 (0.0%) |
| 18 to 34 Years | 0 (0.0%) | 0 (0.0%) |
| 35 to 64 Years | 35 (13.3%) | 0 (0.0%) |
| 65 to 74 Years | 5 (7.8%) | 3 (25.0%) |
| 75 Years and over | 4 (100.0%) | 7 (13.0%) |
Disability Class: Vision Difficulty
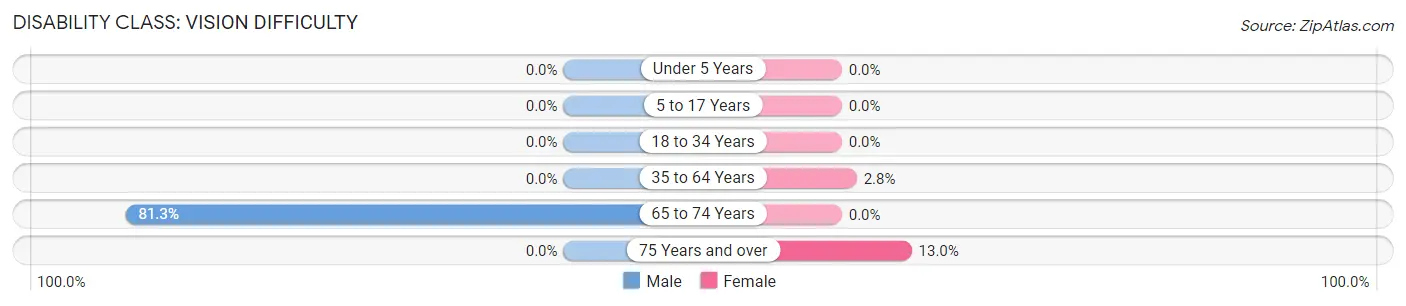
| Age Bracket | Male | Female |
| Under 5 Years | 0 (0.0%) | 0 (0.0%) |
| 5 to 17 Years | 0 (0.0%) | 0 (0.0%) |
| 18 to 34 Years | 0 (0.0%) | 0 (0.0%) |
| 35 to 64 Years | 0 (0.0%) | 7 (2.8%) |
| 65 to 74 Years | 52 (81.2%) | 0 (0.0%) |
| 75 Years and over | 0 (0.0%) | 7 (13.0%) |
Disability Class: Cognitive Difficulty
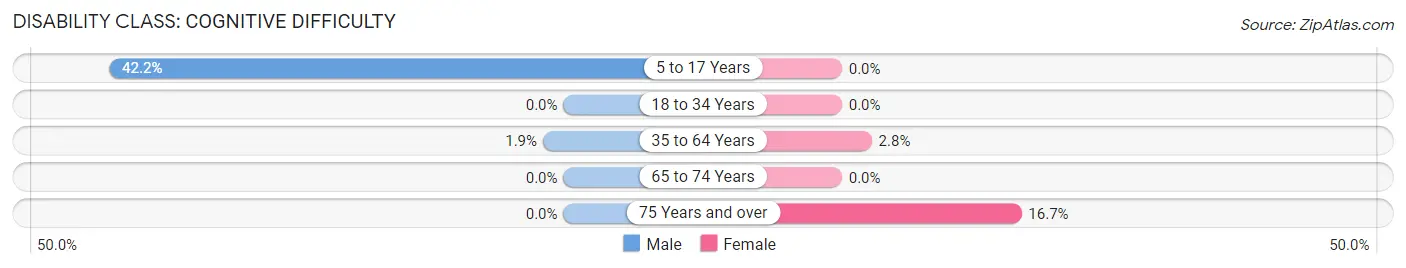
| Age Bracket | Male | Female |
| 5 to 17 Years | 51 (42.1%) | 0 (0.0%) |
| 18 to 34 Years | 0 (0.0%) | 0 (0.0%) |
| 35 to 64 Years | 5 (1.9%) | 7 (2.8%) |
| 65 to 74 Years | 0 (0.0%) | 0 (0.0%) |
| 75 Years and over | 0 (0.0%) | 9 (16.7%) |
Disability Class: Ambulatory Difficulty

| Age Bracket | Male | Female |
| 5 to 17 Years | 0 (0.0%) | 0 (0.0%) |
| 18 to 34 Years | 0 (0.0%) | 0 (0.0%) |
| 35 to 64 Years | 10 (3.8%) | 7 (2.8%) |
| 65 to 74 Years | 27 (42.2%) | 0 (0.0%) |
| 75 Years and over | 4 (100.0%) | 13 (24.1%) |
Disability Class: Self-Care Difficulty

| Age Bracket | Male | Female |
| 5 to 17 Years | 9 (7.4%) | 0 (0.0%) |
| 18 to 34 Years | 0 (0.0%) | 0 (0.0%) |
| 35 to 64 Years | 0 (0.0%) | 7 (2.8%) |
| 65 to 74 Years | 3 (4.7%) | 0 (0.0%) |
| 75 Years and over | 0 (0.0%) | 9 (16.7%) |
Technology Access in Barker Heights
Computing Device Access in Barker Heights
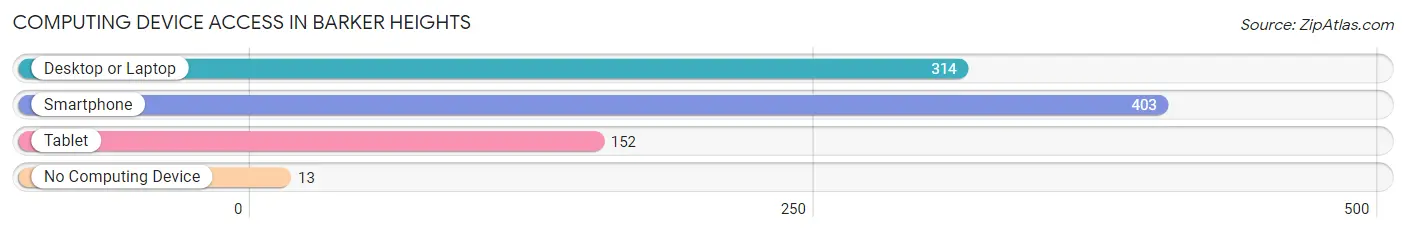
| Device Type | # Households | % Households |
| Desktop or Laptop | 314 | 66.8% |
| Smartphone | 403 | 85.7% |
| Tablet | 152 | 32.3% |
| No Computing Device | 13 | 2.8% |
| Total | 470 | 100.0% |
Internet Access in Barker Heights
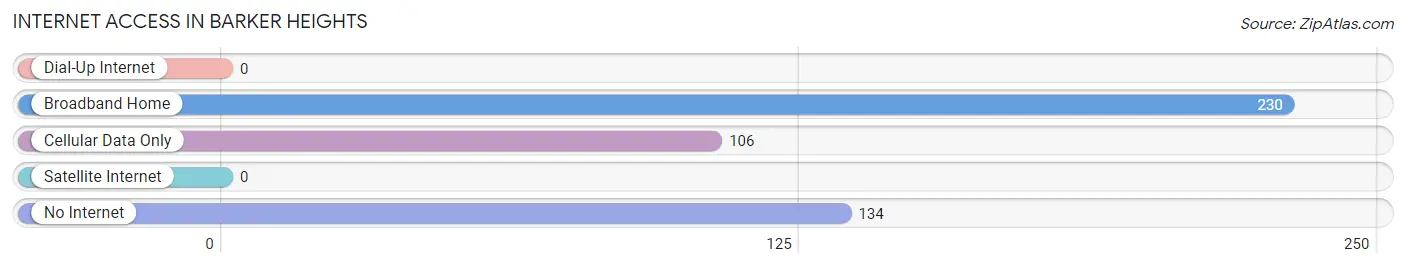
| Internet Type | # Households | % Households |
| Dial-Up Internet | 0 | 0.0% |
| Broadband Home | 230 | 48.9% |
| Cellular Data Only | 106 | 22.6% |
| Satellite Internet | 0 | 0.0% |
| No Internet | 134 | 28.5% |
| Total | 470 | 100.0% |
Barker Heights Summary
Barker Heights is a small town located in the foothills of the Blue Ridge Mountains in North Carolina. It is situated in the western part of the state, about 25 miles from Asheville. The town has a population of just over 1,000 people and is part of the larger Buncombe County.
History
Barker Heights was founded in 1887 by a group of settlers from the nearby town of Weaverville. The town was named after the Barker family, who were among the first settlers. The town was originally a farming community, but in the early 1900s, the town began to grow and develop. The first school was built in 1910, and the first post office was established in 1912.
In the 1920s, the town began to attract more people, and the population grew to over 1,000 by the 1930s. During this time, the town was home to several businesses, including a general store, a blacksmith shop, and a sawmill.
In the 1950s, the town began to decline as many of the businesses closed and the population began to decline. However, in the late 1970s, the town began to experience a resurgence as people began to move back to the area. Today, Barker Heights is a small, rural town with a population of just over 1,000 people.
Geography
Barker Heights is located in the foothills of the Blue Ridge Mountains in western North Carolina. The town is situated in Buncombe County, about 25 miles from Asheville. The town is surrounded by the Pisgah National Forest, which provides a beautiful backdrop for the town.
The town is located at an elevation of 1,400 feet, and the climate is mild and humid. The average temperature in the summer is around 75 degrees Fahrenheit, and the average temperature in the winter is around 40 degrees Fahrenheit.
Economy
The economy of Barker Heights is largely based on agriculture and tourism. The town is home to several farms, which produce a variety of crops, including corn, soybeans, and hay. The town is also home to several wineries, which attract tourists from all over the region.
In addition to agriculture and tourism, the town is also home to several small businesses, including a general store, a hardware store, and a restaurant. The town is also home to a few manufacturing companies, which produce a variety of products, including furniture and clothing.
Demographics
As of the 2010 census, the population of Barker Heights was 1,072. The town is predominantly white, with a population that is 97.3% white and 2.7% other races. The median household income in the town is $41,250, and the median age is 44.7 years.
Conclusion
Barker Heights is a small, rural town located in the foothills of the Blue Ridge Mountains in western North Carolina. The town has a population of just over 1,000 people and is part of the larger Buncombe County. The town is largely based on agriculture and tourism, and is home to several small businesses. The population of the town is predominantly white, with a median household income of $41,250 and a median age of 44.7 years.
Common Questions
What is the Total Population of Barker Heights?
Total Population of Barker Heights is 978.
What is the Total Male Population of Barker Heights?
Total Male Population of Barker Heights is 533.
What is the Total Female Population of Barker Heights?
Total Female Population of Barker Heights is 445.
What is the Ratio of Males per 100 Females in Barker Heights?
There are 119.78 Males per 100 Females in Barker Heights.
What is the Ratio of Females per 100 Males in Barker Heights?
There are 83.49 Females per 100 Males in Barker Heights.
What is the Median Population Age in Barker Heights?
Median Population Age in Barker Heights is 42.6 Years.
What is the Average Family Size in Barker Heights
Average Family Size in Barker Heights is 2.5 People.
What is the Average Household Size in Barker Heights
Average Household Size in Barker Heights is 2.1 People.
What is Per Capita Income in Barker Heights?
Per Capita income in Barker Heights is $24,419.
What is Income or Wage Gap in Barker Heights?
Income or Wage Gap in Barker Heights is 20.7%.
Women in Barker Heights earn 79.3 cents for every dollar earned by a man.
What is Inequality or Gini Index in Barker Heights?
Inequality or Gini Index in Barker Heights is 0.40.
How Large is the Labor Force in Barker Heights?
There are 508 People in the Labor Forcein in Barker Heights.
What is the Percentage of People in the Labor Force in Barker Heights?
64.5% of People are in the Labor Force in Barker Heights.
What is the Unemployment Rate in Barker Heights?
Unemployment Rate in Barker Heights is 1.2%.