St James, NC
St James Map
St James Overview
6,566
TOTAL POPULATION
3,191
MALE POPULATION
3,375
FEMALE POPULATION
94.55
MALES / 100 FEMALES
105.77
FEMALES / 100 MALES
68.3
MEDIAN AGE
2.2
AVG FAMILY SIZE
2.0
AVG HOUSEHOLD SIZE
$90,098
PER CAPITA INCOME
$119,160
AVG FAMILY INCOME
$113,507
AVG HOUSEHOLD INCOME
58.0%
WAGE / INCOME GAP [ % ]
42.0¢/ $1
WAGE / INCOME GAP [ $ ]
$6,500
FAMILY INCOME DEFICIT
0.49
INEQUALITY / GINI INDEX
1,602
LABOR FORCE [ PEOPLE ]
25.4%
PERCENT IN LABOR FORCE
3.5%
UNEMPLOYMENT RATE
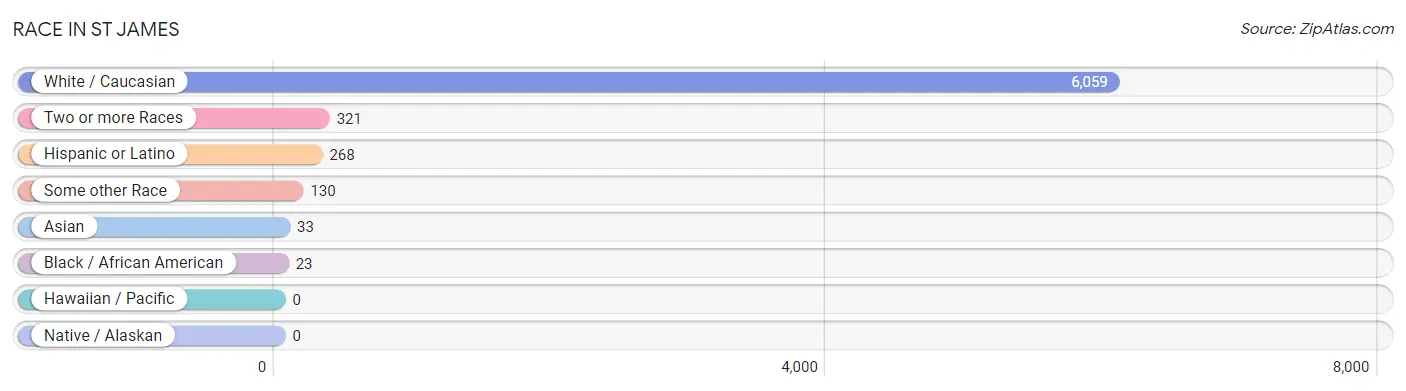
Race in St James
The most populous races in St James are White / Caucasian (6,059 | 92.3%), Two or more Races (321 | 4.9%), and Hispanic or Latino (268 | 4.1%).
| Race | # Population | % Population |
| Asian | 33 | 0.5% |
| Black / African American | 23 | 0.4% |
| Hawaiian / Pacific | 0 | 0.0% |
| Hispanic or Latino | 268 | 4.1% |
| Native / Alaskan | 0 | 0.0% |
| White / Caucasian | 6,059 | 92.3% |
| Two or more Races | 321 | 4.9% |
| Some other Race | 130 | 2.0% |
| Total | 6,566 | 100.0% |
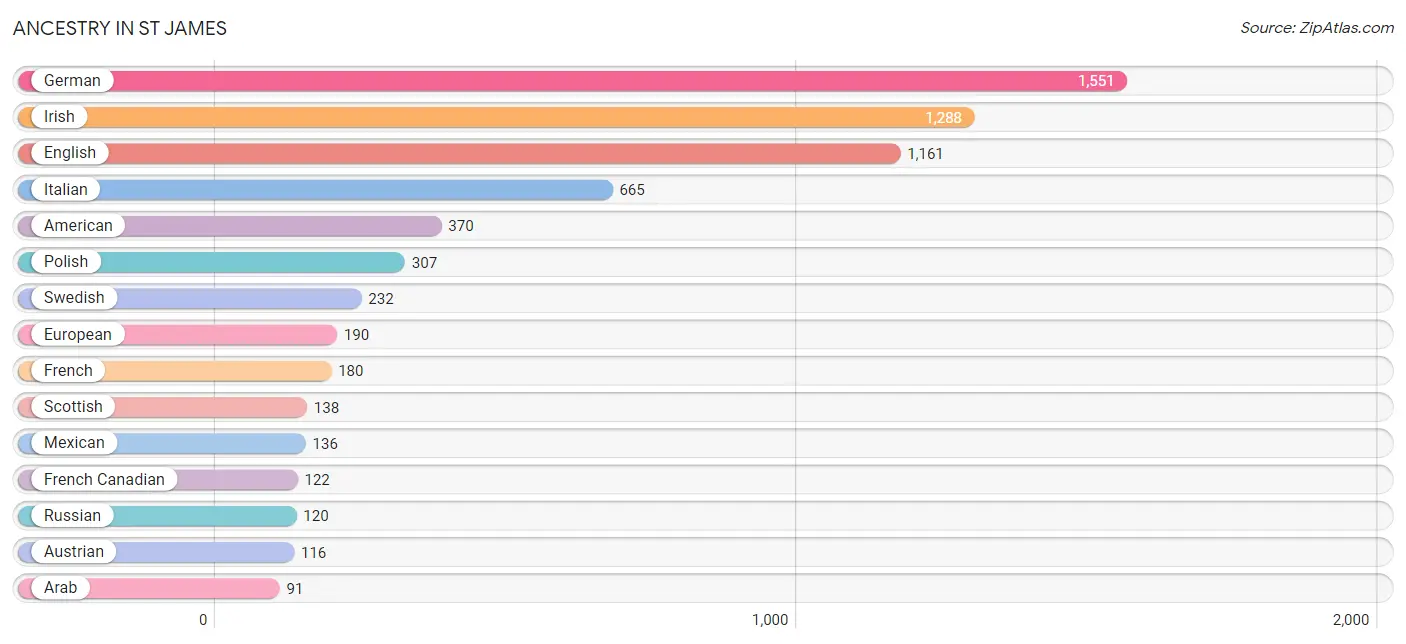
Ancestry in St James
The most populous ancestries reported in St James are German (1,551 | 23.6%), Irish (1,288 | 19.6%), English (1,161 | 17.7%), Italian (665 | 10.1%), and American (370 | 5.6%), together accounting for 76.7% of all St James residents.
| Ancestry | # Population | % Population |
| American | 370 | 5.6% |
| Arab | 91 | 1.4% |
| Austrian | 116 | 1.8% |
| Belgian | 19 | 0.3% |
| Bhutanese | 17 | 0.3% |
| British | 59 | 0.9% |
| Canadian | 14 | 0.2% |
| Celtic | 61 | 0.9% |
| Central American | 59 | 0.9% |
| Czech | 52 | 0.8% |
| Danish | 78 | 1.2% |
| Dutch | 91 | 1.4% |
| Eastern European | 31 | 0.5% |
| Egyptian | 60 | 0.9% |
| English | 1,161 | 17.7% |
| European | 190 | 2.9% |
| Filipino | 20 | 0.3% |
| French | 180 | 2.7% |
| French Canadian | 122 | 1.9% |
| German | 1,551 | 23.6% |
| Greek | 25 | 0.4% |
| Guatemalan | 59 | 0.9% |
| Hungarian | 32 | 0.5% |
| Indian (Asian) | 13 | 0.2% |
| Irish | 1,288 | 19.6% |
| Italian | 665 | 10.1% |
| Lebanese | 60 | 0.9% |
| Lithuanian | 54 | 0.8% |
| Mexican | 136 | 2.1% |
| Northern European | 14 | 0.2% |
| Norwegian | 81 | 1.2% |
| Polish | 307 | 4.7% |
| Russian | 120 | 1.8% |
| Scotch-Irish | 47 | 0.7% |
| Scottish | 138 | 2.1% |
| Serbian | 16 | 0.2% |
| Slovak | 22 | 0.3% |
| Spaniard | 23 | 0.4% |
| Spanish | 16 | 0.2% |
| Swedish | 232 | 3.5% |
| Swiss | 23 | 0.4% |
| Turkish | 31 | 0.5% |
| Ukrainian | 32 | 0.5% |
| Welsh | 78 | 1.2% | View All 44 Rows |
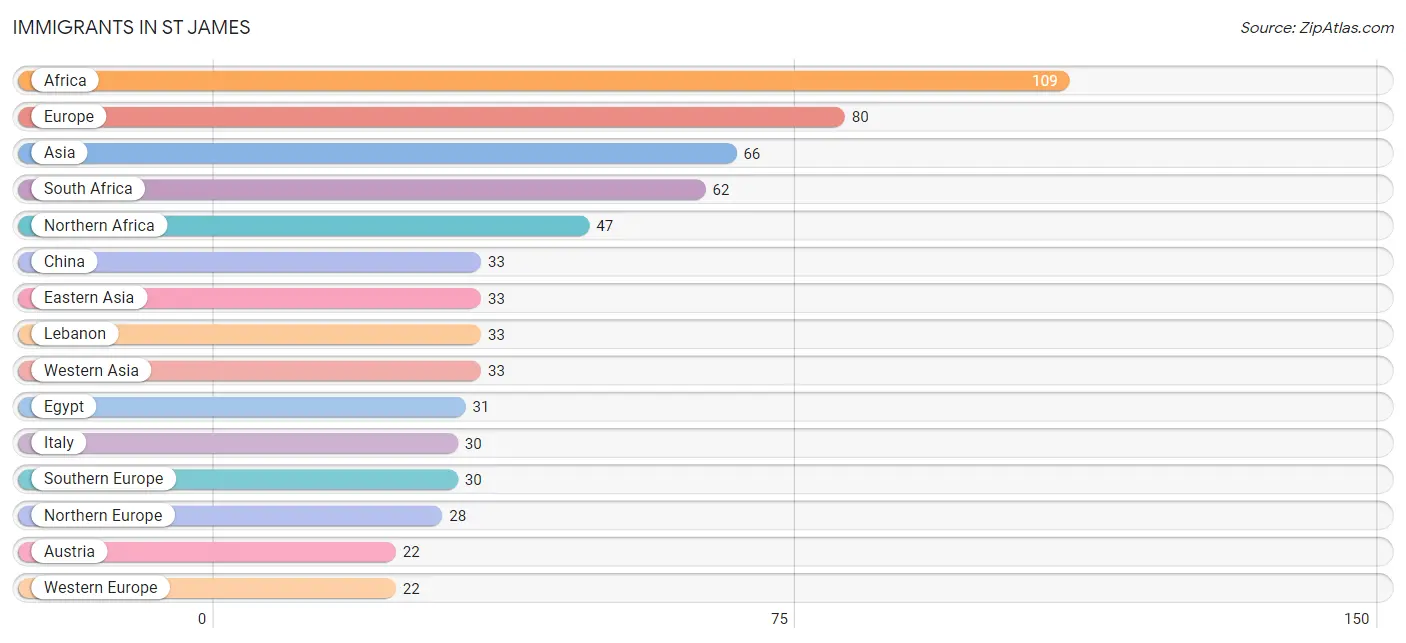
Immigrants in St James
The most numerous immigrant groups reported in St James came from Africa (109 | 1.7%), Europe (80 | 1.2%), Asia (66 | 1.0%), South Africa (62 | 0.9%), and Northern Africa (47 | 0.7%), together accounting for 5.5% of all St James residents.
| Immigration Origin | # Population | % Population |
| Africa | 109 | 1.7% |
| Asia | 66 | 1.0% |
| Austria | 22 | 0.3% |
| Canada | 14 | 0.2% |
| China | 33 | 0.5% |
| Eastern Asia | 33 | 0.5% |
| Egypt | 31 | 0.5% |
| Europe | 80 | 1.2% |
| Italy | 30 | 0.5% |
| Lebanon | 33 | 0.5% |
| Morocco | 16 | 0.2% |
| Northern Africa | 47 | 0.7% |
| Northern Europe | 28 | 0.4% |
| Scotland | 16 | 0.2% |
| South Africa | 62 | 0.9% |
| Southern Europe | 30 | 0.5% |
| Taiwan | 20 | 0.3% |
| Western Asia | 33 | 0.5% |
| Western Europe | 22 | 0.3% | View All 19 Rows |
Sex and Age in St James
Sex and Age in St James
The most populous age groups in St James are 70 to 74 Years (758 | 23.7%) for men and 70 to 74 Years (752 | 22.3%) for women.
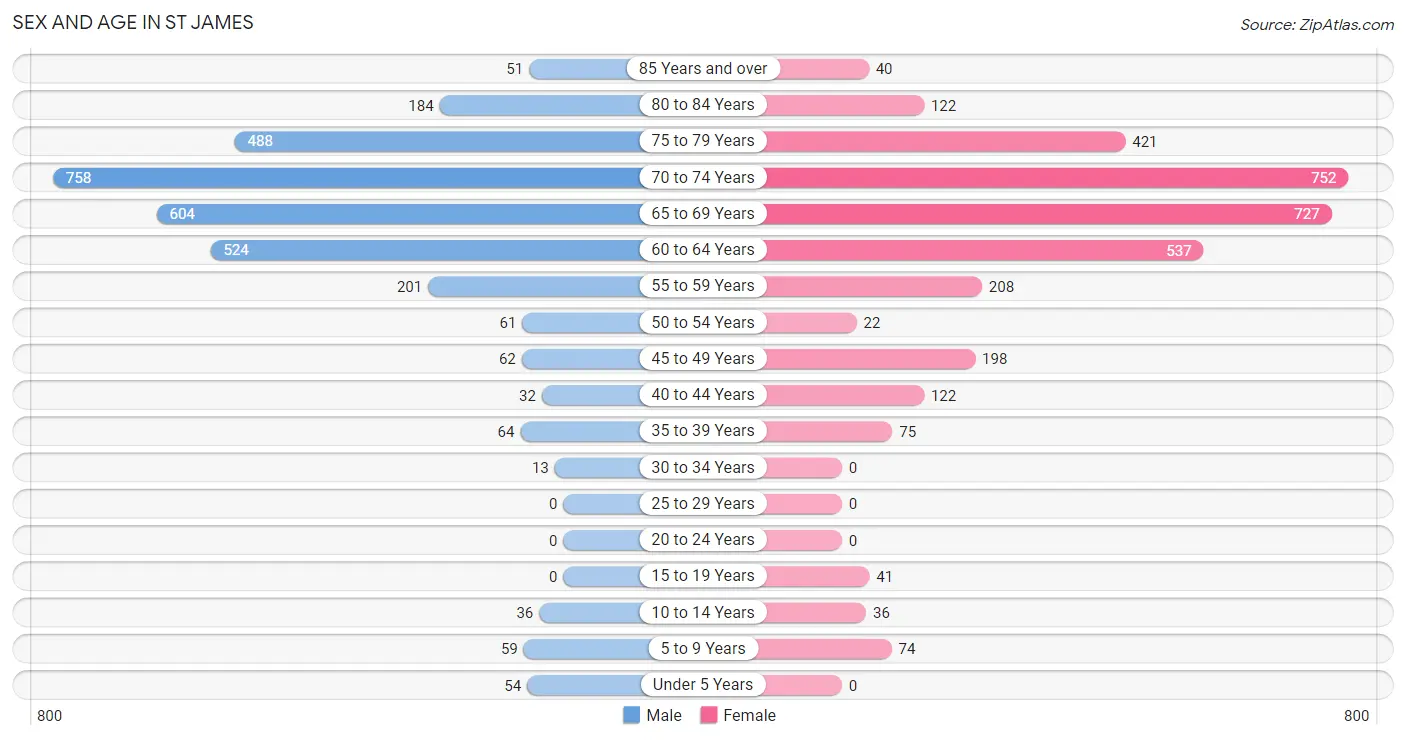
| Age Bracket | Male | Female |
| Under 5 Years | 54 (1.7%) | 0 (0.0%) |
| 5 to 9 Years | 59 (1.8%) | 74 (2.2%) |
| 10 to 14 Years | 36 (1.1%) | 36 (1.1%) |
| 15 to 19 Years | 0 (0.0%) | 41 (1.2%) |
| 20 to 24 Years | 0 (0.0%) | 0 (0.0%) |
| 25 to 29 Years | 0 (0.0%) | 0 (0.0%) |
| 30 to 34 Years | 13 (0.4%) | 0 (0.0%) |
| 35 to 39 Years | 64 (2.0%) | 75 (2.2%) |
| 40 to 44 Years | 32 (1.0%) | 122 (3.6%) |
| 45 to 49 Years | 62 (1.9%) | 198 (5.9%) |
| 50 to 54 Years | 61 (1.9%) | 22 (0.6%) |
| 55 to 59 Years | 201 (6.3%) | 208 (6.2%) |
| 60 to 64 Years | 524 (16.4%) | 537 (15.9%) |
| 65 to 69 Years | 604 (18.9%) | 727 (21.5%) |
| 70 to 74 Years | 758 (23.7%) | 752 (22.3%) |
| 75 to 79 Years | 488 (15.3%) | 421 (12.5%) |
| 80 to 84 Years | 184 (5.8%) | 122 (3.6%) |
| 85 Years and over | 51 (1.6%) | 40 (1.2%) |
| Total | 3,191 (100.0%) | 3,375 (100.0%) |
Families and Households in St James
Median Family Size in St James
The median family size in St James is 2.21 persons per family, with single female/mother families (37 | 1.4%) accounting for the largest median family size of 2.41 persons per family. On the other hand, single male/father families (1 | 0.0%) represent the smallest median family size with 2.00 persons per family.
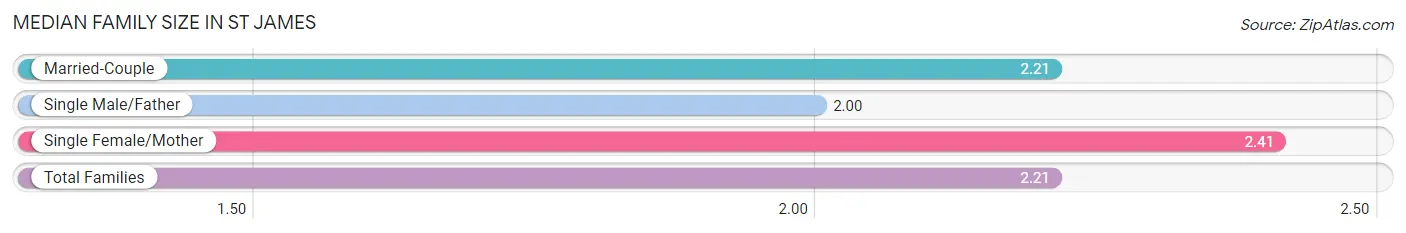
| Family Type | # Families | Family Size |
| Married-Couple | 2,635 (98.6%) | 2.21 |
| Single Male/Father | 1 (0.0%) | 2.00 |
| Single Female/Mother | 37 (1.4%) | 2.41 |
| Total Families | 2,673 (100.0%) | 2.21 |
Median Household Size in St James
The median household size in St James is 2.05 persons per household, with single female/mother households (37 | 1.2%) accounting for the largest median household size of 2.41 persons per household. non-family households (524 | 16.4%) represent the smallest median household size with 1.25 persons per household.
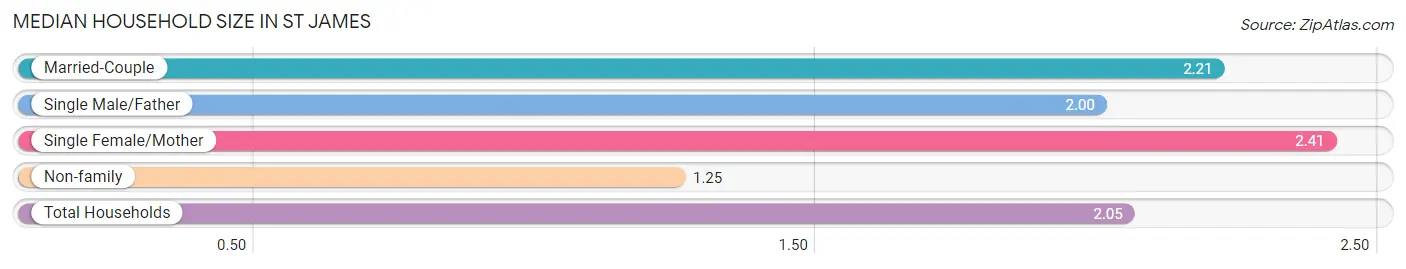
| Household Type | # Households | Household Size |
| Married-Couple | 2,635 (82.4%) | 2.21 |
| Single Male/Father | 1 (0.0%) | 2.00 |
| Single Female/Mother | 37 (1.2%) | 2.41 |
| Non-family | 524 (16.4%) | 1.25 |
| Total Households | 3,197 (100.0%) | 2.05 |
Household Size by Marriage Status in St James
Out of a total of 3,197 households in St James, 2,673 (83.6%) are family households, while 524 (16.4%) are nonfamily households. The most numerous type of family households are 2-person households, comprising 2,382, and the most common type of nonfamily households are 1-person households, comprising 405.
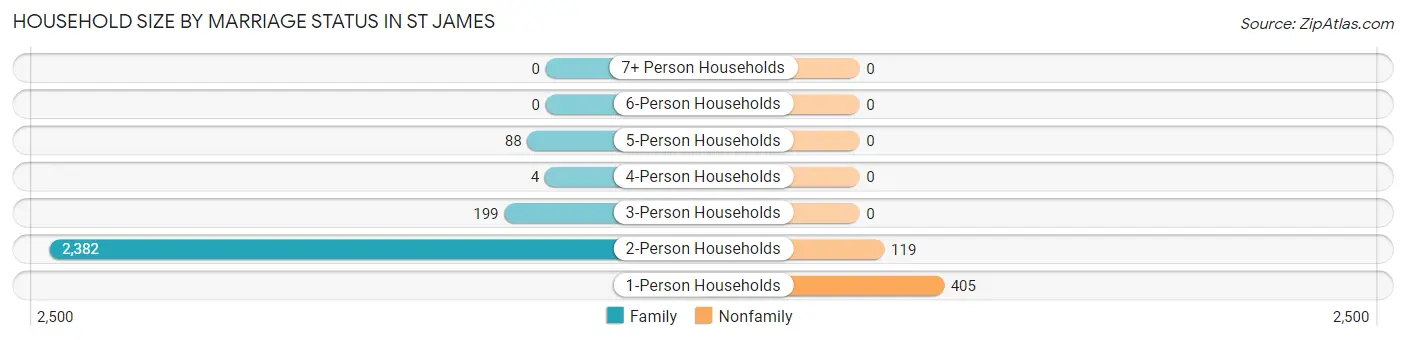
| Household Size | Family Households | Nonfamily Households |
| 1-Person Households | - | 405 (12.7%) |
| 2-Person Households | 2,382 (74.5%) | 119 (3.7%) |
| 3-Person Households | 199 (6.2%) | 0 (0.0%) |
| 4-Person Households | 4 (0.1%) | 0 (0.0%) |
| 5-Person Households | 88 (2.8%) | 0 (0.0%) |
| 6-Person Households | 0 (0.0%) | 0 (0.0%) |
| 7+ Person Households | 0 (0.0%) | 0 (0.0%) |
| Total | 2,673 (83.6%) | 524 (16.4%) |
Female Fertility in St James
Fertility by Age in St James
| Age Bracket | Women with Births | Births / 1,000 Women |
| 15 to 19 years | 0 (0.0%) | 0.0 |
| 20 to 34 years | 0 (0.0%) | 0.0 |
| 35 to 50 years | 0 (0.0%) | 0.0 |
| Total | 0 (0.0%) | 0.0 |
Fertility by Age by Marriage Status in St James
| Age Bracket | Married | Unmarried |
| 15 to 19 years | 0 (0.0%) | 0 (0.0%) |
| 20 to 34 years | 0 (0.0%) | 0 (0.0%) |
| 35 to 50 years | 0 (0.0%) | 0 (0.0%) |
| Total | 0 (0.0%) | 0 (0.0%) |
Fertility by Education in St James
| Educational Attainment | Women with Births | Births / 1,000 Women |
| Less than High School | 0 (0.0%) | 0.0 |
| High School Diploma | 0 (0.0%) | 0.0 |
| College or Associate's Degree | 0 (0.0%) | 0.0 |
| Bachelor's Degree | 0 (0.0%) | 0.0 |
| Graduate Degree | 0 (0.0%) | 0.0 |
| Total | 0 (0.0%) | 0.0 |
Fertility by Education by Marriage Status in St James
| Educational Attainment | Married | Unmarried |
| Less than High School | 0 (0.0%) | 0 (0.0%) |
| High School Diploma | 0 (0.0%) | 0 (0.0%) |
| College or Associate's Degree | 0 (0.0%) | 0 (0.0%) |
| Bachelor's Degree | 0 (0.0%) | 0 (0.0%) |
| Graduate Degree | 0 (0.0%) | 0 (0.0%) |
| Total | 0 (0.0%) | 0 (0.0%) |
Income in St James
Income Overview in St James
Per Capita Income in St James is $90,098, while median incomes of families and households are $119,160 and $113,507 respectively.
| Characteristic | Number | Measure |
| Per Capita Income | 6,566 | $90,098 |
| Median Family Income | 2,673 | $119,160 |
| Mean Family Income | 2,673 | $154,025 |
| Median Household Income | 3,197 | $113,507 |
| Mean Household Income | 3,197 | $183,278 |
| Income Deficit | 2,673 | $6,500 |
| Wage / Income Gap (%) | 6,566 | 57.99% |
| Wage / Income Gap ($) | 6,566 | 42.01¢ per $1 |
| Gini / Inequality Index | 6,566 | 0.49 |
Earnings by Sex in St James
Average Earnings in St James are $71,344, $121,083 for men and $50,864 for women, a difference of 58.0%.
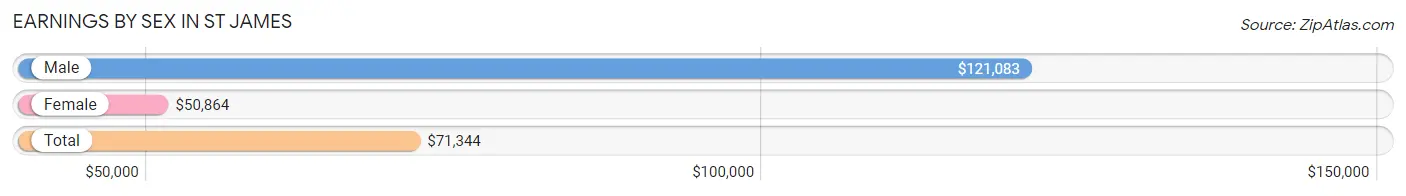
| Sex | Number | Average Earnings |
| Male | 1,061 (55.4%) | $121,083 |
| Female | 854 (44.6%) | $50,864 |
| Total | 1,915 (100.0%) | $71,344 |
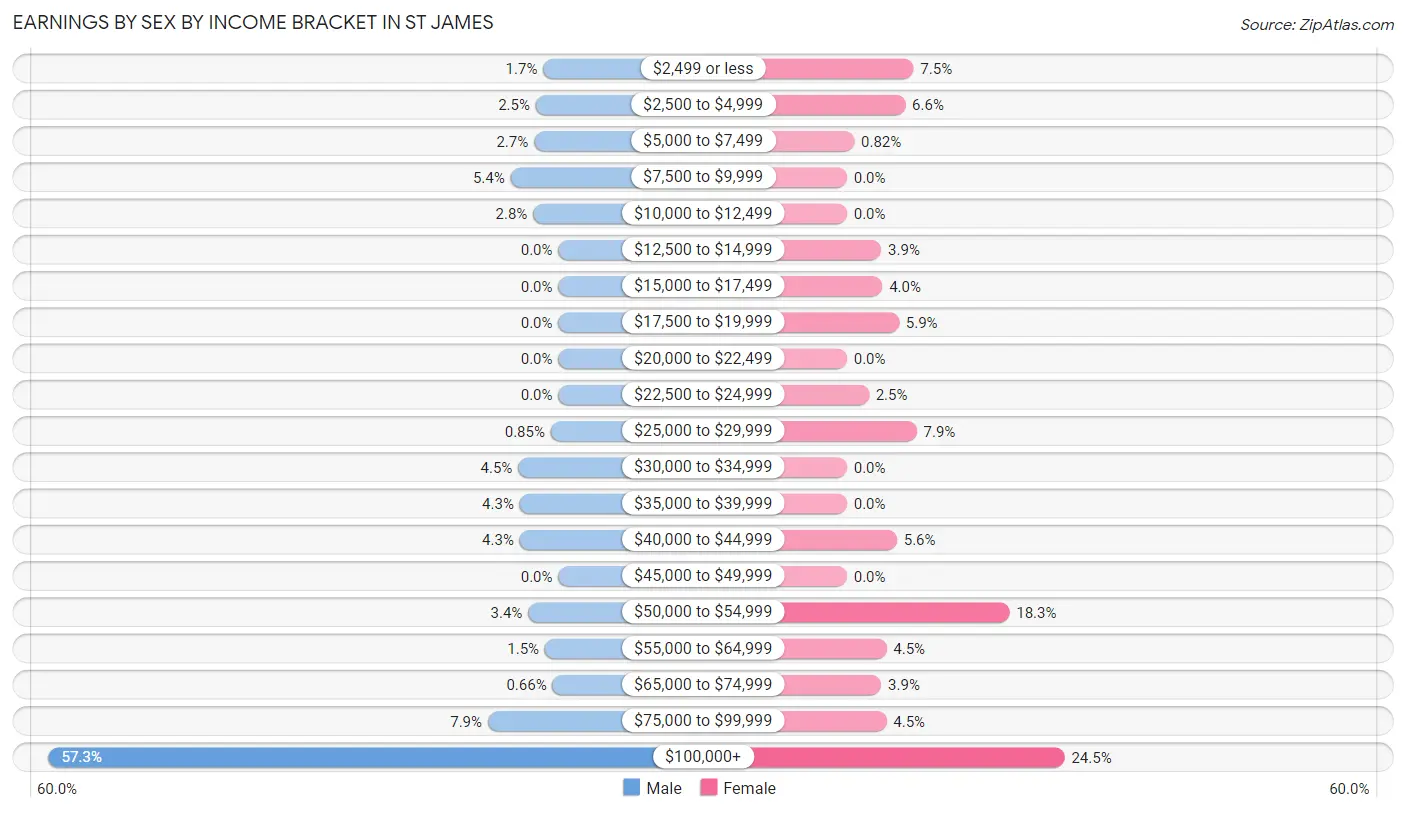
Earnings by Sex by Income Bracket in St James
The most common earnings brackets in St James are $100,000+ for men (608 | 57.3%) and $100,000+ for women (209 | 24.5%).
| Income | Male | Female |
| $2,499 or less | 18 (1.7%) | 64 (7.5%) |
| $2,500 to $4,999 | 27 (2.5%) | 56 (6.6%) |
| $5,000 to $7,499 | 29 (2.7%) | 7 (0.8%) |
| $7,500 to $9,999 | 57 (5.4%) | 0 (0.0%) |
| $10,000 to $12,499 | 30 (2.8%) | 0 (0.0%) |
| $12,500 to $14,999 | 0 (0.0%) | 33 (3.9%) |
| $15,000 to $17,499 | 0 (0.0%) | 34 (4.0%) |
| $17,500 to $19,999 | 0 (0.0%) | 50 (5.9%) |
| $20,000 to $22,499 | 0 (0.0%) | 0 (0.0%) |
| $22,500 to $24,999 | 0 (0.0%) | 21 (2.5%) |
| $25,000 to $29,999 | 9 (0.9%) | 67 (7.9%) |
| $30,000 to $34,999 | 48 (4.5%) | 0 (0.0%) |
| $35,000 to $39,999 | 46 (4.3%) | 0 (0.0%) |
| $40,000 to $44,999 | 46 (4.3%) | 48 (5.6%) |
| $45,000 to $49,999 | 0 (0.0%) | 0 (0.0%) |
| $50,000 to $54,999 | 36 (3.4%) | 156 (18.3%) |
| $55,000 to $64,999 | 16 (1.5%) | 38 (4.4%) |
| $65,000 to $74,999 | 7 (0.7%) | 33 (3.9%) |
| $75,000 to $99,999 | 84 (7.9%) | 38 (4.4%) |
| $100,000+ | 608 (57.3%) | 209 (24.5%) |
| Total | 1,061 (100.0%) | 854 (100.0%) |
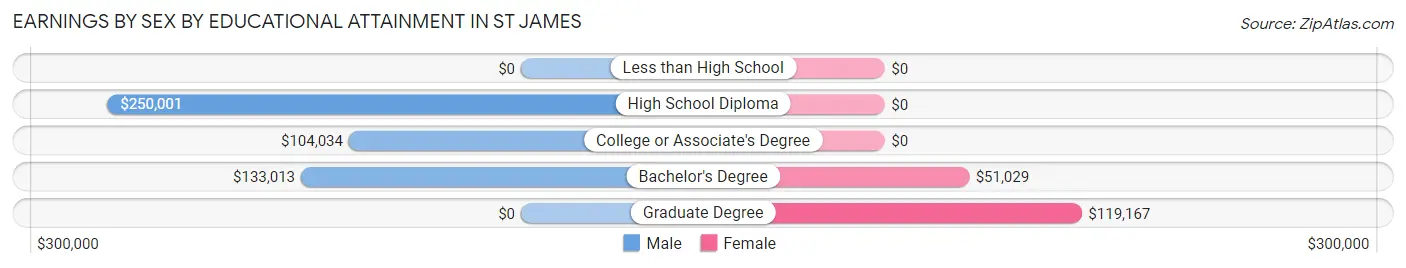
Earnings by Sex by Educational Attainment in St James
Average earnings in St James are $121,083 for men and $51,241 for women, a difference of 57.7%. Men with an educational attainment of high school diploma enjoy the highest average annual earnings of $250,001, while those with college or associate's degree education earn the least with $104,034. Women with an educational attainment of graduate degree earn the most with the average annual earnings of $119,167, while those with bachelor's degree education have the smallest earnings of $51,029.
| Educational Attainment | Male Income | Female Income |
| Less than High School | - | - |
| High School Diploma | $250,001 | $0 |
| College or Associate's Degree | $104,034 | $0 |
| Bachelor's Degree | $133,013 | $51,029 |
| Graduate Degree | - | - |
| Total | $121,083 | $51,241 |
Family Income in St James
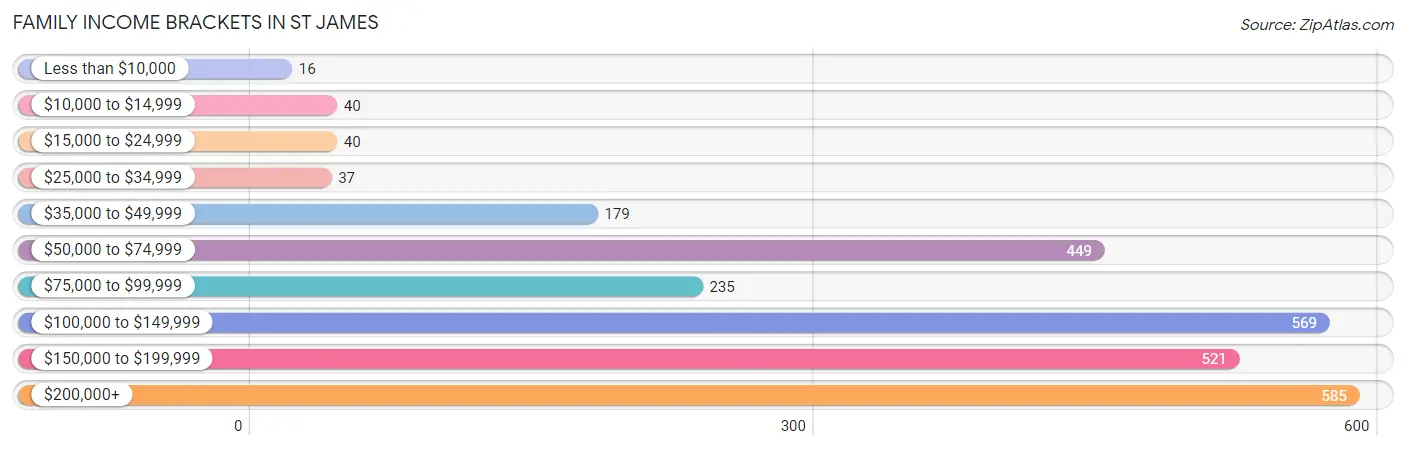
Family Income Brackets in St James
According to the St James family income data, there are 585 families falling into the $200,000+ income range, which is the most common income bracket and makes up 21.9% of all families. Conversely, the less than $10,000 income bracket is the least frequent group with only 16 families (0.6%) belonging to this category.
| Income Bracket | # Families | % Families |
| Less than $10,000 | 16 | 0.6% |
| $10,000 to $14,999 | 40 | 1.5% |
| $15,000 to $24,999 | 40 | 1.5% |
| $25,000 to $34,999 | 37 | 1.4% |
| $35,000 to $49,999 | 179 | 6.7% |
| $50,000 to $74,999 | 449 | 16.8% |
| $75,000 to $99,999 | 235 | 8.8% |
| $100,000 to $149,999 | 569 | 21.3% |
| $150,000 to $199,999 | 521 | 19.5% |
| $200,000+ | 585 | 21.9% |
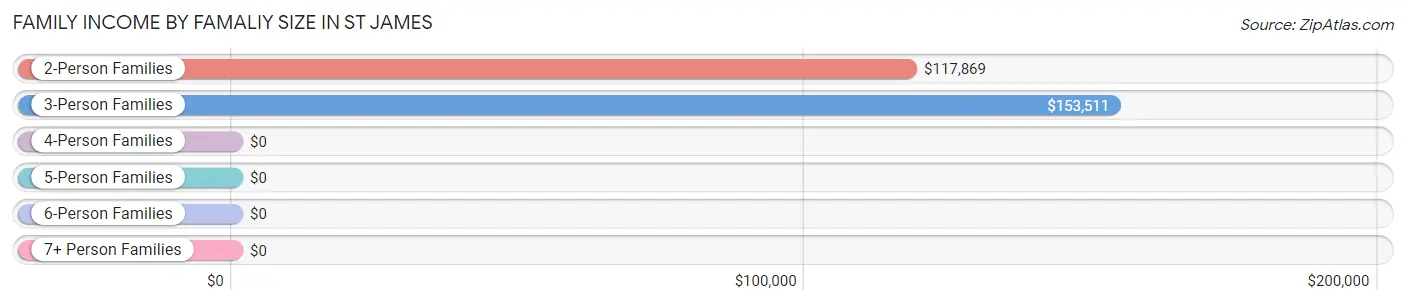
Family Income by Famaliy Size in St James
3-person families (199 | 7.4%) account for the highest median family income in St James with $153,511 per family, while 2-person families (2,382 | 89.1%) have the highest median income of $58,934 per family member.
| Income Bracket | # Families | Median Income |
| 2-Person Families | 2,382 (89.1%) | $117,869 |
| 3-Person Families | 199 (7.4%) | $153,511 |
| 4-Person Families | 4 (0.2%) | $0 |
| 5-Person Families | 88 (3.3%) | $0 |
| 6-Person Families | 0 (0.0%) | $0 |
| 7+ Person Families | 0 (0.0%) | $0 |
| Total | 2,673 (100.0%) | $119,160 |
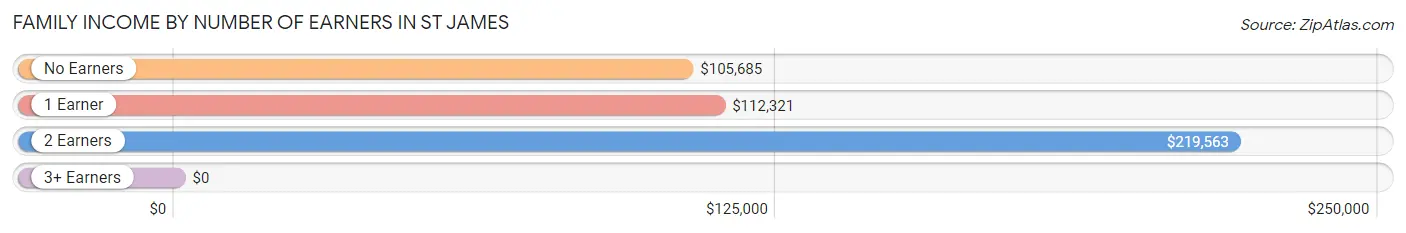
Family Income by Number of Earners in St James
| Number of Earners | # Families | Median Income |
| No Earners | 1,533 (57.4%) | $105,685 |
| 1 Earner | 755 (28.2%) | $112,321 |
| 2 Earners | 339 (12.7%) | $219,563 |
| 3+ Earners | 46 (1.7%) | $0 |
| Total | 2,673 (100.0%) | $119,160 |
Household Income in St James
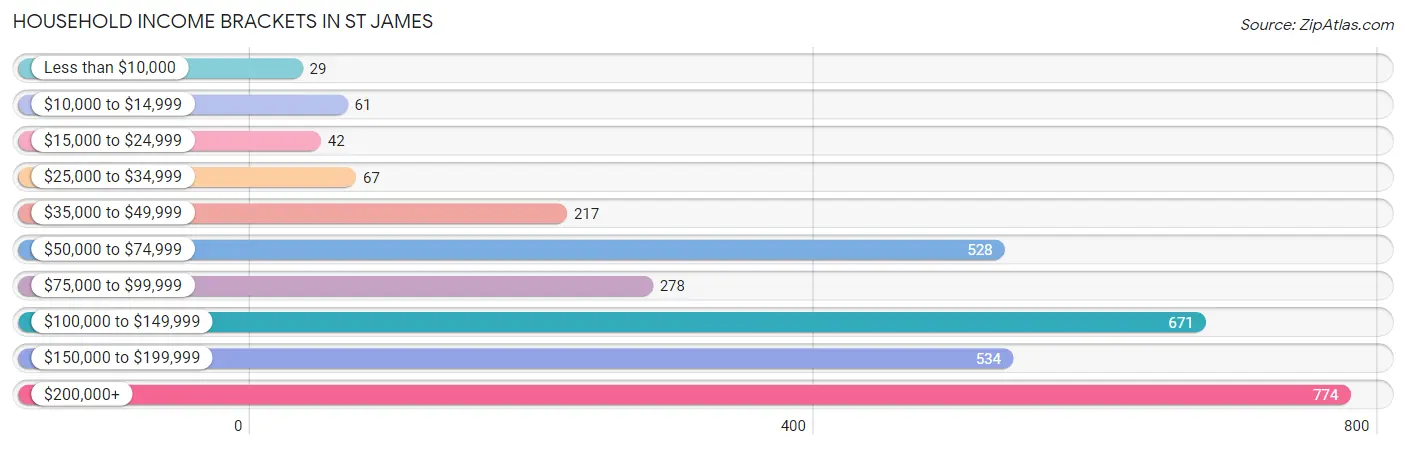
Household Income Brackets in St James
With 774 households falling in the category, the $200,000+ income range is the most frequent in St James, accounting for 24.2% of all households. In contrast, only 29 households (0.9%) fall into the less than $10,000 income bracket, making it the least populous group.
| Income Bracket | # Households | % Households |
| Less than $10,000 | 29 | 0.9% |
| $10,000 to $14,999 | 61 | 1.9% |
| $15,000 to $24,999 | 42 | 1.3% |
| $25,000 to $34,999 | 67 | 2.1% |
| $35,000 to $49,999 | 217 | 6.8% |
| $50,000 to $74,999 | 528 | 16.5% |
| $75,000 to $99,999 | 278 | 8.7% |
| $100,000 to $149,999 | 671 | 21.0% |
| $150,000 to $199,999 | 534 | 16.7% |
| $200,000+ | 774 | 24.2% |
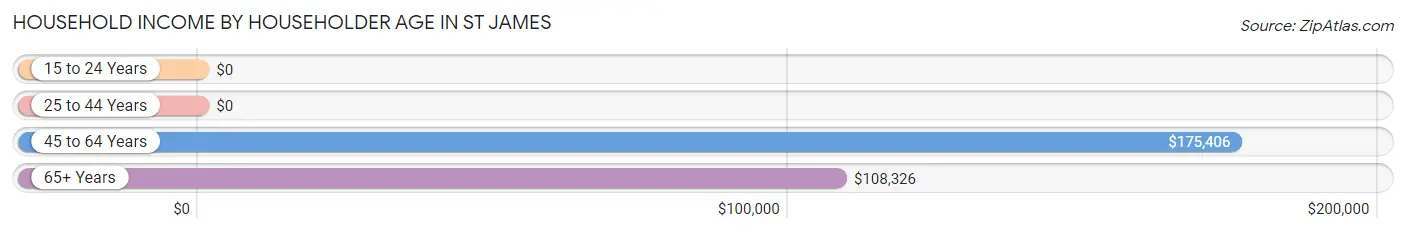
Household Income by Householder Age in St James
The median household income in St James is $113,507, with the highest median household income of $175,406 found in the 45 to 64 years age bracket for the primary householder. A total of 819 households (25.6%) fall into this category.
| Income Bracket | # Households | Median Income |
| 15 to 24 Years | 0 (0.0%) | $0 |
| 25 to 44 Years | 119 (3.7%) | $0 |
| 45 to 64 Years | 819 (25.6%) | $175,406 |
| 65+ Years | 2,259 (70.7%) | $108,326 |
| Total | 3,197 (100.0%) | $113,507 |
Poverty in St James
Income Below Poverty by Sex and Age in St James
With 2.4% poverty level for males and 2.6% for females among the residents of St James, 35 to 44 year old males and 35 to 44 year old females are the most vulnerable to poverty, with 34 males (35.4%) and 40 females (20.3%) in their respective age groups living below the poverty level.
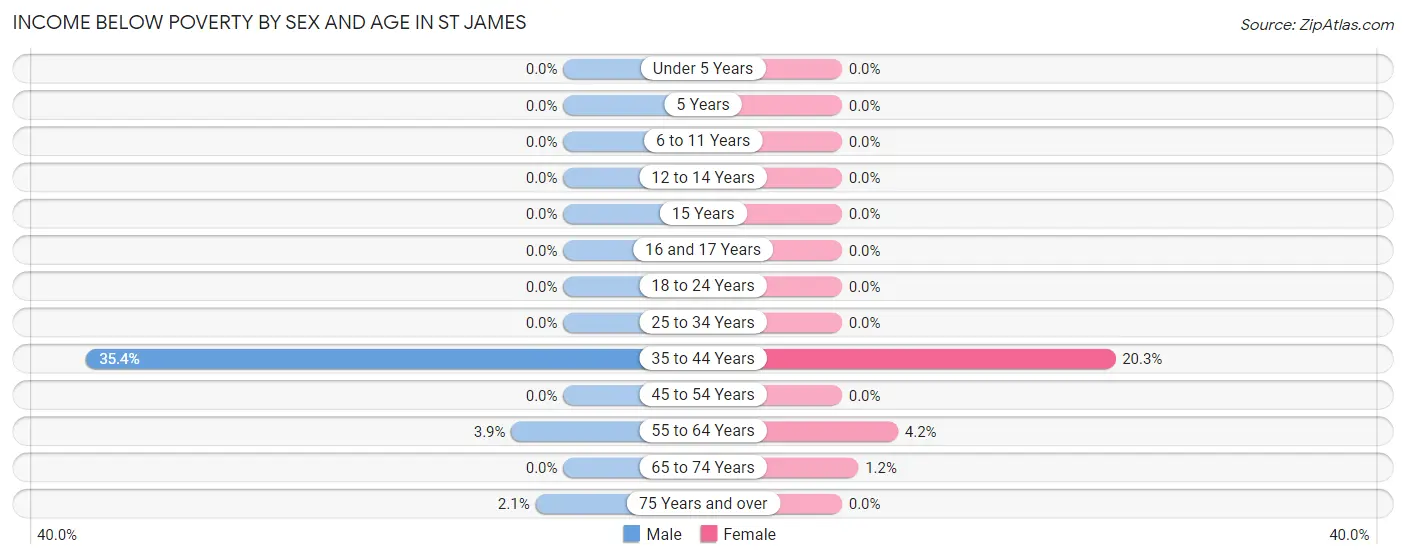
| Age Bracket | Male | Female |
| Under 5 Years | 0 (0.0%) | 0 (0.0%) |
| 5 Years | 0 (0.0%) | 0 (0.0%) |
| 6 to 11 Years | 0 (0.0%) | 0 (0.0%) |
| 12 to 14 Years | 0 (0.0%) | 0 (0.0%) |
| 15 Years | 0 (0.0%) | 0 (0.0%) |
| 16 and 17 Years | 0 (0.0%) | 0 (0.0%) |
| 18 to 24 Years | 0 (0.0%) | 0 (0.0%) |
| 25 to 34 Years | 0 (0.0%) | 0 (0.0%) |
| 35 to 44 Years | 34 (35.4%) | 40 (20.3%) |
| 45 to 54 Years | 0 (0.0%) | 0 (0.0%) |
| 55 to 64 Years | 28 (3.9%) | 31 (4.2%) |
| 65 to 74 Years | 0 (0.0%) | 18 (1.2%) |
| 75 Years and over | 15 (2.1%) | 0 (0.0%) |
| Total | 77 (2.4%) | 89 (2.6%) |
Income Above Poverty by Sex and Age in St James
According to the poverty statistics in St James, males aged under 5 years and females aged 6 to 11 years are the age groups that are most secure financially, with 100.0% of males and 100.0% of females in these age groups living above the poverty line.
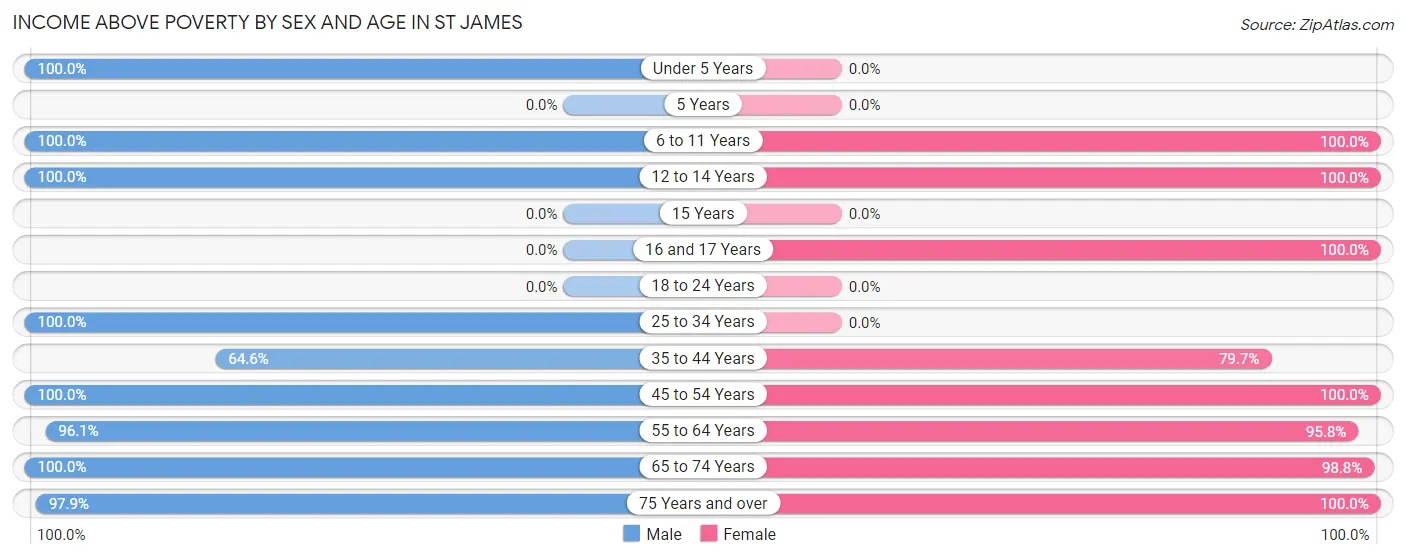
| Age Bracket | Male | Female |
| Under 5 Years | 54 (100.0%) | 0 (0.0%) |
| 5 Years | 0 (0.0%) | 0 (0.0%) |
| 6 to 11 Years | 91 (100.0%) | 79 (100.0%) |
| 12 to 14 Years | 4 (100.0%) | 31 (100.0%) |
| 15 Years | 0 (0.0%) | 0 (0.0%) |
| 16 and 17 Years | 0 (0.0%) | 41 (100.0%) |
| 18 to 24 Years | 0 (0.0%) | 0 (0.0%) |
| 25 to 34 Years | 13 (100.0%) | 0 (0.0%) |
| 35 to 44 Years | 62 (64.6%) | 157 (79.7%) |
| 45 to 54 Years | 123 (100.0%) | 220 (100.0%) |
| 55 to 64 Years | 697 (96.1%) | 714 (95.8%) |
| 65 to 74 Years | 1,362 (100.0%) | 1,461 (98.8%) |
| 75 Years and over | 708 (97.9%) | 583 (100.0%) |
| Total | 3,114 (97.6%) | 3,286 (97.4%) |
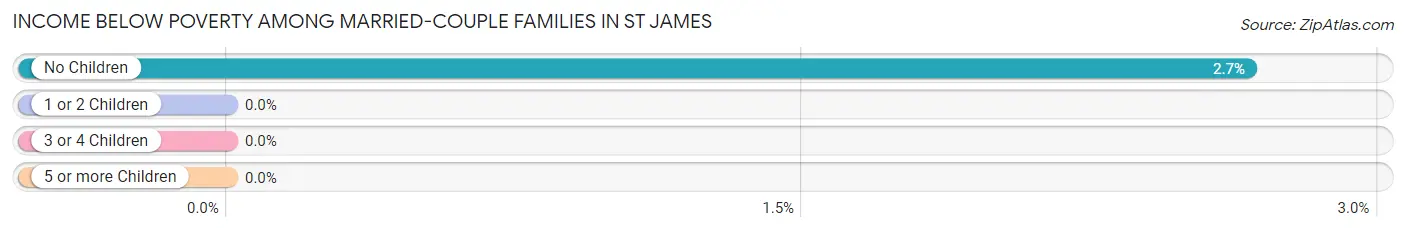
Income Below Poverty Among Married-Couple Families in St James
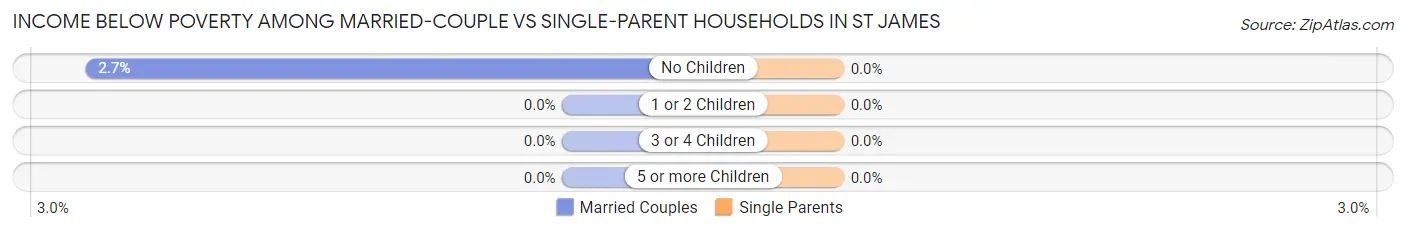
The poverty statistics for married-couple families in St James show that 2.5% or 66 of the total 2,635 families live below the poverty line. Families with no children have the highest poverty rate of 2.7%, comprising of 66 families. On the other hand, families with 1 or 2 children have the lowest poverty rate of 0.0%, which includes 0 families.
| Children | Above Poverty | Below Poverty |
| No Children | 2,412 (97.3%) | 66 (2.7%) |
| 1 or 2 Children | 95 (100.0%) | 0 (0.0%) |
| 3 or 4 Children | 62 (100.0%) | 0 (0.0%) |
| 5 or more Children | 0 (0.0%) | 0 (0.0%) |
| Total | 2,569 (97.5%) | 66 (2.5%) |
Income Below Poverty Among Single-Parent Households in St James
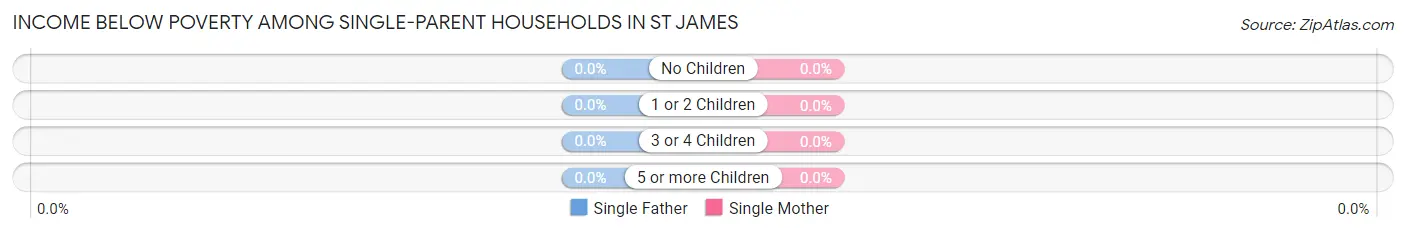
| Children | Single Father | Single Mother |
| No Children | 0 (0.0%) | 0 (0.0%) |
| 1 or 2 Children | 0 (0.0%) | 0 (0.0%) |
| 3 or 4 Children | 0 (0.0%) | 0 (0.0%) |
| 5 or more Children | 0 (0.0%) | 0 (0.0%) |
| Total | 0 (0.0%) | 0 (0.0%) |
Income Below Poverty Among Married-Couple vs Single-Parent Households in St James
| Children | Married-Couple Families | Single-Parent Households |
| No Children | 66 (2.7%) | 0 (0.0%) |
| 1 or 2 Children | 0 (0.0%) | 0 (0.0%) |
| 3 or 4 Children | 0 (0.0%) | 0 (0.0%) |
| 5 or more Children | 0 (0.0%) | 0 (0.0%) |
| Total | 66 (2.5%) | 0 (0.0%) |
Employment Characteristics in St James
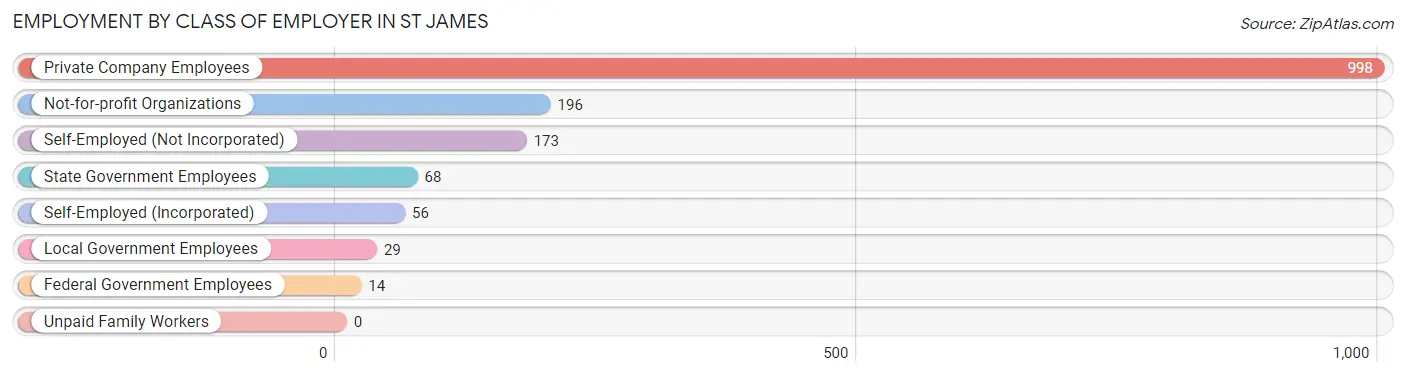
Employment by Class of Employer in St James
Among the 1,534 employed individuals in St James, private company employees (998 | 65.1%), not-for-profit organizations (196 | 12.8%), and self-employed (not incorporated) (173 | 11.3%) make up the most common classes of employment.
| Employer Class | # Employees | % Employees |
| Private Company Employees | 998 | 65.1% |
| Self-Employed (Incorporated) | 56 | 3.6% |
| Self-Employed (Not Incorporated) | 173 | 11.3% |
| Not-for-profit Organizations | 196 | 12.8% |
| Local Government Employees | 29 | 1.9% |
| State Government Employees | 68 | 4.4% |
| Federal Government Employees | 14 | 0.9% |
| Unpaid Family Workers | 0 | 0.0% |
| Total | 1,534 | 100.0% |
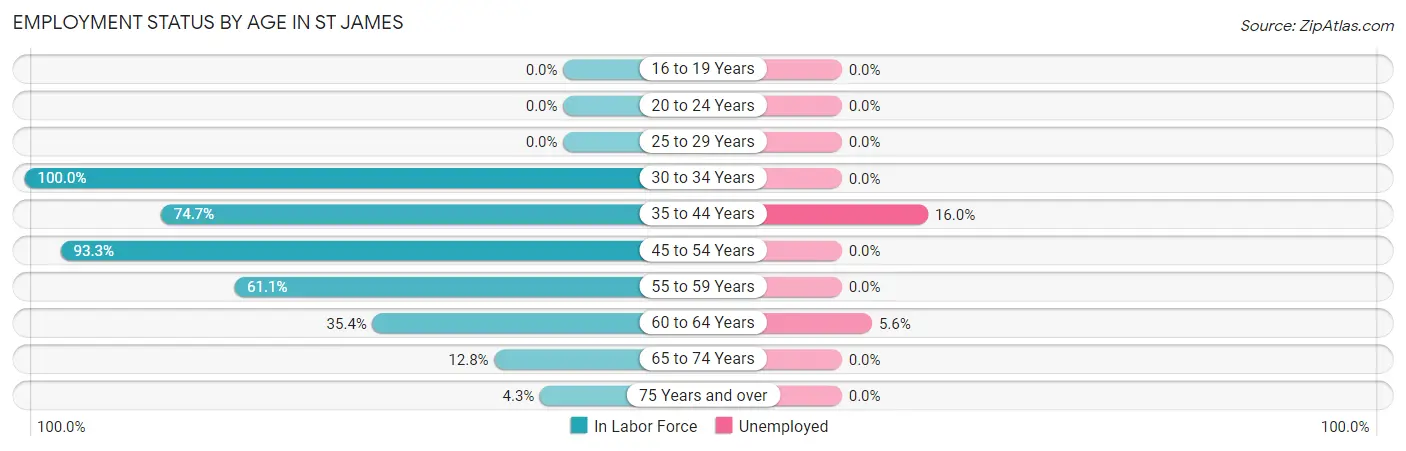
Employment Status by Age in St James
According to the labor force statistics for St James, out of the total population over 16 years of age (6,307), 25.4% or 1,602 individuals are in the labor force, with 3.5% or 56 of them unemployed. The age group with the highest labor force participation rate is 30 to 34 years, with 100.0% or 13 individuals in the labor force. Within the labor force, the 35 to 44 years age range has the highest percentage of unemployed individuals, with 16.0% or 35 of them being unemployed.
| Age Bracket | In Labor Force | Unemployed |
| 16 to 19 Years | 0 (0.0%) | 0 (0.0%) |
| 20 to 24 Years | 0 (0.0%) | 0 (0.0%) |
| 25 to 29 Years | 0 (0.0%) | 0 (0.0%) |
| 30 to 34 Years | 13 (100.0%) | 0 (0.0%) |
| 35 to 44 Years | 219 (74.7%) | 35 (16.0%) |
| 45 to 54 Years | 320 (93.3%) | 0 (0.0%) |
| 55 to 59 Years | 250 (61.1%) | 0 (0.0%) |
| 60 to 64 Years | 376 (35.4%) | 21 (5.6%) |
| 65 to 74 Years | 364 (12.8%) | 0 (0.0%) |
| 75 Years and over | 56 (4.3%) | 0 (0.0%) |
| Total | 1,602 (25.4%) | 56 (3.5%) |
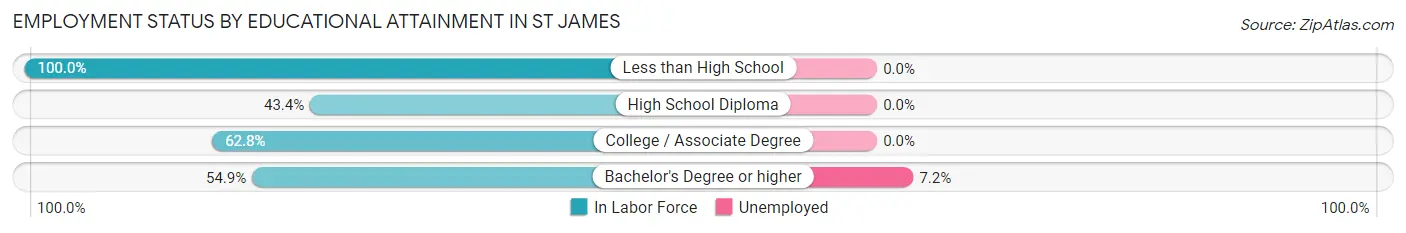
Employment Status by Educational Attainment in St James
According to labor force statistics for St James, 55.6% of individuals (1,178) out of the total population between 25 and 64 years of age (2,119) are in the labor force, with 4.8% or 57 of them being unemployed. The group with the highest labor force participation rate are those with the educational attainment of less than high school, with 100.0% or 30 individuals in the labor force. Within the labor force, individuals with bachelor's degree or higher education have the highest percentage of unemployment, with 7.2% or 56 of them being unemployed.
| Educational Attainment | In Labor Force | Unemployed |
| Less than High School | 30 (100.0%) | 0 (0.0%) |
| High School Diploma | 118 (43.4%) | 0 (0.0%) |
| College / Associate Degree | 257 (62.8%) | 0 (0.0%) |
| Bachelor's Degree or higher | 773 (54.9%) | 101 (7.2%) |
| Total | 1,178 (55.6%) | 102 (4.8%) |
Employment Occupations by Sex in St James
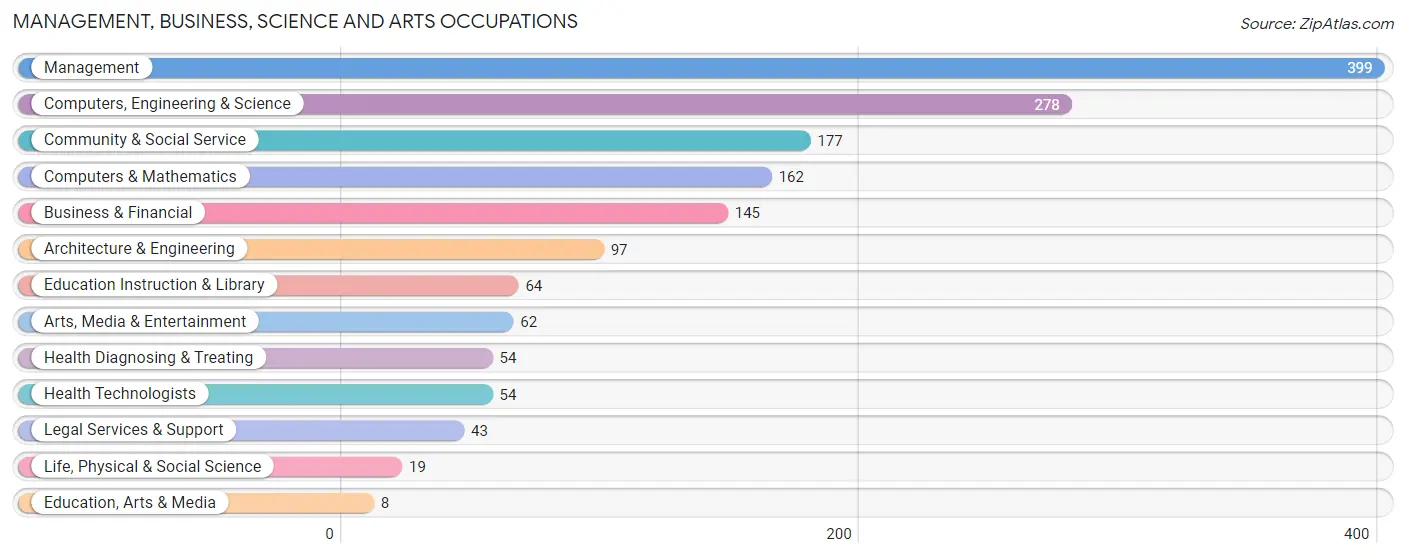
Management, Business, Science and Arts Occupations
The most common Management, Business, Science and Arts occupations in St James are Management (399 | 25.9%), Computers, Engineering & Science (278 | 18.0%), Community & Social Service (177 | 11.5%), Computers & Mathematics (162 | 10.5%), and Business & Financial (145 | 9.4%).
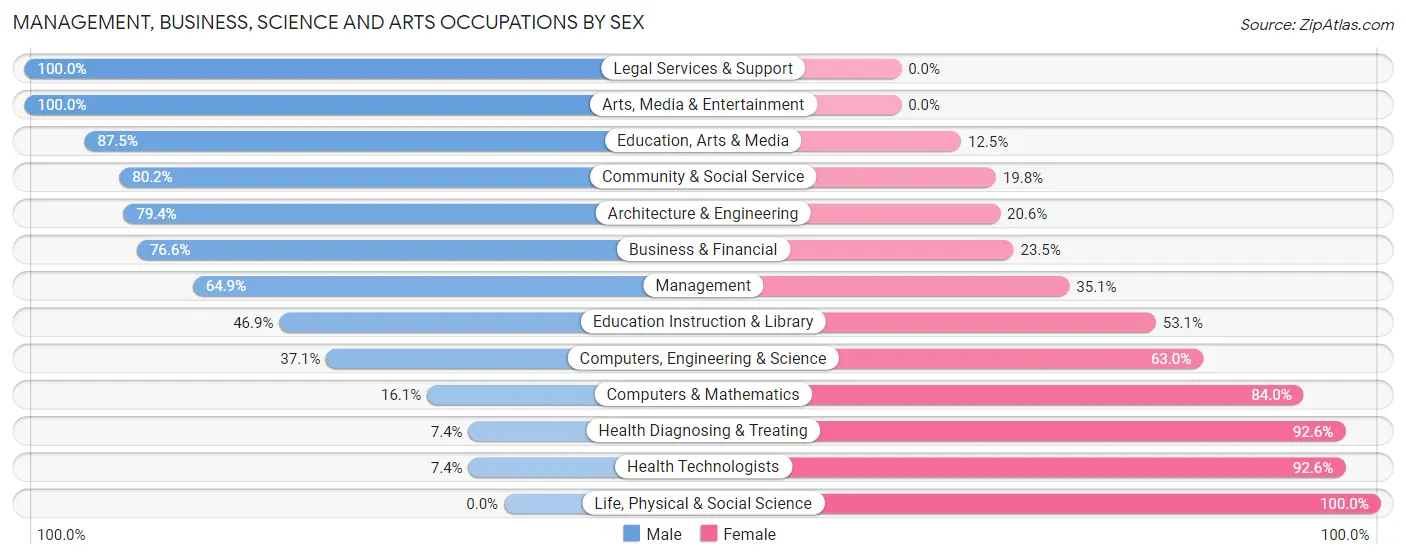
Management, Business, Science and Arts Occupations by Sex
Within the Management, Business, Science and Arts occupations in St James, the most male-oriented occupations are Legal Services & Support (100.0%), Arts, Media & Entertainment (100.0%), and Education, Arts & Media (87.5%), while the most female-oriented occupations are Life, Physical & Social Science (100.0%), Health Diagnosing & Treating (92.6%), and Health Technologists (92.6%).
| Occupation | Male | Female |
| Management | 259 (64.9%) | 140 (35.1%) |
| Business & Financial | 111 (76.5%) | 34 (23.4%) |
| Computers, Engineering & Science | 103 (37.0%) | 175 (62.9%) |
| Computers & Mathematics | 26 (16.1%) | 136 (84.0%) |
| Architecture & Engineering | 77 (79.4%) | 20 (20.6%) |
| Life, Physical & Social Science | 0 (0.0%) | 19 (100.0%) |
| Community & Social Service | 142 (80.2%) | 35 (19.8%) |
| Education, Arts & Media | 7 (87.5%) | 1 (12.5%) |
| Legal Services & Support | 43 (100.0%) | 0 (0.0%) |
| Education Instruction & Library | 30 (46.9%) | 34 (53.1%) |
| Arts, Media & Entertainment | 62 (100.0%) | 0 (0.0%) |
| Health Diagnosing & Treating | 4 (7.4%) | 50 (92.6%) |
| Health Technologists | 4 (7.4%) | 50 (92.6%) |
| Total (Category) | 619 (58.8%) | 434 (41.2%) |
| Total (Overall) | 848 (55.0%) | 695 (45.0%) |
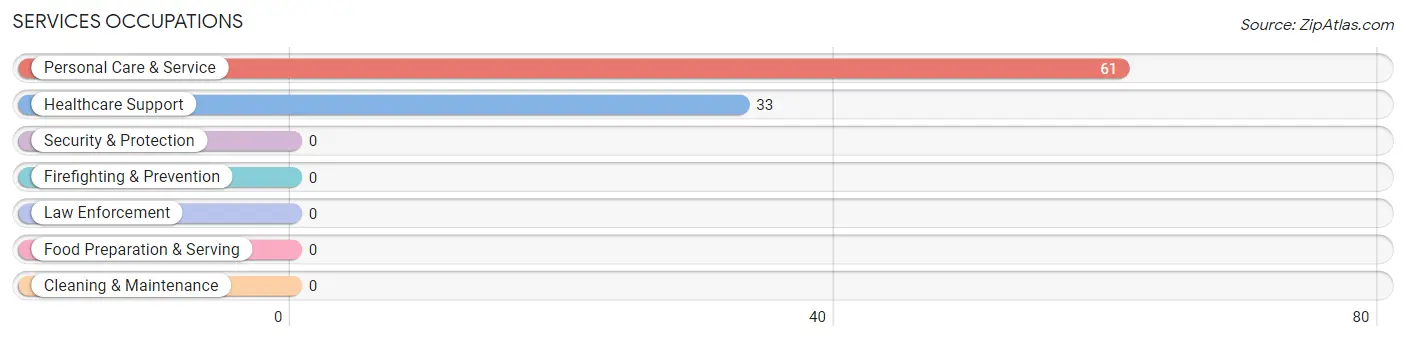
Services Occupations
The most common Services occupations in St James are Personal Care & Service (61 | 4.0%), and Healthcare Support (33 | 2.1%).
Services Occupations by Sex
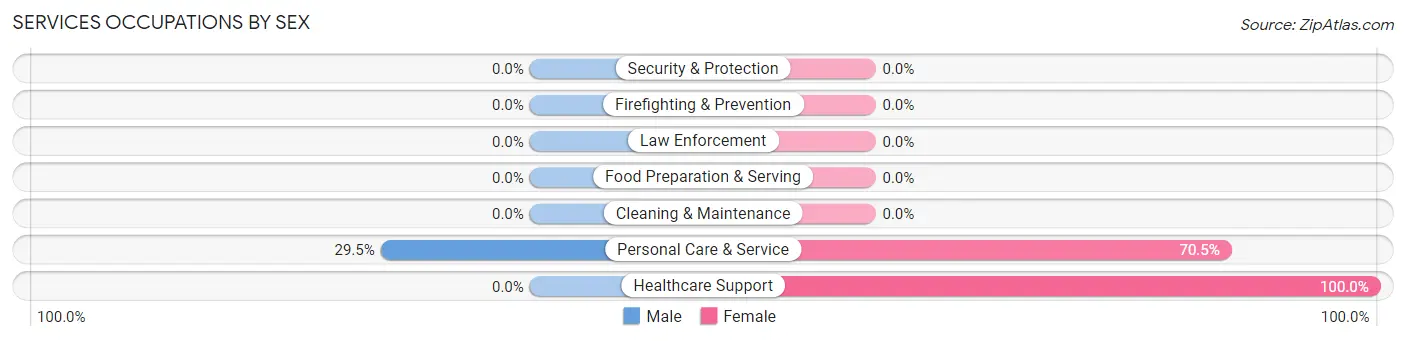
| Occupation | Male | Female |
| Healthcare Support | 0 (0.0%) | 33 (100.0%) |
| Security & Protection | 0 (0.0%) | 0 (0.0%) |
| Firefighting & Prevention | 0 (0.0%) | 0 (0.0%) |
| Law Enforcement | 0 (0.0%) | 0 (0.0%) |
| Food Preparation & Serving | 0 (0.0%) | 0 (0.0%) |
| Cleaning & Maintenance | 0 (0.0%) | 0 (0.0%) |
| Personal Care & Service | 18 (29.5%) | 43 (70.5%) |
| Total (Category) | 18 (19.2%) | 76 (80.8%) |
| Total (Overall) | 848 (55.0%) | 695 (45.0%) |
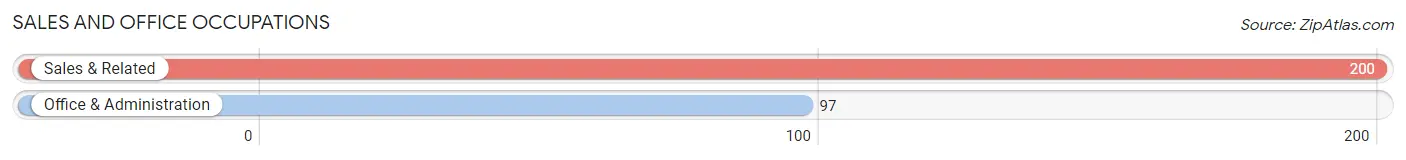
Sales and Office Occupations
The most common Sales and Office occupations in St James are Sales & Related (200 | 13.0%), and Office & Administration (97 | 6.3%).
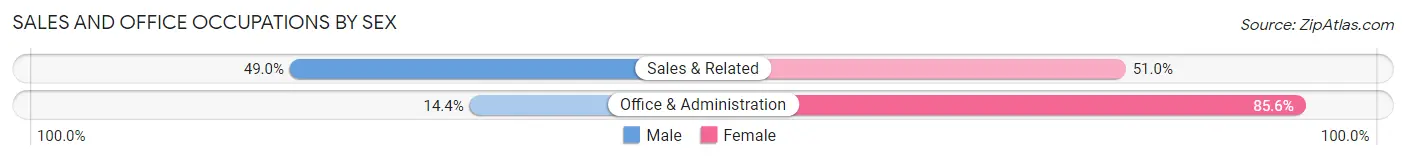
Sales and Office Occupations by Sex
| Occupation | Male | Female |
| Sales & Related | 98 (49.0%) | 102 (51.0%) |
| Office & Administration | 14 (14.4%) | 83 (85.6%) |
| Total (Category) | 112 (37.7%) | 185 (62.3%) |
| Total (Overall) | 848 (55.0%) | 695 (45.0%) |
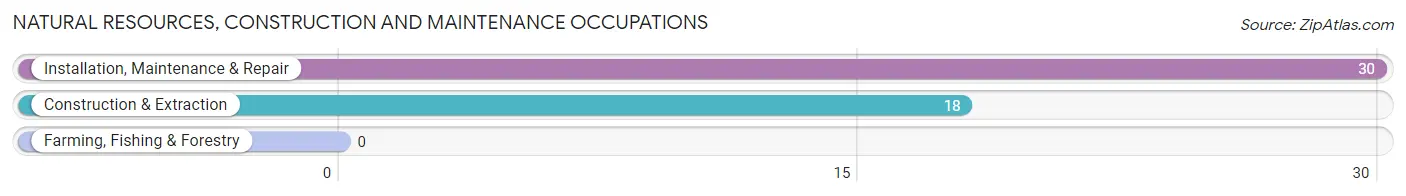
Natural Resources, Construction and Maintenance Occupations
The most common Natural Resources, Construction and Maintenance occupations in St James are Installation, Maintenance & Repair (30 | 1.9%), and Construction & Extraction (18 | 1.2%).
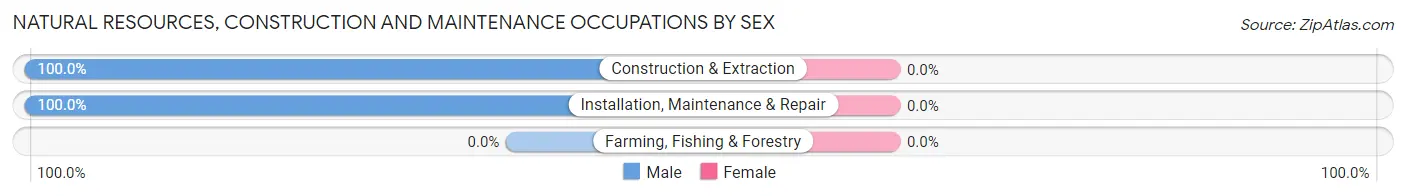
Natural Resources, Construction and Maintenance Occupations by Sex
| Occupation | Male | Female |
| Farming, Fishing & Forestry | 0 (0.0%) | 0 (0.0%) |
| Construction & Extraction | 18 (100.0%) | 0 (0.0%) |
| Installation, Maintenance & Repair | 30 (100.0%) | 0 (0.0%) |
| Total (Category) | 48 (100.0%) | 0 (0.0%) |
| Total (Overall) | 848 (55.0%) | 695 (45.0%) |
Production, Transportation and Moving Occupations
The most common Production, Transportation and Moving occupations in St James are Production (35 | 2.3%), and Transportation (16 | 1.0%).
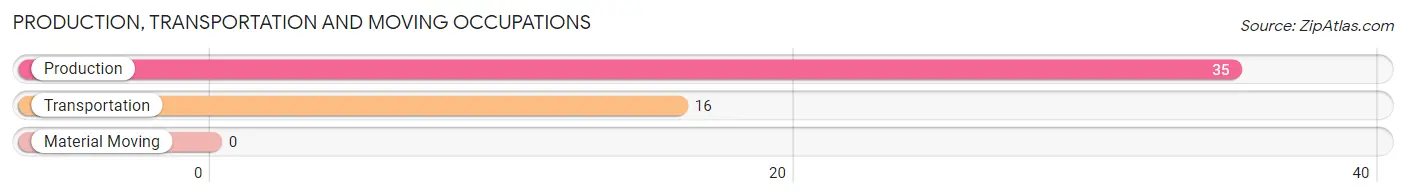
Production, Transportation and Moving Occupations by Sex
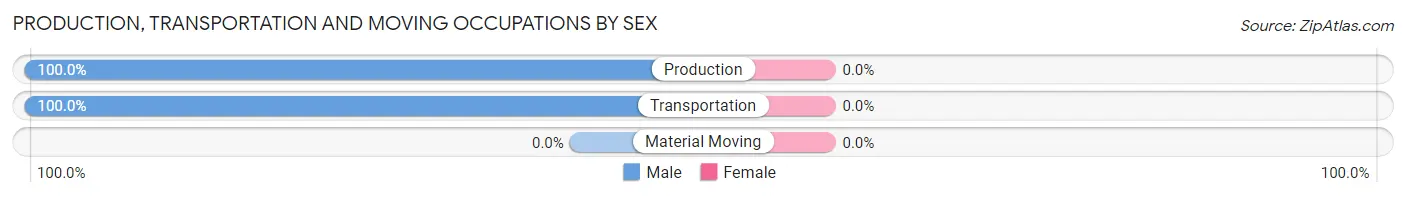
| Occupation | Male | Female |
| Production | 35 (100.0%) | 0 (0.0%) |
| Transportation | 16 (100.0%) | 0 (0.0%) |
| Material Moving | 0 (0.0%) | 0 (0.0%) |
| Total (Category) | 51 (100.0%) | 0 (0.0%) |
| Total (Overall) | 848 (55.0%) | 695 (45.0%) |
Employment Industries by Sex in St James
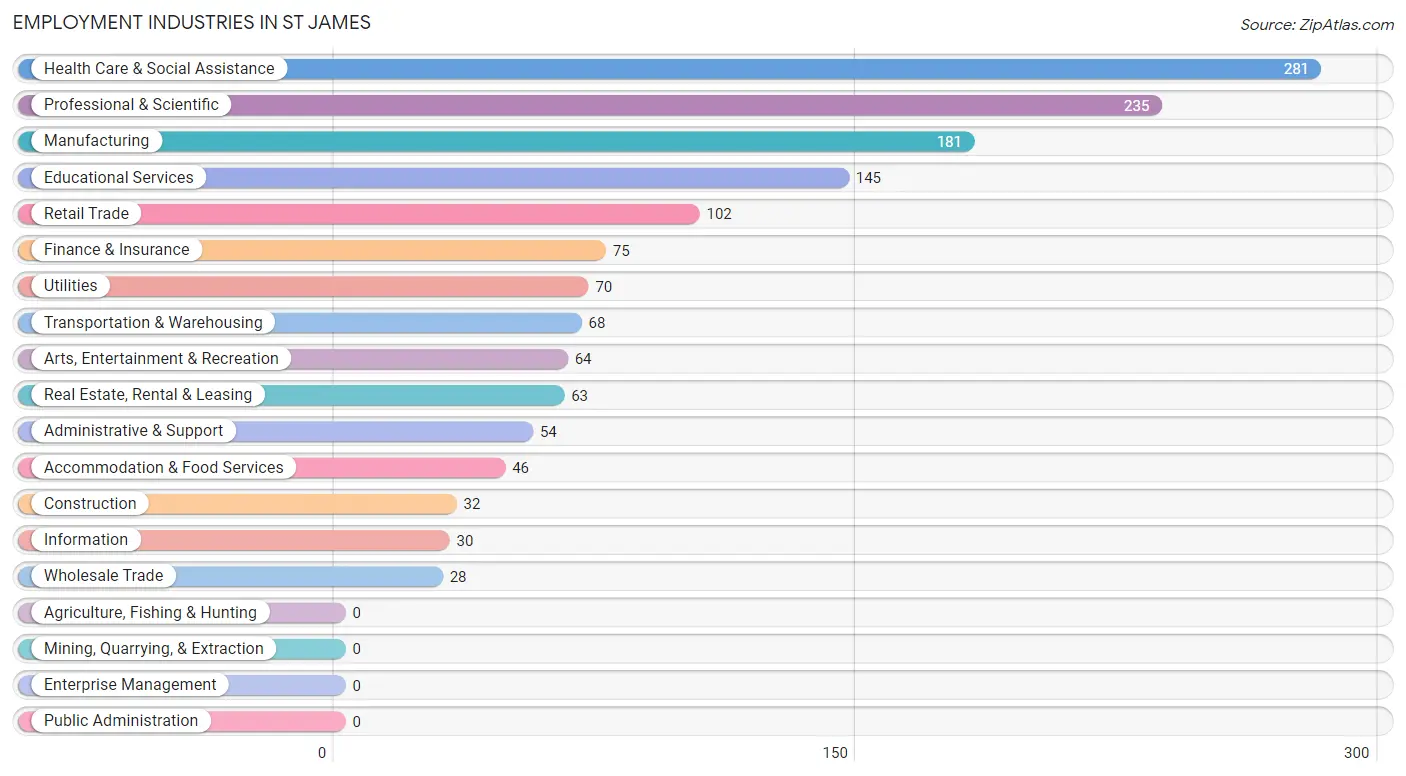
Employment Industries in St James
The major employment industries in St James include Health Care & Social Assistance (281 | 18.2%), Professional & Scientific (235 | 15.2%), Manufacturing (181 | 11.7%), Educational Services (145 | 9.4%), and Retail Trade (102 | 6.6%).
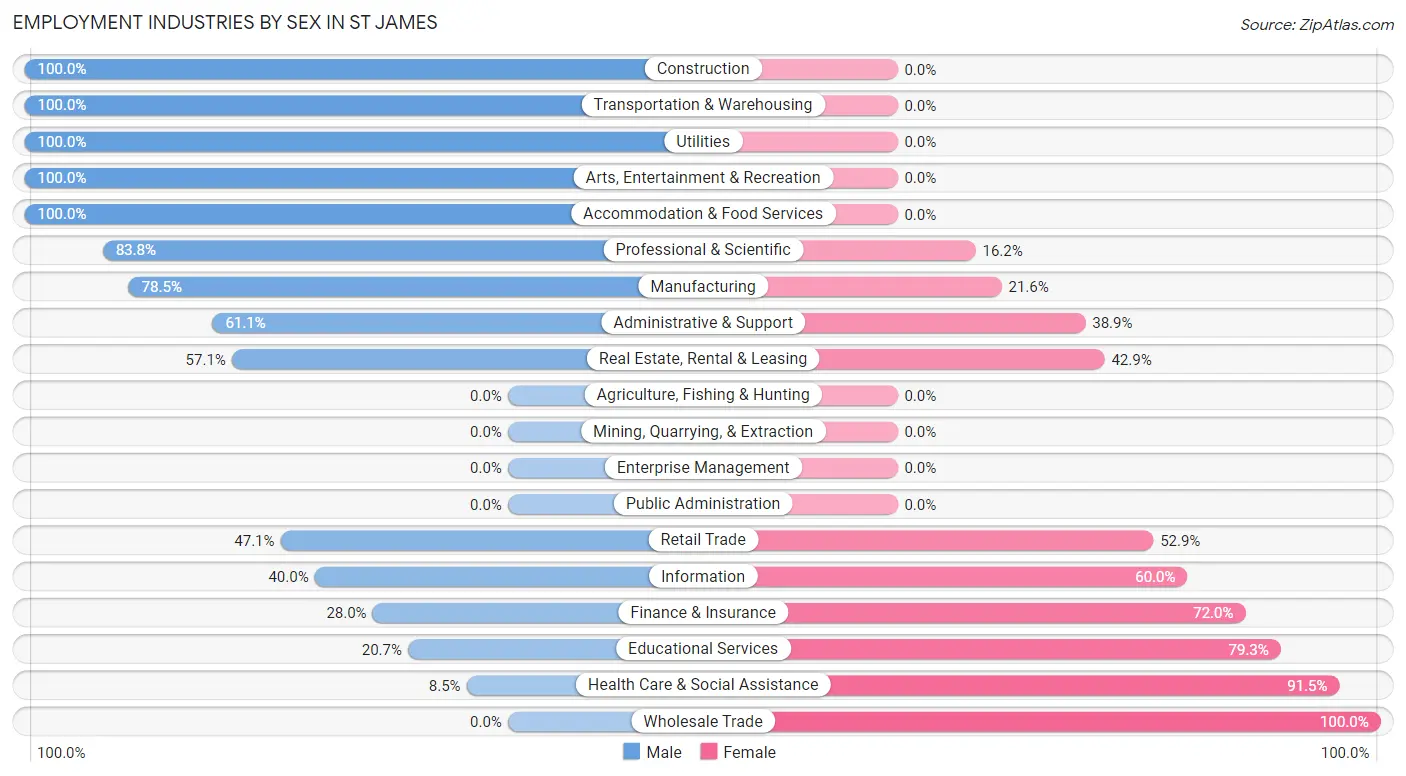
Employment Industries by Sex in St James
The St James industries that see more men than women are Construction (100.0%), Transportation & Warehousing (100.0%), and Utilities (100.0%), whereas the industries that tend to have a higher number of women are Wholesale Trade (100.0%), Health Care & Social Assistance (91.5%), and Educational Services (79.3%).
| Industry | Male | Female |
| Agriculture, Fishing & Hunting | 0 (0.0%) | 0 (0.0%) |
| Mining, Quarrying, & Extraction | 0 (0.0%) | 0 (0.0%) |
| Construction | 32 (100.0%) | 0 (0.0%) |
| Manufacturing | 142 (78.4%) | 39 (21.5%) |
| Wholesale Trade | 0 (0.0%) | 28 (100.0%) |
| Retail Trade | 48 (47.1%) | 54 (52.9%) |
| Transportation & Warehousing | 68 (100.0%) | 0 (0.0%) |
| Utilities | 70 (100.0%) | 0 (0.0%) |
| Information | 12 (40.0%) | 18 (60.0%) |
| Finance & Insurance | 21 (28.0%) | 54 (72.0%) |
| Real Estate, Rental & Leasing | 36 (57.1%) | 27 (42.9%) |
| Professional & Scientific | 197 (83.8%) | 38 (16.2%) |
| Enterprise Management | 0 (0.0%) | 0 (0.0%) |
| Administrative & Support | 33 (61.1%) | 21 (38.9%) |
| Educational Services | 30 (20.7%) | 115 (79.3%) |
| Health Care & Social Assistance | 24 (8.5%) | 257 (91.5%) |
| Arts, Entertainment & Recreation | 64 (100.0%) | 0 (0.0%) |
| Accommodation & Food Services | 46 (100.0%) | 0 (0.0%) |
| Public Administration | 0 (0.0%) | 0 (0.0%) |
| Total | 848 (55.0%) | 695 (45.0%) |
Education in St James
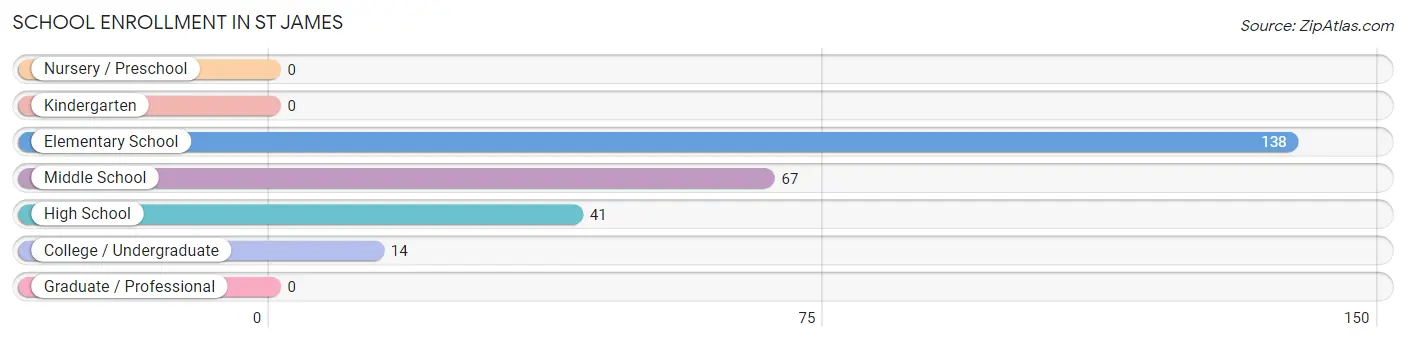
School Enrollment in St James
The most common levels of schooling among the 260 students in St James are elementary school (138 | 53.1%), middle school (67 | 25.8%), and high school (41 | 15.8%).
| School Level | # Students | % Students |
| Nursery / Preschool | 0 | 0.0% |
| Kindergarten | 0 | 0.0% |
| Elementary School | 138 | 53.1% |
| Middle School | 67 | 25.8% |
| High School | 41 | 15.8% |
| College / Undergraduate | 14 | 5.4% |
| Graduate / Professional | 0 | 0.0% |
| Total | 260 | 100.0% |
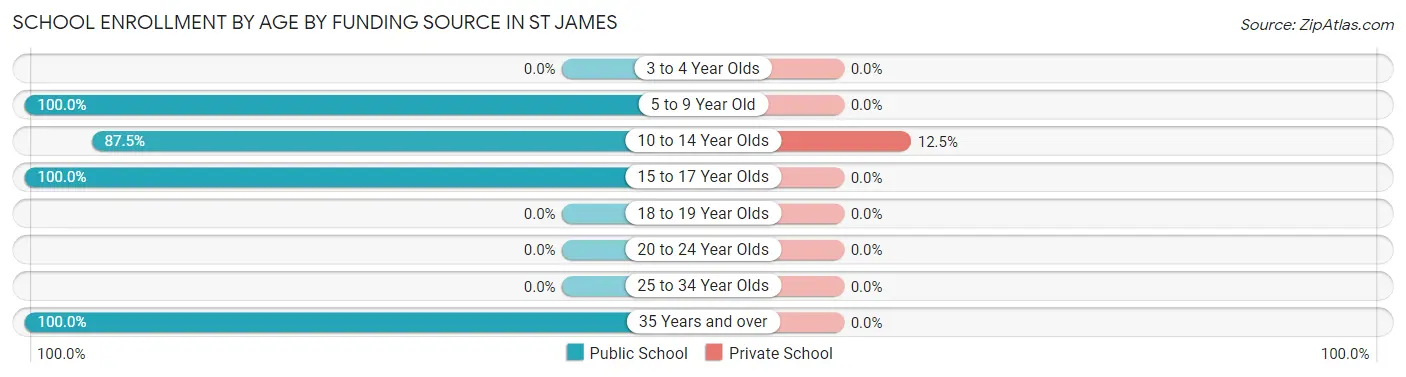
School Enrollment by Age by Funding Source in St James
Out of a total of 260 students who are enrolled in schools in St James, 9 (3.5%) attend a private institution, while the remaining 251 (96.5%) are enrolled in public schools. The age group of 10 to 14 year olds has the highest likelihood of being enrolled in private schools, with 9 (12.5% in the age bracket) enrolled. Conversely, the age group of 5 to 9 year old has the lowest likelihood of being enrolled in a private school, with 133 (100.0% in the age bracket) attending a public institution.
| Age Bracket | Public School | Private School |
| 3 to 4 Year Olds | 0 (0.0%) | 0 (0.0%) |
| 5 to 9 Year Old | 133 (100.0%) | 0 (0.0%) |
| 10 to 14 Year Olds | 63 (87.5%) | 9 (12.5%) |
| 15 to 17 Year Olds | 41 (100.0%) | 0 (0.0%) |
| 18 to 19 Year Olds | 0 (0.0%) | 0 (0.0%) |
| 20 to 24 Year Olds | 0 (0.0%) | 0 (0.0%) |
| 25 to 34 Year Olds | 0 (0.0%) | 0 (0.0%) |
| 35 Years and over | 14 (100.0%) | 0 (0.0%) |
| Total | 251 (96.5%) | 9 (3.5%) |
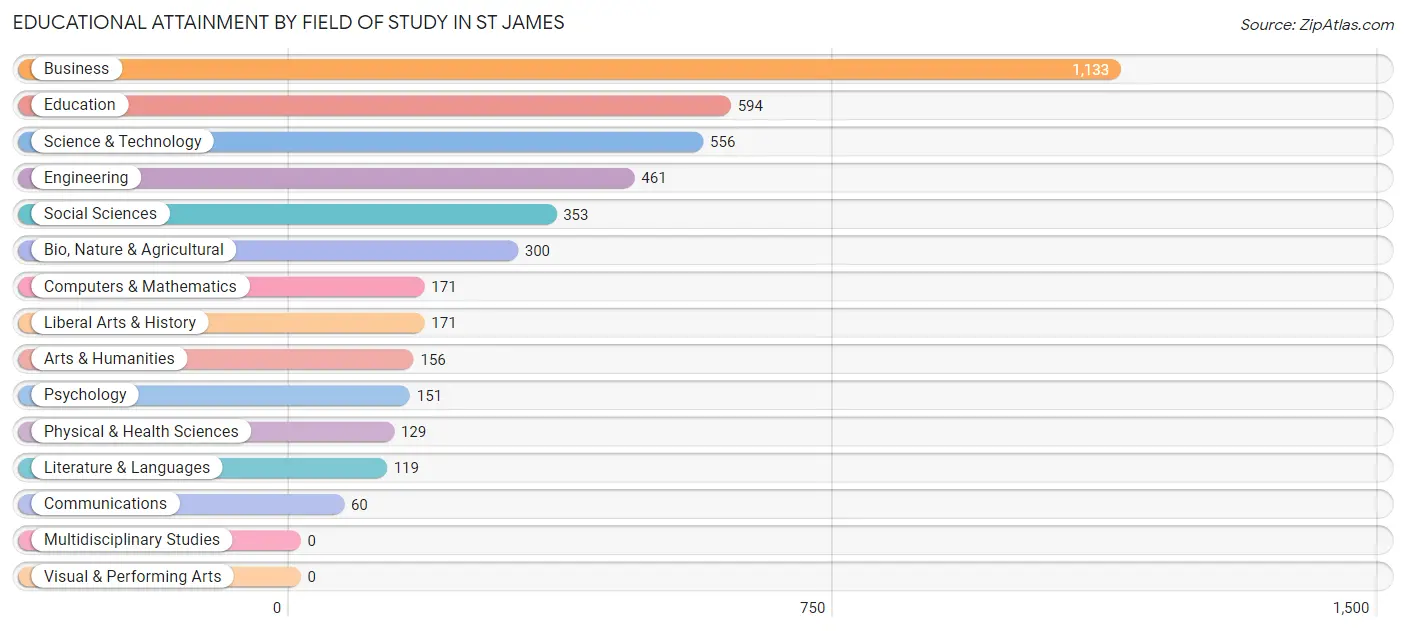
Educational Attainment by Field of Study in St James
Business (1,133 | 26.0%), education (594 | 13.6%), science & technology (556 | 12.8%), engineering (461 | 10.6%), and social sciences (353 | 8.1%) are the most common fields of study among 4,354 individuals in St James who have obtained a bachelor's degree or higher.
| Field of Study | # Graduates | % Graduates |
| Computers & Mathematics | 171 | 3.9% |
| Bio, Nature & Agricultural | 300 | 6.9% |
| Physical & Health Sciences | 129 | 3.0% |
| Psychology | 151 | 3.5% |
| Social Sciences | 353 | 8.1% |
| Engineering | 461 | 10.6% |
| Multidisciplinary Studies | 0 | 0.0% |
| Science & Technology | 556 | 12.8% |
| Business | 1,133 | 26.0% |
| Education | 594 | 13.6% |
| Literature & Languages | 119 | 2.7% |
| Liberal Arts & History | 171 | 3.9% |
| Visual & Performing Arts | 0 | 0.0% |
| Communications | 60 | 1.4% |
| Arts & Humanities | 156 | 3.6% |
| Total | 4,354 | 100.0% |
Transportation & Commute in St James
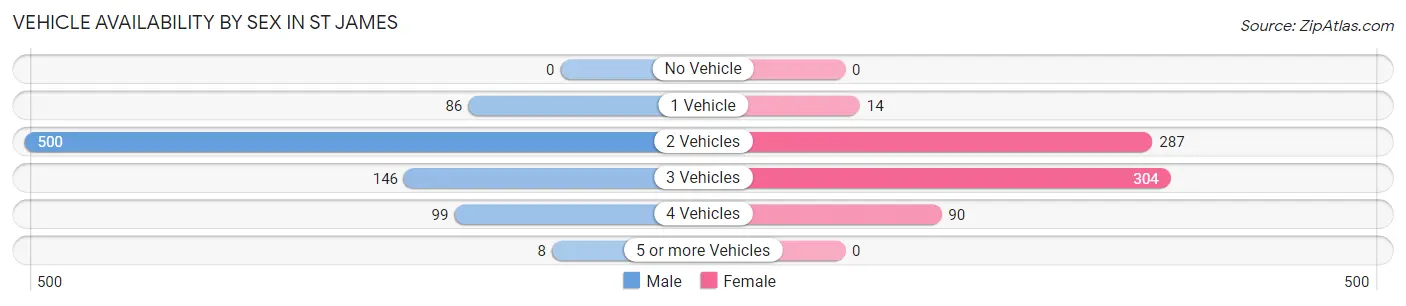
Vehicle Availability by Sex in St James
The most prevalent vehicle ownership categories in St James are males with 2 vehicles (500, accounting for 59.6%) and females with 2 vehicles (287, making up 71.9%).
| Vehicles Available | Male | Female |
| No Vehicle | 0 (0.0%) | 0 (0.0%) |
| 1 Vehicle | 86 (10.2%) | 14 (2.0%) |
| 2 Vehicles | 500 (59.6%) | 287 (41.3%) |
| 3 Vehicles | 146 (17.4%) | 304 (43.7%) |
| 4 Vehicles | 99 (11.8%) | 90 (13.0%) |
| 5 or more Vehicles | 8 (0.9%) | 0 (0.0%) |
| Total | 839 (100.0%) | 695 (100.0%) |
Commute Time in St James
The most frequently occuring commute durations in St James are 90 or more minutes (273 commuters, 26.9%), 20 to 24 minutes (176 commuters, 17.3%), and 15 to 19 minutes (146 commuters, 14.4%).
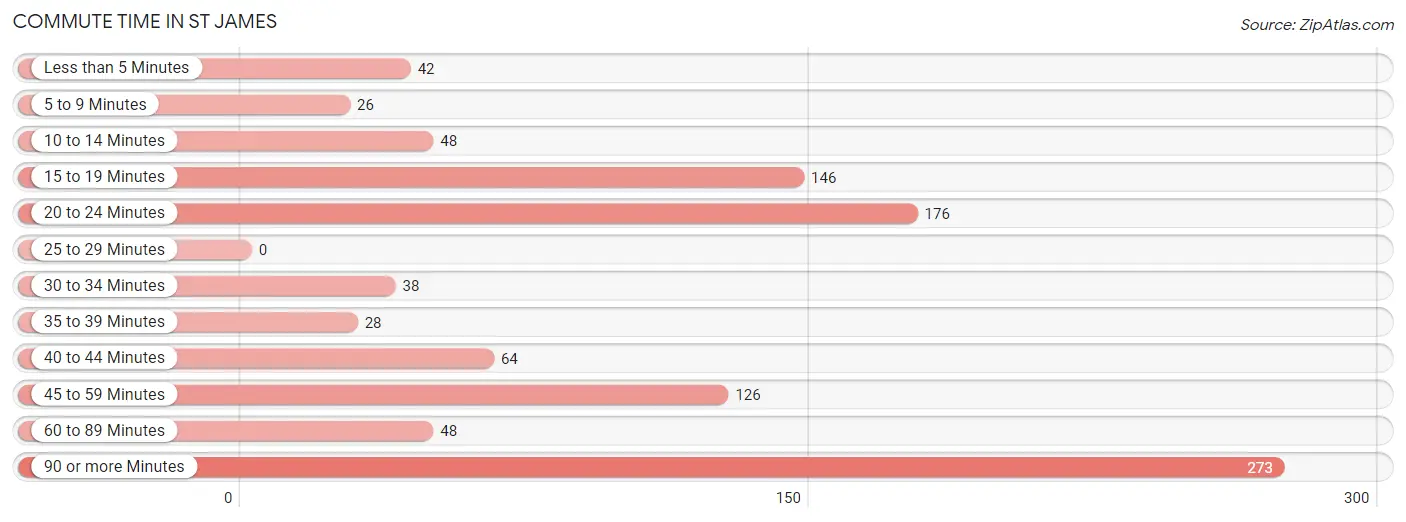
| Commute Time | # Commuters | % Commuters |
| Less than 5 Minutes | 42 | 4.1% |
| 5 to 9 Minutes | 26 | 2.6% |
| 10 to 14 Minutes | 48 | 4.7% |
| 15 to 19 Minutes | 146 | 14.4% |
| 20 to 24 Minutes | 176 | 17.3% |
| 25 to 29 Minutes | 0 | 0.0% |
| 30 to 34 Minutes | 38 | 3.7% |
| 35 to 39 Minutes | 28 | 2.8% |
| 40 to 44 Minutes | 64 | 6.3% |
| 45 to 59 Minutes | 126 | 12.4% |
| 60 to 89 Minutes | 48 | 4.7% |
| 90 or more Minutes | 273 | 26.9% |
Commute Time by Sex in St James
The most common commute times in St James are 20 to 24 minutes (143 commuters, 24.2%) for males and 90 or more minutes (230 commuters, 54.1%) for females.
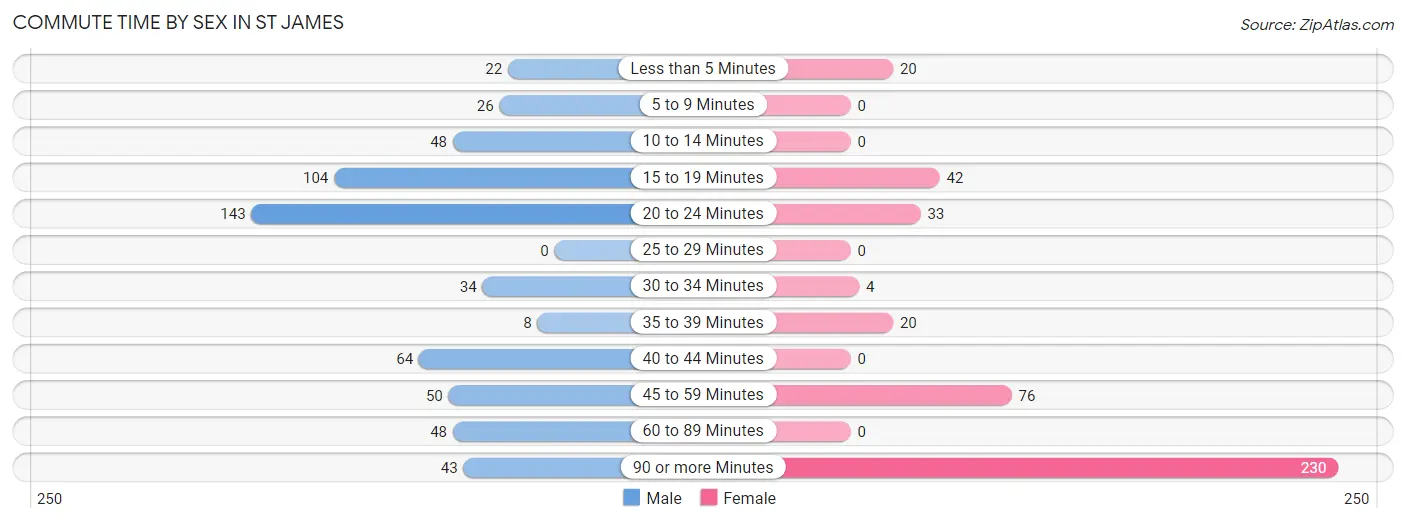
| Commute Time | Male | Female |
| Less than 5 Minutes | 22 (3.7%) | 20 (4.7%) |
| 5 to 9 Minutes | 26 (4.4%) | 0 (0.0%) |
| 10 to 14 Minutes | 48 (8.1%) | 0 (0.0%) |
| 15 to 19 Minutes | 104 (17.6%) | 42 (9.9%) |
| 20 to 24 Minutes | 143 (24.2%) | 33 (7.8%) |
| 25 to 29 Minutes | 0 (0.0%) | 0 (0.0%) |
| 30 to 34 Minutes | 34 (5.8%) | 4 (0.9%) |
| 35 to 39 Minutes | 8 (1.4%) | 20 (4.7%) |
| 40 to 44 Minutes | 64 (10.8%) | 0 (0.0%) |
| 45 to 59 Minutes | 50 (8.5%) | 76 (17.9%) |
| 60 to 89 Minutes | 48 (8.1%) | 0 (0.0%) |
| 90 or more Minutes | 43 (7.3%) | 230 (54.1%) |
Time of Departure to Work by Sex in St James
The most frequent times of departure to work in St James are 6:30 AM to 6:59 AM (121, 20.5%) for males and 9:00 AM to 9:59 AM (237, 55.8%) for females.
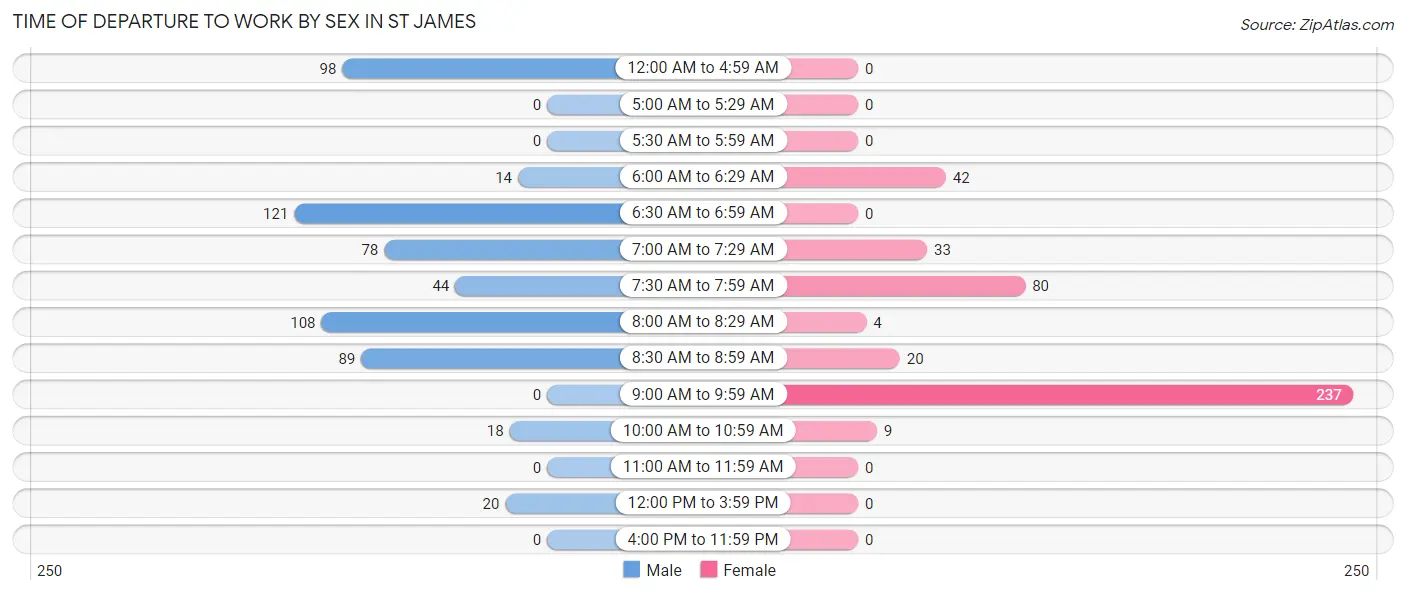
| Time of Departure | Male | Female |
| 12:00 AM to 4:59 AM | 98 (16.6%) | 0 (0.0%) |
| 5:00 AM to 5:29 AM | 0 (0.0%) | 0 (0.0%) |
| 5:30 AM to 5:59 AM | 0 (0.0%) | 0 (0.0%) |
| 6:00 AM to 6:29 AM | 14 (2.4%) | 42 (9.9%) |
| 6:30 AM to 6:59 AM | 121 (20.5%) | 0 (0.0%) |
| 7:00 AM to 7:29 AM | 78 (13.2%) | 33 (7.8%) |
| 7:30 AM to 7:59 AM | 44 (7.5%) | 80 (18.8%) |
| 8:00 AM to 8:29 AM | 108 (18.3%) | 4 (0.9%) |
| 8:30 AM to 8:59 AM | 89 (15.1%) | 20 (4.7%) |
| 9:00 AM to 9:59 AM | 0 (0.0%) | 237 (55.8%) |
| 10:00 AM to 10:59 AM | 18 (3.0%) | 9 (2.1%) |
| 11:00 AM to 11:59 AM | 0 (0.0%) | 0 (0.0%) |
| 12:00 PM to 3:59 PM | 20 (3.4%) | 0 (0.0%) |
| 4:00 PM to 11:59 PM | 0 (0.0%) | 0 (0.0%) |
| Total | 590 (100.0%) | 425 (100.0%) |
Housing Occupancy in St James
Occupancy by Ownership in St James
Of the total 3,197 dwellings in St James, owner-occupied units account for 3,053 (95.5%), while renter-occupied units make up 144 (4.5%).
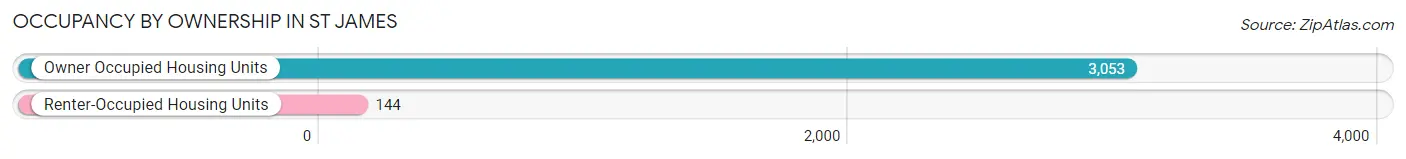
| Occupancy | # Housing Units | % Housing Units |
| Owner Occupied Housing Units | 3,053 | 95.5% |
| Renter-Occupied Housing Units | 144 | 4.5% |
| Total Occupied Housing Units | 3,197 | 100.0% |
Occupancy by Household Size in St James
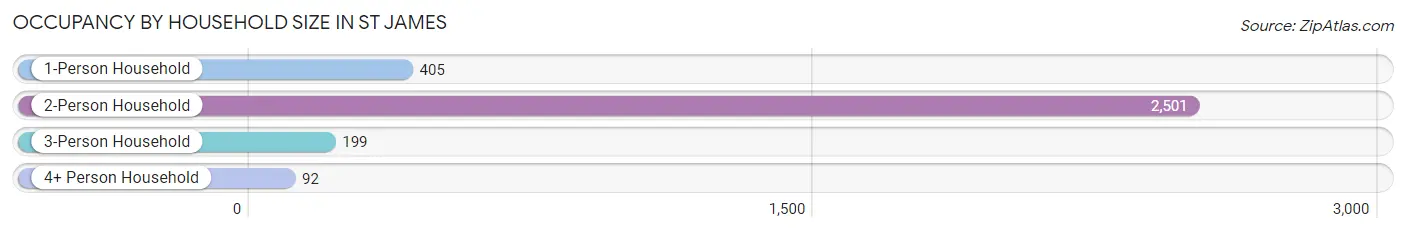
| Household Size | # Housing Units | % Housing Units |
| 1-Person Household | 405 | 12.7% |
| 2-Person Household | 2,501 | 78.2% |
| 3-Person Household | 199 | 6.2% |
| 4+ Person Household | 92 | 2.9% |
| Total Housing Units | 3,197 | 100.0% |
Occupancy by Ownership by Household Size in St James
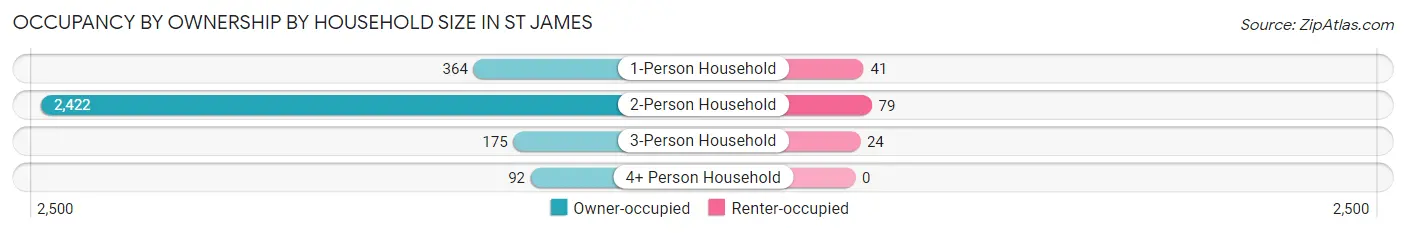
| Household Size | Owner-occupied | Renter-occupied |
| 1-Person Household | 364 (89.9%) | 41 (10.1%) |
| 2-Person Household | 2,422 (96.8%) | 79 (3.2%) |
| 3-Person Household | 175 (87.9%) | 24 (12.1%) |
| 4+ Person Household | 92 (100.0%) | 0 (0.0%) |
| Total Housing Units | 3,053 (95.5%) | 144 (4.5%) |
Occupancy by Educational Attainment in St James
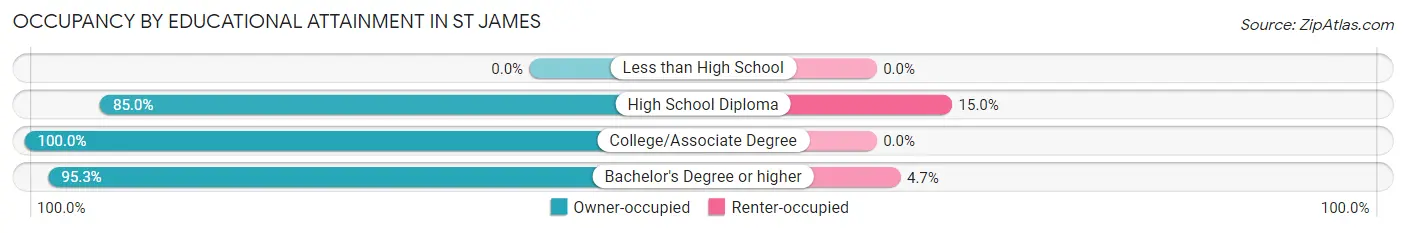
| Household Size | Owner-occupied | Renter-occupied |
| Less than High School | 0 (0.0%) | 0 (0.0%) |
| High School Diploma | 233 (85.0%) | 41 (15.0%) |
| College/Associate Degree | 746 (100.0%) | 0 (0.0%) |
| Bachelor's Degree or higher | 2,074 (95.3%) | 103 (4.7%) |
Occupancy by Age of Householder in St James
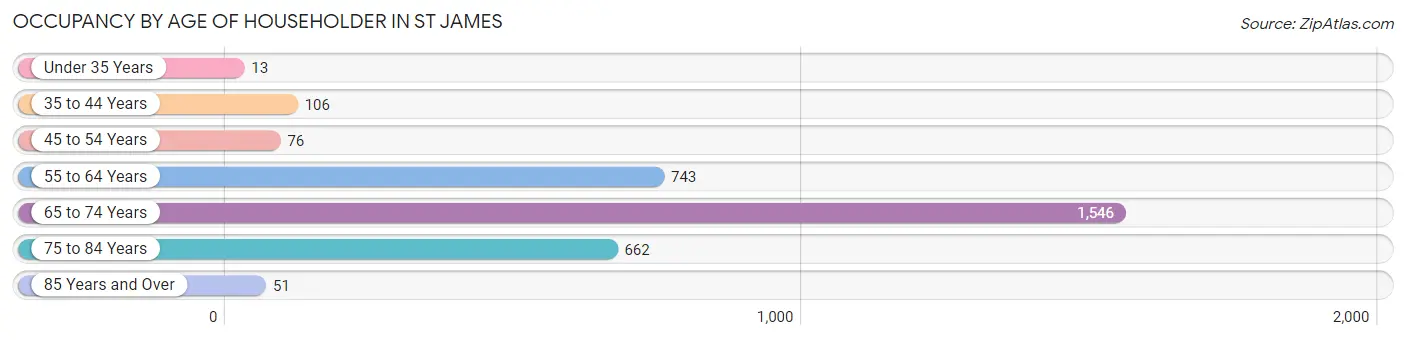
| Age Bracket | # Households | % Households |
| Under 35 Years | 13 | 0.4% |
| 35 to 44 Years | 106 | 3.3% |
| 45 to 54 Years | 76 | 2.4% |
| 55 to 64 Years | 743 | 23.2% |
| 65 to 74 Years | 1,546 | 48.4% |
| 75 to 84 Years | 662 | 20.7% |
| 85 Years and Over | 51 | 1.6% |
| Total | 3,197 | 100.0% |
Housing Finances in St James
Median Income by Occupancy in St James
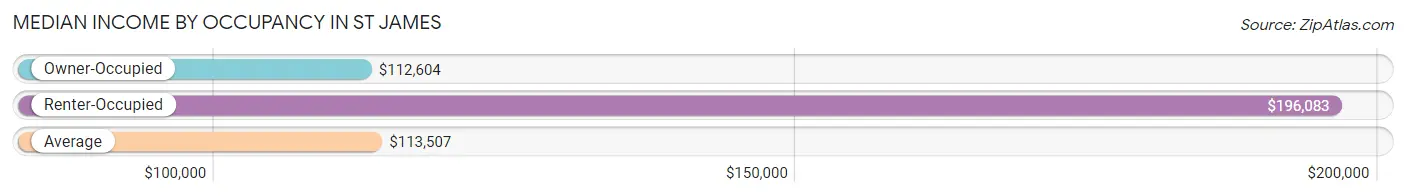
| Occupancy Type | # Households | Median Income |
| Owner-Occupied | 3,053 (95.5%) | $112,604 |
| Renter-Occupied | 144 (4.5%) | $196,083 |
| Average | 3,197 (100.0%) | $113,507 |
Occupancy by Householder Income Bracket in St James
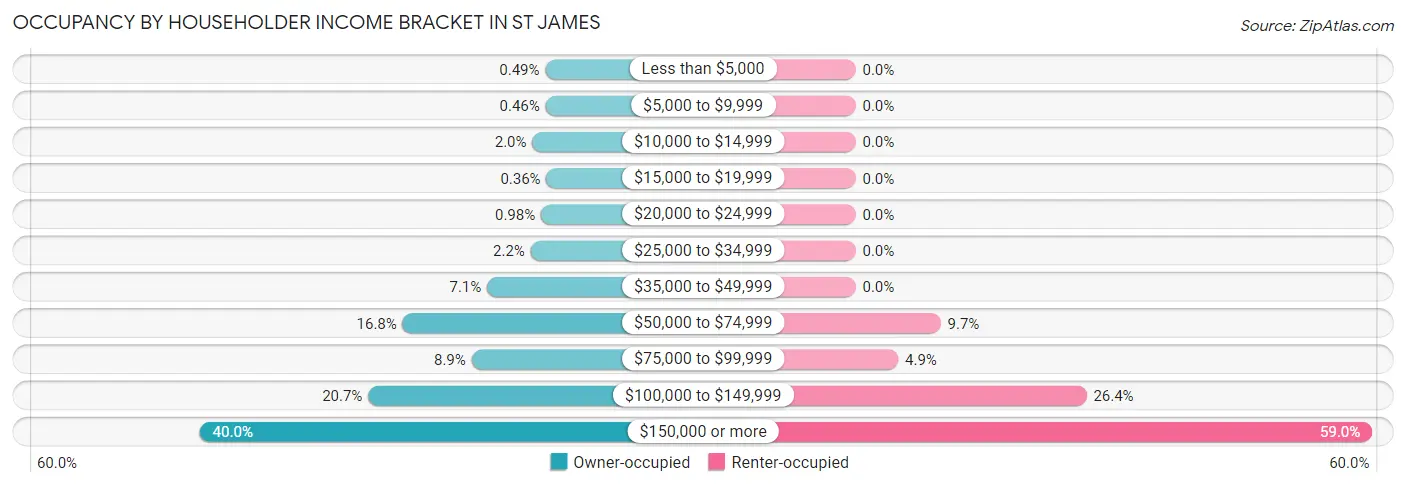
| Income Bracket | Owner-occupied | Renter-occupied |
| Less than $5,000 | 15 (0.5%) | 0 (0.0%) |
| $5,000 to $9,999 | 14 (0.5%) | 0 (0.0%) |
| $10,000 to $14,999 | 60 (2.0%) | 0 (0.0%) |
| $15,000 to $19,999 | 11 (0.4%) | 0 (0.0%) |
| $20,000 to $24,999 | 30 (1.0%) | 0 (0.0%) |
| $25,000 to $34,999 | 66 (2.2%) | 0 (0.0%) |
| $35,000 to $49,999 | 218 (7.1%) | 0 (0.0%) |
| $50,000 to $74,999 | 513 (16.8%) | 14 (9.7%) |
| $75,000 to $99,999 | 272 (8.9%) | 7 (4.9%) |
| $100,000 to $149,999 | 633 (20.7%) | 38 (26.4%) |
| $150,000 or more | 1,221 (40.0%) | 85 (59.0%) |
| Total | 3,053 (100.0%) | 144 (100.0%) |
Monthly Housing Cost Tiers in St James
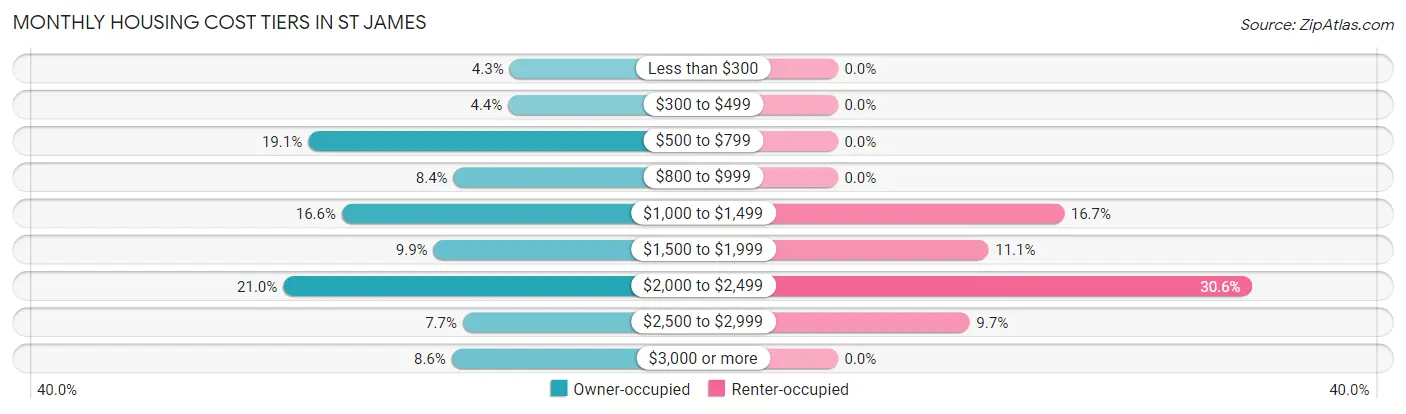
| Monthly Cost | Owner-occupied | Renter-occupied |
| Less than $300 | 131 (4.3%) | 0 (0.0%) |
| $300 to $499 | 134 (4.4%) | 0 (0.0%) |
| $500 to $799 | 584 (19.1%) | 0 (0.0%) |
| $800 to $999 | 257 (8.4%) | 0 (0.0%) |
| $1,000 to $1,499 | 508 (16.6%) | 24 (16.7%) |
| $1,500 to $1,999 | 302 (9.9%) | 16 (11.1%) |
| $2,000 to $2,499 | 640 (21.0%) | 44 (30.6%) |
| $2,500 to $2,999 | 236 (7.7%) | 14 (9.7%) |
| $3,000 or more | 261 (8.6%) | 0 (0.0%) |
| Total | 3,053 (100.0%) | 144 (100.0%) |
Physical Housing Characteristics in St James
Housing Structures in St James
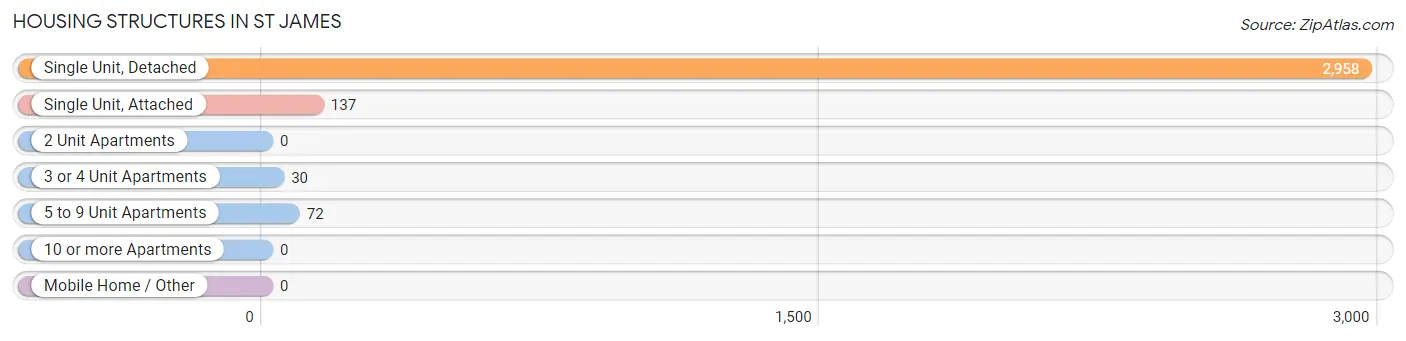
| Structure Type | # Housing Units | % Housing Units |
| Single Unit, Detached | 2,958 | 92.5% |
| Single Unit, Attached | 137 | 4.3% |
| 2 Unit Apartments | 0 | 0.0% |
| 3 or 4 Unit Apartments | 30 | 0.9% |
| 5 to 9 Unit Apartments | 72 | 2.2% |
| 10 or more Apartments | 0 | 0.0% |
| Mobile Home / Other | 0 | 0.0% |
| Total | 3,197 | 100.0% |
Housing Structures by Occupancy in St James
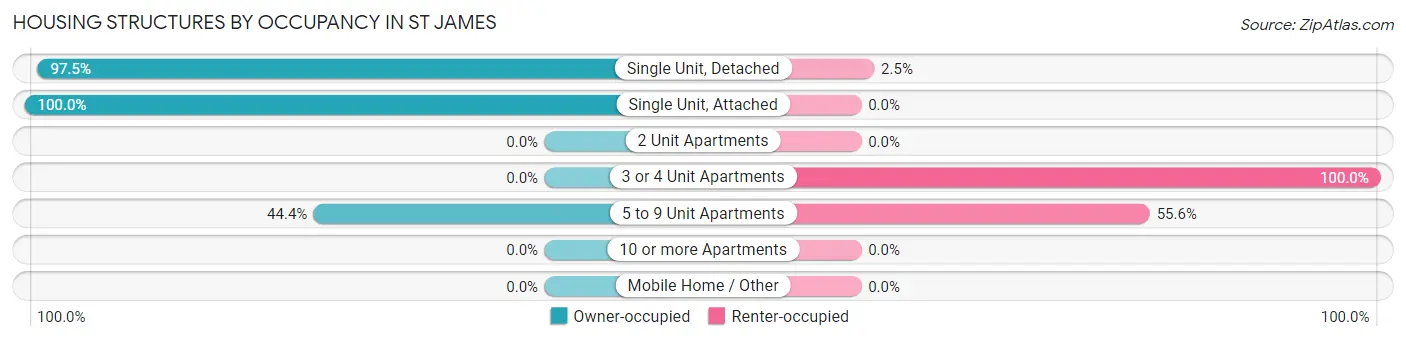
| Structure Type | Owner-occupied | Renter-occupied |
| Single Unit, Detached | 2,884 (97.5%) | 74 (2.5%) |
| Single Unit, Attached | 137 (100.0%) | 0 (0.0%) |
| 2 Unit Apartments | 0 (0.0%) | 0 (0.0%) |
| 3 or 4 Unit Apartments | 0 (0.0%) | 30 (100.0%) |
| 5 to 9 Unit Apartments | 32 (44.4%) | 40 (55.6%) |
| 10 or more Apartments | 0 (0.0%) | 0 (0.0%) |
| Mobile Home / Other | 0 (0.0%) | 0 (0.0%) |
| Total | 3,053 (95.5%) | 144 (4.5%) |
Housing Structures by Number of Rooms in St James
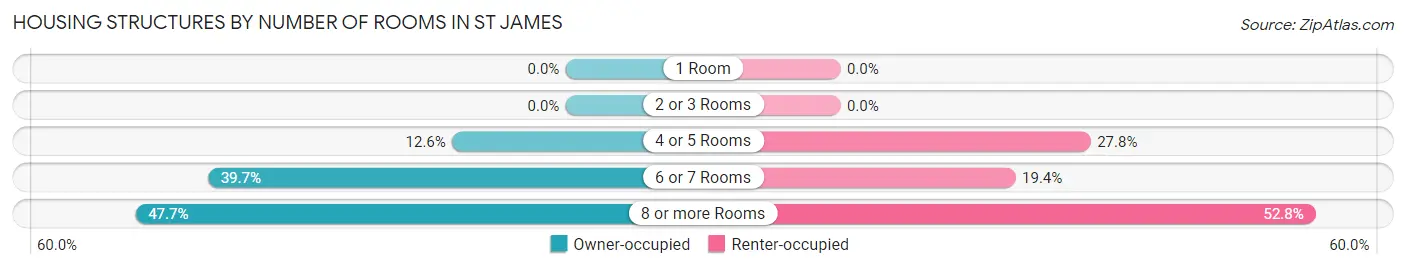
| Number of Rooms | Owner-occupied | Renter-occupied |
| 1 Room | 0 (0.0%) | 0 (0.0%) |
| 2 or 3 Rooms | 0 (0.0%) | 0 (0.0%) |
| 4 or 5 Rooms | 385 (12.6%) | 40 (27.8%) |
| 6 or 7 Rooms | 1,211 (39.7%) | 28 (19.4%) |
| 8 or more Rooms | 1,457 (47.7%) | 76 (52.8%) |
| Total | 3,053 (100.0%) | 144 (100.0%) |
Housing Structure by Heating Type in St James
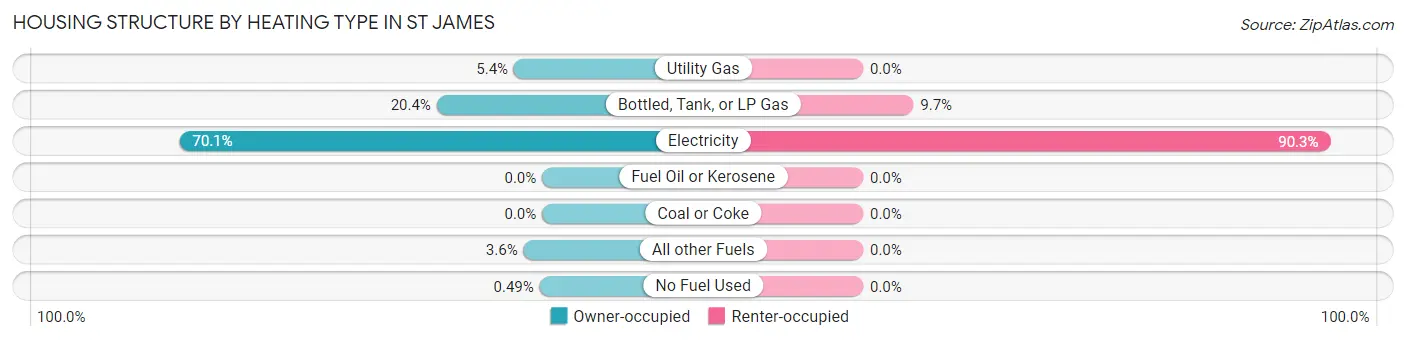
| Heating Type | Owner-occupied | Renter-occupied |
| Utility Gas | 166 (5.4%) | 0 (0.0%) |
| Bottled, Tank, or LP Gas | 622 (20.4%) | 14 (9.7%) |
| Electricity | 2,140 (70.1%) | 130 (90.3%) |
| Fuel Oil or Kerosene | 0 (0.0%) | 0 (0.0%) |
| Coal or Coke | 0 (0.0%) | 0 (0.0%) |
| All other Fuels | 110 (3.6%) | 0 (0.0%) |
| No Fuel Used | 15 (0.5%) | 0 (0.0%) |
| Total | 3,053 (100.0%) | 144 (100.0%) |
Household Vehicle Usage in St James
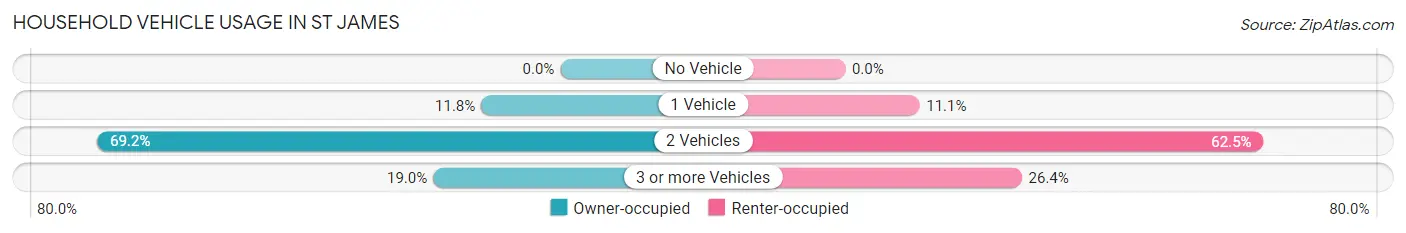
| Vehicles per Household | Owner-occupied | Renter-occupied |
| No Vehicle | 0 (0.0%) | 0 (0.0%) |
| 1 Vehicle | 361 (11.8%) | 16 (11.1%) |
| 2 Vehicles | 2,112 (69.2%) | 90 (62.5%) |
| 3 or more Vehicles | 580 (19.0%) | 38 (26.4%) |
| Total | 3,053 (100.0%) | 144 (100.0%) |
Real Estate & Mortgages in St James
Real Estate and Mortgage Overview in St James
| Characteristic | Without Mortgage | With Mortgage |
| Housing Units | 1,341 | 1,712 |
| Median Property Value | $557,700 | $552,300 |
| Median Household Income | $102,583 | $827 |
| Monthly Housing Costs | $791 | $261 |
| Real Estate Taxes | $2,719 | $96 |
Property Value by Mortgage Status in St James
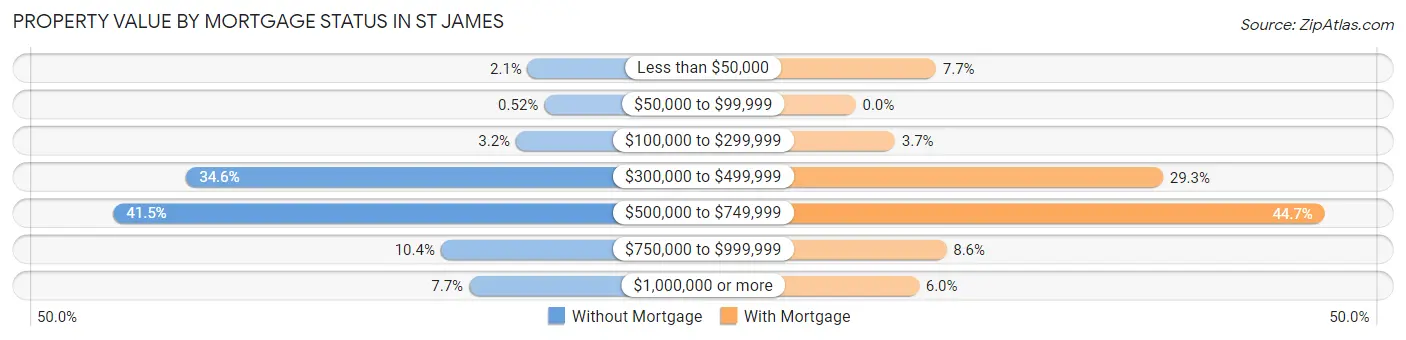
| Property Value | Without Mortgage | With Mortgage |
| Less than $50,000 | 28 (2.1%) | 131 (7.6%) |
| $50,000 to $99,999 | 7 (0.5%) | 0 (0.0%) |
| $100,000 to $299,999 | 43 (3.2%) | 64 (3.7%) |
| $300,000 to $499,999 | 464 (34.6%) | 501 (29.3%) |
| $500,000 to $749,999 | 557 (41.5%) | 765 (44.7%) |
| $750,000 to $999,999 | 139 (10.4%) | 148 (8.6%) |
| $1,000,000 or more | 103 (7.7%) | 103 (6.0%) |
| Total | 1,341 (100.0%) | 1,712 (100.0%) |
Household Income by Mortgage Status in St James
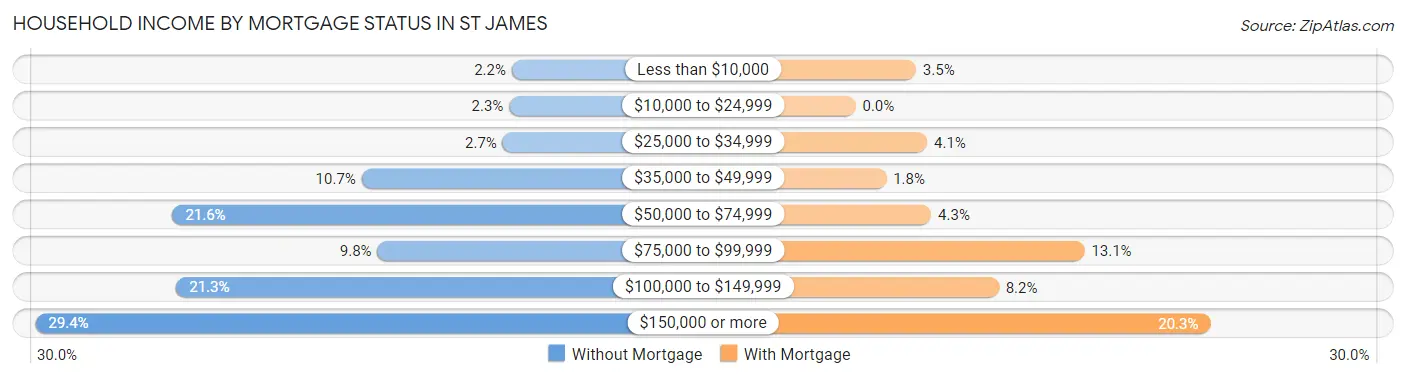
| Household Income | Without Mortgage | With Mortgage |
| Less than $10,000 | 29 (2.2%) | 59 (3.5%) |
| $10,000 to $24,999 | 31 (2.3%) | 0 (0.0%) |
| $25,000 to $34,999 | 36 (2.7%) | 70 (4.1%) |
| $35,000 to $49,999 | 144 (10.7%) | 30 (1.8%) |
| $50,000 to $74,999 | 289 (21.5%) | 74 (4.3%) |
| $75,000 to $99,999 | 132 (9.8%) | 224 (13.1%) |
| $100,000 to $149,999 | 286 (21.3%) | 140 (8.2%) |
| $150,000 or more | 394 (29.4%) | 347 (20.3%) |
| Total | 1,341 (100.0%) | 1,712 (100.0%) |
Property Value to Household Income Ratio in St James
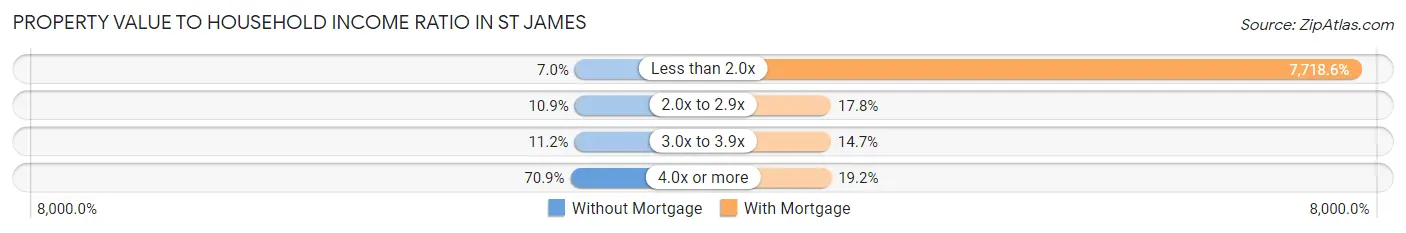
| Value-to-Income Ratio | Without Mortgage | With Mortgage |
| Less than 2.0x | 94 (7.0%) | 132,143 (7,718.6%) |
| 2.0x to 2.9x | 146 (10.9%) | 305 (17.8%) |
| 3.0x to 3.9x | 150 (11.2%) | 251 (14.7%) |
| 4.0x or more | 951 (70.9%) | 329 (19.2%) |
| Total | 1,341 (100.0%) | 1,712 (100.0%) |
Real Estate Taxes by Mortgage Status in St James
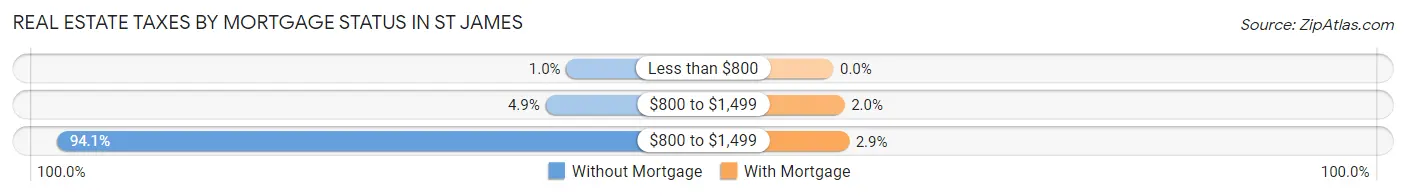
| Property Taxes | Without Mortgage | With Mortgage |
| Less than $800 | 14 (1.0%) | 0 (0.0%) |
| $800 to $1,499 | 65 (4.9%) | 35 (2.0%) |
| $800 to $1,499 | 1,262 (94.1%) | 49 (2.9%) |
| Total | 1,341 (100.0%) | 1,712 (100.0%) |
Health & Disability in St James
Health Insurance Coverage by Age in St James
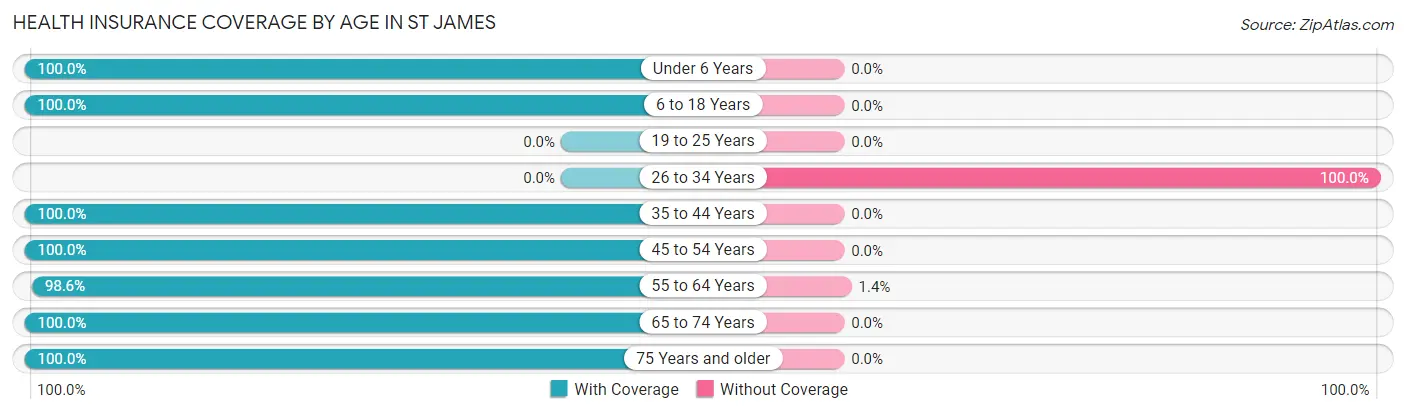
| Age Bracket | With Coverage | Without Coverage |
| Under 6 Years | 54 (100.0%) | 0 (0.0%) |
| 6 to 18 Years | 246 (100.0%) | 0 (0.0%) |
| 19 to 25 Years | 0 (0.0%) | 0 (0.0%) |
| 26 to 34 Years | 0 (0.0%) | 13 (100.0%) |
| 35 to 44 Years | 293 (100.0%) | 0 (0.0%) |
| 45 to 54 Years | 343 (100.0%) | 0 (0.0%) |
| 55 to 64 Years | 1,450 (98.6%) | 20 (1.4%) |
| 65 to 74 Years | 2,841 (100.0%) | 0 (0.0%) |
| 75 Years and older | 1,306 (100.0%) | 0 (0.0%) |
| Total | 6,533 (99.5%) | 33 (0.5%) |
Health Insurance Coverage by Citizenship Status in St James
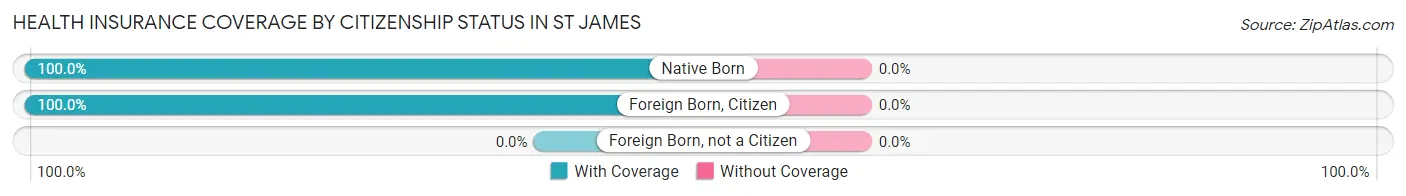
| Citizenship Status | With Coverage | Without Coverage |
| Native Born | 54 (100.0%) | 0 (0.0%) |
| Foreign Born, Citizen | 246 (100.0%) | 0 (0.0%) |
| Foreign Born, not a Citizen | 0 (0.0%) | 0 (0.0%) |
Health Insurance Coverage by Household Income in St James
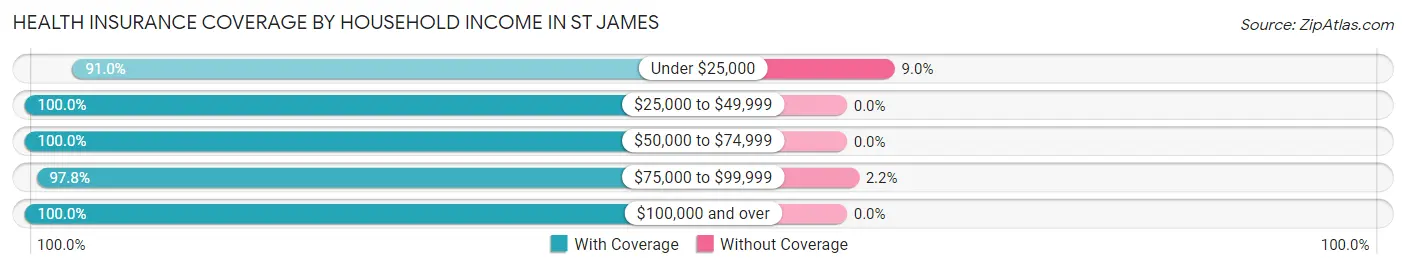
| Household Income | With Coverage | Without Coverage |
| Under $25,000 | 203 (91.0%) | 20 (9.0%) |
| $25,000 to $49,999 | 589 (100.0%) | 0 (0.0%) |
| $50,000 to $74,999 | 1,071 (100.0%) | 0 (0.0%) |
| $75,000 to $99,999 | 570 (97.8%) | 13 (2.2%) |
| $100,000 and over | 4,100 (100.0%) | 0 (0.0%) |
Public vs Private Health Insurance Coverage by Age in St James
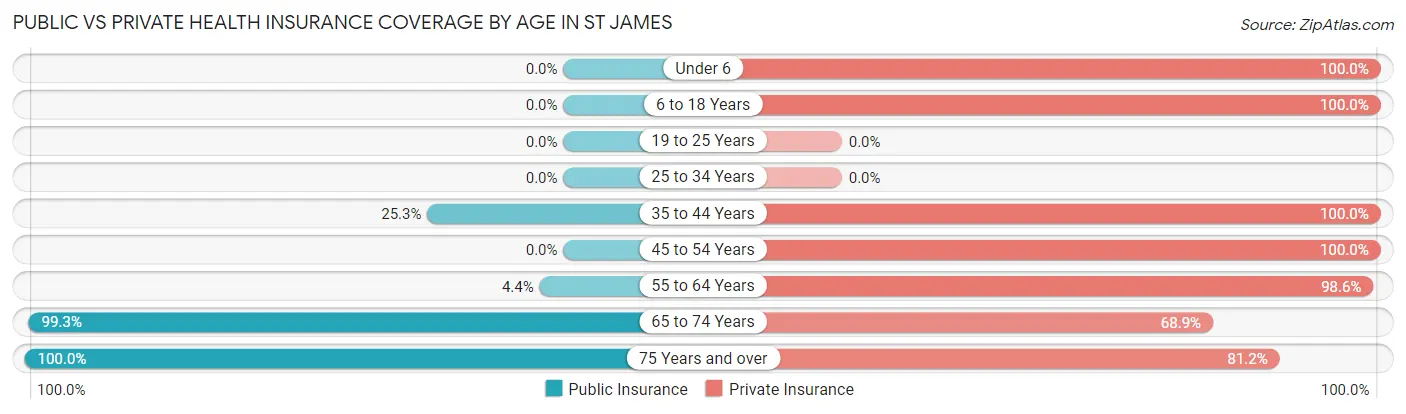
| Age Bracket | Public Insurance | Private Insurance |
| Under 6 | 0 (0.0%) | 54 (100.0%) |
| 6 to 18 Years | 0 (0.0%) | 246 (100.0%) |
| 19 to 25 Years | 0 (0.0%) | 0 (0.0%) |
| 25 to 34 Years | 0 (0.0%) | 0 (0.0%) |
| 35 to 44 Years | 74 (25.3%) | 293 (100.0%) |
| 45 to 54 Years | 0 (0.0%) | 343 (100.0%) |
| 55 to 64 Years | 65 (4.4%) | 1,450 (98.6%) |
| 65 to 74 Years | 2,820 (99.3%) | 1,957 (68.9%) |
| 75 Years and over | 1,306 (100.0%) | 1,061 (81.2%) |
| Total | 4,265 (65.0%) | 5,404 (82.3%) |
Disability Status by Sex by Age in St James
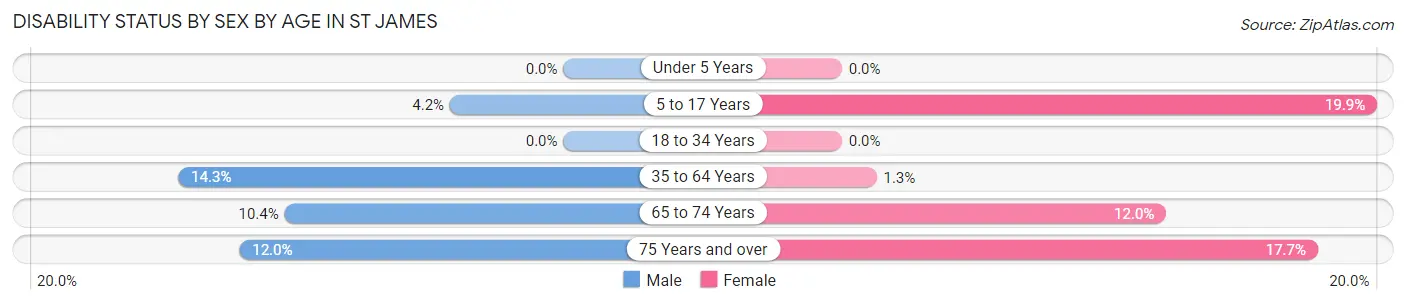
| Age Bracket | Male | Female |
| Under 5 Years | 0 (0.0%) | 0 (0.0%) |
| 5 to 17 Years | 4 (4.2%) | 30 (19.9%) |
| 18 to 34 Years | 0 (0.0%) | 0 (0.0%) |
| 35 to 64 Years | 135 (14.3%) | 15 (1.3%) |
| 65 to 74 Years | 141 (10.3%) | 178 (12.0%) |
| 75 Years and over | 87 (12.0%) | 103 (17.7%) |
Disability Class by Sex by Age in St James
Disability Class: Hearing Difficulty
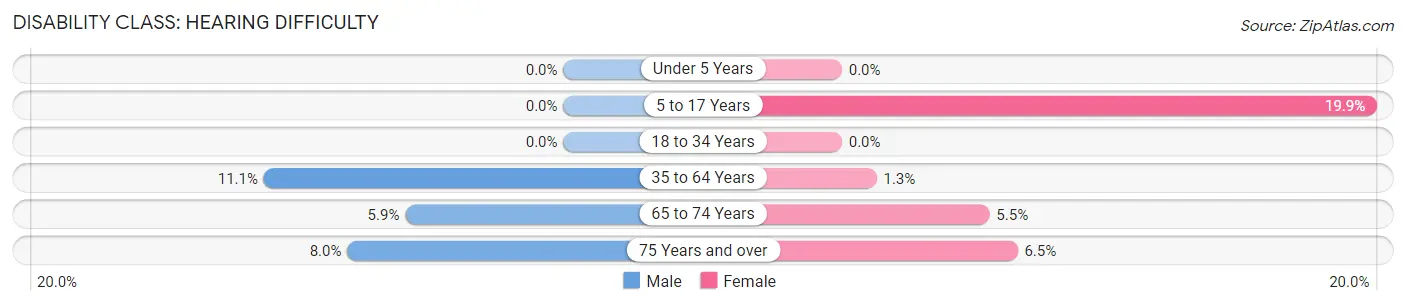
| Age Bracket | Male | Female |
| Under 5 Years | 0 (0.0%) | 0 (0.0%) |
| 5 to 17 Years | 0 (0.0%) | 30 (19.9%) |
| 18 to 34 Years | 0 (0.0%) | 0 (0.0%) |
| 35 to 64 Years | 105 (11.1%) | 15 (1.3%) |
| 65 to 74 Years | 80 (5.9%) | 81 (5.5%) |
| 75 Years and over | 58 (8.0%) | 38 (6.5%) |
Disability Class: Vision Difficulty
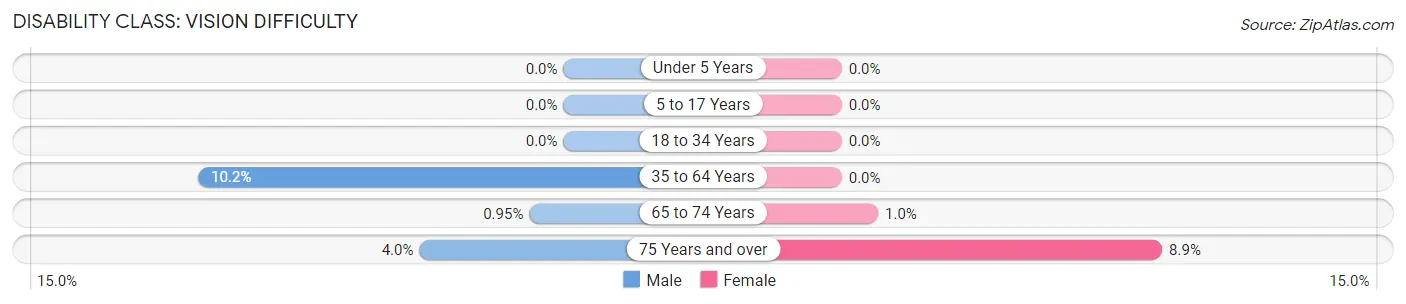
| Age Bracket | Male | Female |
| Under 5 Years | 0 (0.0%) | 0 (0.0%) |
| 5 to 17 Years | 0 (0.0%) | 0 (0.0%) |
| 18 to 34 Years | 0 (0.0%) | 0 (0.0%) |
| 35 to 64 Years | 96 (10.2%) | 0 (0.0%) |
| 65 to 74 Years | 13 (0.9%) | 15 (1.0%) |
| 75 Years and over | 29 (4.0%) | 52 (8.9%) |
Disability Class: Cognitive Difficulty
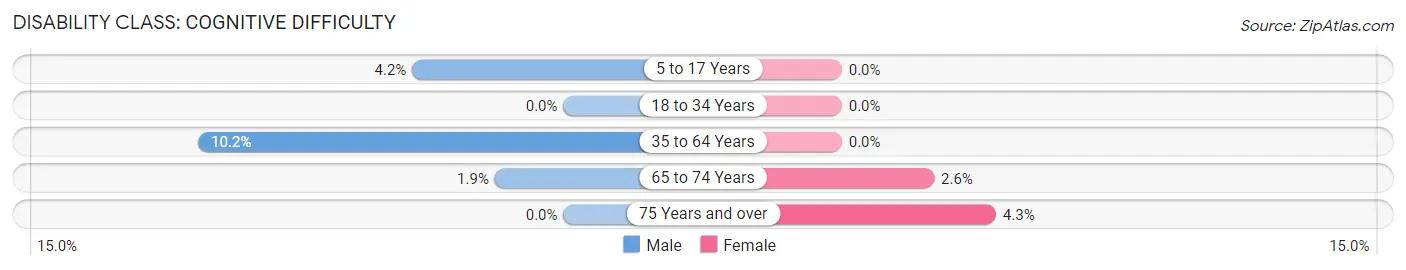
| Age Bracket | Male | Female |
| 5 to 17 Years | 4 (4.2%) | 0 (0.0%) |
| 18 to 34 Years | 0 (0.0%) | 0 (0.0%) |
| 35 to 64 Years | 96 (10.2%) | 0 (0.0%) |
| 65 to 74 Years | 26 (1.9%) | 38 (2.6%) |
| 75 Years and over | 0 (0.0%) | 25 (4.3%) |
Disability Class: Ambulatory Difficulty
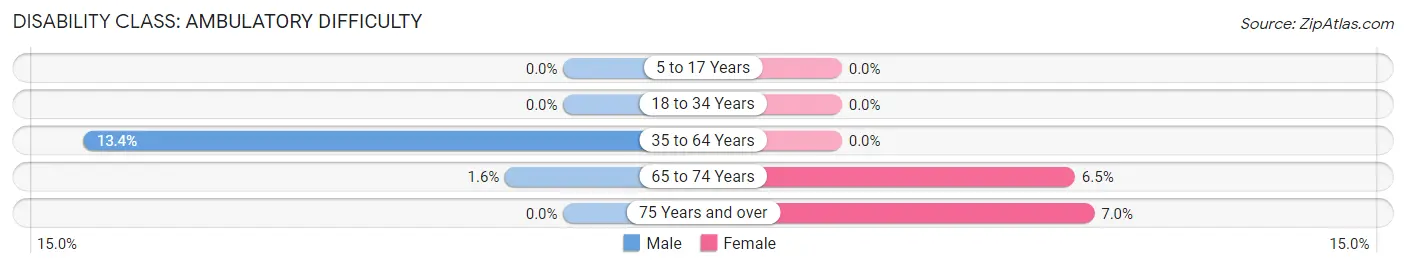
| Age Bracket | Male | Female |
| 5 to 17 Years | 0 (0.0%) | 0 (0.0%) |
| 18 to 34 Years | 0 (0.0%) | 0 (0.0%) |
| 35 to 64 Years | 126 (13.4%) | 0 (0.0%) |
| 65 to 74 Years | 22 (1.6%) | 96 (6.5%) |
| 75 Years and over | 0 (0.0%) | 41 (7.0%) |
Disability Class: Self-Care Difficulty
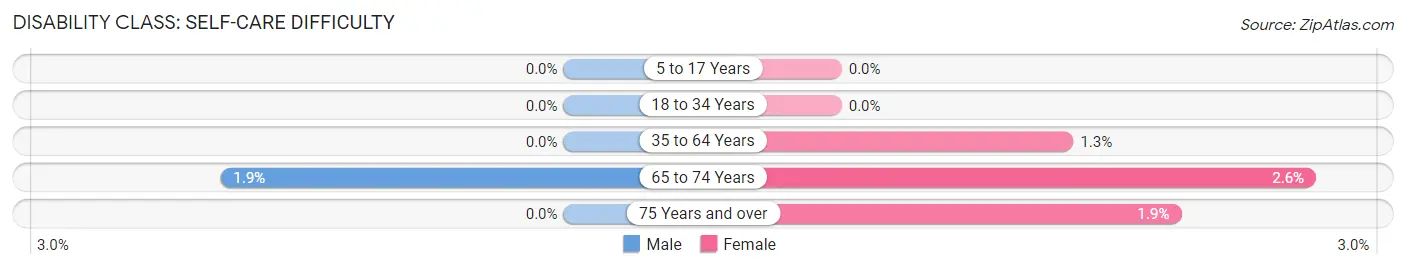
| Age Bracket | Male | Female |
| 5 to 17 Years | 0 (0.0%) | 0 (0.0%) |
| 18 to 34 Years | 0 (0.0%) | 0 (0.0%) |
| 35 to 64 Years | 0 (0.0%) | 15 (1.3%) |
| 65 to 74 Years | 26 (1.9%) | 39 (2.6%) |
| 75 Years and over | 0 (0.0%) | 11 (1.9%) |
Technology Access in St James
Computing Device Access in St James
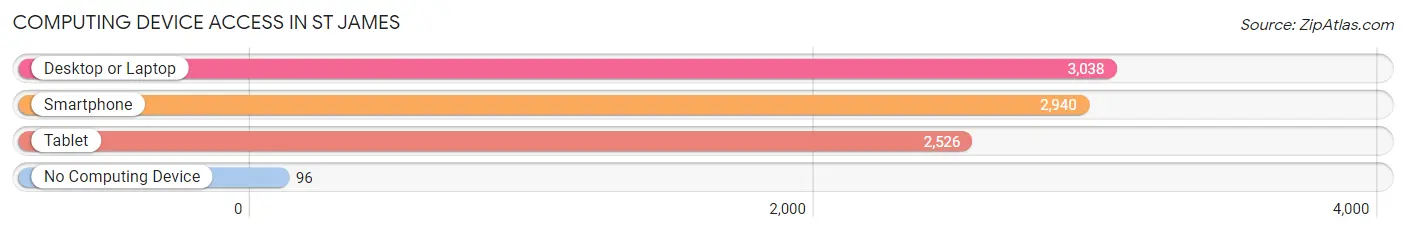
| Device Type | # Households | % Households |
| Desktop or Laptop | 3,038 | 95.0% |
| Smartphone | 2,940 | 92.0% |
| Tablet | 2,526 | 79.0% |
| No Computing Device | 96 | 3.0% |
| Total | 3,197 | 100.0% |
Internet Access in St James
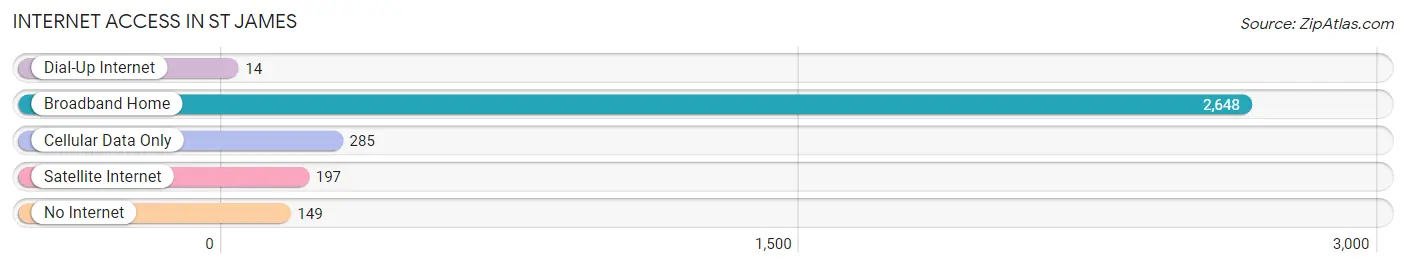
| Internet Type | # Households | % Households |
| Dial-Up Internet | 14 | 0.4% |
| Broadband Home | 2,648 | 82.8% |
| Cellular Data Only | 285 | 8.9% |
| Satellite Internet | 197 | 6.2% |
| No Internet | 149 | 4.7% |
| Total | 3,197 | 100.0% |
St James Summary
St James is a small town located in the southeastern corner of North Carolina, in the United States. It is situated in Brunswick County, and is part of the Wilmington Metropolitan Statistical Area. The town has a population of approximately 1,500 people, and is known for its rural charm and small-town atmosphere.
History
St James was founded in 1725 by a group of settlers from Scotland. The town was named after the patron saint of Scotland, St James. The settlers were attracted to the area due to its fertile soil and abundant natural resources. The town quickly grew and became a thriving agricultural center.
In the early 19th century, St James was a major port for the export of cotton, tobacco, and other goods. The town was also home to several large plantations, which were worked by enslaved African Americans. After the Civil War, the town experienced a period of economic decline, as the plantations were no longer profitable.
In the late 19th century, St James began to experience a period of growth and prosperity. The town was home to several successful businesses, including a sawmill, a gristmill, and a cotton gin. The town also became a popular tourist destination, as it was located near the beach.
Geography
St James is located in the southeastern corner of North Carolina, in Brunswick County. The town is situated on the banks of the Cape Fear River, and is surrounded by lush forests and wetlands. The town is located approximately 30 miles south of Wilmington, and is part of the Wilmington Metropolitan Statistical Area.
The town has a humid subtropical climate, with hot, humid summers and mild winters. The average annual temperature is around 70 degrees Fahrenheit, and the average annual precipitation is around 50 inches.
Economy
St James is a small, rural town, and the economy is largely based on agriculture. The town is home to several farms, which produce a variety of crops, including corn, soybeans, and cotton. The town is also home to several small businesses, including restaurants, retail stores, and service providers.
The town is also home to several manufacturing companies, which produce a variety of products, including furniture, textiles, and electronics. The town is also home to several tourist attractions, including the St James Historic District, which is listed on the National Register of Historic Places.
Demographics
As of the 2010 census, St James had a population of 1,500 people. The racial makeup of the town was 79.3% White, 16.7% African American, 0.7% Native American, 0.7% Asian, and 2.7% from other races. The median household income was $37,500, and the median family income was $45,000.
The town is home to several churches, including the St James Presbyterian Church, the St James United Methodist Church, and the St James Baptist Church. The town is also home to several schools, including the St James Elementary School, the St James Middle School, and the St James High School.
Conclusion
St James is a small town located in the southeastern corner of North Carolina. The town has a population of approximately 1,500 people, and is known for its rural charm and small-town atmosphere. The town has a humid subtropical climate, and the economy is largely based on agriculture. The town is home to several churches, schools, and tourist attractions, and is part of the Wilmington Metropolitan Statistical Area.
Common Questions
What is the Total Population of St James?
Total Population of St James is 6,566.
What is the Total Male Population of St James?
Total Male Population of St James is 3,191.
What is the Total Female Population of St James?
Total Female Population of St James is 3,375.
What is the Ratio of Males per 100 Females in St James?
There are 94.55 Males per 100 Females in St James.
What is the Ratio of Females per 100 Males in St James?
There are 105.77 Females per 100 Males in St James.
What is the Median Population Age in St James?
Median Population Age in St James is 68.3 Years.
What is the Average Family Size in St James
Average Family Size in St James is 2.2 People.
What is the Average Household Size in St James
Average Household Size in St James is 2.0 People.
What is Per Capita Income in St James?
Per Capita income in St James is $90,098.
What is the Median Family Income in St James?
Median Family Income in St James is $119,160.
What is the Median Household income in St James?
Median Household Income in St James is $113,507.
What is Income or Wage Gap in St James?
Income or Wage Gap in St James is 58.0%.
Women in St James earn 42.0 cents for every dollar earned by a man.
What is Family Income Deficit in St James?
Family Income Deficit in St James is $6,500.
Families that are below poverty line in St James earn $6,500 less on average than the poverty threshold level.
What is Inequality or Gini Index in St James?
Inequality or Gini Index in St James is 0.49.
How Large is the Labor Force in St James?
There are 1,602 People in the Labor Forcein in St James.
What is the Percentage of People in the Labor Force in St James?
25.4% of People are in the Labor Force in St James.
What is the Unemployment Rate in St James?
Unemployment Rate in St James is 3.5%.