Bunn, NC
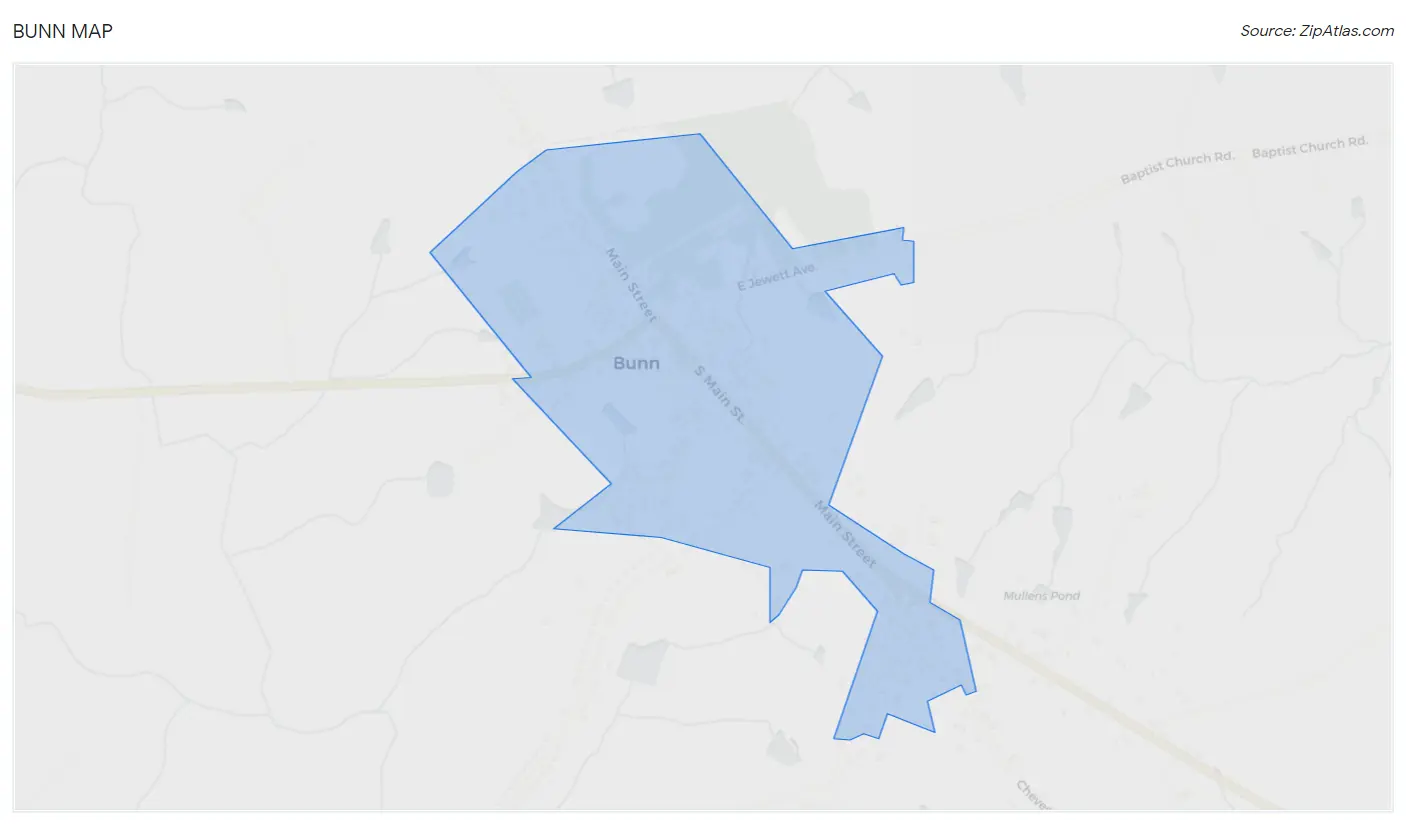
Bunn Map
Bunn Overview
478
TOTAL POPULATION
245
MALE POPULATION
233
FEMALE POPULATION
105.15
MALES / 100 FEMALES
95.10
FEMALES / 100 MALES
43.5
MEDIAN AGE
3.7
AVG FAMILY SIZE
2.5
AVG HOUSEHOLD SIZE
$23,110
PER CAPITA INCOME
$70,852
AVG FAMILY INCOME
$50,536
AVG HOUSEHOLD INCOME
0.9%
WAGE / INCOME GAP [ % ]
99.1¢/ $1
WAGE / INCOME GAP [ $ ]
0.35
INEQUALITY / GINI INDEX
243
LABOR FORCE [ PEOPLE ]
63.8%
PERCENT IN LABOR FORCE
Bunn Zip Codes
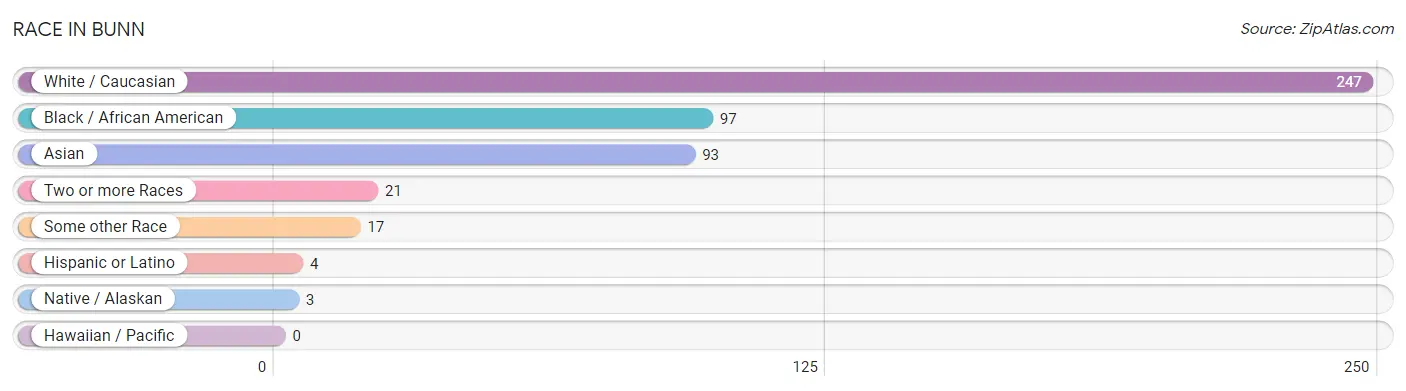
Race in Bunn
The most populous races in Bunn are White / Caucasian (247 | 51.7%), Black / African American (97 | 20.3%), and Asian (93 | 19.5%).
| Race | # Population | % Population |
| Asian | 93 | 19.5% |
| Black / African American | 97 | 20.3% |
| Hawaiian / Pacific | 0 | 0.0% |
| Hispanic or Latino | 4 | 0.8% |
| Native / Alaskan | 3 | 0.6% |
| White / Caucasian | 247 | 51.7% |
| Two or more Races | 21 | 4.4% |
| Some other Race | 17 | 3.6% |
| Total | 478 | 100.0% |
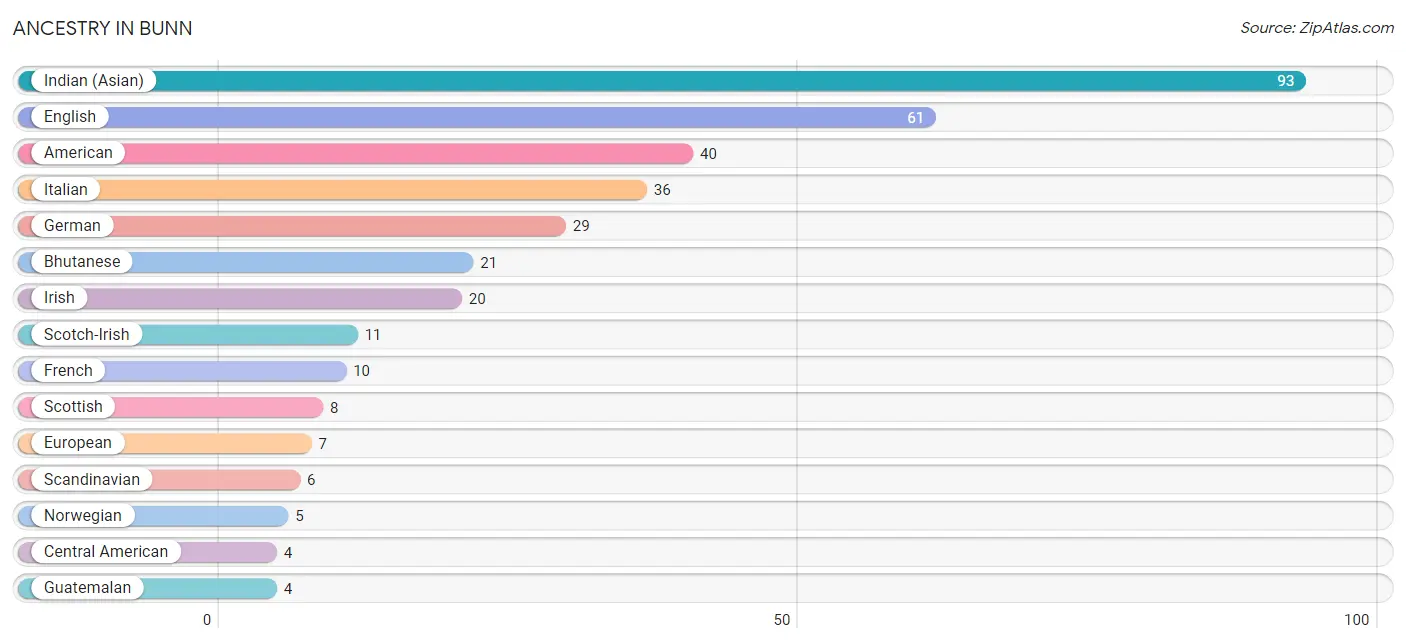
Ancestry in Bunn
The most populous ancestries reported in Bunn are Indian (Asian) (93 | 19.5%), English (61 | 12.8%), American (40 | 8.4%), Italian (36 | 7.5%), and German (29 | 6.1%), together accounting for 54.2% of all Bunn residents.
| Ancestry | # Population | % Population |
| American | 40 | 8.4% |
| Bhutanese | 21 | 4.4% |
| Central American | 4 | 0.8% |
| English | 61 | 12.8% |
| European | 7 | 1.5% |
| French | 10 | 2.1% |
| German | 29 | 6.1% |
| Guatemalan | 4 | 0.8% |
| Indian (Asian) | 93 | 19.5% |
| Irish | 20 | 4.2% |
| Italian | 36 | 7.5% |
| Norwegian | 5 | 1.1% |
| Polish | 1 | 0.2% |
| Portuguese | 2 | 0.4% |
| Russian | 1 | 0.2% |
| Scandinavian | 6 | 1.3% |
| Scotch-Irish | 11 | 2.3% |
| Scottish | 8 | 1.7% |
| Swedish | 1 | 0.2% |
| Welsh | 2 | 0.4% | View All 20 Rows |
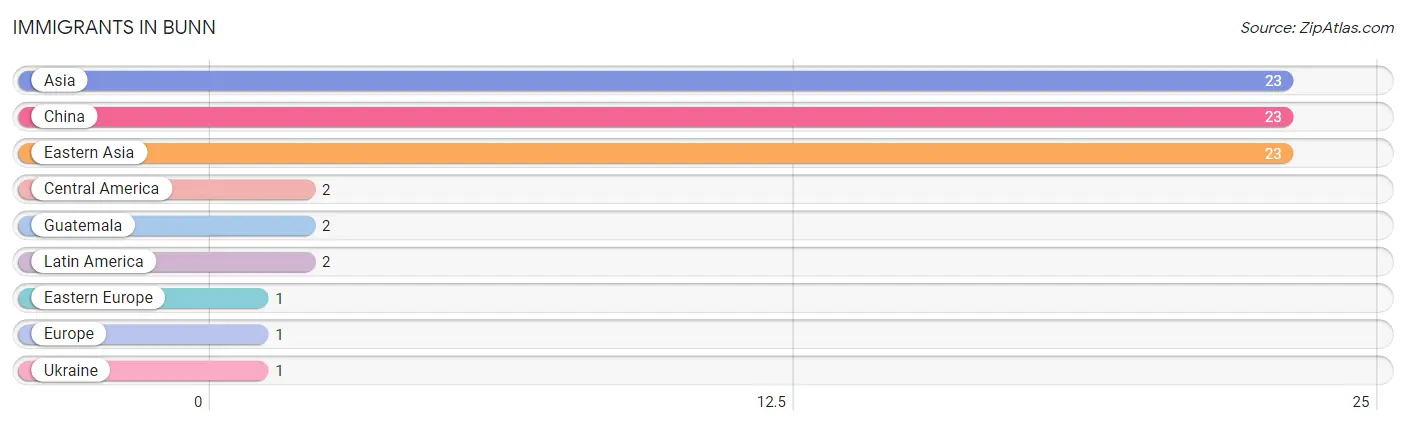
Immigrants in Bunn
The most numerous immigrant groups reported in Bunn came from Asia (23 | 4.8%), China (23 | 4.8%), Eastern Asia (23 | 4.8%), Central America (2 | 0.4%), and Guatemala (2 | 0.4%), together accounting for 15.3% of all Bunn residents.
| Immigration Origin | # Population | % Population |
| Asia | 23 | 4.8% |
| Central America | 2 | 0.4% |
| China | 23 | 4.8% |
| Eastern Asia | 23 | 4.8% |
| Eastern Europe | 1 | 0.2% |
| Europe | 1 | 0.2% |
| Guatemala | 2 | 0.4% |
| Latin America | 2 | 0.4% |
| Ukraine | 1 | 0.2% | View All 9 Rows |
Sex and Age in Bunn
Sex and Age in Bunn
The most populous age groups in Bunn are 40 to 44 Years (42 | 17.1%) for men and 10 to 14 Years (48 | 20.6%) for women.
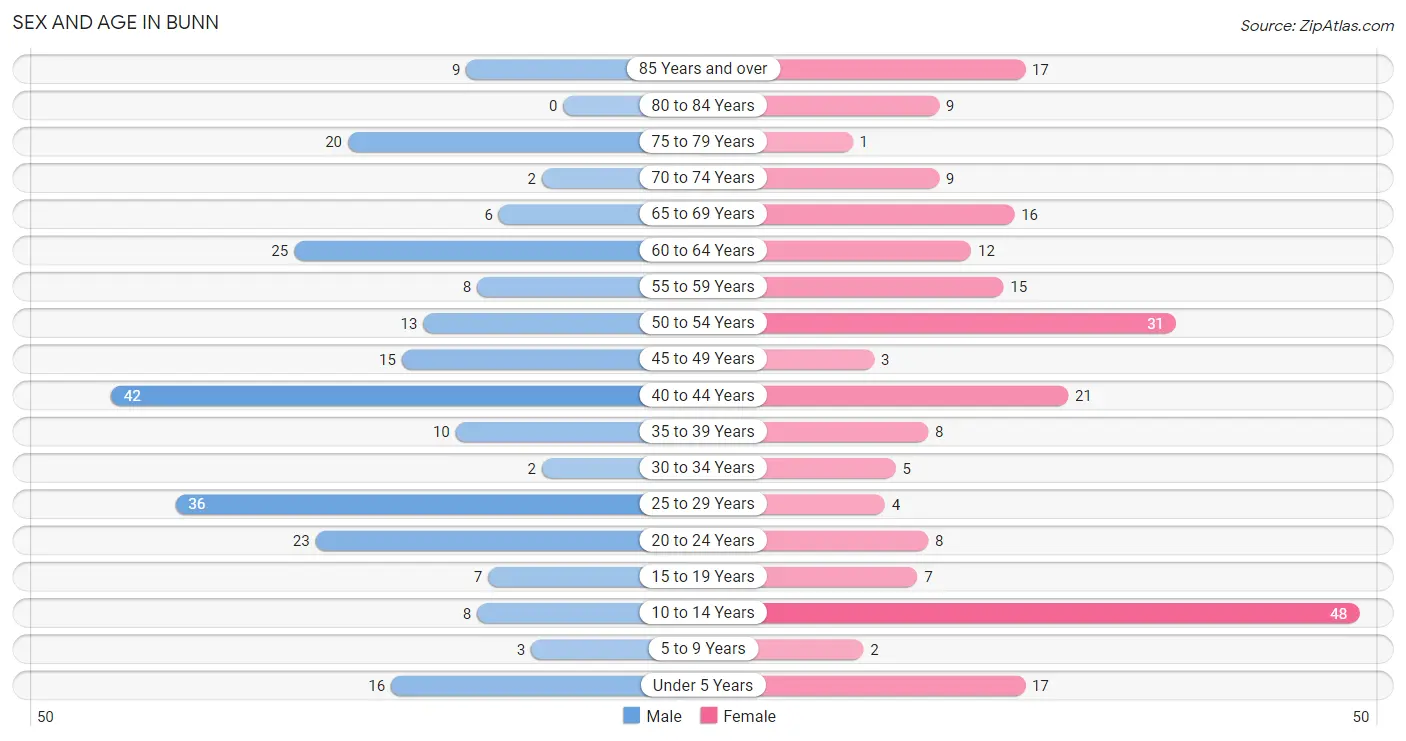
| Age Bracket | Male | Female |
| Under 5 Years | 16 (6.5%) | 17 (7.3%) |
| 5 to 9 Years | 3 (1.2%) | 2 (0.9%) |
| 10 to 14 Years | 8 (3.3%) | 48 (20.6%) |
| 15 to 19 Years | 7 (2.9%) | 7 (3.0%) |
| 20 to 24 Years | 23 (9.4%) | 8 (3.4%) |
| 25 to 29 Years | 36 (14.7%) | 4 (1.7%) |
| 30 to 34 Years | 2 (0.8%) | 5 (2.1%) |
| 35 to 39 Years | 10 (4.1%) | 8 (3.4%) |
| 40 to 44 Years | 42 (17.1%) | 21 (9.0%) |
| 45 to 49 Years | 15 (6.1%) | 3 (1.3%) |
| 50 to 54 Years | 13 (5.3%) | 31 (13.3%) |
| 55 to 59 Years | 8 (3.3%) | 15 (6.4%) |
| 60 to 64 Years | 25 (10.2%) | 12 (5.1%) |
| 65 to 69 Years | 6 (2.5%) | 16 (6.9%) |
| 70 to 74 Years | 2 (0.8%) | 9 (3.9%) |
| 75 to 79 Years | 20 (8.2%) | 1 (0.4%) |
| 80 to 84 Years | 0 (0.0%) | 9 (3.9%) |
| 85 Years and over | 9 (3.7%) | 17 (7.3%) |
| Total | 245 (100.0%) | 233 (100.0%) |
Families and Households in Bunn
Median Family Size in Bunn
The median family size in Bunn is 3.68 persons per family, with married-couple families (76 | 72.4%) accounting for the largest median family size of 3.97 persons per family. On the other hand, single male/father families (7 | 6.7%) represent the smallest median family size with 1.86 persons per family.
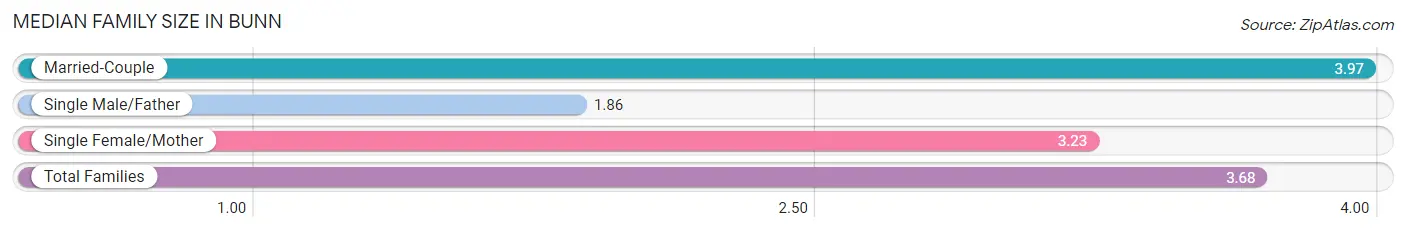
| Family Type | # Families | Family Size |
| Married-Couple | 76 (72.4%) | 3.97 |
| Single Male/Father | 7 (6.7%) | 1.86 |
| Single Female/Mother | 22 (20.9%) | 3.23 |
| Total Families | 105 (100.0%) | 3.68 |
Median Household Size in Bunn
The median household size in Bunn is 2.48 persons per household, with married-couple households (76 | 39.4%) accounting for the largest median household size of 3.97 persons per household. non-family households (88 | 45.6%) represent the smallest median household size with 1.02 persons per household.
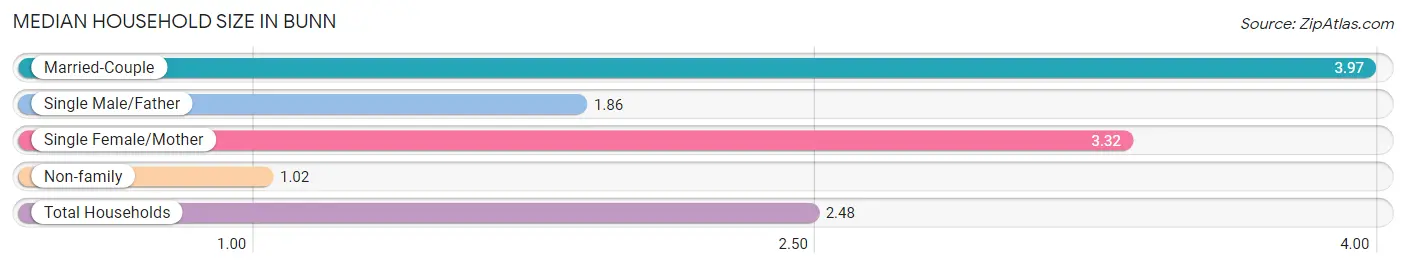
| Household Type | # Households | Household Size |
| Married-Couple | 76 (39.4%) | 3.97 |
| Single Male/Father | 7 (3.6%) | 1.86 |
| Single Female/Mother | 22 (11.4%) | 3.32 |
| Non-family | 88 (45.6%) | 1.02 |
| Total Households | 193 (100.0%) | 2.48 |
Household Size by Marriage Status in Bunn
Out of a total of 193 households in Bunn, 105 (54.4%) are family households, while 88 (45.6%) are nonfamily households. The most numerous type of family households are 2-person households, comprising 56, and the most common type of nonfamily households are 1-person households, comprising 86.
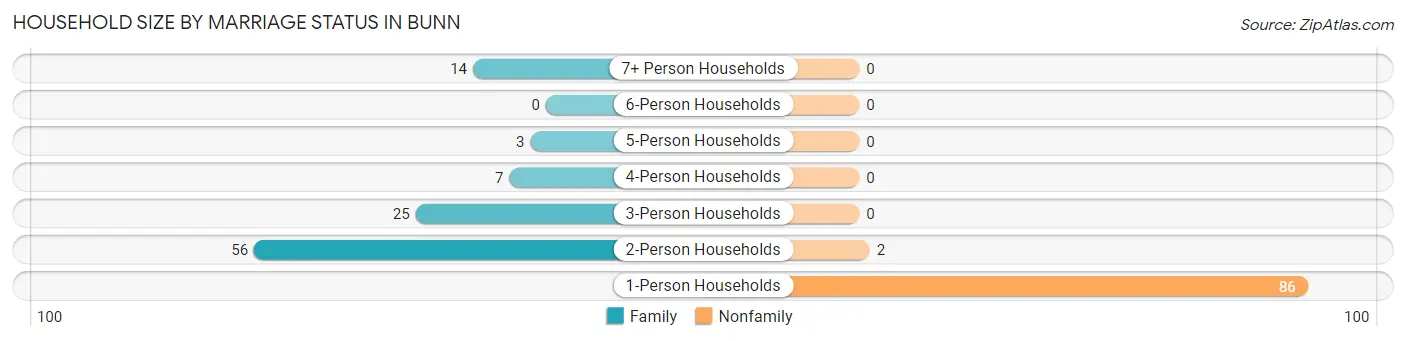
| Household Size | Family Households | Nonfamily Households |
| 1-Person Households | - | 86 (44.6%) |
| 2-Person Households | 56 (29.0%) | 2 (1.0%) |
| 3-Person Households | 25 (13.0%) | 0 (0.0%) |
| 4-Person Households | 7 (3.6%) | 0 (0.0%) |
| 5-Person Households | 3 (1.5%) | 0 (0.0%) |
| 6-Person Households | 0 (0.0%) | 0 (0.0%) |
| 7+ Person Households | 14 (7.2%) | 0 (0.0%) |
| Total | 105 (54.4%) | 88 (45.6%) |
Female Fertility in Bunn
Fertility by Age in Bunn
| Age Bracket | Women with Births | Births / 1,000 Women |
| 15 to 19 years | 0 (0.0%) | 0.0 |
| 20 to 34 years | 0 (0.0%) | 0.0 |
| 35 to 50 years | 0 (0.0%) | 0.0 |
| Total | 0 (0.0%) | 0.0 |
Fertility by Age by Marriage Status in Bunn
| Age Bracket | Married | Unmarried |
| 15 to 19 years | 0 (0.0%) | 0 (0.0%) |
| 20 to 34 years | 0 (0.0%) | 0 (0.0%) |
| 35 to 50 years | 0 (0.0%) | 0 (0.0%) |
| Total | 0 (0.0%) | 0 (0.0%) |
Fertility by Education in Bunn
| Educational Attainment | Women with Births | Births / 1,000 Women |
| Less than High School | 0 (0.0%) | 0.0 |
| High School Diploma | 0 (0.0%) | 0.0 |
| College or Associate's Degree | 0 (0.0%) | 0.0 |
| Bachelor's Degree | 0 (0.0%) | 0.0 |
| Graduate Degree | 0 (0.0%) | 0.0 |
| Total | 0 (0.0%) | 0.0 |
Fertility by Education by Marriage Status in Bunn
| Educational Attainment | Married | Unmarried |
| Less than High School | 0 (0.0%) | 0 (0.0%) |
| High School Diploma | 0 (0.0%) | 0 (0.0%) |
| College or Associate's Degree | 0 (0.0%) | 0 (0.0%) |
| Bachelor's Degree | 0 (0.0%) | 0 (0.0%) |
| Graduate Degree | 0 (0.0%) | 0 (0.0%) |
| Total | 0 (0.0%) | 0 (0.0%) |
Income in Bunn
Income Overview in Bunn
Per Capita Income in Bunn is $23,110, while median incomes of families and households are $70,852 and $50,536 respectively.
| Characteristic | Number | Measure |
| Per Capita Income | 478 | $23,110 |
| Median Family Income | 105 | $70,852 |
| Mean Family Income | 105 | $69,960 |
| Median Household Income | 193 | $50,536 |
| Mean Household Income | 193 | $51,605 |
| Income Deficit | 105 | $0 |
| Wage / Income Gap (%) | 478 | 0.92% |
| Wage / Income Gap ($) | 478 | 99.08¢ per $1 |
| Gini / Inequality Index | 478 | 0.35 |
Earnings by Sex in Bunn
Average Earnings in Bunn are $33,594, $33,438 for men and $33,750 for women, a difference of 0.9%.
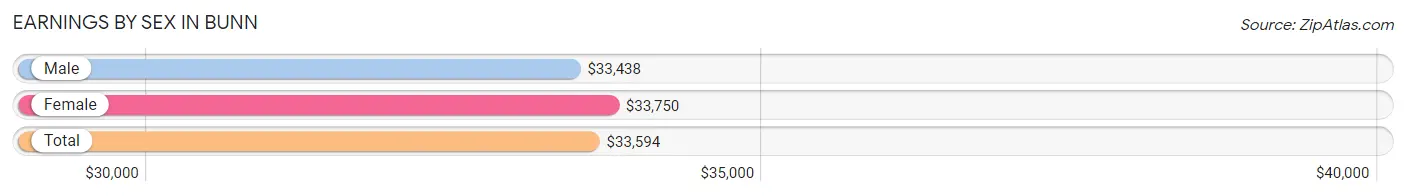
| Sex | Number | Average Earnings |
| Male | 145 (58.7%) | $33,438 |
| Female | 102 (41.3%) | $33,750 |
| Total | 247 (100.0%) | $33,594 |
Earnings by Sex by Income Bracket in Bunn
The most common earnings brackets in Bunn are $35,000 to $39,999 for men (32 | 22.1%) and $35,000 to $39,999 for women (28 | 27.5%).
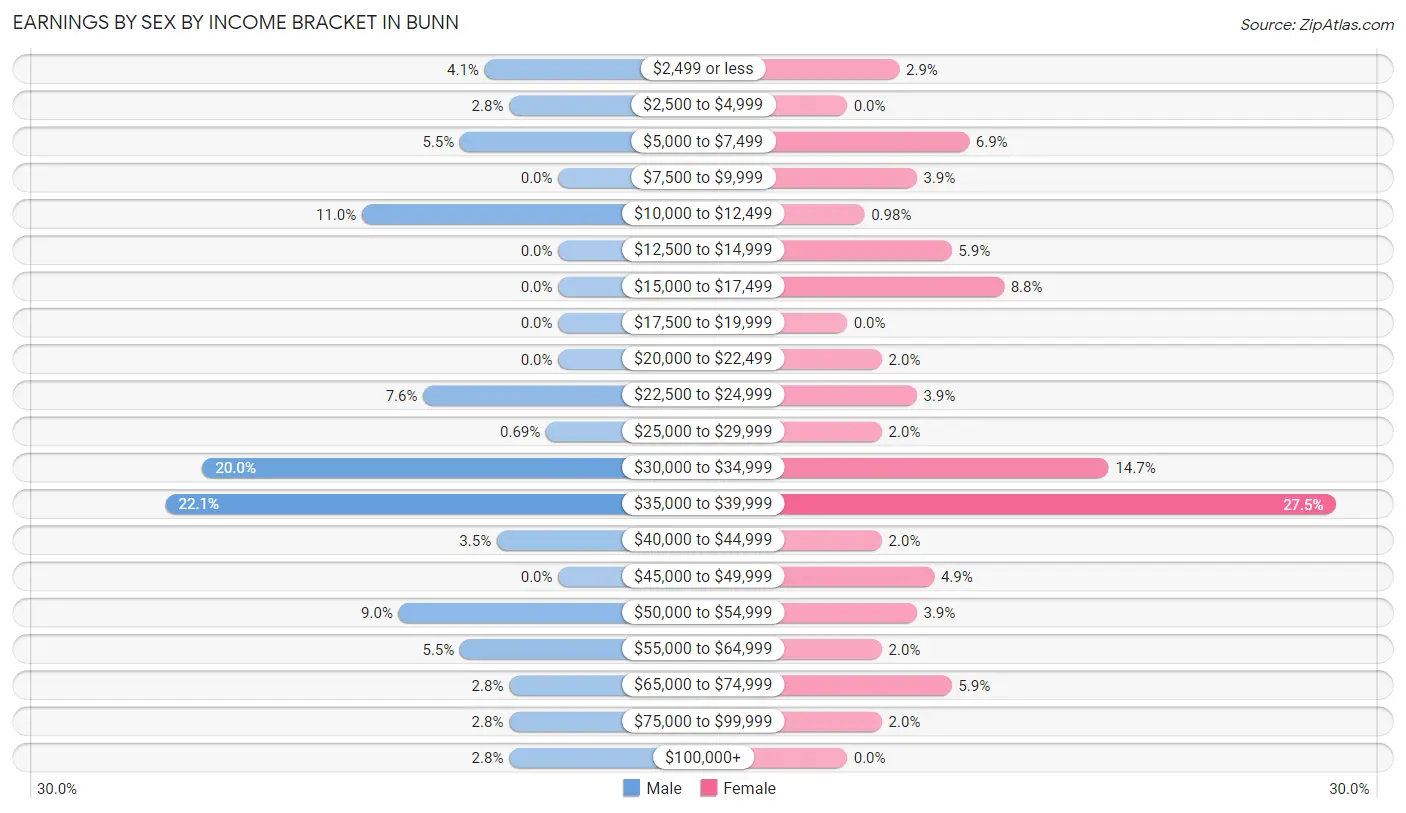
| Income | Male | Female |
| $2,499 or less | 6 (4.1%) | 3 (2.9%) |
| $2,500 to $4,999 | 4 (2.8%) | 0 (0.0%) |
| $5,000 to $7,499 | 8 (5.5%) | 7 (6.9%) |
| $7,500 to $9,999 | 0 (0.0%) | 4 (3.9%) |
| $10,000 to $12,499 | 16 (11.0%) | 1 (1.0%) |
| $12,500 to $14,999 | 0 (0.0%) | 6 (5.9%) |
| $15,000 to $17,499 | 0 (0.0%) | 9 (8.8%) |
| $17,500 to $19,999 | 0 (0.0%) | 0 (0.0%) |
| $20,000 to $22,499 | 0 (0.0%) | 2 (2.0%) |
| $22,500 to $24,999 | 11 (7.6%) | 4 (3.9%) |
| $25,000 to $29,999 | 1 (0.7%) | 2 (2.0%) |
| $30,000 to $34,999 | 29 (20.0%) | 15 (14.7%) |
| $35,000 to $39,999 | 32 (22.1%) | 28 (27.5%) |
| $40,000 to $44,999 | 5 (3.5%) | 2 (2.0%) |
| $45,000 to $49,999 | 0 (0.0%) | 5 (4.9%) |
| $50,000 to $54,999 | 13 (9.0%) | 4 (3.9%) |
| $55,000 to $64,999 | 8 (5.5%) | 2 (2.0%) |
| $65,000 to $74,999 | 4 (2.8%) | 6 (5.9%) |
| $75,000 to $99,999 | 4 (2.8%) | 2 (2.0%) |
| $100,000+ | 4 (2.8%) | 0 (0.0%) |
| Total | 145 (100.0%) | 102 (100.0%) |
Earnings by Sex by Educational Attainment in Bunn
Average earnings in Bunn are $35,375 for men and $35,208 for women, a difference of 0.5%. Men with an educational attainment of bachelor's degree enjoy the highest average annual earnings of $61,000, while those with less than high school education earn the least with $31,359. Women with an educational attainment of bachelor's degree earn the most with the average annual earnings of $36,193, while those with less than high school education have the smallest earnings of $31,125.
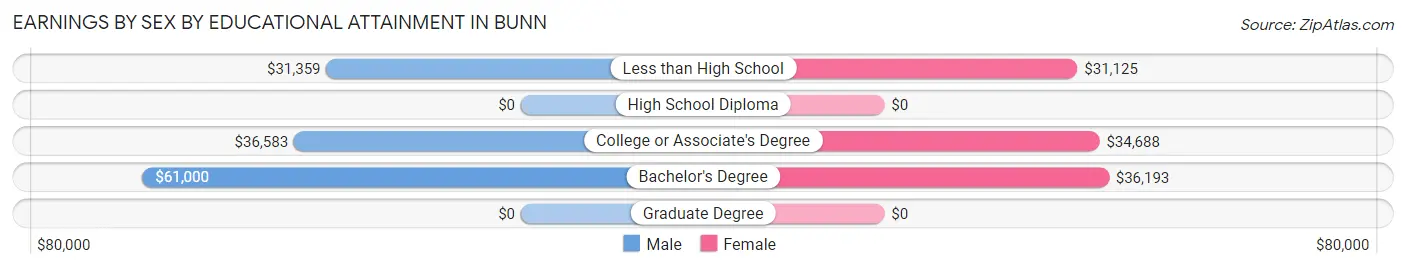
| Educational Attainment | Male Income | Female Income |
| Less than High School | $31,359 | $31,125 |
| High School Diploma | - | - |
| College or Associate's Degree | $36,583 | $34,688 |
| Bachelor's Degree | $61,000 | $36,193 |
| Graduate Degree | - | - |
| Total | $35,375 | $35,208 |
Family Income in Bunn
Family Income Brackets in Bunn
According to the Bunn family income data, there are 50 families falling into the $50,000 to $74,999 income range, which is the most common income bracket and makes up 47.6% of all families.
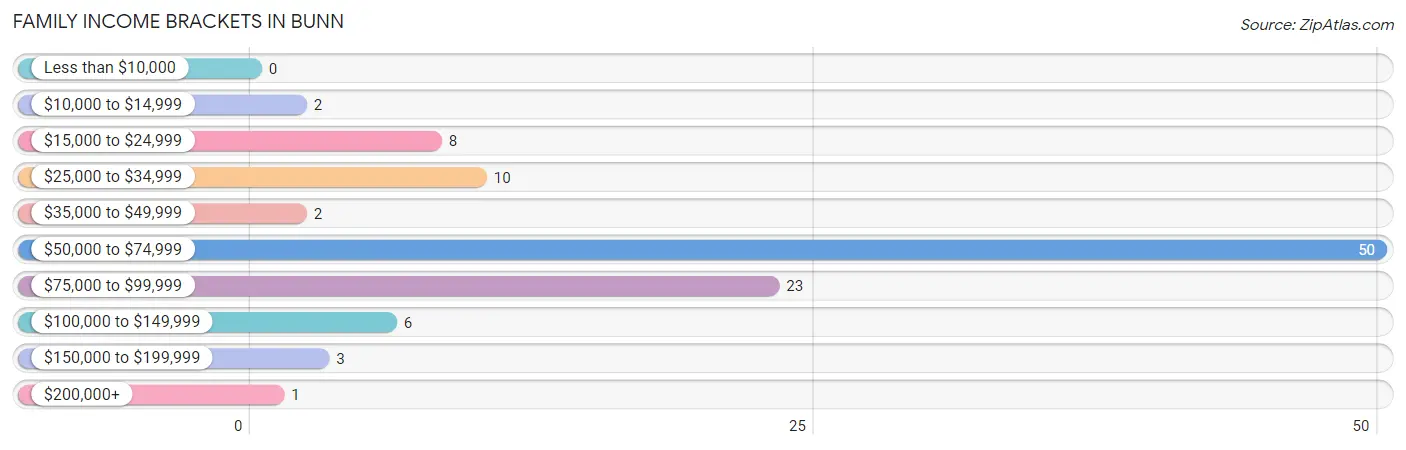
| Income Bracket | # Families | % Families |
| Less than $10,000 | 0 | 0.0% |
| $10,000 to $14,999 | 2 | 1.9% |
| $15,000 to $24,999 | 8 | 7.6% |
| $25,000 to $34,999 | 10 | 9.5% |
| $35,000 to $49,999 | 2 | 1.9% |
| $50,000 to $74,999 | 50 | 47.6% |
| $75,000 to $99,999 | 23 | 21.9% |
| $100,000 to $149,999 | 6 | 5.7% |
| $150,000 to $199,999 | 3 | 2.9% |
| $200,000+ | 1 | 1.0% |
Family Income by Famaliy Size in Bunn
3-person families (23 | 21.9%) account for the highest median family income in Bunn with $86,023 per family, while 2-person families (58 | 55.2%) have the highest median income of $35,170 per family member.
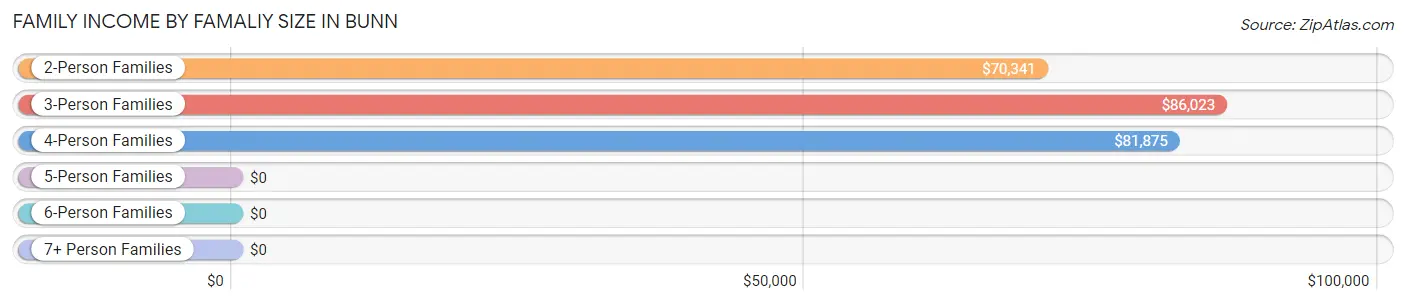
| Income Bracket | # Families | Median Income |
| 2-Person Families | 58 (55.2%) | $70,341 |
| 3-Person Families | 23 (21.9%) | $86,023 |
| 4-Person Families | 7 (6.7%) | $81,875 |
| 5-Person Families | 3 (2.9%) | $0 |
| 6-Person Families | 0 (0.0%) | $0 |
| 7+ Person Families | 14 (13.3%) | $0 |
| Total | 105 (100.0%) | $70,852 |
Family Income by Number of Earners in Bunn
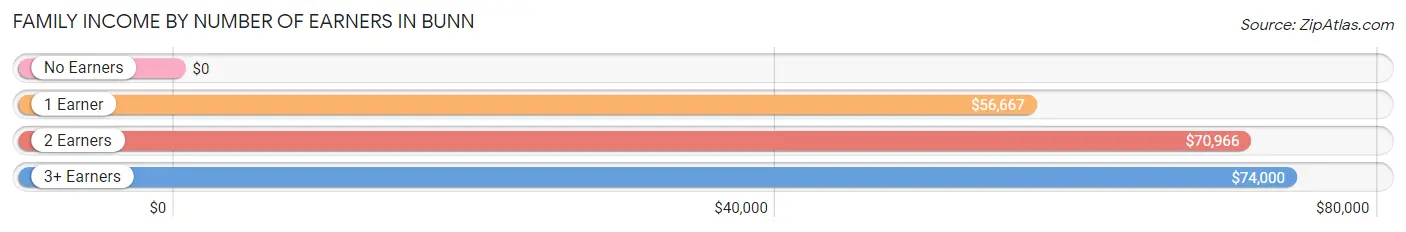
| Number of Earners | # Families | Median Income |
| No Earners | 10 (9.5%) | $0 |
| 1 Earner | 24 (22.9%) | $56,667 |
| 2 Earners | 57 (54.3%) | $70,966 |
| 3+ Earners | 14 (13.3%) | $74,000 |
| Total | 105 (100.0%) | $70,852 |
Household Income in Bunn
Household Income Brackets in Bunn
With 58 households falling in the category, the $50,000 to $74,999 income range is the most frequent in Bunn, accounting for 30.0% of all households. In contrast, only 1 households (0.5%) fall into the less than $10,000 income bracket, making it the least populous group.
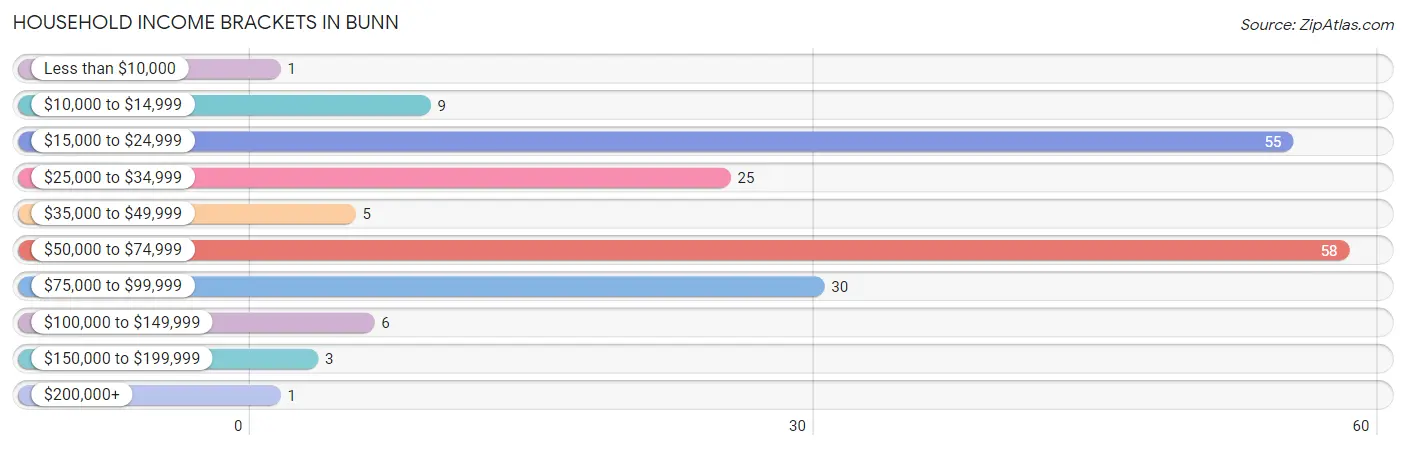
| Income Bracket | # Households | % Households |
| Less than $10,000 | 1 | 0.5% |
| $10,000 to $14,999 | 9 | 4.7% |
| $15,000 to $24,999 | 55 | 28.5% |
| $25,000 to $34,999 | 25 | 13.0% |
| $35,000 to $49,999 | 5 | 2.6% |
| $50,000 to $74,999 | 58 | 30.1% |
| $75,000 to $99,999 | 30 | 15.5% |
| $100,000 to $149,999 | 6 | 3.1% |
| $150,000 to $199,999 | 3 | 1.6% |
| $200,000+ | 1 | 0.5% |
Household Income by Householder Age in Bunn
The median household income in Bunn is $50,536, with the highest median household income of $64,808 found in the 45 to 64 years age bracket for the primary householder. A total of 78 households (40.4%) fall into this category. Meanwhile, the 15 to 24 years age bracket for the primary householder has the lowest median household income of $0, with 3 households (1.5%) in this group.
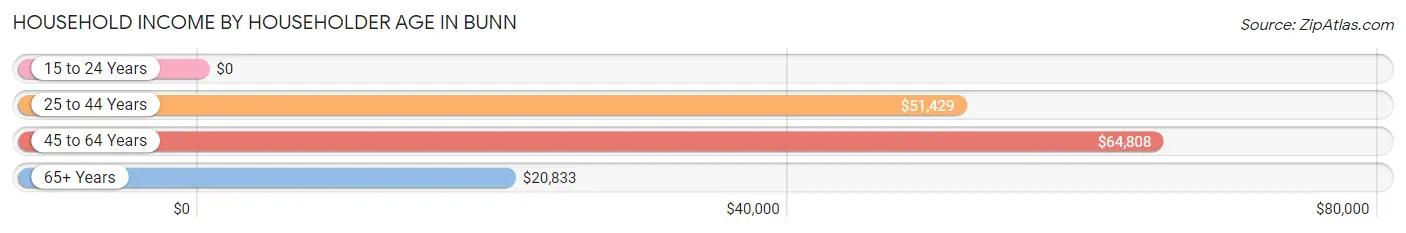
| Income Bracket | # Households | Median Income |
| 15 to 24 Years | 3 (1.5%) | $0 |
| 25 to 44 Years | 36 (18.6%) | $51,429 |
| 45 to 64 Years | 78 (40.4%) | $64,808 |
| 65+ Years | 76 (39.4%) | $20,833 |
| Total | 193 (100.0%) | $50,536 |
Poverty in Bunn
Income Below Poverty by Sex and Age in Bunn
With 5.3% poverty level for males and 4.3% for females among the residents of Bunn, 6 to 11 year old males and 65 to 74 year old females are the most vulnerable to poverty, with 2 males (33.3%) and 4 females (16.0%) in their respective age groups living below the poverty level.
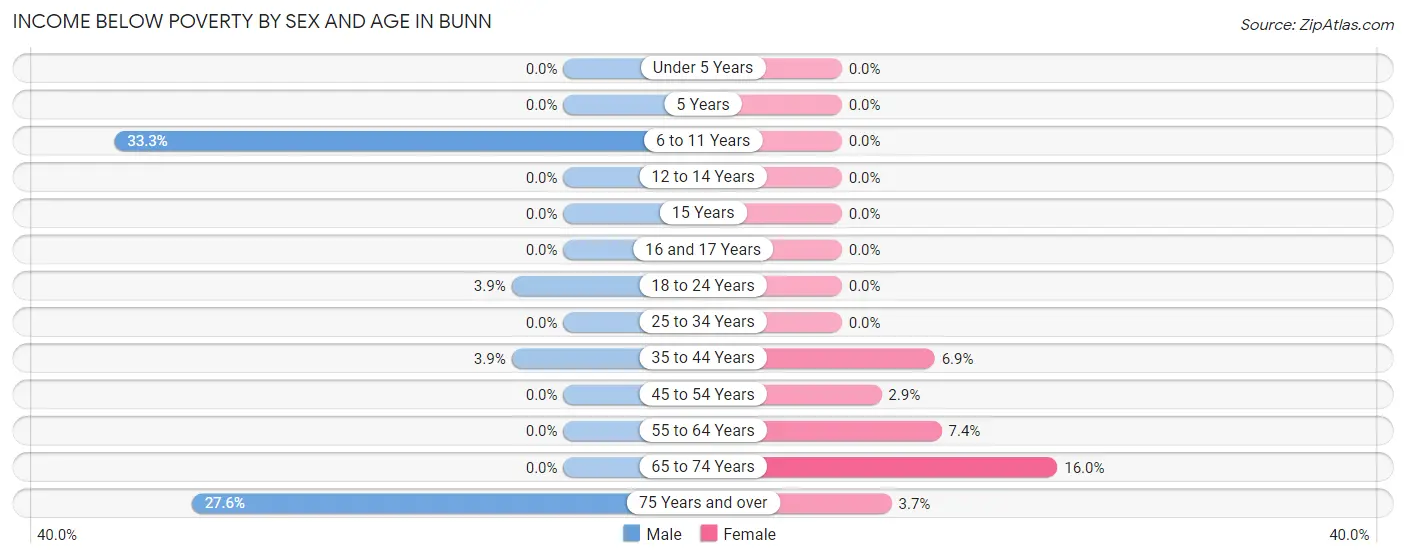
| Age Bracket | Male | Female |
| Under 5 Years | 0 (0.0%) | 0 (0.0%) |
| 5 Years | 0 (0.0%) | 0 (0.0%) |
| 6 to 11 Years | 2 (33.3%) | 0 (0.0%) |
| 12 to 14 Years | 0 (0.0%) | 0 (0.0%) |
| 15 Years | 0 (0.0%) | 0 (0.0%) |
| 16 and 17 Years | 0 (0.0%) | 0 (0.0%) |
| 18 to 24 Years | 1 (3.8%) | 0 (0.0%) |
| 25 to 34 Years | 0 (0.0%) | 0 (0.0%) |
| 35 to 44 Years | 2 (3.8%) | 2 (6.9%) |
| 45 to 54 Years | 0 (0.0%) | 1 (2.9%) |
| 55 to 64 Years | 0 (0.0%) | 2 (7.4%) |
| 65 to 74 Years | 0 (0.0%) | 4 (16.0%) |
| 75 Years and over | 8 (27.6%) | 1 (3.7%) |
| Total | 13 (5.3%) | 10 (4.3%) |
Income Above Poverty by Sex and Age in Bunn
According to the poverty statistics in Bunn, males aged under 5 years and females aged under 5 years are the age groups that are most secure financially, with 100.0% of males and 100.0% of females in these age groups living above the poverty line.
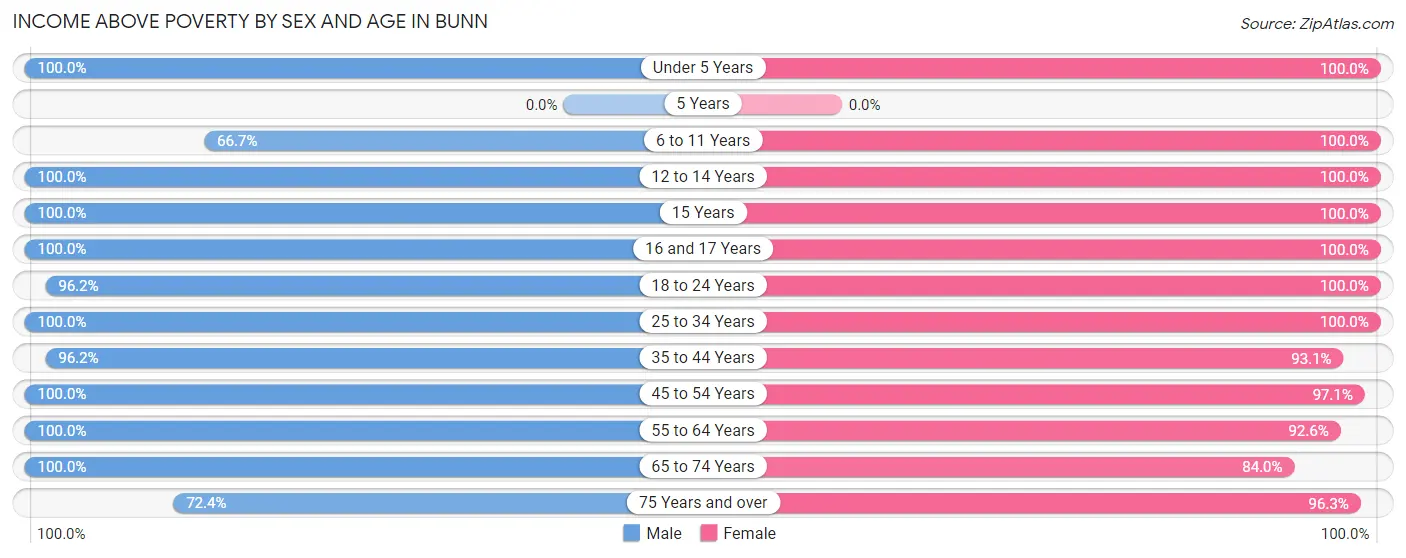
| Age Bracket | Male | Female |
| Under 5 Years | 16 (100.0%) | 17 (100.0%) |
| 5 Years | 0 (0.0%) | 0 (0.0%) |
| 6 to 11 Years | 4 (66.7%) | 18 (100.0%) |
| 12 to 14 Years | 5 (100.0%) | 32 (100.0%) |
| 15 Years | 1 (100.0%) | 2 (100.0%) |
| 16 and 17 Years | 3 (100.0%) | 4 (100.0%) |
| 18 to 24 Years | 25 (96.2%) | 9 (100.0%) |
| 25 to 34 Years | 38 (100.0%) | 9 (100.0%) |
| 35 to 44 Years | 50 (96.2%) | 27 (93.1%) |
| 45 to 54 Years | 28 (100.0%) | 33 (97.1%) |
| 55 to 64 Years | 33 (100.0%) | 25 (92.6%) |
| 65 to 74 Years | 8 (100.0%) | 21 (84.0%) |
| 75 Years and over | 21 (72.4%) | 26 (96.3%) |
| Total | 232 (94.7%) | 223 (95.7%) |
Income Below Poverty Among Married-Couple Families in Bunn
The poverty statistics for married-couple families in Bunn show that 4.0% or 3 of the total 76 families live below the poverty line. Families with no children have the highest poverty rate of 5.4%, comprising of 3 families. On the other hand, families with 1 or 2 children have the lowest poverty rate of 0.0%, which includes 0 families.
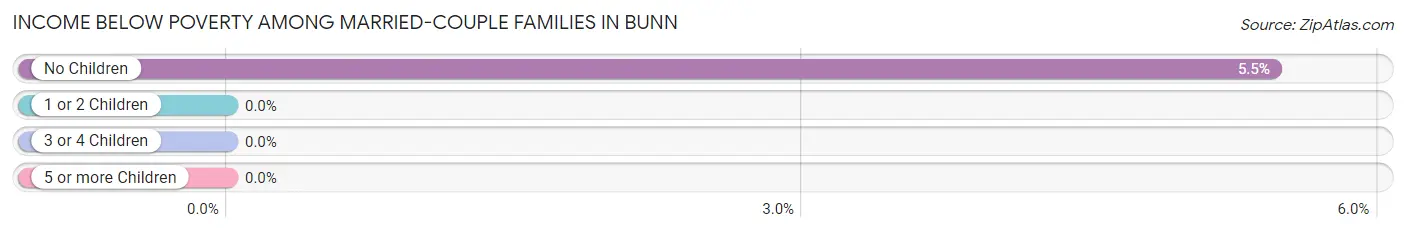
| Children | Above Poverty | Below Poverty |
| No Children | 52 (94.6%) | 3 (5.4%) |
| 1 or 2 Children | 7 (100.0%) | 0 (0.0%) |
| 3 or 4 Children | 1 (100.0%) | 0 (0.0%) |
| 5 or more Children | 13 (100.0%) | 0 (0.0%) |
| Total | 73 (96.1%) | 3 (4.0%) |
Income Below Poverty Among Single-Parent Households in Bunn
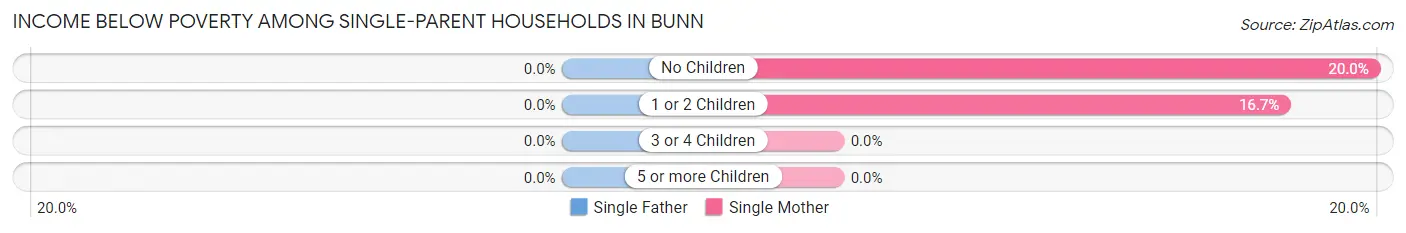
| Children | Single Father | Single Mother |
| No Children | 0 (0.0%) | 2 (20.0%) |
| 1 or 2 Children | 0 (0.0%) | 2 (16.7%) |
| 3 or 4 Children | 0 (0.0%) | 0 (0.0%) |
| 5 or more Children | 0 (0.0%) | 0 (0.0%) |
| Total | 0 (0.0%) | 4 (18.2%) |
Income Below Poverty Among Married-Couple vs Single-Parent Households in Bunn
The poverty data for Bunn shows that 3 of the married-couple family households (4.0%) and 4 of the single-parent households (13.8%) are living below the poverty level. Within the married-couple family households, those with no children have the highest poverty rate, with 3 households (5.4%) falling below the poverty line. Among the single-parent households, those with 1 or 2 children have the highest poverty rate, with 2 household (16.7%) living below poverty.
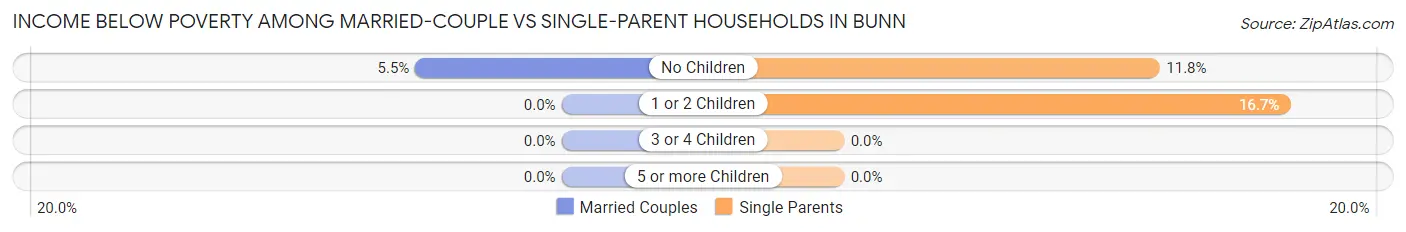
| Children | Married-Couple Families | Single-Parent Households |
| No Children | 3 (5.4%) | 2 (11.8%) |
| 1 or 2 Children | 0 (0.0%) | 2 (16.7%) |
| 3 or 4 Children | 0 (0.0%) | 0 (0.0%) |
| 5 or more Children | 0 (0.0%) | 0 (0.0%) |
| Total | 3 (4.0%) | 4 (13.8%) |
Employment Characteristics in Bunn
Employment by Class of Employer in Bunn
Among the 236 employed individuals in Bunn, private company employees (166 | 70.3%), self-employed (not incorporated) (34 | 14.4%), and not-for-profit organizations (18 | 7.6%) make up the most common classes of employment.

| Employer Class | # Employees | % Employees |
| Private Company Employees | 166 | 70.3% |
| Self-Employed (Incorporated) | 0 | 0.0% |
| Self-Employed (Not Incorporated) | 34 | 14.4% |
| Not-for-profit Organizations | 18 | 7.6% |
| Local Government Employees | 5 | 2.1% |
| State Government Employees | 7 | 3.0% |
| Federal Government Employees | 6 | 2.5% |
| Unpaid Family Workers | 0 | 0.0% |
| Total | 236 | 100.0% |
Employment Status by Age in Bunn
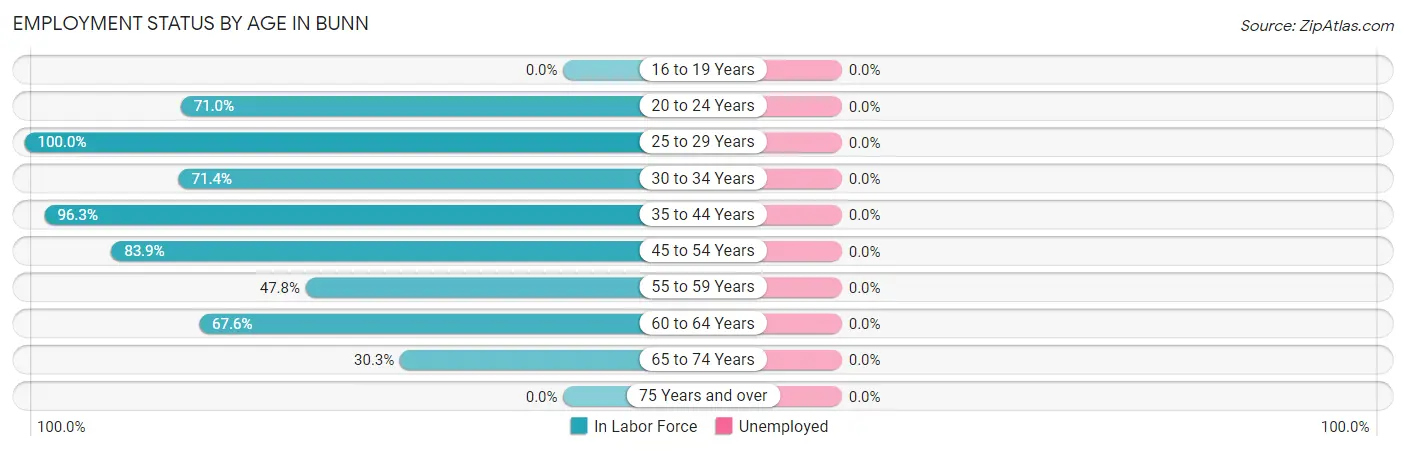
| Age Bracket | In Labor Force | Unemployed |
| 16 to 19 Years | 0 (0.0%) | 0 (0.0%) |
| 20 to 24 Years | 22 (71.0%) | 0 (0.0%) |
| 25 to 29 Years | 40 (100.0%) | 0 (0.0%) |
| 30 to 34 Years | 5 (71.4%) | 0 (0.0%) |
| 35 to 44 Years | 78 (96.3%) | 0 (0.0%) |
| 45 to 54 Years | 52 (83.9%) | 0 (0.0%) |
| 55 to 59 Years | 11 (47.8%) | 0 (0.0%) |
| 60 to 64 Years | 25 (67.6%) | 0 (0.0%) |
| 65 to 74 Years | 10 (30.3%) | 0 (0.0%) |
| 75 Years and over | 0 (0.0%) | 0 (0.0%) |
| Total | 243 (63.8%) | 0 (0.0%) |
Employment Status by Educational Attainment in Bunn
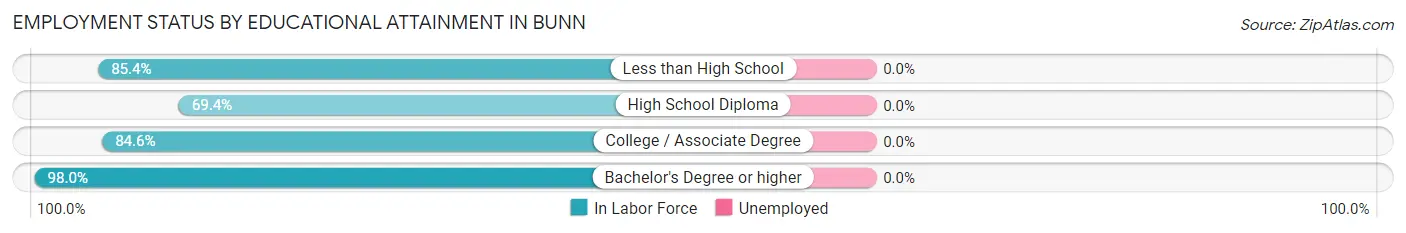
| Educational Attainment | In Labor Force | Unemployed |
| Less than High School | 41 (85.4%) | 0 (0.0%) |
| High School Diploma | 34 (69.4%) | 0 (0.0%) |
| College / Associate Degree | 88 (84.6%) | 0 (0.0%) |
| Bachelor's Degree or higher | 48 (98.0%) | 0 (0.0%) |
| Total | 211 (84.4%) | 0 (0.0%) |
Employment Occupations by Sex in Bunn
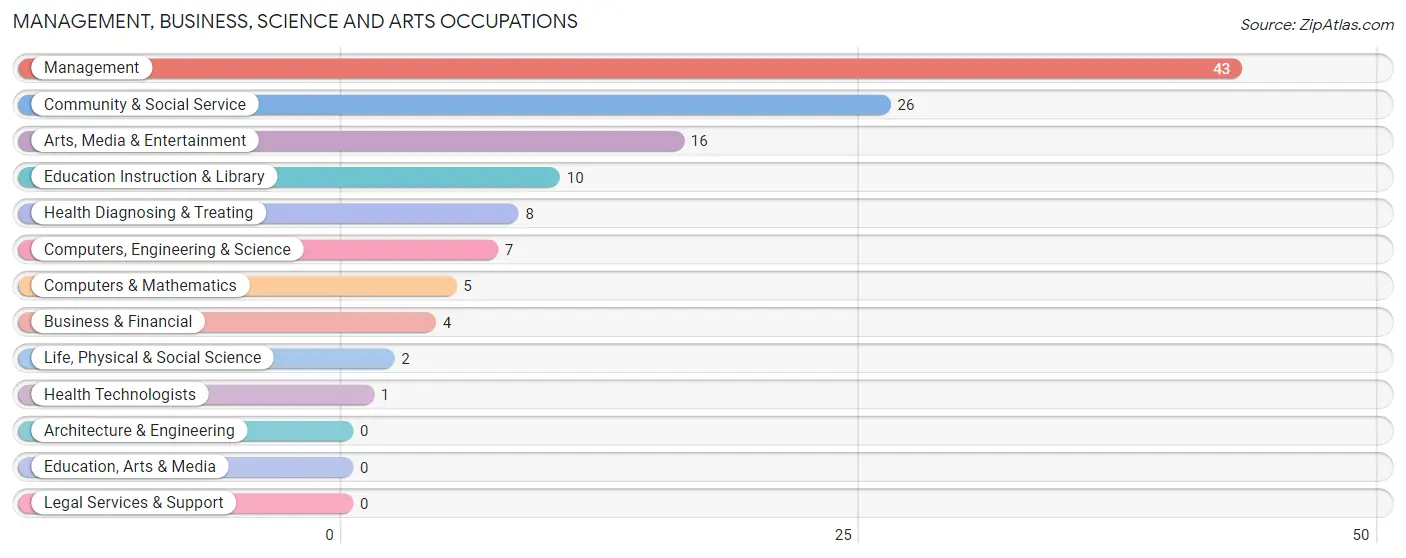
Management, Business, Science and Arts Occupations
The most common Management, Business, Science and Arts occupations in Bunn are Management (43 | 17.7%), Community & Social Service (26 | 10.7%), Arts, Media & Entertainment (16 | 6.6%), Education Instruction & Library (10 | 4.1%), and Health Diagnosing & Treating (8 | 3.3%).
Management, Business, Science and Arts Occupations by Sex
Within the Management, Business, Science and Arts occupations in Bunn, the most male-oriented occupations are Computers & Mathematics (100.0%), Management (95.4%), and Arts, Media & Entertainment (87.5%), while the most female-oriented occupations are Life, Physical & Social Science (100.0%), Health Diagnosing & Treating (100.0%), and Health Technologists (100.0%).
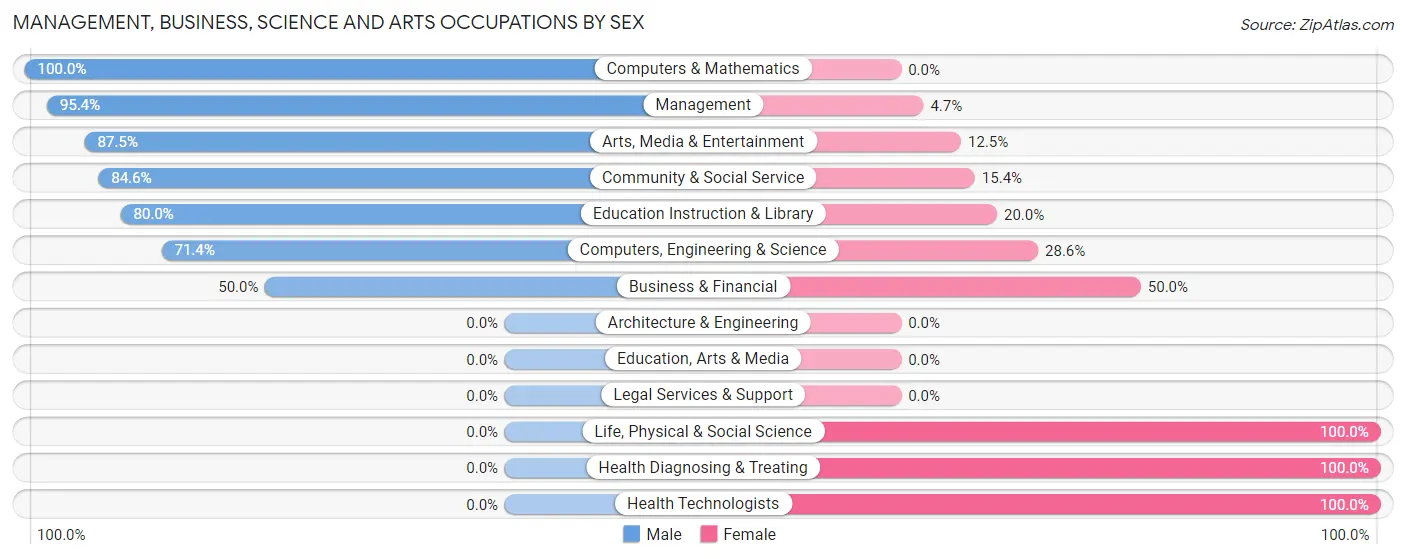
| Occupation | Male | Female |
| Management | 41 (95.4%) | 2 (4.6%) |
| Business & Financial | 2 (50.0%) | 2 (50.0%) |
| Computers, Engineering & Science | 5 (71.4%) | 2 (28.6%) |
| Computers & Mathematics | 5 (100.0%) | 0 (0.0%) |
| Architecture & Engineering | 0 (0.0%) | 0 (0.0%) |
| Life, Physical & Social Science | 0 (0.0%) | 2 (100.0%) |
| Community & Social Service | 22 (84.6%) | 4 (15.4%) |
| Education, Arts & Media | 0 (0.0%) | 0 (0.0%) |
| Legal Services & Support | 0 (0.0%) | 0 (0.0%) |
| Education Instruction & Library | 8 (80.0%) | 2 (20.0%) |
| Arts, Media & Entertainment | 14 (87.5%) | 2 (12.5%) |
| Health Diagnosing & Treating | 0 (0.0%) | 8 (100.0%) |
| Health Technologists | 0 (0.0%) | 1 (100.0%) |
| Total (Category) | 70 (79.5%) | 18 (20.4%) |
| Total (Overall) | 145 (59.7%) | 98 (40.3%) |
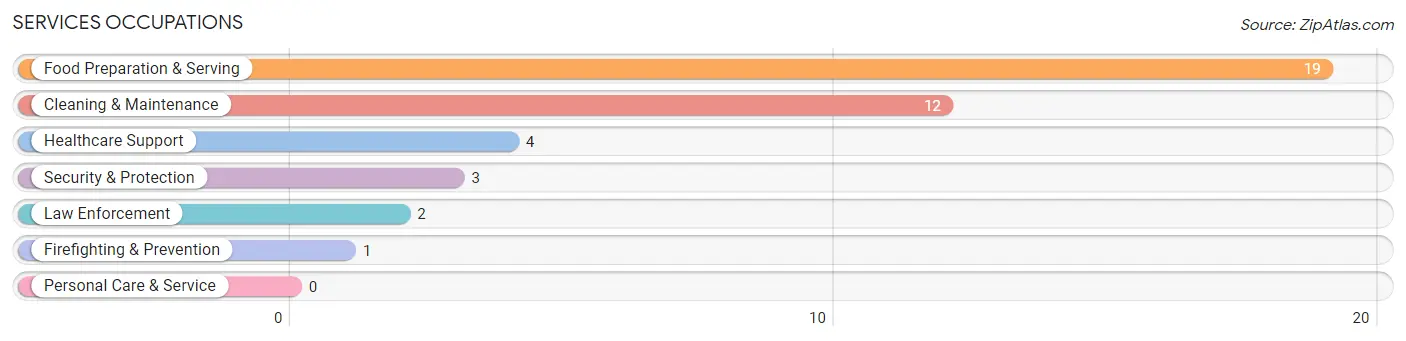
Services Occupations
The most common Services occupations in Bunn are Food Preparation & Serving (19 | 7.8%), Cleaning & Maintenance (12 | 4.9%), Healthcare Support (4 | 1.7%), Security & Protection (3 | 1.2%), and Law Enforcement (2 | 0.8%).
Services Occupations by Sex
Within the Services occupations in Bunn, the most male-oriented occupations are Law Enforcement (100.0%), Cleaning & Maintenance (91.7%), and Security & Protection (66.7%), while the most female-oriented occupations are Healthcare Support (100.0%), Firefighting & Prevention (100.0%), and Food Preparation & Serving (68.4%).
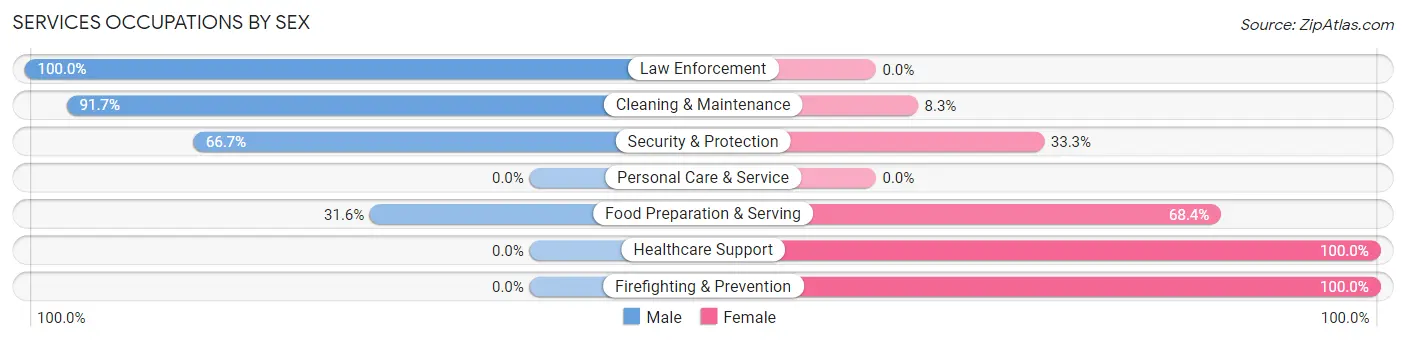
| Occupation | Male | Female |
| Healthcare Support | 0 (0.0%) | 4 (100.0%) |
| Security & Protection | 2 (66.7%) | 1 (33.3%) |
| Firefighting & Prevention | 0 (0.0%) | 1 (100.0%) |
| Law Enforcement | 2 (100.0%) | 0 (0.0%) |
| Food Preparation & Serving | 6 (31.6%) | 13 (68.4%) |
| Cleaning & Maintenance | 11 (91.7%) | 1 (8.3%) |
| Personal Care & Service | 0 (0.0%) | 0 (0.0%) |
| Total (Category) | 19 (50.0%) | 19 (50.0%) |
| Total (Overall) | 145 (59.7%) | 98 (40.3%) |
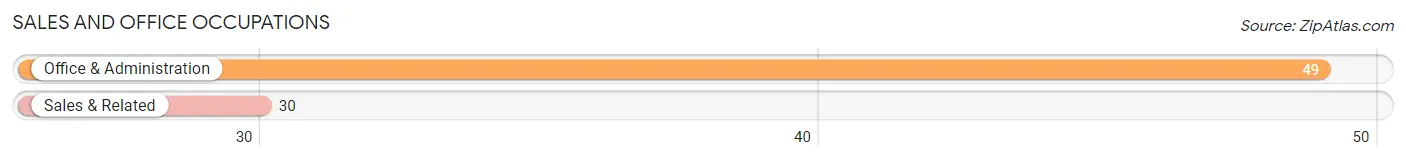
Sales and Office Occupations
The most common Sales and Office occupations in Bunn are Office & Administration (49 | 20.2%), and Sales & Related (30 | 12.3%).
Sales and Office Occupations by Sex
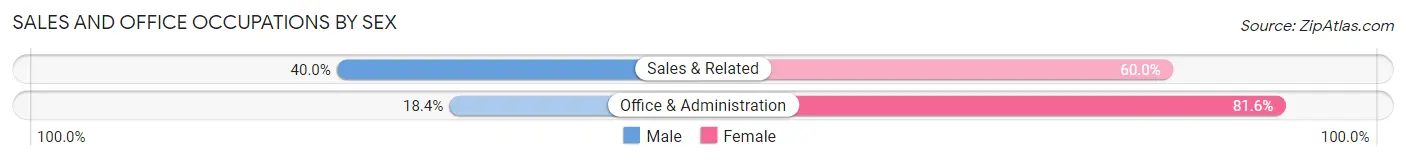
| Occupation | Male | Female |
| Sales & Related | 12 (40.0%) | 18 (60.0%) |
| Office & Administration | 9 (18.4%) | 40 (81.6%) |
| Total (Category) | 21 (26.6%) | 58 (73.4%) |
| Total (Overall) | 145 (59.7%) | 98 (40.3%) |
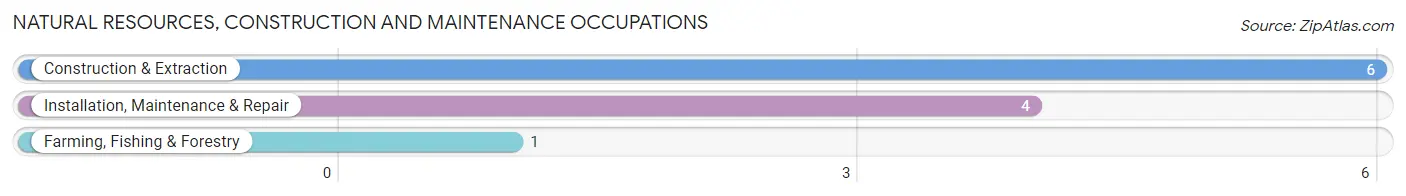
Natural Resources, Construction and Maintenance Occupations
The most common Natural Resources, Construction and Maintenance occupations in Bunn are Construction & Extraction (6 | 2.5%), Installation, Maintenance & Repair (4 | 1.7%), and Farming, Fishing & Forestry (1 | 0.4%).
Natural Resources, Construction and Maintenance Occupations by Sex
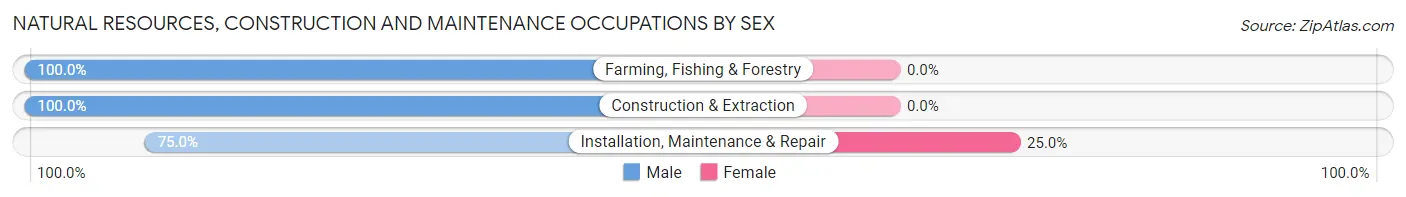
| Occupation | Male | Female |
| Farming, Fishing & Forestry | 1 (100.0%) | 0 (0.0%) |
| Construction & Extraction | 6 (100.0%) | 0 (0.0%) |
| Installation, Maintenance & Repair | 3 (75.0%) | 1 (25.0%) |
| Total (Category) | 10 (90.9%) | 1 (9.1%) |
| Total (Overall) | 145 (59.7%) | 98 (40.3%) |
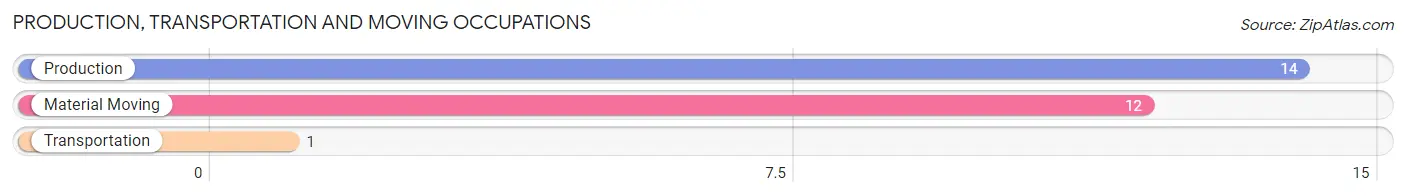
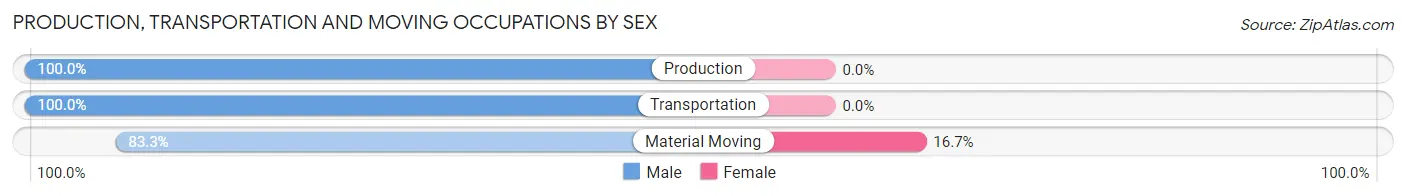
Production, Transportation and Moving Occupations
The most common Production, Transportation and Moving occupations in Bunn are Production (14 | 5.8%), Material Moving (12 | 4.9%), and Transportation (1 | 0.4%).
Production, Transportation and Moving Occupations by Sex
| Occupation | Male | Female |
| Production | 14 (100.0%) | 0 (0.0%) |
| Transportation | 1 (100.0%) | 0 (0.0%) |
| Material Moving | 10 (83.3%) | 2 (16.7%) |
| Total (Category) | 25 (92.6%) | 2 (7.4%) |
| Total (Overall) | 145 (59.7%) | 98 (40.3%) |
Employment Industries by Sex in Bunn
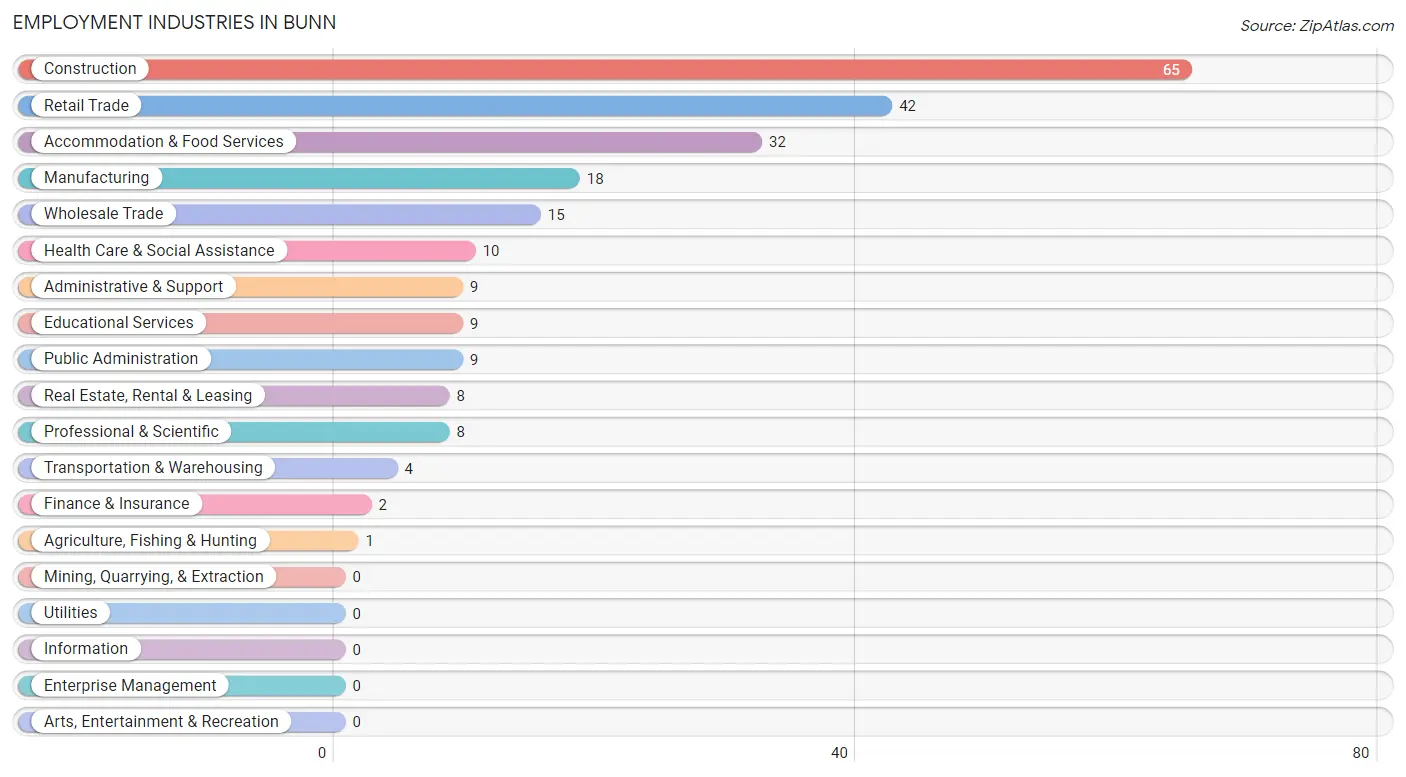
Employment Industries in Bunn
The major employment industries in Bunn include Construction (65 | 26.8%), Retail Trade (42 | 17.3%), Accommodation & Food Services (32 | 13.2%), Manufacturing (18 | 7.4%), and Wholesale Trade (15 | 6.2%).
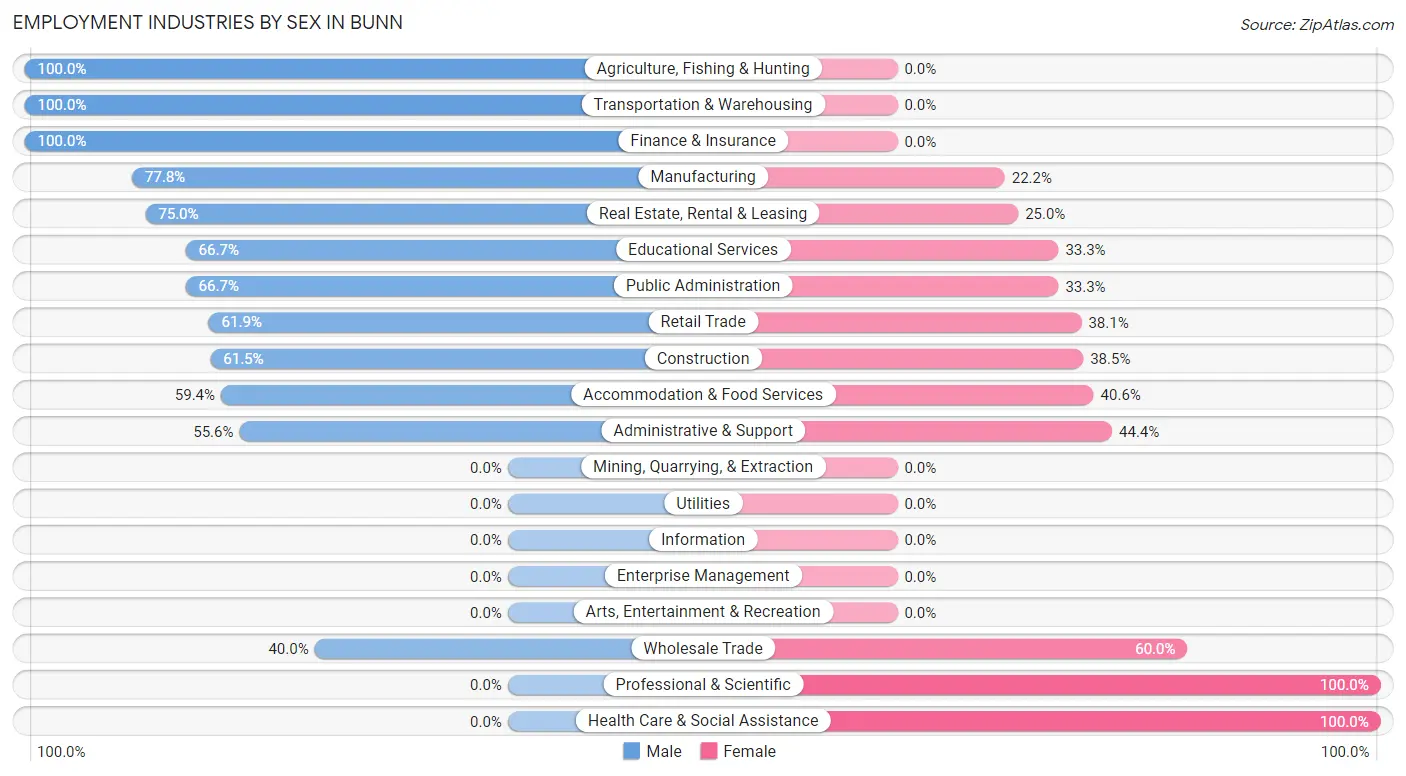
Employment Industries by Sex in Bunn
The Bunn industries that see more men than women are Agriculture, Fishing & Hunting (100.0%), Transportation & Warehousing (100.0%), and Finance & Insurance (100.0%), whereas the industries that tend to have a higher number of women are Professional & Scientific (100.0%), Health Care & Social Assistance (100.0%), and Wholesale Trade (60.0%).
| Industry | Male | Female |
| Agriculture, Fishing & Hunting | 1 (100.0%) | 0 (0.0%) |
| Mining, Quarrying, & Extraction | 0 (0.0%) | 0 (0.0%) |
| Construction | 40 (61.5%) | 25 (38.5%) |
| Manufacturing | 14 (77.8%) | 4 (22.2%) |
| Wholesale Trade | 6 (40.0%) | 9 (60.0%) |
| Retail Trade | 26 (61.9%) | 16 (38.1%) |
| Transportation & Warehousing | 4 (100.0%) | 0 (0.0%) |
| Utilities | 0 (0.0%) | 0 (0.0%) |
| Information | 0 (0.0%) | 0 (0.0%) |
| Finance & Insurance | 2 (100.0%) | 0 (0.0%) |
| Real Estate, Rental & Leasing | 6 (75.0%) | 2 (25.0%) |
| Professional & Scientific | 0 (0.0%) | 8 (100.0%) |
| Enterprise Management | 0 (0.0%) | 0 (0.0%) |
| Administrative & Support | 5 (55.6%) | 4 (44.4%) |
| Educational Services | 6 (66.7%) | 3 (33.3%) |
| Health Care & Social Assistance | 0 (0.0%) | 10 (100.0%) |
| Arts, Entertainment & Recreation | 0 (0.0%) | 0 (0.0%) |
| Accommodation & Food Services | 19 (59.4%) | 13 (40.6%) |
| Public Administration | 6 (66.7%) | 3 (33.3%) |
| Total | 145 (59.7%) | 98 (40.3%) |
Education in Bunn
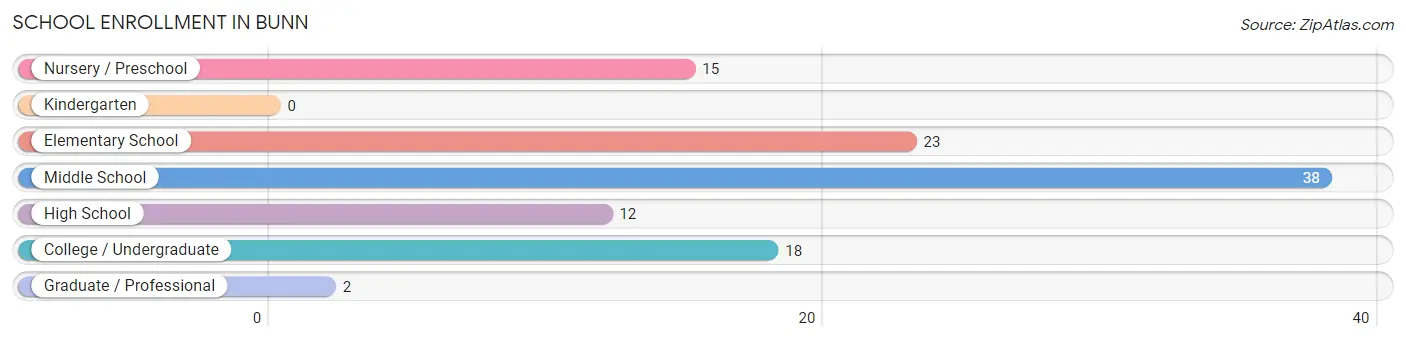
School Enrollment in Bunn
The most common levels of schooling among the 108 students in Bunn are middle school (38 | 35.2%), elementary school (23 | 21.3%), and college / undergraduate (18 | 16.7%).
| School Level | # Students | % Students |
| Nursery / Preschool | 15 | 13.9% |
| Kindergarten | 0 | 0.0% |
| Elementary School | 23 | 21.3% |
| Middle School | 38 | 35.2% |
| High School | 12 | 11.1% |
| College / Undergraduate | 18 | 16.7% |
| Graduate / Professional | 2 | 1.8% |
| Total | 108 | 100.0% |
School Enrollment by Age by Funding Source in Bunn
Out of a total of 108 students who are enrolled in schools in Bunn, 20 (18.5%) attend a private institution, while the remaining 88 (81.5%) are enrolled in public schools. The age group of 35 years and over has the highest likelihood of being enrolled in private schools, with 6 (66.7% in the age bracket) enrolled. Conversely, the age group of 3 to 4 year olds has the lowest likelihood of being enrolled in a private school, with 15 (100.0% in the age bracket) attending a public institution.
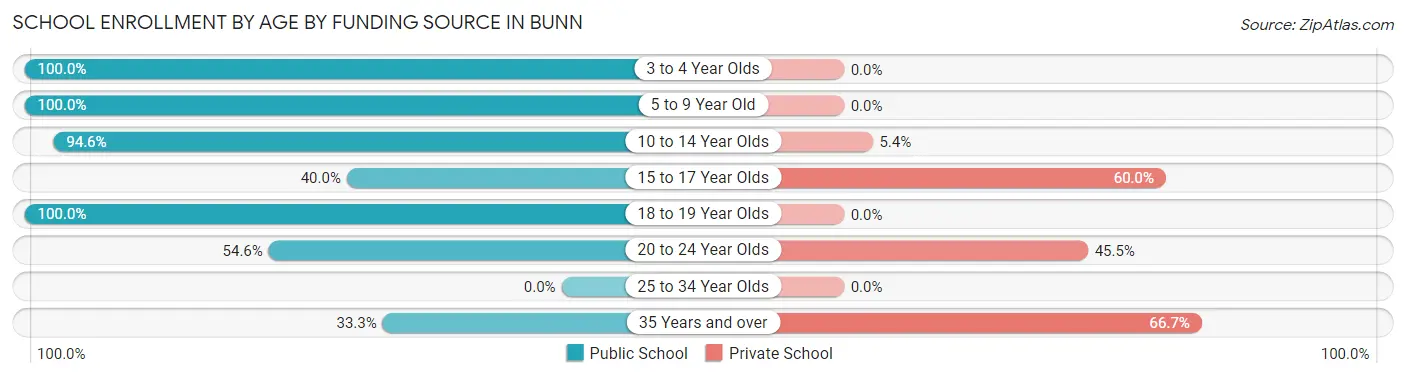
| Age Bracket | Public School | Private School |
| 3 to 4 Year Olds | 15 (100.0%) | 0 (0.0%) |
| 5 to 9 Year Old | 5 (100.0%) | 0 (0.0%) |
| 10 to 14 Year Olds | 53 (94.6%) | 3 (5.4%) |
| 15 to 17 Year Olds | 4 (40.0%) | 6 (60.0%) |
| 18 to 19 Year Olds | 2 (100.0%) | 0 (0.0%) |
| 20 to 24 Year Olds | 6 (54.5%) | 5 (45.5%) |
| 25 to 34 Year Olds | 0 (0.0%) | 0 (0.0%) |
| 35 Years and over | 3 (33.3%) | 6 (66.7%) |
| Total | 88 (81.5%) | 20 (18.5%) |
Educational Attainment by Field of Study in Bunn
Visual & performing arts (26 | 40.6%), business (12 | 18.8%), arts & humanities (8 | 12.5%), social sciences (5 | 7.8%), and liberal arts & history (5 | 7.8%) are the most common fields of study among 64 individuals in Bunn who have obtained a bachelor's degree or higher.
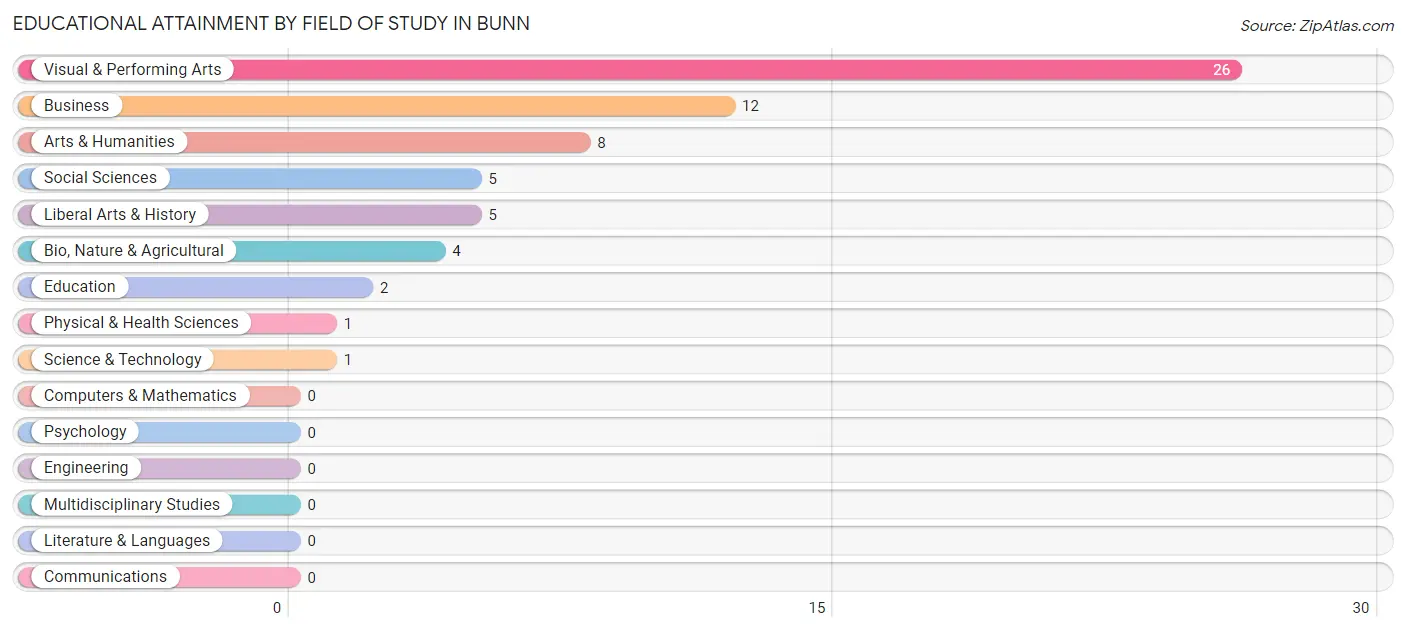
| Field of Study | # Graduates | % Graduates |
| Computers & Mathematics | 0 | 0.0% |
| Bio, Nature & Agricultural | 4 | 6.2% |
| Physical & Health Sciences | 1 | 1.6% |
| Psychology | 0 | 0.0% |
| Social Sciences | 5 | 7.8% |
| Engineering | 0 | 0.0% |
| Multidisciplinary Studies | 0 | 0.0% |
| Science & Technology | 1 | 1.6% |
| Business | 12 | 18.8% |
| Education | 2 | 3.1% |
| Literature & Languages | 0 | 0.0% |
| Liberal Arts & History | 5 | 7.8% |
| Visual & Performing Arts | 26 | 40.6% |
| Communications | 0 | 0.0% |
| Arts & Humanities | 8 | 12.5% |
| Total | 64 | 100.0% |
Transportation & Commute in Bunn
Vehicle Availability by Sex in Bunn
The most prevalent vehicle ownership categories in Bunn are males with 4 vehicles (55, accounting for 39.6%) and females with 4 vehicles (31, making up 56.7%).
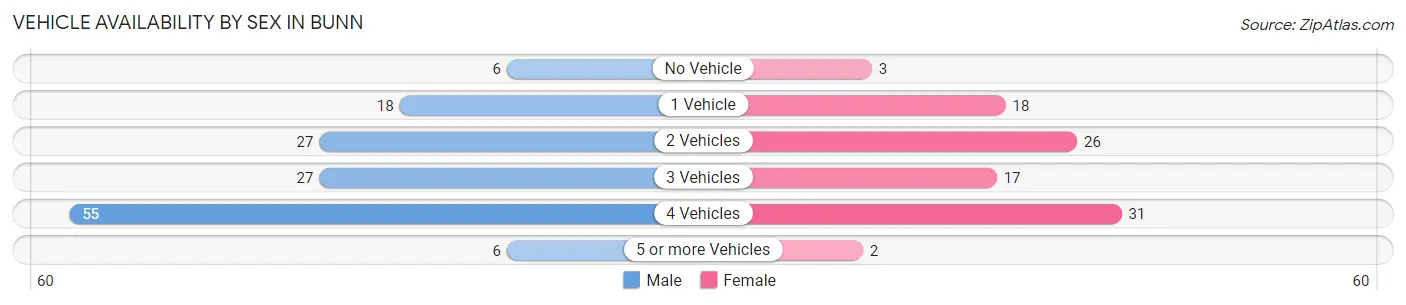
| Vehicles Available | Male | Female |
| No Vehicle | 6 (4.3%) | 3 (3.1%) |
| 1 Vehicle | 18 (13.0%) | 18 (18.6%) |
| 2 Vehicles | 27 (19.4%) | 26 (26.8%) |
| 3 Vehicles | 27 (19.4%) | 17 (17.5%) |
| 4 Vehicles | 55 (39.6%) | 31 (32.0%) |
| 5 or more Vehicles | 6 (4.3%) | 2 (2.1%) |
| Total | 139 (100.0%) | 97 (100.0%) |
Commute Time in Bunn
The most frequently occuring commute durations in Bunn are 35 to 39 minutes (30 commuters, 14.6%), less than 5 minutes (25 commuters, 12.2%), and 30 to 34 minutes (25 commuters, 12.2%).
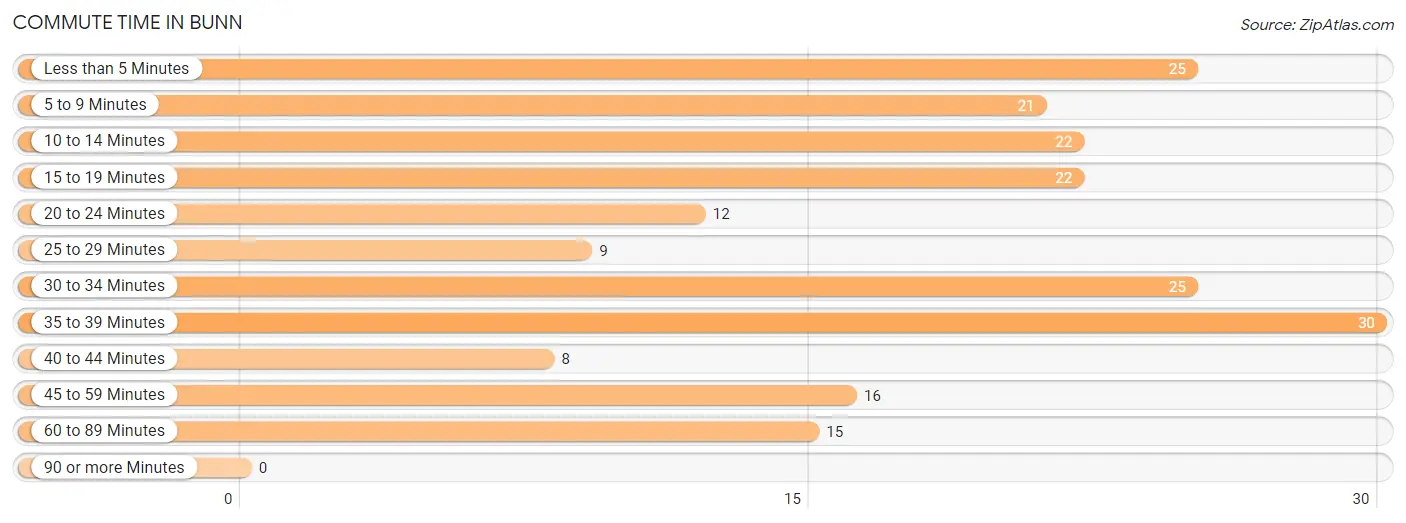
| Commute Time | # Commuters | % Commuters |
| Less than 5 Minutes | 25 | 12.2% |
| 5 to 9 Minutes | 21 | 10.2% |
| 10 to 14 Minutes | 22 | 10.7% |
| 15 to 19 Minutes | 22 | 10.7% |
| 20 to 24 Minutes | 12 | 5.9% |
| 25 to 29 Minutes | 9 | 4.4% |
| 30 to 34 Minutes | 25 | 12.2% |
| 35 to 39 Minutes | 30 | 14.6% |
| 40 to 44 Minutes | 8 | 3.9% |
| 45 to 59 Minutes | 16 | 7.8% |
| 60 to 89 Minutes | 15 | 7.3% |
| 90 or more Minutes | 0 | 0.0% |
Commute Time by Sex in Bunn
The most common commute times in Bunn are 35 to 39 minutes (30 commuters, 21.7%) for males and 45 to 59 minutes (16 commuters, 23.9%) for females.
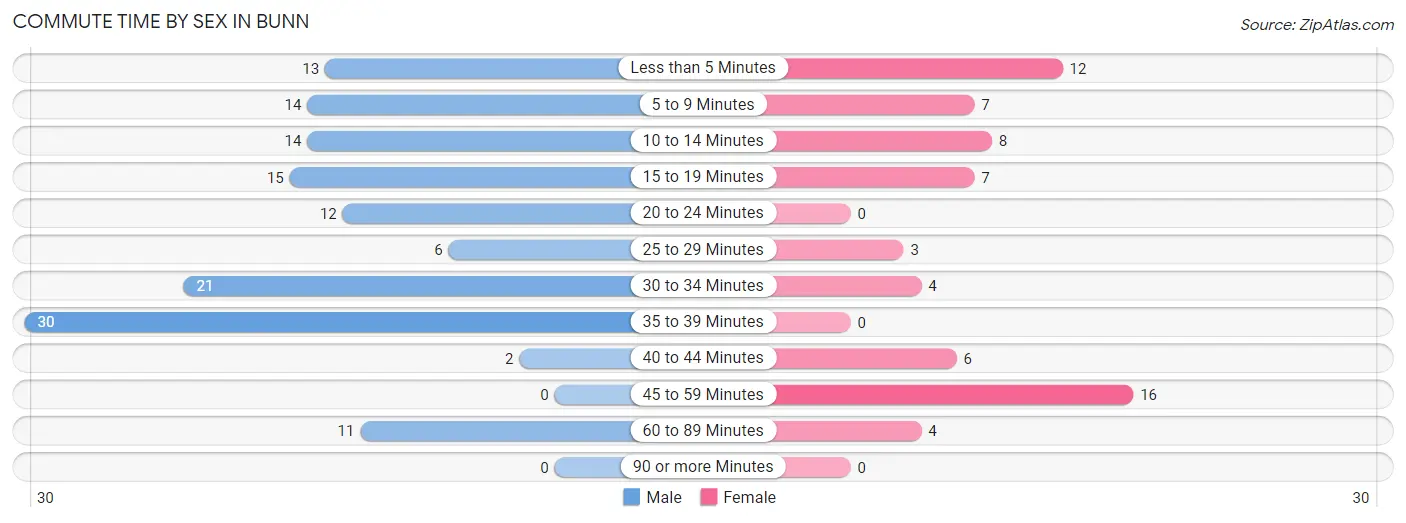
| Commute Time | Male | Female |
| Less than 5 Minutes | 13 (9.4%) | 12 (17.9%) |
| 5 to 9 Minutes | 14 (10.1%) | 7 (10.4%) |
| 10 to 14 Minutes | 14 (10.1%) | 8 (11.9%) |
| 15 to 19 Minutes | 15 (10.9%) | 7 (10.4%) |
| 20 to 24 Minutes | 12 (8.7%) | 0 (0.0%) |
| 25 to 29 Minutes | 6 (4.3%) | 3 (4.5%) |
| 30 to 34 Minutes | 21 (15.2%) | 4 (6.0%) |
| 35 to 39 Minutes | 30 (21.7%) | 0 (0.0%) |
| 40 to 44 Minutes | 2 (1.5%) | 6 (9.0%) |
| 45 to 59 Minutes | 0 (0.0%) | 16 (23.9%) |
| 60 to 89 Minutes | 11 (8.0%) | 4 (6.0%) |
| 90 or more Minutes | 0 (0.0%) | 0 (0.0%) |
Time of Departure to Work by Sex in Bunn
The most frequent times of departure to work in Bunn are 6:30 AM to 6:59 AM (26, 18.8%) for males and 7:00 AM to 7:29 AM (12, 17.9%) for females.
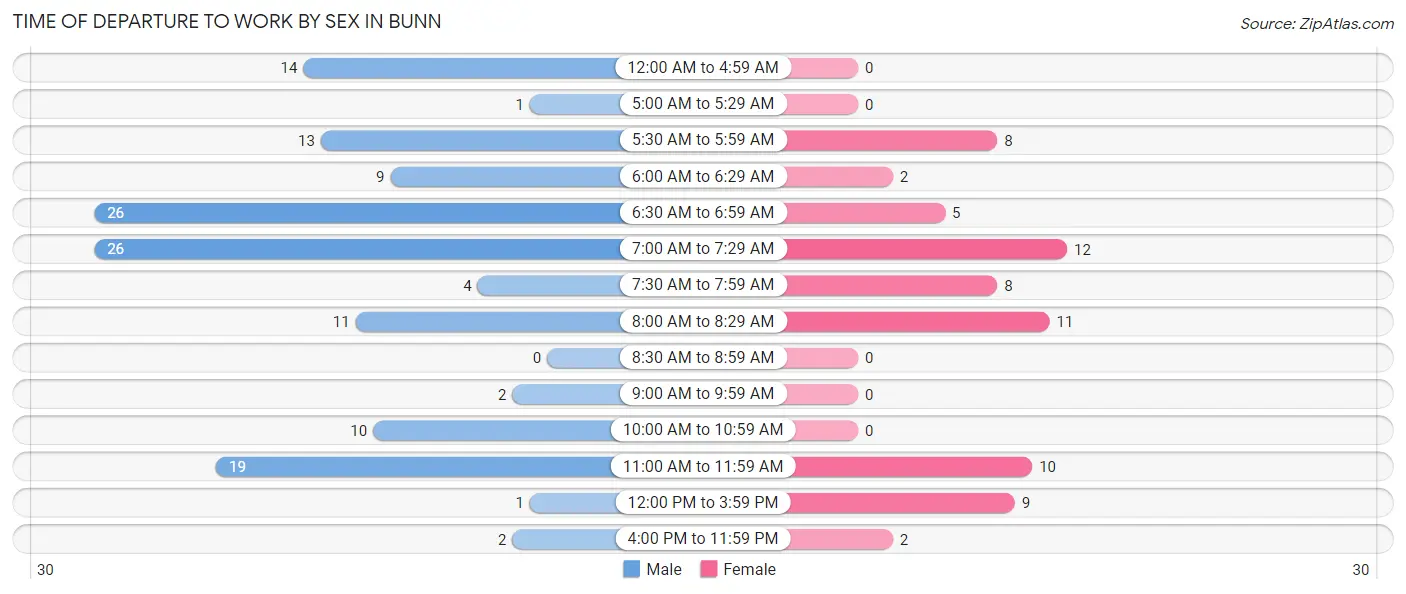
| Time of Departure | Male | Female |
| 12:00 AM to 4:59 AM | 14 (10.1%) | 0 (0.0%) |
| 5:00 AM to 5:29 AM | 1 (0.7%) | 0 (0.0%) |
| 5:30 AM to 5:59 AM | 13 (9.4%) | 8 (11.9%) |
| 6:00 AM to 6:29 AM | 9 (6.5%) | 2 (3.0%) |
| 6:30 AM to 6:59 AM | 26 (18.8%) | 5 (7.5%) |
| 7:00 AM to 7:29 AM | 26 (18.8%) | 12 (17.9%) |
| 7:30 AM to 7:59 AM | 4 (2.9%) | 8 (11.9%) |
| 8:00 AM to 8:29 AM | 11 (8.0%) | 11 (16.4%) |
| 8:30 AM to 8:59 AM | 0 (0.0%) | 0 (0.0%) |
| 9:00 AM to 9:59 AM | 2 (1.5%) | 0 (0.0%) |
| 10:00 AM to 10:59 AM | 10 (7.2%) | 0 (0.0%) |
| 11:00 AM to 11:59 AM | 19 (13.8%) | 10 (14.9%) |
| 12:00 PM to 3:59 PM | 1 (0.7%) | 9 (13.4%) |
| 4:00 PM to 11:59 PM | 2 (1.5%) | 2 (3.0%) |
| Total | 138 (100.0%) | 67 (100.0%) |
Housing Occupancy in Bunn
Occupancy by Ownership in Bunn
Of the total 193 dwellings in Bunn, owner-occupied units account for 122 (63.2%), while renter-occupied units make up 71 (36.8%).
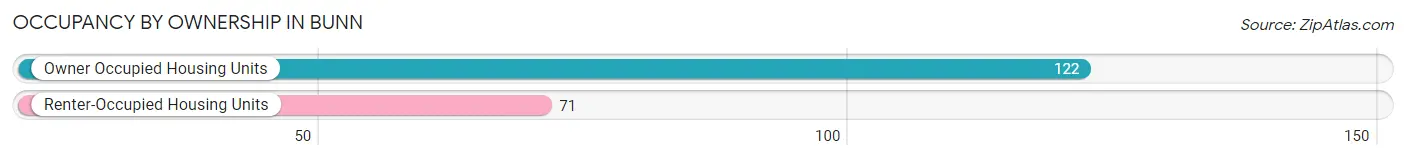
| Occupancy | # Housing Units | % Housing Units |
| Owner Occupied Housing Units | 122 | 63.2% |
| Renter-Occupied Housing Units | 71 | 36.8% |
| Total Occupied Housing Units | 193 | 100.0% |
Occupancy by Household Size in Bunn
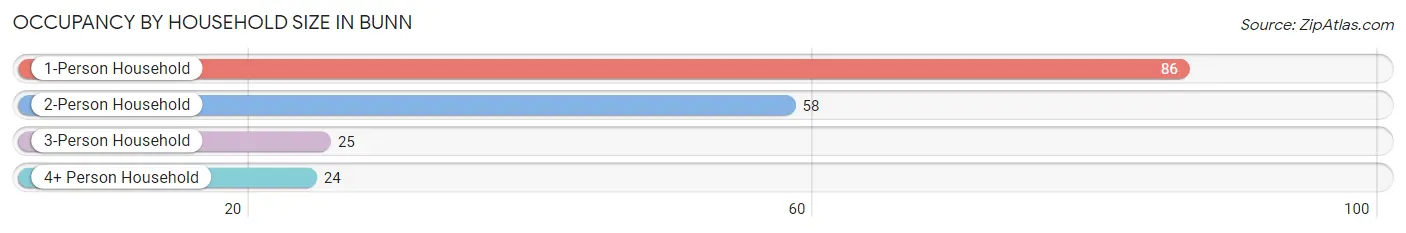
| Household Size | # Housing Units | % Housing Units |
| 1-Person Household | 86 | 44.6% |
| 2-Person Household | 58 | 30.0% |
| 3-Person Household | 25 | 13.0% |
| 4+ Person Household | 24 | 12.4% |
| Total Housing Units | 193 | 100.0% |
Occupancy by Ownership by Household Size in Bunn
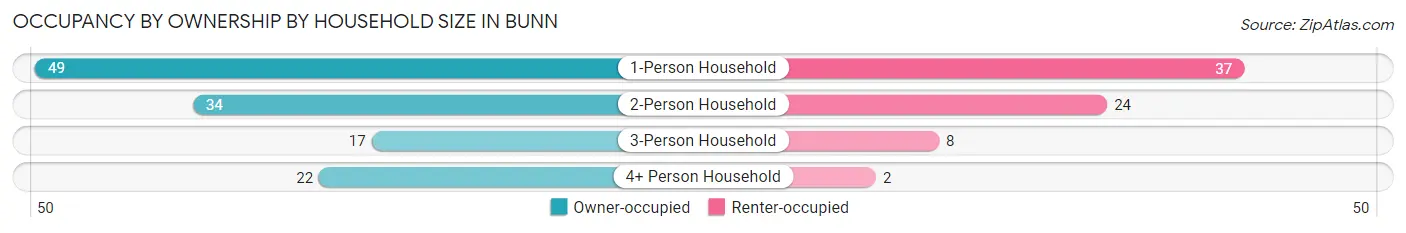
| Household Size | Owner-occupied | Renter-occupied |
| 1-Person Household | 49 (57.0%) | 37 (43.0%) |
| 2-Person Household | 34 (58.6%) | 24 (41.4%) |
| 3-Person Household | 17 (68.0%) | 8 (32.0%) |
| 4+ Person Household | 22 (91.7%) | 2 (8.3%) |
| Total Housing Units | 122 (63.2%) | 71 (36.8%) |
Occupancy by Educational Attainment in Bunn

| Household Size | Owner-occupied | Renter-occupied |
| Less than High School | 23 (52.3%) | 21 (47.7%) |
| High School Diploma | 34 (65.4%) | 18 (34.6%) |
| College/Associate Degree | 31 (51.7%) | 29 (48.3%) |
| Bachelor's Degree or higher | 34 (91.9%) | 3 (8.1%) |
Occupancy by Age of Householder in Bunn
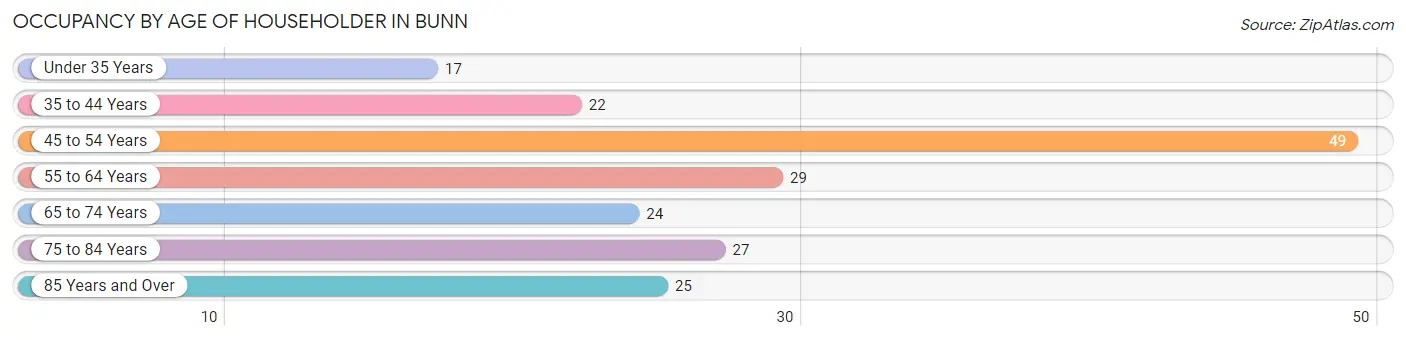
| Age Bracket | # Households | % Households |
| Under 35 Years | 17 | 8.8% |
| 35 to 44 Years | 22 | 11.4% |
| 45 to 54 Years | 49 | 25.4% |
| 55 to 64 Years | 29 | 15.0% |
| 65 to 74 Years | 24 | 12.4% |
| 75 to 84 Years | 27 | 14.0% |
| 85 Years and Over | 25 | 13.0% |
| Total | 193 | 100.0% |
Housing Finances in Bunn
Median Income by Occupancy in Bunn
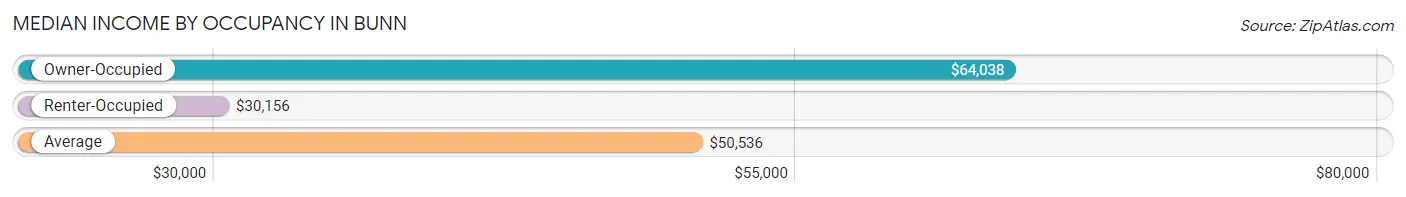
| Occupancy Type | # Households | Median Income |
| Owner-Occupied | 122 (63.2%) | $64,038 |
| Renter-Occupied | 71 (36.8%) | $30,156 |
| Average | 193 (100.0%) | $50,536 |
Occupancy by Householder Income Bracket in Bunn
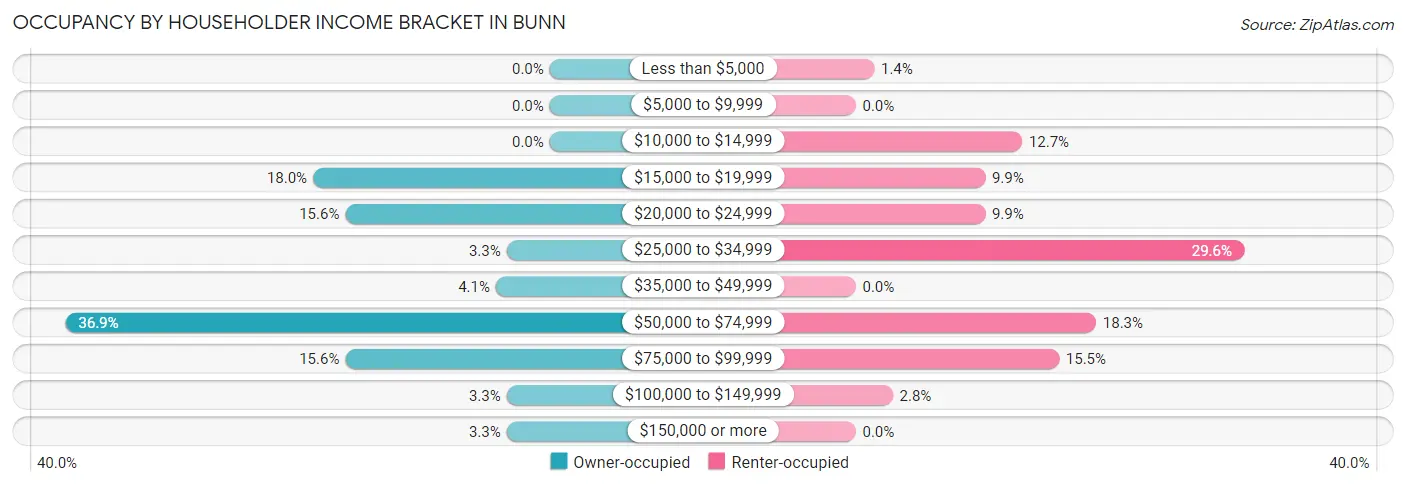
| Income Bracket | Owner-occupied | Renter-occupied |
| Less than $5,000 | 0 (0.0%) | 1 (1.4%) |
| $5,000 to $9,999 | 0 (0.0%) | 0 (0.0%) |
| $10,000 to $14,999 | 0 (0.0%) | 9 (12.7%) |
| $15,000 to $19,999 | 22 (18.0%) | 7 (9.9%) |
| $20,000 to $24,999 | 19 (15.6%) | 7 (9.9%) |
| $25,000 to $34,999 | 4 (3.3%) | 21 (29.6%) |
| $35,000 to $49,999 | 5 (4.1%) | 0 (0.0%) |
| $50,000 to $74,999 | 45 (36.9%) | 13 (18.3%) |
| $75,000 to $99,999 | 19 (15.6%) | 11 (15.5%) |
| $100,000 to $149,999 | 4 (3.3%) | 2 (2.8%) |
| $150,000 or more | 4 (3.3%) | 0 (0.0%) |
| Total | 122 (100.0%) | 71 (100.0%) |
Monthly Housing Cost Tiers in Bunn
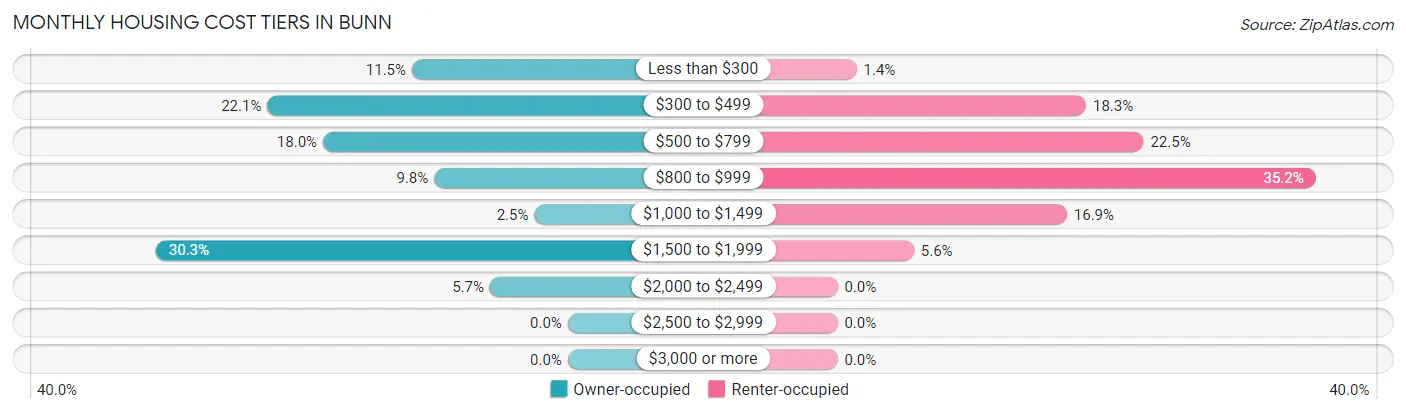
| Monthly Cost | Owner-occupied | Renter-occupied |
| Less than $300 | 14 (11.5%) | 1 (1.4%) |
| $300 to $499 | 27 (22.1%) | 13 (18.3%) |
| $500 to $799 | 22 (18.0%) | 16 (22.5%) |
| $800 to $999 | 12 (9.8%) | 25 (35.2%) |
| $1,000 to $1,499 | 3 (2.5%) | 12 (16.9%) |
| $1,500 to $1,999 | 37 (30.3%) | 4 (5.6%) |
| $2,000 to $2,499 | 7 (5.7%) | 0 (0.0%) |
| $2,500 to $2,999 | 0 (0.0%) | 0 (0.0%) |
| $3,000 or more | 0 (0.0%) | 0 (0.0%) |
| Total | 122 (100.0%) | 71 (100.0%) |
Physical Housing Characteristics in Bunn
Housing Structures in Bunn
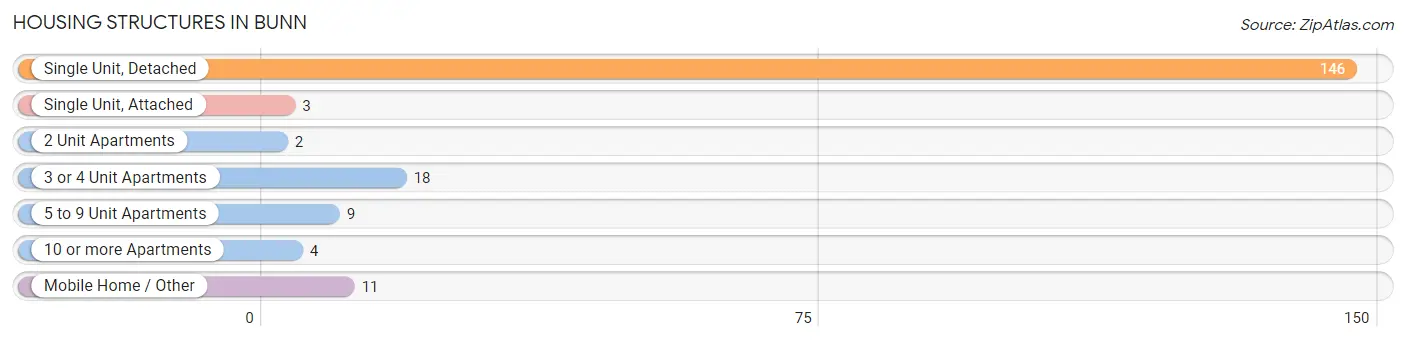
| Structure Type | # Housing Units | % Housing Units |
| Single Unit, Detached | 146 | 75.6% |
| Single Unit, Attached | 3 | 1.5% |
| 2 Unit Apartments | 2 | 1.0% |
| 3 or 4 Unit Apartments | 18 | 9.3% |
| 5 to 9 Unit Apartments | 9 | 4.7% |
| 10 or more Apartments | 4 | 2.1% |
| Mobile Home / Other | 11 | 5.7% |
| Total | 193 | 100.0% |
Housing Structures by Occupancy in Bunn
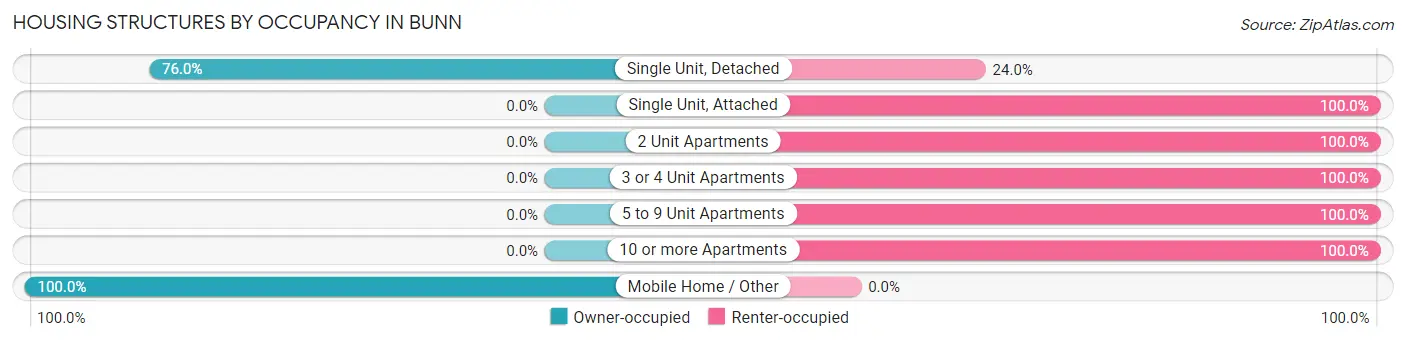
| Structure Type | Owner-occupied | Renter-occupied |
| Single Unit, Detached | 111 (76.0%) | 35 (24.0%) |
| Single Unit, Attached | 0 (0.0%) | 3 (100.0%) |
| 2 Unit Apartments | 0 (0.0%) | 2 (100.0%) |
| 3 or 4 Unit Apartments | 0 (0.0%) | 18 (100.0%) |
| 5 to 9 Unit Apartments | 0 (0.0%) | 9 (100.0%) |
| 10 or more Apartments | 0 (0.0%) | 4 (100.0%) |
| Mobile Home / Other | 11 (100.0%) | 0 (0.0%) |
| Total | 122 (63.2%) | 71 (36.8%) |
Housing Structures by Number of Rooms in Bunn
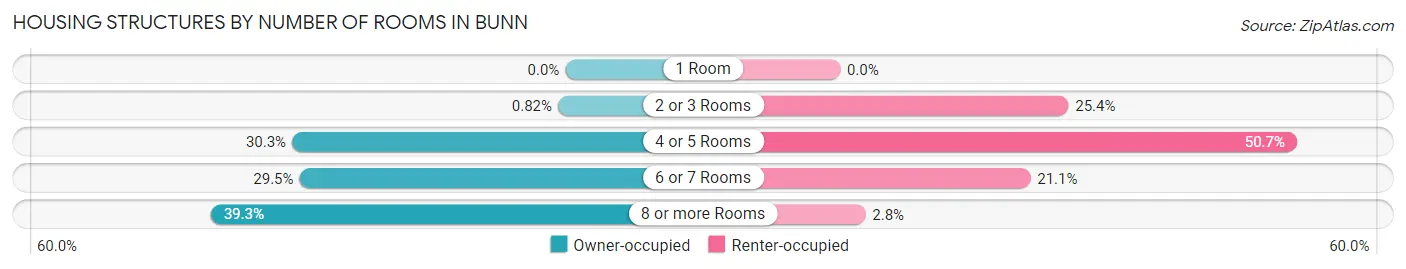
| Number of Rooms | Owner-occupied | Renter-occupied |
| 1 Room | 0 (0.0%) | 0 (0.0%) |
| 2 or 3 Rooms | 1 (0.8%) | 18 (25.4%) |
| 4 or 5 Rooms | 37 (30.3%) | 36 (50.7%) |
| 6 or 7 Rooms | 36 (29.5%) | 15 (21.1%) |
| 8 or more Rooms | 48 (39.3%) | 2 (2.8%) |
| Total | 122 (100.0%) | 71 (100.0%) |
Housing Structure by Heating Type in Bunn
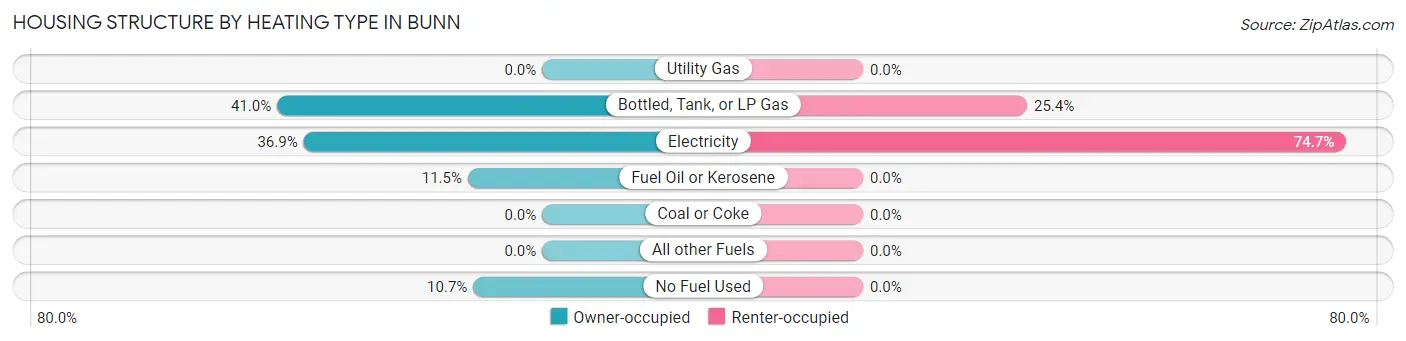
| Heating Type | Owner-occupied | Renter-occupied |
| Utility Gas | 0 (0.0%) | 0 (0.0%) |
| Bottled, Tank, or LP Gas | 50 (41.0%) | 18 (25.4%) |
| Electricity | 45 (36.9%) | 53 (74.7%) |
| Fuel Oil or Kerosene | 14 (11.5%) | 0 (0.0%) |
| Coal or Coke | 0 (0.0%) | 0 (0.0%) |
| All other Fuels | 0 (0.0%) | 0 (0.0%) |
| No Fuel Used | 13 (10.7%) | 0 (0.0%) |
| Total | 122 (100.0%) | 71 (100.0%) |
Household Vehicle Usage in Bunn
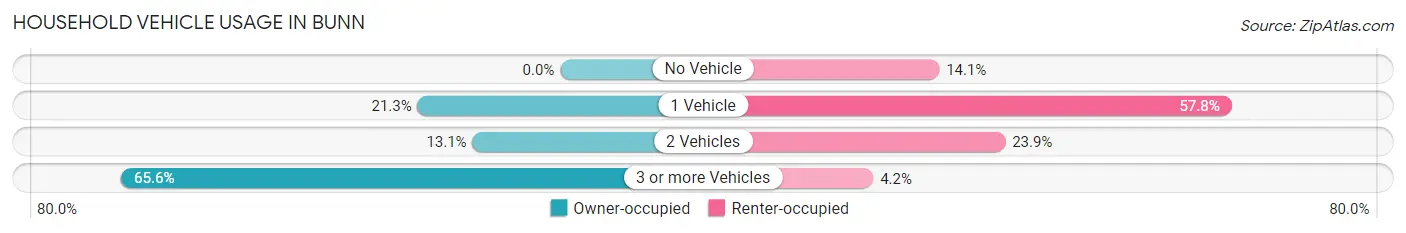
| Vehicles per Household | Owner-occupied | Renter-occupied |
| No Vehicle | 0 (0.0%) | 10 (14.1%) |
| 1 Vehicle | 26 (21.3%) | 41 (57.8%) |
| 2 Vehicles | 16 (13.1%) | 17 (23.9%) |
| 3 or more Vehicles | 80 (65.6%) | 3 (4.2%) |
| Total | 122 (100.0%) | 71 (100.0%) |
Real Estate & Mortgages in Bunn
Real Estate and Mortgage Overview in Bunn
| Characteristic | Without Mortgage | With Mortgage |
| Housing Units | 68 | 54 |
| Median Property Value | - | - |
| Median Household Income | - | - |
| Monthly Housing Costs | $375 | $0 |
| Real Estate Taxes | - | - |
Property Value by Mortgage Status in Bunn
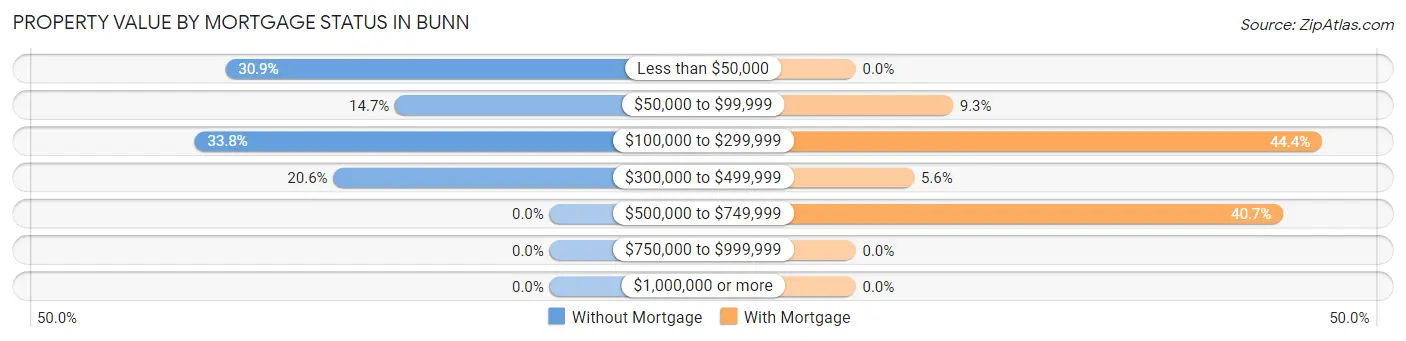
| Property Value | Without Mortgage | With Mortgage |
| Less than $50,000 | 21 (30.9%) | 0 (0.0%) |
| $50,000 to $99,999 | 10 (14.7%) | 5 (9.3%) |
| $100,000 to $299,999 | 23 (33.8%) | 24 (44.4%) |
| $300,000 to $499,999 | 14 (20.6%) | 3 (5.6%) |
| $500,000 to $749,999 | 0 (0.0%) | 22 (40.7%) |
| $750,000 to $999,999 | 0 (0.0%) | 0 (0.0%) |
| $1,000,000 or more | 0 (0.0%) | 0 (0.0%) |
| Total | 68 (100.0%) | 54 (100.0%) |
Household Income by Mortgage Status in Bunn
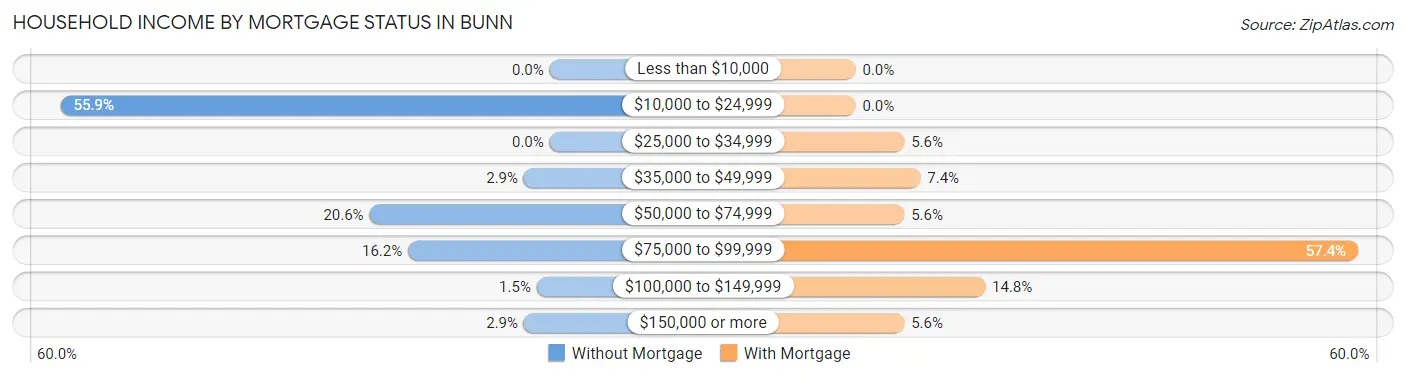
| Household Income | Without Mortgage | With Mortgage |
| Less than $10,000 | 0 (0.0%) | 0 (0.0%) |
| $10,000 to $24,999 | 38 (55.9%) | 0 (0.0%) |
| $25,000 to $34,999 | 0 (0.0%) | 3 (5.6%) |
| $35,000 to $49,999 | 2 (2.9%) | 4 (7.4%) |
| $50,000 to $74,999 | 14 (20.6%) | 3 (5.6%) |
| $75,000 to $99,999 | 11 (16.2%) | 31 (57.4%) |
| $100,000 to $149,999 | 1 (1.5%) | 8 (14.8%) |
| $150,000 or more | 2 (2.9%) | 3 (5.6%) |
| Total | 68 (100.0%) | 54 (100.0%) |
Property Value to Household Income Ratio in Bunn
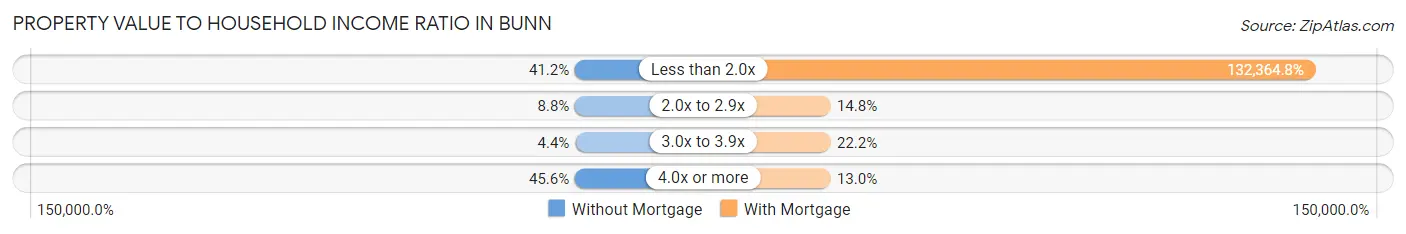
| Value-to-Income Ratio | Without Mortgage | With Mortgage |
| Less than 2.0x | 28 (41.2%) | 71,477 (132,364.8%) |
| 2.0x to 2.9x | 6 (8.8%) | 8 (14.8%) |
| 3.0x to 3.9x | 3 (4.4%) | 12 (22.2%) |
| 4.0x or more | 31 (45.6%) | 7 (13.0%) |
| Total | 68 (100.0%) | 54 (100.0%) |
Real Estate Taxes by Mortgage Status in Bunn
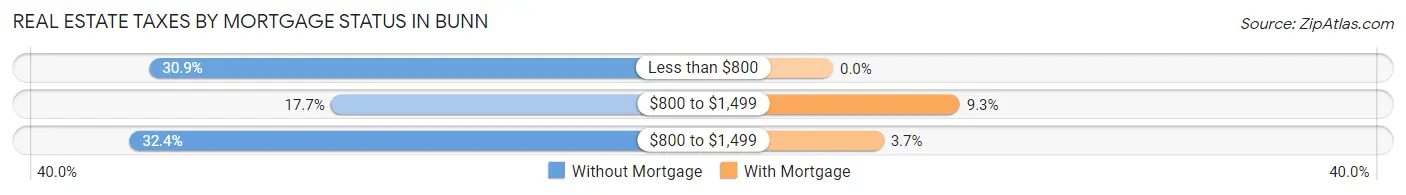
| Property Taxes | Without Mortgage | With Mortgage |
| Less than $800 | 21 (30.9%) | 0 (0.0%) |
| $800 to $1,499 | 12 (17.6%) | 5 (9.3%) |
| $800 to $1,499 | 22 (32.4%) | 2 (3.7%) |
| Total | 68 (100.0%) | 54 (100.0%) |
Health & Disability in Bunn
Health Insurance Coverage by Age in Bunn
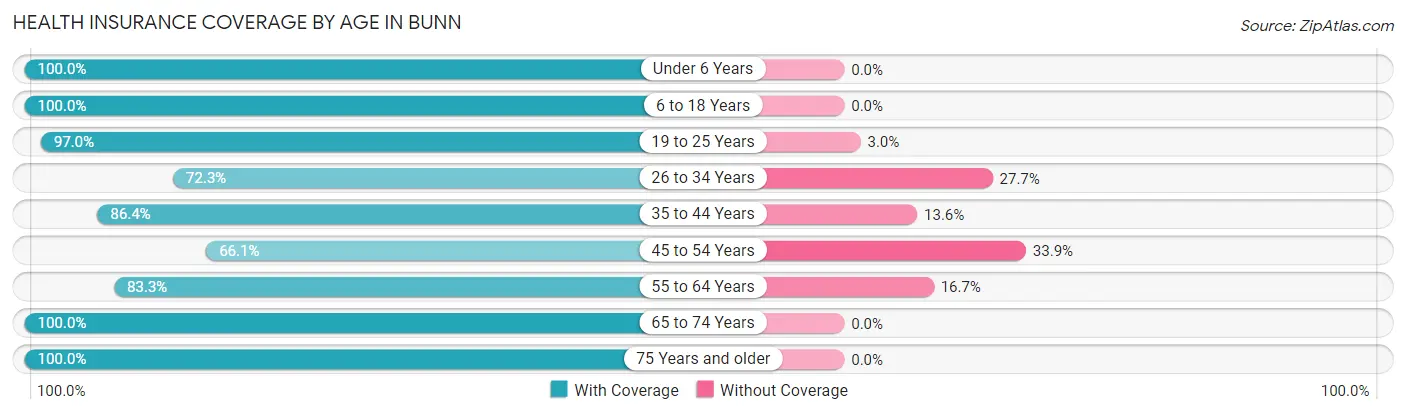
| Age Bracket | With Coverage | Without Coverage |
| Under 6 Years | 33 (100.0%) | 0 (0.0%) |
| 6 to 18 Years | 73 (100.0%) | 0 (0.0%) |
| 19 to 25 Years | 32 (97.0%) | 1 (3.0%) |
| 26 to 34 Years | 34 (72.3%) | 13 (27.7%) |
| 35 to 44 Years | 70 (86.4%) | 11 (13.6%) |
| 45 to 54 Years | 41 (66.1%) | 21 (33.9%) |
| 55 to 64 Years | 50 (83.3%) | 10 (16.7%) |
| 65 to 74 Years | 33 (100.0%) | 0 (0.0%) |
| 75 Years and older | 56 (100.0%) | 0 (0.0%) |
| Total | 422 (88.3%) | 56 (11.7%) |
Health Insurance Coverage by Citizenship Status in Bunn
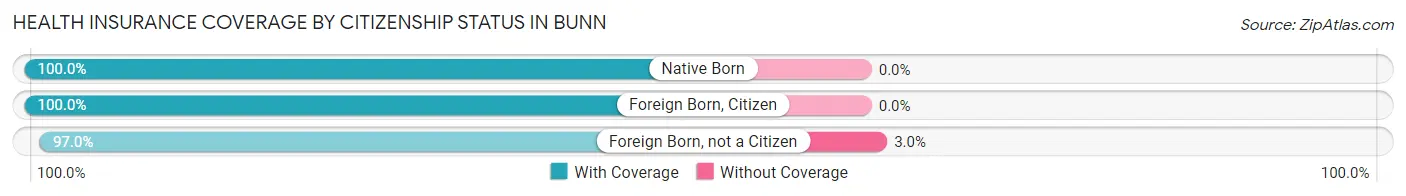
| Citizenship Status | With Coverage | Without Coverage |
| Native Born | 33 (100.0%) | 0 (0.0%) |
| Foreign Born, Citizen | 73 (100.0%) | 0 (0.0%) |
| Foreign Born, not a Citizen | 32 (97.0%) | 1 (3.0%) |
Health Insurance Coverage by Household Income in Bunn
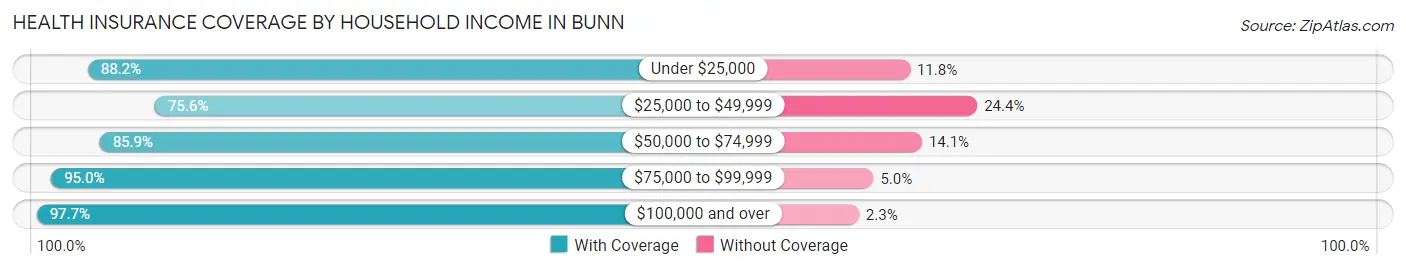
| Household Income | With Coverage | Without Coverage |
| Under $25,000 | 67 (88.2%) | 9 (11.8%) |
| $25,000 to $49,999 | 34 (75.6%) | 11 (24.4%) |
| $50,000 to $74,999 | 183 (85.9%) | 30 (14.1%) |
| $75,000 to $99,999 | 95 (95.0%) | 5 (5.0%) |
| $100,000 and over | 43 (97.7%) | 1 (2.3%) |
Public vs Private Health Insurance Coverage by Age in Bunn
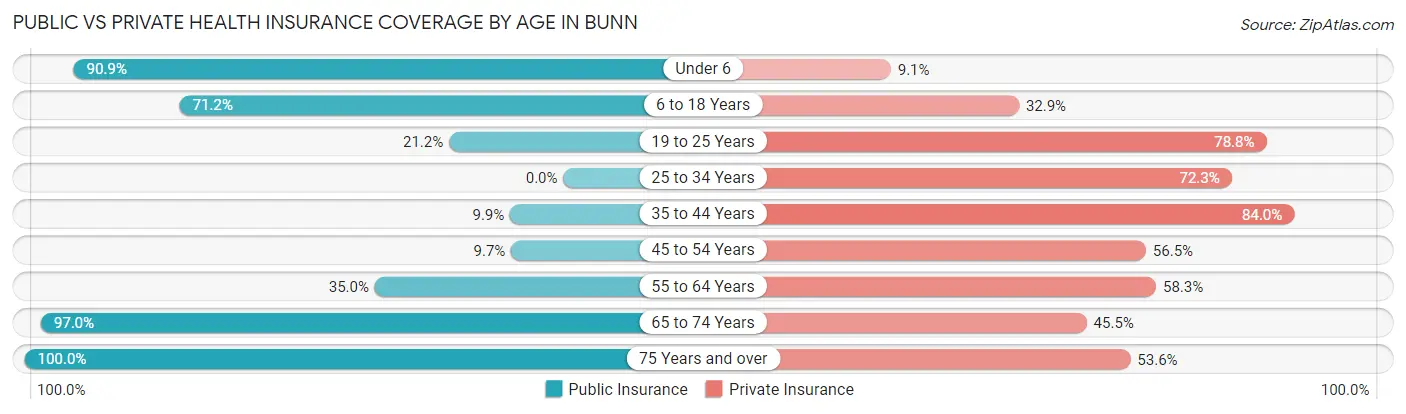
| Age Bracket | Public Insurance | Private Insurance |
| Under 6 | 30 (90.9%) | 3 (9.1%) |
| 6 to 18 Years | 52 (71.2%) | 24 (32.9%) |
| 19 to 25 Years | 7 (21.2%) | 26 (78.8%) |
| 25 to 34 Years | 0 (0.0%) | 34 (72.3%) |
| 35 to 44 Years | 8 (9.9%) | 68 (84.0%) |
| 45 to 54 Years | 6 (9.7%) | 35 (56.5%) |
| 55 to 64 Years | 21 (35.0%) | 35 (58.3%) |
| 65 to 74 Years | 32 (97.0%) | 15 (45.5%) |
| 75 Years and over | 56 (100.0%) | 30 (53.6%) |
| Total | 212 (44.4%) | 270 (56.5%) |
Disability Status by Sex by Age in Bunn
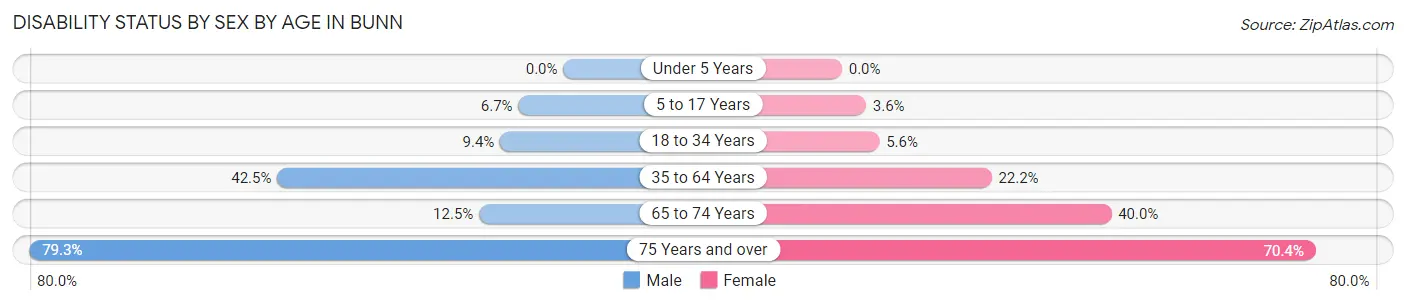
| Age Bracket | Male | Female |
| Under 5 Years | 0 (0.0%) | 0 (0.0%) |
| 5 to 17 Years | 1 (6.7%) | 2 (3.6%) |
| 18 to 34 Years | 6 (9.4%) | 1 (5.6%) |
| 35 to 64 Years | 48 (42.5%) | 20 (22.2%) |
| 65 to 74 Years | 1 (12.5%) | 10 (40.0%) |
| 75 Years and over | 23 (79.3%) | 19 (70.4%) |
Disability Class by Sex by Age in Bunn
Disability Class: Hearing Difficulty
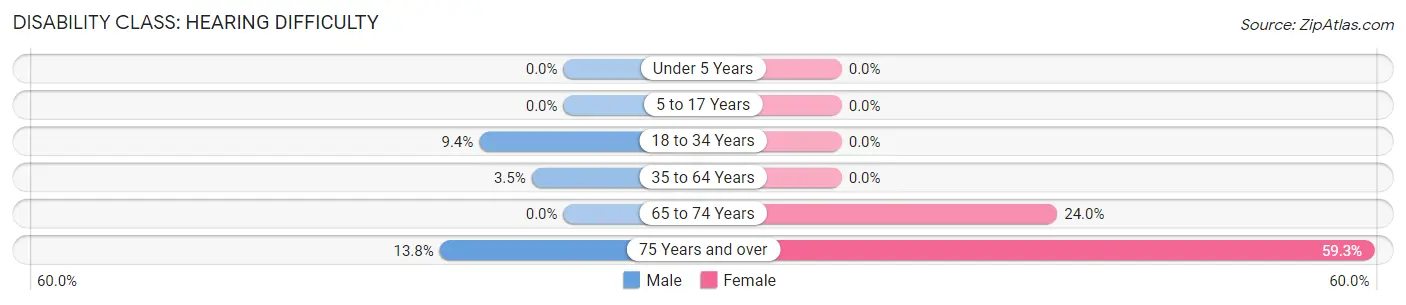
| Age Bracket | Male | Female |
| Under 5 Years | 0 (0.0%) | 0 (0.0%) |
| 5 to 17 Years | 0 (0.0%) | 0 (0.0%) |
| 18 to 34 Years | 6 (9.4%) | 0 (0.0%) |
| 35 to 64 Years | 4 (3.5%) | 0 (0.0%) |
| 65 to 74 Years | 0 (0.0%) | 6 (24.0%) |
| 75 Years and over | 4 (13.8%) | 16 (59.3%) |
Disability Class: Vision Difficulty
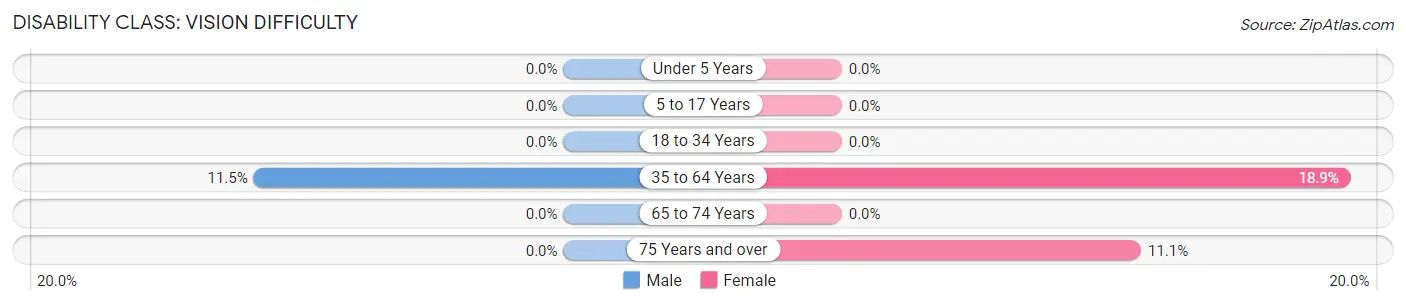
| Age Bracket | Male | Female |
| Under 5 Years | 0 (0.0%) | 0 (0.0%) |
| 5 to 17 Years | 0 (0.0%) | 0 (0.0%) |
| 18 to 34 Years | 0 (0.0%) | 0 (0.0%) |
| 35 to 64 Years | 13 (11.5%) | 17 (18.9%) |
| 65 to 74 Years | 0 (0.0%) | 0 (0.0%) |
| 75 Years and over | 0 (0.0%) | 3 (11.1%) |
Disability Class: Cognitive Difficulty
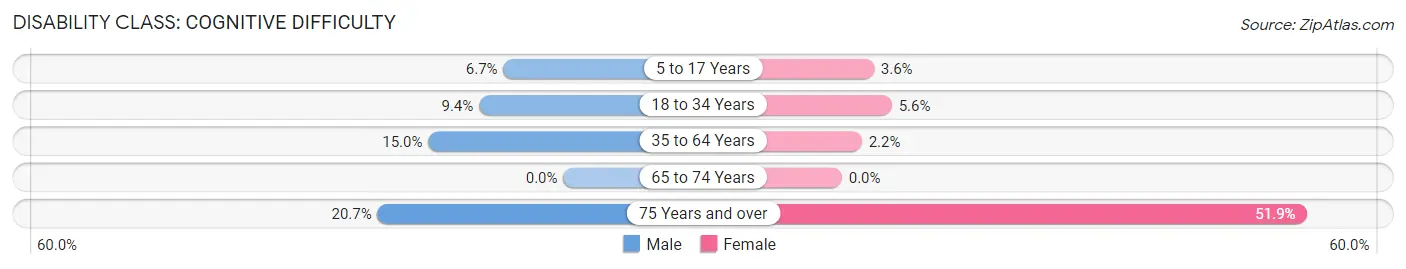
| Age Bracket | Male | Female |
| 5 to 17 Years | 1 (6.7%) | 2 (3.6%) |
| 18 to 34 Years | 6 (9.4%) | 1 (5.6%) |
| 35 to 64 Years | 17 (15.0%) | 2 (2.2%) |
| 65 to 74 Years | 0 (0.0%) | 0 (0.0%) |
| 75 Years and over | 6 (20.7%) | 14 (51.8%) |
Disability Class: Ambulatory Difficulty
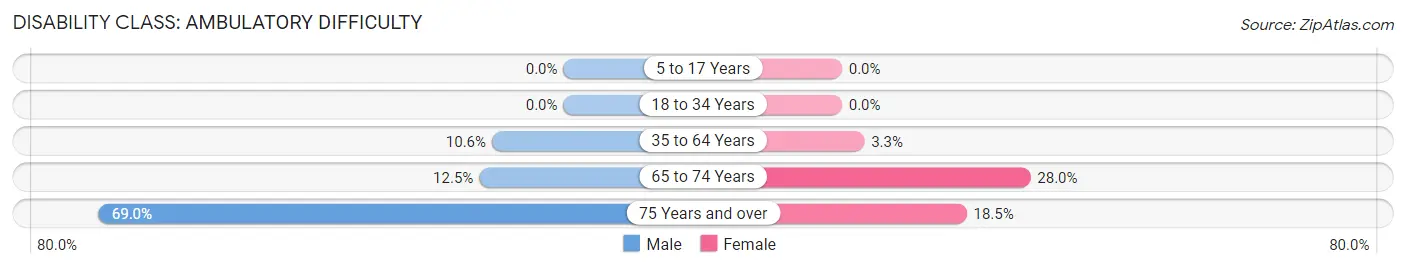
| Age Bracket | Male | Female |
| 5 to 17 Years | 0 (0.0%) | 0 (0.0%) |
| 18 to 34 Years | 0 (0.0%) | 0 (0.0%) |
| 35 to 64 Years | 12 (10.6%) | 3 (3.3%) |
| 65 to 74 Years | 1 (12.5%) | 7 (28.0%) |
| 75 Years and over | 20 (69.0%) | 5 (18.5%) |
Disability Class: Self-Care Difficulty
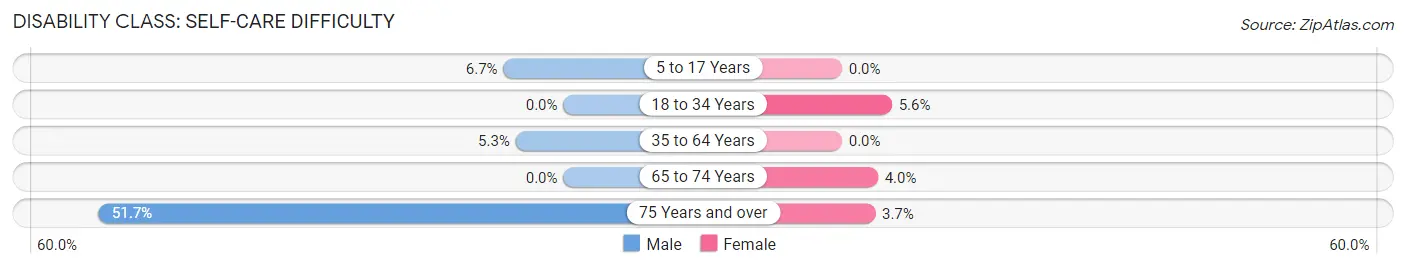
| Age Bracket | Male | Female |
| 5 to 17 Years | 1 (6.7%) | 0 (0.0%) |
| 18 to 34 Years | 0 (0.0%) | 1 (5.6%) |
| 35 to 64 Years | 6 (5.3%) | 0 (0.0%) |
| 65 to 74 Years | 0 (0.0%) | 1 (4.0%) |
| 75 Years and over | 15 (51.7%) | 1 (3.7%) |
Technology Access in Bunn
Computing Device Access in Bunn
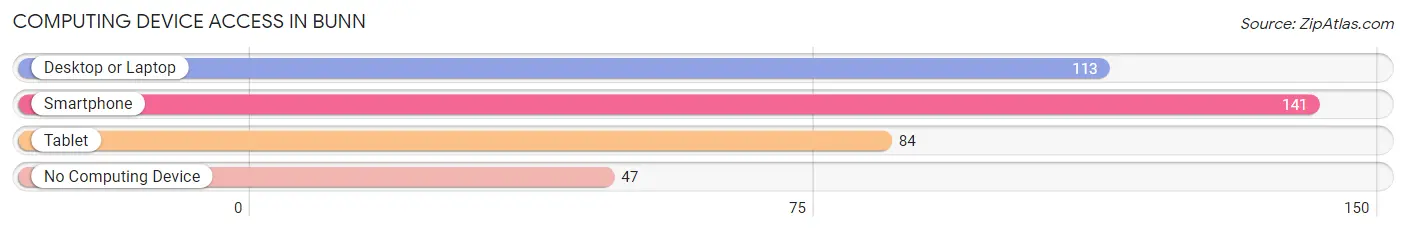
| Device Type | # Households | % Households |
| Desktop or Laptop | 113 | 58.6% |
| Smartphone | 141 | 73.1% |
| Tablet | 84 | 43.5% |
| No Computing Device | 47 | 24.3% |
| Total | 193 | 100.0% |
Internet Access in Bunn
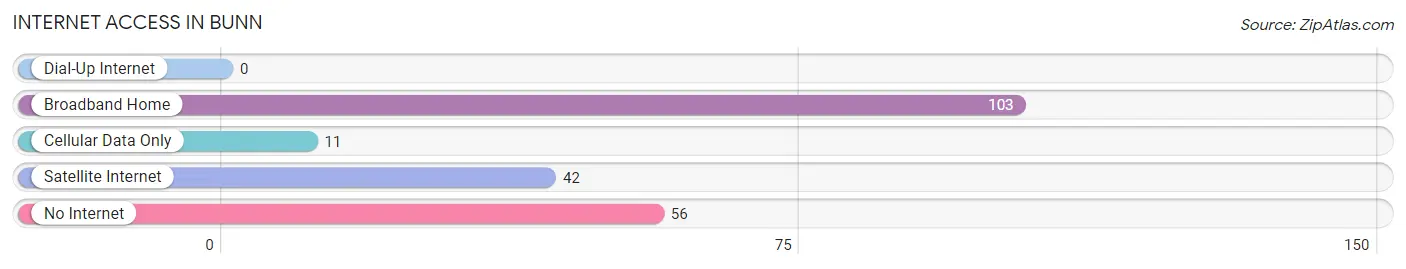
| Internet Type | # Households | % Households |
| Dial-Up Internet | 0 | 0.0% |
| Broadband Home | 103 | 53.4% |
| Cellular Data Only | 11 | 5.7% |
| Satellite Internet | 42 | 21.8% |
| No Internet | 56 | 29.0% |
| Total | 193 | 100.0% |
Bunn Summary
Bunn is a small town located in Franklin County, North Carolina. It is situated in the northeastern part of the state, approximately 30 miles northeast of Raleigh. The town was founded in 1820 and has a population of approximately 1,000 people.
Geography
Bunn is located in the northeastern part of Franklin County, North Carolina. It is situated on the banks of the Neuse River, which is the longest river in the state. The town is surrounded by rolling hills and forests, and is located in the Piedmont region of the state. The town is located at an elevation of approximately 300 feet above sea level.
Economy
The economy of Bunn is largely based on agriculture. The town is home to several farms, which produce a variety of crops, including corn, soybeans, wheat, and tobacco. The town also has a few small businesses, including a grocery store, a hardware store, and a few restaurants.
Demographics
As of the 2010 census, the population of Bunn was 1,000 people. The racial makeup of the town was 95.2% White, 2.2% African American, 0.2% Native American, 0.2% Asian, 0.2% from other races, and 1.2% from two or more races. The median household income was $35,000, and the median family income was $41,000.
History
Bunn was founded in 1820 by a group of settlers from Virginia. The town was named after a local Native American chief, Chief Bunn. The town was originally a farming community, and the main crops grown were corn, wheat, and tobacco. In the late 19th century, the town began to grow and develop, and several businesses were established.
In the early 20th century, the town experienced a period of growth and prosperity. The town was home to several factories, including a cotton mill, a furniture factory, and a canning factory. The town also had a railroad station, which connected it to other towns in the area.
In the late 20th century, the town experienced a period of decline. Many of the factories closed, and the railroad station was abandoned. The town has since experienced a resurgence, and is now home to several small businesses and farms.
Bunn is a small town with a rich history and a bright future. It is a great place to live, work, and raise a family. The town is home to a diverse population, and offers a variety of activities and attractions. The town is also home to several historic sites, including the Bunn Historic District, which is listed on the National Register of Historic Places.
Common Questions
What is the Total Population of Bunn?
Total Population of Bunn is 478.
What is the Total Male Population of Bunn?
Total Male Population of Bunn is 245.
What is the Total Female Population of Bunn?
Total Female Population of Bunn is 233.
What is the Ratio of Males per 100 Females in Bunn?
There are 105.15 Males per 100 Females in Bunn.
What is the Ratio of Females per 100 Males in Bunn?
There are 95.10 Females per 100 Males in Bunn.
What is the Median Population Age in Bunn?
Median Population Age in Bunn is 43.5 Years.
What is the Average Family Size in Bunn
Average Family Size in Bunn is 3.7 People.
What is the Average Household Size in Bunn
Average Household Size in Bunn is 2.5 People.
What is Per Capita Income in Bunn?
Per Capita income in Bunn is $23,110.
What is the Median Family Income in Bunn?
Median Family Income in Bunn is $70,852.
What is the Median Household income in Bunn?
Median Household Income in Bunn is $50,536.
What is Income or Wage Gap in Bunn?
Income or Wage Gap in Bunn is 0.9%.
Women in Bunn earn 99.1 cents for every dollar earned by a man.
What is Inequality or Gini Index in Bunn?
Inequality or Gini Index in Bunn is 0.35.
How Large is the Labor Force in Bunn?
There are 243 People in the Labor Forcein in Bunn.
What is the Percentage of People in the Labor Force in Bunn?
63.8% of People are in the Labor Force in Bunn.