Elroy, NC
Elroy Map
Elroy Overview
3,495
TOTAL POPULATION
1,757
MALE POPULATION
1,738
FEMALE POPULATION
101.09
MALES / 100 FEMALES
98.92
FEMALES / 100 MALES
41.9
MEDIAN AGE
3.1
AVG FAMILY SIZE
2.6
AVG HOUSEHOLD SIZE
$26,360
PER CAPITA INCOME
$71,071
AVG FAMILY INCOME
$59,505
AVG HOUSEHOLD INCOME
16.6%
WAGE / INCOME GAP [ % ]
83.4¢/ $1
WAGE / INCOME GAP [ $ ]
0.38
INEQUALITY / GINI INDEX
1,604
LABOR FORCE [ PEOPLE ]
57.8%
PERCENT IN LABOR FORCE
3.3%
UNEMPLOYMENT RATE
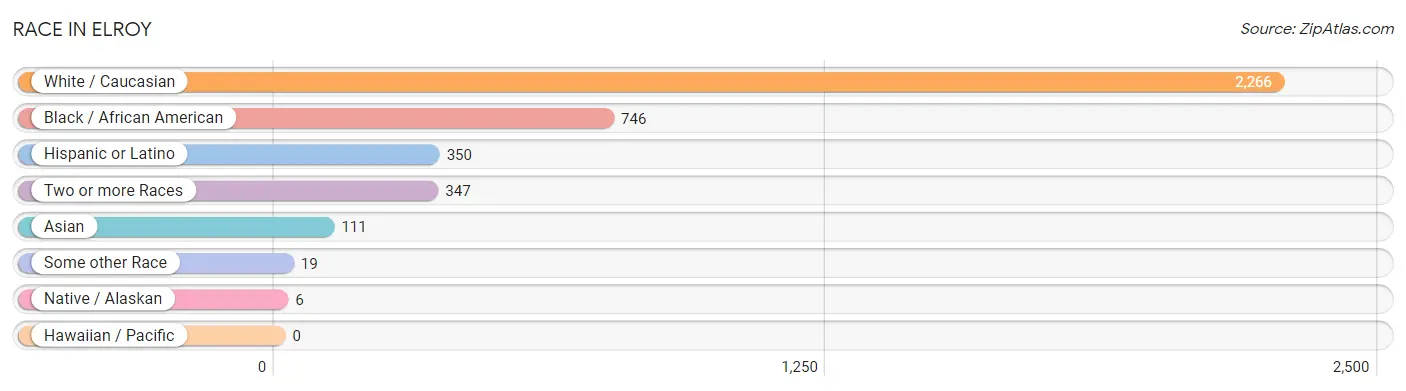
Race in Elroy
The most populous races in Elroy are White / Caucasian (2,266 | 64.8%), Black / African American (746 | 21.3%), and Hispanic or Latino (350 | 10.0%).
| Race | # Population | % Population |
| Asian | 111 | 3.2% |
| Black / African American | 746 | 21.3% |
| Hawaiian / Pacific | 0 | 0.0% |
| Hispanic or Latino | 350 | 10.0% |
| Native / Alaskan | 6 | 0.2% |
| White / Caucasian | 2,266 | 64.8% |
| Two or more Races | 347 | 9.9% |
| Some other Race | 19 | 0.5% |
| Total | 3,495 | 100.0% |
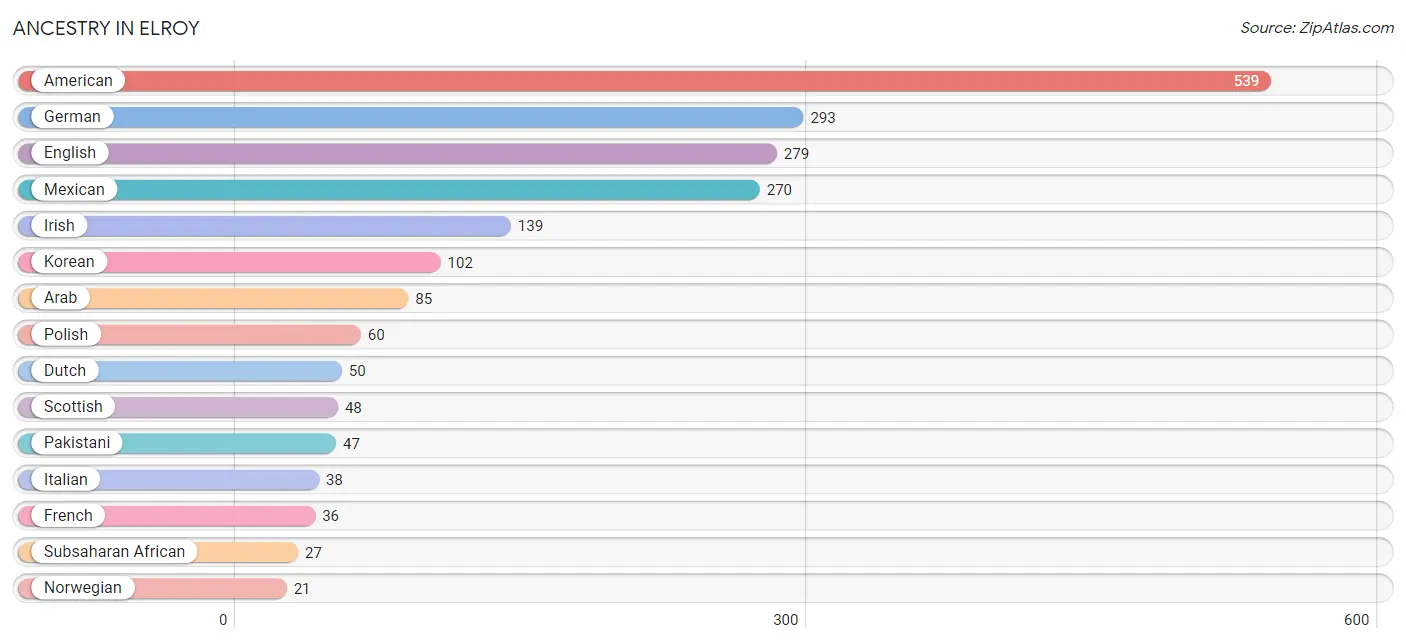
Ancestry in Elroy
The most populous ancestries reported in Elroy are American (539 | 15.4%), German (293 | 8.4%), English (279 | 8.0%), Mexican (270 | 7.7%), and Irish (139 | 4.0%), together accounting for 43.5% of all Elroy residents.
| Ancestry | # Population | % Population |
| African | 19 | 0.5% |
| Albanian | 11 | 0.3% |
| American | 539 | 15.4% |
| Arab | 85 | 2.4% |
| Bhutanese | 8 | 0.2% |
| British | 4 | 0.1% |
| Burmese | 4 | 0.1% |
| Cambodian | 6 | 0.2% |
| Cape Verdean | 8 | 0.2% |
| Cherokee | 6 | 0.2% |
| Dutch | 50 | 1.4% |
| English | 279 | 8.0% |
| European | 17 | 0.5% |
| French | 36 | 1.0% |
| French Canadian | 11 | 0.3% |
| German | 293 | 8.4% |
| Indian (Asian) | 20 | 0.6% |
| Irish | 139 | 4.0% |
| Italian | 38 | 1.1% |
| Korean | 102 | 2.9% |
| Mexican | 270 | 7.7% |
| Norwegian | 21 | 0.6% |
| Pakistani | 47 | 1.3% |
| Polish | 60 | 1.7% |
| Romanian | 9 | 0.3% |
| Russian | 9 | 0.3% |
| Scotch-Irish | 9 | 0.3% |
| Scottish | 48 | 1.4% |
| Subsaharan African | 27 | 0.8% | View All 29 Rows |
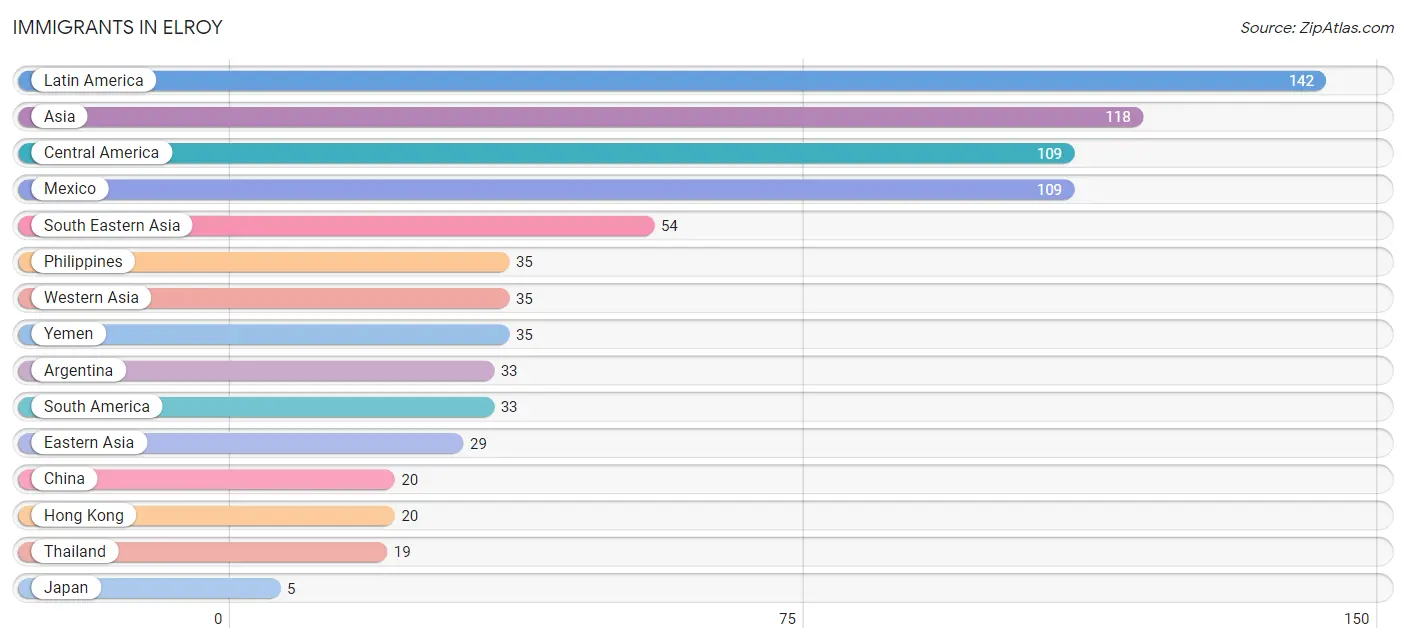
Immigrants in Elroy
The most numerous immigrant groups reported in Elroy came from Latin America (142 | 4.1%), Asia (118 | 3.4%), Central America (109 | 3.1%), Mexico (109 | 3.1%), and South Eastern Asia (54 | 1.5%), together accounting for 15.2% of all Elroy residents.
| Immigration Origin | # Population | % Population |
| Argentina | 33 | 0.9% |
| Asia | 118 | 3.4% |
| Central America | 109 | 3.1% |
| China | 20 | 0.6% |
| Eastern Asia | 29 | 0.8% |
| Hong Kong | 20 | 0.6% |
| Japan | 5 | 0.1% |
| Korea | 4 | 0.1% |
| Latin America | 142 | 4.1% |
| Mexico | 109 | 3.1% |
| Philippines | 35 | 1.0% |
| South America | 33 | 0.9% |
| South Eastern Asia | 54 | 1.5% |
| Thailand | 19 | 0.5% |
| Western Asia | 35 | 1.0% |
| Yemen | 35 | 1.0% | View All 16 Rows |
Sex and Age in Elroy
Sex and Age in Elroy
The most populous age groups in Elroy are 40 to 44 Years (177 | 10.1%) for men and 45 to 49 Years (156 | 9.0%) for women.
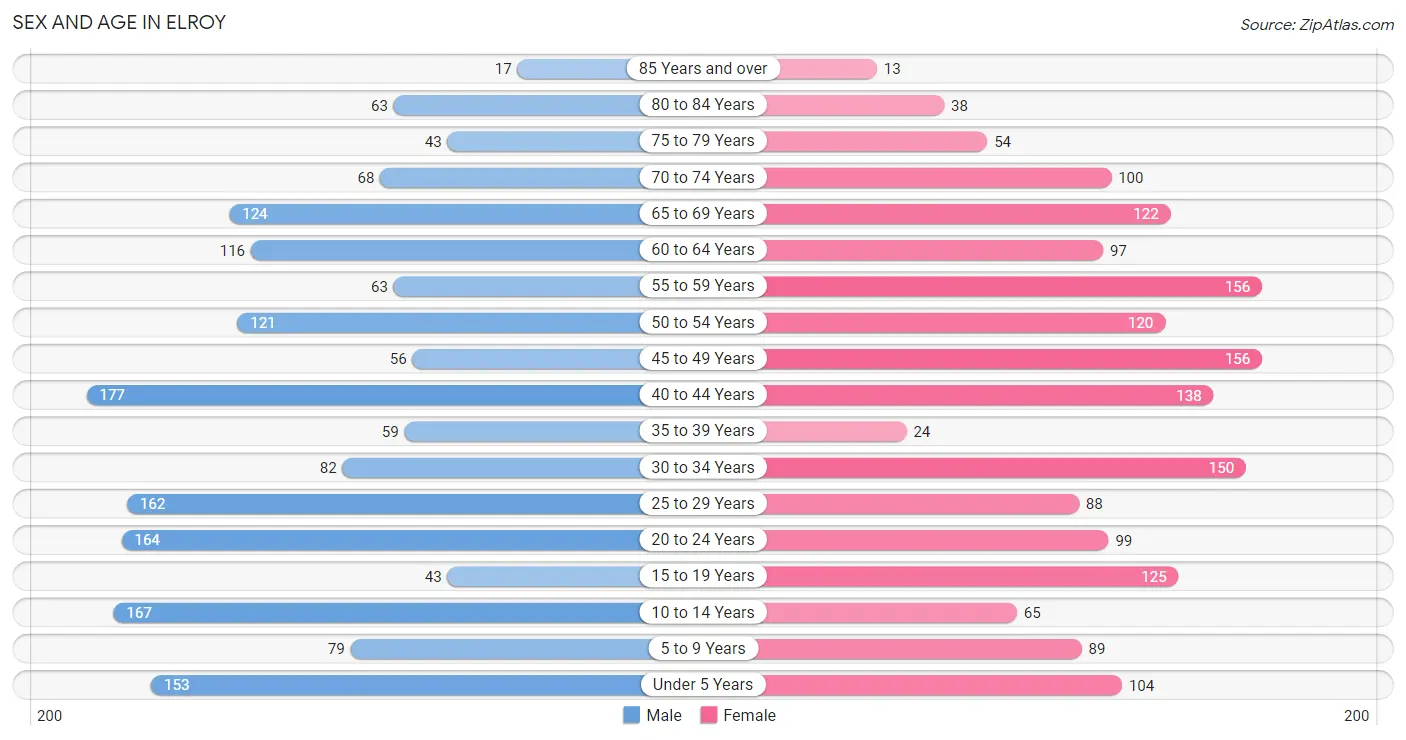
| Age Bracket | Male | Female |
| Under 5 Years | 153 (8.7%) | 104 (6.0%) |
| 5 to 9 Years | 79 (4.5%) | 89 (5.1%) |
| 10 to 14 Years | 167 (9.5%) | 65 (3.7%) |
| 15 to 19 Years | 43 (2.5%) | 125 (7.2%) |
| 20 to 24 Years | 164 (9.3%) | 99 (5.7%) |
| 25 to 29 Years | 162 (9.2%) | 88 (5.1%) |
| 30 to 34 Years | 82 (4.7%) | 150 (8.6%) |
| 35 to 39 Years | 59 (3.4%) | 24 (1.4%) |
| 40 to 44 Years | 177 (10.1%) | 138 (7.9%) |
| 45 to 49 Years | 56 (3.2%) | 156 (9.0%) |
| 50 to 54 Years | 121 (6.9%) | 120 (6.9%) |
| 55 to 59 Years | 63 (3.6%) | 156 (9.0%) |
| 60 to 64 Years | 116 (6.6%) | 97 (5.6%) |
| 65 to 69 Years | 124 (7.1%) | 122 (7.0%) |
| 70 to 74 Years | 68 (3.9%) | 100 (5.8%) |
| 75 to 79 Years | 43 (2.5%) | 54 (3.1%) |
| 80 to 84 Years | 63 (3.6%) | 38 (2.2%) |
| 85 Years and over | 17 (1.0%) | 13 (0.7%) |
| Total | 1,757 (100.0%) | 1,738 (100.0%) |
Families and Households in Elroy
Median Family Size in Elroy
The median family size in Elroy is 3.06 persons per family, with single female/mother families (227 | 24.7%) accounting for the largest median family size of 3.14 persons per family. On the other hand, single male/father families (120 | 13.1%) represent the smallest median family size with 2.76 persons per family.
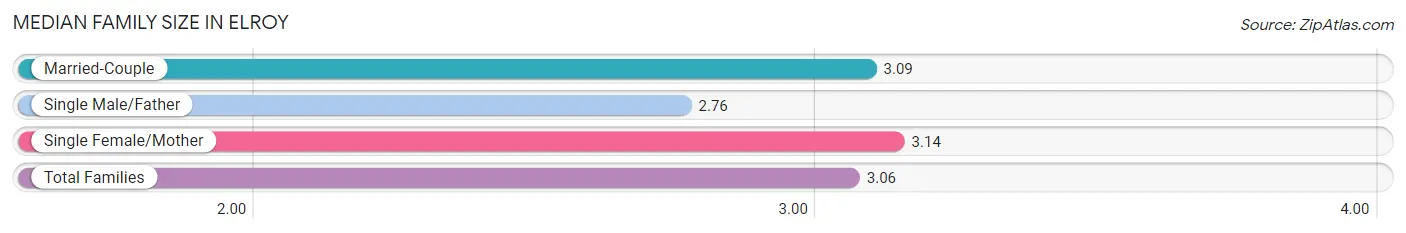
| Family Type | # Families | Family Size |
| Married-Couple | 571 (62.2%) | 3.09 |
| Single Male/Father | 120 (13.1%) | 2.76 |
| Single Female/Mother | 227 (24.7%) | 3.14 |
| Total Families | 918 (100.0%) | 3.06 |
Median Household Size in Elroy
The median household size in Elroy is 2.57 persons per household, with single female/mother households (227 | 16.7%) accounting for the largest median household size of 3.47 persons per household. non-family households (444 | 32.6%) represent the smallest median household size with 1.29 persons per household.
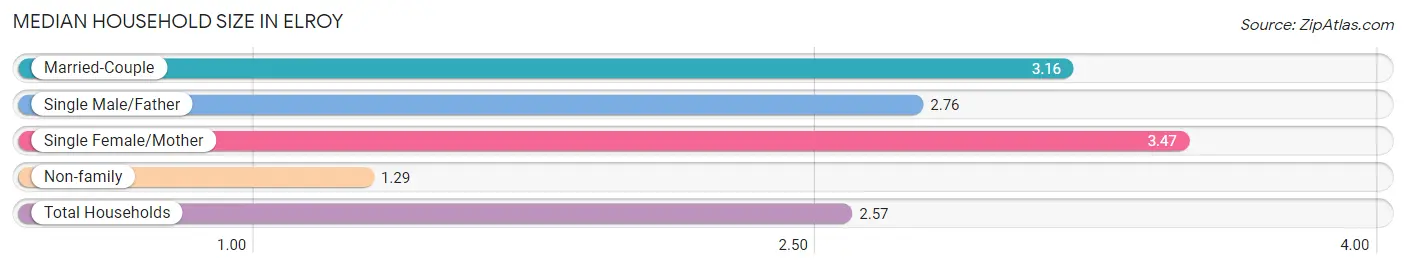
| Household Type | # Households | Household Size |
| Married-Couple | 571 (41.9%) | 3.16 |
| Single Male/Father | 120 (8.8%) | 2.76 |
| Single Female/Mother | 227 (16.7%) | 3.47 |
| Non-family | 444 (32.6%) | 1.29 |
| Total Households | 1,362 (100.0%) | 2.57 |
Household Size by Marriage Status in Elroy
Out of a total of 1,362 households in Elroy, 918 (67.4%) are family households, while 444 (32.6%) are nonfamily households. The most numerous type of family households are 2-person households, comprising 345, and the most common type of nonfamily households are 1-person households, comprising 310.
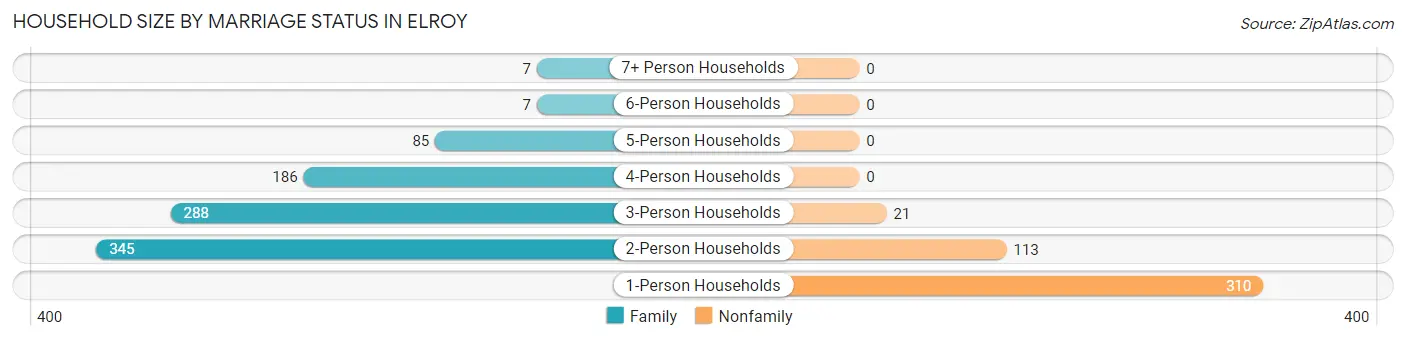
| Household Size | Family Households | Nonfamily Households |
| 1-Person Households | - | 310 (22.8%) |
| 2-Person Households | 345 (25.3%) | 113 (8.3%) |
| 3-Person Households | 288 (21.1%) | 21 (1.5%) |
| 4-Person Households | 186 (13.7%) | 0 (0.0%) |
| 5-Person Households | 85 (6.2%) | 0 (0.0%) |
| 6-Person Households | 7 (0.5%) | 0 (0.0%) |
| 7+ Person Households | 7 (0.5%) | 0 (0.0%) |
| Total | 918 (67.4%) | 444 (32.6%) |
Female Fertility in Elroy
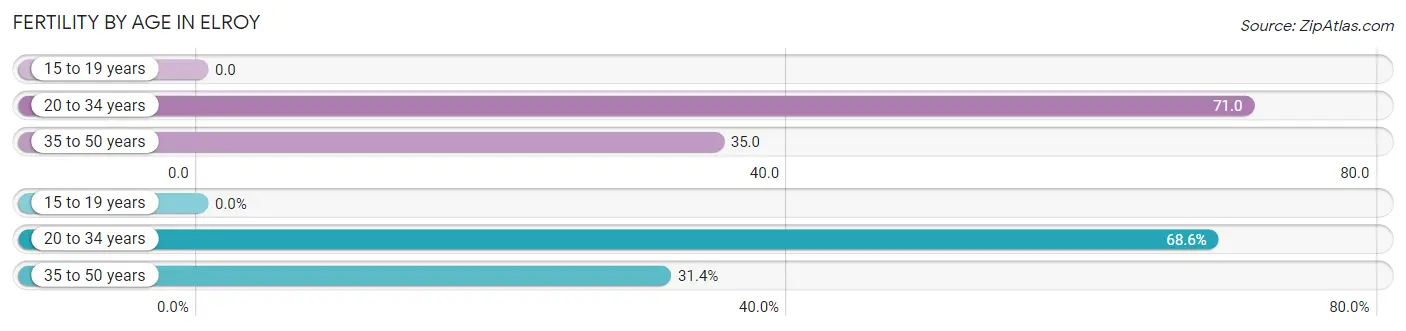
Fertility by Age in Elroy
Average fertility rate in Elroy is 45.0 births per 1,000 women. Women in the age bracket of 20 to 34 years have the highest fertility rate with 71.0 births per 1,000 women. Women in the age bracket of 20 to 34 years acount for 68.6% of all women with births.
| Age Bracket | Women with Births | Births / 1,000 Women |
| 15 to 19 years | 0 (0.0%) | 0.0 |
| 20 to 34 years | 24 (68.6%) | 71.0 |
| 35 to 50 years | 11 (31.4%) | 35.0 |
| Total | 35 (100.0%) | 45.0 |
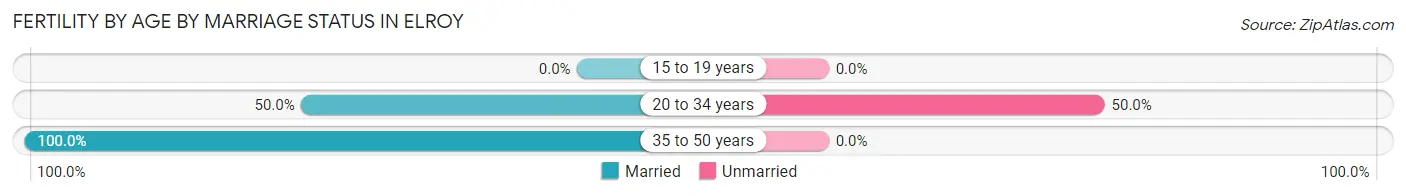
Fertility by Age by Marriage Status in Elroy
65.7% of women with births (35) in Elroy are married. The highest percentage of unmarried women with births falls into 20 to 34 years age bracket with 50.0% of them unmarried at the time of birth, while the lowest percentage of unmarried women with births belong to 35 to 50 years age bracket with 0.0% of them unmarried.
| Age Bracket | Married | Unmarried |
| 15 to 19 years | 0 (0.0%) | 0 (0.0%) |
| 20 to 34 years | 12 (50.0%) | 12 (50.0%) |
| 35 to 50 years | 11 (100.0%) | 0 (0.0%) |
| Total | 23 (65.7%) | 12 (34.3%) |
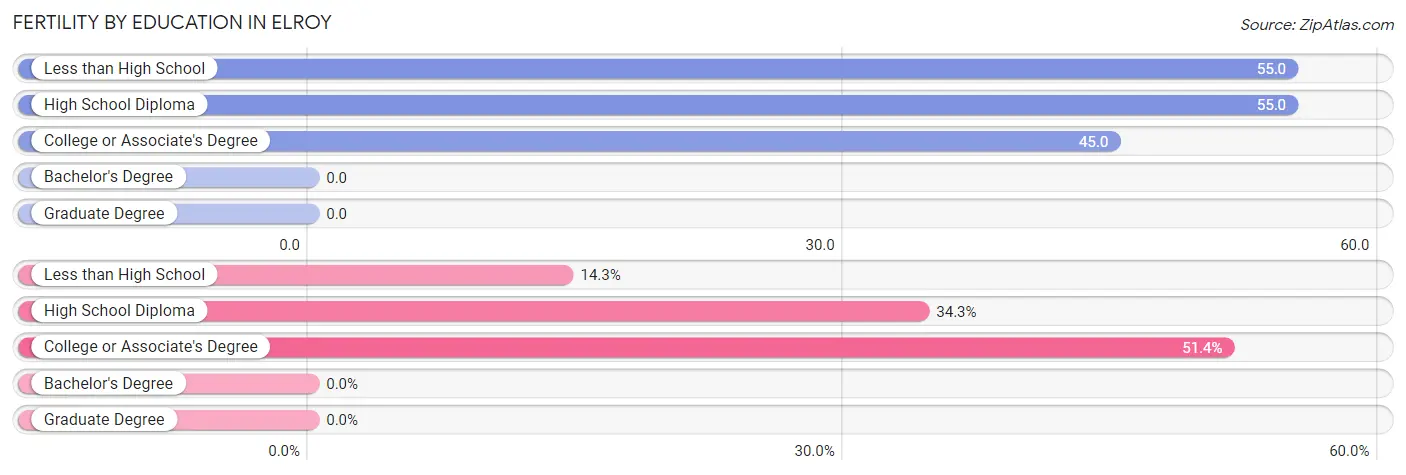
Fertility by Education in Elroy
| Educational Attainment | Women with Births | Births / 1,000 Women |
| Less than High School | 5 (14.3%) | 55.0 |
| High School Diploma | 12 (34.3%) | 55.0 |
| College or Associate's Degree | 18 (51.4%) | 45.0 |
| Bachelor's Degree | 0 (0.0%) | 0.0 |
| Graduate Degree | 0 (0.0%) | 0.0 |
| Total | 35 (100.0%) | 45.0 |
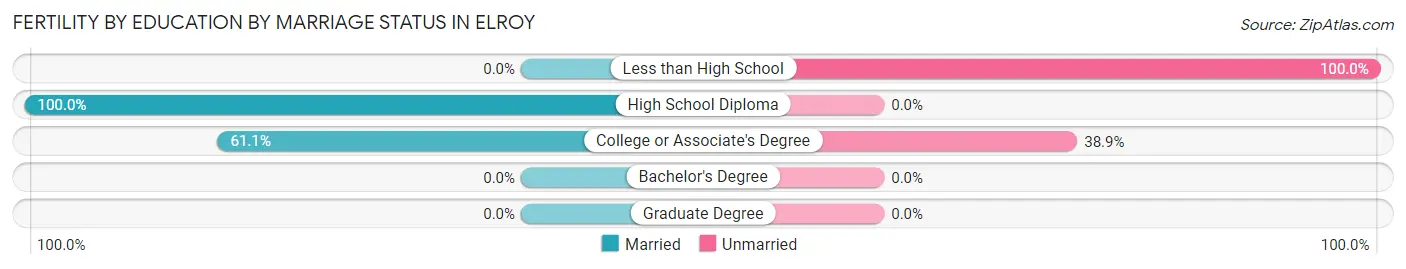
Fertility by Education by Marriage Status in Elroy
34.3% of women with births in Elroy are unmarried. Women with the educational attainment of high school diploma are most likely to be married with 100.0% of them married at childbirth, while women with the educational attainment of less than high school are least likely to be married with 100.0% of them unmarried at childbirth.
| Educational Attainment | Married | Unmarried |
| Less than High School | 0 (0.0%) | 5 (100.0%) |
| High School Diploma | 12 (100.0%) | 0 (0.0%) |
| College or Associate's Degree | 11 (61.1%) | 7 (38.9%) |
| Bachelor's Degree | 0 (0.0%) | 0 (0.0%) |
| Graduate Degree | 0 (0.0%) | 0 (0.0%) |
| Total | 23 (65.7%) | 12 (34.3%) |
Income in Elroy
Income Overview in Elroy
Per Capita Income in Elroy is $26,360, while median incomes of families and households are $71,071 and $59,505 respectively.
| Characteristic | Number | Measure |
| Per Capita Income | 3,495 | $26,360 |
| Median Family Income | 918 | $71,071 |
| Mean Family Income | 918 | $73,093 |
| Median Household Income | 1,362 | $59,505 |
| Mean Household Income | 1,362 | $67,837 |
| Income Deficit | 918 | $0 |
| Wage / Income Gap (%) | 3,495 | 16.58% |
| Wage / Income Gap ($) | 3,495 | 83.42¢ per $1 |
| Gini / Inequality Index | 3,495 | 0.38 |
Earnings by Sex in Elroy
Average Earnings in Elroy are $29,250, $32,153 for men and $26,823 for women, a difference of 16.6%.
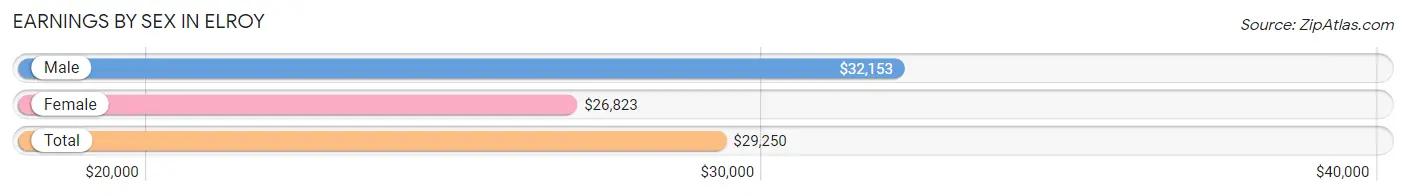
| Sex | Number | Average Earnings |
| Male | 851 (47.9%) | $32,153 |
| Female | 925 (52.1%) | $26,823 |
| Total | 1,776 (100.0%) | $29,250 |
Earnings by Sex by Income Bracket in Elroy
The most common earnings brackets in Elroy are $55,000 to $64,999 for men (110 | 12.9%) and $45,000 to $49,999 for women (110 | 11.9%).
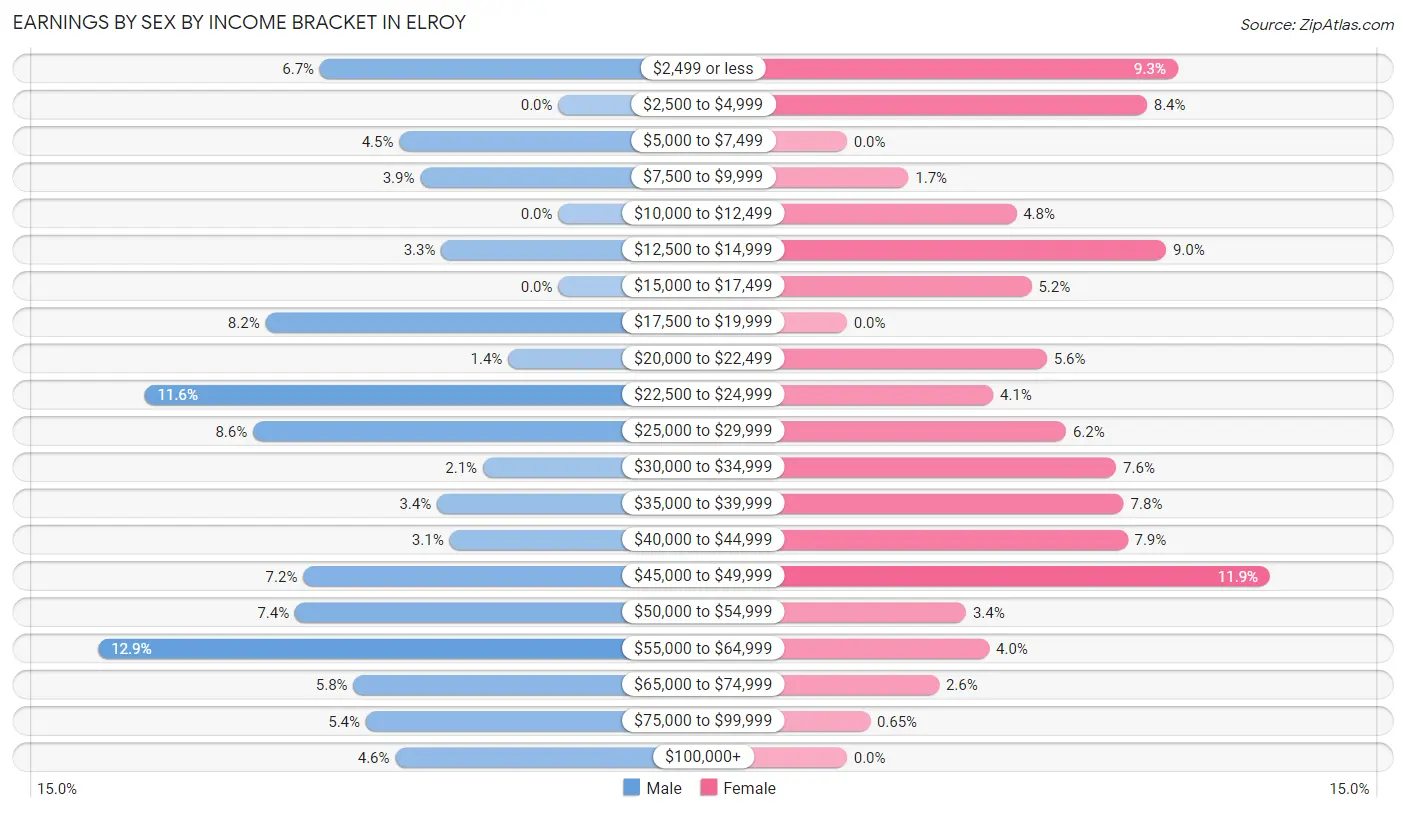
| Income | Male | Female |
| $2,499 or less | 57 (6.7%) | 86 (9.3%) |
| $2,500 to $4,999 | 0 (0.0%) | 78 (8.4%) |
| $5,000 to $7,499 | 38 (4.5%) | 0 (0.0%) |
| $7,500 to $9,999 | 33 (3.9%) | 16 (1.7%) |
| $10,000 to $12,499 | 0 (0.0%) | 44 (4.8%) |
| $12,500 to $14,999 | 28 (3.3%) | 83 (9.0%) |
| $15,000 to $17,499 | 0 (0.0%) | 48 (5.2%) |
| $17,500 to $19,999 | 70 (8.2%) | 0 (0.0%) |
| $20,000 to $22,499 | 12 (1.4%) | 52 (5.6%) |
| $22,500 to $24,999 | 99 (11.6%) | 38 (4.1%) |
| $25,000 to $29,999 | 73 (8.6%) | 57 (6.2%) |
| $30,000 to $34,999 | 18 (2.1%) | 70 (7.6%) |
| $35,000 to $39,999 | 29 (3.4%) | 72 (7.8%) |
| $40,000 to $44,999 | 26 (3.1%) | 73 (7.9%) |
| $45,000 to $49,999 | 61 (7.2%) | 110 (11.9%) |
| $50,000 to $54,999 | 63 (7.4%) | 31 (3.4%) |
| $55,000 to $64,999 | 110 (12.9%) | 37 (4.0%) |
| $65,000 to $74,999 | 49 (5.8%) | 24 (2.6%) |
| $75,000 to $99,999 | 46 (5.4%) | 6 (0.6%) |
| $100,000+ | 39 (4.6%) | 0 (0.0%) |
| Total | 851 (100.0%) | 925 (100.0%) |
Earnings by Sex by Educational Attainment in Elroy
Average earnings in Elroy are $41,429 for men and $30,179 for women, a difference of 27.2%. Men with an educational attainment of college or associate's degree enjoy the highest average annual earnings of $51,845, while those with high school diploma education earn the least with $23,882. Women with an educational attainment of bachelor's degree earn the most with the average annual earnings of $56,023, while those with college or associate's degree education have the smallest earnings of $27,545.
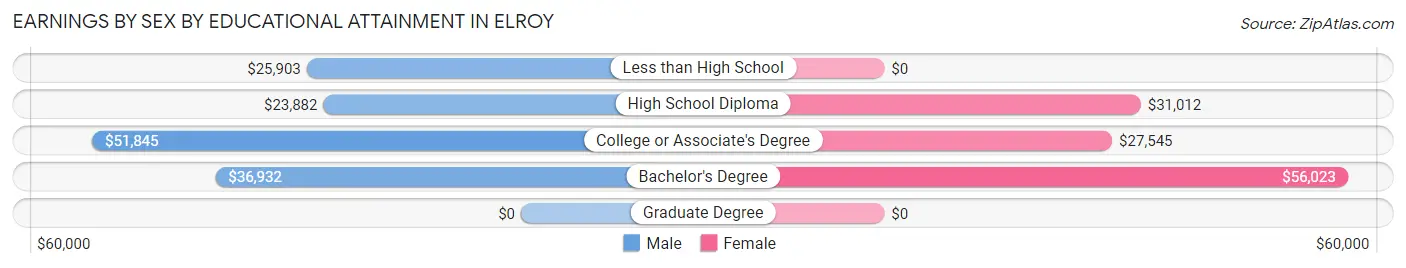
| Educational Attainment | Male Income | Female Income |
| Less than High School | $25,903 | $0 |
| High School Diploma | $23,882 | $31,012 |
| College or Associate's Degree | $51,845 | $27,545 |
| Bachelor's Degree | $36,932 | $56,023 |
| Graduate Degree | - | - |
| Total | $41,429 | $30,179 |
Family Income in Elroy
Family Income Brackets in Elroy
According to the Elroy family income data, there are 239 families falling into the $75,000 to $99,999 income range, which is the most common income bracket and makes up 26.0% of all families. Conversely, the $150,000 to $199,999 income bracket is the least frequent group with only 11 families (1.2%) belonging to this category.
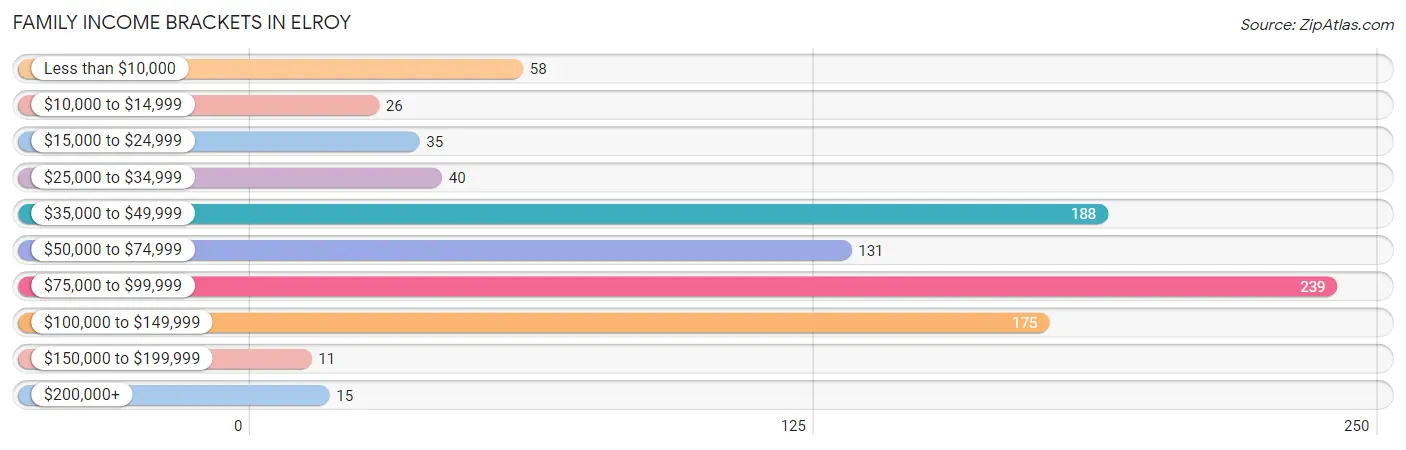
| Income Bracket | # Families | % Families |
| Less than $10,000 | 58 | 6.3% |
| $10,000 to $14,999 | 26 | 2.8% |
| $15,000 to $24,999 | 35 | 3.8% |
| $25,000 to $34,999 | 40 | 4.4% |
| $35,000 to $49,999 | 188 | 20.5% |
| $50,000 to $74,999 | 131 | 14.3% |
| $75,000 to $99,999 | 239 | 26.0% |
| $100,000 to $149,999 | 175 | 19.1% |
| $150,000 to $199,999 | 11 | 1.2% |
| $200,000+ | 15 | 1.6% |
Family Income by Famaliy Size in Elroy
4-person families (172 | 18.7%) account for the highest median family income in Elroy with $91,225 per family, while 2-person families (391 | 42.6%) have the highest median income of $25,625 per family member.
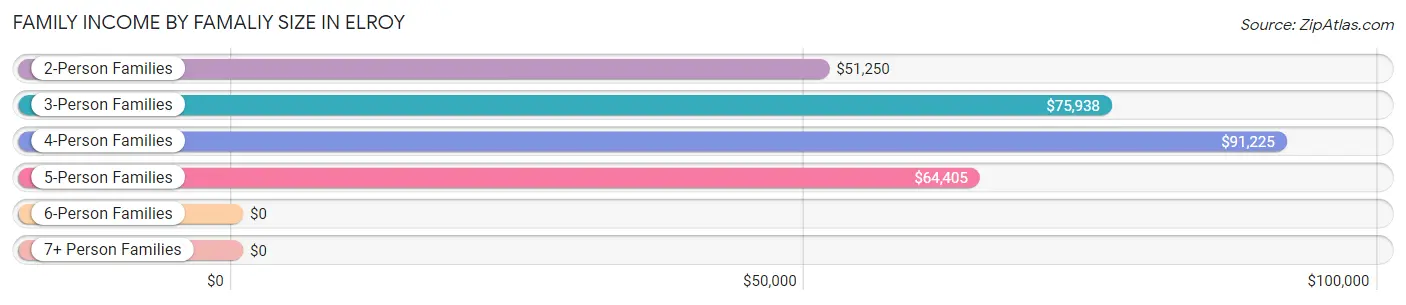
| Income Bracket | # Families | Median Income |
| 2-Person Families | 391 (42.6%) | $51,250 |
| 3-Person Families | 289 (31.5%) | $75,938 |
| 4-Person Families | 172 (18.7%) | $91,225 |
| 5-Person Families | 52 (5.7%) | $64,405 |
| 6-Person Families | 7 (0.8%) | $0 |
| 7+ Person Families | 7 (0.8%) | $0 |
| Total | 918 (100.0%) | $71,071 |
Family Income by Number of Earners in Elroy
The median family income in Elroy is $71,071, with families comprising 3+ earners (129) having the highest median family income of $100,906, while families with 1 earner (333) have the lowest median family income of $49,684, accounting for 14.1% and 36.3% of families, respectively.
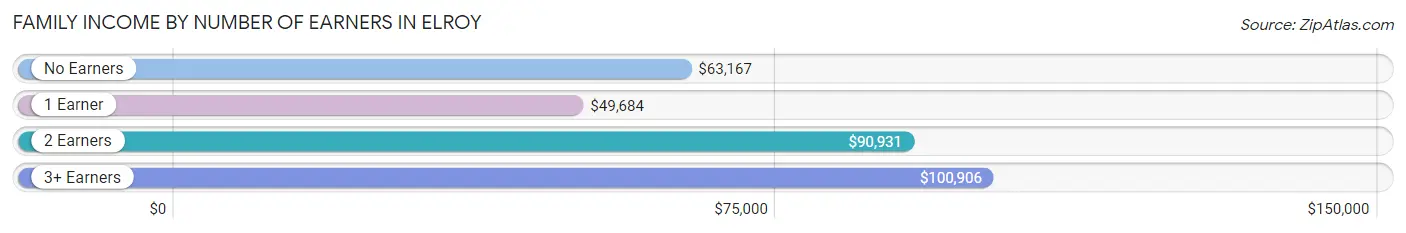
| Number of Earners | # Families | Median Income |
| No Earners | 168 (18.3%) | $63,167 |
| 1 Earner | 333 (36.3%) | $49,684 |
| 2 Earners | 288 (31.4%) | $90,931 |
| 3+ Earners | 129 (14.1%) | $100,906 |
| Total | 918 (100.0%) | $71,071 |
Household Income in Elroy
Household Income Brackets in Elroy
With 285 households falling in the category, the $75,000 to $99,999 income range is the most frequent in Elroy, accounting for 20.9% of all households. In contrast, only 30 households (2.2%) fall into the $200,000+ income bracket, making it the least populous group.
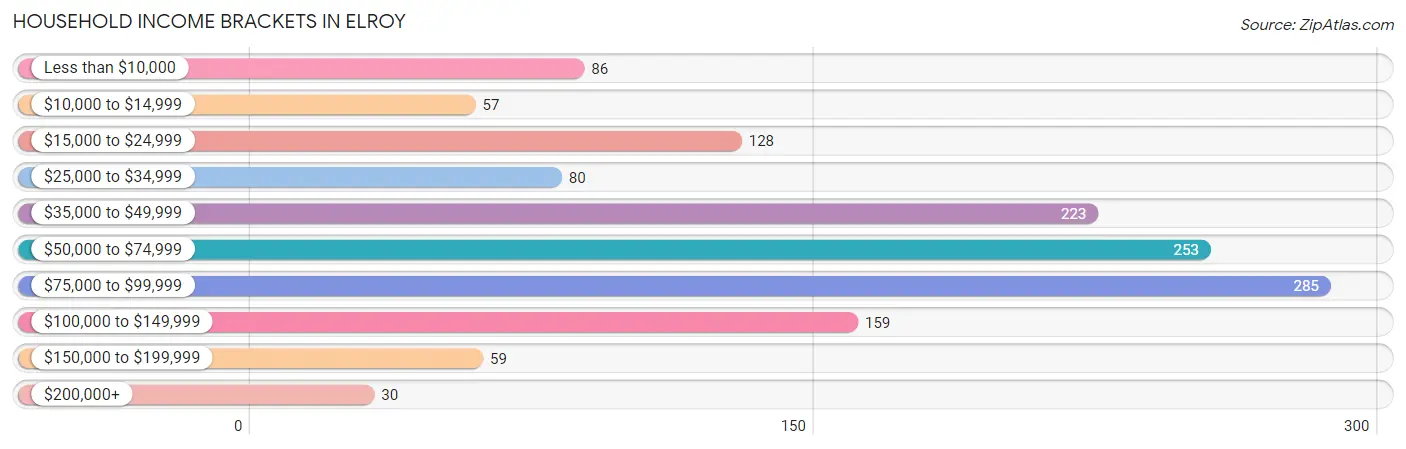
| Income Bracket | # Households | % Households |
| Less than $10,000 | 86 | 6.3% |
| $10,000 to $14,999 | 57 | 4.2% |
| $15,000 to $24,999 | 128 | 9.4% |
| $25,000 to $34,999 | 80 | 5.9% |
| $35,000 to $49,999 | 223 | 16.4% |
| $50,000 to $74,999 | 253 | 18.6% |
| $75,000 to $99,999 | 285 | 20.9% |
| $100,000 to $149,999 | 159 | 11.7% |
| $150,000 to $199,999 | 59 | 4.3% |
| $200,000+ | 30 | 2.2% |
Household Income by Householder Age in Elroy
The median household income in Elroy is $59,505, with the highest median household income of $71,250 found in the 65+ years age bracket for the primary householder. A total of 357 households (26.2%) fall into this category. Meanwhile, the 15 to 24 years age bracket for the primary householder has the lowest median household income of $0, with 80 households (5.9%) in this group.
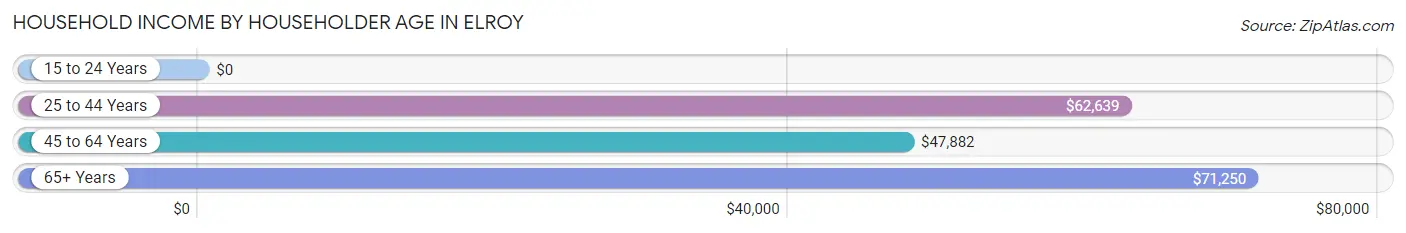
| Income Bracket | # Households | Median Income |
| 15 to 24 Years | 80 (5.9%) | $0 |
| 25 to 44 Years | 392 (28.8%) | $62,639 |
| 45 to 64 Years | 533 (39.1%) | $47,882 |
| 65+ Years | 357 (26.2%) | $71,250 |
| Total | 1,362 (100.0%) | $59,505 |
Poverty in Elroy
Income Below Poverty by Sex and Age in Elroy
With 8.8% poverty level for males and 15.8% for females among the residents of Elroy, 15 year old males and 12 to 14 year old females are the most vulnerable to poverty, with 11 males (30.6%) and 16 females (33.3%) in their respective age groups living below the poverty level.
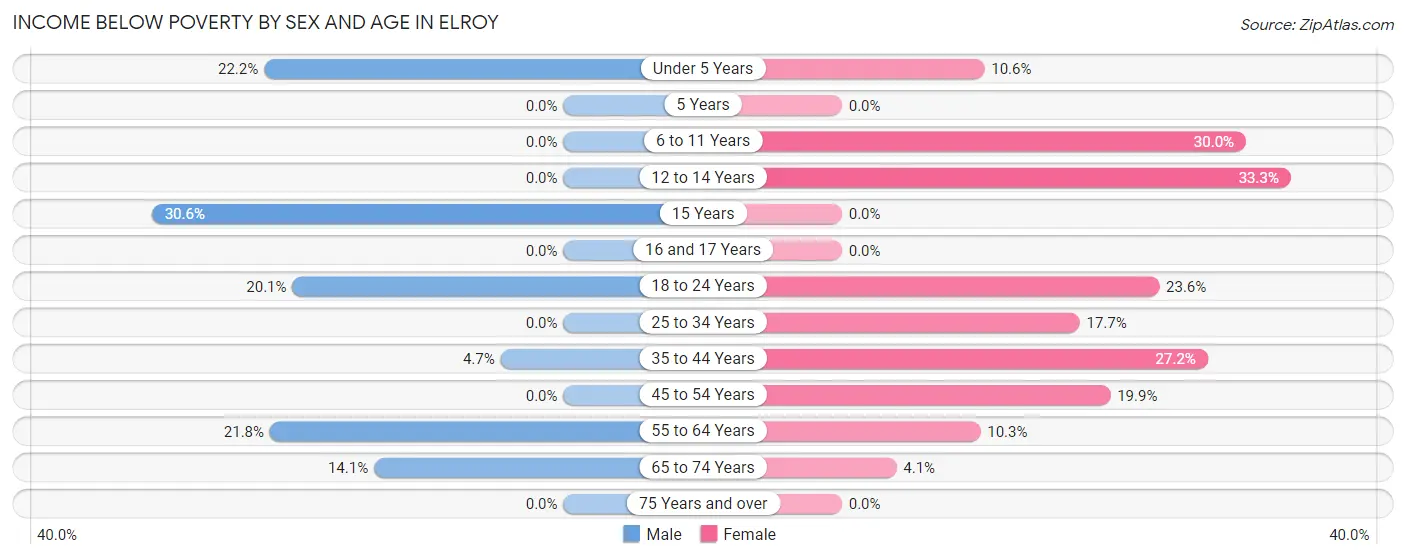
| Age Bracket | Male | Female |
| Under 5 Years | 34 (22.2%) | 11 (10.6%) |
| 5 Years | 0 (0.0%) | 0 (0.0%) |
| 6 to 11 Years | 0 (0.0%) | 27 (30.0%) |
| 12 to 14 Years | 0 (0.0%) | 16 (33.3%) |
| 15 Years | 11 (30.6%) | 0 (0.0%) |
| 16 and 17 Years | 0 (0.0%) | 0 (0.0%) |
| 18 to 24 Years | 33 (20.1%) | 45 (23.6%) |
| 25 to 34 Years | 0 (0.0%) | 42 (17.6%) |
| 35 to 44 Years | 11 (4.7%) | 44 (27.2%) |
| 45 to 54 Years | 0 (0.0%) | 55 (19.9%) |
| 55 to 64 Years | 39 (21.8%) | 26 (10.3%) |
| 65 to 74 Years | 27 (14.1%) | 9 (4.1%) |
| 75 Years and over | 0 (0.0%) | 0 (0.0%) |
| Total | 155 (8.8%) | 275 (15.8%) |
Income Above Poverty by Sex and Age in Elroy
According to the poverty statistics in Elroy, males aged 5 years and females aged 5 years are the age groups that are most secure financially, with 100.0% of males and 100.0% of females in these age groups living above the poverty line.
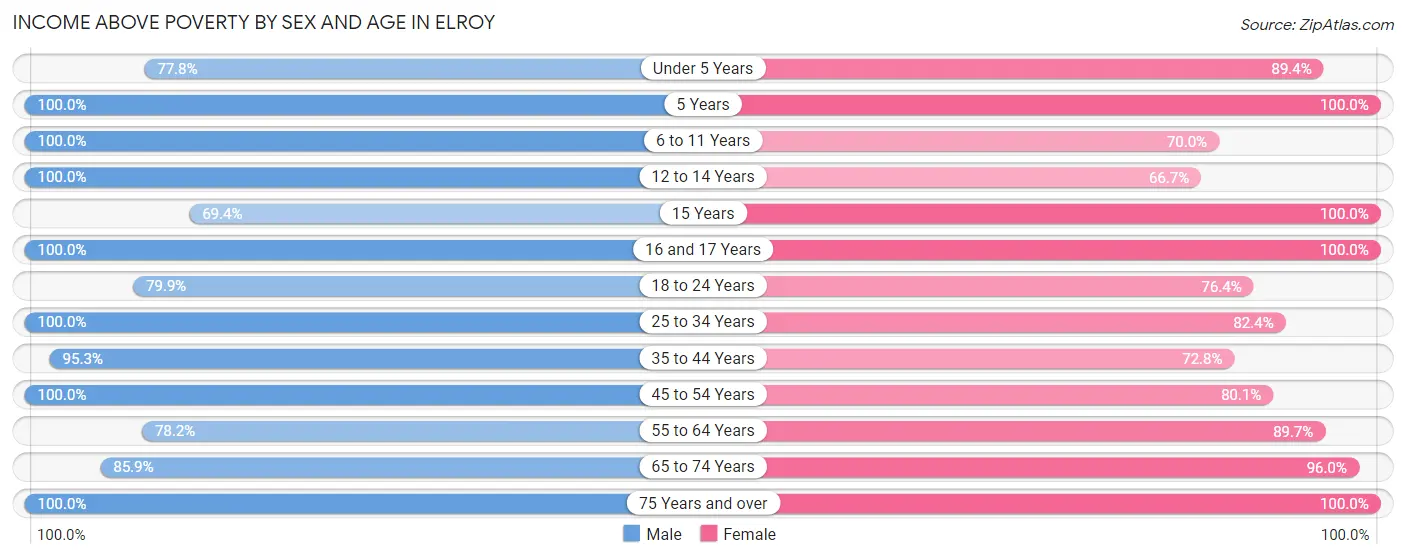
| Age Bracket | Male | Female |
| Under 5 Years | 119 (77.8%) | 93 (89.4%) |
| 5 Years | 10 (100.0%) | 16 (100.0%) |
| 6 to 11 Years | 202 (100.0%) | 63 (70.0%) |
| 12 to 14 Years | 34 (100.0%) | 32 (66.7%) |
| 15 Years | 25 (69.4%) | 27 (100.0%) |
| 16 and 17 Years | 7 (100.0%) | 6 (100.0%) |
| 18 to 24 Years | 131 (79.9%) | 146 (76.4%) |
| 25 to 34 Years | 244 (100.0%) | 196 (82.4%) |
| 35 to 44 Years | 225 (95.3%) | 118 (72.8%) |
| 45 to 54 Years | 177 (100.0%) | 221 (80.1%) |
| 55 to 64 Years | 140 (78.2%) | 227 (89.7%) |
| 65 to 74 Years | 165 (85.9%) | 213 (96.0%) |
| 75 Years and over | 123 (100.0%) | 105 (100.0%) |
| Total | 1,602 (91.2%) | 1,463 (84.2%) |
Income Below Poverty Among Married-Couple Families in Elroy
The poverty statistics for married-couple families in Elroy show that 1.8% or 10 of the total 571 families live below the poverty line. Families with 3 or 4 children have the highest poverty rate of 58.8%, comprising of 10 families. On the other hand, families with no children have the lowest poverty rate of 0.0%, which includes 0 families.
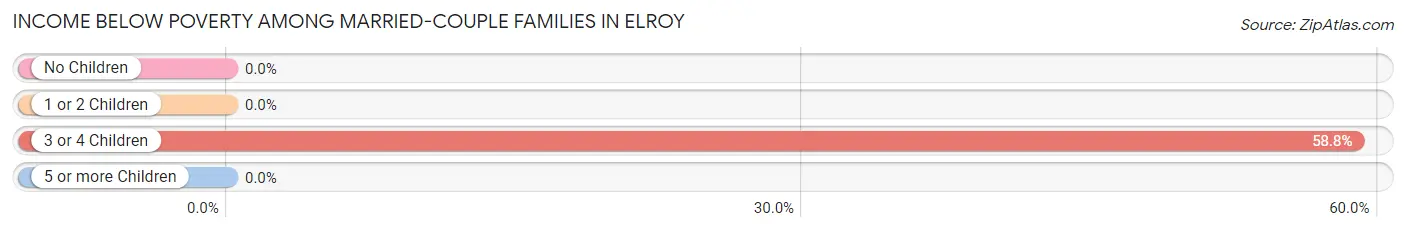
| Children | Above Poverty | Below Poverty |
| No Children | 401 (100.0%) | 0 (0.0%) |
| 1 or 2 Children | 153 (100.0%) | 0 (0.0%) |
| 3 or 4 Children | 7 (41.2%) | 10 (58.8%) |
| 5 or more Children | 0 (0.0%) | 0 (0.0%) |
| Total | 561 (98.3%) | 10 (1.8%) |
Income Below Poverty Among Single-Parent Households in Elroy
According to the poverty data in Elroy, 27.5% or 33 single-father households and 22.5% or 51 single-mother households are living below the poverty line. Among single-father households, those with 1 or 2 children have the highest poverty rate, with 33 households (50.8%) experiencing poverty. Likewise, among single-mother households, those with 3 or 4 children have the highest poverty rate, with 10 households (100.0%) falling below the poverty line.
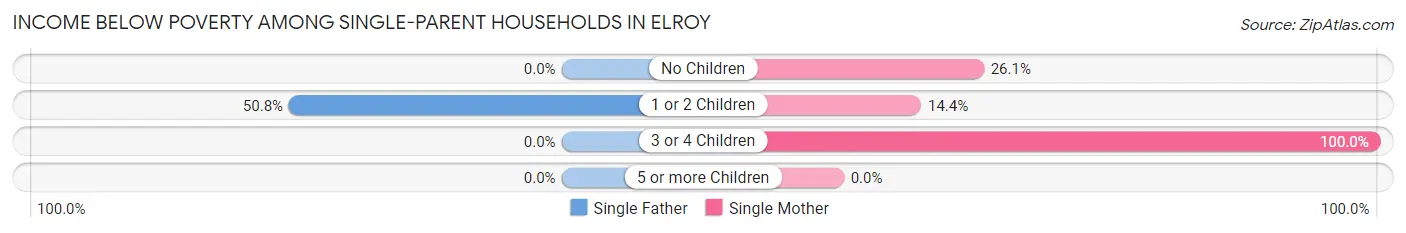
| Children | Single Father | Single Mother |
| No Children | 0 (0.0%) | 24 (26.1%) |
| 1 or 2 Children | 33 (50.8%) | 17 (14.4%) |
| 3 or 4 Children | 0 (0.0%) | 10 (100.0%) |
| 5 or more Children | 0 (0.0%) | 0 (0.0%) |
| Total | 33 (27.5%) | 51 (22.5%) |
Income Below Poverty Among Married-Couple vs Single-Parent Households in Elroy
The poverty data for Elroy shows that 10 of the married-couple family households (1.8%) and 84 of the single-parent households (24.2%) are living below the poverty level. Within the married-couple family households, those with 3 or 4 children have the highest poverty rate, with 10 households (58.8%) falling below the poverty line. Among the single-parent households, those with 3 or 4 children have the highest poverty rate, with 10 household (100.0%) living below poverty.
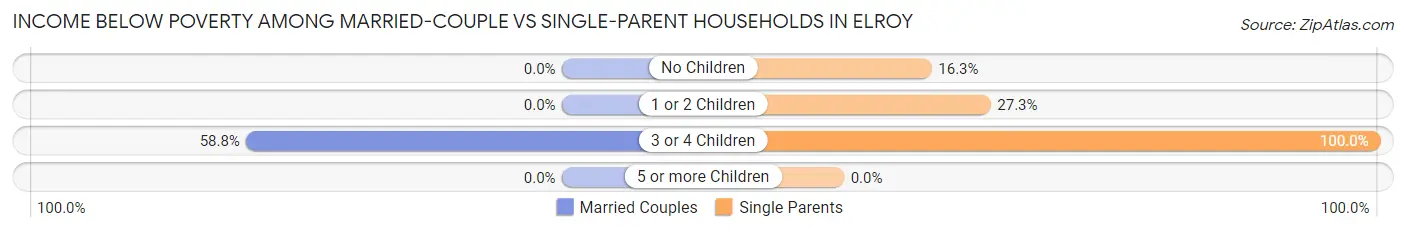
| Children | Married-Couple Families | Single-Parent Households |
| No Children | 0 (0.0%) | 24 (16.3%) |
| 1 or 2 Children | 0 (0.0%) | 50 (27.3%) |
| 3 or 4 Children | 10 (58.8%) | 10 (100.0%) |
| 5 or more Children | 0 (0.0%) | 0 (0.0%) |
| Total | 10 (1.8%) | 84 (24.2%) |
Employment Characteristics in Elroy
Employment by Class of Employer in Elroy
Among the 1,497 employed individuals in Elroy, private company employees (1,022 | 68.3%), not-for-profit organizations (129 | 8.6%), and federal government employees (92 | 6.1%) make up the most common classes of employment.
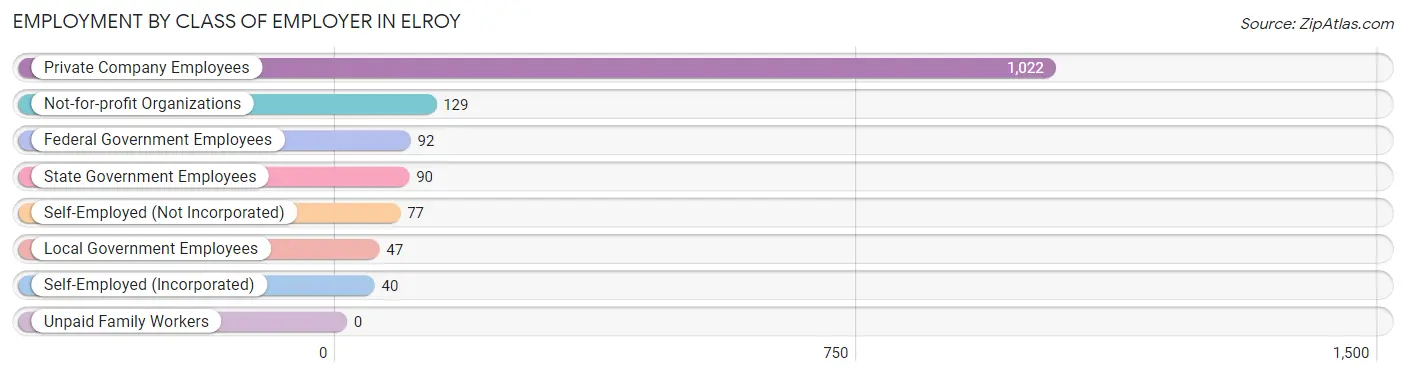
| Employer Class | # Employees | % Employees |
| Private Company Employees | 1,022 | 68.3% |
| Self-Employed (Incorporated) | 40 | 2.7% |
| Self-Employed (Not Incorporated) | 77 | 5.1% |
| Not-for-profit Organizations | 129 | 8.6% |
| Local Government Employees | 47 | 3.1% |
| State Government Employees | 90 | 6.0% |
| Federal Government Employees | 92 | 6.1% |
| Unpaid Family Workers | 0 | 0.0% |
| Total | 1,497 | 100.0% |
Employment Status by Age in Elroy
According to the labor force statistics for Elroy, out of the total population over 16 years of age (2,775), 57.8% or 1,604 individuals are in the labor force, with 3.3% or 53 of them unemployed. The age group with the highest labor force participation rate is 35 to 44 years, with 89.9% or 358 individuals in the labor force. Within the labor force, the 30 to 34 years age range has the highest percentage of unemployed individuals, with 6.4% or 13 of them being unemployed.
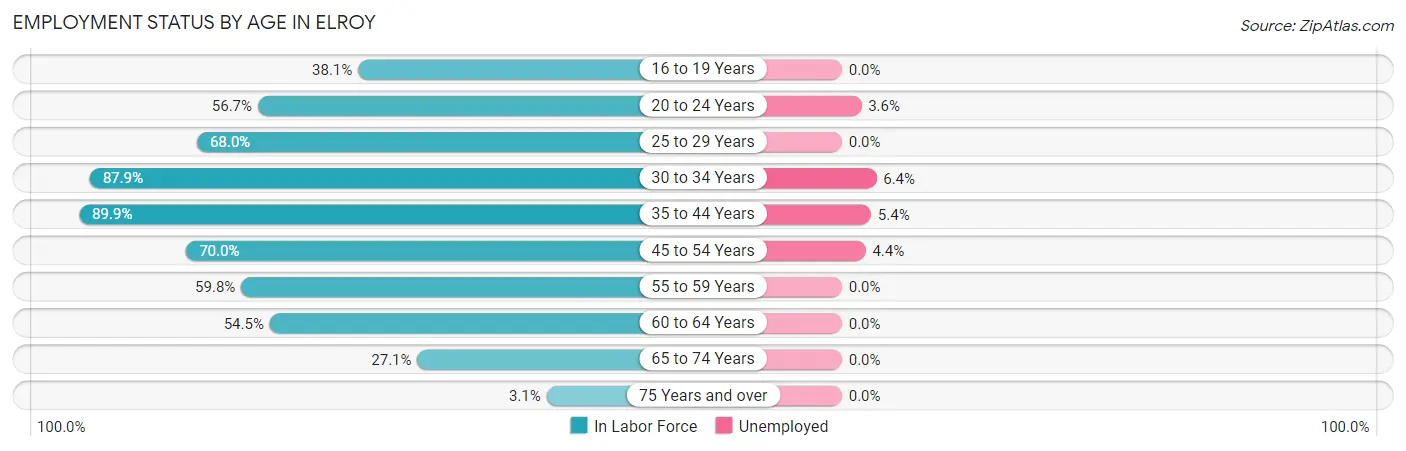
| Age Bracket | In Labor Force | Unemployed |
| 16 to 19 Years | 40 (38.1%) | 0 (0.0%) |
| 20 to 24 Years | 149 (56.7%) | 5 (3.6%) |
| 25 to 29 Years | 170 (68.0%) | 0 (0.0%) |
| 30 to 34 Years | 204 (87.9%) | 13 (6.4%) |
| 35 to 44 Years | 358 (89.9%) | 19 (5.4%) |
| 45 to 54 Years | 317 (70.0%) | 14 (4.4%) |
| 55 to 59 Years | 131 (59.8%) | 0 (0.0%) |
| 60 to 64 Years | 116 (54.5%) | 0 (0.0%) |
| 65 to 74 Years | 112 (27.1%) | 0 (0.0%) |
| 75 Years and over | 7 (3.1%) | 0 (0.0%) |
| Total | 1,604 (57.8%) | 53 (3.3%) |
Employment Status by Educational Attainment in Elroy
According to labor force statistics for Elroy, 73.4% of individuals (1,296) out of the total population between 25 and 64 years of age (1,765) are in the labor force, with 3.6% or 47 of them being unemployed. The group with the highest labor force participation rate are those with the educational attainment of bachelor's degree or higher, with 81.0% or 187 individuals in the labor force. Within the labor force, individuals with less than high school education have the highest percentage of unemployment, with 18.1% or 13 of them being unemployed.
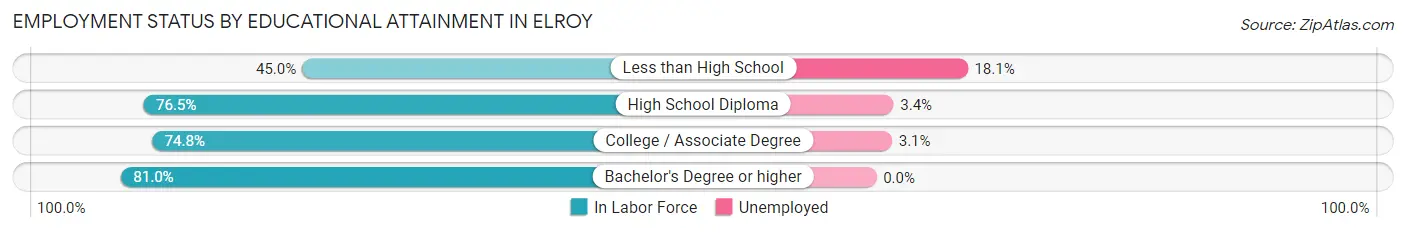
| Educational Attainment | In Labor Force | Unemployed |
| Less than High School | 72 (45.0%) | 29 (18.1%) |
| High School Diploma | 424 (76.5%) | 19 (3.4%) |
| College / Associate Degree | 613 (74.8%) | 25 (3.1%) |
| Bachelor's Degree or higher | 187 (81.0%) | 0 (0.0%) |
| Total | 1,296 (73.4%) | 64 (3.6%) |
Employment Occupations by Sex in Elroy
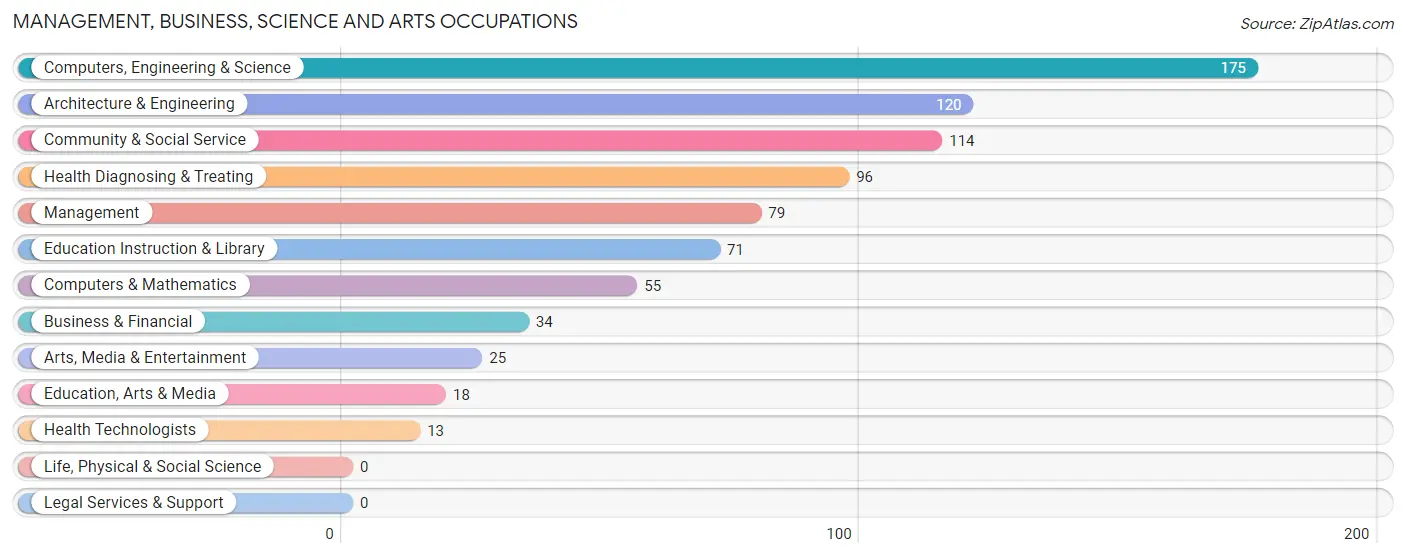
Management, Business, Science and Arts Occupations
The most common Management, Business, Science and Arts occupations in Elroy are Computers, Engineering & Science (175 | 11.6%), Architecture & Engineering (120 | 7.9%), Community & Social Service (114 | 7.5%), Health Diagnosing & Treating (96 | 6.4%), and Management (79 | 5.2%).
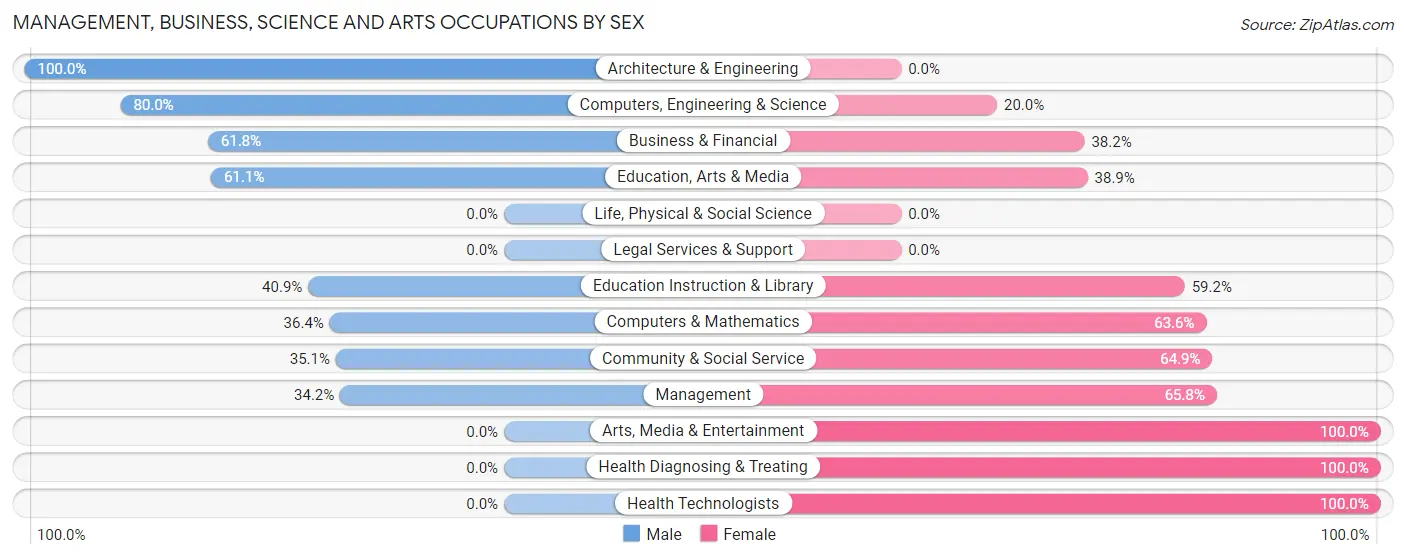
Management, Business, Science and Arts Occupations by Sex
Within the Management, Business, Science and Arts occupations in Elroy, the most male-oriented occupations are Architecture & Engineering (100.0%), Computers, Engineering & Science (80.0%), and Business & Financial (61.8%), while the most female-oriented occupations are Arts, Media & Entertainment (100.0%), Health Diagnosing & Treating (100.0%), and Health Technologists (100.0%).
| Occupation | Male | Female |
| Management | 27 (34.2%) | 52 (65.8%) |
| Business & Financial | 21 (61.8%) | 13 (38.2%) |
| Computers, Engineering & Science | 140 (80.0%) | 35 (20.0%) |
| Computers & Mathematics | 20 (36.4%) | 35 (63.6%) |
| Architecture & Engineering | 120 (100.0%) | 0 (0.0%) |
| Life, Physical & Social Science | 0 (0.0%) | 0 (0.0%) |
| Community & Social Service | 40 (35.1%) | 74 (64.9%) |
| Education, Arts & Media | 11 (61.1%) | 7 (38.9%) |
| Legal Services & Support | 0 (0.0%) | 0 (0.0%) |
| Education Instruction & Library | 29 (40.8%) | 42 (59.2%) |
| Arts, Media & Entertainment | 0 (0.0%) | 25 (100.0%) |
| Health Diagnosing & Treating | 0 (0.0%) | 96 (100.0%) |
| Health Technologists | 0 (0.0%) | 13 (100.0%) |
| Total (Category) | 228 (45.8%) | 270 (54.2%) |
| Total (Overall) | 770 (50.9%) | 742 (49.1%) |
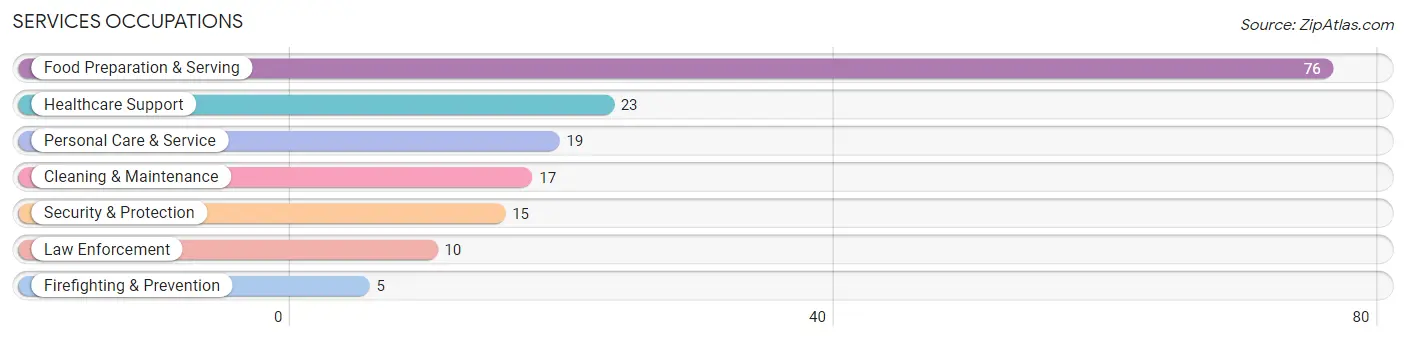
Services Occupations
The most common Services occupations in Elroy are Food Preparation & Serving (76 | 5.0%), Healthcare Support (23 | 1.5%), Personal Care & Service (19 | 1.3%), Cleaning & Maintenance (17 | 1.1%), and Security & Protection (15 | 1.0%).
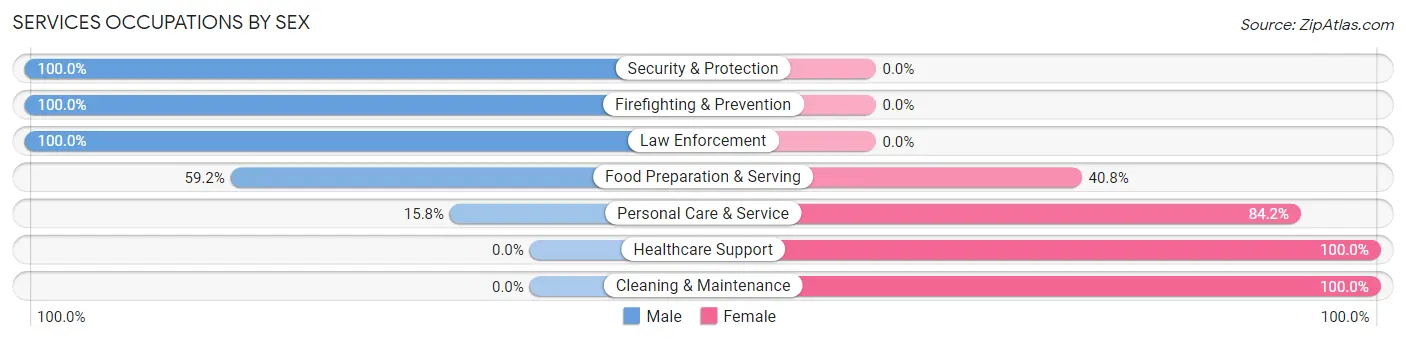
Services Occupations by Sex
Within the Services occupations in Elroy, the most male-oriented occupations are Security & Protection (100.0%), Firefighting & Prevention (100.0%), and Law Enforcement (100.0%), while the most female-oriented occupations are Healthcare Support (100.0%), Cleaning & Maintenance (100.0%), and Personal Care & Service (84.2%).
| Occupation | Male | Female |
| Healthcare Support | 0 (0.0%) | 23 (100.0%) |
| Security & Protection | 15 (100.0%) | 0 (0.0%) |
| Firefighting & Prevention | 5 (100.0%) | 0 (0.0%) |
| Law Enforcement | 10 (100.0%) | 0 (0.0%) |
| Food Preparation & Serving | 45 (59.2%) | 31 (40.8%) |
| Cleaning & Maintenance | 0 (0.0%) | 17 (100.0%) |
| Personal Care & Service | 3 (15.8%) | 16 (84.2%) |
| Total (Category) | 63 (42.0%) | 87 (58.0%) |
| Total (Overall) | 770 (50.9%) | 742 (49.1%) |
Sales and Office Occupations
The most common Sales and Office occupations in Elroy are Sales & Related (194 | 12.8%), and Office & Administration (180 | 11.9%).
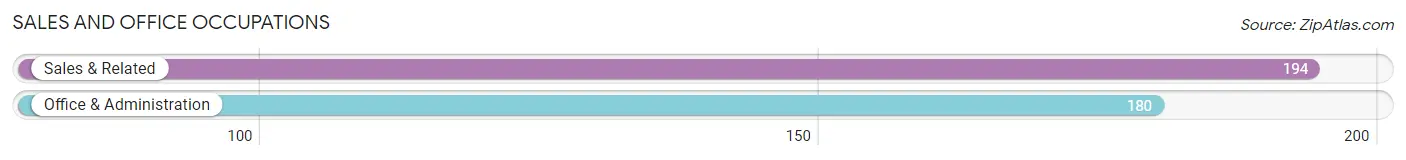
Sales and Office Occupations by Sex

| Occupation | Male | Female |
| Sales & Related | 124 (63.9%) | 70 (36.1%) |
| Office & Administration | 25 (13.9%) | 155 (86.1%) |
| Total (Category) | 149 (39.8%) | 225 (60.2%) |
| Total (Overall) | 770 (50.9%) | 742 (49.1%) |
Natural Resources, Construction and Maintenance Occupations
The most common Natural Resources, Construction and Maintenance occupations in Elroy are Installation, Maintenance & Repair (109 | 7.2%), and Construction & Extraction (29 | 1.9%).

Natural Resources, Construction and Maintenance Occupations by Sex
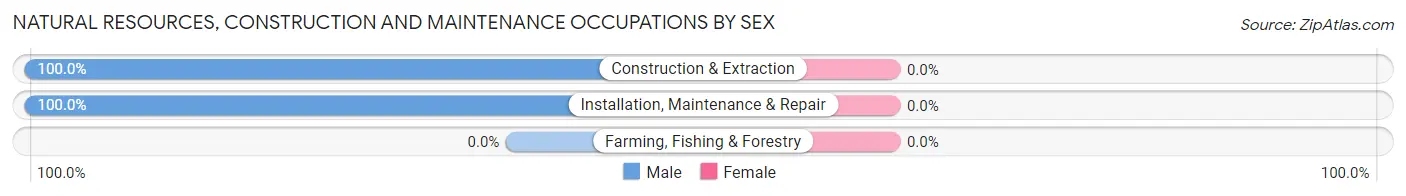
| Occupation | Male | Female |
| Farming, Fishing & Forestry | 0 (0.0%) | 0 (0.0%) |
| Construction & Extraction | 29 (100.0%) | 0 (0.0%) |
| Installation, Maintenance & Repair | 109 (100.0%) | 0 (0.0%) |
| Total (Category) | 138 (100.0%) | 0 (0.0%) |
| Total (Overall) | 770 (50.9%) | 742 (49.1%) |
Production, Transportation and Moving Occupations
The most common Production, Transportation and Moving occupations in Elroy are Material Moving (155 | 10.2%), Production (151 | 10.0%), and Transportation (46 | 3.0%).
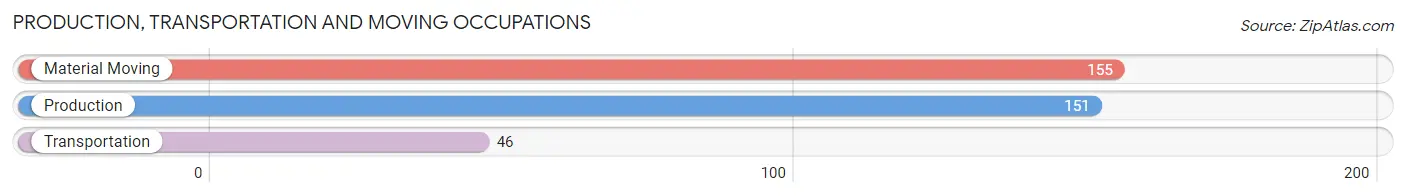
Production, Transportation and Moving Occupations by Sex
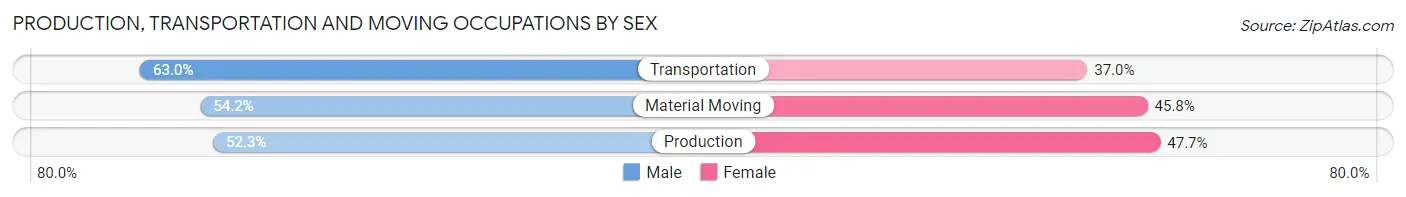
| Occupation | Male | Female |
| Production | 79 (52.3%) | 72 (47.7%) |
| Transportation | 29 (63.0%) | 17 (37.0%) |
| Material Moving | 84 (54.2%) | 71 (45.8%) |
| Total (Category) | 192 (54.5%) | 160 (45.5%) |
| Total (Overall) | 770 (50.9%) | 742 (49.1%) |
Employment Industries by Sex in Elroy
Employment Industries in Elroy
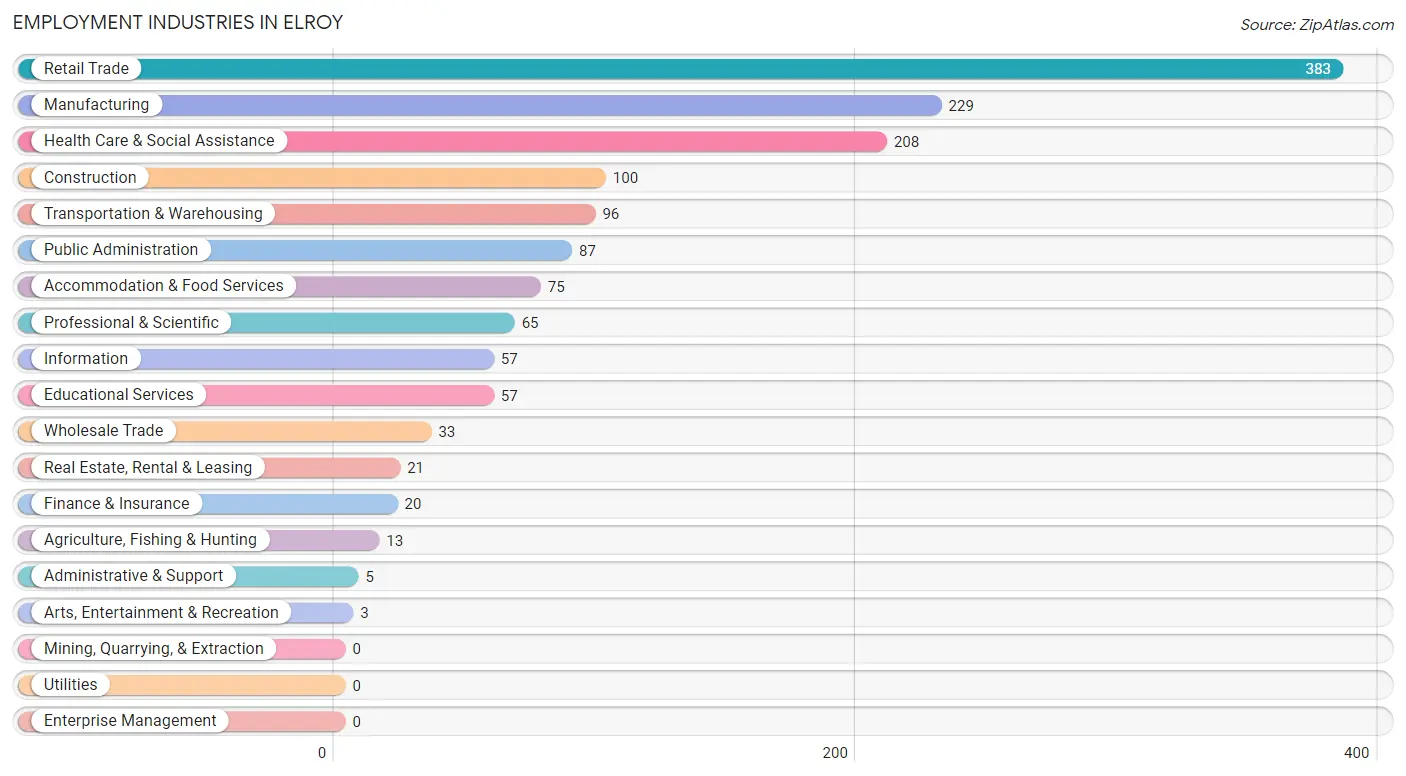
The major employment industries in Elroy include Retail Trade (383 | 25.3%), Manufacturing (229 | 15.1%), Health Care & Social Assistance (208 | 13.8%), Construction (100 | 6.6%), and Transportation & Warehousing (96 | 6.4%).
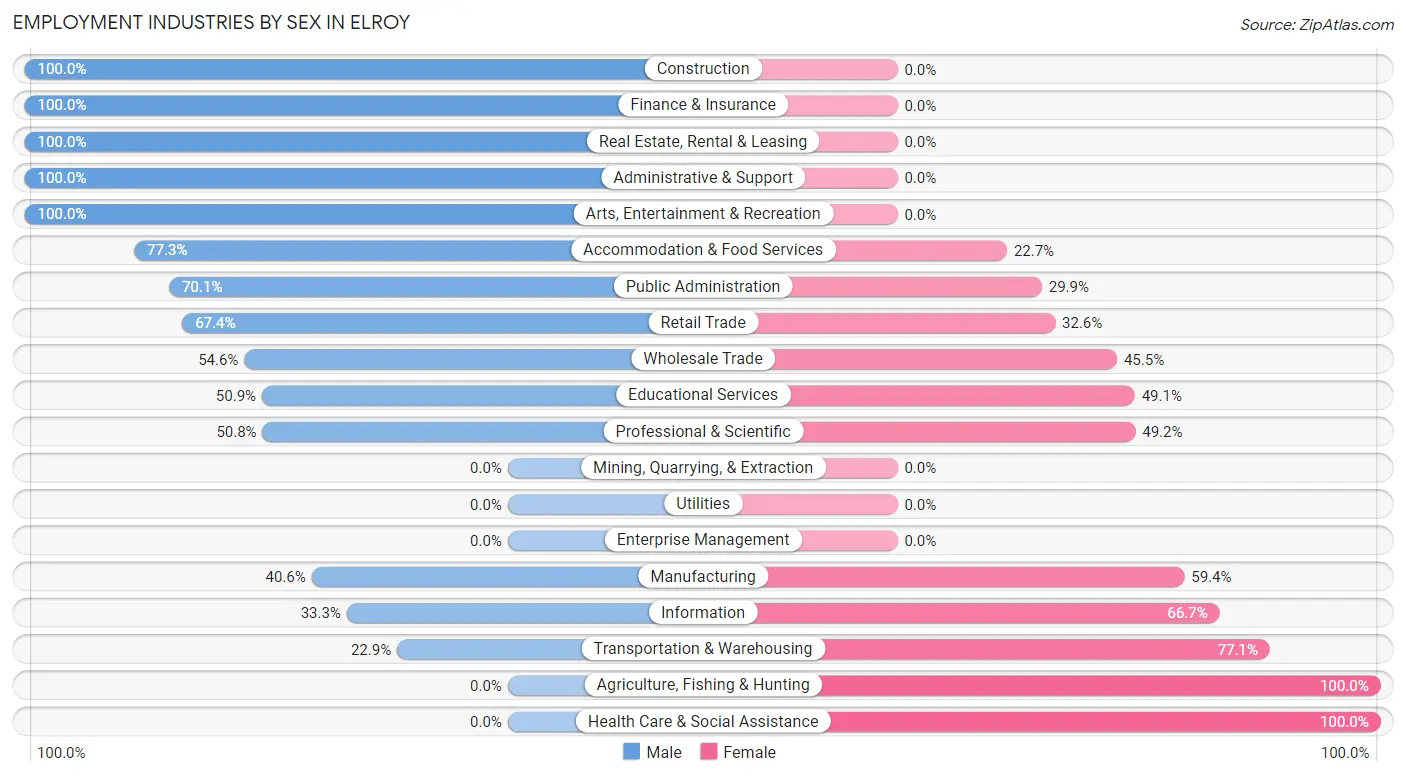
Employment Industries by Sex in Elroy
The Elroy industries that see more men than women are Construction (100.0%), Finance & Insurance (100.0%), and Real Estate, Rental & Leasing (100.0%), whereas the industries that tend to have a higher number of women are Agriculture, Fishing & Hunting (100.0%), Health Care & Social Assistance (100.0%), and Transportation & Warehousing (77.1%).
| Industry | Male | Female |
| Agriculture, Fishing & Hunting | 0 (0.0%) | 13 (100.0%) |
| Mining, Quarrying, & Extraction | 0 (0.0%) | 0 (0.0%) |
| Construction | 100 (100.0%) | 0 (0.0%) |
| Manufacturing | 93 (40.6%) | 136 (59.4%) |
| Wholesale Trade | 18 (54.5%) | 15 (45.5%) |
| Retail Trade | 258 (67.4%) | 125 (32.6%) |
| Transportation & Warehousing | 22 (22.9%) | 74 (77.1%) |
| Utilities | 0 (0.0%) | 0 (0.0%) |
| Information | 19 (33.3%) | 38 (66.7%) |
| Finance & Insurance | 20 (100.0%) | 0 (0.0%) |
| Real Estate, Rental & Leasing | 21 (100.0%) | 0 (0.0%) |
| Professional & Scientific | 33 (50.8%) | 32 (49.2%) |
| Enterprise Management | 0 (0.0%) | 0 (0.0%) |
| Administrative & Support | 5 (100.0%) | 0 (0.0%) |
| Educational Services | 29 (50.9%) | 28 (49.1%) |
| Health Care & Social Assistance | 0 (0.0%) | 208 (100.0%) |
| Arts, Entertainment & Recreation | 3 (100.0%) | 0 (0.0%) |
| Accommodation & Food Services | 58 (77.3%) | 17 (22.7%) |
| Public Administration | 61 (70.1%) | 26 (29.9%) |
| Total | 770 (50.9%) | 742 (49.1%) |
Education in Elroy
School Enrollment in Elroy
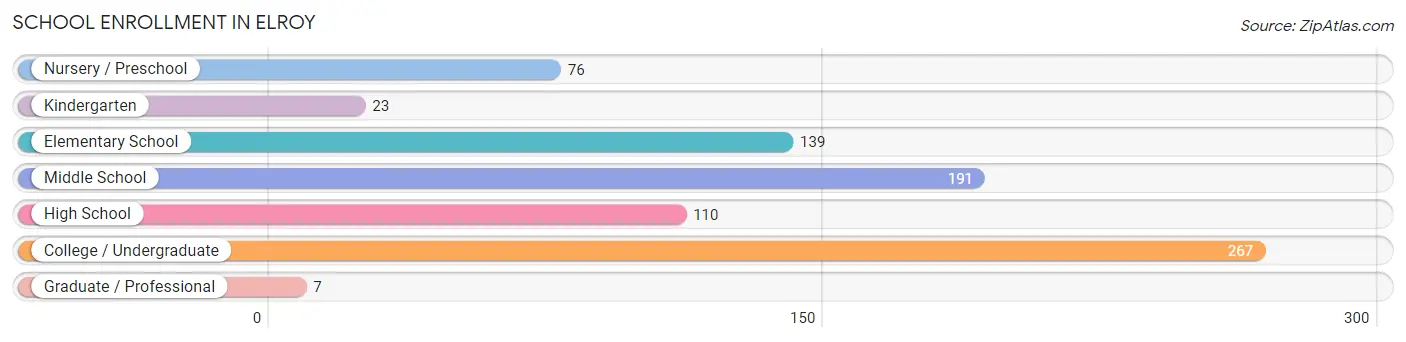
The most common levels of schooling among the 813 students in Elroy are college / undergraduate (267 | 32.8%), middle school (191 | 23.5%), and elementary school (139 | 17.1%).
| School Level | # Students | % Students |
| Nursery / Preschool | 76 | 9.3% |
| Kindergarten | 23 | 2.8% |
| Elementary School | 139 | 17.1% |
| Middle School | 191 | 23.5% |
| High School | 110 | 13.5% |
| College / Undergraduate | 267 | 32.8% |
| Graduate / Professional | 7 | 0.9% |
| Total | 813 | 100.0% |
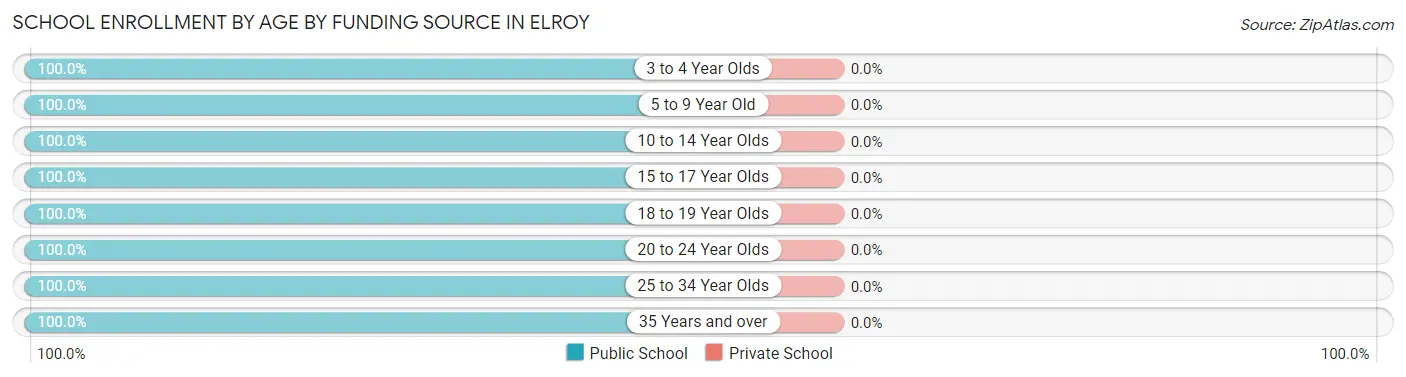
School Enrollment by Age by Funding Source in Elroy
| Age Bracket | Public School | Private School |
| 3 to 4 Year Olds | 68 (100.0%) | 0 (0.0%) |
| 5 to 9 Year Old | 163 (100.0%) | 0 (0.0%) |
| 10 to 14 Year Olds | 232 (100.0%) | 0 (0.0%) |
| 15 to 17 Year Olds | 76 (100.0%) | 0 (0.0%) |
| 18 to 19 Year Olds | 58 (100.0%) | 0 (0.0%) |
| 20 to 24 Year Olds | 137 (100.0%) | 0 (0.0%) |
| 25 to 34 Year Olds | 49 (100.0%) | 0 (0.0%) |
| 35 Years and over | 30 (100.0%) | 0 (0.0%) |
| Total | 813 (100.0%) | 0 (0.0%) |
Educational Attainment by Field of Study in Elroy
Business (123 | 36.7%), liberal arts & history (48 | 14.3%), computers & mathematics (31 | 9.2%), bio, nature & agricultural (31 | 9.2%), and arts & humanities (25 | 7.5%) are the most common fields of study among 335 individuals in Elroy who have obtained a bachelor's degree or higher.
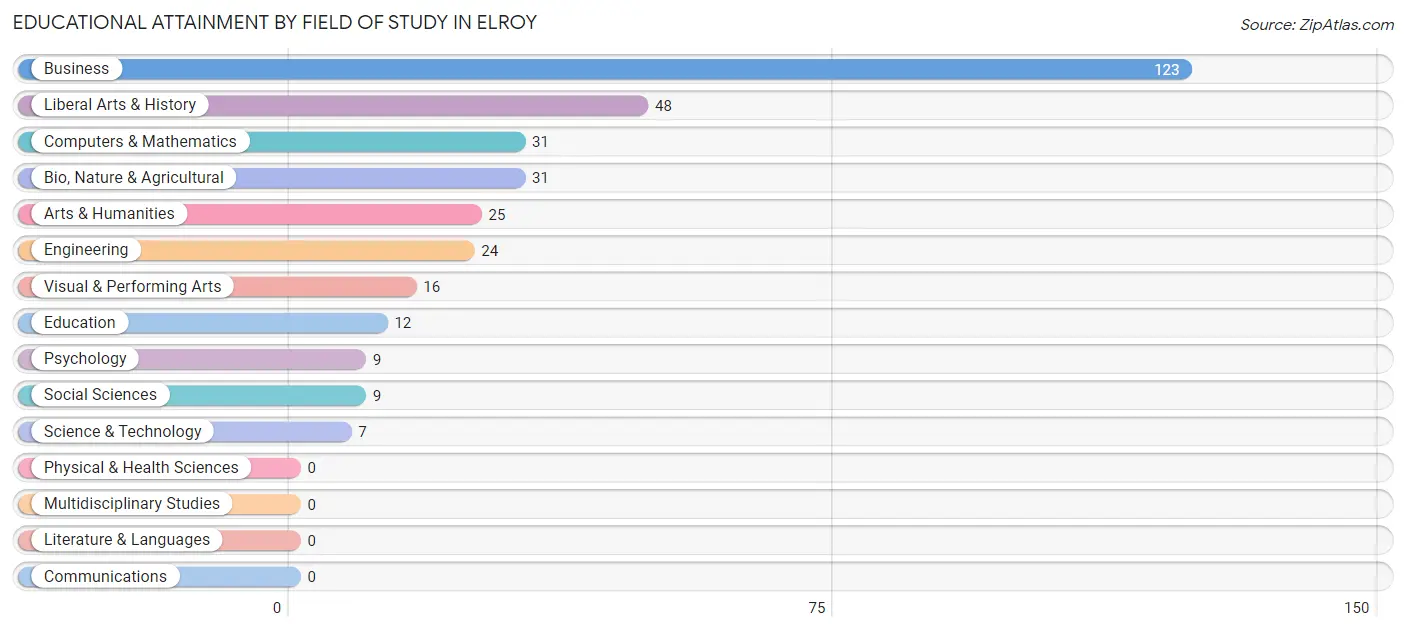
| Field of Study | # Graduates | % Graduates |
| Computers & Mathematics | 31 | 9.2% |
| Bio, Nature & Agricultural | 31 | 9.2% |
| Physical & Health Sciences | 0 | 0.0% |
| Psychology | 9 | 2.7% |
| Social Sciences | 9 | 2.7% |
| Engineering | 24 | 7.2% |
| Multidisciplinary Studies | 0 | 0.0% |
| Science & Technology | 7 | 2.1% |
| Business | 123 | 36.7% |
| Education | 12 | 3.6% |
| Literature & Languages | 0 | 0.0% |
| Liberal Arts & History | 48 | 14.3% |
| Visual & Performing Arts | 16 | 4.8% |
| Communications | 0 | 0.0% |
| Arts & Humanities | 25 | 7.5% |
| Total | 335 | 100.0% |
Transportation & Commute in Elroy
Vehicle Availability by Sex in Elroy
The most prevalent vehicle ownership categories in Elroy are males with 2 vehicles (321, accounting for 42.1%) and females with 2 vehicles (215, making up 43.7%).
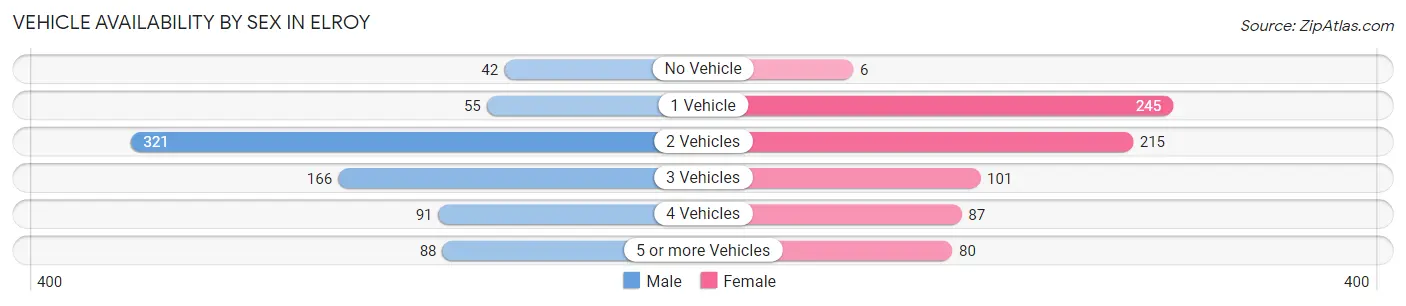
| Vehicles Available | Male | Female |
| No Vehicle | 42 (5.5%) | 6 (0.8%) |
| 1 Vehicle | 55 (7.2%) | 245 (33.4%) |
| 2 Vehicles | 321 (42.1%) | 215 (29.3%) |
| 3 Vehicles | 166 (21.8%) | 101 (13.8%) |
| 4 Vehicles | 91 (11.9%) | 87 (11.8%) |
| 5 or more Vehicles | 88 (11.5%) | 80 (10.9%) |
| Total | 763 (100.0%) | 734 (100.0%) |
Commute Time in Elroy
The most frequently occuring commute durations in Elroy are 15 to 19 minutes (470 commuters, 33.2%), 10 to 14 minutes (311 commuters, 22.0%), and 20 to 24 minutes (178 commuters, 12.6%).
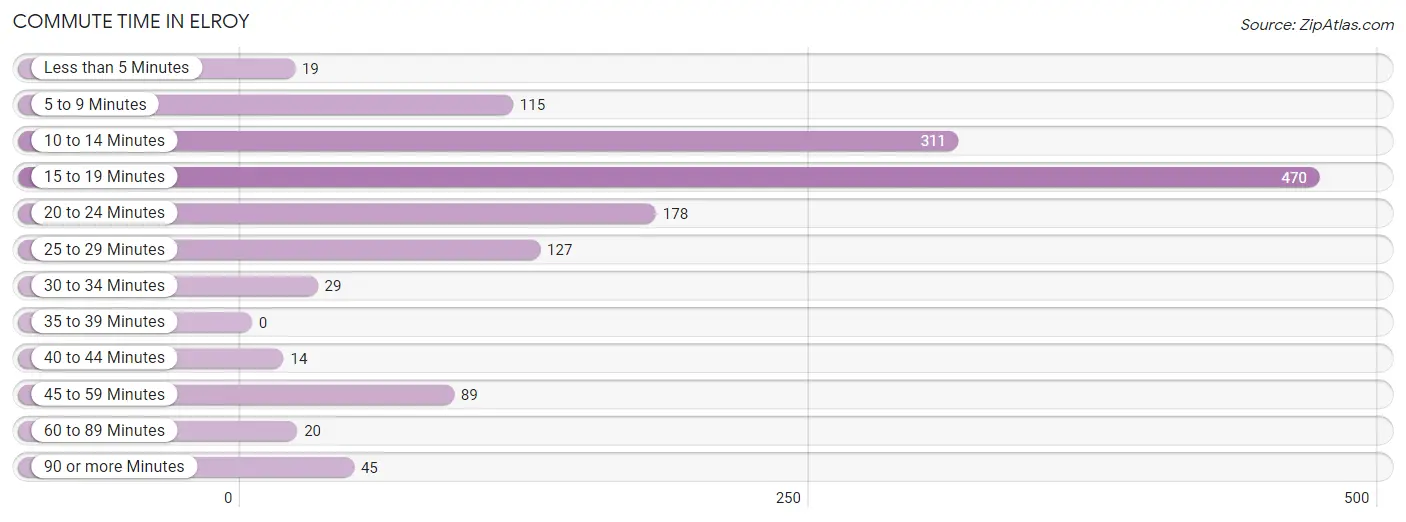
| Commute Time | # Commuters | % Commuters |
| Less than 5 Minutes | 19 | 1.3% |
| 5 to 9 Minutes | 115 | 8.1% |
| 10 to 14 Minutes | 311 | 22.0% |
| 15 to 19 Minutes | 470 | 33.2% |
| 20 to 24 Minutes | 178 | 12.6% |
| 25 to 29 Minutes | 127 | 9.0% |
| 30 to 34 Minutes | 29 | 2.1% |
| 35 to 39 Minutes | 0 | 0.0% |
| 40 to 44 Minutes | 14 | 1.0% |
| 45 to 59 Minutes | 89 | 6.3% |
| 60 to 89 Minutes | 20 | 1.4% |
| 90 or more Minutes | 45 | 3.2% |
Commute Time by Sex in Elroy
The most common commute times in Elroy are 15 to 19 minutes (198 commuters, 26.2%) for males and 15 to 19 minutes (272 commuters, 41.1%) for females.
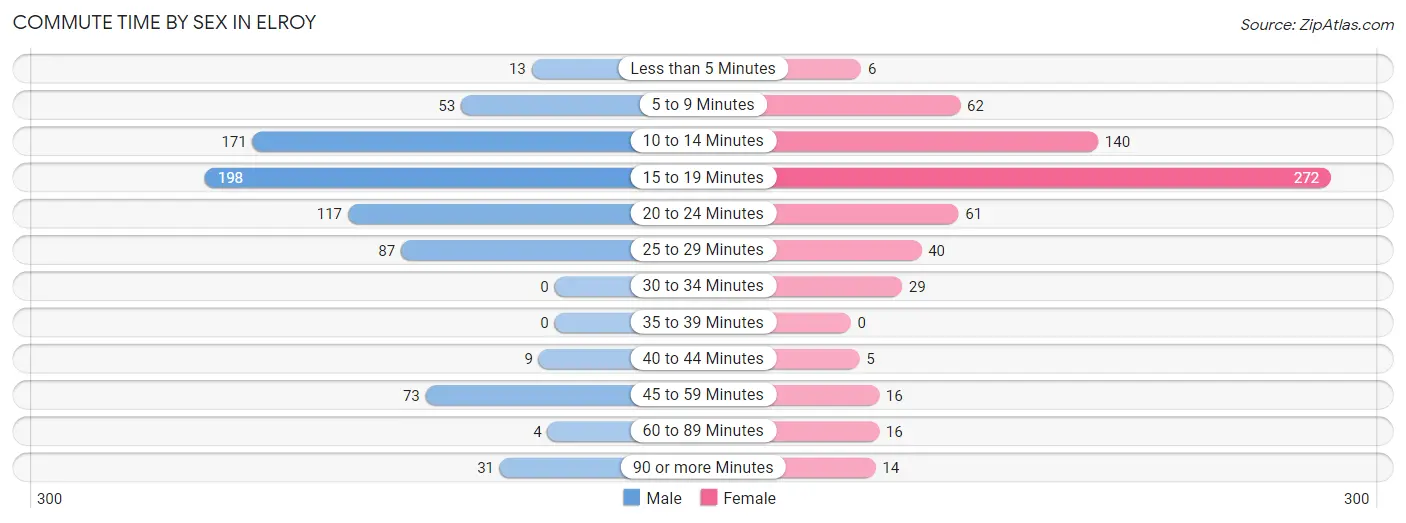
| Commute Time | Male | Female |
| Less than 5 Minutes | 13 (1.7%) | 6 (0.9%) |
| 5 to 9 Minutes | 53 (7.0%) | 62 (9.4%) |
| 10 to 14 Minutes | 171 (22.6%) | 140 (21.2%) |
| 15 to 19 Minutes | 198 (26.2%) | 272 (41.1%) |
| 20 to 24 Minutes | 117 (15.5%) | 61 (9.2%) |
| 25 to 29 Minutes | 87 (11.5%) | 40 (6.0%) |
| 30 to 34 Minutes | 0 (0.0%) | 29 (4.4%) |
| 35 to 39 Minutes | 0 (0.0%) | 0 (0.0%) |
| 40 to 44 Minutes | 9 (1.2%) | 5 (0.8%) |
| 45 to 59 Minutes | 73 (9.7%) | 16 (2.4%) |
| 60 to 89 Minutes | 4 (0.5%) | 16 (2.4%) |
| 90 or more Minutes | 31 (4.1%) | 14 (2.1%) |
Time of Departure to Work by Sex in Elroy
The most frequent times of departure to work in Elroy are 7:00 AM to 7:29 AM (134, 17.7%) for males and 7:00 AM to 7:29 AM (113, 17.1%) for females.
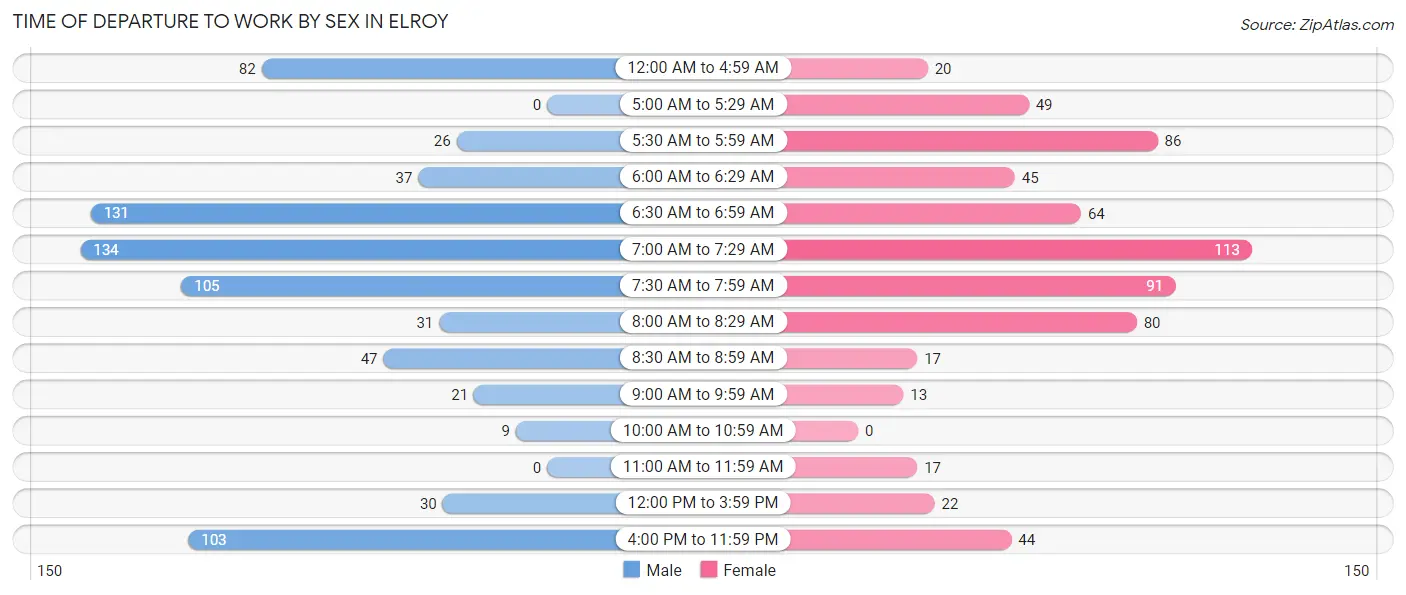
| Time of Departure | Male | Female |
| 12:00 AM to 4:59 AM | 82 (10.8%) | 20 (3.0%) |
| 5:00 AM to 5:29 AM | 0 (0.0%) | 49 (7.4%) |
| 5:30 AM to 5:59 AM | 26 (3.4%) | 86 (13.0%) |
| 6:00 AM to 6:29 AM | 37 (4.9%) | 45 (6.8%) |
| 6:30 AM to 6:59 AM | 131 (17.3%) | 64 (9.7%) |
| 7:00 AM to 7:29 AM | 134 (17.7%) | 113 (17.1%) |
| 7:30 AM to 7:59 AM | 105 (13.9%) | 91 (13.8%) |
| 8:00 AM to 8:29 AM | 31 (4.1%) | 80 (12.1%) |
| 8:30 AM to 8:59 AM | 47 (6.2%) | 17 (2.6%) |
| 9:00 AM to 9:59 AM | 21 (2.8%) | 13 (2.0%) |
| 10:00 AM to 10:59 AM | 9 (1.2%) | 0 (0.0%) |
| 11:00 AM to 11:59 AM | 0 (0.0%) | 17 (2.6%) |
| 12:00 PM to 3:59 PM | 30 (4.0%) | 22 (3.3%) |
| 4:00 PM to 11:59 PM | 103 (13.6%) | 44 (6.7%) |
| Total | 756 (100.0%) | 661 (100.0%) |
Housing Occupancy in Elroy
Occupancy by Ownership in Elroy
Of the total 1,362 dwellings in Elroy, owner-occupied units account for 949 (69.7%), while renter-occupied units make up 413 (30.3%).
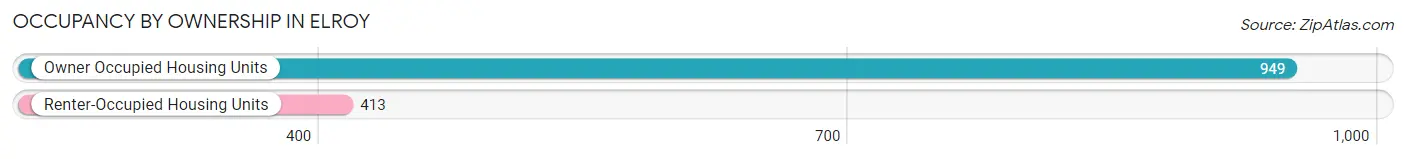
| Occupancy | # Housing Units | % Housing Units |
| Owner Occupied Housing Units | 949 | 69.7% |
| Renter-Occupied Housing Units | 413 | 30.3% |
| Total Occupied Housing Units | 1,362 | 100.0% |
Occupancy by Household Size in Elroy
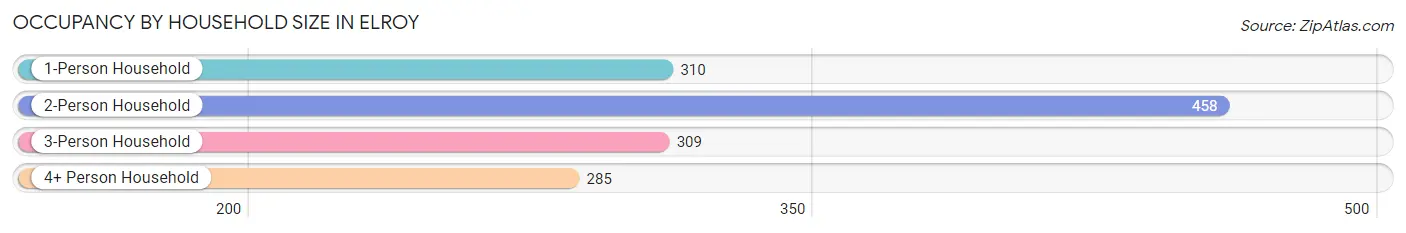
| Household Size | # Housing Units | % Housing Units |
| 1-Person Household | 310 | 22.8% |
| 2-Person Household | 458 | 33.6% |
| 3-Person Household | 309 | 22.7% |
| 4+ Person Household | 285 | 20.9% |
| Total Housing Units | 1,362 | 100.0% |
Occupancy by Ownership by Household Size in Elroy
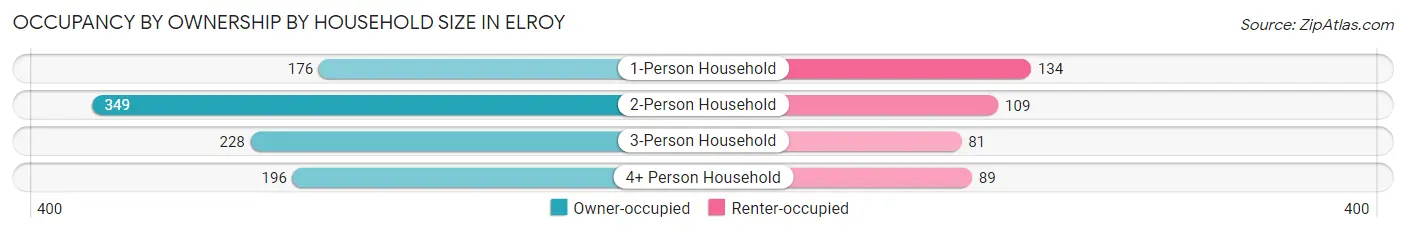
| Household Size | Owner-occupied | Renter-occupied |
| 1-Person Household | 176 (56.8%) | 134 (43.2%) |
| 2-Person Household | 349 (76.2%) | 109 (23.8%) |
| 3-Person Household | 228 (73.8%) | 81 (26.2%) |
| 4+ Person Household | 196 (68.8%) | 89 (31.2%) |
| Total Housing Units | 949 (69.7%) | 413 (30.3%) |
Occupancy by Educational Attainment in Elroy
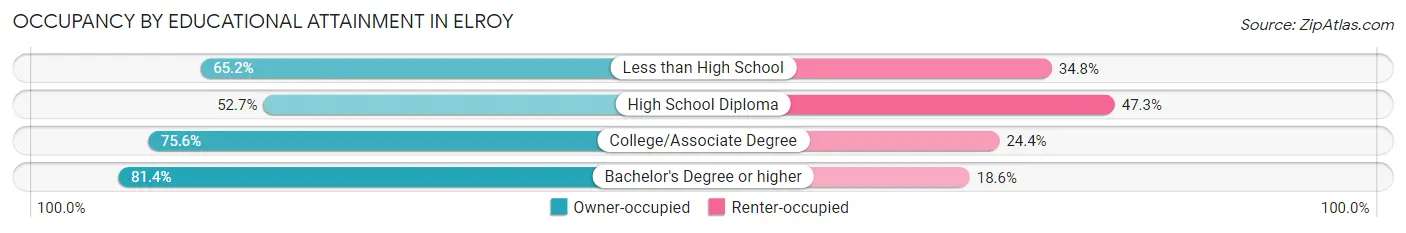
| Household Size | Owner-occupied | Renter-occupied |
| Less than High School | 58 (65.2%) | 31 (34.8%) |
| High School Diploma | 186 (52.7%) | 167 (47.3%) |
| College/Associate Degree | 569 (75.6%) | 184 (24.4%) |
| Bachelor's Degree or higher | 136 (81.4%) | 31 (18.6%) |
Occupancy by Age of Householder in Elroy
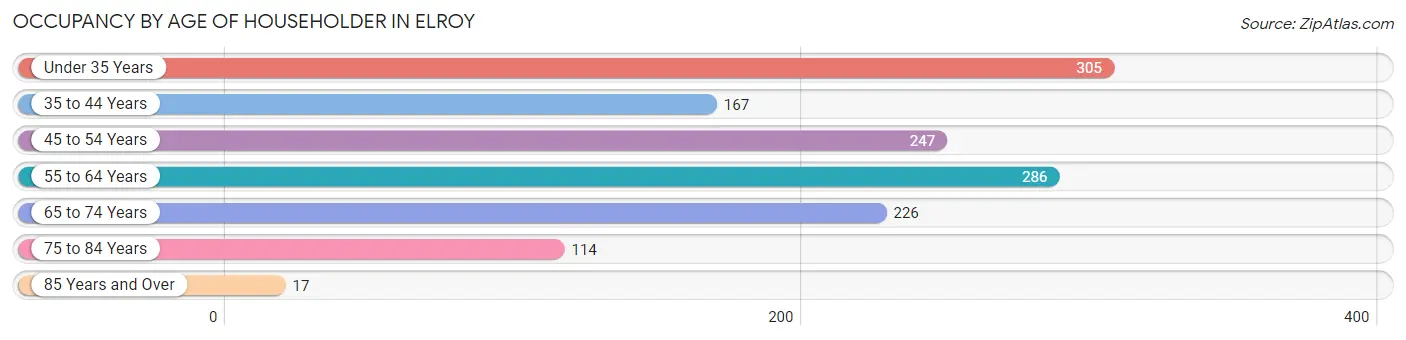
| Age Bracket | # Households | % Households |
| Under 35 Years | 305 | 22.4% |
| 35 to 44 Years | 167 | 12.3% |
| 45 to 54 Years | 247 | 18.1% |
| 55 to 64 Years | 286 | 21.0% |
| 65 to 74 Years | 226 | 16.6% |
| 75 to 84 Years | 114 | 8.4% |
| 85 Years and Over | 17 | 1.3% |
| Total | 1,362 | 100.0% |
Housing Finances in Elroy
Median Income by Occupancy in Elroy
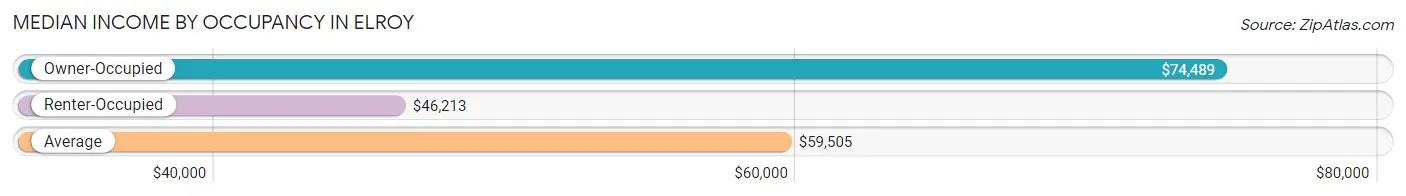
| Occupancy Type | # Households | Median Income |
| Owner-Occupied | 949 (69.7%) | $74,489 |
| Renter-Occupied | 413 (30.3%) | $46,213 |
| Average | 1,362 (100.0%) | $59,505 |
Occupancy by Householder Income Bracket in Elroy
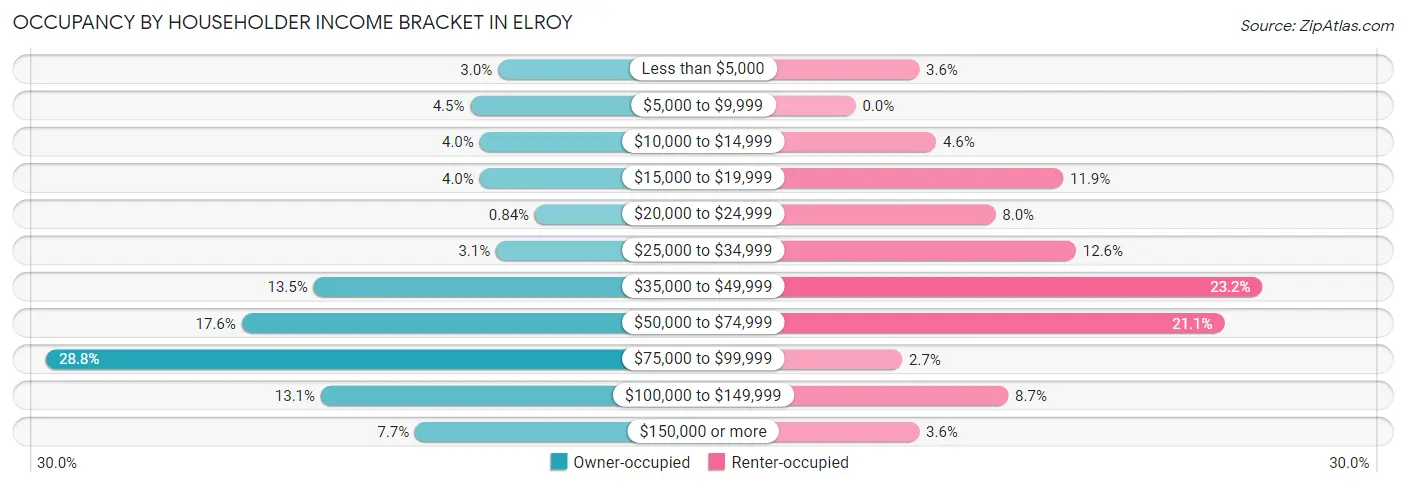
| Income Bracket | Owner-occupied | Renter-occupied |
| Less than $5,000 | 28 (2.9%) | 15 (3.6%) |
| $5,000 to $9,999 | 43 (4.5%) | 0 (0.0%) |
| $10,000 to $14,999 | 38 (4.0%) | 19 (4.6%) |
| $15,000 to $19,999 | 38 (4.0%) | 49 (11.9%) |
| $20,000 to $24,999 | 8 (0.8%) | 33 (8.0%) |
| $25,000 to $34,999 | 29 (3.1%) | 52 (12.6%) |
| $35,000 to $49,999 | 128 (13.5%) | 96 (23.2%) |
| $50,000 to $74,999 | 167 (17.6%) | 87 (21.1%) |
| $75,000 to $99,999 | 273 (28.8%) | 11 (2.7%) |
| $100,000 to $149,999 | 124 (13.1%) | 36 (8.7%) |
| $150,000 or more | 73 (7.7%) | 15 (3.6%) |
| Total | 949 (100.0%) | 413 (100.0%) |
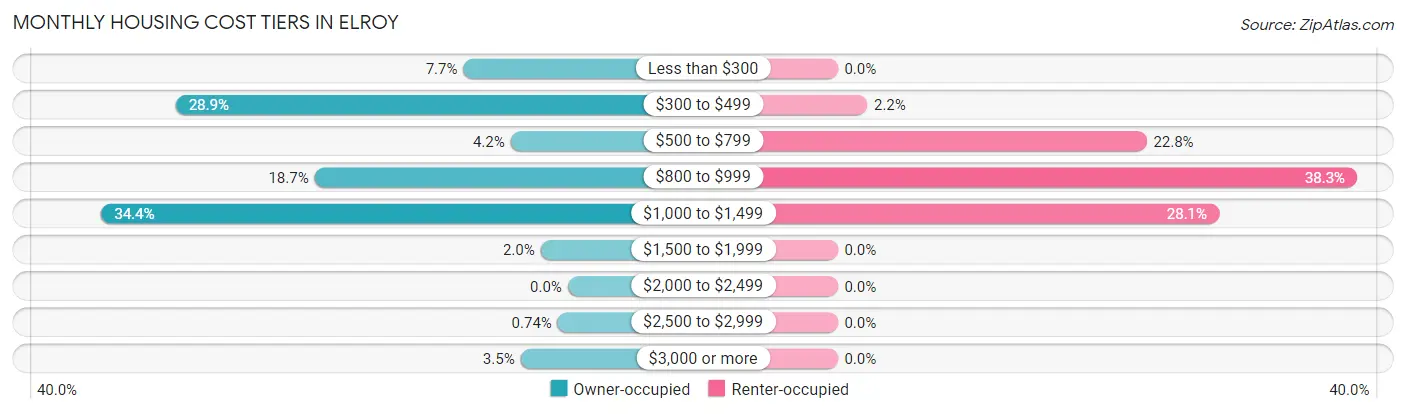
Monthly Housing Cost Tiers in Elroy
| Monthly Cost | Owner-occupied | Renter-occupied |
| Less than $300 | 73 (7.7%) | 0 (0.0%) |
| $300 to $499 | 274 (28.9%) | 9 (2.2%) |
| $500 to $799 | 40 (4.2%) | 94 (22.8%) |
| $800 to $999 | 177 (18.6%) | 158 (38.3%) |
| $1,000 to $1,499 | 326 (34.4%) | 116 (28.1%) |
| $1,500 to $1,999 | 19 (2.0%) | 0 (0.0%) |
| $2,000 to $2,499 | 0 (0.0%) | 0 (0.0%) |
| $2,500 to $2,999 | 7 (0.7%) | 0 (0.0%) |
| $3,000 or more | 33 (3.5%) | 0 (0.0%) |
| Total | 949 (100.0%) | 413 (100.0%) |
Physical Housing Characteristics in Elroy
Housing Structures in Elroy
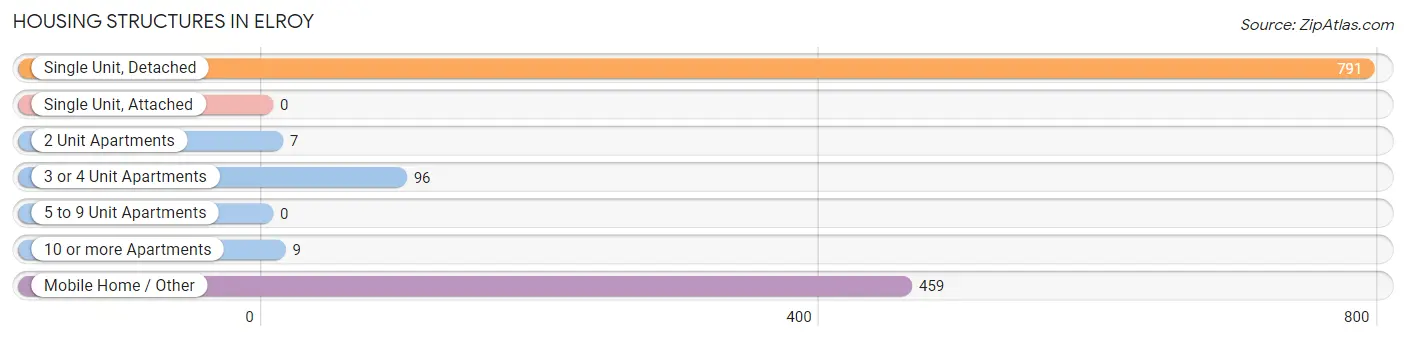
| Structure Type | # Housing Units | % Housing Units |
| Single Unit, Detached | 791 | 58.1% |
| Single Unit, Attached | 0 | 0.0% |
| 2 Unit Apartments | 7 | 0.5% |
| 3 or 4 Unit Apartments | 96 | 7.0% |
| 5 to 9 Unit Apartments | 0 | 0.0% |
| 10 or more Apartments | 9 | 0.7% |
| Mobile Home / Other | 459 | 33.7% |
| Total | 1,362 | 100.0% |
Housing Structures by Occupancy in Elroy
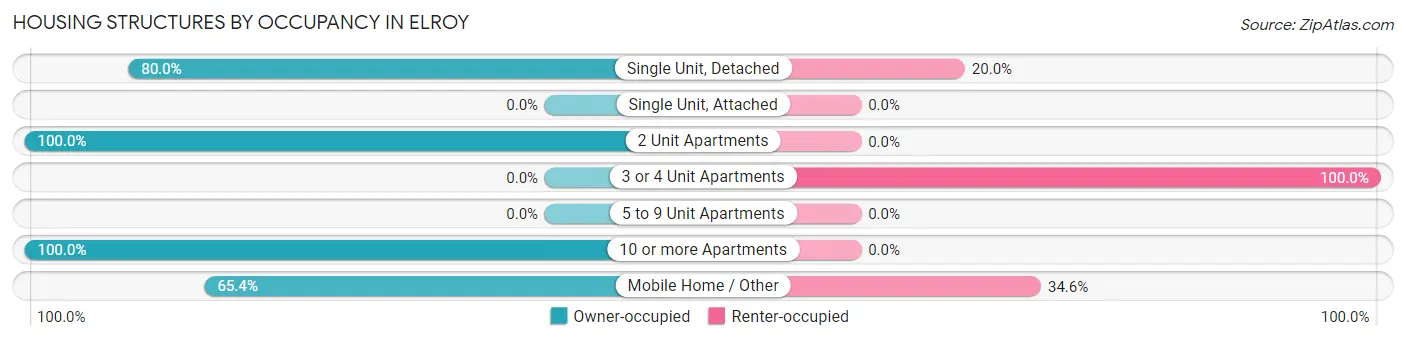
| Structure Type | Owner-occupied | Renter-occupied |
| Single Unit, Detached | 633 (80.0%) | 158 (20.0%) |
| Single Unit, Attached | 0 (0.0%) | 0 (0.0%) |
| 2 Unit Apartments | 7 (100.0%) | 0 (0.0%) |
| 3 or 4 Unit Apartments | 0 (0.0%) | 96 (100.0%) |
| 5 to 9 Unit Apartments | 0 (0.0%) | 0 (0.0%) |
| 10 or more Apartments | 9 (100.0%) | 0 (0.0%) |
| Mobile Home / Other | 300 (65.4%) | 159 (34.6%) |
| Total | 949 (69.7%) | 413 (30.3%) |
Housing Structures by Number of Rooms in Elroy
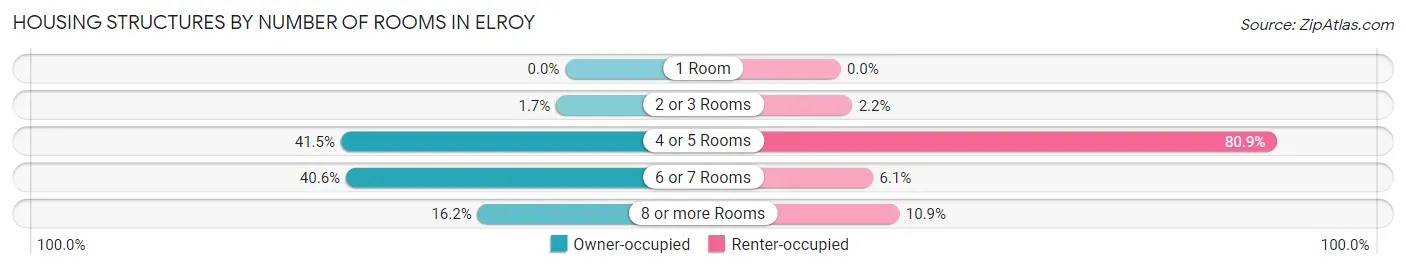
| Number of Rooms | Owner-occupied | Renter-occupied |
| 1 Room | 0 (0.0%) | 0 (0.0%) |
| 2 or 3 Rooms | 16 (1.7%) | 9 (2.2%) |
| 4 or 5 Rooms | 394 (41.5%) | 334 (80.9%) |
| 6 or 7 Rooms | 385 (40.6%) | 25 (6.0%) |
| 8 or more Rooms | 154 (16.2%) | 45 (10.9%) |
| Total | 949 (100.0%) | 413 (100.0%) |
Housing Structure by Heating Type in Elroy
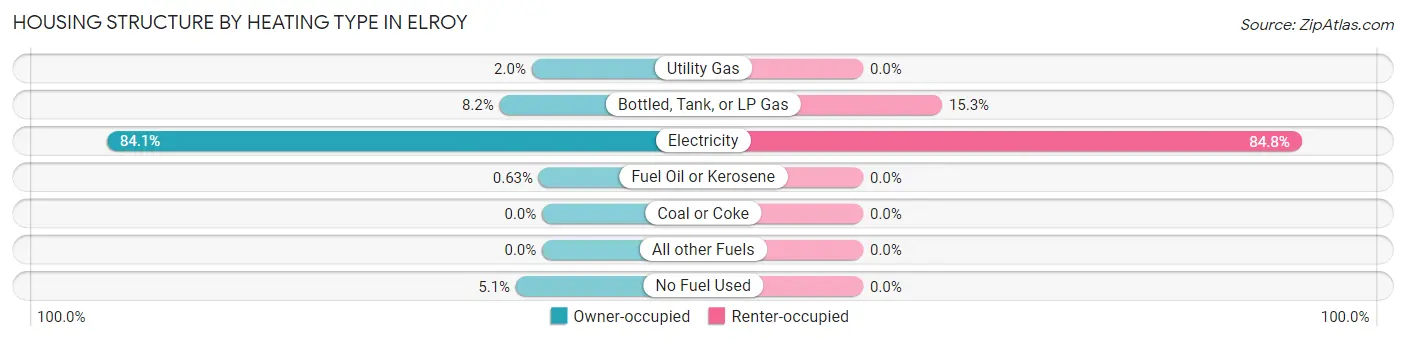
| Heating Type | Owner-occupied | Renter-occupied |
| Utility Gas | 19 (2.0%) | 0 (0.0%) |
| Bottled, Tank, or LP Gas | 78 (8.2%) | 63 (15.2%) |
| Electricity | 798 (84.1%) | 350 (84.8%) |
| Fuel Oil or Kerosene | 6 (0.6%) | 0 (0.0%) |
| Coal or Coke | 0 (0.0%) | 0 (0.0%) |
| All other Fuels | 0 (0.0%) | 0 (0.0%) |
| No Fuel Used | 48 (5.1%) | 0 (0.0%) |
| Total | 949 (100.0%) | 413 (100.0%) |
Household Vehicle Usage in Elroy
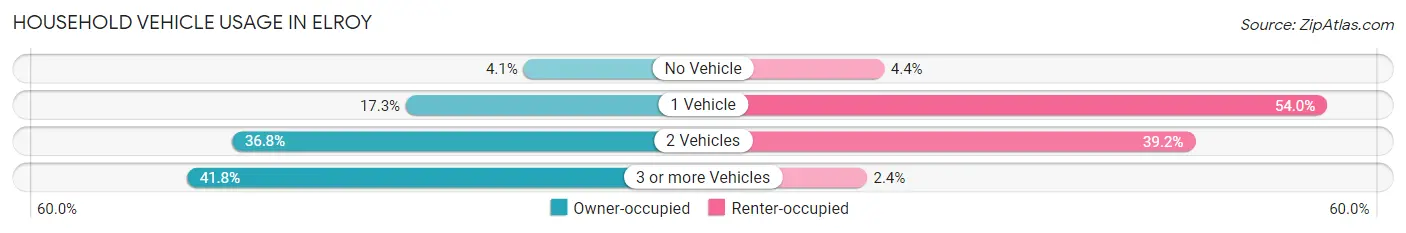
| Vehicles per Household | Owner-occupied | Renter-occupied |
| No Vehicle | 39 (4.1%) | 18 (4.4%) |
| 1 Vehicle | 164 (17.3%) | 223 (54.0%) |
| 2 Vehicles | 349 (36.8%) | 162 (39.2%) |
| 3 or more Vehicles | 397 (41.8%) | 10 (2.4%) |
| Total | 949 (100.0%) | 413 (100.0%) |
Real Estate & Mortgages in Elroy
Real Estate and Mortgage Overview in Elroy
| Characteristic | Without Mortgage | With Mortgage |
| Housing Units | 423 | 526 |
| Median Property Value | $103,000 | $129,800 |
| Median Household Income | $70,179 | $40 |
| Monthly Housing Costs | $397 | $17 |
| Real Estate Taxes | $694 | $12 |
Property Value by Mortgage Status in Elroy
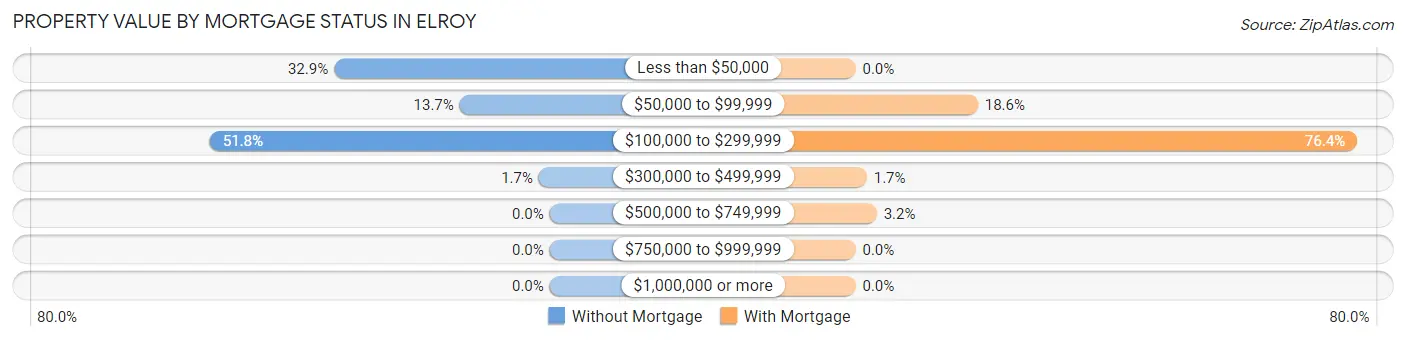
| Property Value | Without Mortgage | With Mortgage |
| Less than $50,000 | 139 (32.9%) | 0 (0.0%) |
| $50,000 to $99,999 | 58 (13.7%) | 98 (18.6%) |
| $100,000 to $299,999 | 219 (51.8%) | 402 (76.4%) |
| $300,000 to $499,999 | 7 (1.7%) | 9 (1.7%) |
| $500,000 to $749,999 | 0 (0.0%) | 17 (3.2%) |
| $750,000 to $999,999 | 0 (0.0%) | 0 (0.0%) |
| $1,000,000 or more | 0 (0.0%) | 0 (0.0%) |
| Total | 423 (100.0%) | 526 (100.0%) |
Household Income by Mortgage Status in Elroy
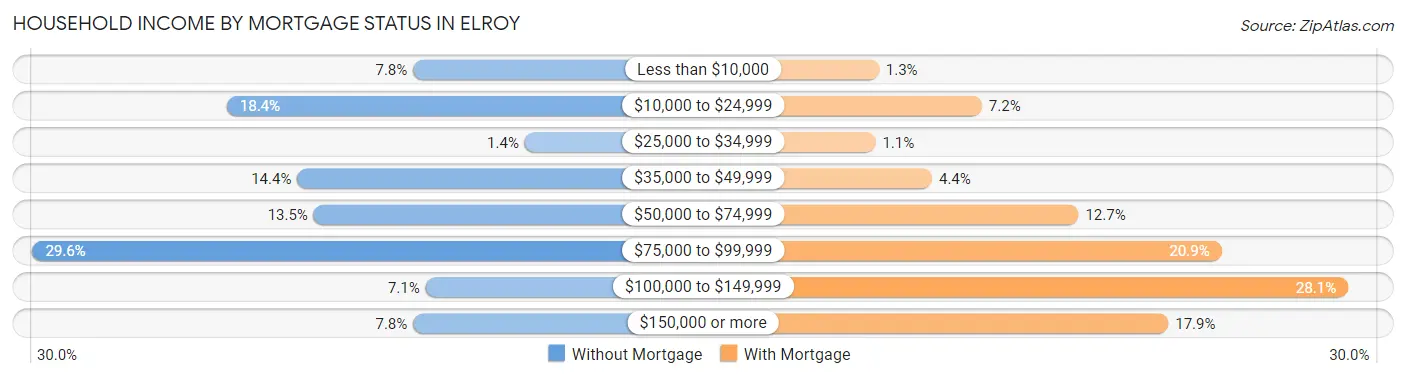
| Household Income | Without Mortgage | With Mortgage |
| Less than $10,000 | 33 (7.8%) | 7 (1.3%) |
| $10,000 to $24,999 | 78 (18.4%) | 38 (7.2%) |
| $25,000 to $34,999 | 6 (1.4%) | 6 (1.1%) |
| $35,000 to $49,999 | 61 (14.4%) | 23 (4.4%) |
| $50,000 to $74,999 | 57 (13.5%) | 67 (12.7%) |
| $75,000 to $99,999 | 125 (29.5%) | 110 (20.9%) |
| $100,000 to $149,999 | 30 (7.1%) | 148 (28.1%) |
| $150,000 or more | 33 (7.8%) | 94 (17.9%) |
| Total | 423 (100.0%) | 526 (100.0%) |
Property Value to Household Income Ratio in Elroy
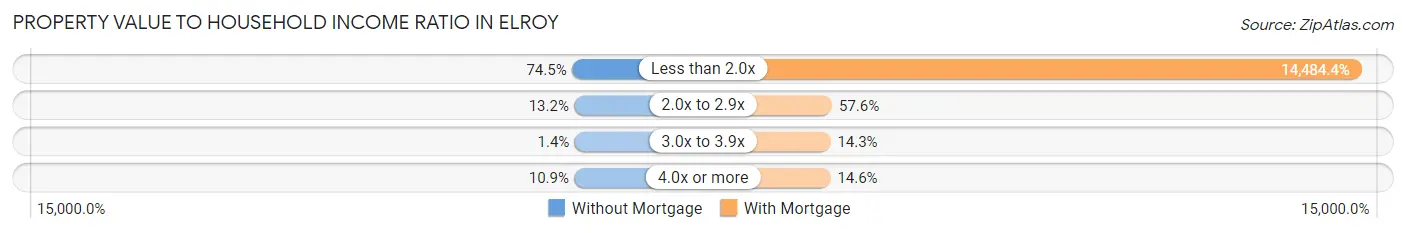
| Value-to-Income Ratio | Without Mortgage | With Mortgage |
| Less than 2.0x | 315 (74.5%) | 76,188 (14,484.4%) |
| 2.0x to 2.9x | 56 (13.2%) | 303 (57.6%) |
| 3.0x to 3.9x | 6 (1.4%) | 75 (14.3%) |
| 4.0x or more | 46 (10.9%) | 77 (14.6%) |
| Total | 423 (100.0%) | 526 (100.0%) |
Real Estate Taxes by Mortgage Status in Elroy
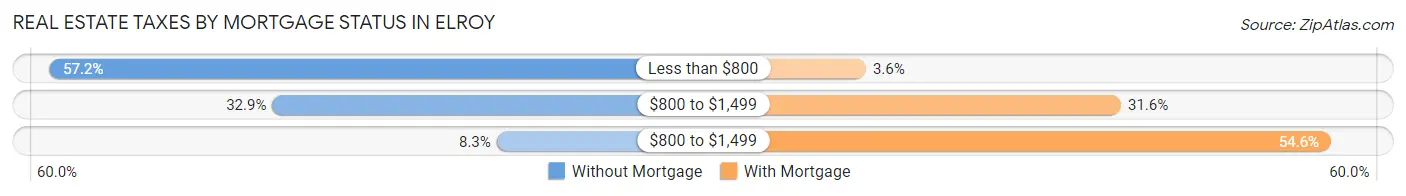
| Property Taxes | Without Mortgage | With Mortgage |
| Less than $800 | 242 (57.2%) | 19 (3.6%) |
| $800 to $1,499 | 139 (32.9%) | 166 (31.6%) |
| $800 to $1,499 | 35 (8.3%) | 287 (54.6%) |
| Total | 423 (100.0%) | 526 (100.0%) |
Health & Disability in Elroy
Health Insurance Coverage by Age in Elroy
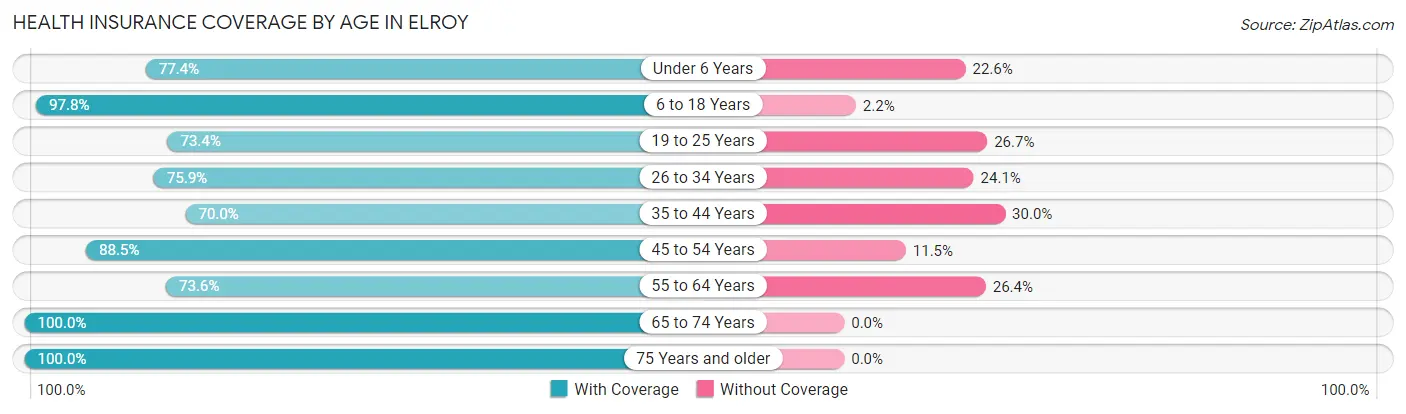
| Age Bracket | With Coverage | Without Coverage |
| Under 6 Years | 219 (77.4%) | 64 (22.6%) |
| 6 to 18 Years | 452 (97.8%) | 10 (2.2%) |
| 19 to 25 Years | 289 (73.4%) | 105 (26.7%) |
| 26 to 34 Years | 302 (75.9%) | 96 (24.1%) |
| 35 to 44 Years | 273 (70.0%) | 117 (30.0%) |
| 45 to 54 Years | 401 (88.5%) | 52 (11.5%) |
| 55 to 64 Years | 318 (73.6%) | 114 (26.4%) |
| 65 to 74 Years | 414 (100.0%) | 0 (0.0%) |
| 75 Years and older | 228 (100.0%) | 0 (0.0%) |
| Total | 2,896 (83.8%) | 558 (16.2%) |
Health Insurance Coverage by Citizenship Status in Elroy
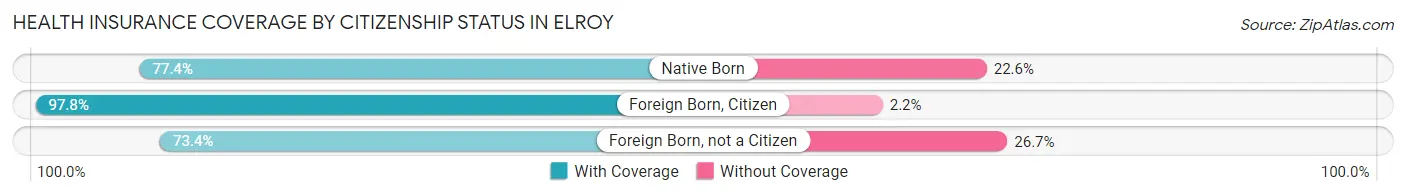
| Citizenship Status | With Coverage | Without Coverage |
| Native Born | 219 (77.4%) | 64 (22.6%) |
| Foreign Born, Citizen | 452 (97.8%) | 10 (2.2%) |
| Foreign Born, not a Citizen | 289 (73.4%) | 105 (26.7%) |
Health Insurance Coverage by Household Income in Elroy
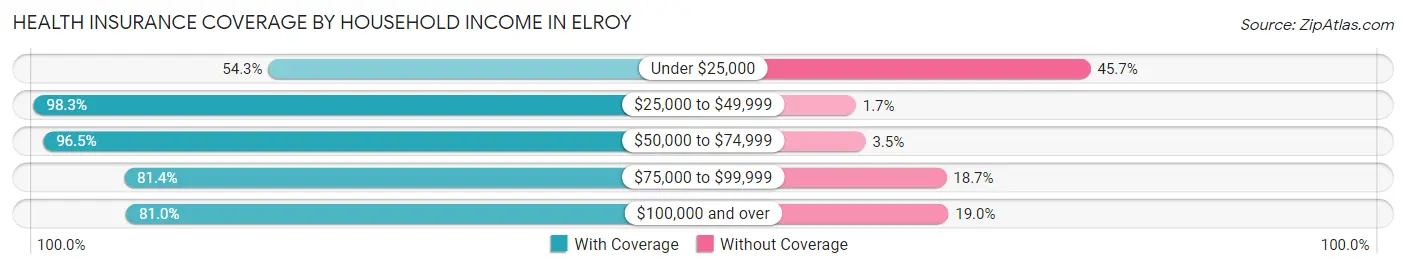
| Household Income | With Coverage | Without Coverage |
| Under $25,000 | 270 (54.3%) | 227 (45.7%) |
| $25,000 to $49,999 | 638 (98.3%) | 11 (1.7%) |
| $50,000 to $74,999 | 717 (96.5%) | 26 (3.5%) |
| $75,000 to $99,999 | 781 (81.4%) | 179 (18.6%) |
| $100,000 and over | 490 (81.0%) | 115 (19.0%) |
Public vs Private Health Insurance Coverage by Age in Elroy
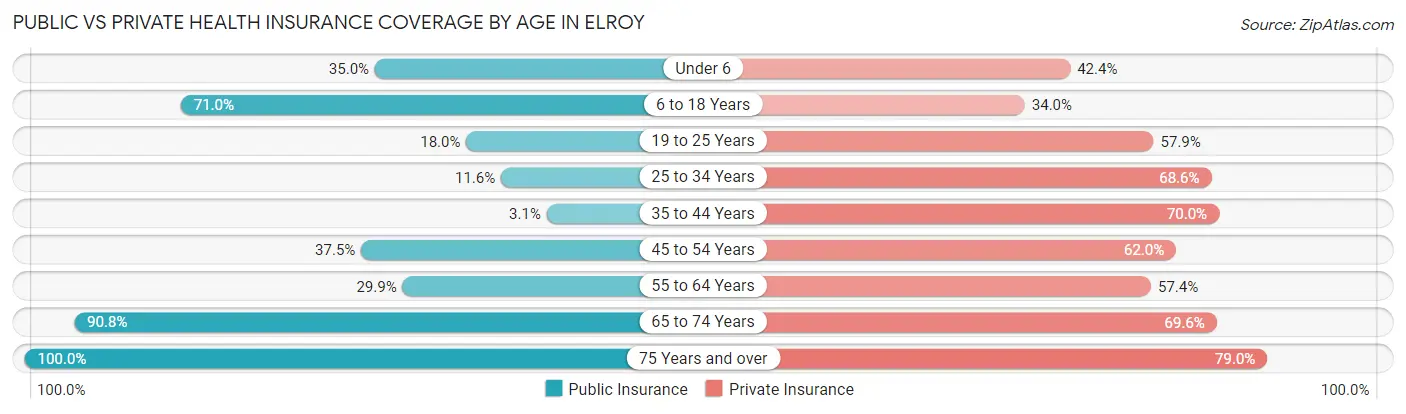
| Age Bracket | Public Insurance | Private Insurance |
| Under 6 | 99 (35.0%) | 120 (42.4%) |
| 6 to 18 Years | 328 (71.0%) | 157 (34.0%) |
| 19 to 25 Years | 71 (18.0%) | 228 (57.9%) |
| 25 to 34 Years | 46 (11.6%) | 273 (68.6%) |
| 35 to 44 Years | 12 (3.1%) | 273 (70.0%) |
| 45 to 54 Years | 170 (37.5%) | 281 (62.0%) |
| 55 to 64 Years | 129 (29.9%) | 248 (57.4%) |
| 65 to 74 Years | 376 (90.8%) | 288 (69.6%) |
| 75 Years and over | 228 (100.0%) | 180 (78.9%) |
| Total | 1,459 (42.2%) | 2,048 (59.3%) |
Disability Status by Sex by Age in Elroy
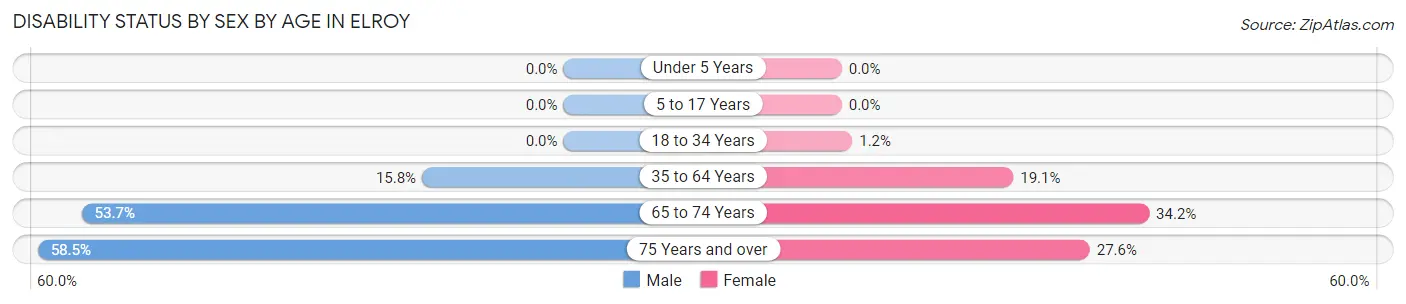
| Age Bracket | Male | Female |
| Under 5 Years | 0 (0.0%) | 0 (0.0%) |
| 5 to 17 Years | 0 (0.0%) | 0 (0.0%) |
| 18 to 34 Years | 0 (0.0%) | 5 (1.2%) |
| 35 to 64 Years | 92 (15.8%) | 132 (19.1%) |
| 65 to 74 Years | 103 (53.6%) | 76 (34.2%) |
| 75 Years and over | 72 (58.5%) | 29 (27.6%) |
Disability Class by Sex by Age in Elroy
Disability Class: Hearing Difficulty
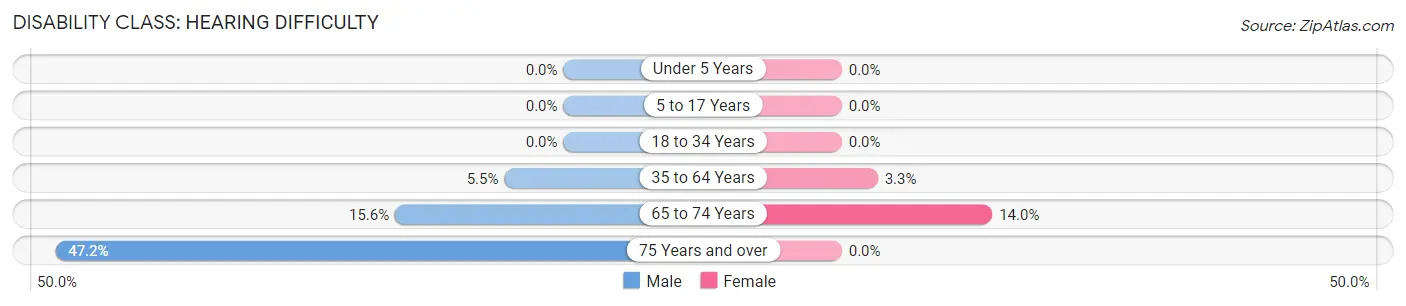
| Age Bracket | Male | Female |
| Under 5 Years | 0 (0.0%) | 0 (0.0%) |
| 5 to 17 Years | 0 (0.0%) | 0 (0.0%) |
| 18 to 34 Years | 0 (0.0%) | 0 (0.0%) |
| 35 to 64 Years | 32 (5.5%) | 23 (3.3%) |
| 65 to 74 Years | 30 (15.6%) | 31 (14.0%) |
| 75 Years and over | 58 (47.1%) | 0 (0.0%) |
Disability Class: Vision Difficulty
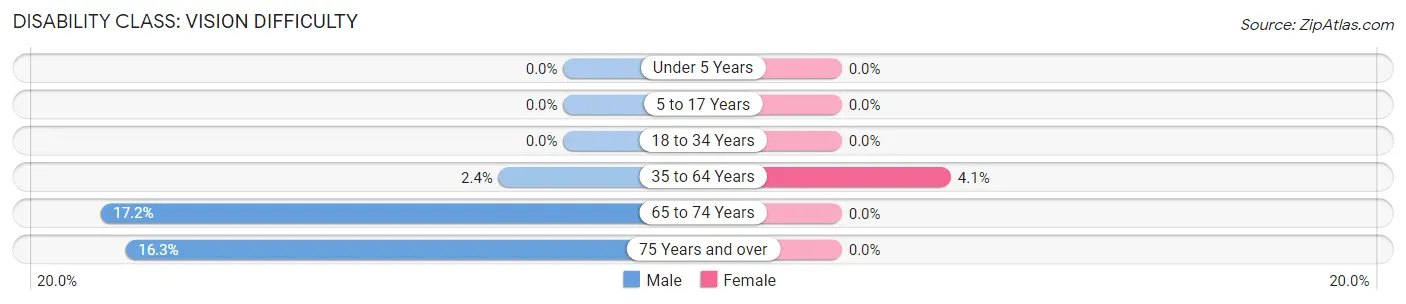
| Age Bracket | Male | Female |
| Under 5 Years | 0 (0.0%) | 0 (0.0%) |
| 5 to 17 Years | 0 (0.0%) | 0 (0.0%) |
| 18 to 34 Years | 0 (0.0%) | 0 (0.0%) |
| 35 to 64 Years | 14 (2.4%) | 28 (4.1%) |
| 65 to 74 Years | 33 (17.2%) | 0 (0.0%) |
| 75 Years and over | 20 (16.3%) | 0 (0.0%) |
Disability Class: Cognitive Difficulty
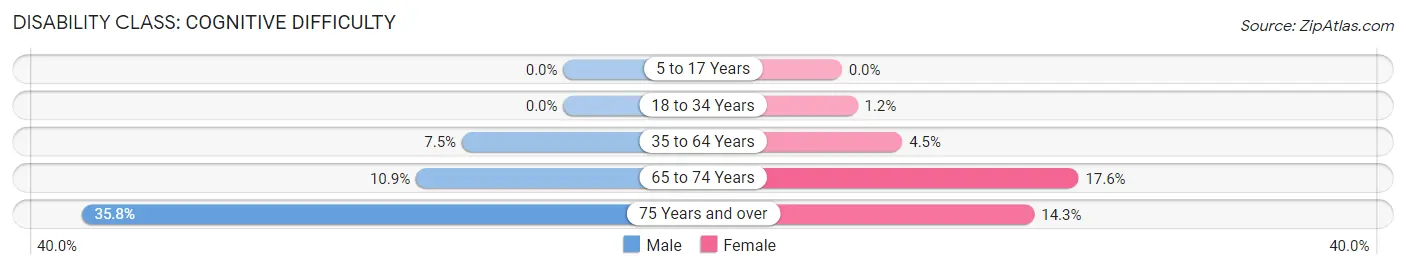
| Age Bracket | Male | Female |
| 5 to 17 Years | 0 (0.0%) | 0 (0.0%) |
| 18 to 34 Years | 0 (0.0%) | 5 (1.2%) |
| 35 to 64 Years | 44 (7.5%) | 31 (4.5%) |
| 65 to 74 Years | 21 (10.9%) | 39 (17.6%) |
| 75 Years and over | 44 (35.8%) | 15 (14.3%) |
Disability Class: Ambulatory Difficulty
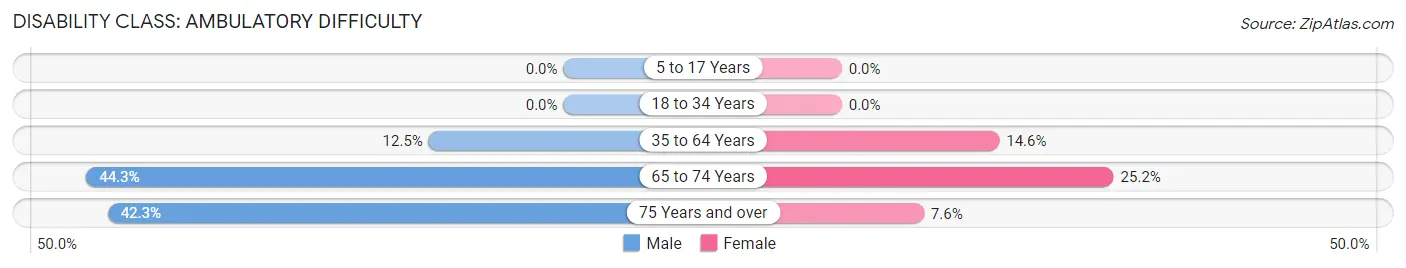
| Age Bracket | Male | Female |
| 5 to 17 Years | 0 (0.0%) | 0 (0.0%) |
| 18 to 34 Years | 0 (0.0%) | 0 (0.0%) |
| 35 to 64 Years | 73 (12.5%) | 101 (14.6%) |
| 65 to 74 Years | 85 (44.3%) | 56 (25.2%) |
| 75 Years and over | 52 (42.3%) | 8 (7.6%) |
Disability Class: Self-Care Difficulty
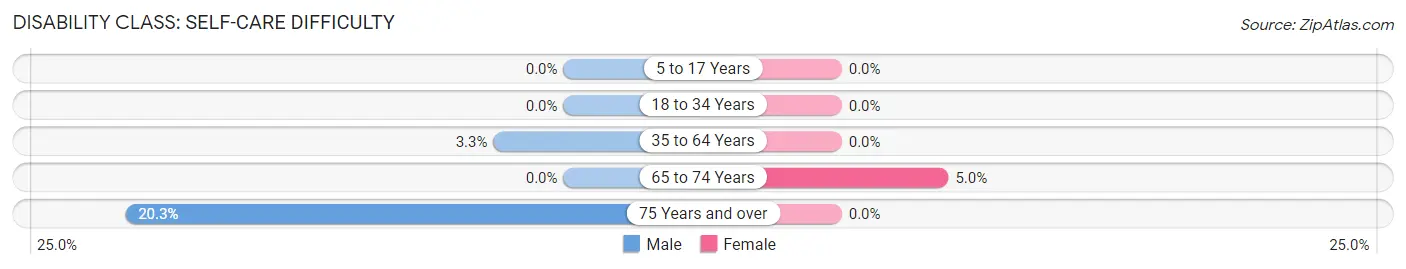
| Age Bracket | Male | Female |
| 5 to 17 Years | 0 (0.0%) | 0 (0.0%) |
| 18 to 34 Years | 0 (0.0%) | 0 (0.0%) |
| 35 to 64 Years | 19 (3.3%) | 0 (0.0%) |
| 65 to 74 Years | 0 (0.0%) | 11 (5.0%) |
| 75 Years and over | 25 (20.3%) | 0 (0.0%) |
Technology Access in Elroy
Computing Device Access in Elroy
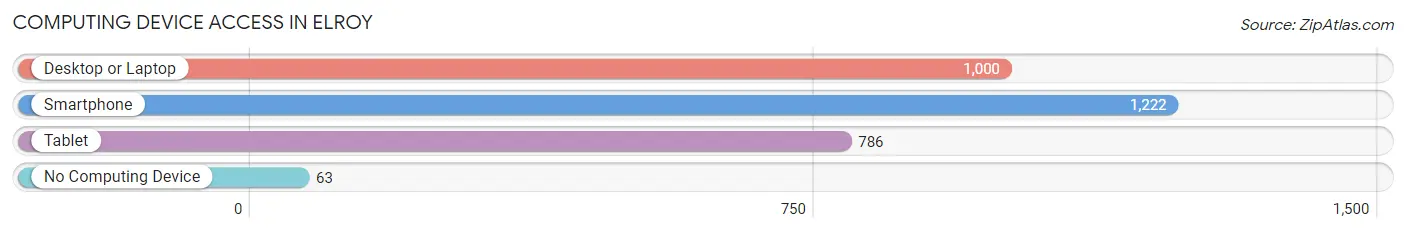
| Device Type | # Households | % Households |
| Desktop or Laptop | 1,000 | 73.4% |
| Smartphone | 1,222 | 89.7% |
| Tablet | 786 | 57.7% |
| No Computing Device | 63 | 4.6% |
| Total | 1,362 | 100.0% |
Internet Access in Elroy
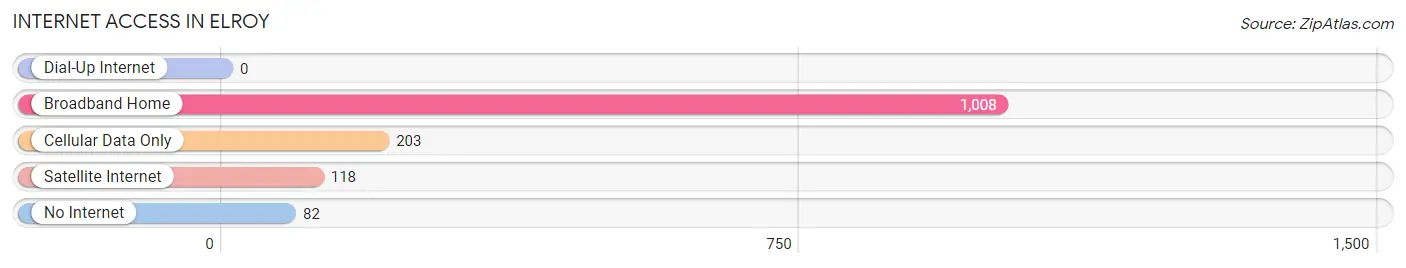
| Internet Type | # Households | % Households |
| Dial-Up Internet | 0 | 0.0% |
| Broadband Home | 1,008 | 74.0% |
| Cellular Data Only | 203 | 14.9% |
| Satellite Internet | 118 | 8.7% |
| No Internet | 82 | 6.0% |
| Total | 1,362 | 100.0% |
Elroy Summary
Elroy, North Carolina is a small town located in the foothills of the Blue Ridge Mountains in the western part of the state. It is situated in the Yadkin Valley region of North Carolina, and is part of Wilkes County. The town was founded in 1845 and has a population of approximately 1,000 people.
Geography
Elroy is located in the foothills of the Blue Ridge Mountains, and is part of the Yadkin Valley region of North Carolina. The town is situated in Wilkes County, and is located about 25 miles northwest of the city of Winston-Salem. The town is situated at an elevation of 1,000 feet above sea level, and is surrounded by rolling hills and forests. The Yadkin River runs through the town, and the nearby Brushy Mountains provide a scenic backdrop.
History
Elroy was founded in 1845 by a group of settlers from the nearby town of Wilkesboro. The town was named after the first settler, Elroy Smith. The town quickly grew and became a thriving community, with a variety of businesses and services. In the late 19th century, the town was a major stop on the North Carolina Railroad, and was a popular destination for travelers.
In the early 20th century, Elroy was a popular destination for tourists, and the town was home to several resorts and hotels. The town also had a thriving lumber industry, and was home to several sawmills. In the 1950s, the town began to decline, and many of the businesses and services closed. In the late 20th century, the town began to experience a resurgence, and many of the businesses and services have been restored.
Economy
Elroy’s economy is largely based on tourism and agriculture. The town is home to several wineries, and is a popular destination for wine-tasting tours. The town is also home to several farms, and is a popular destination for agritourism. The town is also home to several small businesses, including restaurants, shops, and galleries.
Demographics
As of the 2010 census, Elroy had a population of 1,000 people. The town is predominantly white, with a small African American population. The median household income is $35,000, and the median home value is $150,000. The town has a low unemployment rate, and the majority of the population is employed in the tourism and agriculture industries.
Elroy is a small town with a rich history and a vibrant economy. The town is home to a variety of businesses and services, and is a popular destination for tourists and wine-tasting tours. The town is also home to several farms, and is a popular destination for agritourism. The town has a diverse population, and is a great place to live and work.
Common Questions
What is the Total Population of Elroy?
Total Population of Elroy is 3,495.
What is the Total Male Population of Elroy?
Total Male Population of Elroy is 1,757.
What is the Total Female Population of Elroy?
Total Female Population of Elroy is 1,738.
What is the Ratio of Males per 100 Females in Elroy?
There are 101.09 Males per 100 Females in Elroy.
What is the Ratio of Females per 100 Males in Elroy?
There are 98.92 Females per 100 Males in Elroy.
What is the Median Population Age in Elroy?
Median Population Age in Elroy is 41.9 Years.
What is the Average Family Size in Elroy
Average Family Size in Elroy is 3.1 People.
What is the Average Household Size in Elroy
Average Household Size in Elroy is 2.6 People.
What is Per Capita Income in Elroy?
Per Capita income in Elroy is $26,360.
What is the Median Family Income in Elroy?
Median Family Income in Elroy is $71,071.
What is the Median Household income in Elroy?
Median Household Income in Elroy is $59,505.
What is Income or Wage Gap in Elroy?
Income or Wage Gap in Elroy is 16.6%.
Women in Elroy earn 83.4 cents for every dollar earned by a man.
What is Inequality or Gini Index in Elroy?
Inequality or Gini Index in Elroy is 0.38.
How Large is the Labor Force in Elroy?
There are 1,604 People in the Labor Forcein in Elroy.
What is the Percentage of People in the Labor Force in Elroy?
57.8% of People are in the Labor Force in Elroy.
What is the Unemployment Rate in Elroy?
Unemployment Rate in Elroy is 3.3%.