Avery Creek, NC
Avery Creek Map
Avery Creek Overview
3,338
TOTAL POPULATION
1,554
MALE POPULATION
1,784
FEMALE POPULATION
87.11
MALES / 100 FEMALES
114.80
FEMALES / 100 MALES
40.4
MEDIAN AGE
4.3
AVG FAMILY SIZE
3.9
AVG HOUSEHOLD SIZE
$40,664
PER CAPITA INCOME
$104,038
AVG FAMILY INCOME
$104,808
AVG HOUSEHOLD INCOME
41.4%
WAGE / INCOME GAP [ % ]
58.6¢/ $1
WAGE / INCOME GAP [ $ ]
0.36
INEQUALITY / GINI INDEX
2,008
LABOR FORCE [ PEOPLE ]
72.6%
PERCENT IN LABOR FORCE
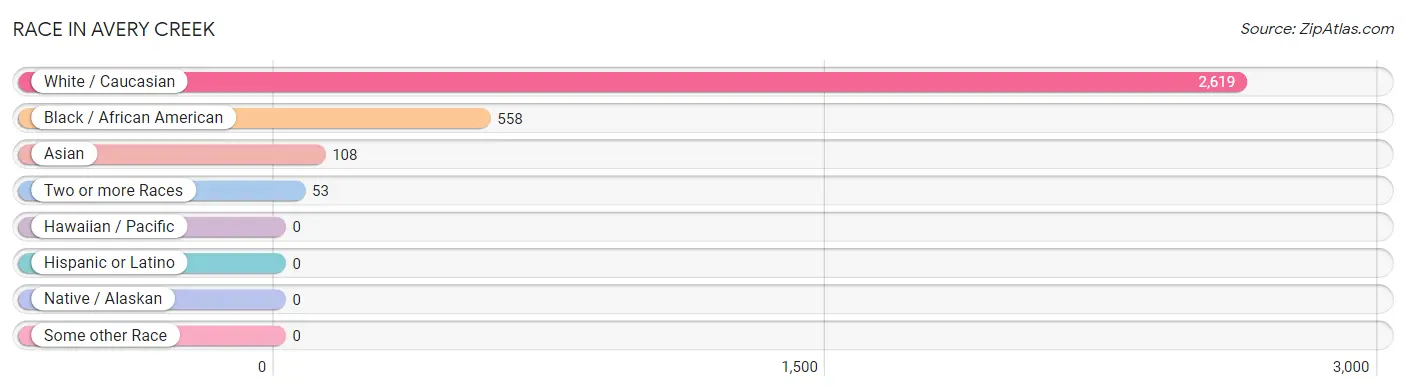
Race in Avery Creek
The most populous races in Avery Creek are White / Caucasian (2,619 | 78.5%), Black / African American (558 | 16.7%), and Asian (108 | 3.2%).
| Race | # Population | % Population |
| Asian | 108 | 3.2% |
| Black / African American | 558 | 16.7% |
| Hawaiian / Pacific | 0 | 0.0% |
| Hispanic or Latino | 0 | 0.0% |
| Native / Alaskan | 0 | 0.0% |
| White / Caucasian | 2,619 | 78.5% |
| Two or more Races | 53 | 1.6% |
| Some other Race | 0 | 0.0% |
| Total | 3,338 | 100.0% |
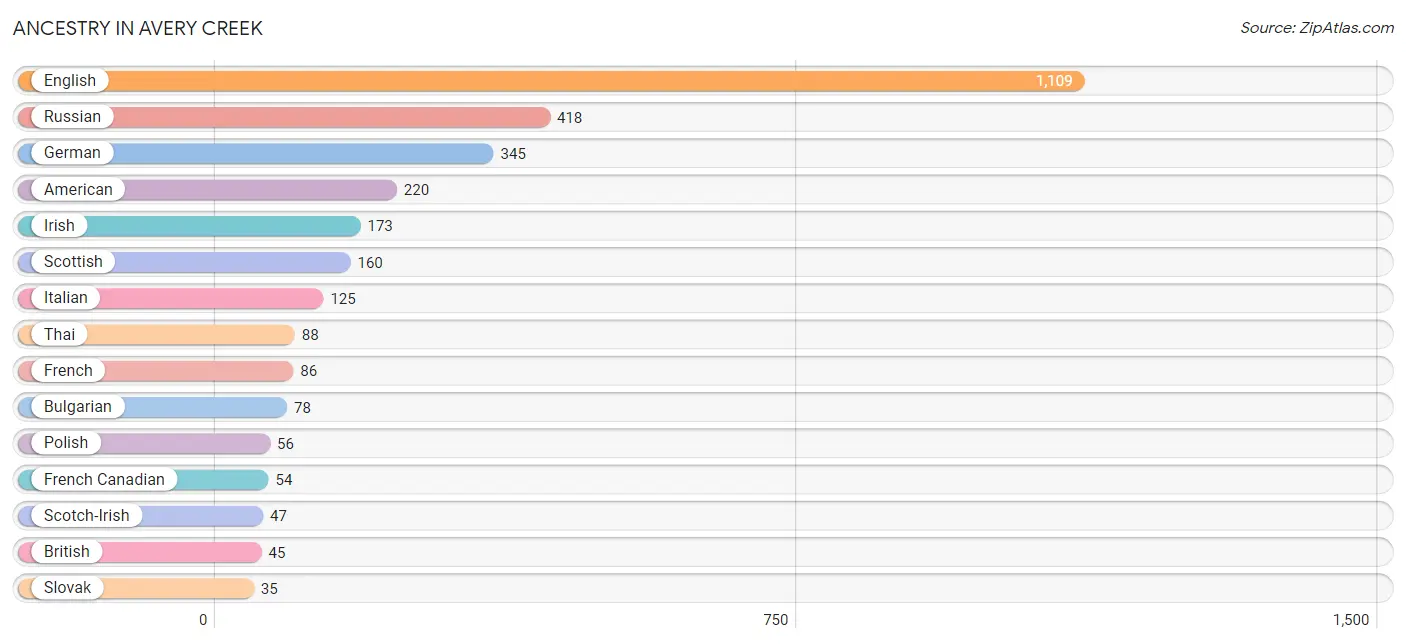
Ancestry in Avery Creek
The most populous ancestries reported in Avery Creek are English (1,109 | 33.2%), Russian (418 | 12.5%), German (345 | 10.3%), American (220 | 6.6%), and Irish (173 | 5.2%), together accounting for 67.8% of all Avery Creek residents.
| Ancestry | # Population | % Population |
| American | 220 | 6.6% |
| British | 45 | 1.3% |
| Bulgarian | 78 | 2.3% |
| Burmese | 20 | 0.6% |
| Danish | 14 | 0.4% |
| English | 1,109 | 33.2% |
| French | 86 | 2.6% |
| French Canadian | 54 | 1.6% |
| German | 345 | 10.3% |
| Greek | 21 | 0.6% |
| Irish | 173 | 5.2% |
| Italian | 125 | 3.7% |
| Nigerian | 27 | 0.8% |
| Polish | 56 | 1.7% |
| Portuguese | 13 | 0.4% |
| Russian | 418 | 12.5% |
| Scandinavian | 10 | 0.3% |
| Scotch-Irish | 47 | 1.4% |
| Scottish | 160 | 4.8% |
| Slovak | 35 | 1.1% |
| Subsaharan African | 27 | 0.8% |
| Swedish | 24 | 0.7% |
| Thai | 88 | 2.6% |
| Welsh | 26 | 0.8% | View All 24 Rows |
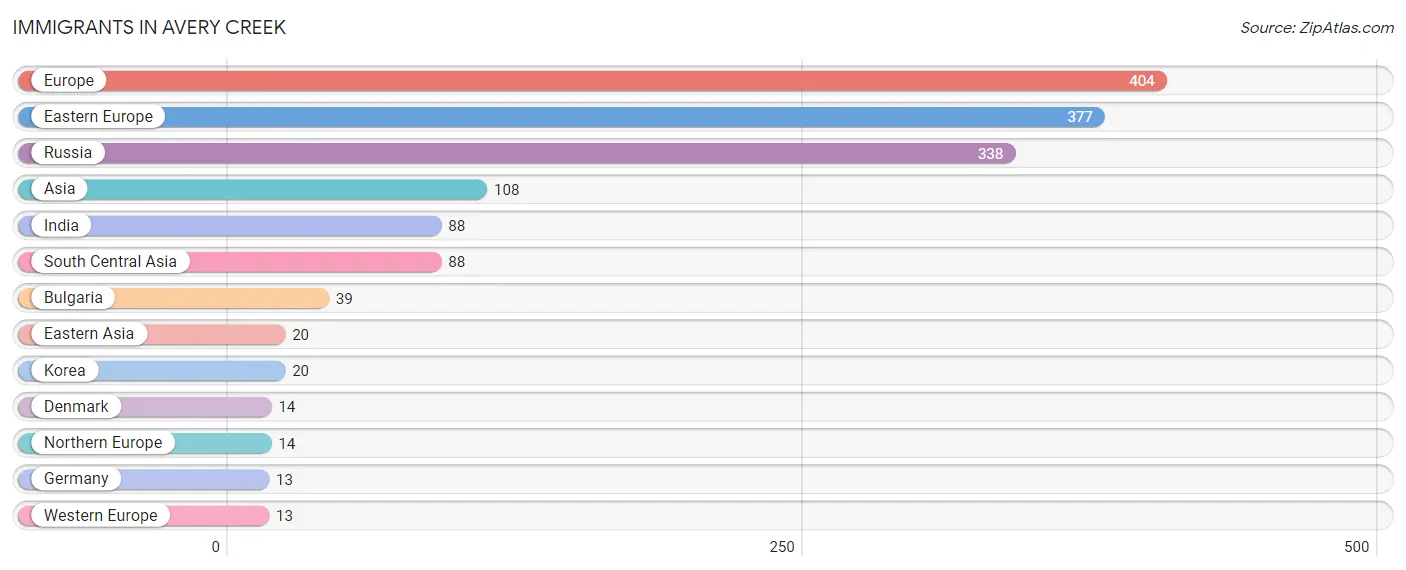
Immigrants in Avery Creek
The most numerous immigrant groups reported in Avery Creek came from Europe (404 | 12.1%), Eastern Europe (377 | 11.3%), Russia (338 | 10.1%), Asia (108 | 3.2%), and India (88 | 2.6%), together accounting for 39.4% of all Avery Creek residents.
| Immigration Origin | # Population | % Population |
| Asia | 108 | 3.2% |
| Bulgaria | 39 | 1.2% |
| Denmark | 14 | 0.4% |
| Eastern Asia | 20 | 0.6% |
| Eastern Europe | 377 | 11.3% |
| Europe | 404 | 12.1% |
| Germany | 13 | 0.4% |
| India | 88 | 2.6% |
| Korea | 20 | 0.6% |
| Northern Europe | 14 | 0.4% |
| Russia | 338 | 10.1% |
| South Central Asia | 88 | 2.6% |
| Western Europe | 13 | 0.4% | View All 13 Rows |
Sex and Age in Avery Creek
Sex and Age in Avery Creek
The most populous age groups in Avery Creek are 15 to 19 Years (231 | 14.9%) for men and 15 to 19 Years (271 | 15.2%) for women.
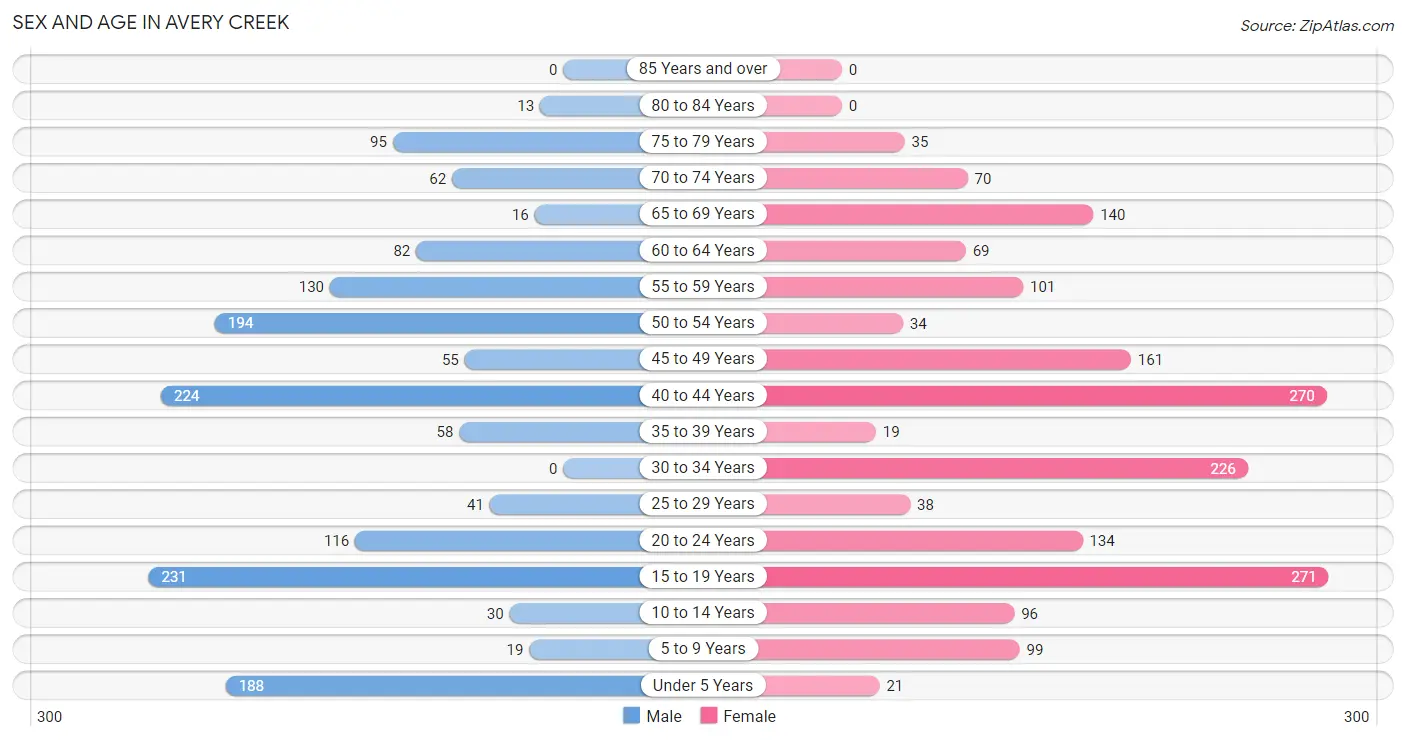
| Age Bracket | Male | Female |
| Under 5 Years | 188 (12.1%) | 21 (1.2%) |
| 5 to 9 Years | 19 (1.2%) | 99 (5.6%) |
| 10 to 14 Years | 30 (1.9%) | 96 (5.4%) |
| 15 to 19 Years | 231 (14.9%) | 271 (15.2%) |
| 20 to 24 Years | 116 (7.5%) | 134 (7.5%) |
| 25 to 29 Years | 41 (2.6%) | 38 (2.1%) |
| 30 to 34 Years | 0 (0.0%) | 226 (12.7%) |
| 35 to 39 Years | 58 (3.7%) | 19 (1.1%) |
| 40 to 44 Years | 224 (14.4%) | 270 (15.1%) |
| 45 to 49 Years | 55 (3.5%) | 161 (9.0%) |
| 50 to 54 Years | 194 (12.5%) | 34 (1.9%) |
| 55 to 59 Years | 130 (8.4%) | 101 (5.7%) |
| 60 to 64 Years | 82 (5.3%) | 69 (3.9%) |
| 65 to 69 Years | 16 (1.0%) | 140 (7.9%) |
| 70 to 74 Years | 62 (4.0%) | 70 (3.9%) |
| 75 to 79 Years | 95 (6.1%) | 35 (2.0%) |
| 80 to 84 Years | 13 (0.8%) | 0 (0.0%) |
| 85 Years and over | 0 (0.0%) | 0 (0.0%) |
| Total | 1,554 (100.0%) | 1,784 (100.0%) |
Families and Households in Avery Creek
Median Family Size in Avery Creek
The median family size in Avery Creek is 4.27 persons per family, with single female/mother families (92 | 12.6%) accounting for the largest median family size of 8.32 persons per family. On the other hand, single male/father families (69 | 9.5%) represent the smallest median family size with 3.33 persons per family.
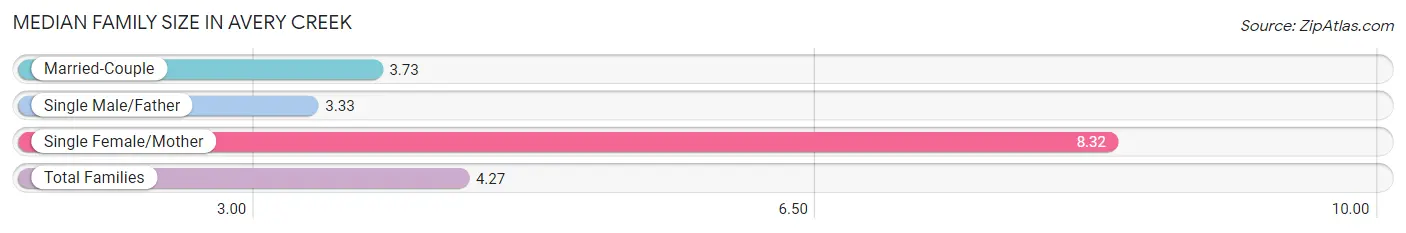
| Family Type | # Families | Family Size |
| Married-Couple | 567 (77.9%) | 3.73 |
| Single Male/Father | 69 (9.5%) | 3.33 |
| Single Female/Mother | 92 (12.6%) | 8.32 |
| Total Families | 728 (100.0%) | 4.27 |
Median Household Size in Avery Creek
The median household size in Avery Creek is 3.88 persons per household, with single female/mother households (92 | 10.7%) accounting for the largest median household size of 8.58 persons per household. non-family households (132 | 15.3%) represent the smallest median household size with 1.24 persons per household.
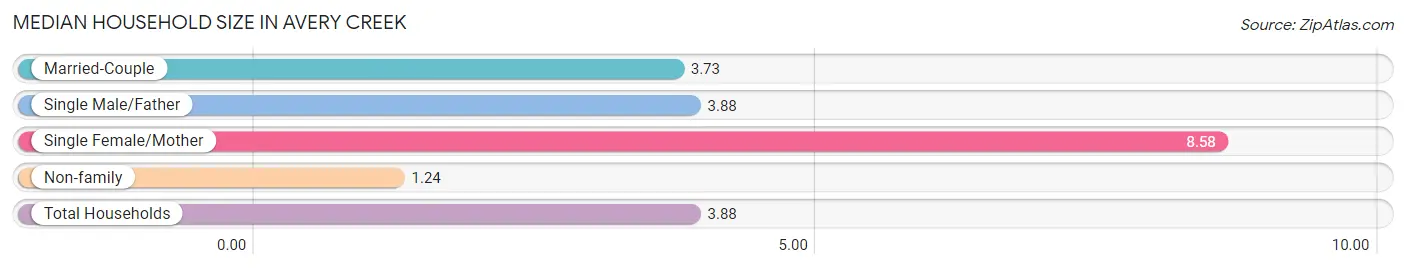
| Household Type | # Households | Household Size |
| Married-Couple | 567 (65.9%) | 3.73 |
| Single Male/Father | 69 (8.0%) | 3.88 |
| Single Female/Mother | 92 (10.7%) | 8.58 |
| Non-family | 132 (15.3%) | 1.24 |
| Total Households | 860 (100.0%) | 3.88 |
Household Size by Marriage Status in Avery Creek
Out of a total of 860 households in Avery Creek, 728 (84.7%) are family households, while 132 (15.3%) are nonfamily households. The most numerous type of family households are 2-person households, comprising 280, and the most common type of nonfamily households are 1-person households, comprising 99.
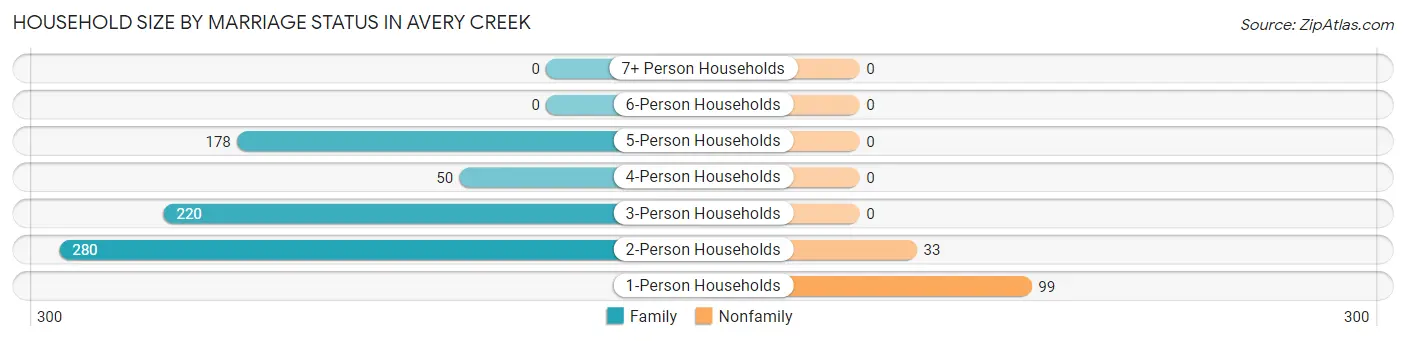
| Household Size | Family Households | Nonfamily Households |
| 1-Person Households | - | 99 (11.5%) |
| 2-Person Households | 280 (32.6%) | 33 (3.8%) |
| 3-Person Households | 220 (25.6%) | 0 (0.0%) |
| 4-Person Households | 50 (5.8%) | 0 (0.0%) |
| 5-Person Households | 178 (20.7%) | 0 (0.0%) |
| 6-Person Households | 0 (0.0%) | 0 (0.0%) |
| 7+ Person Households | 0 (0.0%) | 0 (0.0%) |
| Total | 728 (84.7%) | 132 (15.3%) |
Female Fertility in Avery Creek
Fertility by Age in Avery Creek
| Age Bracket | Women with Births | Births / 1,000 Women |
| 15 to 19 years | 0 (0.0%) | 0.0 |
| 20 to 34 years | 0 (0.0%) | 0.0 |
| 35 to 50 years | 0 (0.0%) | 0.0 |
| Total | 0 (0.0%) | 0.0 |
Fertility by Age by Marriage Status in Avery Creek
| Age Bracket | Married | Unmarried |
| 15 to 19 years | 0 (0.0%) | 0 (0.0%) |
| 20 to 34 years | 0 (0.0%) | 0 (0.0%) |
| 35 to 50 years | 0 (0.0%) | 0 (0.0%) |
| Total | 0 (0.0%) | 0 (0.0%) |
Fertility by Education in Avery Creek
| Educational Attainment | Women with Births | Births / 1,000 Women |
| Less than High School | 0 (0.0%) | 0.0 |
| High School Diploma | 0 (0.0%) | 0.0 |
| College or Associate's Degree | 0 (0.0%) | 0.0 |
| Bachelor's Degree | 0 (0.0%) | 0.0 |
| Graduate Degree | 0 (0.0%) | 0.0 |
| Total | 0 (0.0%) | 0.0 |
Fertility by Education by Marriage Status in Avery Creek
| Educational Attainment | Married | Unmarried |
| Less than High School | 0 (0.0%) | 0 (0.0%) |
| High School Diploma | 0 (0.0%) | 0 (0.0%) |
| College or Associate's Degree | 0 (0.0%) | 0 (0.0%) |
| Bachelor's Degree | 0 (0.0%) | 0 (0.0%) |
| Graduate Degree | 0 (0.0%) | 0 (0.0%) |
| Total | 0 (0.0%) | 0 (0.0%) |
Income in Avery Creek
Income Overview in Avery Creek
Per Capita Income in Avery Creek is $40,664, while median incomes of families and households are $104,038 and $104,808 respectively.
| Characteristic | Number | Measure |
| Per Capita Income | 3,338 | $40,664 |
| Median Family Income | 728 | $104,038 |
| Mean Family Income | 728 | $136,428 |
| Median Household Income | 860 | $104,808 |
| Mean Household Income | 860 | $133,220 |
| Income Deficit | 728 | $0 |
| Wage / Income Gap (%) | 3,338 | 41.44% |
| Wage / Income Gap ($) | 3,338 | 58.56¢ per $1 |
| Gini / Inequality Index | 3,338 | 0.36 |
Earnings by Sex in Avery Creek
Average Earnings in Avery Creek are $31,151, $48,674 for men and $28,504 for women, a difference of 41.4%.
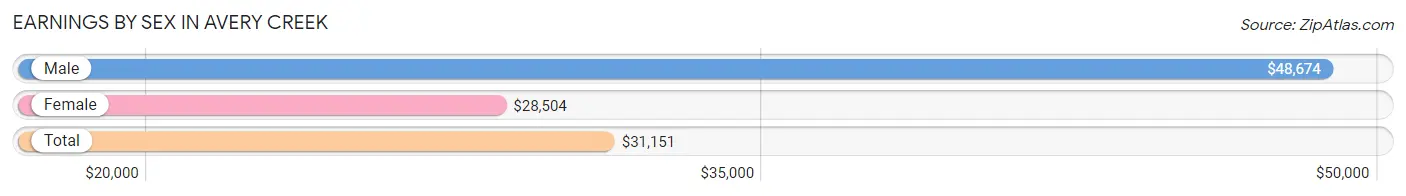
| Sex | Number | Average Earnings |
| Male | 1,022 (49.2%) | $48,674 |
| Female | 1,057 (50.8%) | $28,504 |
| Total | 2,079 (100.0%) | $31,151 |
Earnings by Sex by Income Bracket in Avery Creek
The most common earnings brackets in Avery Creek are $100,000+ for men (232 | 22.7%) and $25,000 to $29,999 for women (203 | 19.2%).
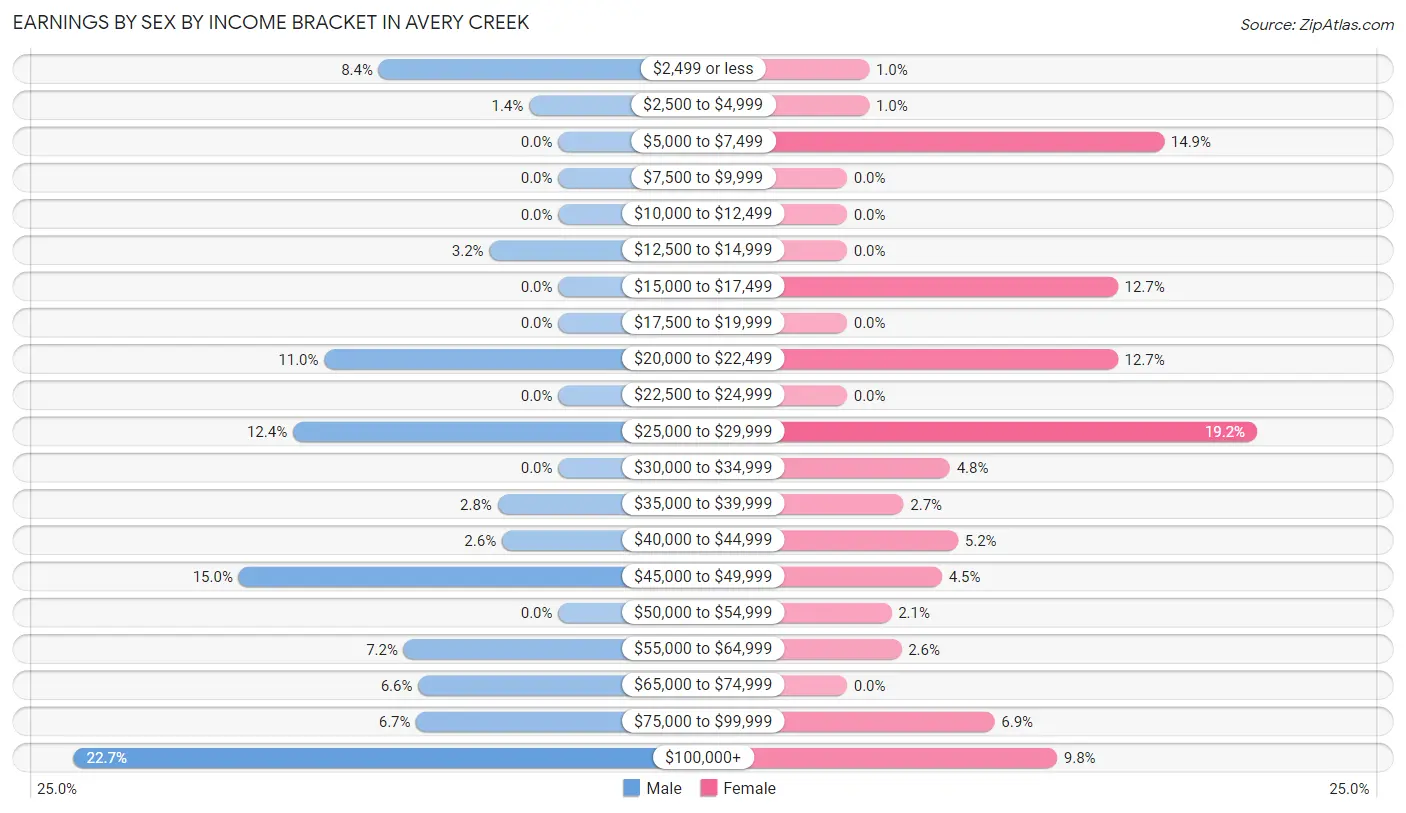
| Income | Male | Female |
| $2,499 or less | 86 (8.4%) | 11 (1.0%) |
| $2,500 to $4,999 | 14 (1.4%) | 11 (1.0%) |
| $5,000 to $7,499 | 0 (0.0%) | 157 (14.8%) |
| $7,500 to $9,999 | 0 (0.0%) | 0 (0.0%) |
| $10,000 to $12,499 | 0 (0.0%) | 0 (0.0%) |
| $12,500 to $14,999 | 33 (3.2%) | 0 (0.0%) |
| $15,000 to $17,499 | 0 (0.0%) | 134 (12.7%) |
| $17,500 to $19,999 | 0 (0.0%) | 0 (0.0%) |
| $20,000 to $22,499 | 112 (11.0%) | 134 (12.7%) |
| $22,500 to $24,999 | 0 (0.0%) | 0 (0.0%) |
| $25,000 to $29,999 | 127 (12.4%) | 203 (19.2%) |
| $30,000 to $34,999 | 0 (0.0%) | 51 (4.8%) |
| $35,000 to $39,999 | 29 (2.8%) | 28 (2.6%) |
| $40,000 to $44,999 | 27 (2.6%) | 55 (5.2%) |
| $45,000 to $49,999 | 153 (15.0%) | 47 (4.4%) |
| $50,000 to $54,999 | 0 (0.0%) | 22 (2.1%) |
| $55,000 to $64,999 | 74 (7.2%) | 27 (2.5%) |
| $65,000 to $74,999 | 67 (6.6%) | 0 (0.0%) |
| $75,000 to $99,999 | 68 (6.7%) | 73 (6.9%) |
| $100,000+ | 232 (22.7%) | 104 (9.8%) |
| Total | 1,022 (100.0%) | 1,057 (100.0%) |
Earnings by Sex by Educational Attainment in Avery Creek
Average earnings in Avery Creek are $56,550 for men and $31,217 for women, a difference of 44.8%. Men with an educational attainment of college or associate's degree enjoy the highest average annual earnings of $75,463, while those with bachelor's degree education earn the least with $49,367. Women with an educational attainment of graduate degree earn the most with the average annual earnings of $111,078, while those with college or associate's degree education have the smallest earnings of $29,372.
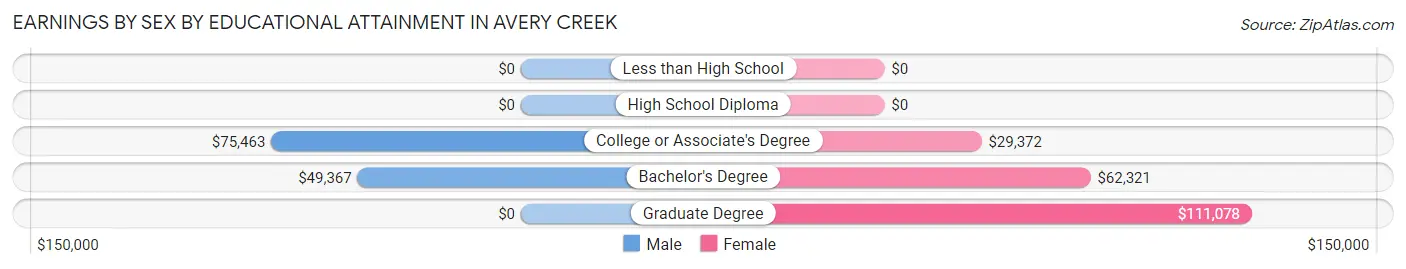
| Educational Attainment | Male Income | Female Income |
| Less than High School | - | - |
| High School Diploma | - | - |
| College or Associate's Degree | $75,463 | $29,372 |
| Bachelor's Degree | $49,367 | $62,321 |
| Graduate Degree | - | - |
| Total | $56,550 | $31,217 |
Family Income in Avery Creek
Family Income Brackets in Avery Creek
According to the Avery Creek family income data, there are 171 families falling into the $75,000 to $99,999 income range, which is the most common income bracket and makes up 23.5% of all families.
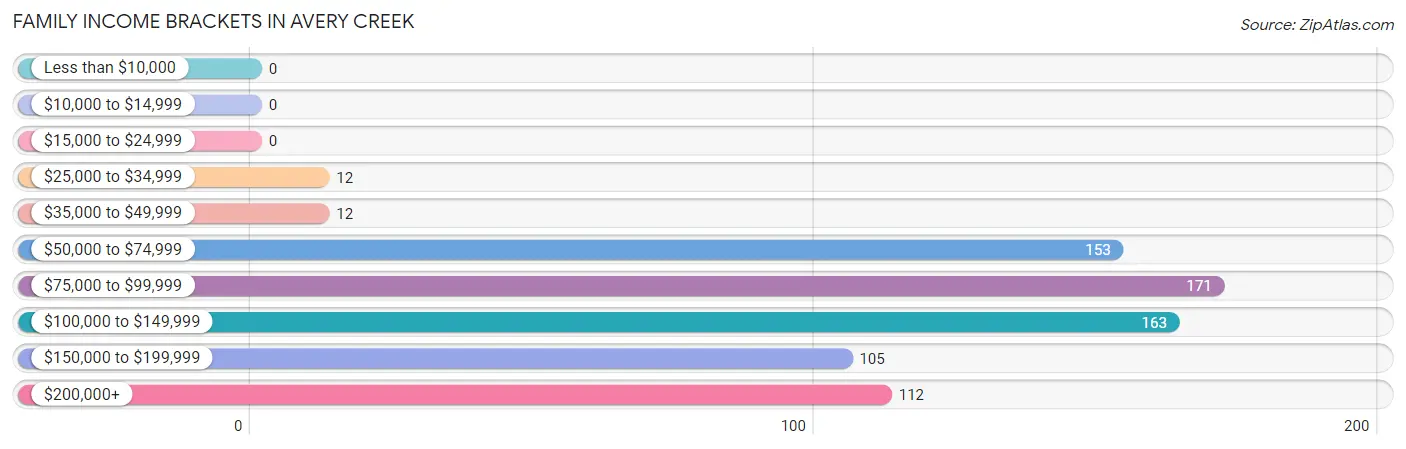
| Income Bracket | # Families | % Families |
| Less than $10,000 | 0 | 0.0% |
| $10,000 to $14,999 | 0 | 0.0% |
| $15,000 to $24,999 | 0 | 0.0% |
| $25,000 to $34,999 | 12 | 1.6% |
| $35,000 to $49,999 | 12 | 1.6% |
| $50,000 to $74,999 | 153 | 21.0% |
| $75,000 to $99,999 | 171 | 23.5% |
| $100,000 to $149,999 | 163 | 22.4% |
| $150,000 to $199,999 | 105 | 14.4% |
| $200,000+ | 112 | 15.4% |
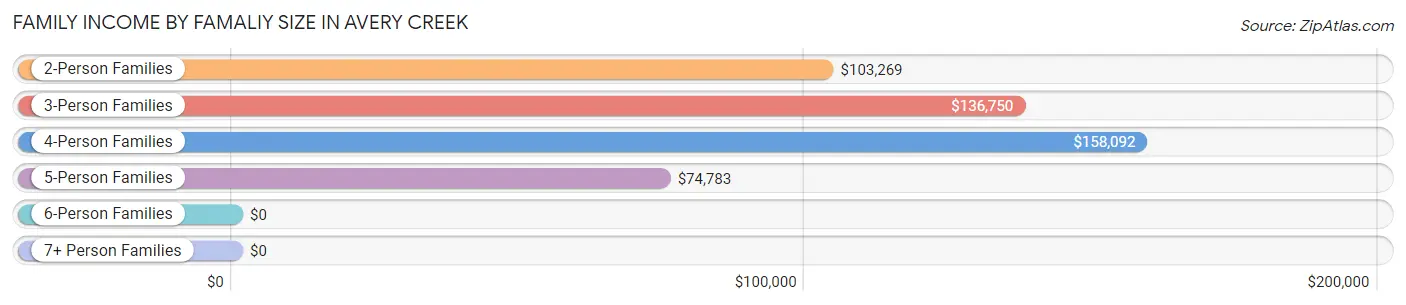
Family Income by Famaliy Size in Avery Creek
4-person families (91 | 12.5%) account for the highest median family income in Avery Creek with $158,092 per family, while 2-person families (296 | 40.7%) have the highest median income of $51,634 per family member.
| Income Bracket | # Families | Median Income |
| 2-Person Families | 296 (40.7%) | $103,269 |
| 3-Person Families | 204 (28.0%) | $136,750 |
| 4-Person Families | 91 (12.5%) | $158,092 |
| 5-Person Families | 137 (18.8%) | $74,783 |
| 6-Person Families | 0 (0.0%) | $0 |
| 7+ Person Families | 0 (0.0%) | $0 |
| Total | 728 (100.0%) | $104,038 |
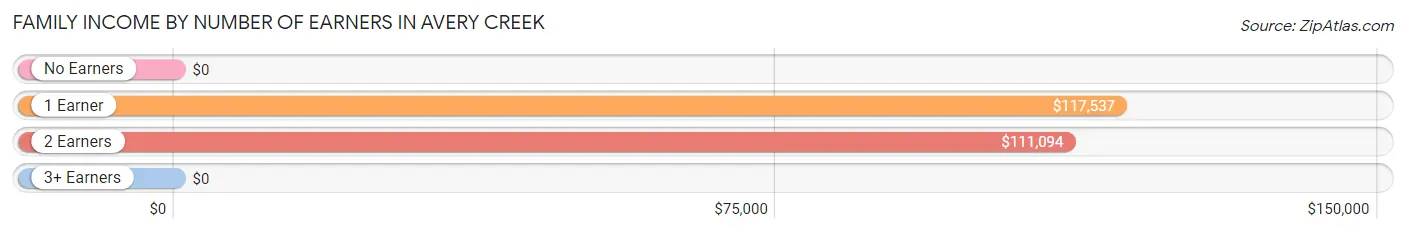
Family Income by Number of Earners in Avery Creek
| Number of Earners | # Families | Median Income |
| No Earners | 66 (9.1%) | $0 |
| 1 Earner | 235 (32.3%) | $117,537 |
| 2 Earners | 365 (50.1%) | $111,094 |
| 3+ Earners | 62 (8.5%) | $0 |
| Total | 728 (100.0%) | $104,038 |
Household Income in Avery Creek
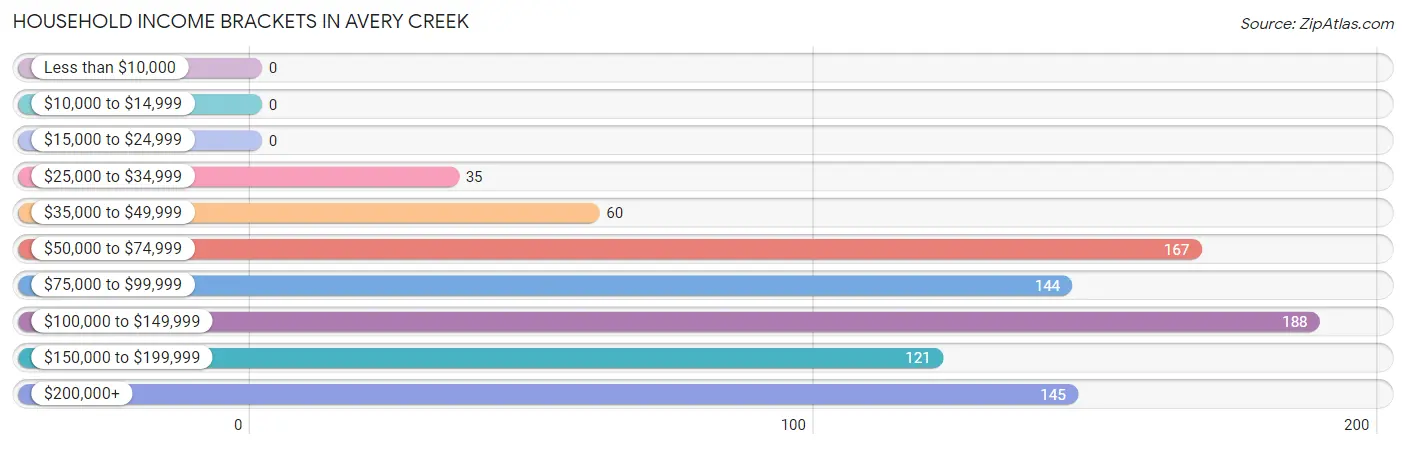
Household Income Brackets in Avery Creek
With 188 households falling in the category, the $100,000 to $149,999 income range is the most frequent in Avery Creek, accounting for 21.9% of all households.
| Income Bracket | # Households | % Households |
| Less than $10,000 | 0 | 0.0% |
| $10,000 to $14,999 | 0 | 0.0% |
| $15,000 to $24,999 | 0 | 0.0% |
| $25,000 to $34,999 | 35 | 4.1% |
| $35,000 to $49,999 | 60 | 7.0% |
| $50,000 to $74,999 | 167 | 19.4% |
| $75,000 to $99,999 | 144 | 16.7% |
| $100,000 to $149,999 | 188 | 21.9% |
| $150,000 to $199,999 | 121 | 14.1% |
| $200,000+ | 145 | 16.9% |
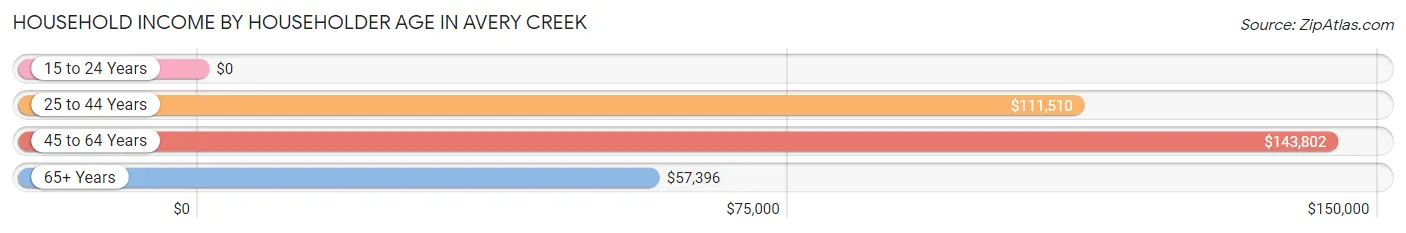
Household Income by Householder Age in Avery Creek
The median household income in Avery Creek is $104,808, with the highest median household income of $143,802 found in the 45 to 64 years age bracket for the primary householder. A total of 291 households (33.8%) fall into this category.
| Income Bracket | # Households | Median Income |
| 15 to 24 Years | 0 (0.0%) | $0 |
| 25 to 44 Years | 373 (43.4%) | $111,510 |
| 45 to 64 Years | 291 (33.8%) | $143,802 |
| 65+ Years | 196 (22.8%) | $57,396 |
| Total | 860 (100.0%) | $104,808 |
Poverty in Avery Creek
Income Below Poverty by Sex and Age in Avery Creek
| Age Bracket | Male | Female |
| Under 5 Years | 0 (0.0%) | 0 (0.0%) |
| 5 Years | 0 (0.0%) | 0 (0.0%) |
| 6 to 11 Years | 0 (0.0%) | 0 (0.0%) |
| 12 to 14 Years | 0 (0.0%) | 0 (0.0%) |
| 15 Years | 0 (0.0%) | 0 (0.0%) |
| 16 and 17 Years | 0 (0.0%) | 0 (0.0%) |
| 18 to 24 Years | 0 (0.0%) | 0 (0.0%) |
| 25 to 34 Years | 0 (0.0%) | 0 (0.0%) |
| 35 to 44 Years | 0 (0.0%) | 0 (0.0%) |
| 45 to 54 Years | 0 (0.0%) | 0 (0.0%) |
| 55 to 64 Years | 0 (0.0%) | 0 (0.0%) |
| 65 to 74 Years | 0 (0.0%) | 0 (0.0%) |
| 75 Years and over | 0 (0.0%) | 0 (0.0%) |
| Total | 0 (0.0%) | 0 (0.0%) |
Income Above Poverty by Sex and Age in Avery Creek
According to the poverty statistics in Avery Creek, males aged under 5 years and females aged under 5 years are the age groups that are most secure financially, with 100.0% of males and 100.0% of females in these age groups living above the poverty line.
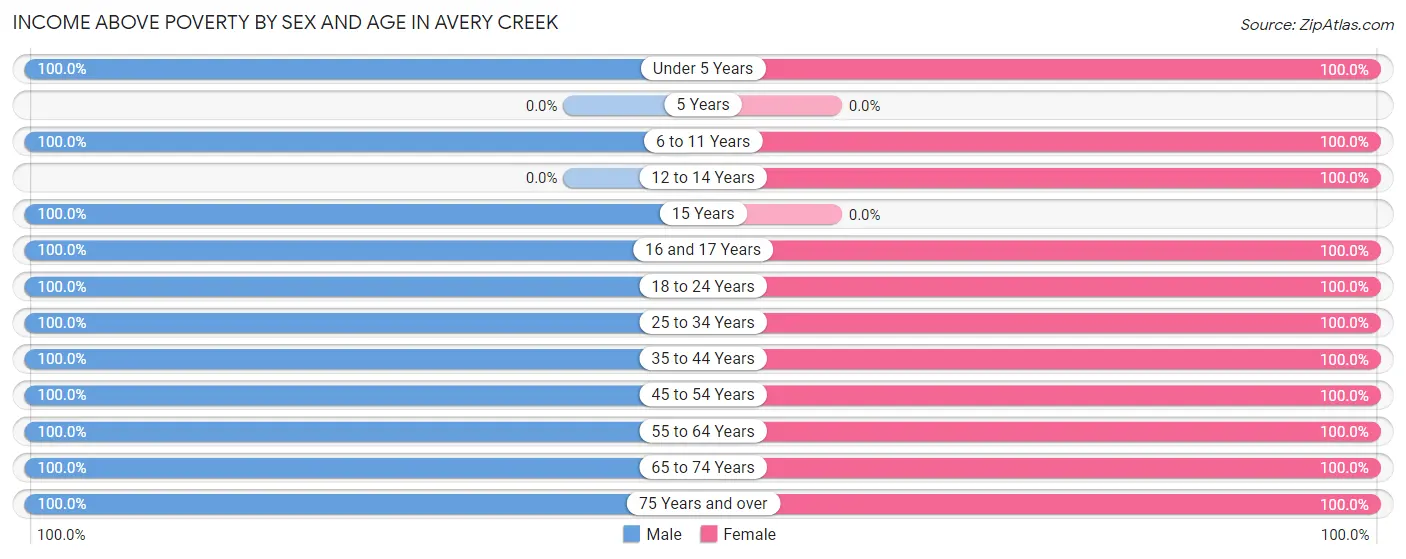
| Age Bracket | Male | Female |
| Under 5 Years | 188 (100.0%) | 21 (100.0%) |
| 5 Years | 0 (0.0%) | 0 (0.0%) |
| 6 to 11 Years | 49 (100.0%) | 172 (100.0%) |
| 12 to 14 Years | 0 (0.0%) | 23 (100.0%) |
| 15 Years | 119 (100.0%) | 0 (0.0%) |
| 16 and 17 Years | 86 (100.0%) | 95 (100.0%) |
| 18 to 24 Years | 142 (100.0%) | 310 (100.0%) |
| 25 to 34 Years | 41 (100.0%) | 264 (100.0%) |
| 35 to 44 Years | 282 (100.0%) | 289 (100.0%) |
| 45 to 54 Years | 249 (100.0%) | 195 (100.0%) |
| 55 to 64 Years | 212 (100.0%) | 170 (100.0%) |
| 65 to 74 Years | 78 (100.0%) | 210 (100.0%) |
| 75 Years and over | 108 (100.0%) | 35 (100.0%) |
| Total | 1,554 (100.0%) | 1,784 (100.0%) |
Income Below Poverty Among Married-Couple Families in Avery Creek
| Children | Above Poverty | Below Poverty |
| No Children | 279 (100.0%) | 0 (0.0%) |
| 1 or 2 Children | 288 (100.0%) | 0 (0.0%) |
| 3 or 4 Children | 0 (0.0%) | 0 (0.0%) |
| 5 or more Children | 0 (0.0%) | 0 (0.0%) |
| Total | 567 (100.0%) | 0 (0.0%) |
Income Below Poverty Among Single-Parent Households in Avery Creek
| Children | Single Father | Single Mother |
| No Children | 0 (0.0%) | 0 (0.0%) |
| 1 or 2 Children | 0 (0.0%) | 0 (0.0%) |
| 3 or 4 Children | 0 (0.0%) | 0 (0.0%) |
| 5 or more Children | 0 (0.0%) | 0 (0.0%) |
| Total | 0 (0.0%) | 0 (0.0%) |
Income Below Poverty Among Married-Couple vs Single-Parent Households in Avery Creek
| Children | Married-Couple Families | Single-Parent Households |
| No Children | 0 (0.0%) | 0 (0.0%) |
| 1 or 2 Children | 0 (0.0%) | 0 (0.0%) |
| 3 or 4 Children | 0 (0.0%) | 0 (0.0%) |
| 5 or more Children | 0 (0.0%) | 0 (0.0%) |
| Total | 0 (0.0%) | 0 (0.0%) |
Employment Characteristics in Avery Creek
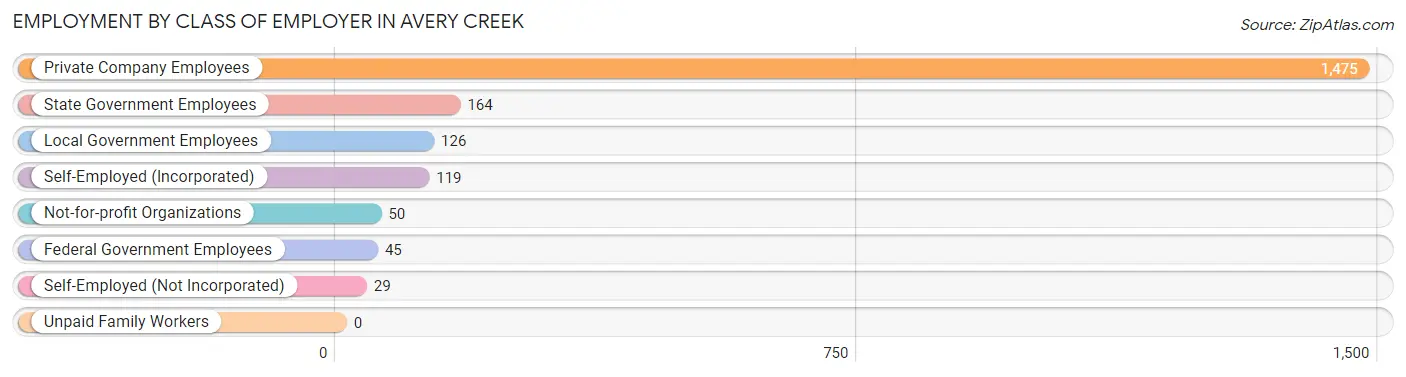
Employment by Class of Employer in Avery Creek
Among the 2,008 employed individuals in Avery Creek, private company employees (1,475 | 73.5%), state government employees (164 | 8.2%), and local government employees (126 | 6.3%) make up the most common classes of employment.
| Employer Class | # Employees | % Employees |
| Private Company Employees | 1,475 | 73.5% |
| Self-Employed (Incorporated) | 119 | 5.9% |
| Self-Employed (Not Incorporated) | 29 | 1.4% |
| Not-for-profit Organizations | 50 | 2.5% |
| Local Government Employees | 126 | 6.3% |
| State Government Employees | 164 | 8.2% |
| Federal Government Employees | 45 | 2.2% |
| Unpaid Family Workers | 0 | 0.0% |
| Total | 2,008 | 100.0% |
Employment Status by Age in Avery Creek
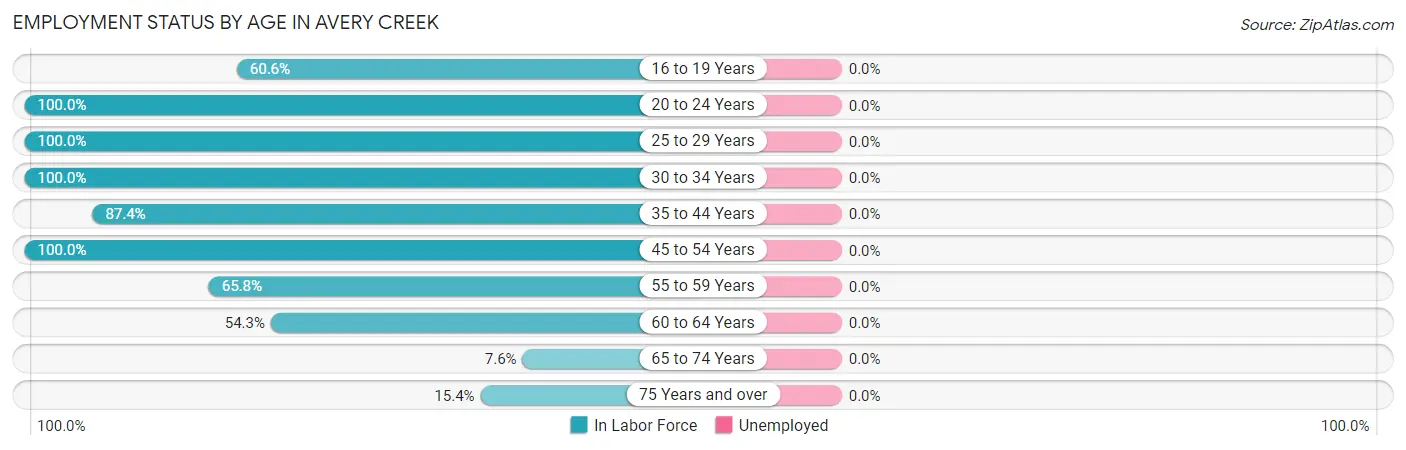
| Age Bracket | In Labor Force | Unemployed |
| 16 to 19 Years | 232 (60.6%) | 0 (0.0%) |
| 20 to 24 Years | 250 (100.0%) | 0 (0.0%) |
| 25 to 29 Years | 79 (100.0%) | 0 (0.0%) |
| 30 to 34 Years | 226 (100.0%) | 0 (0.0%) |
| 35 to 44 Years | 499 (87.4%) | 0 (0.0%) |
| 45 to 54 Years | 444 (100.0%) | 0 (0.0%) |
| 55 to 59 Years | 152 (65.8%) | 0 (0.0%) |
| 60 to 64 Years | 82 (54.3%) | 0 (0.0%) |
| 65 to 74 Years | 22 (7.6%) | 0 (0.0%) |
| 75 Years and over | 22 (15.4%) | 0 (0.0%) |
| Total | 2,008 (72.6%) | 0 (0.0%) |
Employment Status by Educational Attainment in Avery Creek
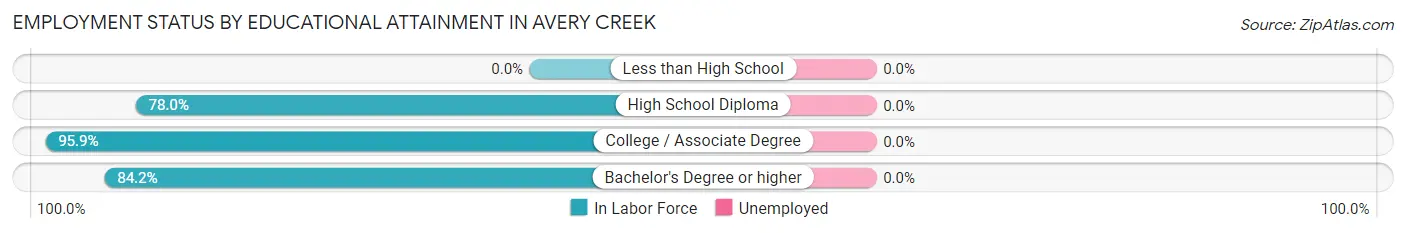
| Educational Attainment | In Labor Force | Unemployed |
| Less than High School | 0 (0.0%) | 0 (0.0%) |
| High School Diploma | 343 (78.0%) | 0 (0.0%) |
| College / Associate Degree | 629 (95.9%) | 0 (0.0%) |
| Bachelor's Degree or higher | 510 (84.2%) | 0 (0.0%) |
| Total | 1,482 (87.1%) | 0 (0.0%) |
Employment Occupations by Sex in Avery Creek
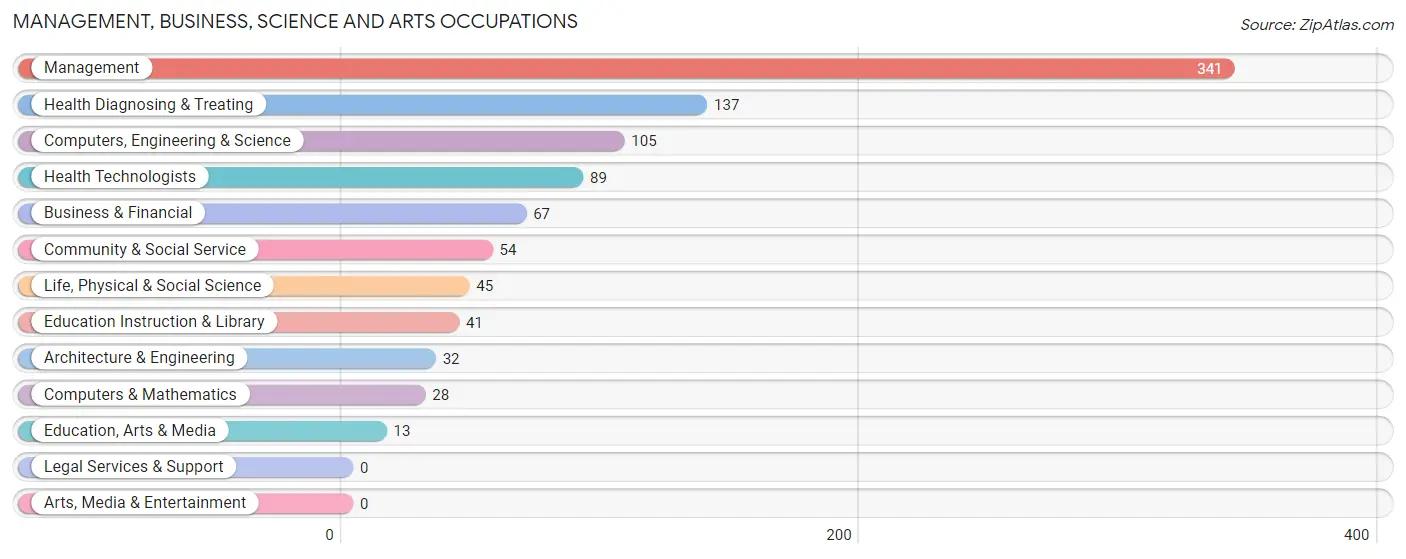
Management, Business, Science and Arts Occupations
The most common Management, Business, Science and Arts occupations in Avery Creek are Management (341 | 17.0%), Health Diagnosing & Treating (137 | 6.8%), Computers, Engineering & Science (105 | 5.2%), Health Technologists (89 | 4.4%), and Business & Financial (67 | 3.3%).
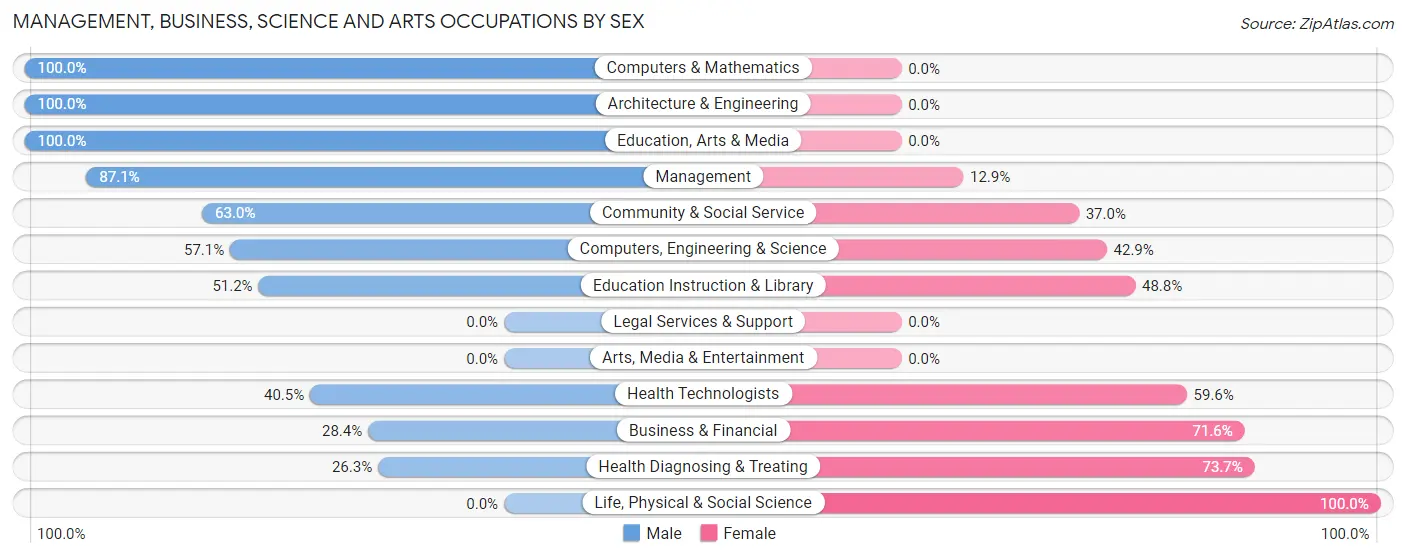
Management, Business, Science and Arts Occupations by Sex
Within the Management, Business, Science and Arts occupations in Avery Creek, the most male-oriented occupations are Computers & Mathematics (100.0%), Architecture & Engineering (100.0%), and Education, Arts & Media (100.0%), while the most female-oriented occupations are Life, Physical & Social Science (100.0%), Health Diagnosing & Treating (73.7%), and Business & Financial (71.6%).
| Occupation | Male | Female |
| Management | 297 (87.1%) | 44 (12.9%) |
| Business & Financial | 19 (28.4%) | 48 (71.6%) |
| Computers, Engineering & Science | 60 (57.1%) | 45 (42.9%) |
| Computers & Mathematics | 28 (100.0%) | 0 (0.0%) |
| Architecture & Engineering | 32 (100.0%) | 0 (0.0%) |
| Life, Physical & Social Science | 0 (0.0%) | 45 (100.0%) |
| Community & Social Service | 34 (63.0%) | 20 (37.0%) |
| Education, Arts & Media | 13 (100.0%) | 0 (0.0%) |
| Legal Services & Support | 0 (0.0%) | 0 (0.0%) |
| Education Instruction & Library | 21 (51.2%) | 20 (48.8%) |
| Arts, Media & Entertainment | 0 (0.0%) | 0 (0.0%) |
| Health Diagnosing & Treating | 36 (26.3%) | 101 (73.7%) |
| Health Technologists | 36 (40.5%) | 53 (59.6%) |
| Total (Category) | 446 (63.3%) | 258 (36.6%) |
| Total (Overall) | 975 (48.6%) | 1,033 (51.4%) |
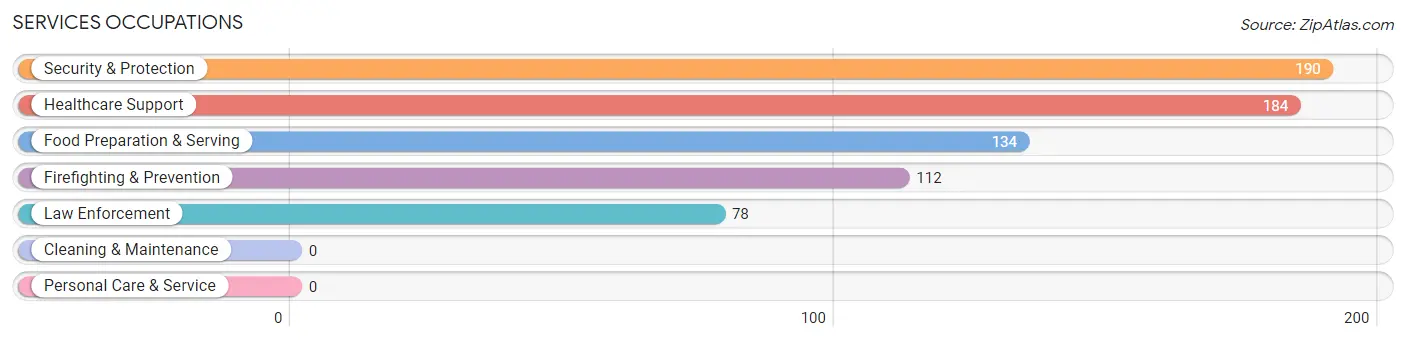
Services Occupations
The most common Services occupations in Avery Creek are Security & Protection (190 | 9.5%), Healthcare Support (184 | 9.2%), Food Preparation & Serving (134 | 6.7%), Firefighting & Prevention (112 | 5.6%), and Law Enforcement (78 | 3.9%).
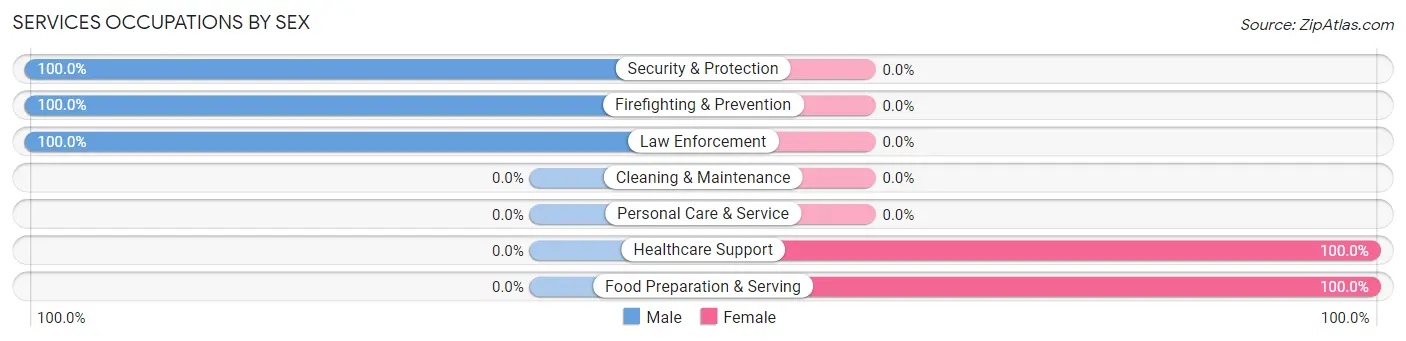
Services Occupations by Sex
Within the Services occupations in Avery Creek, the most male-oriented occupations are Security & Protection (100.0%), Firefighting & Prevention (100.0%), and Law Enforcement (100.0%), while the most female-oriented occupations are Healthcare Support (100.0%), and Food Preparation & Serving (100.0%).
| Occupation | Male | Female |
| Healthcare Support | 0 (0.0%) | 184 (100.0%) |
| Security & Protection | 190 (100.0%) | 0 (0.0%) |
| Firefighting & Prevention | 112 (100.0%) | 0 (0.0%) |
| Law Enforcement | 78 (100.0%) | 0 (0.0%) |
| Food Preparation & Serving | 0 (0.0%) | 134 (100.0%) |
| Cleaning & Maintenance | 0 (0.0%) | 0 (0.0%) |
| Personal Care & Service | 0 (0.0%) | 0 (0.0%) |
| Total (Category) | 190 (37.4%) | 318 (62.6%) |
| Total (Overall) | 975 (48.6%) | 1,033 (51.4%) |
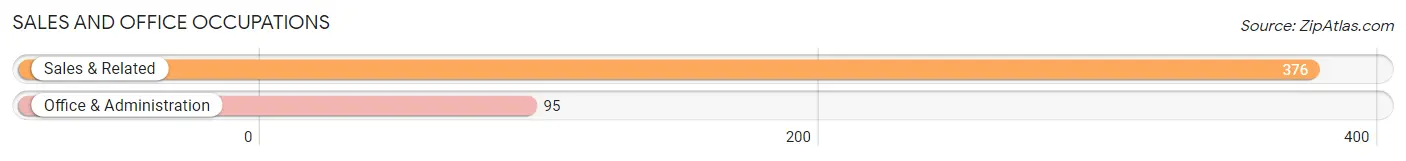
Sales and Office Occupations
The most common Sales and Office occupations in Avery Creek are Sales & Related (376 | 18.7%), and Office & Administration (95 | 4.7%).
Sales and Office Occupations by Sex
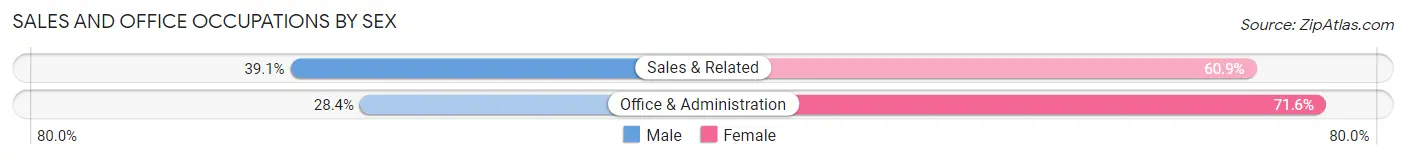
| Occupation | Male | Female |
| Sales & Related | 147 (39.1%) | 229 (60.9%) |
| Office & Administration | 27 (28.4%) | 68 (71.6%) |
| Total (Category) | 174 (36.9%) | 297 (63.1%) |
| Total (Overall) | 975 (48.6%) | 1,033 (51.4%) |
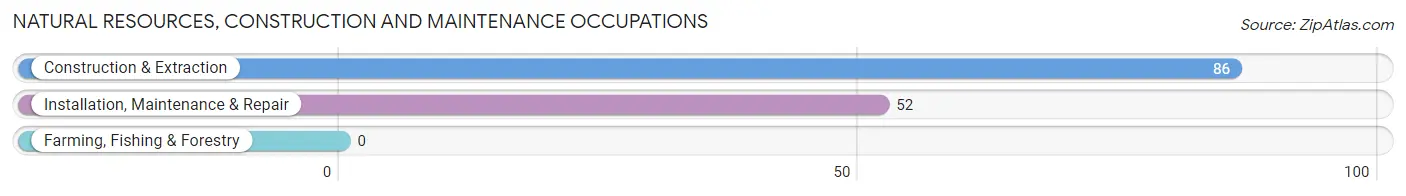
Natural Resources, Construction and Maintenance Occupations
The most common Natural Resources, Construction and Maintenance occupations in Avery Creek are Construction & Extraction (86 | 4.3%), and Installation, Maintenance & Repair (52 | 2.6%).
Natural Resources, Construction and Maintenance Occupations by Sex
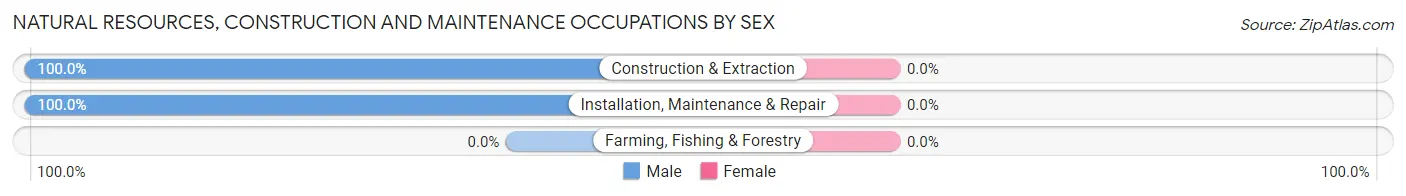
| Occupation | Male | Female |
| Farming, Fishing & Forestry | 0 (0.0%) | 0 (0.0%) |
| Construction & Extraction | 86 (100.0%) | 0 (0.0%) |
| Installation, Maintenance & Repair | 52 (100.0%) | 0 (0.0%) |
| Total (Category) | 138 (100.0%) | 0 (0.0%) |
| Total (Overall) | 975 (48.6%) | 1,033 (51.4%) |
Production, Transportation and Moving Occupations
The most common Production, Transportation and Moving occupations in Avery Creek are Material Moving (146 | 7.3%), and Transportation (41 | 2.0%).
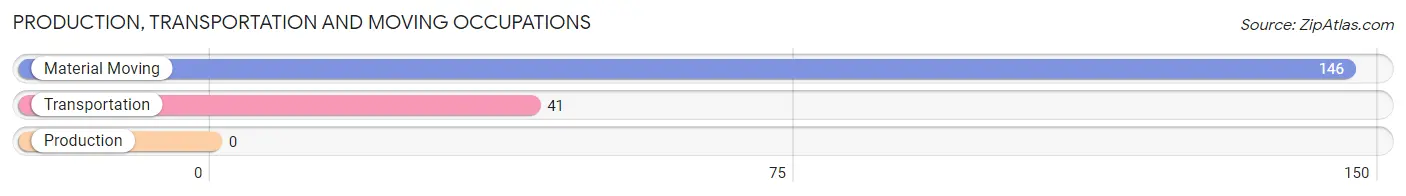
Production, Transportation and Moving Occupations by Sex
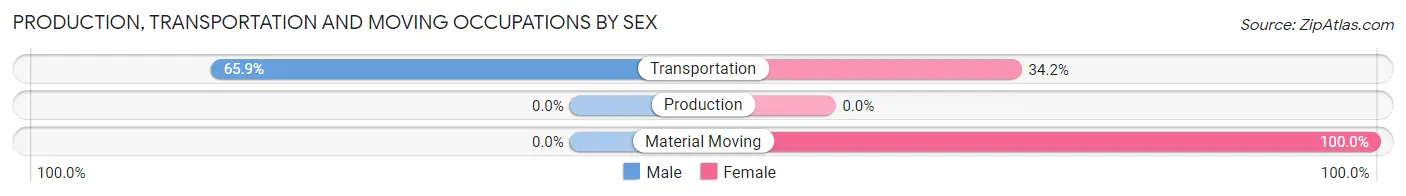
| Occupation | Male | Female |
| Production | 0 (0.0%) | 0 (0.0%) |
| Transportation | 27 (65.8%) | 14 (34.2%) |
| Material Moving | 0 (0.0%) | 146 (100.0%) |
| Total (Category) | 27 (14.4%) | 160 (85.6%) |
| Total (Overall) | 975 (48.6%) | 1,033 (51.4%) |
Employment Industries by Sex in Avery Creek
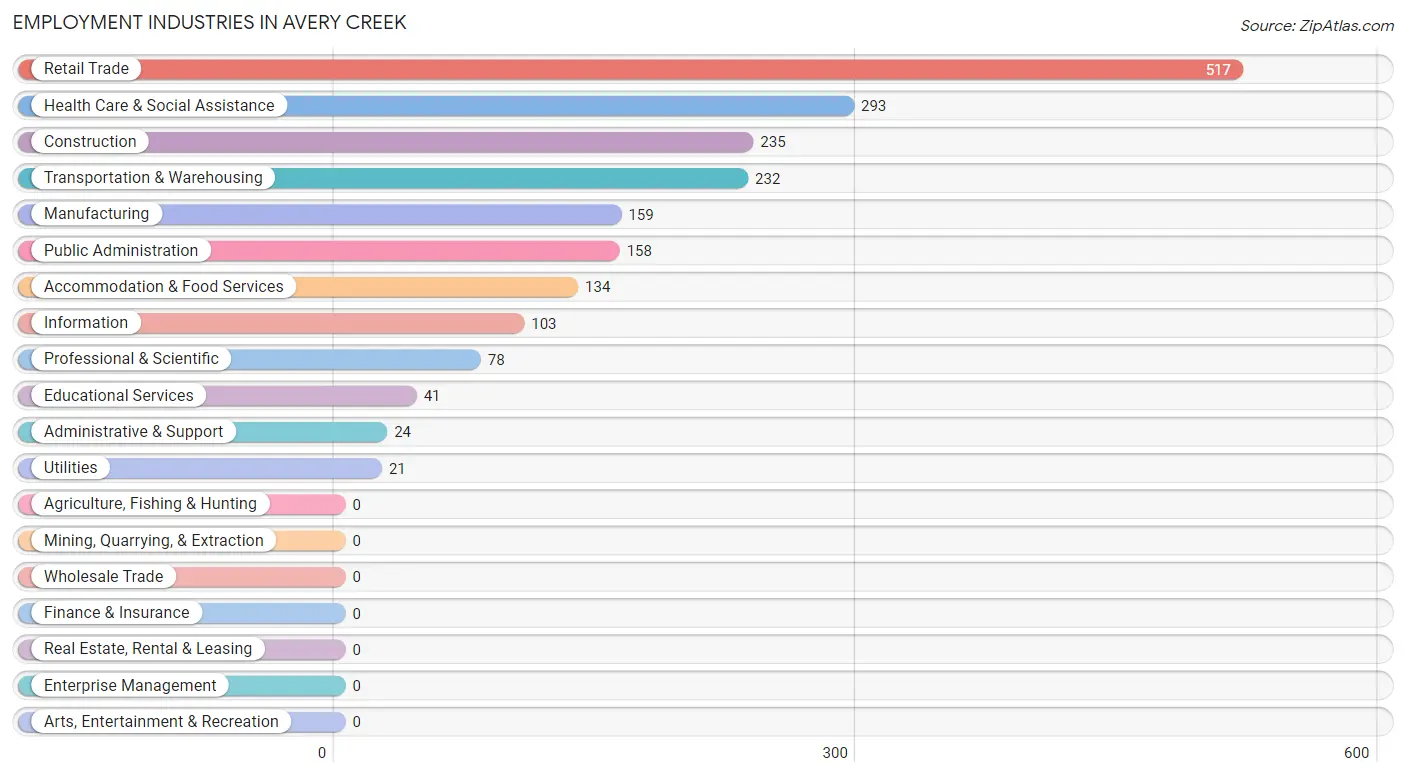
Employment Industries in Avery Creek
The major employment industries in Avery Creek include Retail Trade (517 | 25.8%), Health Care & Social Assistance (293 | 14.6%), Construction (235 | 11.7%), Transportation & Warehousing (232 | 11.6%), and Manufacturing (159 | 7.9%).
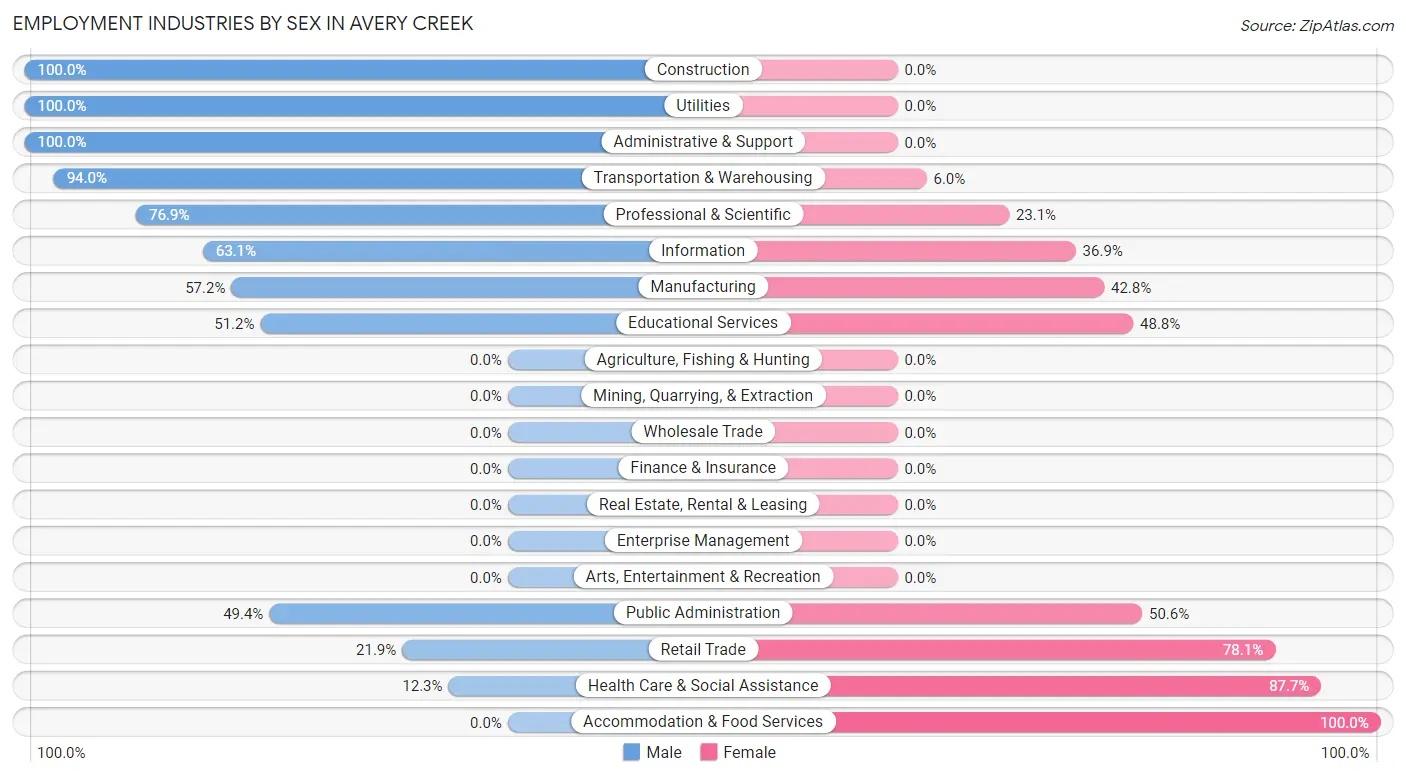
Employment Industries by Sex in Avery Creek
The Avery Creek industries that see more men than women are Construction (100.0%), Utilities (100.0%), and Administrative & Support (100.0%), whereas the industries that tend to have a higher number of women are Accommodation & Food Services (100.0%), Health Care & Social Assistance (87.7%), and Retail Trade (78.1%).
| Industry | Male | Female |
| Agriculture, Fishing & Hunting | 0 (0.0%) | 0 (0.0%) |
| Mining, Quarrying, & Extraction | 0 (0.0%) | 0 (0.0%) |
| Construction | 235 (100.0%) | 0 (0.0%) |
| Manufacturing | 91 (57.2%) | 68 (42.8%) |
| Wholesale Trade | 0 (0.0%) | 0 (0.0%) |
| Retail Trade | 113 (21.9%) | 404 (78.1%) |
| Transportation & Warehousing | 218 (94.0%) | 14 (6.0%) |
| Utilities | 21 (100.0%) | 0 (0.0%) |
| Information | 65 (63.1%) | 38 (36.9%) |
| Finance & Insurance | 0 (0.0%) | 0 (0.0%) |
| Real Estate, Rental & Leasing | 0 (0.0%) | 0 (0.0%) |
| Professional & Scientific | 60 (76.9%) | 18 (23.1%) |
| Enterprise Management | 0 (0.0%) | 0 (0.0%) |
| Administrative & Support | 24 (100.0%) | 0 (0.0%) |
| Educational Services | 21 (51.2%) | 20 (48.8%) |
| Health Care & Social Assistance | 36 (12.3%) | 257 (87.7%) |
| Arts, Entertainment & Recreation | 0 (0.0%) | 0 (0.0%) |
| Accommodation & Food Services | 0 (0.0%) | 134 (100.0%) |
| Public Administration | 78 (49.4%) | 80 (50.6%) |
| Total | 975 (48.6%) | 1,033 (51.4%) |
Education in Avery Creek
School Enrollment in Avery Creek
The most common levels of schooling among the 693 students in Avery Creek are high school (386 | 55.7%), middle school (126 | 18.2%), and elementary school (108 | 15.6%).
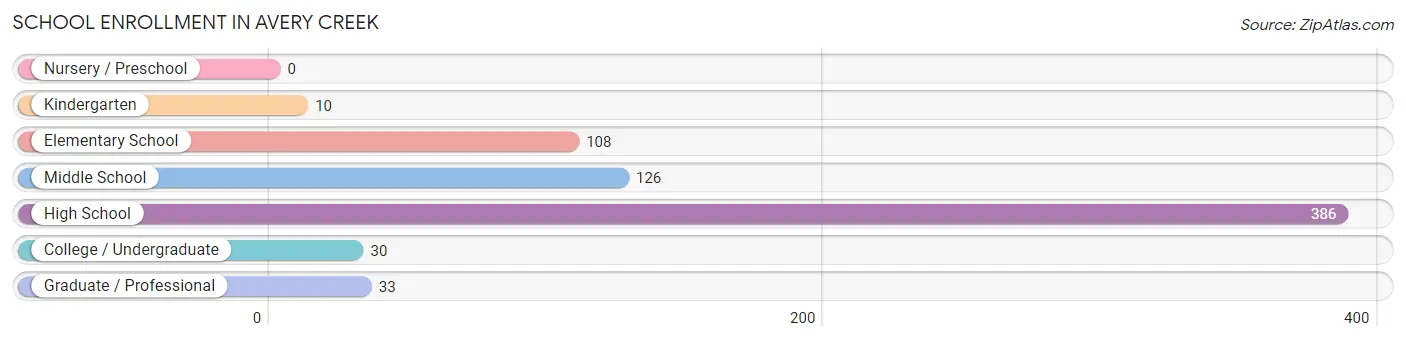
| School Level | # Students | % Students |
| Nursery / Preschool | 0 | 0.0% |
| Kindergarten | 10 | 1.4% |
| Elementary School | 108 | 15.6% |
| Middle School | 126 | 18.2% |
| High School | 386 | 55.7% |
| College / Undergraduate | 30 | 4.3% |
| Graduate / Professional | 33 | 4.8% |
| Total | 693 | 100.0% |
School Enrollment by Age by Funding Source in Avery Creek
Out of a total of 693 students who are enrolled in schools in Avery Creek, 74 (10.7%) attend a private institution, while the remaining 619 (89.3%) are enrolled in public schools. The age group of 5 to 9 year old has the highest likelihood of being enrolled in private schools, with 24 (20.3% in the age bracket) enrolled. Conversely, the age group of 10 to 14 year olds has the lowest likelihood of being enrolled in a private school, with 126 (100.0% in the age bracket) attending a public institution.
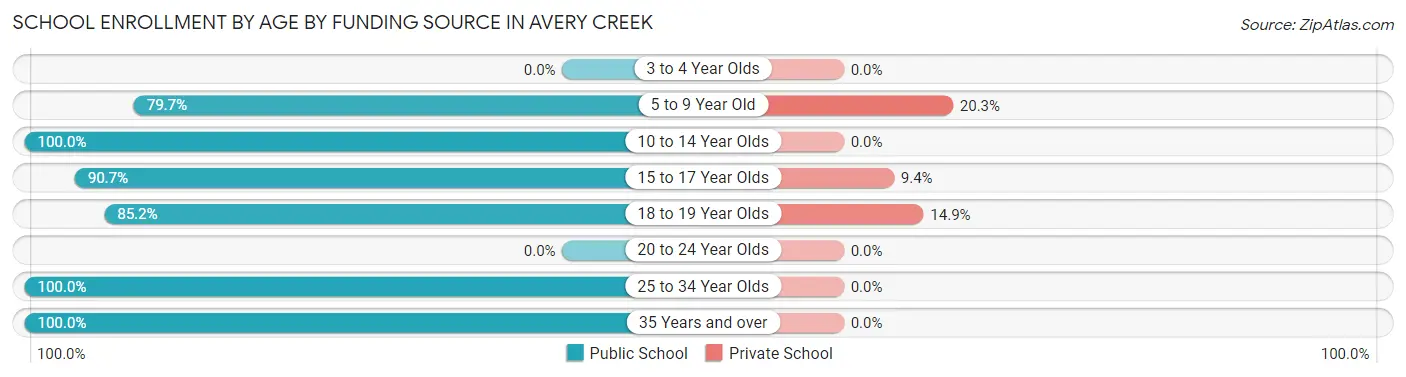
| Age Bracket | Public School | Private School |
| 3 to 4 Year Olds | 0 (0.0%) | 0 (0.0%) |
| 5 to 9 Year Old | 94 (79.7%) | 24 (20.3%) |
| 10 to 14 Year Olds | 126 (100.0%) | 0 (0.0%) |
| 15 to 17 Year Olds | 194 (90.6%) | 20 (9.3%) |
| 18 to 19 Year Olds | 172 (85.2%) | 30 (14.8%) |
| 20 to 24 Year Olds | 0 (0.0%) | 0 (0.0%) |
| 25 to 34 Year Olds | 20 (100.0%) | 0 (0.0%) |
| 35 Years and over | 13 (100.0%) | 0 (0.0%) |
| Total | 619 (89.3%) | 74 (10.7%) |
Educational Attainment by Field of Study in Avery Creek
Business (286 | 35.4%), education (136 | 16.8%), science & technology (73 | 9.0%), engineering (71 | 8.8%), and psychology (63 | 7.8%) are the most common fields of study among 808 individuals in Avery Creek who have obtained a bachelor's degree or higher.
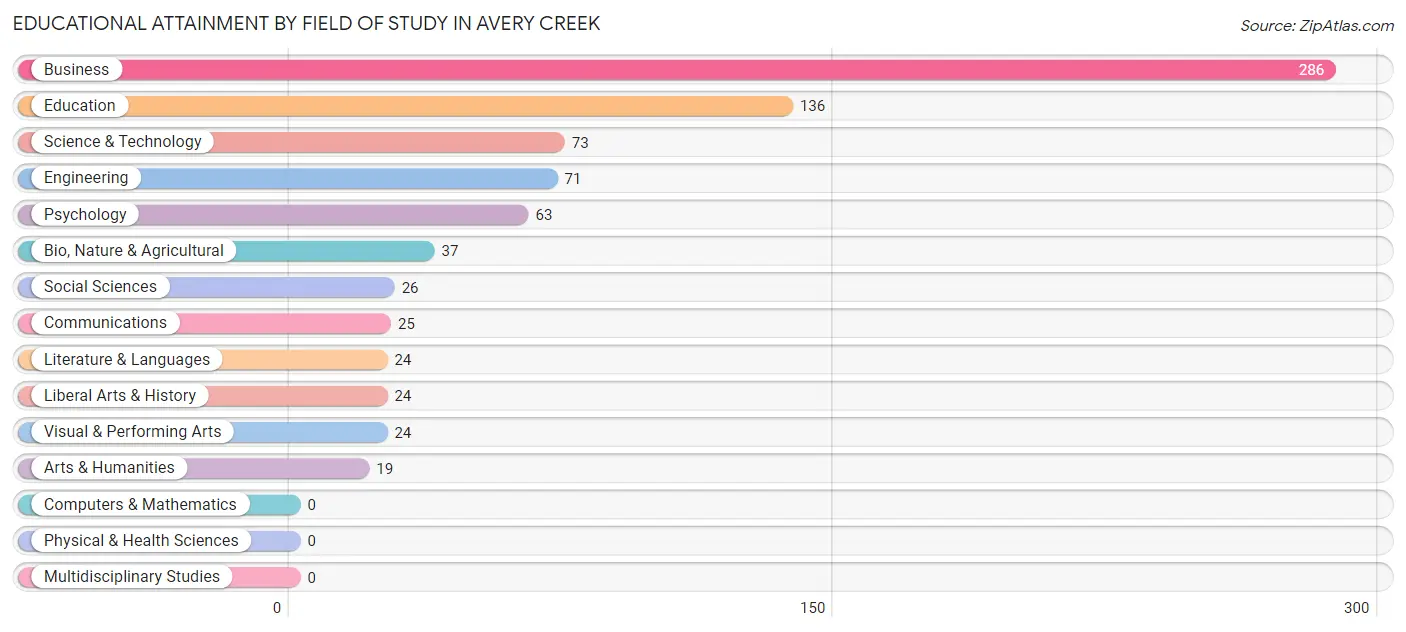
| Field of Study | # Graduates | % Graduates |
| Computers & Mathematics | 0 | 0.0% |
| Bio, Nature & Agricultural | 37 | 4.6% |
| Physical & Health Sciences | 0 | 0.0% |
| Psychology | 63 | 7.8% |
| Social Sciences | 26 | 3.2% |
| Engineering | 71 | 8.8% |
| Multidisciplinary Studies | 0 | 0.0% |
| Science & Technology | 73 | 9.0% |
| Business | 286 | 35.4% |
| Education | 136 | 16.8% |
| Literature & Languages | 24 | 3.0% |
| Liberal Arts & History | 24 | 3.0% |
| Visual & Performing Arts | 24 | 3.0% |
| Communications | 25 | 3.1% |
| Arts & Humanities | 19 | 2.4% |
| Total | 808 | 100.0% |
Transportation & Commute in Avery Creek
Vehicle Availability by Sex in Avery Creek
The most prevalent vehicle ownership categories in Avery Creek are males with 3 vehicles (364, accounting for 37.3%) and females with 3 vehicles (164, making up 35.2%).
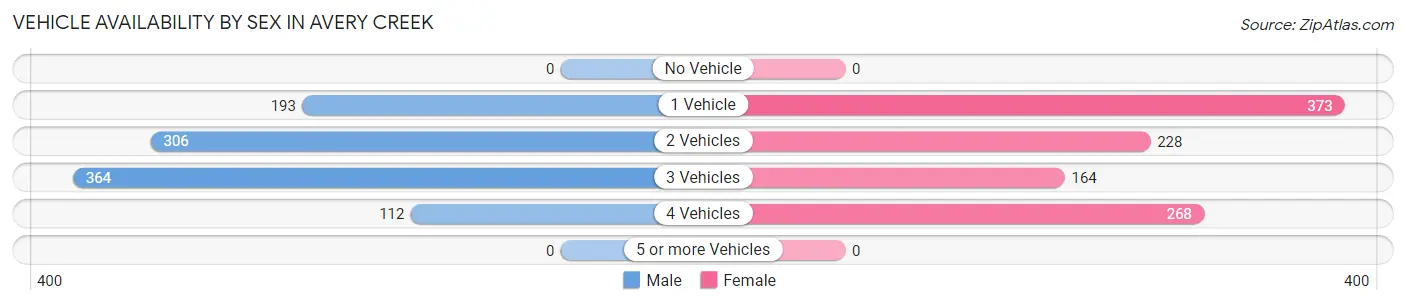
| Vehicles Available | Male | Female |
| No Vehicle | 0 (0.0%) | 0 (0.0%) |
| 1 Vehicle | 193 (19.8%) | 373 (36.1%) |
| 2 Vehicles | 306 (31.4%) | 228 (22.1%) |
| 3 Vehicles | 364 (37.3%) | 164 (15.9%) |
| 4 Vehicles | 112 (11.5%) | 268 (25.9%) |
| 5 or more Vehicles | 0 (0.0%) | 0 (0.0%) |
| Total | 975 (100.0%) | 1,033 (100.0%) |
Commute Time in Avery Creek
The most frequently occuring commute durations in Avery Creek are 20 to 24 minutes (875 commuters, 55.0%), 10 to 14 minutes (191 commuters, 12.0%), and 15 to 19 minutes (134 commuters, 8.4%).
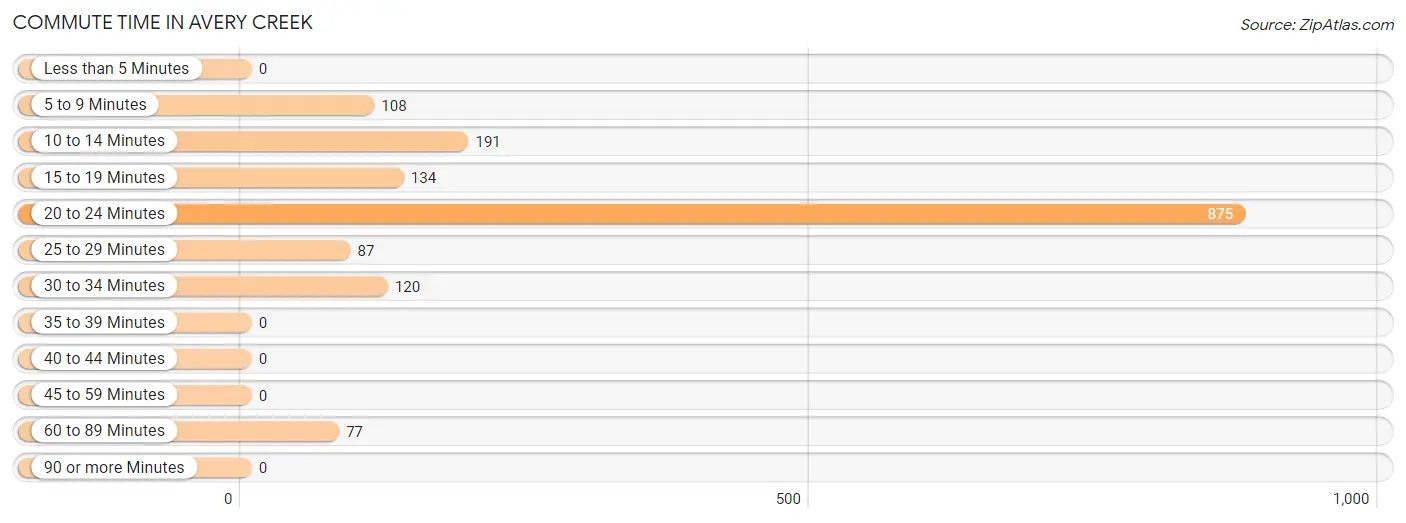
| Commute Time | # Commuters | % Commuters |
| Less than 5 Minutes | 0 | 0.0% |
| 5 to 9 Minutes | 108 | 6.8% |
| 10 to 14 Minutes | 191 | 12.0% |
| 15 to 19 Minutes | 134 | 8.4% |
| 20 to 24 Minutes | 875 | 55.0% |
| 25 to 29 Minutes | 87 | 5.5% |
| 30 to 34 Minutes | 120 | 7.5% |
| 35 to 39 Minutes | 0 | 0.0% |
| 40 to 44 Minutes | 0 | 0.0% |
| 45 to 59 Minutes | 0 | 0.0% |
| 60 to 89 Minutes | 77 | 4.8% |
| 90 or more Minutes | 0 | 0.0% |
Commute Time by Sex in Avery Creek
The most common commute times in Avery Creek are 20 to 24 minutes (269 commuters, 43.0%) for males and 20 to 24 minutes (606 commuters, 62.7%) for females.
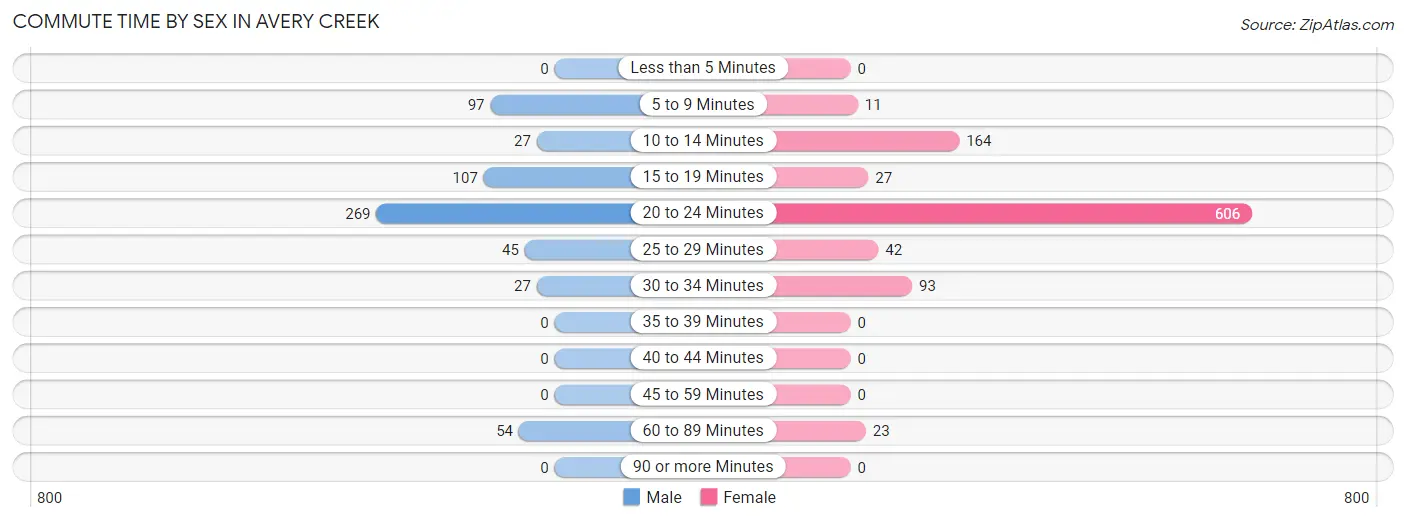
| Commute Time | Male | Female |
| Less than 5 Minutes | 0 (0.0%) | 0 (0.0%) |
| 5 to 9 Minutes | 97 (15.5%) | 11 (1.1%) |
| 10 to 14 Minutes | 27 (4.3%) | 164 (17.0%) |
| 15 to 19 Minutes | 107 (17.1%) | 27 (2.8%) |
| 20 to 24 Minutes | 269 (43.0%) | 606 (62.7%) |
| 25 to 29 Minutes | 45 (7.2%) | 42 (4.3%) |
| 30 to 34 Minutes | 27 (4.3%) | 93 (9.6%) |
| 35 to 39 Minutes | 0 (0.0%) | 0 (0.0%) |
| 40 to 44 Minutes | 0 (0.0%) | 0 (0.0%) |
| 45 to 59 Minutes | 0 (0.0%) | 0 (0.0%) |
| 60 to 89 Minutes | 54 (8.6%) | 23 (2.4%) |
| 90 or more Minutes | 0 (0.0%) | 0 (0.0%) |
Time of Departure to Work by Sex in Avery Creek
The most frequent times of departure to work in Avery Creek are 7:30 AM to 7:59 AM (236, 37.7%) for males and 4:00 PM to 11:59 PM (204, 21.1%) for females.
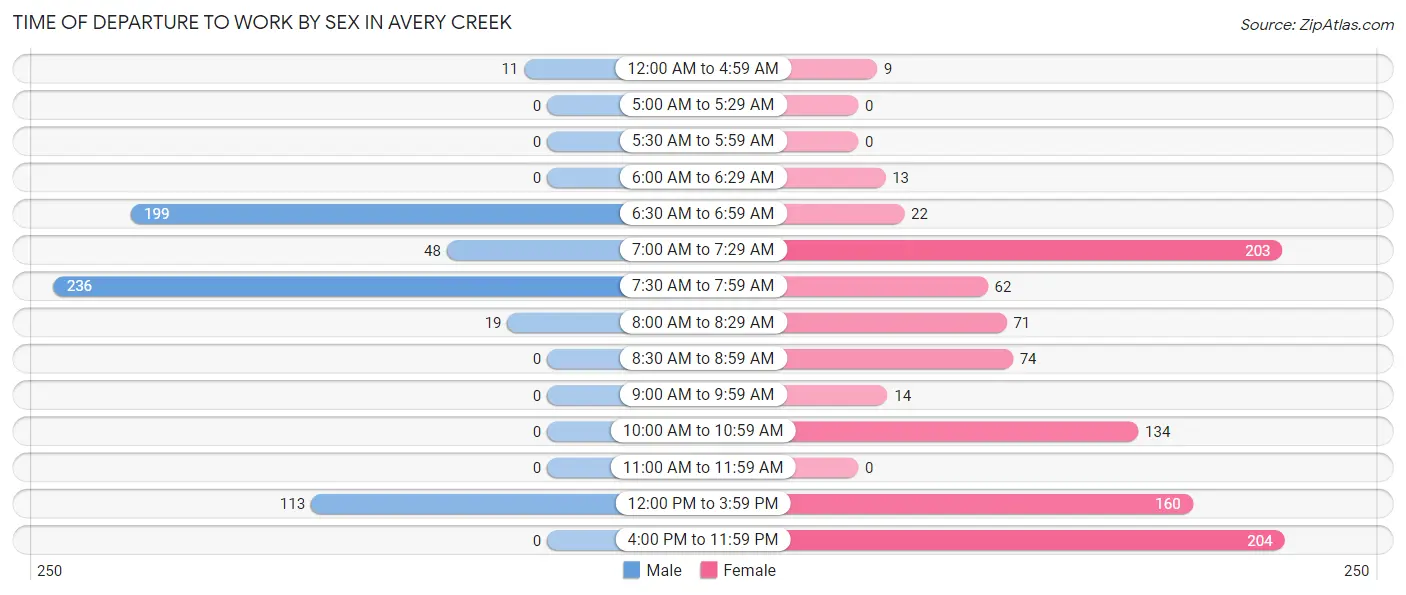
| Time of Departure | Male | Female |
| 12:00 AM to 4:59 AM | 11 (1.8%) | 9 (0.9%) |
| 5:00 AM to 5:29 AM | 0 (0.0%) | 0 (0.0%) |
| 5:30 AM to 5:59 AM | 0 (0.0%) | 0 (0.0%) |
| 6:00 AM to 6:29 AM | 0 (0.0%) | 13 (1.3%) |
| 6:30 AM to 6:59 AM | 199 (31.8%) | 22 (2.3%) |
| 7:00 AM to 7:29 AM | 48 (7.7%) | 203 (21.0%) |
| 7:30 AM to 7:59 AM | 236 (37.7%) | 62 (6.4%) |
| 8:00 AM to 8:29 AM | 19 (3.0%) | 71 (7.3%) |
| 8:30 AM to 8:59 AM | 0 (0.0%) | 74 (7.7%) |
| 9:00 AM to 9:59 AM | 0 (0.0%) | 14 (1.5%) |
| 10:00 AM to 10:59 AM | 0 (0.0%) | 134 (13.9%) |
| 11:00 AM to 11:59 AM | 0 (0.0%) | 0 (0.0%) |
| 12:00 PM to 3:59 PM | 113 (18.0%) | 160 (16.6%) |
| 4:00 PM to 11:59 PM | 0 (0.0%) | 204 (21.1%) |
| Total | 626 (100.0%) | 966 (100.0%) |
Housing Occupancy in Avery Creek
Occupancy by Ownership in Avery Creek
Of the total 860 dwellings in Avery Creek, owner-occupied units account for 743 (86.4%), while renter-occupied units make up 117 (13.6%).
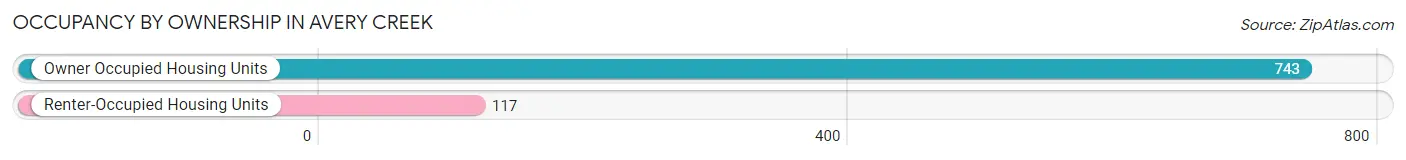
| Occupancy | # Housing Units | % Housing Units |
| Owner Occupied Housing Units | 743 | 86.4% |
| Renter-Occupied Housing Units | 117 | 13.6% |
| Total Occupied Housing Units | 860 | 100.0% |
Occupancy by Household Size in Avery Creek
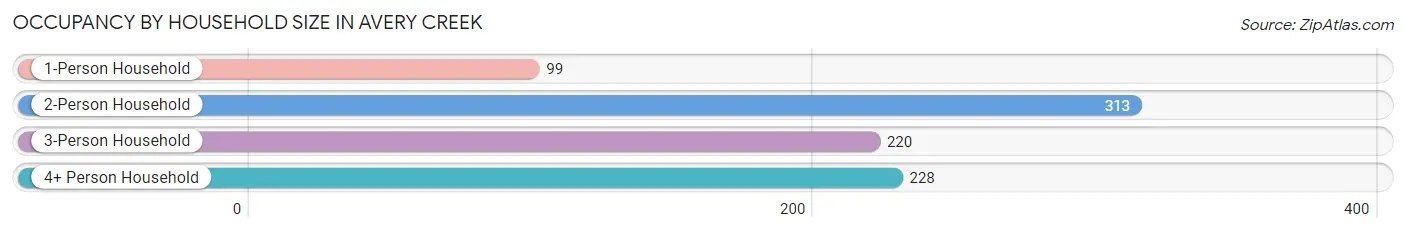
| Household Size | # Housing Units | % Housing Units |
| 1-Person Household | 99 | 11.5% |
| 2-Person Household | 313 | 36.4% |
| 3-Person Household | 220 | 25.6% |
| 4+ Person Household | 228 | 26.5% |
| Total Housing Units | 860 | 100.0% |
Occupancy by Ownership by Household Size in Avery Creek
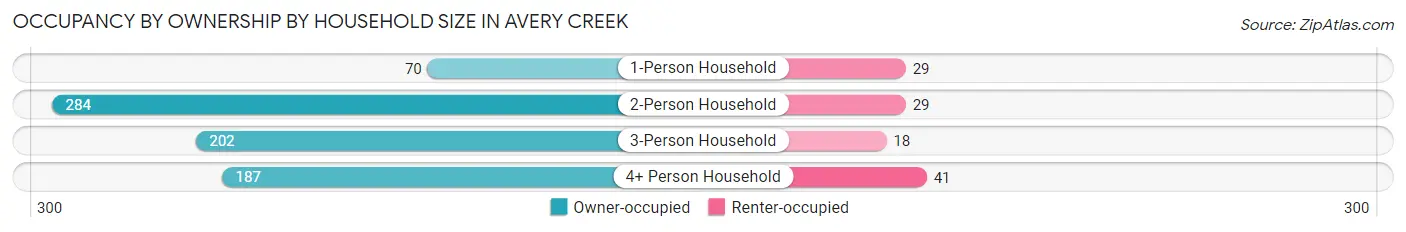
| Household Size | Owner-occupied | Renter-occupied |
| 1-Person Household | 70 (70.7%) | 29 (29.3%) |
| 2-Person Household | 284 (90.7%) | 29 (9.3%) |
| 3-Person Household | 202 (91.8%) | 18 (8.2%) |
| 4+ Person Household | 187 (82.0%) | 41 (18.0%) |
| Total Housing Units | 743 (86.4%) | 117 (13.6%) |
Occupancy by Educational Attainment in Avery Creek
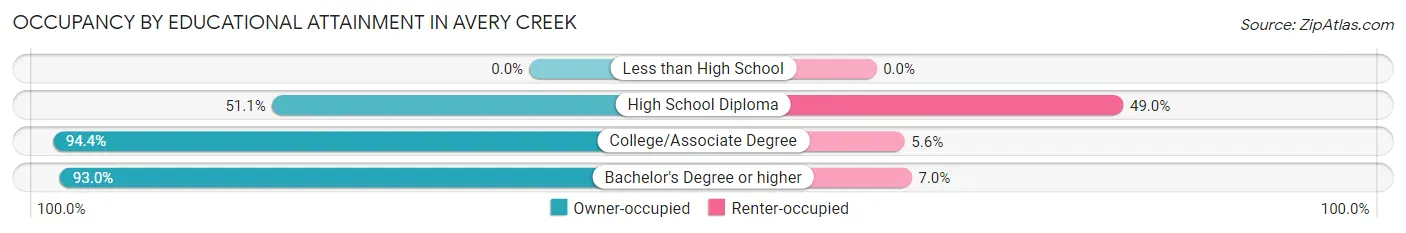
| Household Size | Owner-occupied | Renter-occupied |
| Less than High School | 0 (0.0%) | 0 (0.0%) |
| High School Diploma | 73 (51.0%) | 70 (48.9%) |
| College/Associate Degree | 219 (94.4%) | 13 (5.6%) |
| Bachelor's Degree or higher | 451 (93.0%) | 34 (7.0%) |
Occupancy by Age of Householder in Avery Creek
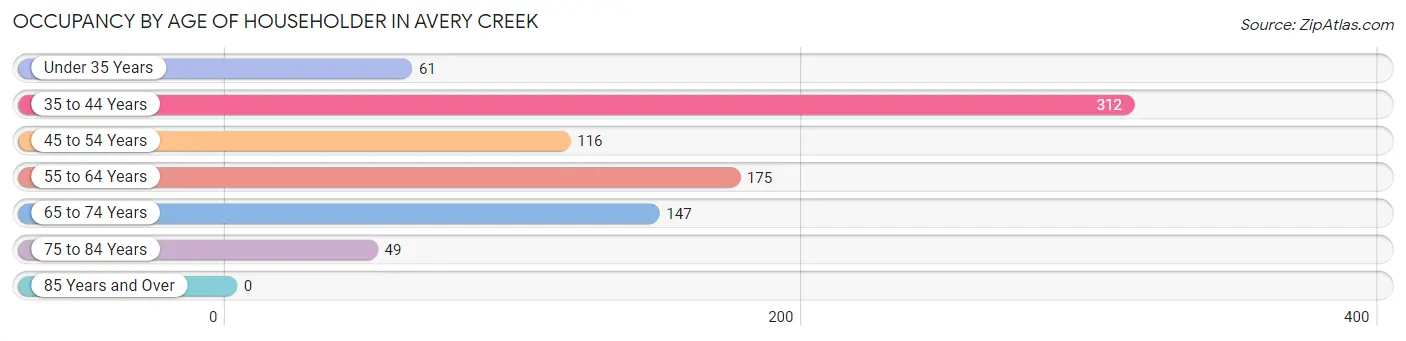
| Age Bracket | # Households | % Households |
| Under 35 Years | 61 | 7.1% |
| 35 to 44 Years | 312 | 36.3% |
| 45 to 54 Years | 116 | 13.5% |
| 55 to 64 Years | 175 | 20.3% |
| 65 to 74 Years | 147 | 17.1% |
| 75 to 84 Years | 49 | 5.7% |
| 85 Years and Over | 0 | 0.0% |
| Total | 860 | 100.0% |
Housing Finances in Avery Creek
Median Income by Occupancy in Avery Creek
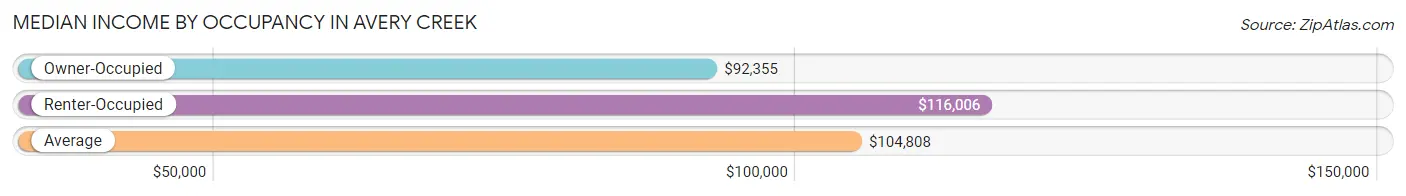
| Occupancy Type | # Households | Median Income |
| Owner-Occupied | 743 (86.4%) | $92,355 |
| Renter-Occupied | 117 (13.6%) | $116,006 |
| Average | 860 (100.0%) | $104,808 |
Occupancy by Householder Income Bracket in Avery Creek
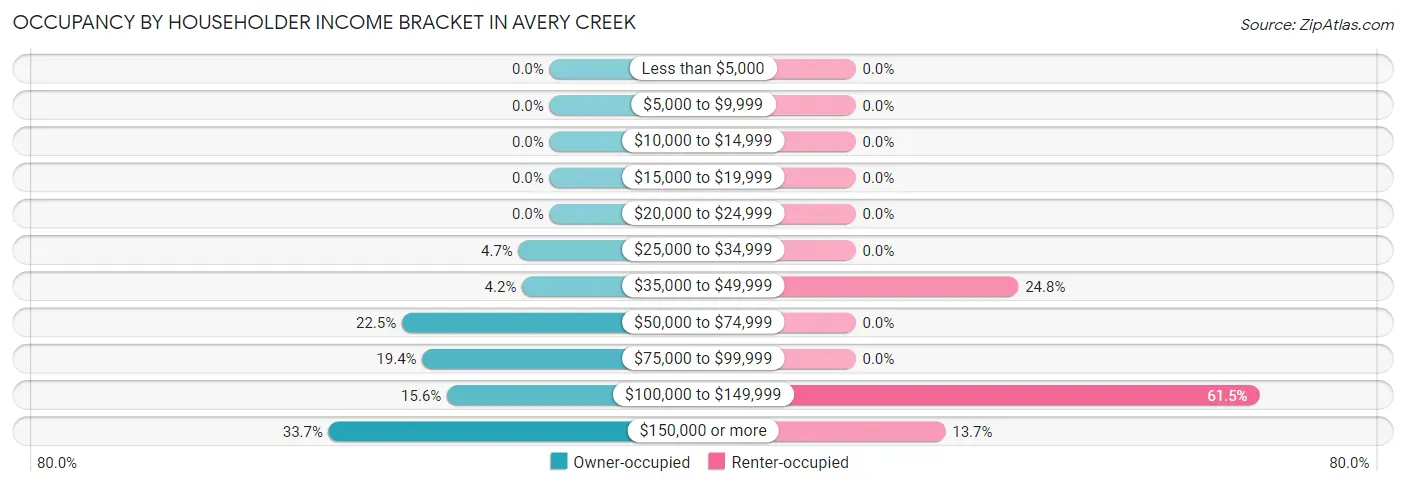
| Income Bracket | Owner-occupied | Renter-occupied |
| Less than $5,000 | 0 (0.0%) | 0 (0.0%) |
| $5,000 to $9,999 | 0 (0.0%) | 0 (0.0%) |
| $10,000 to $14,999 | 0 (0.0%) | 0 (0.0%) |
| $15,000 to $19,999 | 0 (0.0%) | 0 (0.0%) |
| $20,000 to $24,999 | 0 (0.0%) | 0 (0.0%) |
| $25,000 to $34,999 | 35 (4.7%) | 0 (0.0%) |
| $35,000 to $49,999 | 31 (4.2%) | 29 (24.8%) |
| $50,000 to $74,999 | 167 (22.5%) | 0 (0.0%) |
| $75,000 to $99,999 | 144 (19.4%) | 0 (0.0%) |
| $100,000 to $149,999 | 116 (15.6%) | 72 (61.5%) |
| $150,000 or more | 250 (33.7%) | 16 (13.7%) |
| Total | 743 (100.0%) | 117 (100.0%) |
Monthly Housing Cost Tiers in Avery Creek
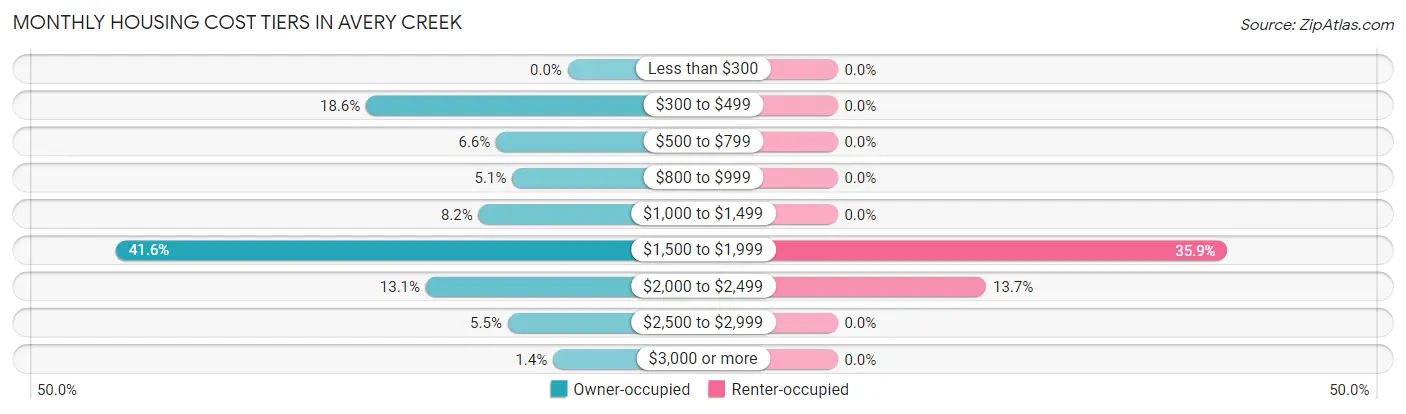
| Monthly Cost | Owner-occupied | Renter-occupied |
| Less than $300 | 0 (0.0%) | 0 (0.0%) |
| $300 to $499 | 138 (18.6%) | 0 (0.0%) |
| $500 to $799 | 49 (6.6%) | 0 (0.0%) |
| $800 to $999 | 38 (5.1%) | 0 (0.0%) |
| $1,000 to $1,499 | 61 (8.2%) | 0 (0.0%) |
| $1,500 to $1,999 | 309 (41.6%) | 42 (35.9%) |
| $2,000 to $2,499 | 97 (13.1%) | 16 (13.7%) |
| $2,500 to $2,999 | 41 (5.5%) | 0 (0.0%) |
| $3,000 or more | 10 (1.3%) | 0 (0.0%) |
| Total | 743 (100.0%) | 117 (100.0%) |
Physical Housing Characteristics in Avery Creek
Housing Structures in Avery Creek
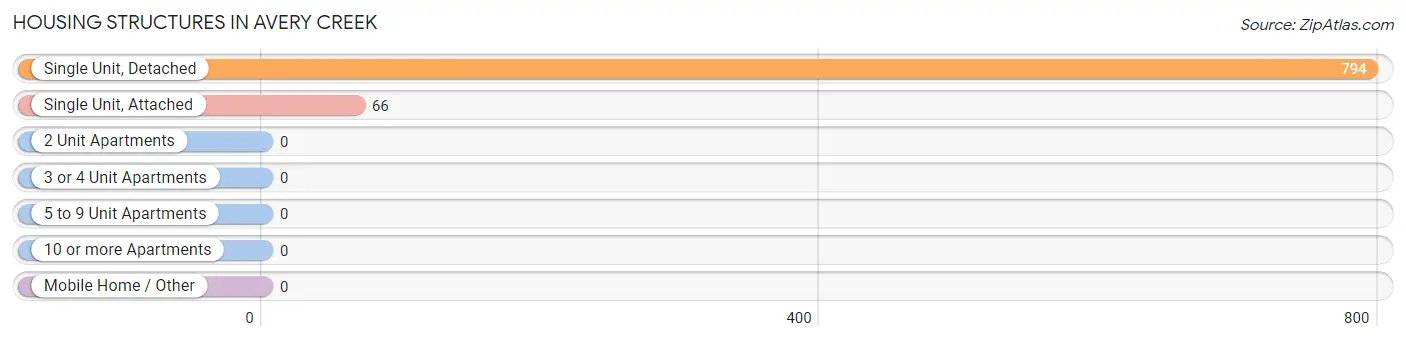
| Structure Type | # Housing Units | % Housing Units |
| Single Unit, Detached | 794 | 92.3% |
| Single Unit, Attached | 66 | 7.7% |
| 2 Unit Apartments | 0 | 0.0% |
| 3 or 4 Unit Apartments | 0 | 0.0% |
| 5 to 9 Unit Apartments | 0 | 0.0% |
| 10 or more Apartments | 0 | 0.0% |
| Mobile Home / Other | 0 | 0.0% |
| Total | 860 | 100.0% |
Housing Structures by Occupancy in Avery Creek
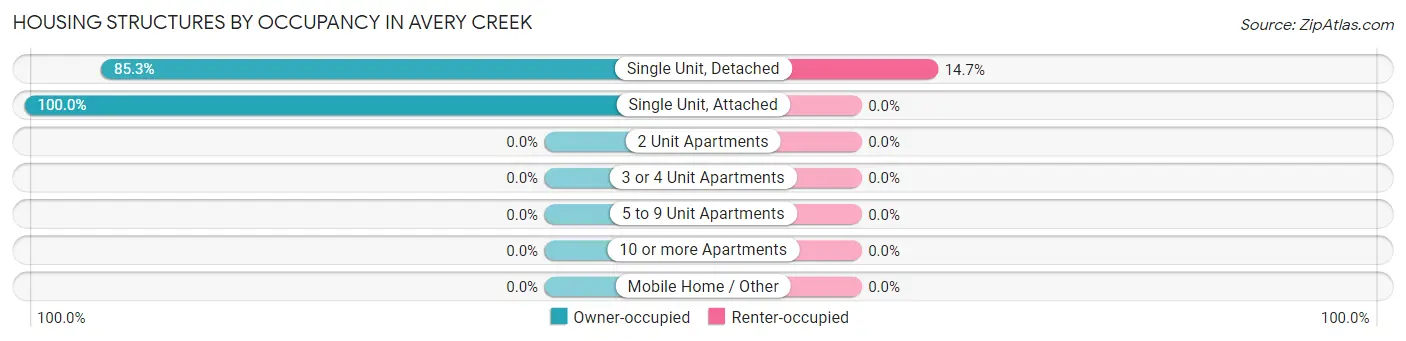
| Structure Type | Owner-occupied | Renter-occupied |
| Single Unit, Detached | 677 (85.3%) | 117 (14.7%) |
| Single Unit, Attached | 66 (100.0%) | 0 (0.0%) |
| 2 Unit Apartments | 0 (0.0%) | 0 (0.0%) |
| 3 or 4 Unit Apartments | 0 (0.0%) | 0 (0.0%) |
| 5 to 9 Unit Apartments | 0 (0.0%) | 0 (0.0%) |
| 10 or more Apartments | 0 (0.0%) | 0 (0.0%) |
| Mobile Home / Other | 0 (0.0%) | 0 (0.0%) |
| Total | 743 (86.4%) | 117 (13.6%) |
Housing Structures by Number of Rooms in Avery Creek
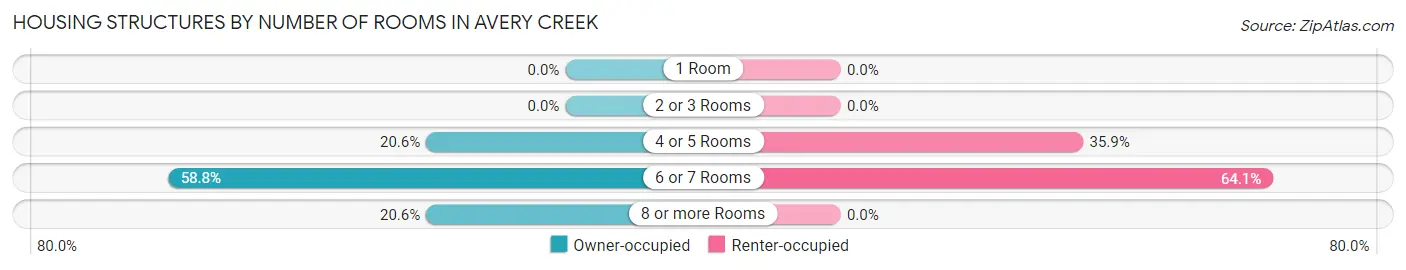
| Number of Rooms | Owner-occupied | Renter-occupied |
| 1 Room | 0 (0.0%) | 0 (0.0%) |
| 2 or 3 Rooms | 0 (0.0%) | 0 (0.0%) |
| 4 or 5 Rooms | 153 (20.6%) | 42 (35.9%) |
| 6 or 7 Rooms | 437 (58.8%) | 75 (64.1%) |
| 8 or more Rooms | 153 (20.6%) | 0 (0.0%) |
| Total | 743 (100.0%) | 117 (100.0%) |
Housing Structure by Heating Type in Avery Creek
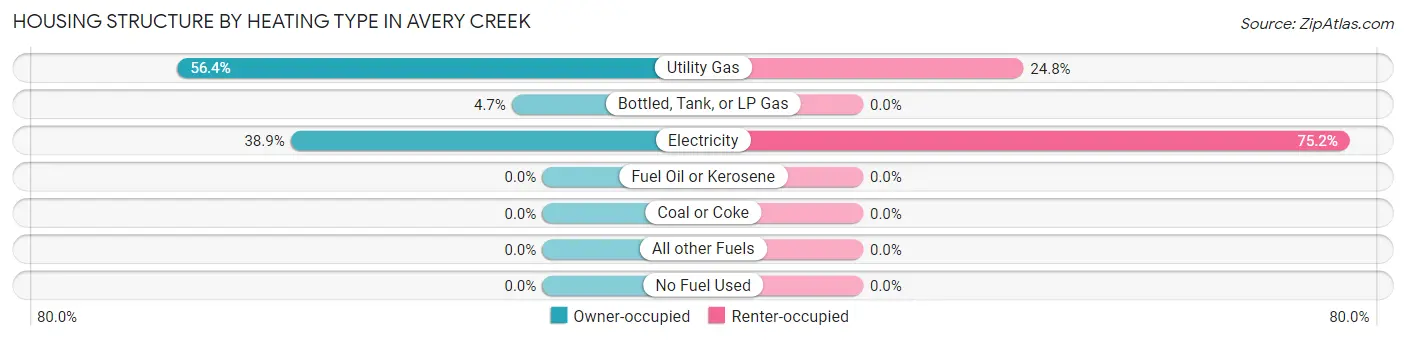
| Heating Type | Owner-occupied | Renter-occupied |
| Utility Gas | 419 (56.4%) | 29 (24.8%) |
| Bottled, Tank, or LP Gas | 35 (4.7%) | 0 (0.0%) |
| Electricity | 289 (38.9%) | 88 (75.2%) |
| Fuel Oil or Kerosene | 0 (0.0%) | 0 (0.0%) |
| Coal or Coke | 0 (0.0%) | 0 (0.0%) |
| All other Fuels | 0 (0.0%) | 0 (0.0%) |
| No Fuel Used | 0 (0.0%) | 0 (0.0%) |
| Total | 743 (100.0%) | 117 (100.0%) |
Household Vehicle Usage in Avery Creek
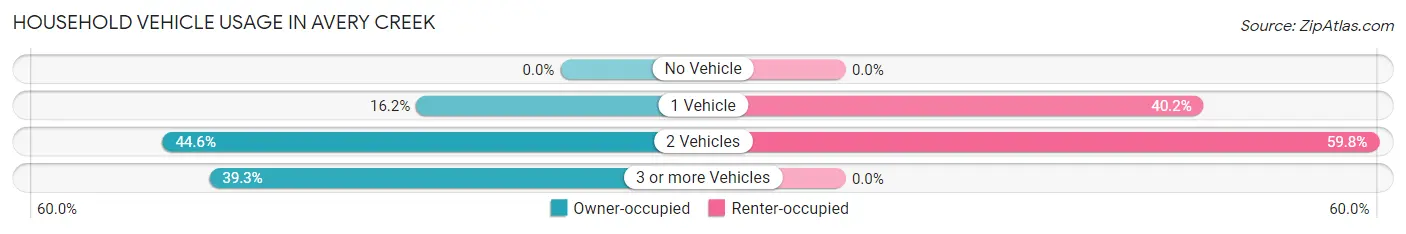
| Vehicles per Household | Owner-occupied | Renter-occupied |
| No Vehicle | 0 (0.0%) | 0 (0.0%) |
| 1 Vehicle | 120 (16.2%) | 47 (40.2%) |
| 2 Vehicles | 331 (44.6%) | 70 (59.8%) |
| 3 or more Vehicles | 292 (39.3%) | 0 (0.0%) |
| Total | 743 (100.0%) | 117 (100.0%) |
Real Estate & Mortgages in Avery Creek
Real Estate and Mortgage Overview in Avery Creek
| Characteristic | Without Mortgage | With Mortgage |
| Housing Units | 164 | 579 |
| Median Property Value | $286,000 | $318,400 |
| Median Household Income | $60,000 | $229 |
| Monthly Housing Costs | $450 | $10 |
| Real Estate Taxes | $1,602 | $0 |
Property Value by Mortgage Status in Avery Creek
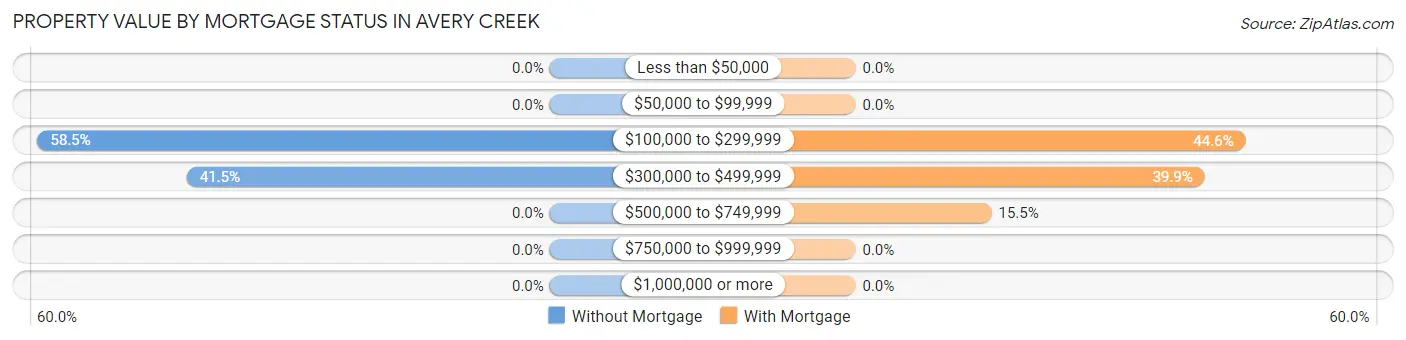
| Property Value | Without Mortgage | With Mortgage |
| Less than $50,000 | 0 (0.0%) | 0 (0.0%) |
| $50,000 to $99,999 | 0 (0.0%) | 0 (0.0%) |
| $100,000 to $299,999 | 96 (58.5%) | 258 (44.6%) |
| $300,000 to $499,999 | 68 (41.5%) | 231 (39.9%) |
| $500,000 to $749,999 | 0 (0.0%) | 90 (15.5%) |
| $750,000 to $999,999 | 0 (0.0%) | 0 (0.0%) |
| $1,000,000 or more | 0 (0.0%) | 0 (0.0%) |
| Total | 164 (100.0%) | 579 (100.0%) |
Household Income by Mortgage Status in Avery Creek
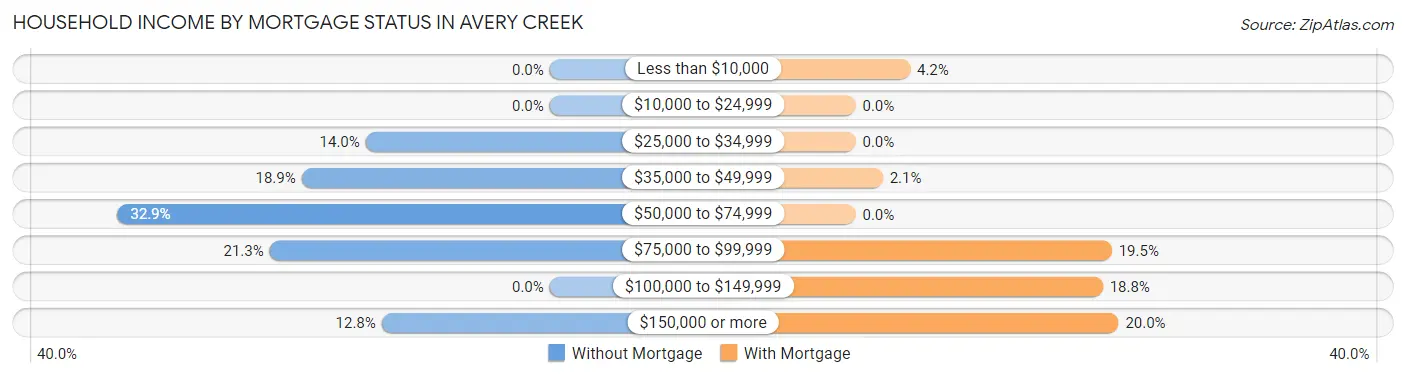
| Household Income | Without Mortgage | With Mortgage |
| Less than $10,000 | 0 (0.0%) | 24 (4.2%) |
| $10,000 to $24,999 | 0 (0.0%) | 0 (0.0%) |
| $25,000 to $34,999 | 23 (14.0%) | 0 (0.0%) |
| $35,000 to $49,999 | 31 (18.9%) | 12 (2.1%) |
| $50,000 to $74,999 | 54 (32.9%) | 0 (0.0%) |
| $75,000 to $99,999 | 35 (21.3%) | 113 (19.5%) |
| $100,000 to $149,999 | 0 (0.0%) | 109 (18.8%) |
| $150,000 or more | 21 (12.8%) | 116 (20.0%) |
| Total | 164 (100.0%) | 579 (100.0%) |
Property Value to Household Income Ratio in Avery Creek
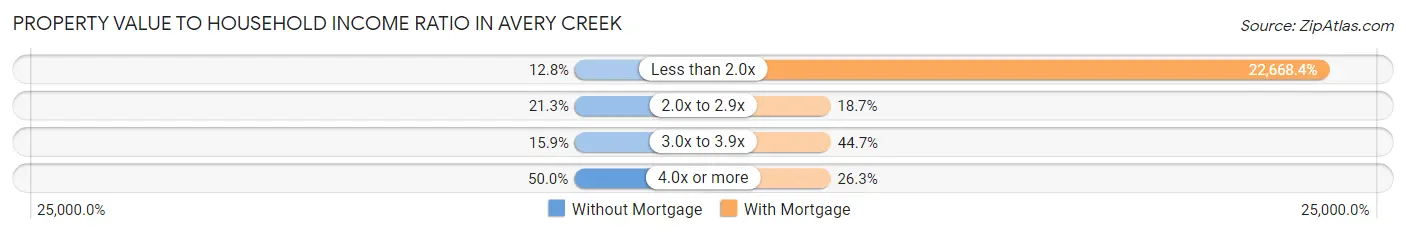
| Value-to-Income Ratio | Without Mortgage | With Mortgage |
| Less than 2.0x | 21 (12.8%) | 131,250 (22,668.4%) |
| 2.0x to 2.9x | 35 (21.3%) | 108 (18.6%) |
| 3.0x to 3.9x | 26 (15.9%) | 259 (44.7%) |
| 4.0x or more | 82 (50.0%) | 152 (26.3%) |
| Total | 164 (100.0%) | 579 (100.0%) |
Real Estate Taxes by Mortgage Status in Avery Creek
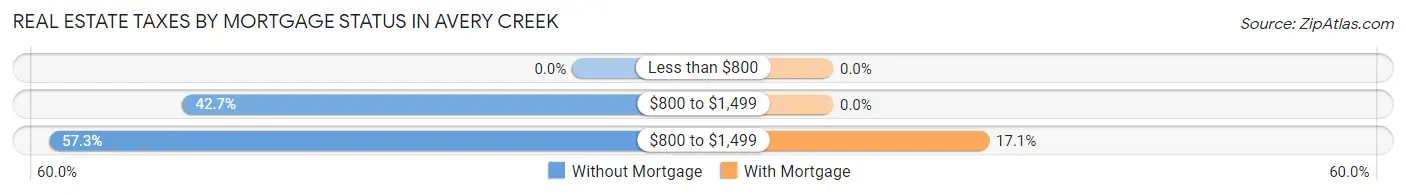
| Property Taxes | Without Mortgage | With Mortgage |
| Less than $800 | 0 (0.0%) | 0 (0.0%) |
| $800 to $1,499 | 70 (42.7%) | 0 (0.0%) |
| $800 to $1,499 | 94 (57.3%) | 99 (17.1%) |
| Total | 164 (100.0%) | 579 (100.0%) |
Health & Disability in Avery Creek
Health Insurance Coverage by Age in Avery Creek
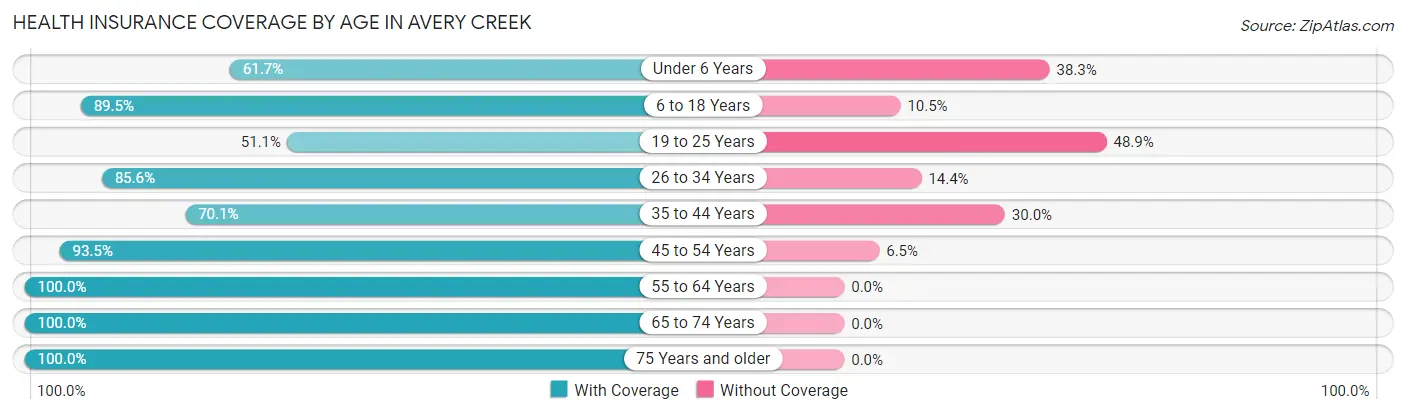
| Age Bracket | With Coverage | Without Coverage |
| Under 6 Years | 129 (61.7%) | 80 (38.3%) |
| 6 to 18 Years | 641 (89.5%) | 75 (10.5%) |
| 19 to 25 Years | 164 (51.1%) | 157 (48.9%) |
| 26 to 34 Years | 226 (85.6%) | 38 (14.4%) |
| 35 to 44 Years | 400 (70.1%) | 171 (29.9%) |
| 45 to 54 Years | 415 (93.5%) | 29 (6.5%) |
| 55 to 64 Years | 382 (100.0%) | 0 (0.0%) |
| 65 to 74 Years | 288 (100.0%) | 0 (0.0%) |
| 75 Years and older | 143 (100.0%) | 0 (0.0%) |
| Total | 2,788 (83.5%) | 550 (16.5%) |
Health Insurance Coverage by Citizenship Status in Avery Creek
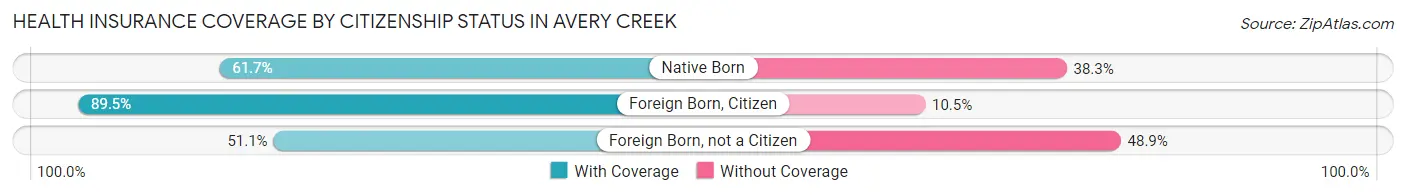
| Citizenship Status | With Coverage | Without Coverage |
| Native Born | 129 (61.7%) | 80 (38.3%) |
| Foreign Born, Citizen | 641 (89.5%) | 75 (10.5%) |
| Foreign Born, not a Citizen | 164 (51.1%) | 157 (48.9%) |
Health Insurance Coverage by Household Income in Avery Creek
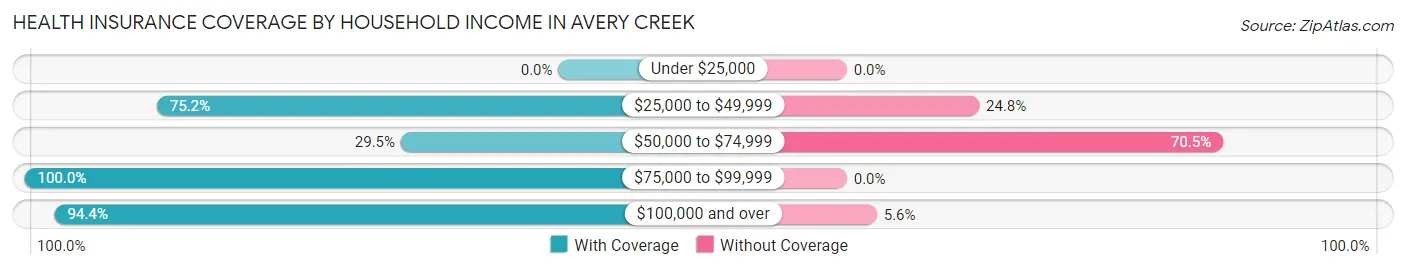
| Household Income | With Coverage | Without Coverage |
| Under $25,000 | 0 (0.0%) | 0 (0.0%) |
| $25,000 to $49,999 | 88 (75.2%) | 29 (24.8%) |
| $50,000 to $74,999 | 175 (29.5%) | 418 (70.5%) |
| $75,000 to $99,999 | 796 (100.0%) | 0 (0.0%) |
| $100,000 and over | 1,729 (94.4%) | 103 (5.6%) |
Public vs Private Health Insurance Coverage by Age in Avery Creek
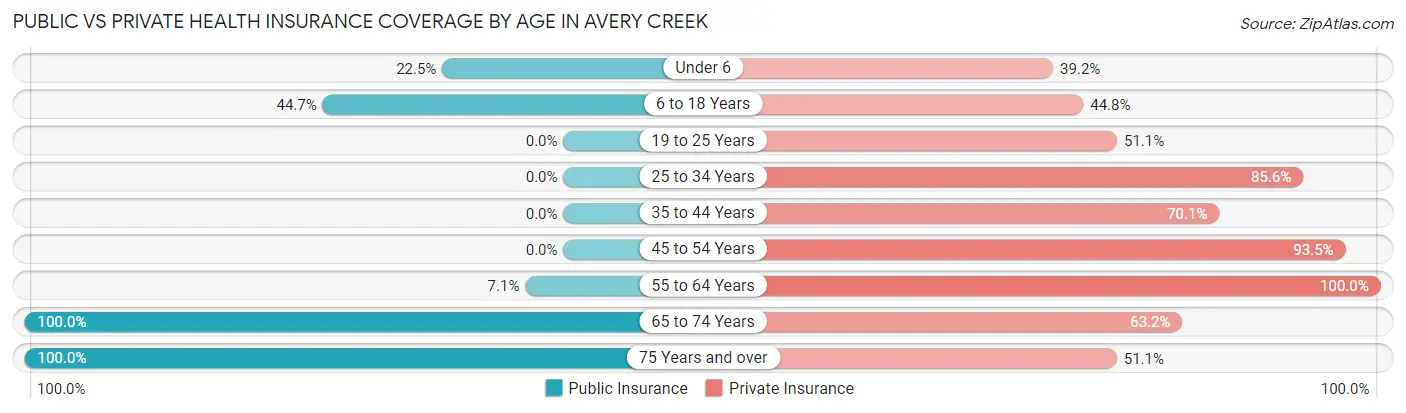
| Age Bracket | Public Insurance | Private Insurance |
| Under 6 | 47 (22.5%) | 82 (39.2%) |
| 6 to 18 Years | 320 (44.7%) | 321 (44.8%) |
| 19 to 25 Years | 0 (0.0%) | 164 (51.1%) |
| 25 to 34 Years | 0 (0.0%) | 226 (85.6%) |
| 35 to 44 Years | 0 (0.0%) | 400 (70.1%) |
| 45 to 54 Years | 0 (0.0%) | 415 (93.5%) |
| 55 to 64 Years | 27 (7.1%) | 382 (100.0%) |
| 65 to 74 Years | 288 (100.0%) | 182 (63.2%) |
| 75 Years and over | 143 (100.0%) | 73 (51.0%) |
| Total | 825 (24.7%) | 2,245 (67.3%) |
Disability Status by Sex by Age in Avery Creek
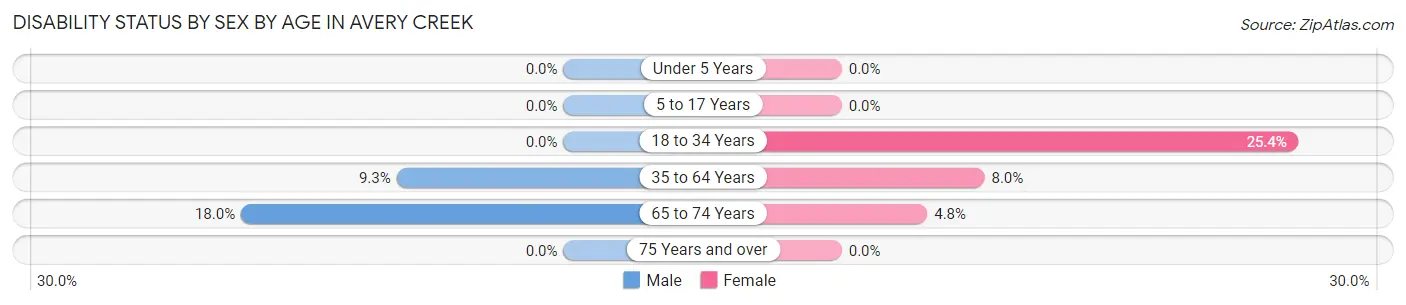
| Age Bracket | Male | Female |
| Under 5 Years | 0 (0.0%) | 0 (0.0%) |
| 5 to 17 Years | 0 (0.0%) | 0 (0.0%) |
| 18 to 34 Years | 0 (0.0%) | 146 (25.4%) |
| 35 to 64 Years | 69 (9.3%) | 52 (8.0%) |
| 65 to 74 Years | 14 (17.9%) | 10 (4.8%) |
| 75 Years and over | 0 (0.0%) | 0 (0.0%) |
Disability Class by Sex by Age in Avery Creek
Disability Class: Hearing Difficulty
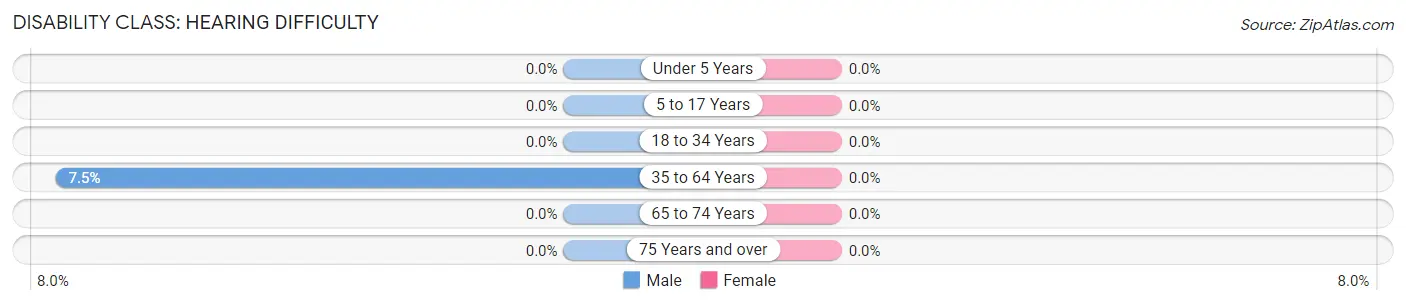
| Age Bracket | Male | Female |
| Under 5 Years | 0 (0.0%) | 0 (0.0%) |
| 5 to 17 Years | 0 (0.0%) | 0 (0.0%) |
| 18 to 34 Years | 0 (0.0%) | 0 (0.0%) |
| 35 to 64 Years | 56 (7.5%) | 0 (0.0%) |
| 65 to 74 Years | 0 (0.0%) | 0 (0.0%) |
| 75 Years and over | 0 (0.0%) | 0 (0.0%) |
Disability Class: Vision Difficulty
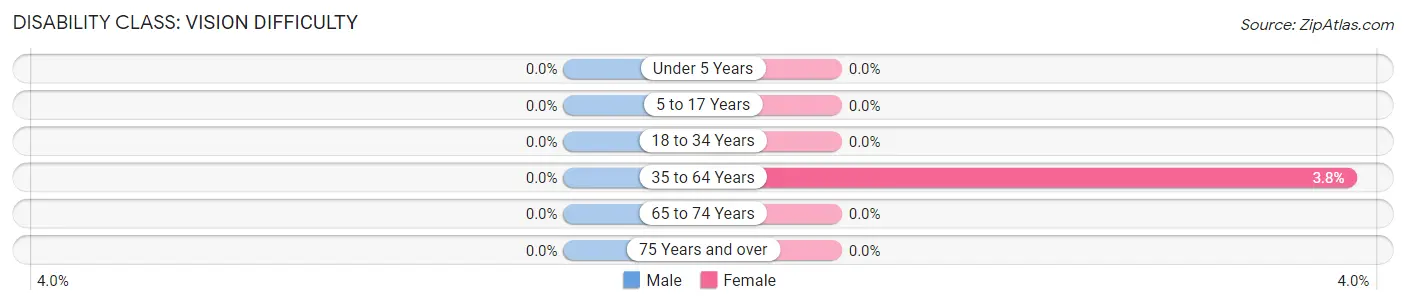
| Age Bracket | Male | Female |
| Under 5 Years | 0 (0.0%) | 0 (0.0%) |
| 5 to 17 Years | 0 (0.0%) | 0 (0.0%) |
| 18 to 34 Years | 0 (0.0%) | 0 (0.0%) |
| 35 to 64 Years | 0 (0.0%) | 25 (3.8%) |
| 65 to 74 Years | 0 (0.0%) | 0 (0.0%) |
| 75 Years and over | 0 (0.0%) | 0 (0.0%) |
Disability Class: Cognitive Difficulty
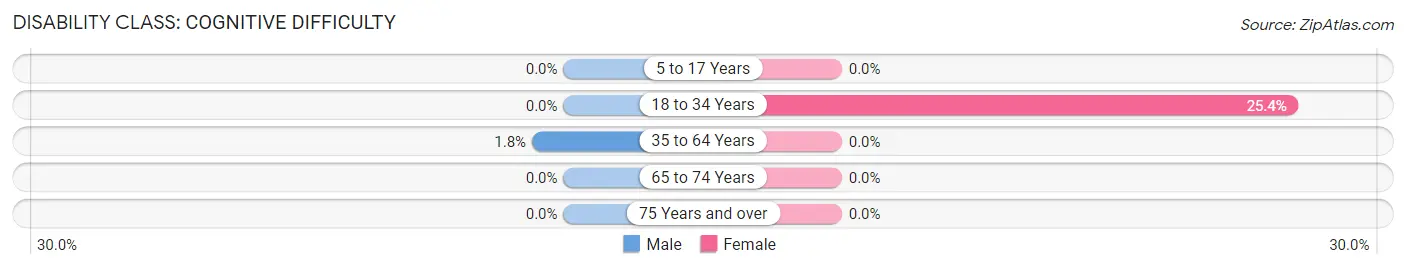
| Age Bracket | Male | Female |
| 5 to 17 Years | 0 (0.0%) | 0 (0.0%) |
| 18 to 34 Years | 0 (0.0%) | 146 (25.4%) |
| 35 to 64 Years | 13 (1.8%) | 0 (0.0%) |
| 65 to 74 Years | 0 (0.0%) | 0 (0.0%) |
| 75 Years and over | 0 (0.0%) | 0 (0.0%) |
Disability Class: Ambulatory Difficulty
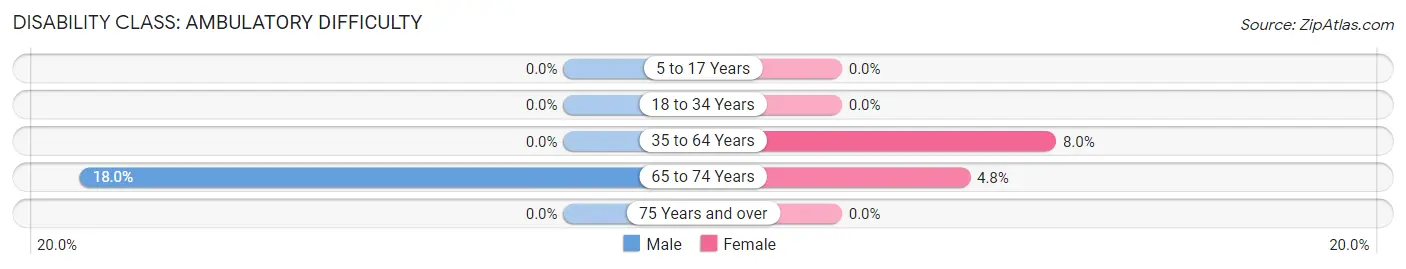
| Age Bracket | Male | Female |
| 5 to 17 Years | 0 (0.0%) | 0 (0.0%) |
| 18 to 34 Years | 0 (0.0%) | 0 (0.0%) |
| 35 to 64 Years | 0 (0.0%) | 52 (8.0%) |
| 65 to 74 Years | 14 (17.9%) | 10 (4.8%) |
| 75 Years and over | 0 (0.0%) | 0 (0.0%) |
Disability Class: Self-Care Difficulty
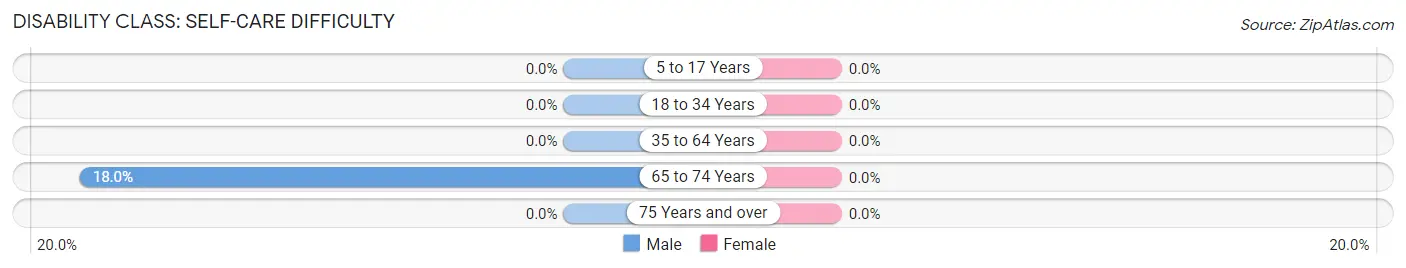
| Age Bracket | Male | Female |
| 5 to 17 Years | 0 (0.0%) | 0 (0.0%) |
| 18 to 34 Years | 0 (0.0%) | 0 (0.0%) |
| 35 to 64 Years | 0 (0.0%) | 0 (0.0%) |
| 65 to 74 Years | 14 (17.9%) | 0 (0.0%) |
| 75 Years and over | 0 (0.0%) | 0 (0.0%) |
Technology Access in Avery Creek
Computing Device Access in Avery Creek
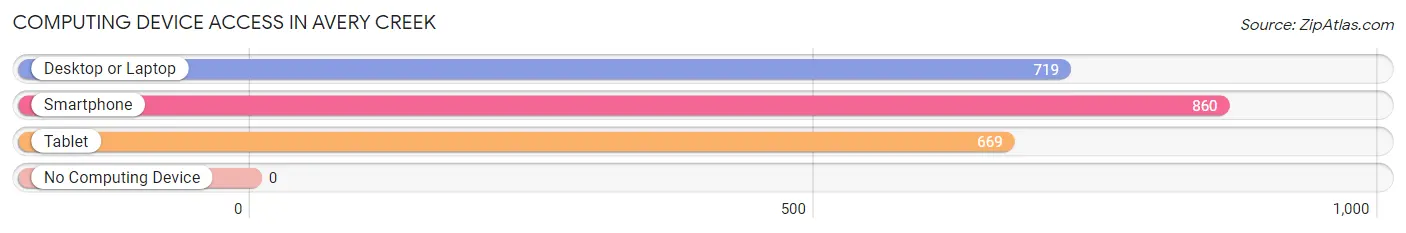
| Device Type | # Households | % Households |
| Desktop or Laptop | 719 | 83.6% |
| Smartphone | 860 | 100.0% |
| Tablet | 669 | 77.8% |
| No Computing Device | 0 | 0.0% |
| Total | 860 | 100.0% |
Internet Access in Avery Creek
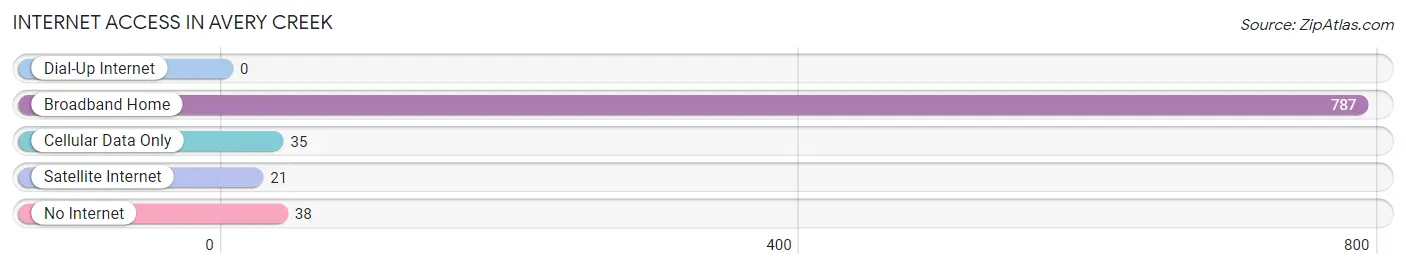
| Internet Type | # Households | % Households |
| Dial-Up Internet | 0 | 0.0% |
| Broadband Home | 787 | 91.5% |
| Cellular Data Only | 35 | 4.1% |
| Satellite Internet | 21 | 2.4% |
| No Internet | 38 | 4.4% |
| Total | 860 | 100.0% |
Avery Creek Summary
Avery Creek is a small unincorporated community located in Buncombe County, North Carolina. It is situated in the Blue Ridge Mountains, approximately 10 miles south of Asheville. The community is named after the Avery Creek, which flows through the area.
History
The area that is now Avery Creek was first settled in the late 1700s by the Avery family. The family established a homestead and a small grist mill on the banks of the creek. The mill was used to grind grain for the local community. The Avery family also operated a small store and post office in the area.
In the early 1900s, the area began to develop as a tourist destination. The Avery family opened a hotel and a general store to cater to the influx of visitors. The area also became a popular spot for camping and fishing.
Geography
Avery Creek is located in the Blue Ridge Mountains of western North Carolina. The community is situated at an elevation of 2,400 feet and is surrounded by the Pisgah National Forest. The Avery Creek flows through the area and is a popular spot for fishing and swimming.
The climate in Avery Creek is mild and temperate. Summers are warm and humid, while winters are cold and snowy. The average annual temperature is around 55 degrees Fahrenheit.
Economy
The economy of Avery Creek is largely based on tourism. The area is a popular destination for outdoor activities such as camping, fishing, and hiking. There are also several local businesses that cater to visitors, including restaurants, lodging, and retail stores.
The area is also home to several small farms and orchards. The farms produce a variety of fruits and vegetables, which are sold at local farmers markets and grocery stores.
Demographics
As of the 2010 census, the population of Avery Creek was 1,845. The racial makeup of the community was 97.3% White, 0.7% African American, 0.3% Native American, 0.2% Asian, and 1.5% from other races.
The median household income in Avery Creek was $41,250, and the median family income was $50,000. The per capita income was $20,000. The unemployment rate was 5.2%.
Conclusion
Avery Creek is a small unincorporated community located in Buncombe County, North Carolina. It is situated in the Blue Ridge Mountains, approximately 10 miles south of Asheville. The economy of Avery Creek is largely based on tourism, with visitors coming to the area for outdoor activities such as camping, fishing, and hiking. The population of Avery Creek was 1,845 as of the 2010 census, with a median household income of $41,250.
Common Questions
What is the Total Population of Avery Creek?
Total Population of Avery Creek is 3,338.
What is the Total Male Population of Avery Creek?
Total Male Population of Avery Creek is 1,554.
What is the Total Female Population of Avery Creek?
Total Female Population of Avery Creek is 1,784.
What is the Ratio of Males per 100 Females in Avery Creek?
There are 87.11 Males per 100 Females in Avery Creek.
What is the Ratio of Females per 100 Males in Avery Creek?
There are 114.80 Females per 100 Males in Avery Creek.
What is the Median Population Age in Avery Creek?
Median Population Age in Avery Creek is 40.4 Years.
What is the Average Family Size in Avery Creek
Average Family Size in Avery Creek is 4.3 People.
What is the Average Household Size in Avery Creek
Average Household Size in Avery Creek is 3.9 People.
What is Per Capita Income in Avery Creek?
Per Capita income in Avery Creek is $40,664.
What is the Median Family Income in Avery Creek?
Median Family Income in Avery Creek is $104,038.
What is the Median Household income in Avery Creek?
Median Household Income in Avery Creek is $104,808.
What is Income or Wage Gap in Avery Creek?
Income or Wage Gap in Avery Creek is 41.4%.
Women in Avery Creek earn 58.6 cents for every dollar earned by a man.
What is Inequality or Gini Index in Avery Creek?
Inequality or Gini Index in Avery Creek is 0.36.
How Large is the Labor Force in Avery Creek?
There are 2,008 People in the Labor Forcein in Avery Creek.
What is the Percentage of People in the Labor Force in Avery Creek?
72.6% of People are in the Labor Force in Avery Creek.