Cities with the Highest Percentage of Immigrants from Caribbean in North Carolina
RELATED REPORTS & OPTIONS
Caribbean
North Carolina
Compare Cities
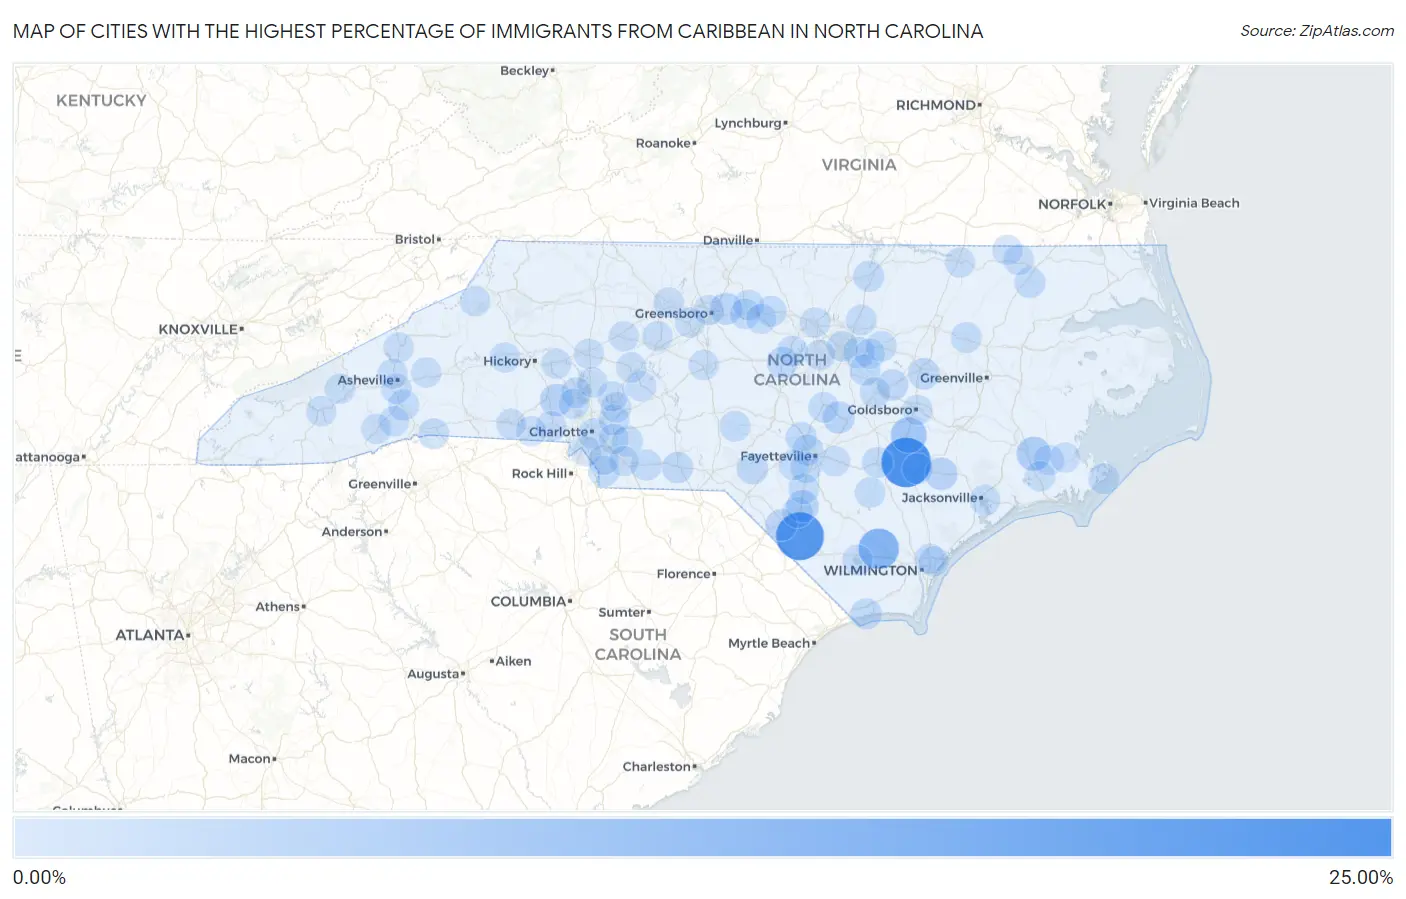
Map of Cities with the Highest Percentage of Immigrants from Caribbean in North Carolina
0.00%
25.00%
Cities with the Highest Percentage of Immigrants from Caribbean in North Carolina
| City | Caribbean | vs State | vs National | |
| 1. | Warsaw | 21.22% | 0.48%(+20.7)#-1 | 1.37%(+19.8)#0 |
| 2. | Orrum | 19.35% | 0.48%(+18.9)#0 | 1.37%(+18.0)#1 |
| 3. | East Arcadia | 11.28% | 0.48%(+10.8)#1 | 1.37%(+9.90)#2 |
| 4. | Mount Olive | 6.28% | 0.48%(+5.80)#25 | 1.37%(+4.90)#1,072 |
| 5. | Fairfield Harbour | 4.62% | 0.48%(+4.14)#26 | 1.37%(+3.24)#1,073 |
| 6. | Beulaville | 2.92% | 0.48%(+2.44)#27 | 1.37%(+1.55)#1,074 |
| 7. | Iron Station | 2.86% | 0.48%(+2.39)#28 | 1.37%(+1.49)#1,075 |
| 8. | Barker Ten Mile | 2.73% | 0.48%(+2.25)#29 | 1.37%(+1.36)#1,076 |
| 9. | Erwin | 2.43% | 0.48%(+1.96)#30 | 1.37%(+1.06)#1,077 |
| 10. | Mcleansville | 2.14% | 0.48%(+1.67)#31 | 1.37%(+0.771)#1,078 |
| 11. | Mcdonald | 2.06% | 0.48%(+1.59)#32 | 1.37%(+0.689)#1,079 |
| 12. | Black Creek | 1.85% | 0.48%(+1.37)#33 | 1.37%(+0.475)#1,080 |
| 13. | Deercroft | 1.79% | 0.48%(+1.31)#34 | 1.37%(+0.413)#1,081 |
| 14. | Pittsboro | 1.69% | 0.48%(+1.21)#35 | 1.37%(+0.318)#1,082 |
| 15. | Wadesboro | 1.68% | 0.48%(+1.20)#36 | 1.37%(+0.306)#1,083 |
| 16. | Micro | 1.68% | 0.48%(+1.20)#37 | 1.37%(+0.305)#1,084 |
| 17. | Knightdale | 1.57% | 0.48%(+1.09)#38 | 1.37%(+0.196)#1,085 |
| 18. | Anderson Creek | 1.43% | 0.48%(+0.950)#39 | 1.37%(+0.053)#1,086 |
| 19. | Henderson | 1.42% | 0.48%(+0.944)#40 | 1.37%(+0.048)#1,087 |
| 20. | Marshville | 1.36% | 0.48%(+0.889)#41 | 1.37%(-0.008)#1,088 |
| 21. | Ocean Isle Beach | 1.36% | 0.48%(+0.884)#42 | 1.37%(-0.013)#1,089 |
| 22. | Clinton | 1.34% | 0.48%(+0.863)#43 | 1.37%(-0.033)#1,090 |
| 23. | Spring Lake | 1.33% | 0.48%(+0.856)#44 | 1.37%(-0.040)#1,091 |
| 24. | Fayetteville | 1.33% | 0.48%(+0.854)#55 | 1.37%(-0.043)#2,108 |
| 25. | Hope Mills | 1.32% | 0.48%(+0.843)#56 | 1.37%(-0.054)#2,109 |
| 26. | Waxhaw | 1.32% | 0.48%(+0.840)#57 | 1.37%(-0.056)#2,110 |
| 27. | Clayton | 1.31% | 0.48%(+0.836)#58 | 1.37%(-0.061)#2,111 |
| 28. | Ahoskie | 1.26% | 0.48%(+0.784)#59 | 1.37%(-0.112)#2,112 |
| 29. | Tarboro | 1.22% | 0.48%(+0.739)#60 | 1.37%(-0.157)#2,113 |
| 30. | Charlotte | 1.20% | 0.48%(+0.728)#61 | 1.37%(-0.169)#2,248 |
| 31. | Fairview | 1.20% | 0.48%(+0.720)#62 | 1.37%(-0.177)#2,249 |
| 32. | Mebane | 1.16% | 0.48%(+0.681)#63 | 1.37%(-0.216)#2,250 |
| 33. | Fletcher | 1.15% | 0.48%(+0.674)#64 | 1.37%(-0.222)#2,251 |
| 34. | Atlantic | 1.12% | 0.48%(+0.648)#65 | 1.37%(-0.249)#2,252 |
| 35. | Tryon | 1.12% | 0.48%(+0.645)#66 | 1.37%(-0.251)#2,253 |
| 36. | Jacksonville | 1.09% | 0.48%(+0.610)#67 | 1.37%(-0.286)#2,254 |
| 37. | Kenansville | 1.08% | 0.48%(+0.601)#68 | 1.37%(-0.296)#2,255 |
| 38. | Lumberton | 1.07% | 0.48%(+0.592)#69 | 1.37%(-0.304)#2,256 |
| 39. | St Pauls | 1.06% | 0.48%(+0.586)#70 | 1.37%(-0.311)#2,257 |
| 40. | Raleigh | 1.02% | 0.48%(+0.549)#71 | 1.37%(-0.348)#2,258 |
| 41. | Fearrington Village | 1.01% | 0.48%(+0.531)#72 | 1.37%(-0.365)#2,259 |
| 42. | Westport | 1.01% | 0.48%(+0.531)#73 | 1.37%(-0.366)#2,260 |
| 43. | Seven Lakes | 1.00% | 0.48%(+0.526)#74 | 1.37%(-0.371)#2,261 |
| 44. | Harrisburg | 0.99% | 0.48%(+0.517)#75 | 1.37%(-0.380)#2,262 |
| 45. | Rockfish | 0.98% | 0.48%(+0.505)#76 | 1.37%(-0.392)#2,263 |
| 46. | Smithfield | 0.96% | 0.48%(+0.487)#77 | 1.37%(-0.409)#2,264 |
| 47. | Youngsville | 0.95% | 0.48%(+0.474)#78 | 1.37%(-0.422)#2,265 |
| 48. | Zebulon | 0.92% | 0.48%(+0.440)#79 | 1.37%(-0.456)#2,266 |
| 49. | Garland | 0.90% | 0.48%(+0.428)#80 | 1.37%(-0.469)#2,267 |
| 50. | Lillington | 0.90% | 0.48%(+0.422)#81 | 1.37%(-0.474)#2,268 |
| 51. | Glen Raven | 0.89% | 0.48%(+0.414)#82 | 1.37%(-0.483)#2,269 |
| 52. | Lake Waccamaw | 0.89% | 0.48%(+0.413)#83 | 1.37%(-0.483)#2,270 |
| 53. | Walkertown | 0.88% | 0.48%(+0.400)#84 | 1.37%(-0.496)#2,271 |
| 54. | Lowesville | 0.84% | 0.48%(+0.365)#85 | 1.37%(-0.531)#2,272 |
| 55. | Arapahoe | 0.82% | 0.48%(+0.348)#86 | 1.37%(-0.548)#2,273 |
| 56. | Banner Elk | 0.81% | 0.48%(+0.334)#87 | 1.37%(-0.562)#2,274 |
| 57. | Burlington | 0.81% | 0.48%(+0.332)#88 | 1.37%(-0.565)#2,275 |
| 58. | Gastonia | 0.79% | 0.48%(+0.314)#89 | 1.37%(-0.582)#2,276 |
| 59. | Cary | 0.79% | 0.48%(+0.310)#90 | 1.37%(-0.587)#2,277 |
| 60. | Concord | 0.74% | 0.48%(+0.264)#91 | 1.37%(-0.633)#2,278 |
| 61. | Wendell | 0.74% | 0.48%(+0.262)#92 | 1.37%(-0.635)#2,279 |
| 62. | Welcome | 0.73% | 0.48%(+0.250)#93 | 1.37%(-0.647)#2,280 |
| 63. | Havelock | 0.72% | 0.48%(+0.246)#94 | 1.37%(-0.650)#2,281 |
| 64. | Asheboro | 0.72% | 0.48%(+0.243)#95 | 1.37%(-0.653)#2,282 |
| 65. | Pineville | 0.71% | 0.48%(+0.236)#96 | 1.37%(-0.660)#2,283 |
| 66. | Mocksville | 0.71% | 0.48%(+0.235)#97 | 1.37%(-0.662)#2,284 |
| 67. | Greensboro | 0.71% | 0.48%(+0.232)#98 | 1.37%(-0.664)#2,380 |
| 68. | Mars Hill | 0.70% | 0.48%(+0.228)#99 | 1.37%(-0.669)#2,381 |
| 69. | Asheville | 0.70% | 0.48%(+0.226)#100 | 1.37%(-0.670)#2,382 |
| 70. | Rockwell | 0.70% | 0.48%(+0.223)#101 | 1.37%(-0.674)#2,383 |
| 71. | Spout Springs | 0.69% | 0.48%(+0.217)#102 | 1.37%(-0.679)#2,384 |
| 72. | Etowah | 0.69% | 0.48%(+0.213)#103 | 1.37%(-0.683)#2,385 |
| 73. | Claremont | 0.68% | 0.48%(+0.208)#104 | 1.37%(-0.689)#2,386 |
| 74. | Kannapolis | 0.68% | 0.48%(+0.205)#105 | 1.37%(-0.692)#2,387 |
| 75. | Durham | 0.68% | 0.48%(+0.205)#106 | 1.37%(-0.692)#2,388 |
| 76. | Drexel | 0.68% | 0.48%(+0.203)#107 | 1.37%(-0.694)#2,389 |
| 77. | Montreat | 0.68% | 0.48%(+0.203)#108 | 1.37%(-0.694)#2,390 |
| 78. | Stedman | 0.68% | 0.48%(+0.200)#109 | 1.37%(-0.696)#2,391 |
| 79. | Goldsboro | 0.67% | 0.48%(+0.197)#110 | 1.37%(-0.699)#2,392 |
| 80. | Woodfin | 0.66% | 0.48%(+0.182)#111 | 1.37%(-0.714)#2,393 |
| 81. | Salisbury | 0.65% | 0.48%(+0.170)#112 | 1.37%(-0.726)#2,394 |
| 82. | Northchase | 0.63% | 0.48%(+0.156)#113 | 1.37%(-0.741)#2,395 |
| 83. | Weddington | 0.63% | 0.48%(+0.154)#114 | 1.37%(-0.742)#2,396 |
| 84. | High Point | 0.60% | 0.48%(+0.128)#115 | 1.37%(-0.769)#2,397 |
| 85. | Mooresville | 0.59% | 0.48%(+0.118)#116 | 1.37%(-0.779)#2,398 |
| 86. | Maggie Valley | 0.59% | 0.48%(+0.116)#117 | 1.37%(-0.780)#2,399 |
| 87. | Kings Mountain | 0.59% | 0.48%(+0.111)#118 | 1.37%(-0.786)#2,400 |
| 88. | Weldon | 0.59% | 0.48%(+0.110)#119 | 1.37%(-0.786)#2,401 |
| 89. | Murraysville | 0.58% | 0.48%(+0.106)#120 | 1.37%(-0.791)#2,402 |
| 90. | Brevard | 0.58% | 0.48%(+0.103)#121 | 1.37%(-0.794)#2,403 |
| 91. | Murfreesboro | 0.57% | 0.48%(+0.098)#122 | 1.37%(-0.798)#2,404 |
| 92. | Swepsonville | 0.57% | 0.48%(+0.092)#123 | 1.37%(-0.804)#2,405 |
| 93. | Severn | 0.56% | 0.48%(+0.089)#124 | 1.37%(-0.807)#2,406 |
| 94. | Mint Hill | 0.55% | 0.48%(+0.074)#125 | 1.37%(-0.822)#2,407 |
| 95. | Statesville | 0.54% | 0.48%(+0.067)#126 | 1.37%(-0.830)#2,408 |
| 96. | Governors Club | 0.54% | 0.48%(+0.063)#127 | 1.37%(-0.834)#2,409 |
| 97. | Sylva | 0.54% | 0.48%(+0.062)#128 | 1.37%(-0.834)#2,410 |
| 98. | Shelby | 0.53% | 0.48%(+0.058)#129 | 1.37%(-0.838)#2,411 |
| 99. | Oriental | 0.52% | 0.48%(+0.041)#130 | 1.37%(-0.856)#2,412 |
| 100. | Monroe | 0.52% | 0.48%(+0.040)#131 | 1.37%(-0.857)#2,413 |
Common Questions
What are the Top 10 Cities with the Highest Percentage of Immigrants from Caribbean in North Carolina?
Top 10 Cities with the Highest Percentage of Immigrants from Caribbean in North Carolina are:
#1
21.22%
#2
19.35%
#3
11.28%
#4
6.28%
#5
4.62%
#6
2.92%
#7
2.86%
#8
2.73%
#9
2.43%
#10
2.14%
What city has the Highest Percentage of Immigrants from Caribbean in North Carolina?
Warsaw has the Highest Percentage of Immigrants from Caribbean in North Carolina with 21.22%.
What is the Percentage of Immigrants from Caribbean in the State of North Carolina?
Percentage of Immigrants from Caribbean in North Carolina is 0.48%.
What is the Percentage of Immigrants from Caribbean in the United States?
Percentage of Immigrants from Caribbean in the United States is 1.37%.