Cities with the Highest Percentage of Immigrants from El Salvador in North Carolina
RELATED REPORTS & OPTIONS
El Salvador
North Carolina
Compare Cities
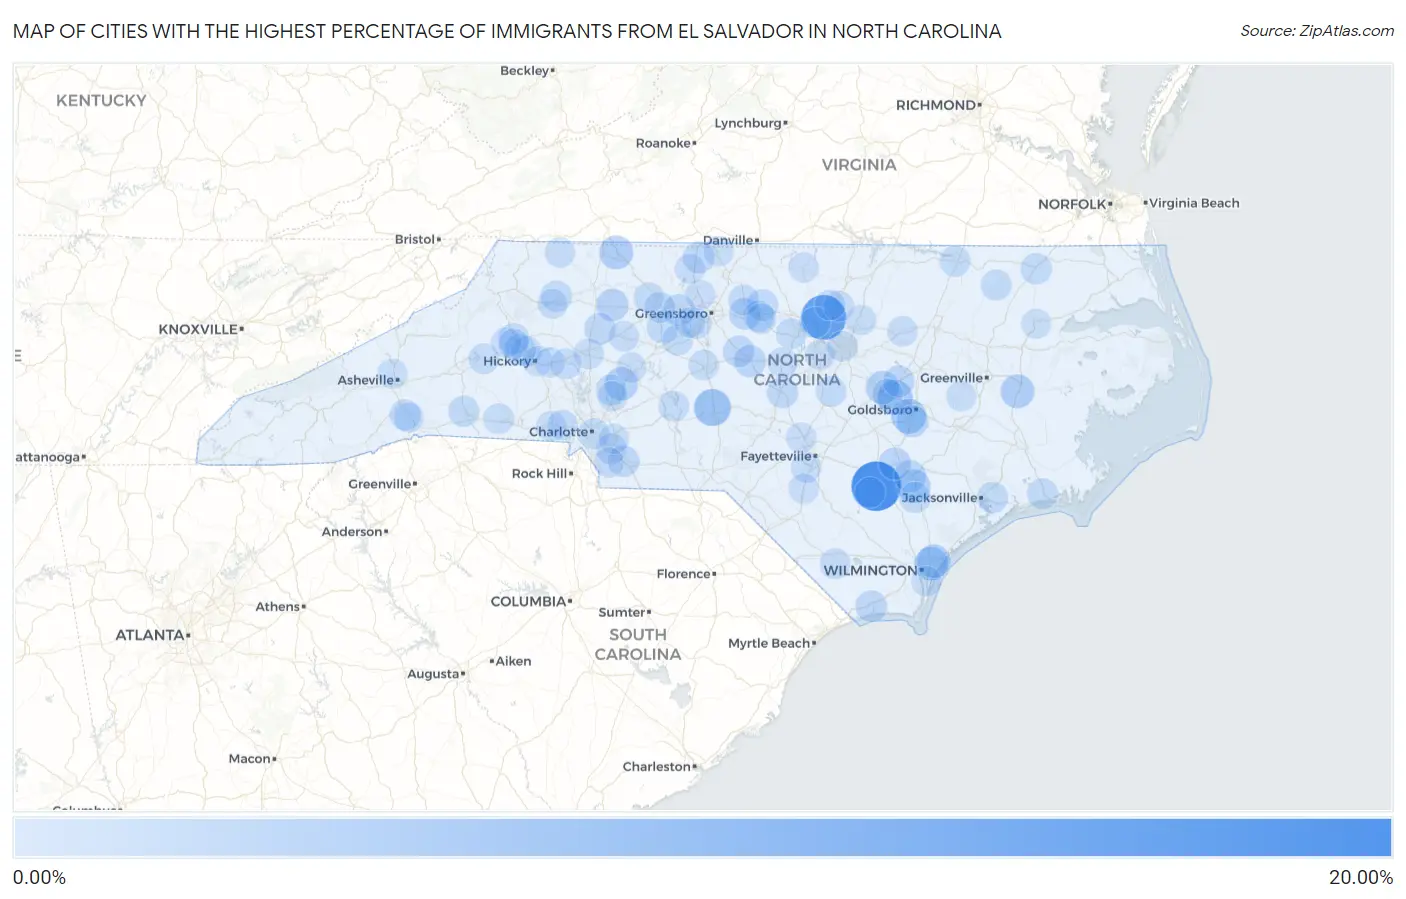
Map of Cities with the Highest Percentage of Immigrants from El Salvador in North Carolina
0.00%
20.00%
Cities with the Highest Percentage of Immigrants from El Salvador in North Carolina
| City | El Salvador | vs State | vs National | |
| 1. | Ingold | 16.12% | 0.32%(+15.8)#-1 | 0.43%(+15.7)#0 |
| 2. | Gorman | 12.29% | 0.32%(+12.0)#0 | 0.43%(+11.9)#1 |
| 3. | Emma | 6.03% | 0.32%(+5.71)#1 | 0.43%(+5.60)#2 |
| 4. | Star | 5.55% | 0.32%(+5.23)#2 | 0.43%(+5.12)#3 |
| 5. | Princeton | 4.21% | 0.32%(+3.90)#3 | 0.43%(+3.79)#4 |
| 6. | Mar Mac | 3.90% | 0.32%(+3.58)#4 | 0.43%(+3.48)#5 |
| 7. | Toast | 3.14% | 0.32%(+2.82)#5 | 0.43%(+2.72)#6 |
| 8. | Chocowinity | 3.12% | 0.32%(+2.80)#6 | 0.43%(+2.69)#7 |
| 9. | Kings Grant | 2.94% | 0.32%(+2.62)#7 | 0.43%(+2.52)#8 |
| 10. | Murraysville | 2.93% | 0.32%(+2.61)#8 | 0.43%(+2.51)#541 |
| 11. | Rose Hill | 2.85% | 0.32%(+2.53)#9 | 0.43%(+2.43)#542 |
| 12. | China Grove | 2.79% | 0.32%(+2.47)#10 | 0.43%(+2.36)#543 |
| 13. | Selma | 2.78% | 0.32%(+2.46)#11 | 0.43%(+2.35)#544 |
| 14. | Arrowhead Beach | 2.25% | 0.32%(+1.93)#12 | 0.43%(+1.83)#545 |
| 15. | Yadkinville | 2.05% | 0.32%(+1.73)#13 | 0.43%(+1.63)#546 |
| 16. | Magnolia | 2.01% | 0.32%(+1.69)#14 | 0.43%(+1.59)#547 |
| 17. | Turkey | 1.90% | 0.32%(+1.59)#15 | 0.43%(+1.48)#548 |
| 18. | Brogden | 1.68% | 0.32%(+1.36)#16 | 0.43%(+1.25)#549 |
| 19. | Siler City | 1.58% | 0.32%(+1.26)#17 | 0.43%(+1.15)#550 |
| 20. | Burlington | 1.58% | 0.32%(+1.26)#18 | 0.43%(+1.15)#551 |
| 21. | Kenly | 1.46% | 0.32%(+1.15)#19 | 0.43%(+1.04)#552 |
| 22. | Staley | 1.39% | 0.32%(+1.07)#20 | 0.43%(+0.961)#553 |
| 23. | Shallotte | 1.38% | 0.32%(+1.06)#21 | 0.43%(+0.951)#554 |
| 24. | Harmony | 1.37% | 0.32%(+1.05)#22 | 0.43%(+0.945)#555 |
| 25. | Kernersville | 1.35% | 0.32%(+1.04)#23 | 0.43%(+0.929)#556 |
| 26. | Sanford | 1.27% | 0.32%(+0.955)#24 | 0.43%(+0.849)#557 |
| 27. | Stoneville | 1.24% | 0.32%(+0.917)#25 | 0.43%(+0.810)#558 |
| 28. | Monroe | 1.23% | 0.32%(+0.911)#35 | 0.43%(+0.804)#1,563 |
| 29. | Winton | 1.19% | 0.32%(+0.868)#36 | 0.43%(+0.762)#1,564 |
| 30. | Green Level | 1.16% | 0.32%(+0.838)#37 | 0.43%(+0.732)#1,565 |
| 31. | Midway | 1.15% | 0.32%(+0.834)#38 | 0.43%(+0.727)#1,566 |
| 32. | Fairplains | 1.11% | 0.32%(+0.793)#39 | 0.43%(+0.686)#1,567 |
| 33. | Wallace | 1.10% | 0.32%(+0.785)#40 | 0.43%(+0.678)#1,568 |
| 34. | Dudley | 1.10% | 0.32%(+0.783)#41 | 0.43%(+0.677)#1,569 |
| 35. | Rutherfordton | 1.09% | 0.32%(+0.771)#42 | 0.43%(+0.664)#1,570 |
| 36. | Piney Green | 1.06% | 0.32%(+0.744)#43 | 0.43%(+0.638)#1,571 |
| 37. | Sawmills | 1.03% | 0.32%(+0.716)#44 | 0.43%(+0.609)#1,572 |
| 38. | Graham | 1.00% | 0.32%(+0.685)#45 | 0.43%(+0.578)#1,573 |
| 39. | Balfour | 0.96% | 0.32%(+0.644)#46 | 0.43%(+0.538)#1,574 |
| 40. | Rich Square | 0.94% | 0.32%(+0.620)#47 | 0.43%(+0.513)#1,575 |
| 41. | Lenoir | 0.92% | 0.32%(+0.605)#48 | 0.43%(+0.498)#1,576 |
| 42. | Winston Salem | 0.92% | 0.32%(+0.600)#49 | 0.43%(+0.493)#1,738 |
| 43. | Charlotte | 0.92% | 0.32%(+0.600)#50 | 0.43%(+0.493)#1,739 |
| 44. | Thomasville | 0.91% | 0.32%(+0.595)#51 | 0.43%(+0.489)#1,740 |
| 45. | Roanoke Rapids | 0.90% | 0.32%(+0.586)#52 | 0.43%(+0.479)#1,741 |
| 46. | Angier | 0.84% | 0.32%(+0.523)#53 | 0.43%(+0.416)#1,742 |
| 47. | Newport | 0.84% | 0.32%(+0.521)#54 | 0.43%(+0.414)#1,743 |
| 48. | Enochville | 0.81% | 0.32%(+0.494)#55 | 0.43%(+0.387)#1,744 |
| 49. | Durham | 0.80% | 0.32%(+0.480)#56 | 0.43%(+0.373)#1,745 |
| 50. | Carrboro | 0.74% | 0.32%(+0.420)#57 | 0.43%(+0.314)#1,746 |
| 51. | Ossipee | 0.71% | 0.32%(+0.395)#58 | 0.43%(+0.289)#1,747 |
| 52. | Brunswick | 0.65% | 0.32%(+0.330)#59 | 0.43%(+0.223)#1,748 |
| 53. | Raleigh | 0.63% | 0.32%(+0.315)#60 | 0.43%(+0.208)#1,749 |
| 54. | Glen Alpine | 0.63% | 0.32%(+0.314)#61 | 0.43%(+0.208)#1,750 |
| 55. | Badin | 0.63% | 0.32%(+0.308)#62 | 0.43%(+0.201)#1,751 |
| 56. | Stallings | 0.61% | 0.32%(+0.286)#63 | 0.43%(+0.180)#1,752 |
| 57. | Bethania | 0.60% | 0.32%(+0.278)#64 | 0.43%(+0.172)#1,753 |
| 58. | Statesville | 0.59% | 0.32%(+0.269)#65 | 0.43%(+0.163)#1,754 |
| 59. | Mocksville | 0.58% | 0.32%(+0.257)#66 | 0.43%(+0.150)#1,755 |
| 60. | Asheboro | 0.57% | 0.32%(+0.253)#67 | 0.43%(+0.146)#1,756 |
| 61. | Lattimore | 0.54% | 0.32%(+0.220)#68 | 0.43%(+0.113)#1,757 |
| 62. | Jamestown | 0.52% | 0.32%(+0.198)#69 | 0.43%(+0.091)#1,758 |
| 63. | Creedmoor | 0.51% | 0.32%(+0.194)#70 | 0.43%(+0.088)#1,759 |
| 64. | Gastonia | 0.51% | 0.32%(+0.187)#71 | 0.43%(+0.081)#1,760 |
| 65. | Pittsboro | 0.50% | 0.32%(+0.186)#72 | 0.43%(+0.080)#1,761 |
| 66. | Garland | 0.50% | 0.32%(+0.183)#73 | 0.43%(+0.077)#1,762 |
| 67. | Butner | 0.50% | 0.32%(+0.183)#74 | 0.43%(+0.076)#1,763 |
| 68. | Swepsonville | 0.49% | 0.32%(+0.168)#75 | 0.43%(+0.062)#1,764 |
| 69. | Granite Falls | 0.49% | 0.32%(+0.168)#76 | 0.43%(+0.061)#1,765 |
| 70. | Catawba | 0.48% | 0.32%(+0.157)#77 | 0.43%(+0.051)#1,766 |
| 71. | High Point | 0.47% | 0.32%(+0.155)#78 | 0.43%(+0.049)#1,767 |
| 72. | Lowell | 0.46% | 0.32%(+0.142)#79 | 0.43%(+0.035)#1,768 |
| 73. | Sparta | 0.45% | 0.32%(+0.127)#80 | 0.43%(+0.020)#1,769 |
| 74. | Hope Mills | 0.44% | 0.32%(+0.117)#81 | 0.43%(+0.010)#1,770 |
| 75. | Spring Hope | 0.42% | 0.32%(+0.098)#82 | 0.43%(-0.009)#1,771 |
| 76. | St Pauls | 0.40% | 0.32%(+0.079)#83 | 0.43%(-0.027)#1,772 |
| 77. | Maury | 0.38% | 0.32%(+0.060)#84 | 0.43%(-0.046)#1,773 |
| 78. | Gamewell | 0.38% | 0.32%(+0.059)#85 | 0.43%(-0.048)#1,774 |
| 79. | Cajah S Mountain | 0.37% | 0.32%(+0.050)#86 | 0.43%(-0.057)#1,775 |
| 80. | Spring Lake | 0.37% | 0.32%(+0.048)#87 | 0.43%(-0.058)#1,776 |
| 81. | Mint Hill | 0.36% | 0.32%(+0.043)#88 | 0.43%(-0.064)#1,777 |
| 82. | Roxboro | 0.36% | 0.32%(+0.038)#89 | 0.43%(-0.069)#1,778 |
| 83. | Summerfield | 0.35% | 0.32%(+0.036)#90 | 0.43%(-0.070)#1,779 |
| 84. | Wesley Chapel | 0.34% | 0.32%(+0.024)#91 | 0.43%(-0.083)#1,780 |
| 85. | Eden | 0.34% | 0.32%(+0.020)#92 | 0.43%(-0.087)#1,781 |
| 86. | Hendersonville | 0.32% | 0.32%(-0.001)#93 | 0.43%(-0.108)#1,782 |
| 87. | Cary | 0.31% | 0.32%(-0.007)#94 | 0.43%(-0.114)#1,783 |
| 88. | Salisbury | 0.30% | 0.32%(-0.022)#95 | 0.43%(-0.129)#1,784 |
| 89. | Silver Lake | 0.29% | 0.32%(-0.029)#96 | 0.43%(-0.135)#1,785 |
| 90. | Youngsville | 0.29% | 0.32%(-0.030)#97 | 0.43%(-0.136)#1,786 |
| 91. | Pine Level | 0.28% | 0.32%(-0.035)#98 | 0.43%(-0.142)#1,787 |
| 92. | Madison | 0.27% | 0.32%(-0.044)#99 | 0.43%(-0.151)#1,788 |
| 93. | Wilkesboro | 0.27% | 0.32%(-0.047)#100 | 0.43%(-0.153)#1,789 |
| 94. | Woodfin | 0.25% | 0.32%(-0.066)#101 | 0.43%(-0.172)#1,790 |
| 95. | Spout Springs | 0.25% | 0.32%(-0.068)#102 | 0.43%(-0.175)#1,791 |
| 96. | Hickory | 0.25% | 0.32%(-0.072)#103 | 0.43%(-0.179)#1,792 |
| 97. | Anderson Creek | 0.24% | 0.32%(-0.083)#104 | 0.43%(-0.190)#1,793 |
| 98. | Windsor | 0.23% | 0.32%(-0.090)#105 | 0.43%(-0.196)#1,794 |
| 99. | Kannapolis | 0.21% | 0.32%(-0.105)#106 | 0.43%(-0.212)#1,795 |
| 100. | Conover | 0.21% | 0.32%(-0.106)#107 | 0.43%(-0.213)#1,796 |
Common Questions
What are the Top 10 Cities with the Highest Percentage of Immigrants from El Salvador in North Carolina?
Top 10 Cities with the Highest Percentage of Immigrants from El Salvador in North Carolina are:
#1
16.12%
#2
12.29%
#3
5.55%
#4
4.21%
#5
3.90%
#6
3.14%
#7
3.12%
#8
2.94%
#9
2.93%
#10
2.85%
What city has the Highest Percentage of Immigrants from El Salvador in North Carolina?
Ingold has the Highest Percentage of Immigrants from El Salvador in North Carolina with 16.12%.
What is the Percentage of Immigrants from El Salvador in the State of North Carolina?
Percentage of Immigrants from El Salvador in North Carolina is 0.32%.
What is the Percentage of Immigrants from El Salvador in the United States?
Percentage of Immigrants from El Salvador in the United States is 0.43%.