Biltmore Forest, NC
Biltmore Forest Map
Biltmore Forest Overview
1,700
TOTAL POPULATION
866
MALE POPULATION
834
FEMALE POPULATION
103.84
MALES / 100 FEMALES
96.30
FEMALES / 100 MALES
50.2
MEDIAN AGE
3.2
AVG FAMILY SIZE
2.9
AVG HOUSEHOLD SIZE
$117,858
PER CAPITA INCOME
$210,833
AVG FAMILY INCOME
$174,286
AVG HOUSEHOLD INCOME
29.9%
WAGE / INCOME GAP [ % ]
70.1¢/ $1
WAGE / INCOME GAP [ $ ]
$12,431
FAMILY INCOME DEFICIT
0.56
INEQUALITY / GINI INDEX
694
LABOR FORCE [ PEOPLE ]
51.0%
PERCENT IN LABOR FORCE
2.4%
UNEMPLOYMENT RATE
Biltmore Forest Area Codes
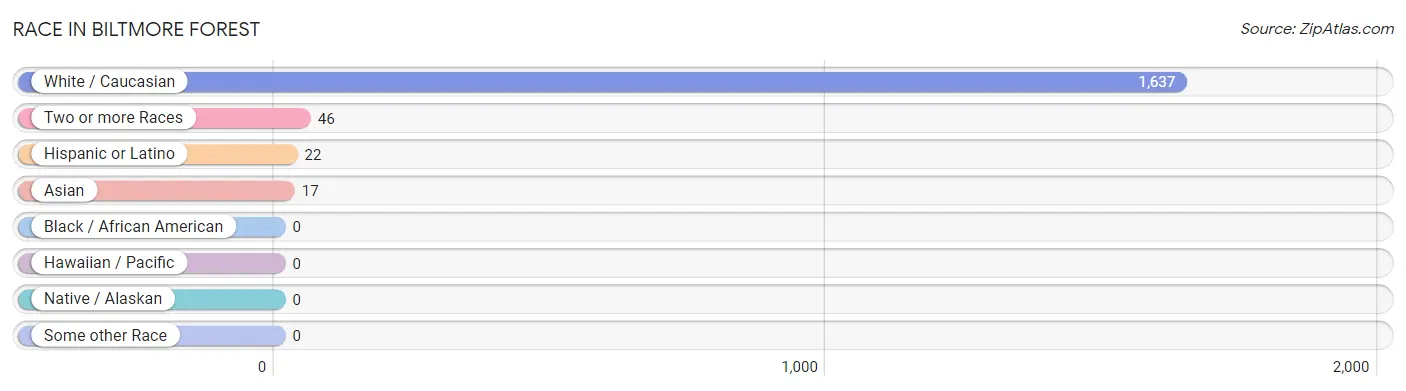
Race in Biltmore Forest
The most populous races in Biltmore Forest are White / Caucasian (1,637 | 96.3%), Two or more Races (46 | 2.7%), and Hispanic or Latino (22 | 1.3%).
| Race | # Population | % Population |
| Asian | 17 | 1.0% |
| Black / African American | 0 | 0.0% |
| Hawaiian / Pacific | 0 | 0.0% |
| Hispanic or Latino | 22 | 1.3% |
| Native / Alaskan | 0 | 0.0% |
| White / Caucasian | 1,637 | 96.3% |
| Two or more Races | 46 | 2.7% |
| Some other Race | 0 | 0.0% |
| Total | 1,700 | 100.0% |
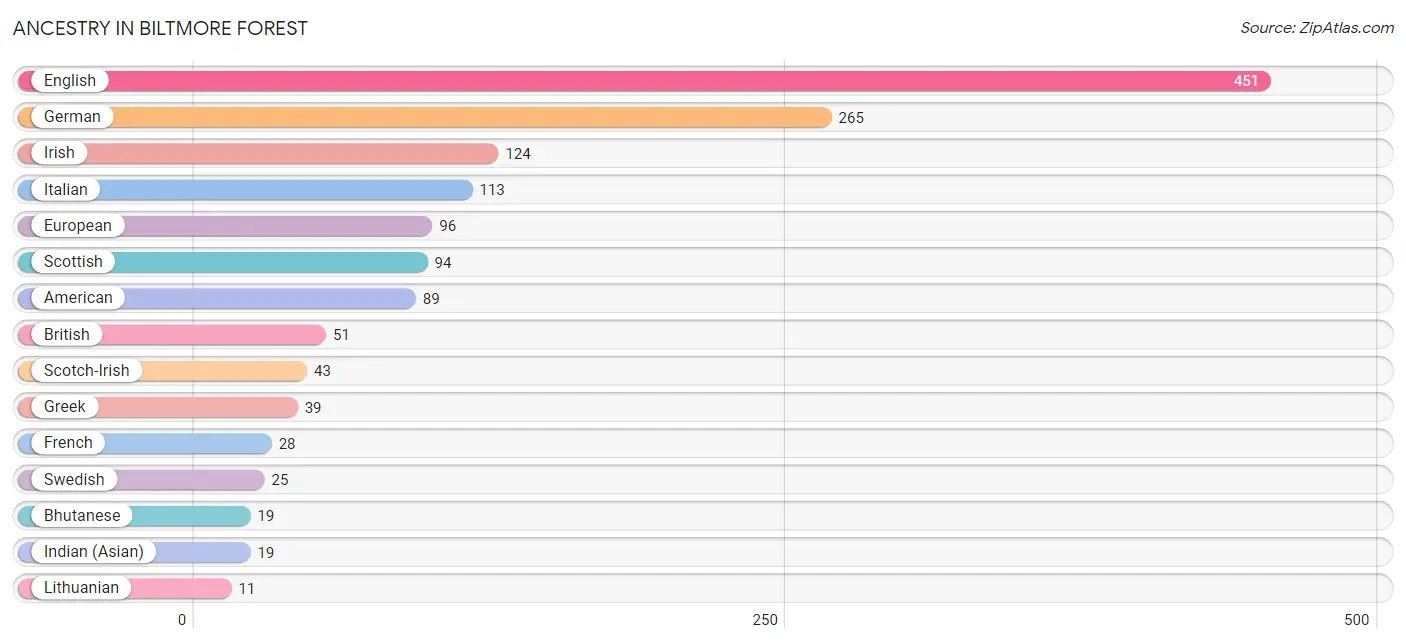
Ancestry in Biltmore Forest
The most populous ancestries reported in Biltmore Forest are English (451 | 26.5%), German (265 | 15.6%), Irish (124 | 7.3%), Italian (113 | 6.7%), and European (96 | 5.7%), together accounting for 61.7% of all Biltmore Forest residents.
| Ancestry | # Population | % Population |
| American | 89 | 5.2% |
| Armenian | 4 | 0.2% |
| Austrian | 7 | 0.4% |
| Bhutanese | 19 | 1.1% |
| British | 51 | 3.0% |
| Canadian | 4 | 0.2% |
| Cuban | 4 | 0.2% |
| Czechoslovakian | 2 | 0.1% |
| Dutch | 7 | 0.4% |
| Eastern European | 10 | 0.6% |
| English | 451 | 26.5% |
| European | 96 | 5.7% |
| French | 28 | 1.7% |
| French Canadian | 9 | 0.5% |
| German | 265 | 15.6% |
| Greek | 39 | 2.3% |
| Icelander | 3 | 0.2% |
| Indian (Asian) | 19 | 1.1% |
| Irish | 124 | 7.3% |
| Italian | 113 | 6.7% |
| Lithuanian | 11 | 0.6% |
| Mexican | 10 | 0.6% |
| Northern European | 9 | 0.5% |
| Norwegian | 5 | 0.3% |
| Polish | 10 | 0.6% |
| Portuguese | 6 | 0.4% |
| Puerto Rican | 4 | 0.2% |
| Scotch-Irish | 43 | 2.5% |
| Scottish | 94 | 5.5% |
| Slovak | 2 | 0.1% |
| Spaniard | 4 | 0.2% |
| Swedish | 25 | 1.5% |
| Swiss | 3 | 0.2% |
| Ukrainian | 8 | 0.5% |
| Welsh | 10 | 0.6% | View All 35 Rows |
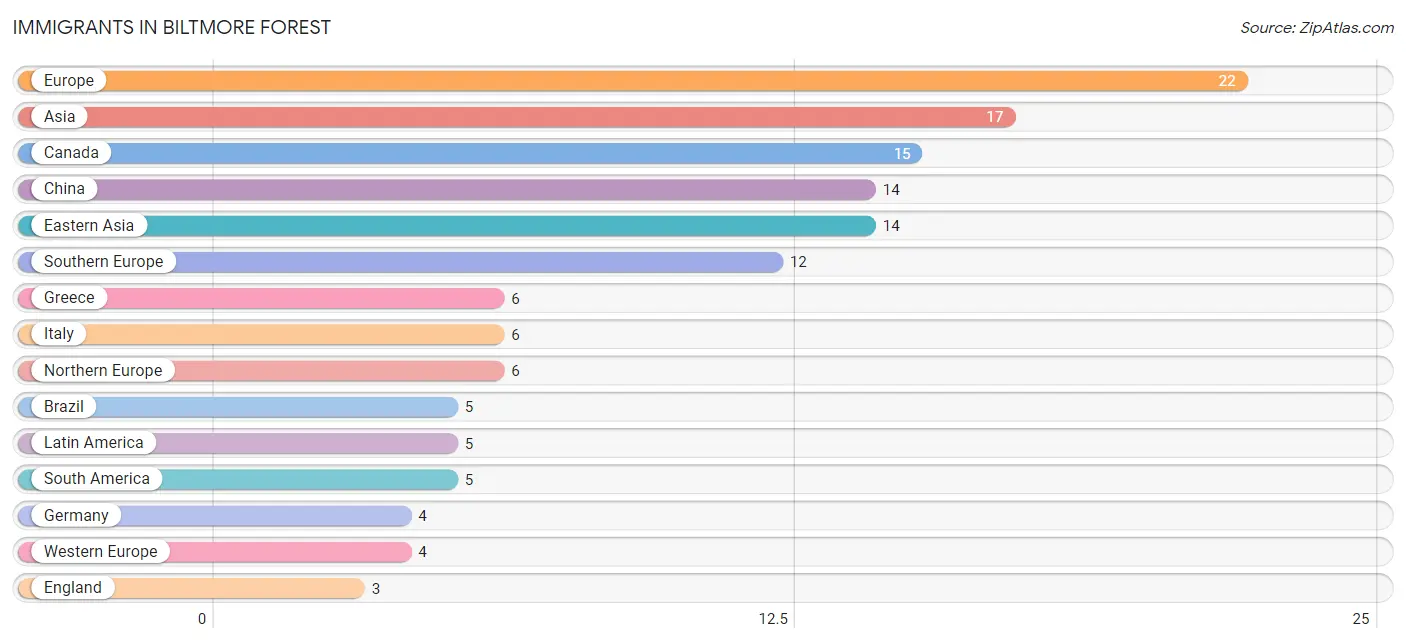
Immigrants in Biltmore Forest
The most numerous immigrant groups reported in Biltmore Forest came from Europe (22 | 1.3%), Asia (17 | 1.0%), Canada (15 | 0.9%), China (14 | 0.8%), and Eastern Asia (14 | 0.8%), together accounting for 4.8% of all Biltmore Forest residents.
| Immigration Origin | # Population | % Population |
| Asia | 17 | 1.0% |
| Brazil | 5 | 0.3% |
| Canada | 15 | 0.9% |
| China | 14 | 0.8% |
| Eastern Asia | 14 | 0.8% |
| England | 3 | 0.2% |
| Europe | 22 | 1.3% |
| Germany | 4 | 0.2% |
| Greece | 6 | 0.4% |
| Italy | 6 | 0.4% |
| Latin America | 5 | 0.3% |
| Northern Europe | 6 | 0.4% |
| Philippines | 3 | 0.2% |
| South America | 5 | 0.3% |
| South Eastern Asia | 3 | 0.2% |
| Southern Europe | 12 | 0.7% |
| Western Europe | 4 | 0.2% | View All 17 Rows |
Sex and Age in Biltmore Forest
Sex and Age in Biltmore Forest
The most populous age groups in Biltmore Forest are 15 to 19 Years (101 | 11.7%) for men and 15 to 19 Years (116 | 13.9%) for women.
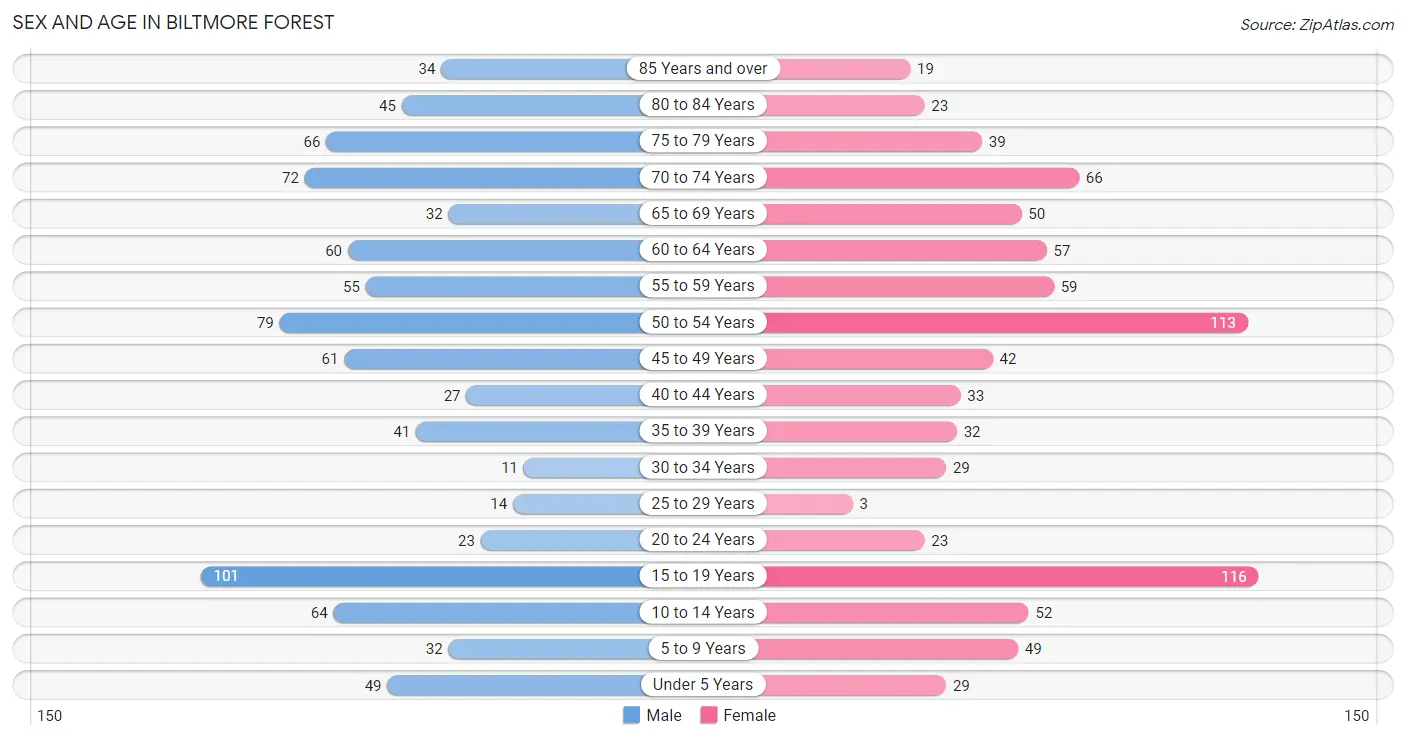
| Age Bracket | Male | Female |
| Under 5 Years | 49 (5.7%) | 29 (3.5%) |
| 5 to 9 Years | 32 (3.7%) | 49 (5.9%) |
| 10 to 14 Years | 64 (7.4%) | 52 (6.2%) |
| 15 to 19 Years | 101 (11.7%) | 116 (13.9%) |
| 20 to 24 Years | 23 (2.7%) | 23 (2.8%) |
| 25 to 29 Years | 14 (1.6%) | 3 (0.4%) |
| 30 to 34 Years | 11 (1.3%) | 29 (3.5%) |
| 35 to 39 Years | 41 (4.7%) | 32 (3.8%) |
| 40 to 44 Years | 27 (3.1%) | 33 (4.0%) |
| 45 to 49 Years | 61 (7.0%) | 42 (5.0%) |
| 50 to 54 Years | 79 (9.1%) | 113 (13.6%) |
| 55 to 59 Years | 55 (6.4%) | 59 (7.1%) |
| 60 to 64 Years | 60 (6.9%) | 57 (6.8%) |
| 65 to 69 Years | 32 (3.7%) | 50 (6.0%) |
| 70 to 74 Years | 72 (8.3%) | 66 (7.9%) |
| 75 to 79 Years | 66 (7.6%) | 39 (4.7%) |
| 80 to 84 Years | 45 (5.2%) | 23 (2.8%) |
| 85 Years and over | 34 (3.9%) | 19 (2.3%) |
| Total | 866 (100.0%) | 834 (100.0%) |
Families and Households in Biltmore Forest
Median Family Size in Biltmore Forest
The median family size in Biltmore Forest is 3.23 persons per family, with single male/father families (28 | 5.7%) accounting for the largest median family size of 4.14 persons per family. On the other hand, single female/mother families (17 | 3.5%) represent the smallest median family size with 2.65 persons per family.
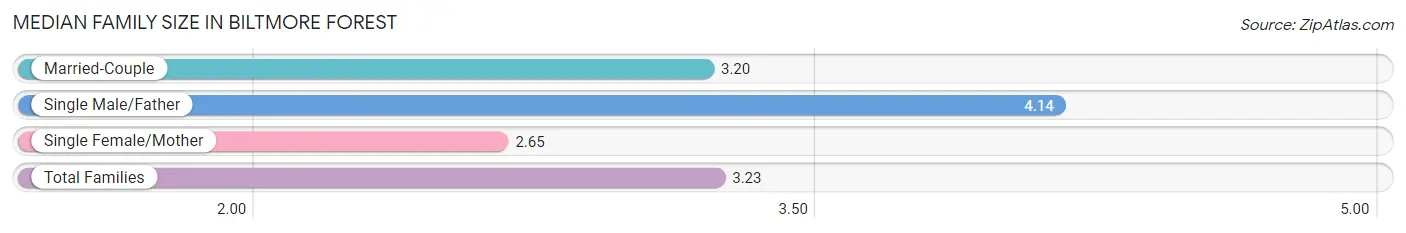
| Family Type | # Families | Family Size |
| Married-Couple | 445 (90.8%) | 3.20 |
| Single Male/Father | 28 (5.7%) | 4.14 |
| Single Female/Mother | 17 (3.5%) | 2.65 |
| Total Families | 490 (100.0%) | 3.23 |
Median Household Size in Biltmore Forest
The median household size in Biltmore Forest is 2.89 persons per household, with single male/father households (28 | 4.8%) accounting for the largest median household size of 4.14 persons per household. non-family households (98 | 16.7%) represent the smallest median household size with 1.07 persons per household.
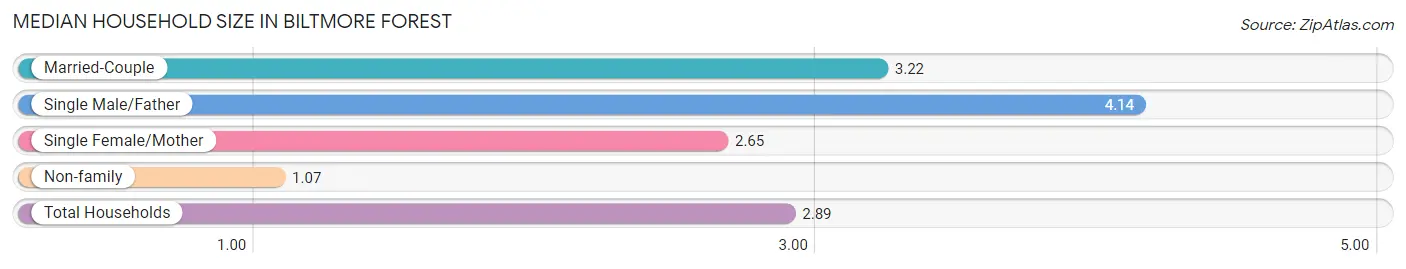
| Household Type | # Households | Household Size |
| Married-Couple | 445 (75.7%) | 3.22 |
| Single Male/Father | 28 (4.8%) | 4.14 |
| Single Female/Mother | 17 (2.9%) | 2.65 |
| Non-family | 98 (16.7%) | 1.07 |
| Total Households | 588 (100.0%) | 2.89 |
Household Size by Marriage Status in Biltmore Forest
Out of a total of 588 households in Biltmore Forest, 490 (83.3%) are family households, while 98 (16.7%) are nonfamily households. The most numerous type of family households are 2-person households, comprising 284, and the most common type of nonfamily households are 1-person households, comprising 92.
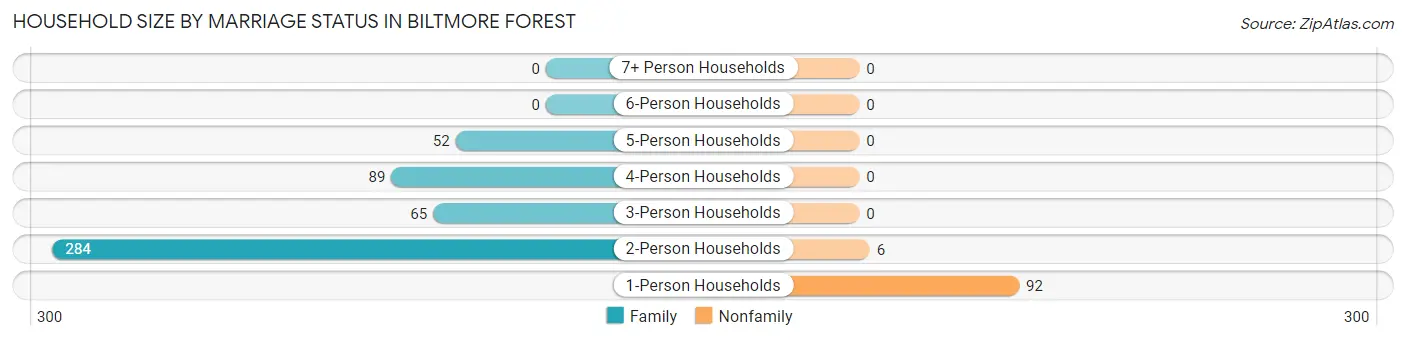
| Household Size | Family Households | Nonfamily Households |
| 1-Person Households | - | 92 (15.7%) |
| 2-Person Households | 284 (48.3%) | 6 (1.0%) |
| 3-Person Households | 65 (11.1%) | 0 (0.0%) |
| 4-Person Households | 89 (15.1%) | 0 (0.0%) |
| 5-Person Households | 52 (8.8%) | 0 (0.0%) |
| 6-Person Households | 0 (0.0%) | 0 (0.0%) |
| 7+ Person Households | 0 (0.0%) | 0 (0.0%) |
| Total | 490 (83.3%) | 98 (16.7%) |
Female Fertility in Biltmore Forest
Fertility by Age in Biltmore Forest
| Age Bracket | Women with Births | Births / 1,000 Women |
| 15 to 19 years | 0 (0.0%) | 0.0 |
| 20 to 34 years | 0 (0.0%) | 0.0 |
| 35 to 50 years | 0 (0.0%) | 0.0 |
| Total | 0 (0.0%) | 0.0 |
Fertility by Age by Marriage Status in Biltmore Forest
| Age Bracket | Married | Unmarried |
| 15 to 19 years | 0 (0.0%) | 0 (0.0%) |
| 20 to 34 years | 0 (0.0%) | 0 (0.0%) |
| 35 to 50 years | 0 (0.0%) | 0 (0.0%) |
| Total | 0 (0.0%) | 0 (0.0%) |
Fertility by Education in Biltmore Forest
| Educational Attainment | Women with Births | Births / 1,000 Women |
| Less than High School | 0 (0.0%) | 0.0 |
| High School Diploma | 0 (0.0%) | 0.0 |
| College or Associate's Degree | 0 (0.0%) | 0.0 |
| Bachelor's Degree | 0 (0.0%) | 0.0 |
| Graduate Degree | 0 (0.0%) | 0.0 |
| Total | 0 (0.0%) | 0.0 |
Fertility by Education by Marriage Status in Biltmore Forest
| Educational Attainment | Married | Unmarried |
| Less than High School | 0 (0.0%) | 0 (0.0%) |
| High School Diploma | 0 (0.0%) | 0 (0.0%) |
| College or Associate's Degree | 0 (0.0%) | 0 (0.0%) |
| Bachelor's Degree | 0 (0.0%) | 0 (0.0%) |
| Graduate Degree | 0 (0.0%) | 0 (0.0%) |
| Total | 0 (0.0%) | 0 (0.0%) |
Income in Biltmore Forest
Income Overview in Biltmore Forest
Per Capita Income in Biltmore Forest is $117,858, while median incomes of families and households are $210,833 and $174,286 respectively.
| Characteristic | Number | Measure |
| Per Capita Income | 1,700 | $117,858 |
| Median Family Income | 490 | $210,833 |
| Mean Family Income | 490 | $375,359 |
| Median Household Income | 588 | $174,286 |
| Mean Household Income | 588 | $331,074 |
| Income Deficit | 490 | $12,431 |
| Wage / Income Gap (%) | 1,700 | 29.88% |
| Wage / Income Gap ($) | 1,700 | 70.12¢ per $1 |
| Gini / Inequality Index | 1,700 | 0.56 |
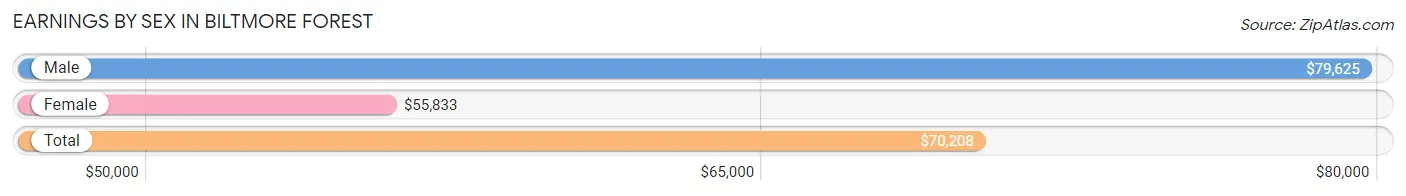
Earnings by Sex in Biltmore Forest
Average Earnings in Biltmore Forest are $70,208, $79,625 for men and $55,833 for women, a difference of 29.9%.
| Sex | Number | Average Earnings |
| Male | 487 (65.7%) | $79,625 |
| Female | 254 (34.3%) | $55,833 |
| Total | 741 (100.0%) | $70,208 |
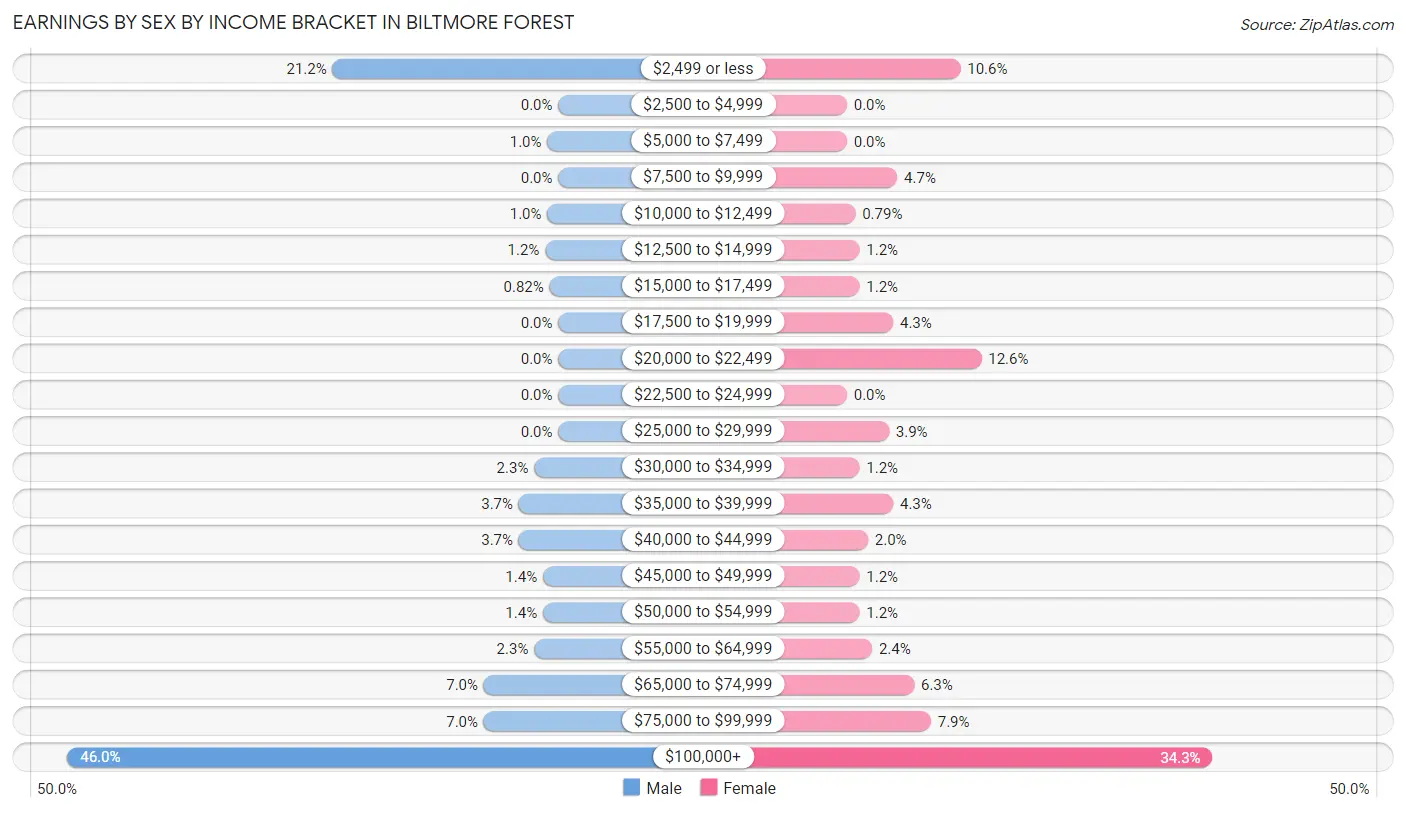
Earnings by Sex by Income Bracket in Biltmore Forest
The most common earnings brackets in Biltmore Forest are $100,000+ for men (224 | 46.0%) and $100,000+ for women (87 | 34.3%).
| Income | Male | Female |
| $2,499 or less | 103 (21.1%) | 27 (10.6%) |
| $2,500 to $4,999 | 0 (0.0%) | 0 (0.0%) |
| $5,000 to $7,499 | 5 (1.0%) | 0 (0.0%) |
| $7,500 to $9,999 | 0 (0.0%) | 12 (4.7%) |
| $10,000 to $12,499 | 5 (1.0%) | 2 (0.8%) |
| $12,500 to $14,999 | 6 (1.2%) | 3 (1.2%) |
| $15,000 to $17,499 | 4 (0.8%) | 3 (1.2%) |
| $17,500 to $19,999 | 0 (0.0%) | 11 (4.3%) |
| $20,000 to $22,499 | 0 (0.0%) | 32 (12.6%) |
| $22,500 to $24,999 | 0 (0.0%) | 0 (0.0%) |
| $25,000 to $29,999 | 0 (0.0%) | 10 (3.9%) |
| $30,000 to $34,999 | 11 (2.3%) | 3 (1.2%) |
| $35,000 to $39,999 | 18 (3.7%) | 11 (4.3%) |
| $40,000 to $44,999 | 18 (3.7%) | 5 (2.0%) |
| $45,000 to $49,999 | 7 (1.4%) | 3 (1.2%) |
| $50,000 to $54,999 | 7 (1.4%) | 3 (1.2%) |
| $55,000 to $64,999 | 11 (2.3%) | 6 (2.4%) |
| $65,000 to $74,999 | 34 (7.0%) | 16 (6.3%) |
| $75,000 to $99,999 | 34 (7.0%) | 20 (7.9%) |
| $100,000+ | 224 (46.0%) | 87 (34.3%) |
| Total | 487 (100.0%) | 254 (100.0%) |
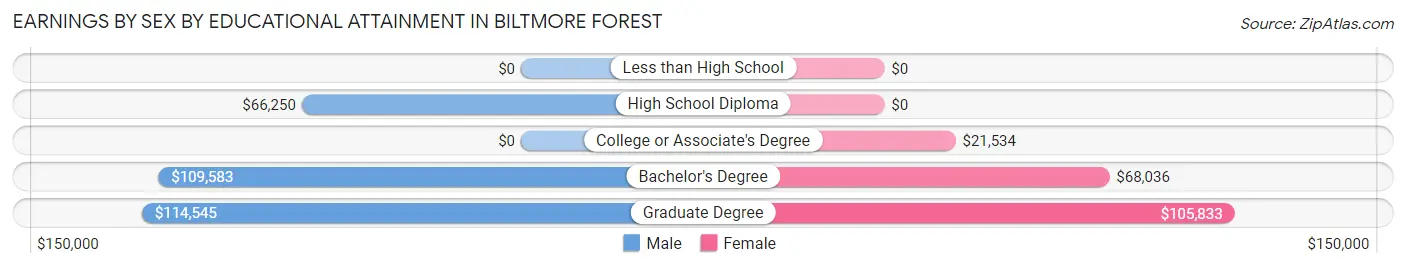
Earnings by Sex by Educational Attainment in Biltmore Forest
Average earnings in Biltmore Forest are $107,917 for men and $66,806 for women, a difference of 38.1%. Men with an educational attainment of graduate degree enjoy the highest average annual earnings of $114,545, while those with high school diploma education earn the least with $66,250. Women with an educational attainment of graduate degree earn the most with the average annual earnings of $105,833, while those with college or associate's degree education have the smallest earnings of $21,534.
| Educational Attainment | Male Income | Female Income |
| Less than High School | - | - |
| High School Diploma | $66,250 | $0 |
| College or Associate's Degree | - | - |
| Bachelor's Degree | $109,583 | $68,036 |
| Graduate Degree | $114,545 | $105,833 |
| Total | $107,917 | $66,806 |
Family Income in Biltmore Forest
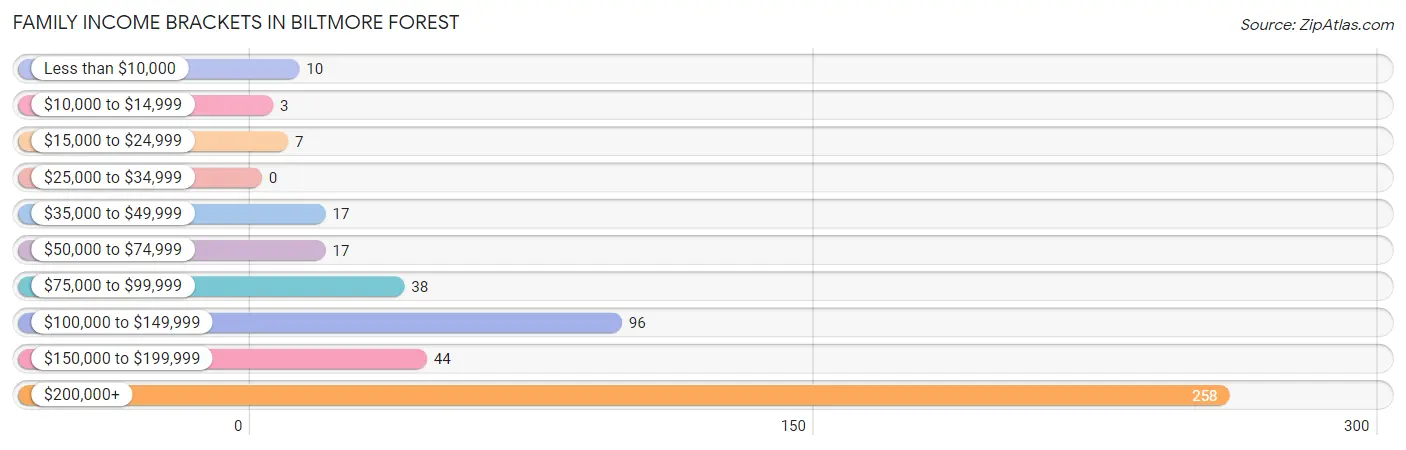
Family Income Brackets in Biltmore Forest
According to the Biltmore Forest family income data, there are 258 families falling into the $200,000+ income range, which is the most common income bracket and makes up 52.6% of all families.
| Income Bracket | # Families | % Families |
| Less than $10,000 | 10 | 2.0% |
| $10,000 to $14,999 | 3 | 0.6% |
| $15,000 to $24,999 | 7 | 1.4% |
| $25,000 to $34,999 | 0 | 0.0% |
| $35,000 to $49,999 | 17 | 3.5% |
| $50,000 to $74,999 | 17 | 3.5% |
| $75,000 to $99,999 | 38 | 7.8% |
| $100,000 to $149,999 | 96 | 19.6% |
| $150,000 to $199,999 | 44 | 9.0% |
| $200,000+ | 258 | 52.7% |
Family Income by Famaliy Size in Biltmore Forest
4-person families (87 | 17.8%) account for the highest median family income in Biltmore Forest with $250,001 per family, while 2-person families (286 | 58.4%) have the highest median income of $95,416 per family member.
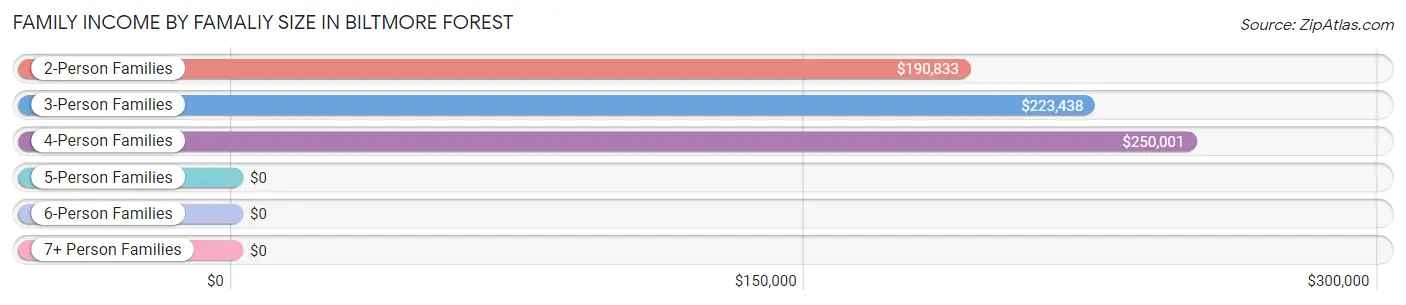
| Income Bracket | # Families | Median Income |
| 2-Person Families | 286 (58.4%) | $190,833 |
| 3-Person Families | 65 (13.3%) | $223,438 |
| 4-Person Families | 87 (17.8%) | $250,001 |
| 5-Person Families | 52 (10.6%) | $0 |
| 6-Person Families | 0 (0.0%) | $0 |
| 7+ Person Families | 0 (0.0%) | $0 |
| Total | 490 (100.0%) | $210,833 |
Family Income by Number of Earners in Biltmore Forest
The median family income in Biltmore Forest is $210,833, with families comprising 2 earners (211) having the highest median family income of $250,001, while families with no earners (143) have the lowest median family income of $147,361, accounting for 43.1% and 29.2% of families, respectively.
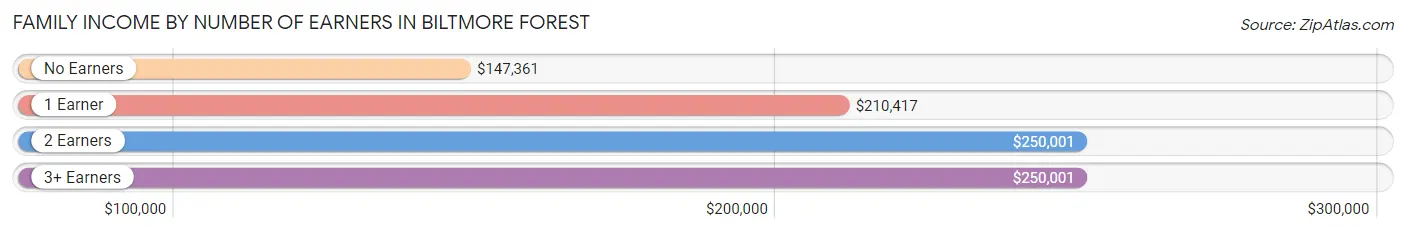
| Number of Earners | # Families | Median Income |
| No Earners | 143 (29.2%) | $147,361 |
| 1 Earner | 121 (24.7%) | $210,417 |
| 2 Earners | 211 (43.1%) | $250,001 |
| 3+ Earners | 15 (3.1%) | $250,001 |
| Total | 490 (100.0%) | $210,833 |
Household Income in Biltmore Forest
Household Income Brackets in Biltmore Forest
With 272 households falling in the category, the $200,000+ income range is the most frequent in Biltmore Forest, accounting for 46.3% of all households. In contrast, only 3 households (0.5%) fall into the $10,000 to $14,999 income bracket, making it the least populous group.
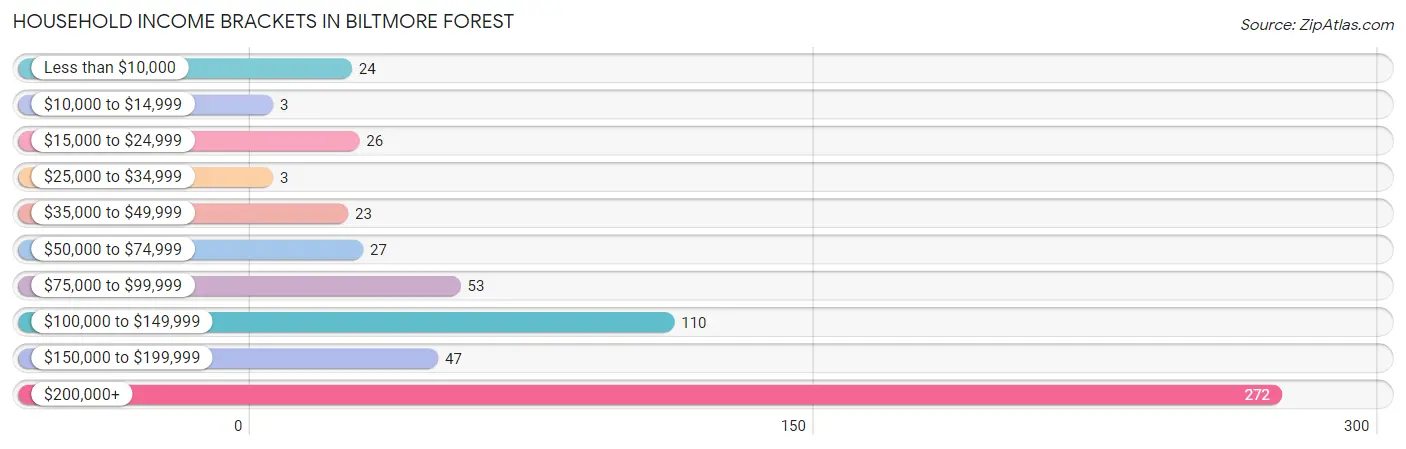
| Income Bracket | # Households | % Households |
| Less than $10,000 | 24 | 4.1% |
| $10,000 to $14,999 | 3 | 0.5% |
| $15,000 to $24,999 | 26 | 4.4% |
| $25,000 to $34,999 | 3 | 0.5% |
| $35,000 to $49,999 | 23 | 3.9% |
| $50,000 to $74,999 | 27 | 4.6% |
| $75,000 to $99,999 | 53 | 9.0% |
| $100,000 to $149,999 | 110 | 18.7% |
| $150,000 to $199,999 | 47 | 8.0% |
| $200,000+ | 272 | 46.3% |
Household Income by Householder Age in Biltmore Forest
The median household income in Biltmore Forest is $174,286, with the highest median household income of $250,001 found in the 25 to 44 years age bracket for the primary householder. A total of 87 households (14.8%) fall into this category. Meanwhile, the 15 to 24 years age bracket for the primary householder has the lowest median household income of $0, with 5 households (0.9%) in this group.

| Income Bracket | # Households | Median Income |
| 15 to 24 Years | 5 (0.9%) | $0 |
| 25 to 44 Years | 87 (14.8%) | $250,001 |
| 45 to 64 Years | 224 (38.1%) | $185,000 |
| 65+ Years | 272 (46.3%) | $148,750 |
| Total | 588 (100.0%) | $174,286 |
Poverty in Biltmore Forest
Income Below Poverty by Sex and Age in Biltmore Forest
With 1.1% poverty level for males and 4.8% for females among the residents of Biltmore Forest, 12 to 14 year old males and 25 to 34 year old females are the most vulnerable to poverty, with 4 males (9.5%) and 11 females (34.4%) in their respective age groups living below the poverty level.
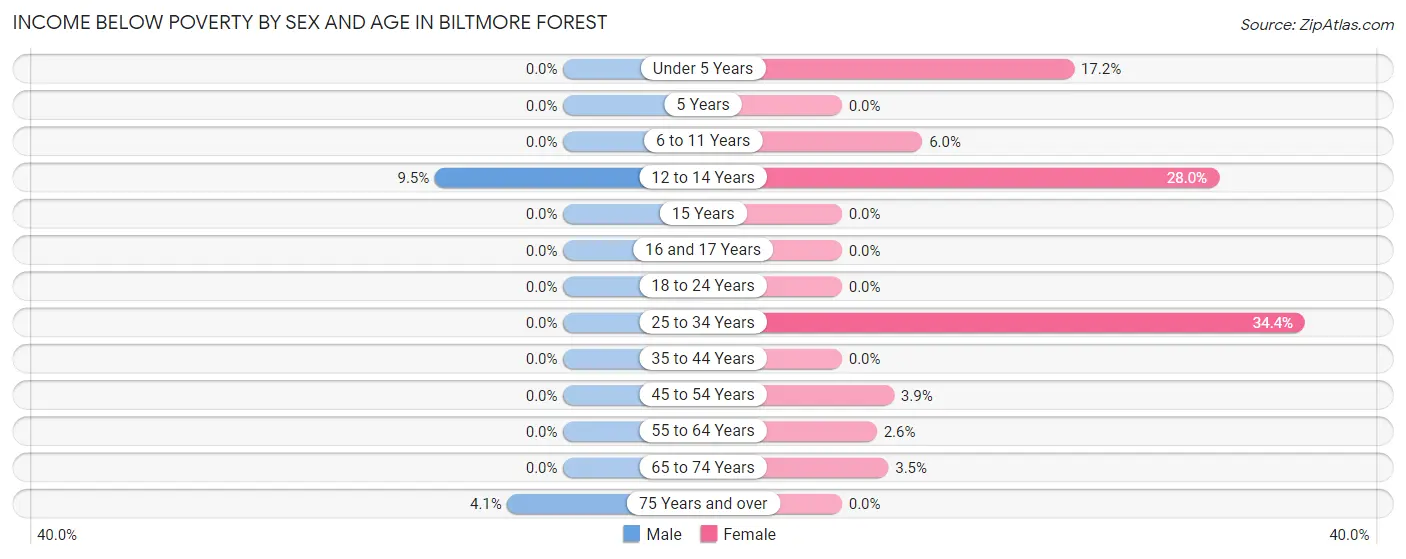
| Age Bracket | Male | Female |
| Under 5 Years | 0 (0.0%) | 5 (17.2%) |
| 5 Years | 0 (0.0%) | 0 (0.0%) |
| 6 to 11 Years | 0 (0.0%) | 4 (6.0%) |
| 12 to 14 Years | 4 (9.5%) | 7 (28.0%) |
| 15 Years | 0 (0.0%) | 0 (0.0%) |
| 16 and 17 Years | 0 (0.0%) | 0 (0.0%) |
| 18 to 24 Years | 0 (0.0%) | 0 (0.0%) |
| 25 to 34 Years | 0 (0.0%) | 11 (34.4%) |
| 35 to 44 Years | 0 (0.0%) | 0 (0.0%) |
| 45 to 54 Years | 0 (0.0%) | 6 (3.9%) |
| 55 to 64 Years | 0 (0.0%) | 3 (2.6%) |
| 65 to 74 Years | 0 (0.0%) | 4 (3.5%) |
| 75 Years and over | 6 (4.1%) | 0 (0.0%) |
| Total | 10 (1.1%) | 40 (4.8%) |
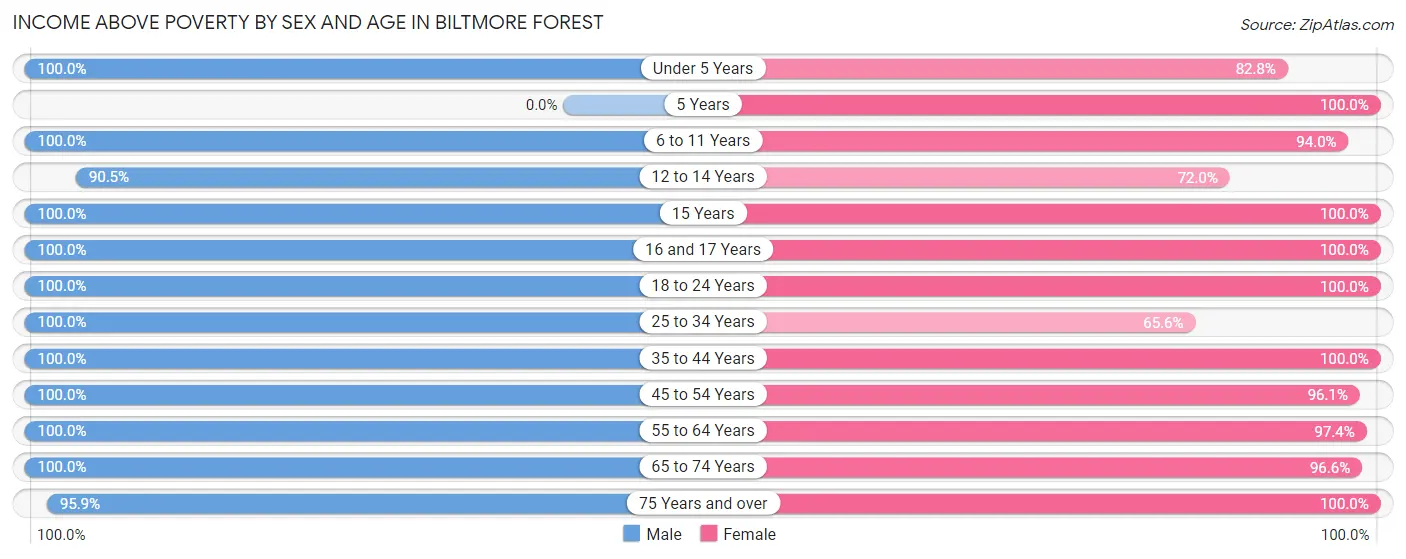
Income Above Poverty by Sex and Age in Biltmore Forest
According to the poverty statistics in Biltmore Forest, males aged under 5 years and females aged 5 years are the age groups that are most secure financially, with 100.0% of males and 100.0% of females in these age groups living above the poverty line.
| Age Bracket | Male | Female |
| Under 5 Years | 49 (100.0%) | 24 (82.8%) |
| 5 Years | 0 (0.0%) | 9 (100.0%) |
| 6 to 11 Years | 54 (100.0%) | 63 (94.0%) |
| 12 to 14 Years | 38 (90.5%) | 18 (72.0%) |
| 15 Years | 9 (100.0%) | 55 (100.0%) |
| 16 and 17 Years | 7 (100.0%) | 53 (100.0%) |
| 18 to 24 Years | 108 (100.0%) | 31 (100.0%) |
| 25 to 34 Years | 25 (100.0%) | 21 (65.6%) |
| 35 to 44 Years | 68 (100.0%) | 65 (100.0%) |
| 45 to 54 Years | 140 (100.0%) | 149 (96.1%) |
| 55 to 64 Years | 115 (100.0%) | 113 (97.4%) |
| 65 to 74 Years | 104 (100.0%) | 112 (96.6%) |
| 75 Years and over | 139 (95.9%) | 81 (100.0%) |
| Total | 856 (98.9%) | 794 (95.2%) |
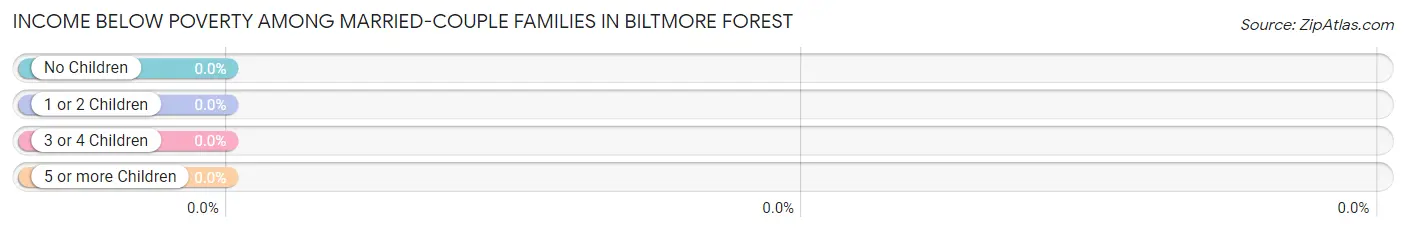
Income Below Poverty Among Married-Couple Families in Biltmore Forest
| Children | Above Poverty | Below Poverty |
| No Children | 280 (100.0%) | 0 (0.0%) |
| 1 or 2 Children | 147 (100.0%) | 0 (0.0%) |
| 3 or 4 Children | 18 (100.0%) | 0 (0.0%) |
| 5 or more Children | 0 (0.0%) | 0 (0.0%) |
| Total | 445 (100.0%) | 0 (0.0%) |
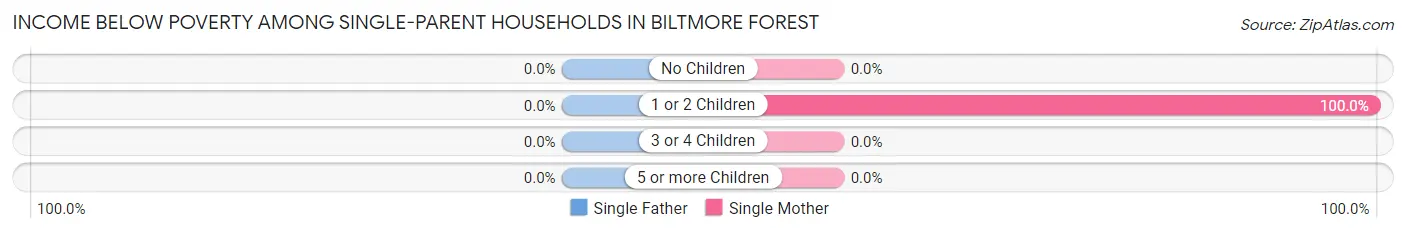
Income Below Poverty Among Single-Parent Households in Biltmore Forest
| Children | Single Father | Single Mother |
| No Children | 0 (0.0%) | 0 (0.0%) |
| 1 or 2 Children | 0 (0.0%) | 13 (100.0%) |
| 3 or 4 Children | 0 (0.0%) | 0 (0.0%) |
| 5 or more Children | 0 (0.0%) | 0 (0.0%) |
| Total | 0 (0.0%) | 13 (76.5%) |
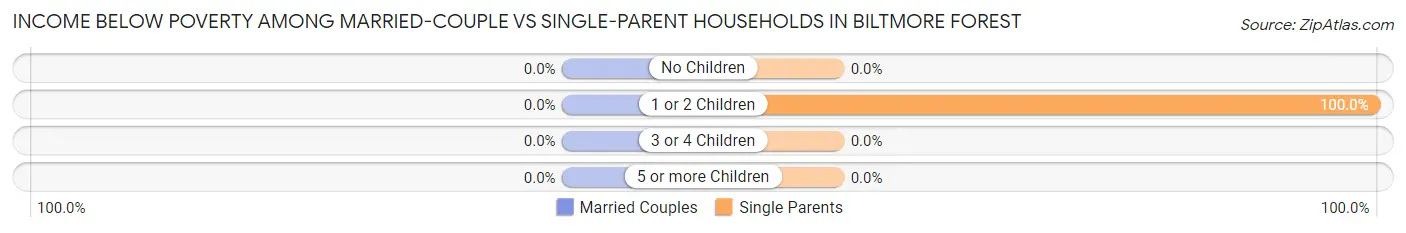
Income Below Poverty Among Married-Couple vs Single-Parent Households in Biltmore Forest
| Children | Married-Couple Families | Single-Parent Households |
| No Children | 0 (0.0%) | 0 (0.0%) |
| 1 or 2 Children | 0 (0.0%) | 13 (100.0%) |
| 3 or 4 Children | 0 (0.0%) | 0 (0.0%) |
| 5 or more Children | 0 (0.0%) | 0 (0.0%) |
| Total | 0 (0.0%) | 13 (28.9%) |
Employment Characteristics in Biltmore Forest
Employment by Class of Employer in Biltmore Forest
Among the 667 employed individuals in Biltmore Forest, private company employees (440 | 66.0%), self-employed (incorporated) (96 | 14.4%), and self-employed (not incorporated) (65 | 9.8%) make up the most common classes of employment.
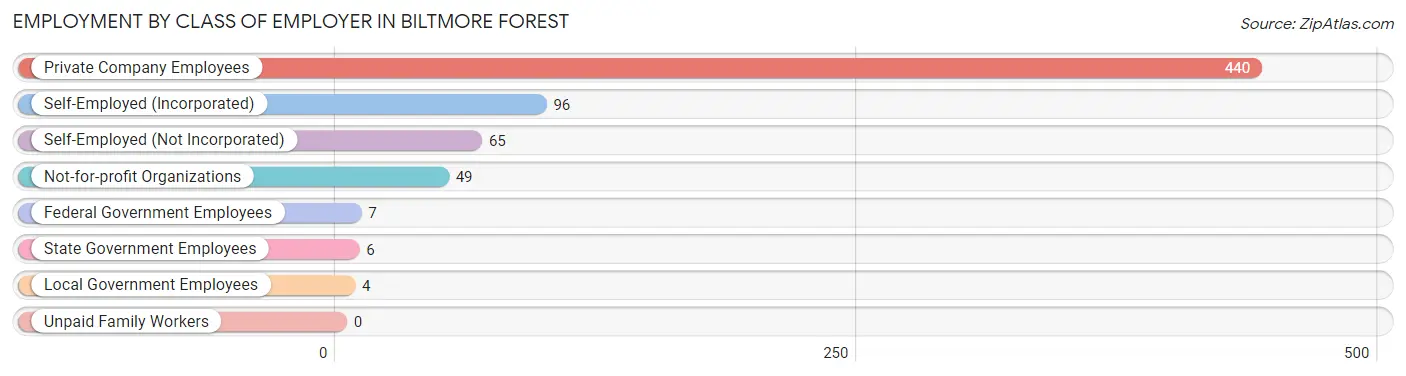
| Employer Class | # Employees | % Employees |
| Private Company Employees | 440 | 66.0% |
| Self-Employed (Incorporated) | 96 | 14.4% |
| Self-Employed (Not Incorporated) | 65 | 9.8% |
| Not-for-profit Organizations | 49 | 7.3% |
| Local Government Employees | 4 | 0.6% |
| State Government Employees | 6 | 0.9% |
| Federal Government Employees | 7 | 1.1% |
| Unpaid Family Workers | 0 | 0.0% |
| Total | 667 | 100.0% |
Employment Status by Age in Biltmore Forest
According to the labor force statistics for Biltmore Forest, out of the total population over 16 years of age (1,361), 51.0% or 694 individuals are in the labor force, with 2.4% or 17 of them unemployed. The age group with the highest labor force participation rate is 25 to 29 years, with 100.0% or 17 individuals in the labor force. Within the labor force, the 20 to 24 years age range has the highest percentage of unemployed individuals, with 17.9% or 5 of them being unemployed.
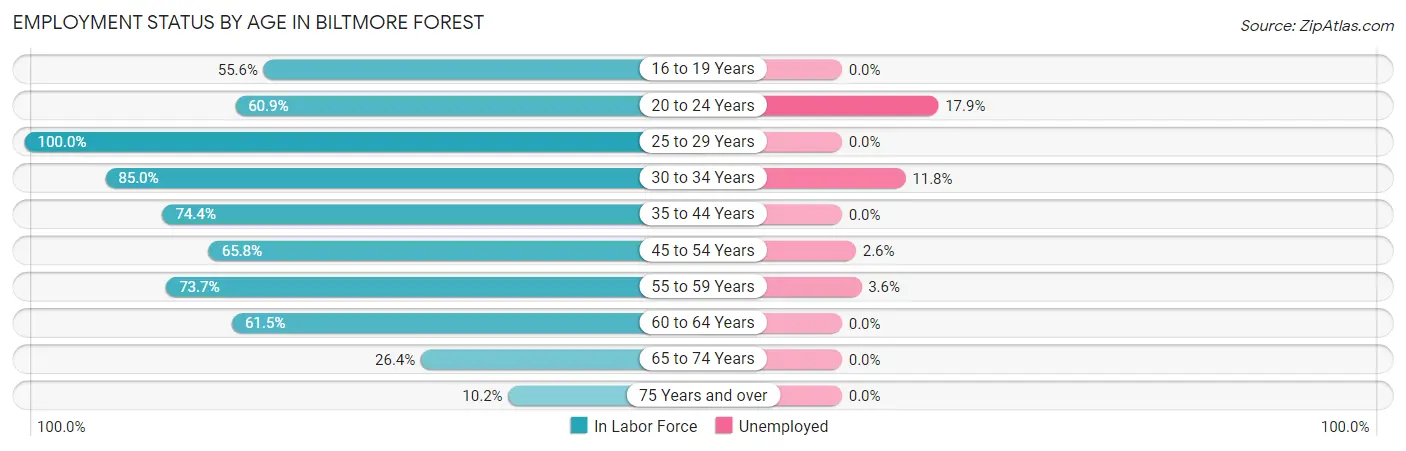
| Age Bracket | In Labor Force | Unemployed |
| 16 to 19 Years | 85 (55.6%) | 0 (0.0%) |
| 20 to 24 Years | 28 (60.9%) | 5 (17.9%) |
| 25 to 29 Years | 17 (100.0%) | 0 (0.0%) |
| 30 to 34 Years | 34 (85.0%) | 4 (11.8%) |
| 35 to 44 Years | 99 (74.4%) | 0 (0.0%) |
| 45 to 54 Years | 194 (65.8%) | 5 (2.6%) |
| 55 to 59 Years | 84 (73.7%) | 3 (3.6%) |
| 60 to 64 Years | 72 (61.5%) | 0 (0.0%) |
| 65 to 74 Years | 58 (26.4%) | 0 (0.0%) |
| 75 Years and over | 23 (10.2%) | 0 (0.0%) |
| Total | 694 (51.0%) | 17 (2.4%) |
Employment Status by Educational Attainment in Biltmore Forest
According to labor force statistics for Biltmore Forest, 69.8% of individuals (500) out of the total population between 25 and 64 years of age (716) are in the labor force, with 2.4% or 12 of them being unemployed. The group with the highest labor force participation rate are those with the educational attainment of high school diploma, with 100.0% or 28 individuals in the labor force. Within the labor force, individuals with college / associate degree education have the highest percentage of unemployment, with 4.3% or 3 of them being unemployed.
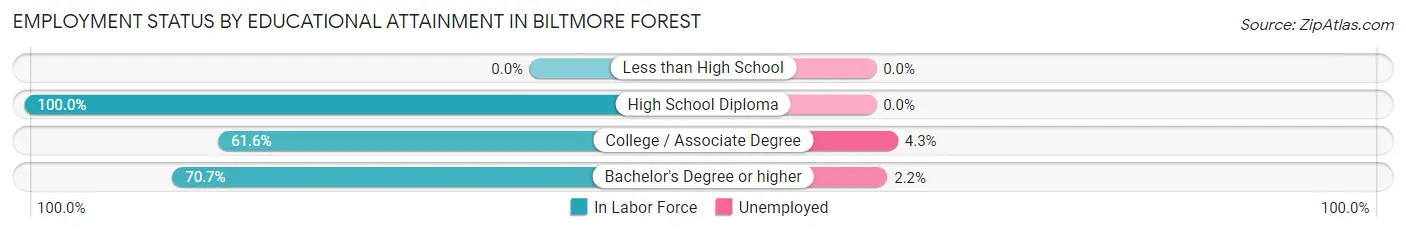
| Educational Attainment | In Labor Force | Unemployed |
| Less than High School | 0 (0.0%) | 0 (0.0%) |
| High School Diploma | 28 (100.0%) | 0 (0.0%) |
| College / Associate Degree | 69 (61.6%) | 5 (4.3%) |
| Bachelor's Degree or higher | 403 (70.7%) | 13 (2.2%) |
| Total | 500 (69.8%) | 17 (2.4%) |
Employment Occupations by Sex in Biltmore Forest
Management, Business, Science and Arts Occupations
The most common Management, Business, Science and Arts occupations in Biltmore Forest are Health Diagnosing & Treating (179 | 26.4%), Health Technologists (179 | 26.4%), Management (101 | 14.9%), Community & Social Service (81 | 12.0%), and Business & Financial (38 | 5.6%).
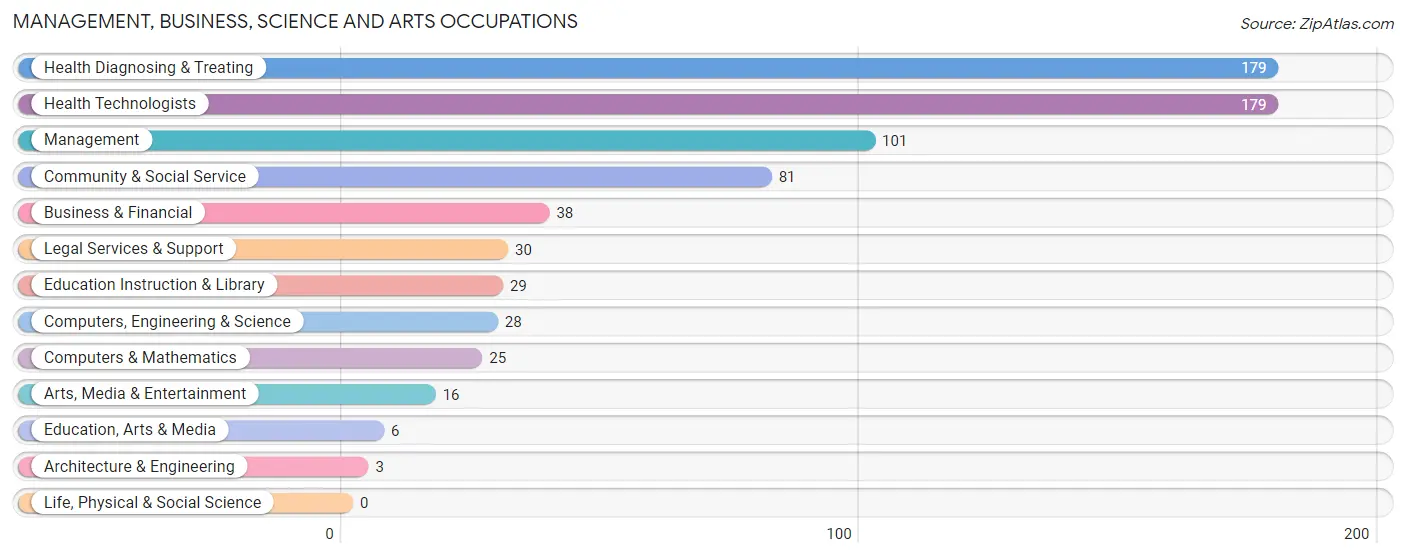
Management, Business, Science and Arts Occupations by Sex
Within the Management, Business, Science and Arts occupations in Biltmore Forest, the most male-oriented occupations are Architecture & Engineering (100.0%), Computers, Engineering & Science (85.7%), and Business & Financial (84.2%), while the most female-oriented occupations are Education, Arts & Media (100.0%), Arts, Media & Entertainment (81.2%), and Community & Social Service (55.6%).
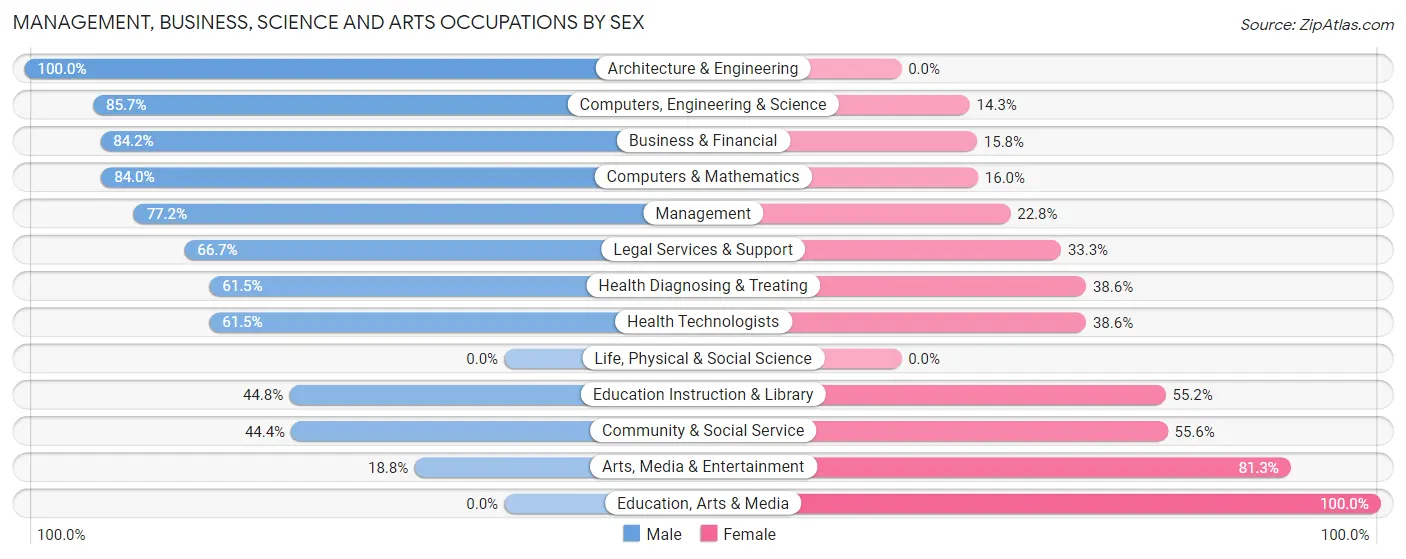
| Occupation | Male | Female |
| Management | 78 (77.2%) | 23 (22.8%) |
| Business & Financial | 32 (84.2%) | 6 (15.8%) |
| Computers, Engineering & Science | 24 (85.7%) | 4 (14.3%) |
| Computers & Mathematics | 21 (84.0%) | 4 (16.0%) |
| Architecture & Engineering | 3 (100.0%) | 0 (0.0%) |
| Life, Physical & Social Science | 0 (0.0%) | 0 (0.0%) |
| Community & Social Service | 36 (44.4%) | 45 (55.6%) |
| Education, Arts & Media | 0 (0.0%) | 6 (100.0%) |
| Legal Services & Support | 20 (66.7%) | 10 (33.3%) |
| Education Instruction & Library | 13 (44.8%) | 16 (55.2%) |
| Arts, Media & Entertainment | 3 (18.8%) | 13 (81.2%) |
| Health Diagnosing & Treating | 110 (61.5%) | 69 (38.6%) |
| Health Technologists | 110 (61.5%) | 69 (38.6%) |
| Total (Category) | 280 (65.6%) | 147 (34.4%) |
| Total (Overall) | 457 (67.5%) | 220 (32.5%) |
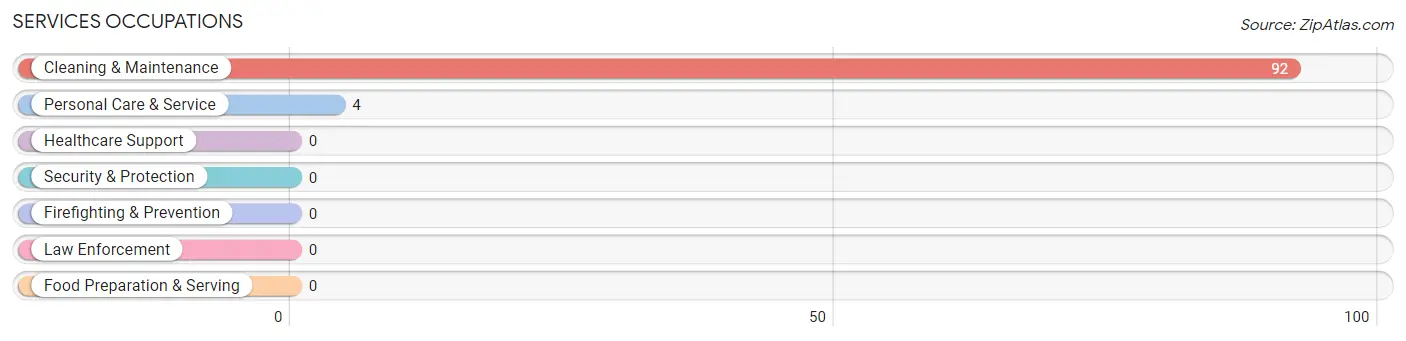
Services Occupations
The most common Services occupations in Biltmore Forest are Cleaning & Maintenance (92 | 13.6%), and Personal Care & Service (4 | 0.6%).
Services Occupations by Sex
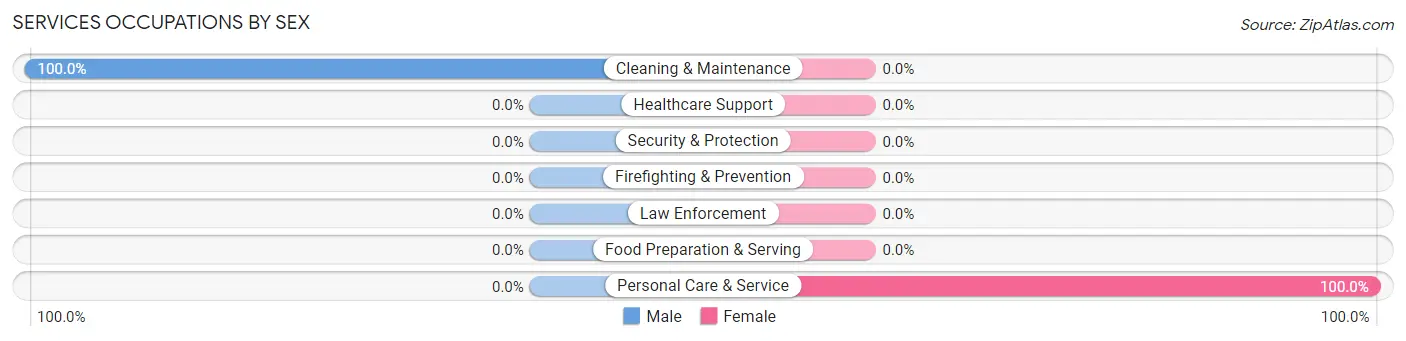
| Occupation | Male | Female |
| Healthcare Support | 0 (0.0%) | 0 (0.0%) |
| Security & Protection | 0 (0.0%) | 0 (0.0%) |
| Firefighting & Prevention | 0 (0.0%) | 0 (0.0%) |
| Law Enforcement | 0 (0.0%) | 0 (0.0%) |
| Food Preparation & Serving | 0 (0.0%) | 0 (0.0%) |
| Cleaning & Maintenance | 92 (100.0%) | 0 (0.0%) |
| Personal Care & Service | 0 (0.0%) | 4 (100.0%) |
| Total (Category) | 92 (95.8%) | 4 (4.2%) |
| Total (Overall) | 457 (67.5%) | 220 (32.5%) |
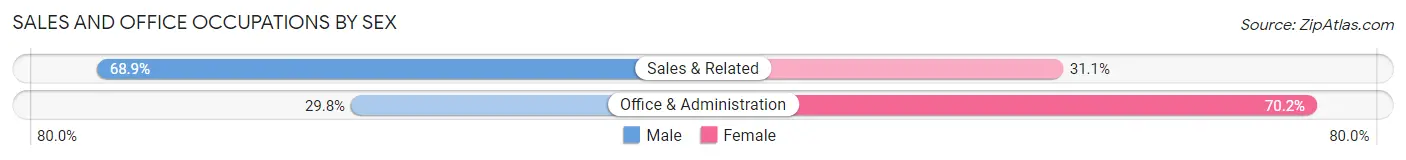
Sales and Office Occupations
The most common Sales and Office occupations in Biltmore Forest are Office & Administration (47 | 6.9%), and Sales & Related (45 | 6.7%).
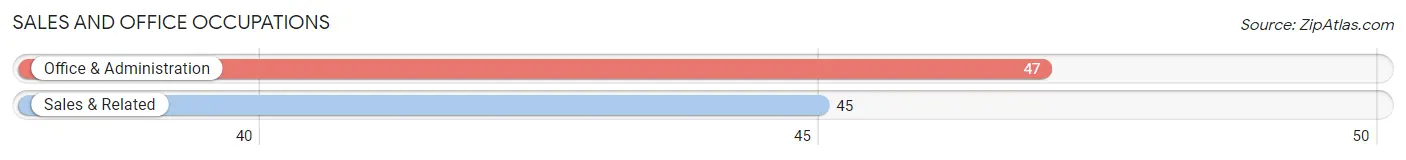
Sales and Office Occupations by Sex
| Occupation | Male | Female |
| Sales & Related | 31 (68.9%) | 14 (31.1%) |
| Office & Administration | 14 (29.8%) | 33 (70.2%) |
| Total (Category) | 45 (48.9%) | 47 (51.1%) |
| Total (Overall) | 457 (67.5%) | 220 (32.5%) |
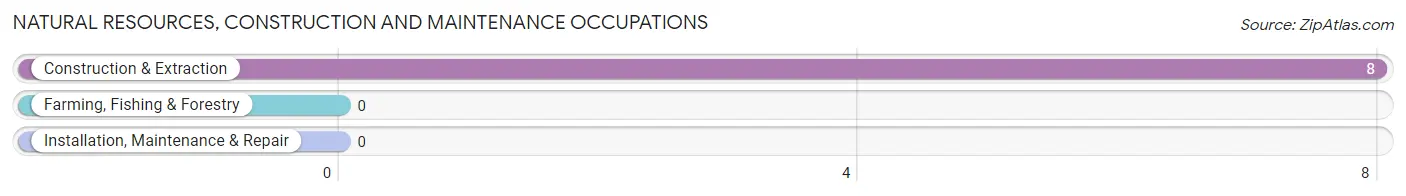
Natural Resources, Construction and Maintenance Occupations
The most common Natural Resources, Construction and Maintenance occupations in Biltmore Forest are , and Construction & Extraction (8 | 1.2%).
Natural Resources, Construction and Maintenance Occupations by Sex
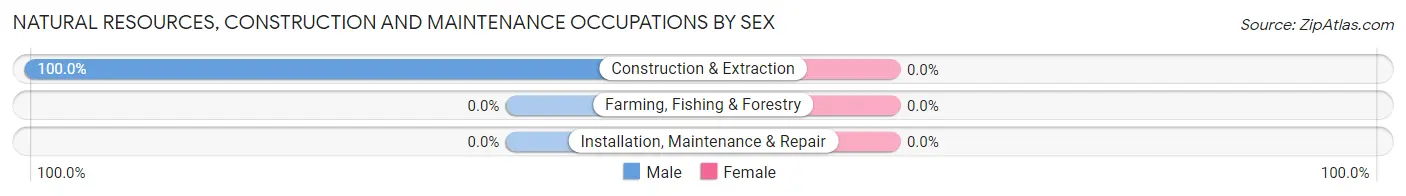
| Occupation | Male | Female |
| Farming, Fishing & Forestry | 0 (0.0%) | 0 (0.0%) |
| Construction & Extraction | 8 (100.0%) | 0 (0.0%) |
| Installation, Maintenance & Repair | 0 (0.0%) | 0 (0.0%) |
| Total (Category) | 8 (100.0%) | 0 (0.0%) |
| Total (Overall) | 457 (67.5%) | 220 (32.5%) |
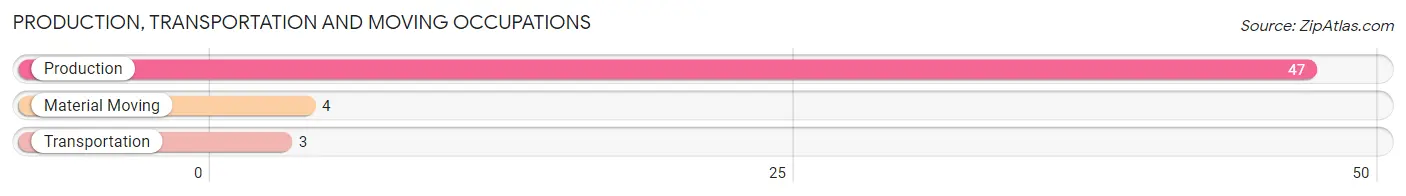
Production, Transportation and Moving Occupations
The most common Production, Transportation and Moving occupations in Biltmore Forest are Production (47 | 6.9%), Material Moving (4 | 0.6%), and Transportation (3 | 0.4%).
Production, Transportation and Moving Occupations by Sex
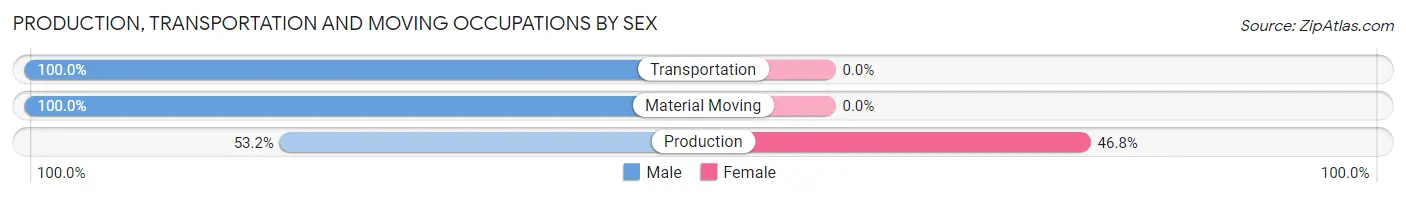
| Occupation | Male | Female |
| Production | 25 (53.2%) | 22 (46.8%) |
| Transportation | 3 (100.0%) | 0 (0.0%) |
| Material Moving | 4 (100.0%) | 0 (0.0%) |
| Total (Category) | 32 (59.3%) | 22 (40.7%) |
| Total (Overall) | 457 (67.5%) | 220 (32.5%) |
Employment Industries by Sex in Biltmore Forest
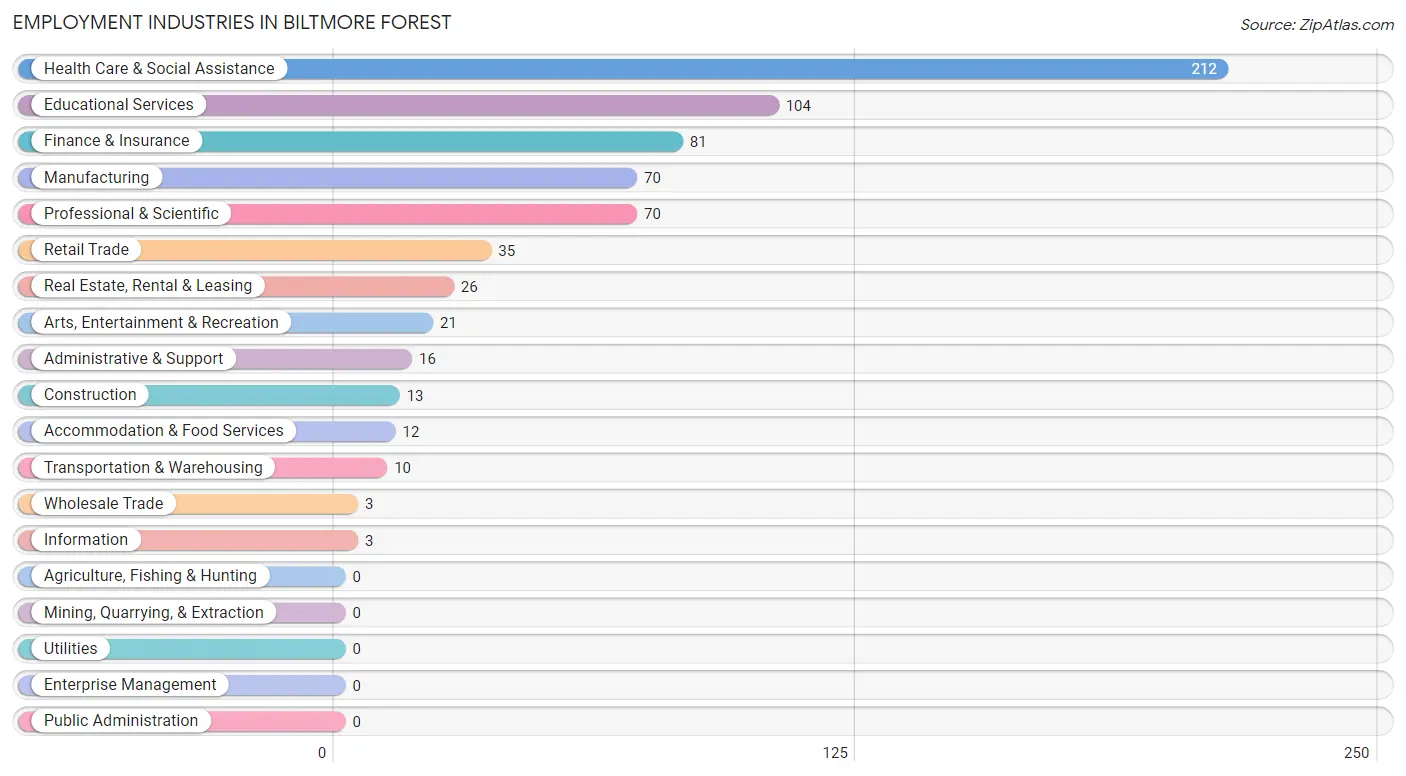
Employment Industries in Biltmore Forest
The major employment industries in Biltmore Forest include Health Care & Social Assistance (212 | 31.3%), Educational Services (104 | 15.4%), Finance & Insurance (81 | 12.0%), Manufacturing (70 | 10.3%), and Professional & Scientific (70 | 10.3%).
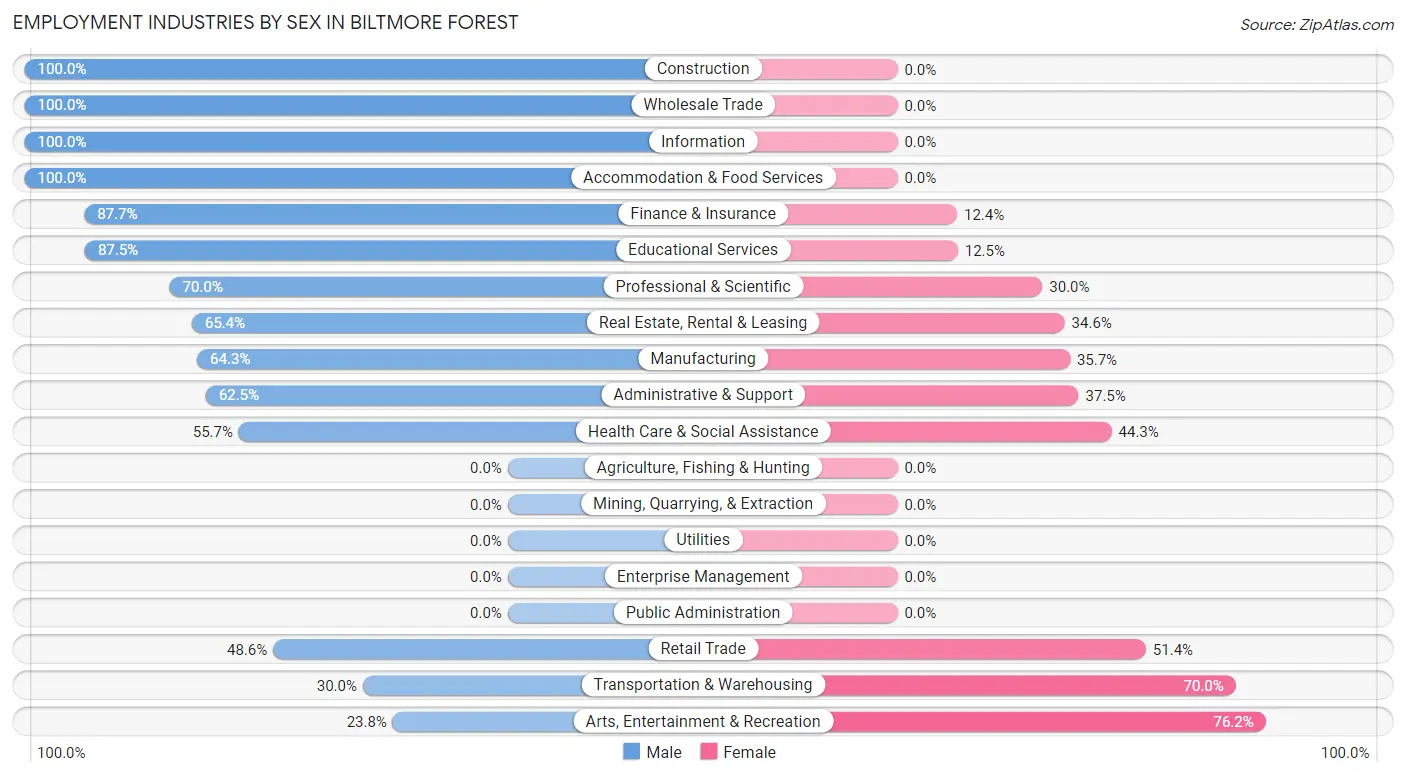
Employment Industries by Sex in Biltmore Forest
The Biltmore Forest industries that see more men than women are Construction (100.0%), Wholesale Trade (100.0%), and Information (100.0%), whereas the industries that tend to have a higher number of women are Arts, Entertainment & Recreation (76.2%), Transportation & Warehousing (70.0%), and Retail Trade (51.4%).
| Industry | Male | Female |
| Agriculture, Fishing & Hunting | 0 (0.0%) | 0 (0.0%) |
| Mining, Quarrying, & Extraction | 0 (0.0%) | 0 (0.0%) |
| Construction | 13 (100.0%) | 0 (0.0%) |
| Manufacturing | 45 (64.3%) | 25 (35.7%) |
| Wholesale Trade | 3 (100.0%) | 0 (0.0%) |
| Retail Trade | 17 (48.6%) | 18 (51.4%) |
| Transportation & Warehousing | 3 (30.0%) | 7 (70.0%) |
| Utilities | 0 (0.0%) | 0 (0.0%) |
| Information | 3 (100.0%) | 0 (0.0%) |
| Finance & Insurance | 71 (87.6%) | 10 (12.3%) |
| Real Estate, Rental & Leasing | 17 (65.4%) | 9 (34.6%) |
| Professional & Scientific | 49 (70.0%) | 21 (30.0%) |
| Enterprise Management | 0 (0.0%) | 0 (0.0%) |
| Administrative & Support | 10 (62.5%) | 6 (37.5%) |
| Educational Services | 91 (87.5%) | 13 (12.5%) |
| Health Care & Social Assistance | 118 (55.7%) | 94 (44.3%) |
| Arts, Entertainment & Recreation | 5 (23.8%) | 16 (76.2%) |
| Accommodation & Food Services | 12 (100.0%) | 0 (0.0%) |
| Public Administration | 0 (0.0%) | 0 (0.0%) |
| Total | 457 (67.5%) | 220 (32.5%) |
Education in Biltmore Forest
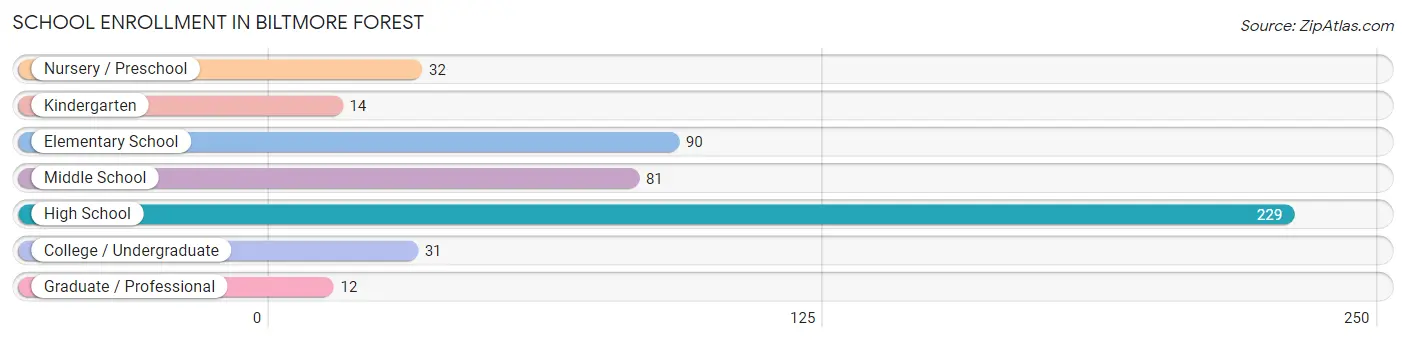
School Enrollment in Biltmore Forest
The most common levels of schooling among the 489 students in Biltmore Forest are high school (229 | 46.8%), elementary school (90 | 18.4%), and middle school (81 | 16.6%).
| School Level | # Students | % Students |
| Nursery / Preschool | 32 | 6.5% |
| Kindergarten | 14 | 2.9% |
| Elementary School | 90 | 18.4% |
| Middle School | 81 | 16.6% |
| High School | 229 | 46.8% |
| College / Undergraduate | 31 | 6.3% |
| Graduate / Professional | 12 | 2.5% |
| Total | 489 | 100.0% |
School Enrollment by Age by Funding Source in Biltmore Forest
Out of a total of 489 students who are enrolled in schools in Biltmore Forest, 344 (70.3%) attend a private institution, while the remaining 145 (29.7%) are enrolled in public schools. The age group of 3 to 4 year olds has the highest likelihood of being enrolled in private schools, with 32 (100.0% in the age bracket) enrolled. Conversely, the age group of 35 years and over has the lowest likelihood of being enrolled in a private school, with 9 (75.0% in the age bracket) attending a public institution.
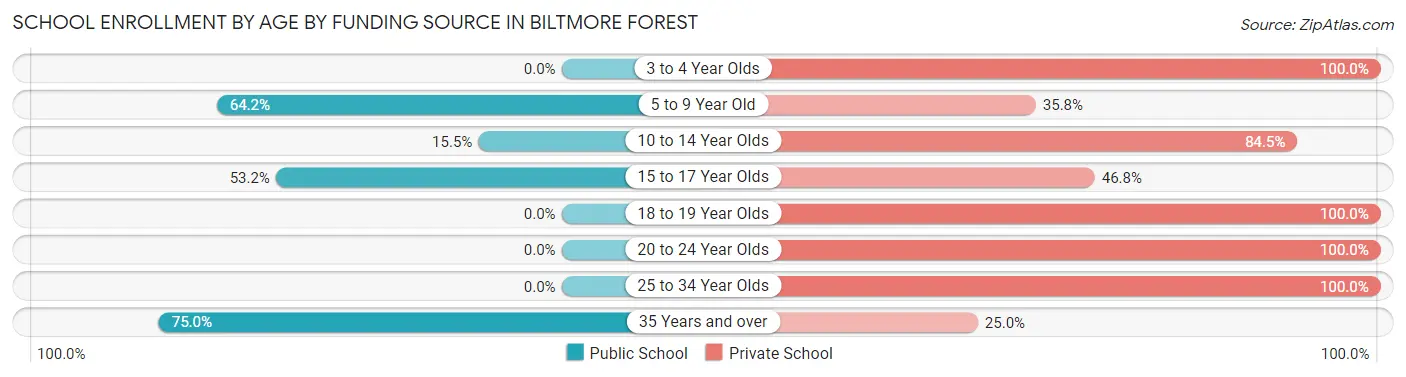
| Age Bracket | Public School | Private School |
| 3 to 4 Year Olds | 0 (0.0%) | 32 (100.0%) |
| 5 to 9 Year Old | 52 (64.2%) | 29 (35.8%) |
| 10 to 14 Year Olds | 18 (15.5%) | 98 (84.5%) |
| 15 to 17 Year Olds | 66 (53.2%) | 58 (46.8%) |
| 18 to 19 Year Olds | 0 (0.0%) | 93 (100.0%) |
| 20 to 24 Year Olds | 0 (0.0%) | 24 (100.0%) |
| 25 to 34 Year Olds | 0 (0.0%) | 7 (100.0%) |
| 35 Years and over | 9 (75.0%) | 3 (25.0%) |
| Total | 145 (29.7%) | 344 (70.3%) |
Educational Attainment by Field of Study in Biltmore Forest
Business (157 | 15.7%), bio, nature & agricultural (147 | 14.7%), education (104 | 10.4%), social sciences (99 | 9.9%), and engineering (92 | 9.2%) are the most common fields of study among 998 individuals in Biltmore Forest who have obtained a bachelor's degree or higher.
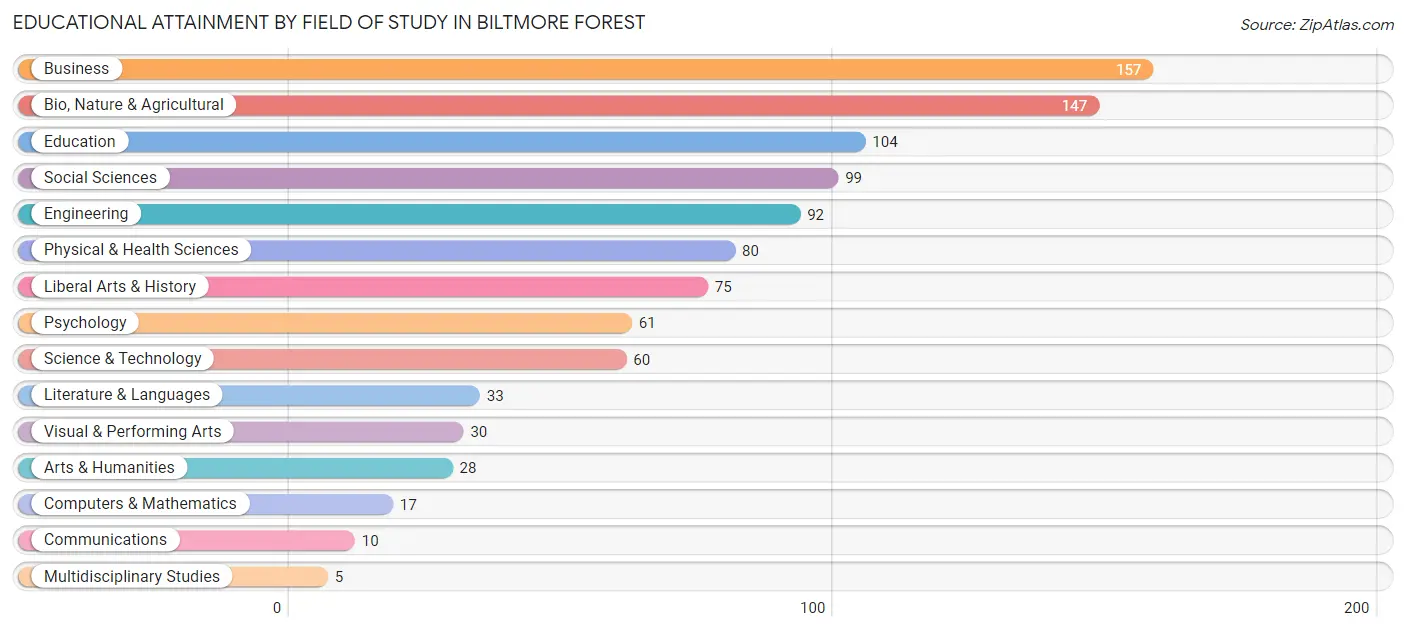
| Field of Study | # Graduates | % Graduates |
| Computers & Mathematics | 17 | 1.7% |
| Bio, Nature & Agricultural | 147 | 14.7% |
| Physical & Health Sciences | 80 | 8.0% |
| Psychology | 61 | 6.1% |
| Social Sciences | 99 | 9.9% |
| Engineering | 92 | 9.2% |
| Multidisciplinary Studies | 5 | 0.5% |
| Science & Technology | 60 | 6.0% |
| Business | 157 | 15.7% |
| Education | 104 | 10.4% |
| Literature & Languages | 33 | 3.3% |
| Liberal Arts & History | 75 | 7.5% |
| Visual & Performing Arts | 30 | 3.0% |
| Communications | 10 | 1.0% |
| Arts & Humanities | 28 | 2.8% |
| Total | 998 | 100.0% |
Transportation & Commute in Biltmore Forest
Vehicle Availability by Sex in Biltmore Forest
The most prevalent vehicle ownership categories in Biltmore Forest are males with 2 vehicles (178, accounting for 39.2%) and females with 2 vehicles (118, making up 83.6%).
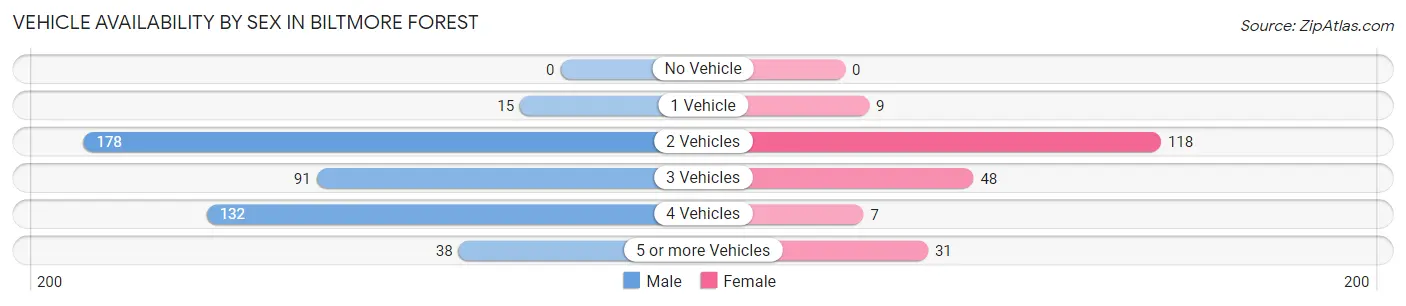
| Vehicles Available | Male | Female |
| No Vehicle | 0 (0.0%) | 0 (0.0%) |
| 1 Vehicle | 15 (3.3%) | 9 (4.2%) |
| 2 Vehicles | 178 (39.2%) | 118 (55.4%) |
| 3 Vehicles | 91 (20.0%) | 48 (22.5%) |
| 4 Vehicles | 132 (29.1%) | 7 (3.3%) |
| 5 or more Vehicles | 38 (8.4%) | 31 (14.5%) |
| Total | 454 (100.0%) | 213 (100.0%) |
Commute Time in Biltmore Forest
The most frequently occuring commute durations in Biltmore Forest are 15 to 19 minutes (173 commuters, 32.2%), 20 to 24 minutes (130 commuters, 24.2%), and 10 to 14 minutes (105 commuters, 19.6%).
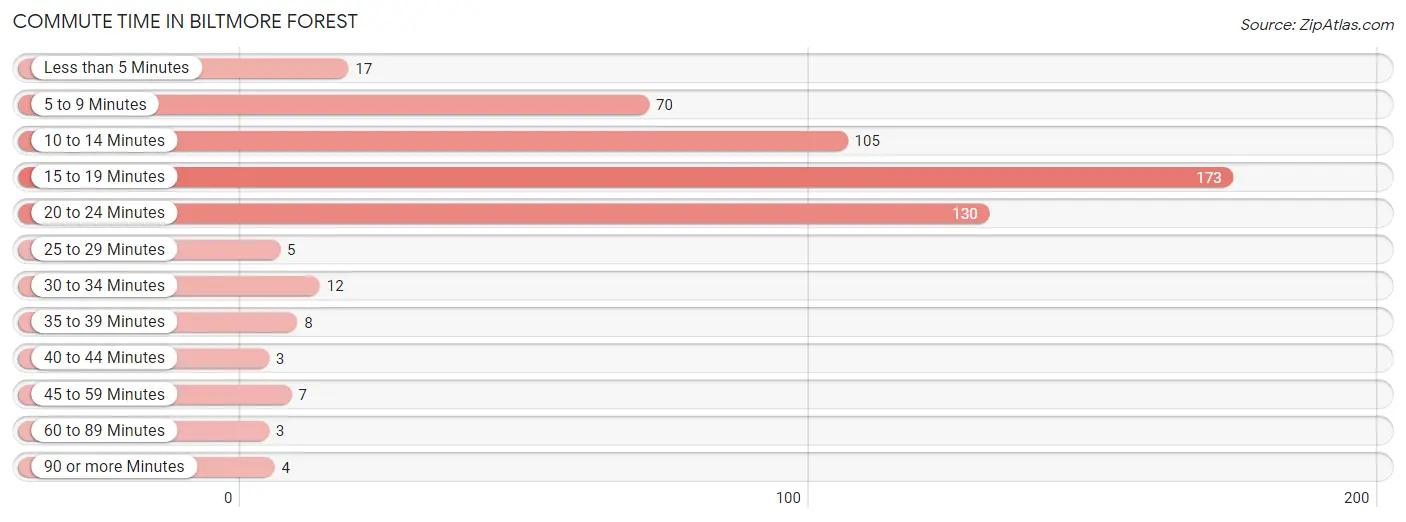
| Commute Time | # Commuters | % Commuters |
| Less than 5 Minutes | 17 | 3.2% |
| 5 to 9 Minutes | 70 | 13.0% |
| 10 to 14 Minutes | 105 | 19.6% |
| 15 to 19 Minutes | 173 | 32.2% |
| 20 to 24 Minutes | 130 | 24.2% |
| 25 to 29 Minutes | 5 | 0.9% |
| 30 to 34 Minutes | 12 | 2.2% |
| 35 to 39 Minutes | 8 | 1.5% |
| 40 to 44 Minutes | 3 | 0.6% |
| 45 to 59 Minutes | 7 | 1.3% |
| 60 to 89 Minutes | 3 | 0.6% |
| 90 or more Minutes | 4 | 0.7% |
Commute Time by Sex in Biltmore Forest
The most common commute times in Biltmore Forest are 15 to 19 minutes (116 commuters, 30.4%) for males and 15 to 19 minutes (57 commuters, 36.5%) for females.
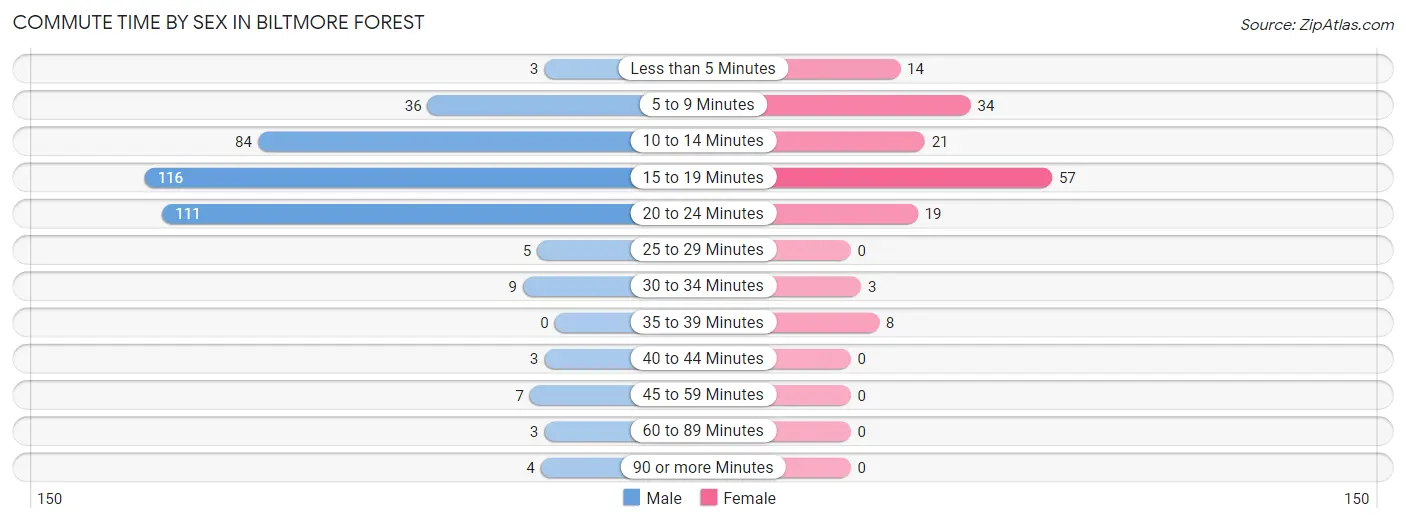
| Commute Time | Male | Female |
| Less than 5 Minutes | 3 (0.8%) | 14 (9.0%) |
| 5 to 9 Minutes | 36 (9.5%) | 34 (21.8%) |
| 10 to 14 Minutes | 84 (22.1%) | 21 (13.5%) |
| 15 to 19 Minutes | 116 (30.4%) | 57 (36.5%) |
| 20 to 24 Minutes | 111 (29.1%) | 19 (12.2%) |
| 25 to 29 Minutes | 5 (1.3%) | 0 (0.0%) |
| 30 to 34 Minutes | 9 (2.4%) | 3 (1.9%) |
| 35 to 39 Minutes | 0 (0.0%) | 8 (5.1%) |
| 40 to 44 Minutes | 3 (0.8%) | 0 (0.0%) |
| 45 to 59 Minutes | 7 (1.8%) | 0 (0.0%) |
| 60 to 89 Minutes | 3 (0.8%) | 0 (0.0%) |
| 90 or more Minutes | 4 (1.1%) | 0 (0.0%) |
Time of Departure to Work by Sex in Biltmore Forest
The most frequent times of departure to work in Biltmore Forest are 8:00 AM to 8:29 AM (110, 28.9%) for males and 7:30 AM to 7:59 AM (49, 31.4%) for females.
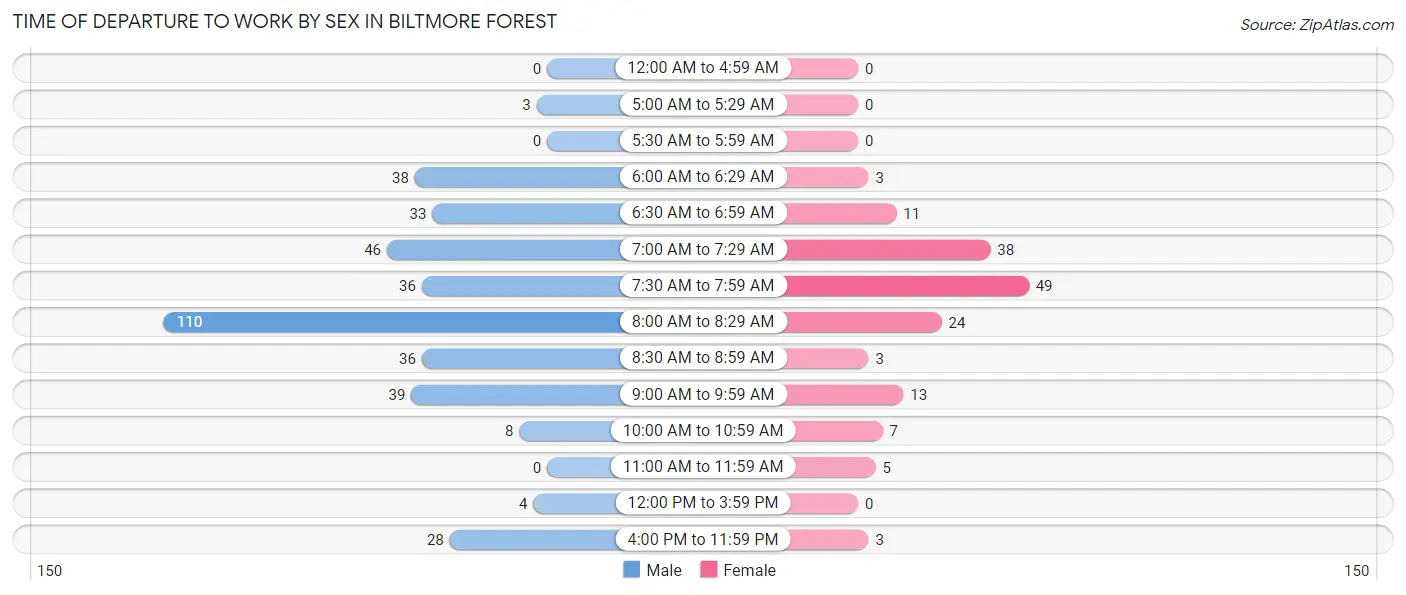
| Time of Departure | Male | Female |
| 12:00 AM to 4:59 AM | 0 (0.0%) | 0 (0.0%) |
| 5:00 AM to 5:29 AM | 3 (0.8%) | 0 (0.0%) |
| 5:30 AM to 5:59 AM | 0 (0.0%) | 0 (0.0%) |
| 6:00 AM to 6:29 AM | 38 (10.0%) | 3 (1.9%) |
| 6:30 AM to 6:59 AM | 33 (8.7%) | 11 (7.0%) |
| 7:00 AM to 7:29 AM | 46 (12.1%) | 38 (24.4%) |
| 7:30 AM to 7:59 AM | 36 (9.5%) | 49 (31.4%) |
| 8:00 AM to 8:29 AM | 110 (28.9%) | 24 (15.4%) |
| 8:30 AM to 8:59 AM | 36 (9.5%) | 3 (1.9%) |
| 9:00 AM to 9:59 AM | 39 (10.2%) | 13 (8.3%) |
| 10:00 AM to 10:59 AM | 8 (2.1%) | 7 (4.5%) |
| 11:00 AM to 11:59 AM | 0 (0.0%) | 5 (3.2%) |
| 12:00 PM to 3:59 PM | 4 (1.1%) | 0 (0.0%) |
| 4:00 PM to 11:59 PM | 28 (7.3%) | 3 (1.9%) |
| Total | 381 (100.0%) | 156 (100.0%) |
Housing Occupancy in Biltmore Forest
Occupancy by Ownership in Biltmore Forest
Of the total 588 dwellings in Biltmore Forest, owner-occupied units account for 565 (96.1%), while renter-occupied units make up 23 (3.9%).
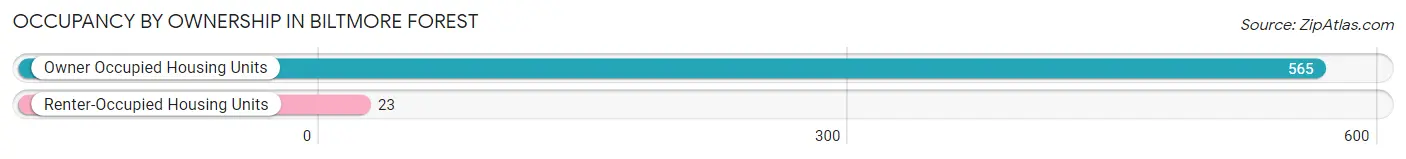
| Occupancy | # Housing Units | % Housing Units |
| Owner Occupied Housing Units | 565 | 96.1% |
| Renter-Occupied Housing Units | 23 | 3.9% |
| Total Occupied Housing Units | 588 | 100.0% |
Occupancy by Household Size in Biltmore Forest
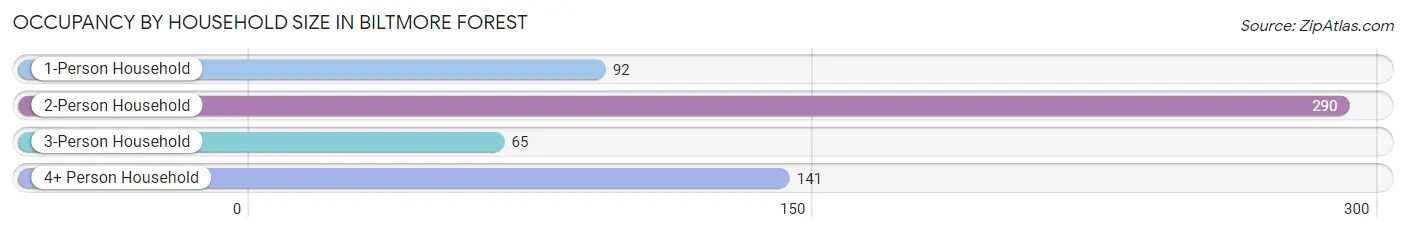
| Household Size | # Housing Units | % Housing Units |
| 1-Person Household | 92 | 15.7% |
| 2-Person Household | 290 | 49.3% |
| 3-Person Household | 65 | 11.1% |
| 4+ Person Household | 141 | 24.0% |
| Total Housing Units | 588 | 100.0% |
Occupancy by Ownership by Household Size in Biltmore Forest
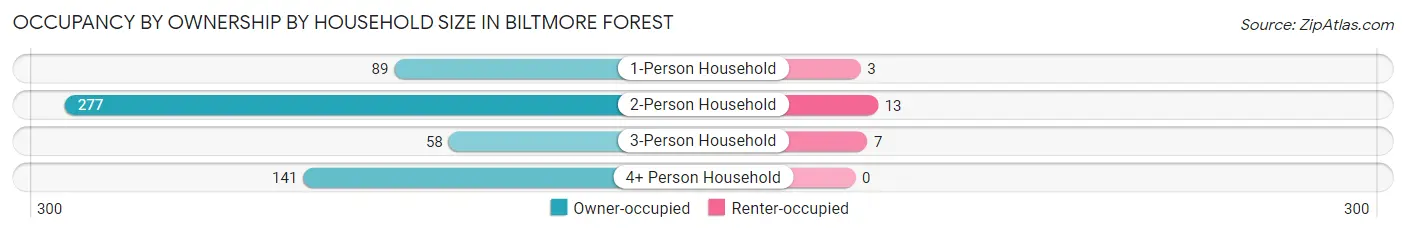
| Household Size | Owner-occupied | Renter-occupied |
| 1-Person Household | 89 (96.7%) | 3 (3.3%) |
| 2-Person Household | 277 (95.5%) | 13 (4.5%) |
| 3-Person Household | 58 (89.2%) | 7 (10.8%) |
| 4+ Person Household | 141 (100.0%) | 0 (0.0%) |
| Total Housing Units | 565 (96.1%) | 23 (3.9%) |
Occupancy by Educational Attainment in Biltmore Forest
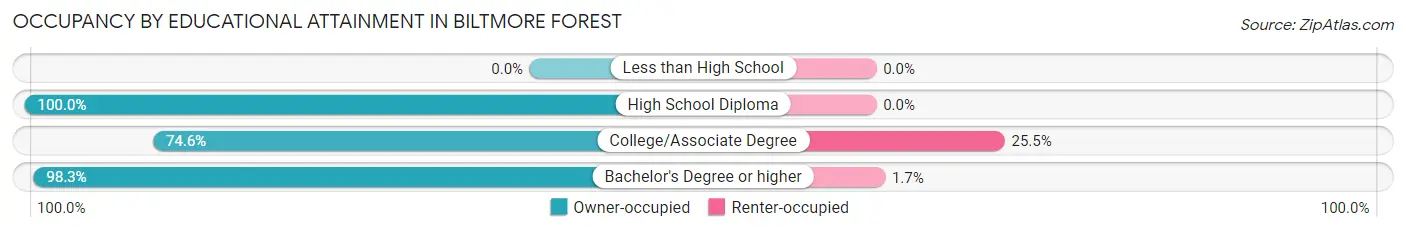
| Household Size | Owner-occupied | Renter-occupied |
| Less than High School | 0 (0.0%) | 0 (0.0%) |
| High School Diploma | 16 (100.0%) | 0 (0.0%) |
| College/Associate Degree | 41 (74.6%) | 14 (25.5%) |
| Bachelor's Degree or higher | 508 (98.3%) | 9 (1.7%) |
Occupancy by Age of Householder in Biltmore Forest
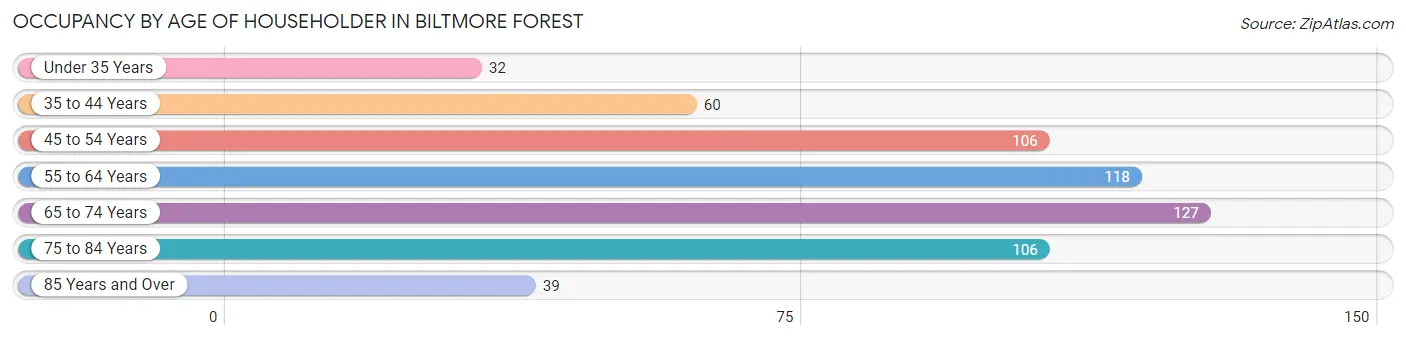
| Age Bracket | # Households | % Households |
| Under 35 Years | 32 | 5.4% |
| 35 to 44 Years | 60 | 10.2% |
| 45 to 54 Years | 106 | 18.0% |
| 55 to 64 Years | 118 | 20.1% |
| 65 to 74 Years | 127 | 21.6% |
| 75 to 84 Years | 106 | 18.0% |
| 85 Years and Over | 39 | 6.6% |
| Total | 588 | 100.0% |
Housing Finances in Biltmore Forest
Median Income by Occupancy in Biltmore Forest
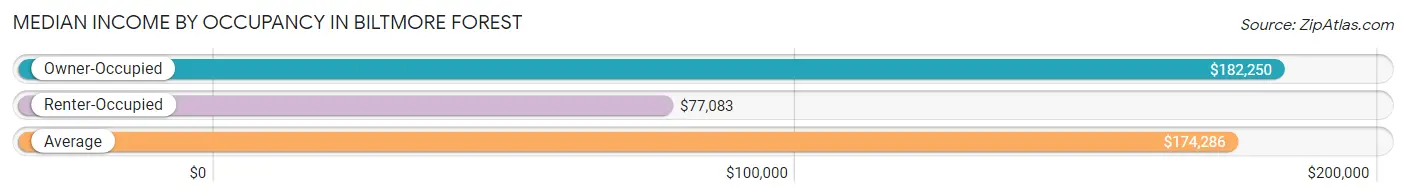
| Occupancy Type | # Households | Median Income |
| Owner-Occupied | 565 (96.1%) | $182,250 |
| Renter-Occupied | 23 (3.9%) | $77,083 |
| Average | 588 (100.0%) | $174,286 |
Occupancy by Householder Income Bracket in Biltmore Forest
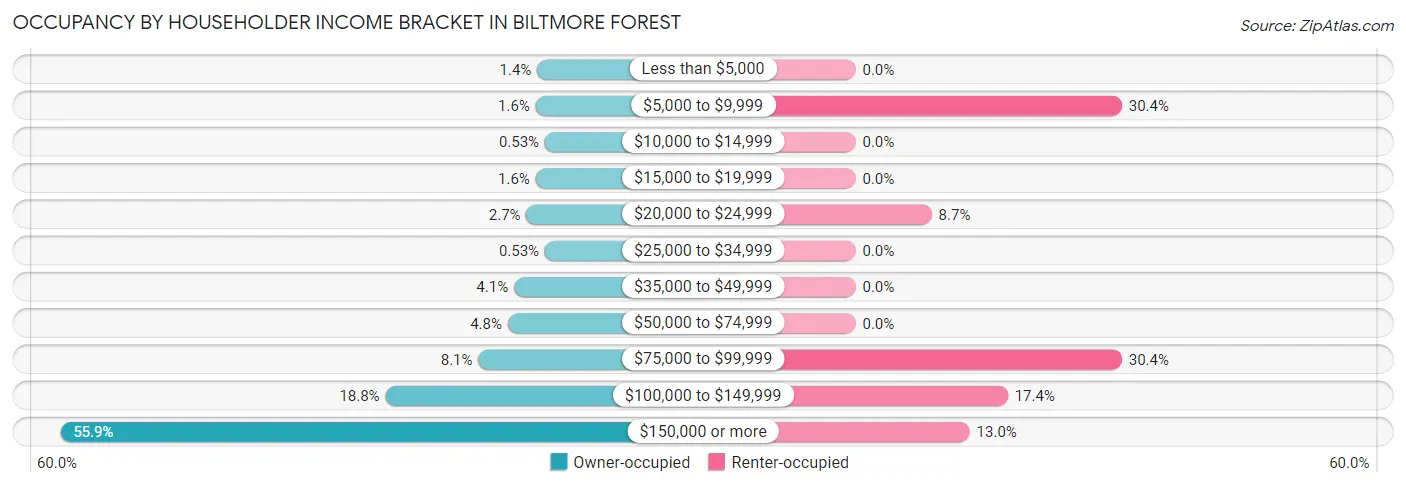
| Income Bracket | Owner-occupied | Renter-occupied |
| Less than $5,000 | 8 (1.4%) | 0 (0.0%) |
| $5,000 to $9,999 | 9 (1.6%) | 7 (30.4%) |
| $10,000 to $14,999 | 3 (0.5%) | 0 (0.0%) |
| $15,000 to $19,999 | 9 (1.6%) | 0 (0.0%) |
| $20,000 to $24,999 | 15 (2.6%) | 2 (8.7%) |
| $25,000 to $34,999 | 3 (0.5%) | 0 (0.0%) |
| $35,000 to $49,999 | 23 (4.1%) | 0 (0.0%) |
| $50,000 to $74,999 | 27 (4.8%) | 0 (0.0%) |
| $75,000 to $99,999 | 46 (8.1%) | 7 (30.4%) |
| $100,000 to $149,999 | 106 (18.8%) | 4 (17.4%) |
| $150,000 or more | 316 (55.9%) | 3 (13.0%) |
| Total | 565 (100.0%) | 23 (100.0%) |
Monthly Housing Cost Tiers in Biltmore Forest
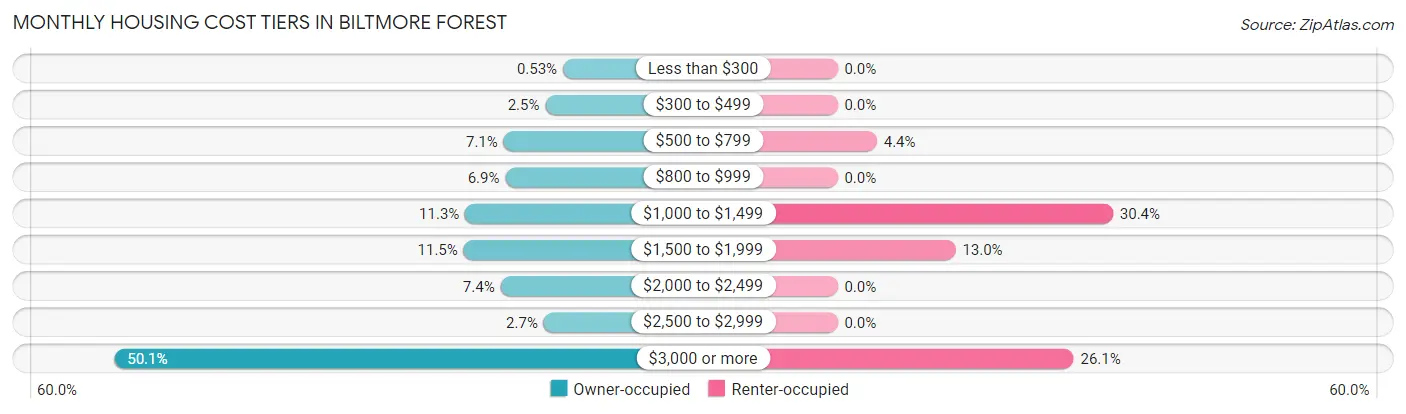
| Monthly Cost | Owner-occupied | Renter-occupied |
| Less than $300 | 3 (0.5%) | 0 (0.0%) |
| $300 to $499 | 14 (2.5%) | 0 (0.0%) |
| $500 to $799 | 40 (7.1%) | 1 (4.3%) |
| $800 to $999 | 39 (6.9%) | 0 (0.0%) |
| $1,000 to $1,499 | 64 (11.3%) | 7 (30.4%) |
| $1,500 to $1,999 | 65 (11.5%) | 3 (13.0%) |
| $2,000 to $2,499 | 42 (7.4%) | 0 (0.0%) |
| $2,500 to $2,999 | 15 (2.6%) | 0 (0.0%) |
| $3,000 or more | 283 (50.1%) | 6 (26.1%) |
| Total | 565 (100.0%) | 23 (100.0%) |
Physical Housing Characteristics in Biltmore Forest
Housing Structures in Biltmore Forest
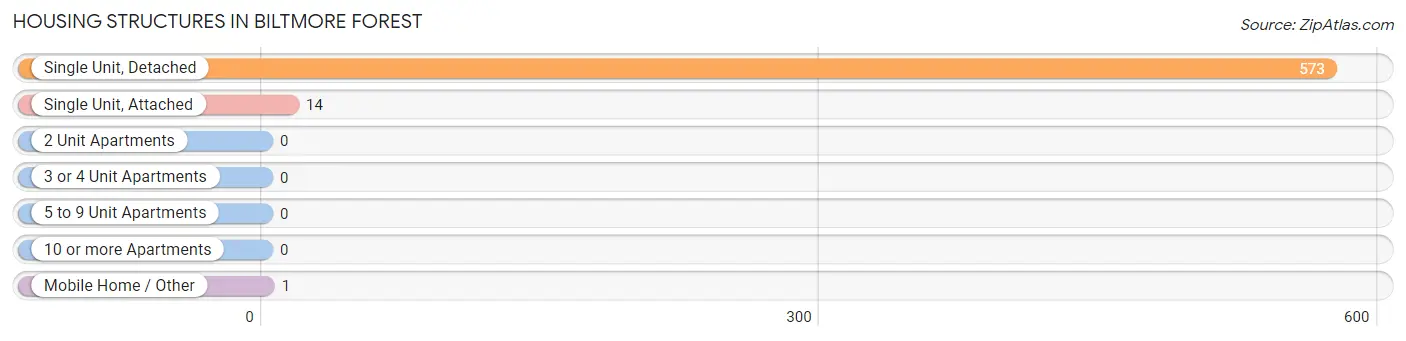
| Structure Type | # Housing Units | % Housing Units |
| Single Unit, Detached | 573 | 97.5% |
| Single Unit, Attached | 14 | 2.4% |
| 2 Unit Apartments | 0 | 0.0% |
| 3 or 4 Unit Apartments | 0 | 0.0% |
| 5 to 9 Unit Apartments | 0 | 0.0% |
| 10 or more Apartments | 0 | 0.0% |
| Mobile Home / Other | 1 | 0.2% |
| Total | 588 | 100.0% |
Housing Structures by Occupancy in Biltmore Forest
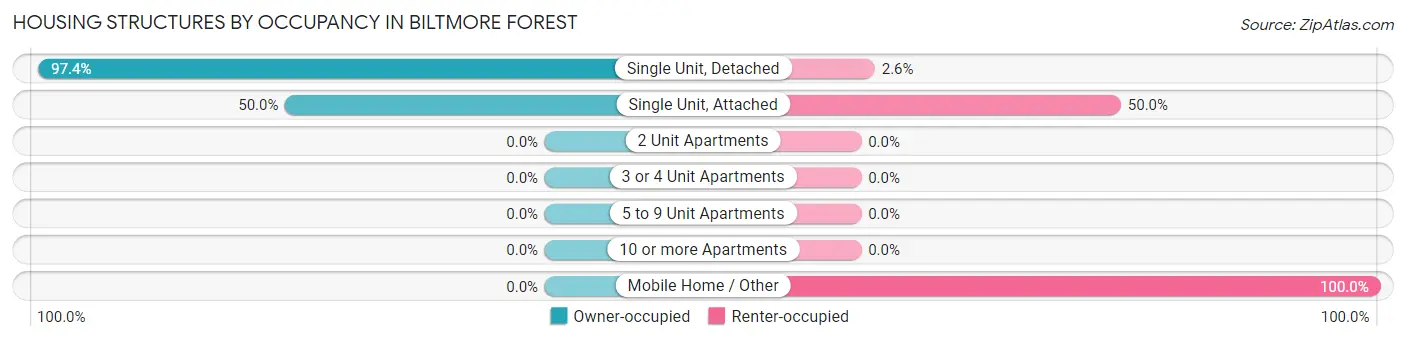
| Structure Type | Owner-occupied | Renter-occupied |
| Single Unit, Detached | 558 (97.4%) | 15 (2.6%) |
| Single Unit, Attached | 7 (50.0%) | 7 (50.0%) |
| 2 Unit Apartments | 0 (0.0%) | 0 (0.0%) |
| 3 or 4 Unit Apartments | 0 (0.0%) | 0 (0.0%) |
| 5 to 9 Unit Apartments | 0 (0.0%) | 0 (0.0%) |
| 10 or more Apartments | 0 (0.0%) | 0 (0.0%) |
| Mobile Home / Other | 0 (0.0%) | 1 (100.0%) |
| Total | 565 (96.1%) | 23 (3.9%) |
Housing Structures by Number of Rooms in Biltmore Forest
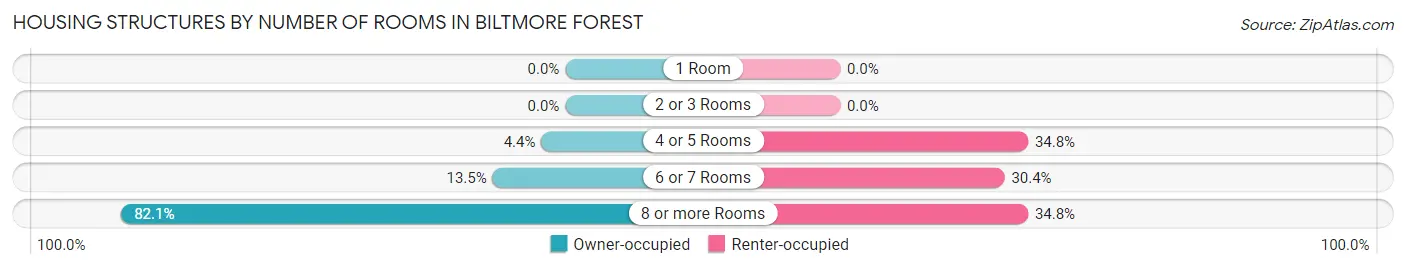
| Number of Rooms | Owner-occupied | Renter-occupied |
| 1 Room | 0 (0.0%) | 0 (0.0%) |
| 2 or 3 Rooms | 0 (0.0%) | 0 (0.0%) |
| 4 or 5 Rooms | 25 (4.4%) | 8 (34.8%) |
| 6 or 7 Rooms | 76 (13.5%) | 7 (30.4%) |
| 8 or more Rooms | 464 (82.1%) | 8 (34.8%) |
| Total | 565 (100.0%) | 23 (100.0%) |
Housing Structure by Heating Type in Biltmore Forest
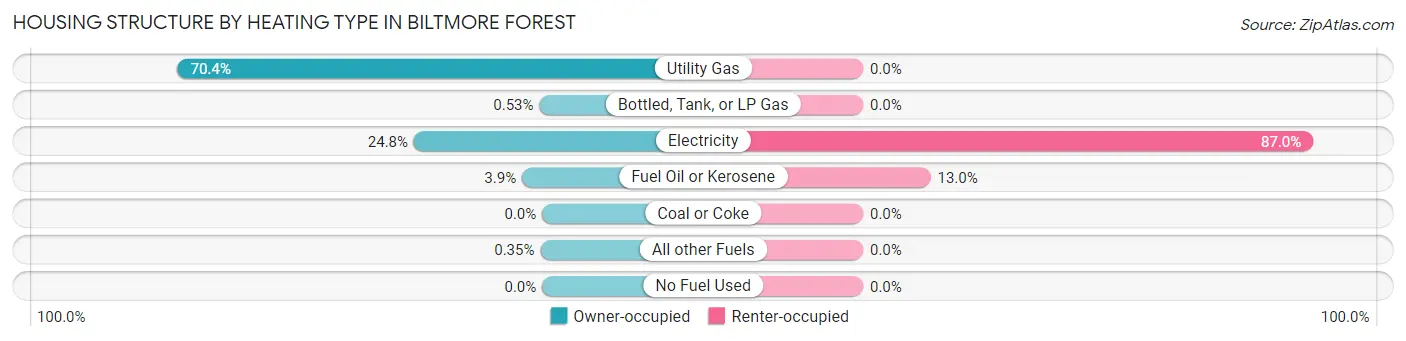
| Heating Type | Owner-occupied | Renter-occupied |
| Utility Gas | 398 (70.4%) | 0 (0.0%) |
| Bottled, Tank, or LP Gas | 3 (0.5%) | 0 (0.0%) |
| Electricity | 140 (24.8%) | 20 (87.0%) |
| Fuel Oil or Kerosene | 22 (3.9%) | 3 (13.0%) |
| Coal or Coke | 0 (0.0%) | 0 (0.0%) |
| All other Fuels | 2 (0.4%) | 0 (0.0%) |
| No Fuel Used | 0 (0.0%) | 0 (0.0%) |
| Total | 565 (100.0%) | 23 (100.0%) |
Household Vehicle Usage in Biltmore Forest
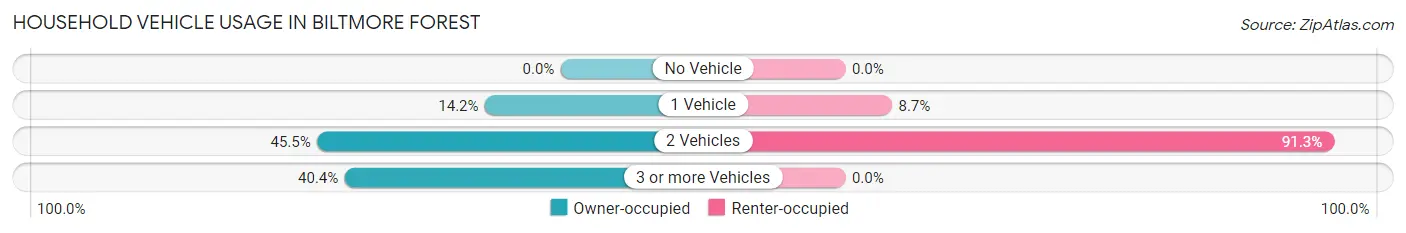
| Vehicles per Household | Owner-occupied | Renter-occupied |
| No Vehicle | 0 (0.0%) | 0 (0.0%) |
| 1 Vehicle | 80 (14.2%) | 2 (8.7%) |
| 2 Vehicles | 257 (45.5%) | 21 (91.3%) |
| 3 or more Vehicles | 228 (40.4%) | 0 (0.0%) |
| Total | 565 (100.0%) | 23 (100.0%) |
Real Estate & Mortgages in Biltmore Forest
Real Estate and Mortgage Overview in Biltmore Forest
| Characteristic | Without Mortgage | With Mortgage |
| Housing Units | 259 | 306 |
| Median Property Value | $1,181,100 | $1,169,900 |
| Median Household Income | $172,917 | $179 |
| Monthly Housing Costs | $1,404 | $246 |
| Real Estate Taxes | $8,260 | $5 |
Property Value by Mortgage Status in Biltmore Forest
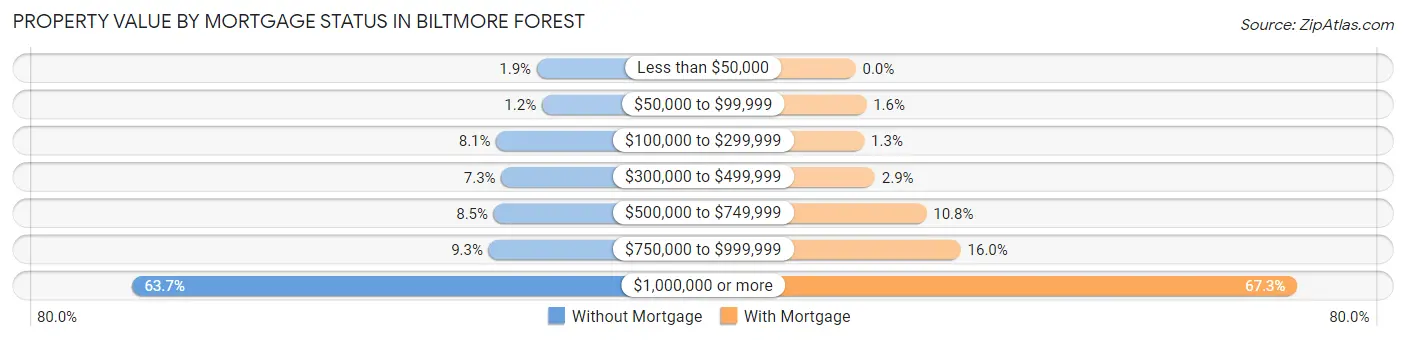
| Property Value | Without Mortgage | With Mortgage |
| Less than $50,000 | 5 (1.9%) | 0 (0.0%) |
| $50,000 to $99,999 | 3 (1.2%) | 5 (1.6%) |
| $100,000 to $299,999 | 21 (8.1%) | 4 (1.3%) |
| $300,000 to $499,999 | 19 (7.3%) | 9 (2.9%) |
| $500,000 to $749,999 | 22 (8.5%) | 33 (10.8%) |
| $750,000 to $999,999 | 24 (9.3%) | 49 (16.0%) |
| $1,000,000 or more | 165 (63.7%) | 206 (67.3%) |
| Total | 259 (100.0%) | 306 (100.0%) |
Household Income by Mortgage Status in Biltmore Forest
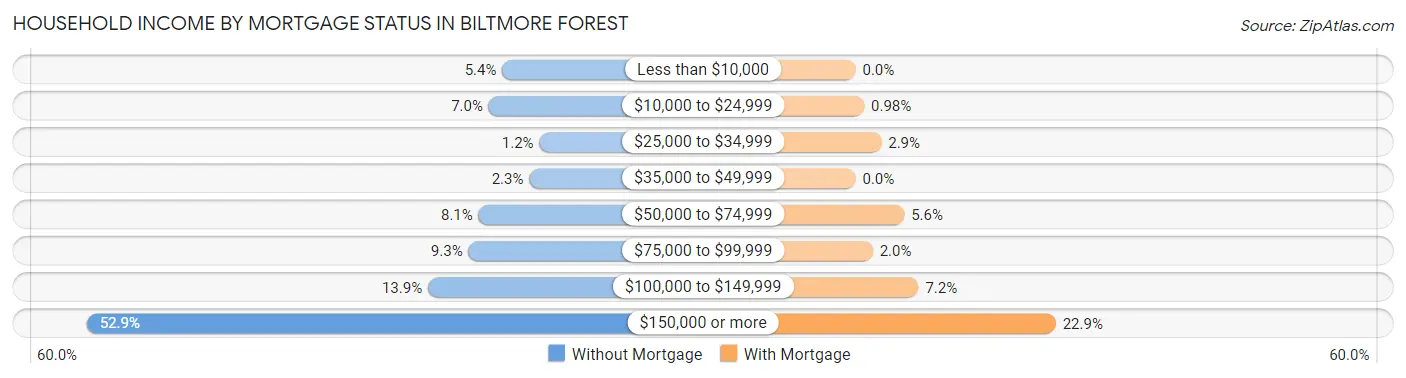
| Household Income | Without Mortgage | With Mortgage |
| Less than $10,000 | 14 (5.4%) | 0 (0.0%) |
| $10,000 to $24,999 | 18 (7.0%) | 3 (1.0%) |
| $25,000 to $34,999 | 3 (1.2%) | 9 (2.9%) |
| $35,000 to $49,999 | 6 (2.3%) | 0 (0.0%) |
| $50,000 to $74,999 | 21 (8.1%) | 17 (5.6%) |
| $75,000 to $99,999 | 24 (9.3%) | 6 (2.0%) |
| $100,000 to $149,999 | 36 (13.9%) | 22 (7.2%) |
| $150,000 or more | 137 (52.9%) | 70 (22.9%) |
| Total | 259 (100.0%) | 306 (100.0%) |
Property Value to Household Income Ratio in Biltmore Forest
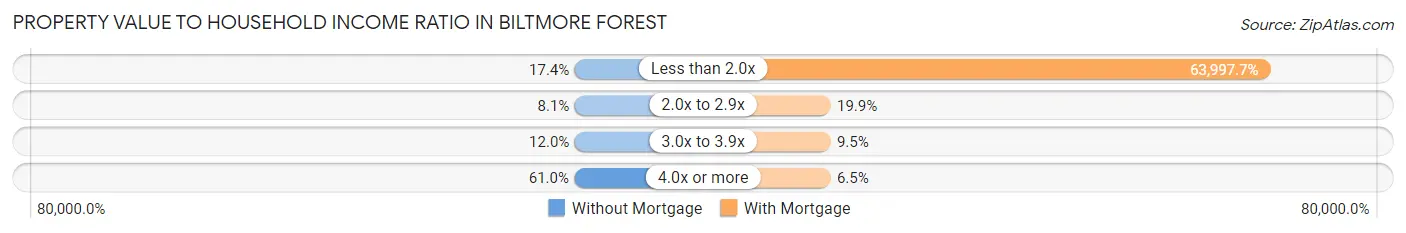
| Value-to-Income Ratio | Without Mortgage | With Mortgage |
| Less than 2.0x | 45 (17.4%) | 195,833 (63,997.7%) |
| 2.0x to 2.9x | 21 (8.1%) | 61 (19.9%) |
| 3.0x to 3.9x | 31 (12.0%) | 29 (9.5%) |
| 4.0x or more | 158 (61.0%) | 20 (6.5%) |
| Total | 259 (100.0%) | 306 (100.0%) |
Real Estate Taxes by Mortgage Status in Biltmore Forest
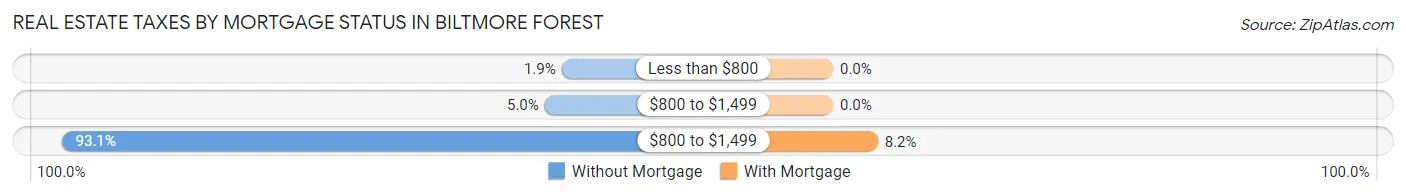
| Property Taxes | Without Mortgage | With Mortgage |
| Less than $800 | 5 (1.9%) | 0 (0.0%) |
| $800 to $1,499 | 13 (5.0%) | 0 (0.0%) |
| $800 to $1,499 | 241 (93.0%) | 25 (8.2%) |
| Total | 259 (100.0%) | 306 (100.0%) |
Health & Disability in Biltmore Forest
Health Insurance Coverage by Age in Biltmore Forest
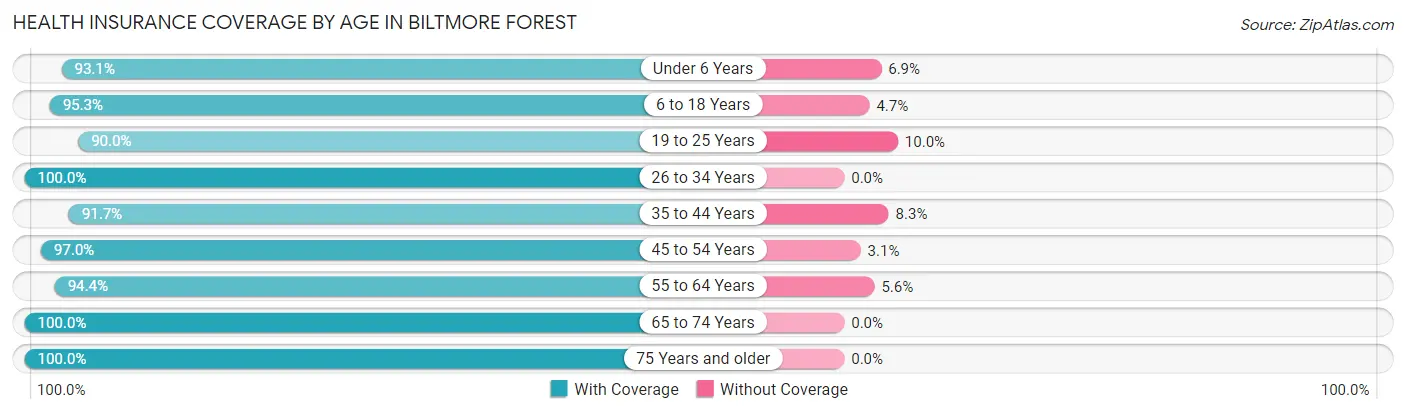
| Age Bracket | With Coverage | Without Coverage |
| Under 6 Years | 81 (93.1%) | 6 (6.9%) |
| 6 to 18 Years | 386 (95.3%) | 19 (4.7%) |
| 19 to 25 Years | 54 (90.0%) | 6 (10.0%) |
| 26 to 34 Years | 43 (100.0%) | 0 (0.0%) |
| 35 to 44 Years | 122 (91.7%) | 11 (8.3%) |
| 45 to 54 Years | 286 (97.0%) | 9 (3.0%) |
| 55 to 64 Years | 218 (94.4%) | 13 (5.6%) |
| 65 to 74 Years | 220 (100.0%) | 0 (0.0%) |
| 75 Years and older | 226 (100.0%) | 0 (0.0%) |
| Total | 1,636 (96.2%) | 64 (3.8%) |
Health Insurance Coverage by Citizenship Status in Biltmore Forest
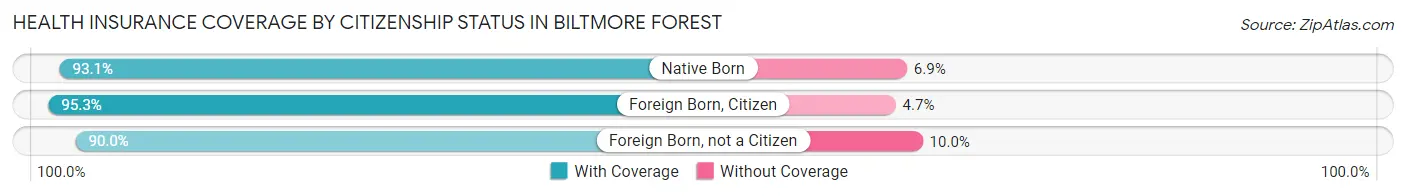
| Citizenship Status | With Coverage | Without Coverage |
| Native Born | 81 (93.1%) | 6 (6.9%) |
| Foreign Born, Citizen | 386 (95.3%) | 19 (4.7%) |
| Foreign Born, not a Citizen | 54 (90.0%) | 6 (10.0%) |
Health Insurance Coverage by Household Income in Biltmore Forest
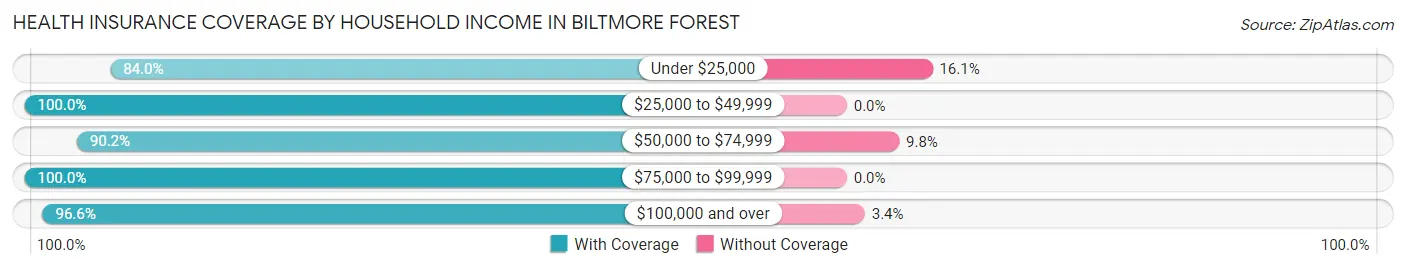
| Household Income | With Coverage | Without Coverage |
| Under $25,000 | 68 (84.0%) | 13 (16.1%) |
| $25,000 to $49,999 | 53 (100.0%) | 0 (0.0%) |
| $50,000 to $74,999 | 46 (90.2%) | 5 (9.8%) |
| $75,000 to $99,999 | 149 (100.0%) | 0 (0.0%) |
| $100,000 and over | 1,320 (96.6%) | 46 (3.4%) |
Public vs Private Health Insurance Coverage by Age in Biltmore Forest
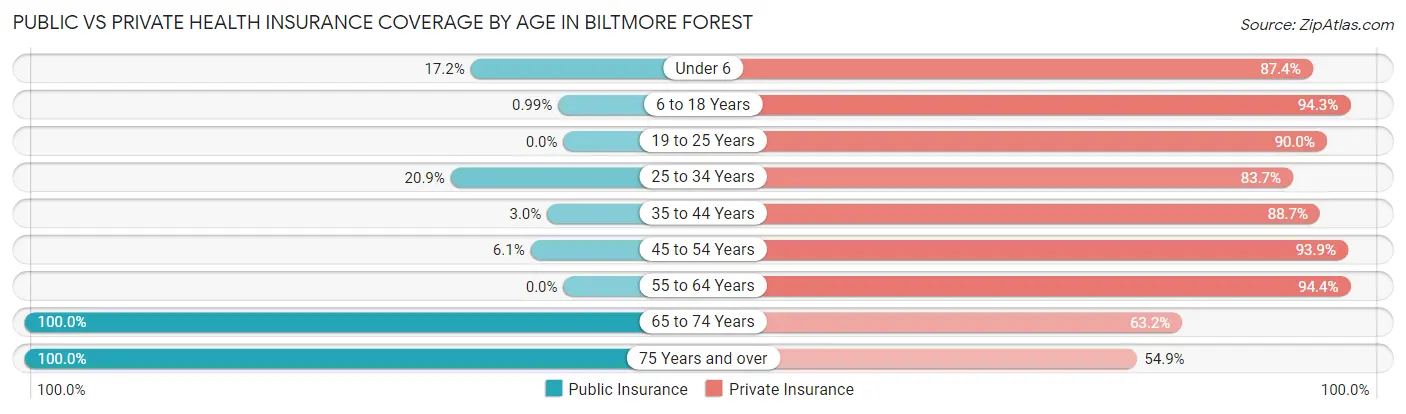
| Age Bracket | Public Insurance | Private Insurance |
| Under 6 | 15 (17.2%) | 76 (87.4%) |
| 6 to 18 Years | 4 (1.0%) | 382 (94.3%) |
| 19 to 25 Years | 0 (0.0%) | 54 (90.0%) |
| 25 to 34 Years | 9 (20.9%) | 36 (83.7%) |
| 35 to 44 Years | 4 (3.0%) | 118 (88.7%) |
| 45 to 54 Years | 18 (6.1%) | 277 (93.9%) |
| 55 to 64 Years | 0 (0.0%) | 218 (94.4%) |
| 65 to 74 Years | 220 (100.0%) | 139 (63.2%) |
| 75 Years and over | 226 (100.0%) | 124 (54.9%) |
| Total | 496 (29.2%) | 1,424 (83.8%) |
Disability Status by Sex by Age in Biltmore Forest
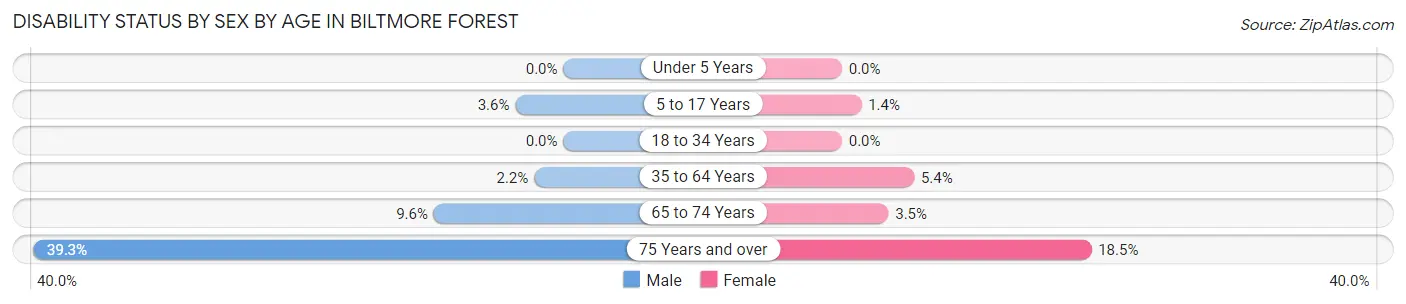
| Age Bracket | Male | Female |
| Under 5 Years | 0 (0.0%) | 0 (0.0%) |
| 5 to 17 Years | 4 (3.6%) | 3 (1.4%) |
| 18 to 34 Years | 0 (0.0%) | 0 (0.0%) |
| 35 to 64 Years | 7 (2.2%) | 18 (5.4%) |
| 65 to 74 Years | 10 (9.6%) | 4 (3.5%) |
| 75 Years and over | 57 (39.3%) | 15 (18.5%) |
Disability Class by Sex by Age in Biltmore Forest
Disability Class: Hearing Difficulty
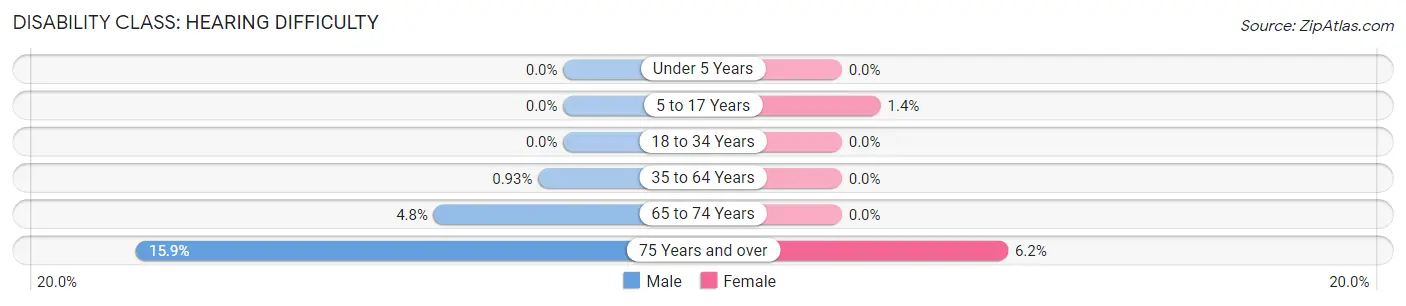
| Age Bracket | Male | Female |
| Under 5 Years | 0 (0.0%) | 0 (0.0%) |
| 5 to 17 Years | 0 (0.0%) | 3 (1.4%) |
| 18 to 34 Years | 0 (0.0%) | 0 (0.0%) |
| 35 to 64 Years | 3 (0.9%) | 0 (0.0%) |
| 65 to 74 Years | 5 (4.8%) | 0 (0.0%) |
| 75 Years and over | 23 (15.9%) | 5 (6.2%) |
Disability Class: Vision Difficulty
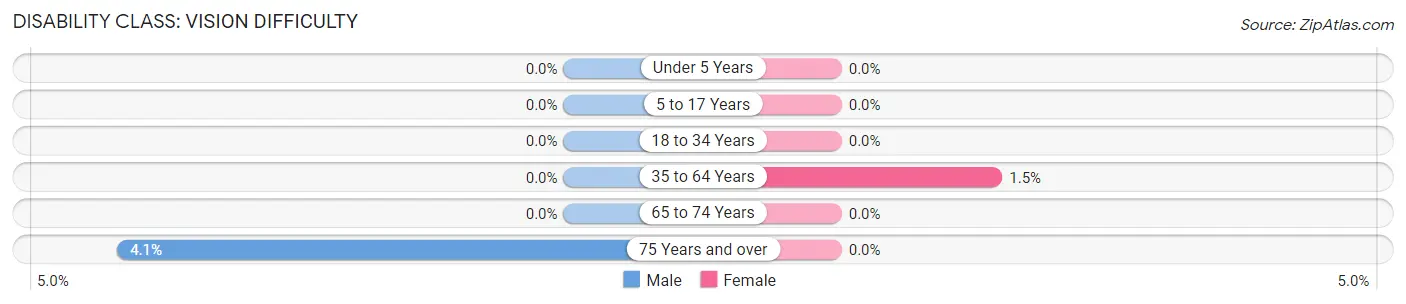
| Age Bracket | Male | Female |
| Under 5 Years | 0 (0.0%) | 0 (0.0%) |
| 5 to 17 Years | 0 (0.0%) | 0 (0.0%) |
| 18 to 34 Years | 0 (0.0%) | 0 (0.0%) |
| 35 to 64 Years | 0 (0.0%) | 5 (1.5%) |
| 65 to 74 Years | 0 (0.0%) | 0 (0.0%) |
| 75 Years and over | 6 (4.1%) | 0 (0.0%) |
Disability Class: Cognitive Difficulty
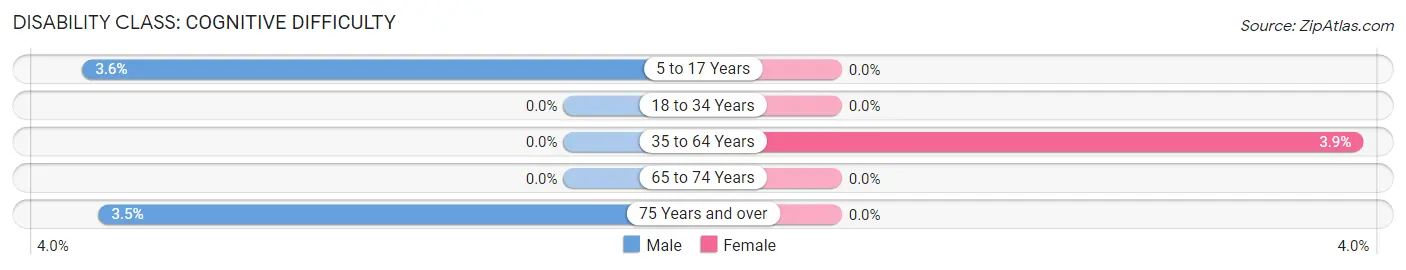
| Age Bracket | Male | Female |
| 5 to 17 Years | 4 (3.6%) | 0 (0.0%) |
| 18 to 34 Years | 0 (0.0%) | 0 (0.0%) |
| 35 to 64 Years | 0 (0.0%) | 13 (3.9%) |
| 65 to 74 Years | 0 (0.0%) | 0 (0.0%) |
| 75 Years and over | 5 (3.5%) | 0 (0.0%) |
Disability Class: Ambulatory Difficulty
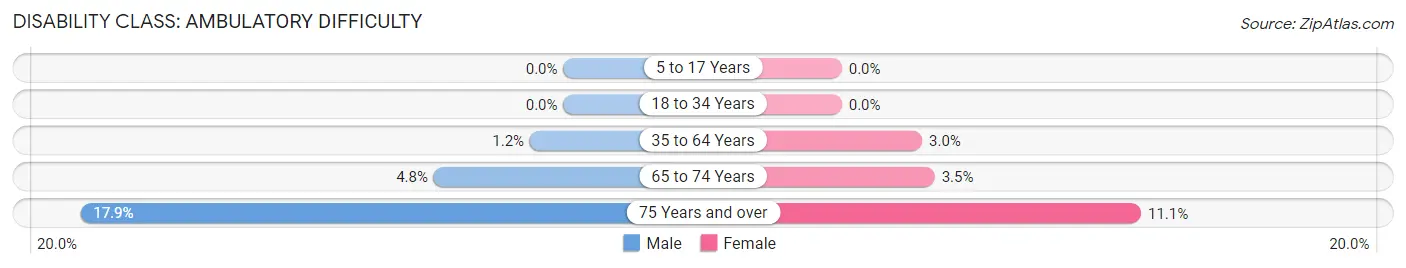
| Age Bracket | Male | Female |
| 5 to 17 Years | 0 (0.0%) | 0 (0.0%) |
| 18 to 34 Years | 0 (0.0%) | 0 (0.0%) |
| 35 to 64 Years | 4 (1.2%) | 10 (3.0%) |
| 65 to 74 Years | 5 (4.8%) | 4 (3.5%) |
| 75 Years and over | 26 (17.9%) | 9 (11.1%) |
Disability Class: Self-Care Difficulty
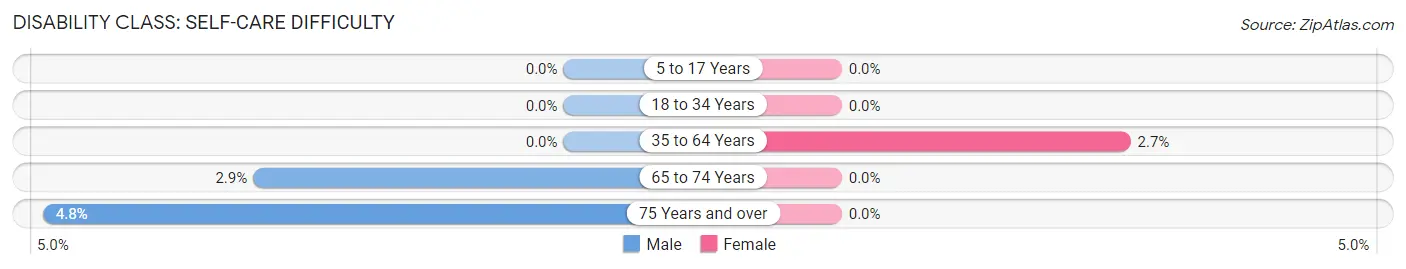
| Age Bracket | Male | Female |
| 5 to 17 Years | 0 (0.0%) | 0 (0.0%) |
| 18 to 34 Years | 0 (0.0%) | 0 (0.0%) |
| 35 to 64 Years | 0 (0.0%) | 9 (2.7%) |
| 65 to 74 Years | 3 (2.9%) | 0 (0.0%) |
| 75 Years and over | 7 (4.8%) | 0 (0.0%) |
Technology Access in Biltmore Forest
Computing Device Access in Biltmore Forest
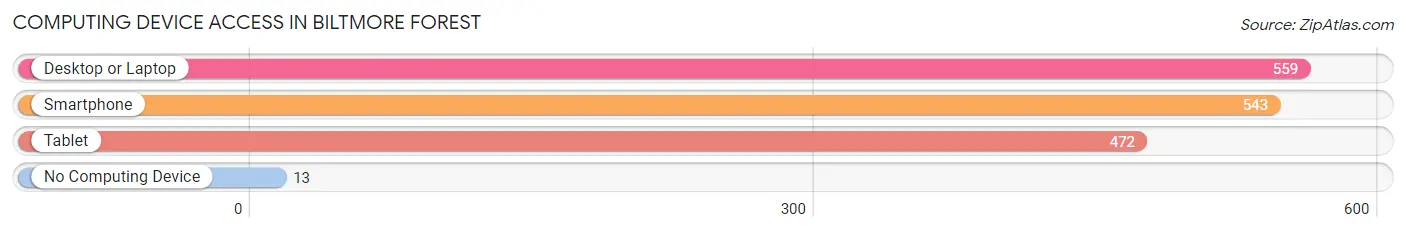
| Device Type | # Households | % Households |
| Desktop or Laptop | 559 | 95.1% |
| Smartphone | 543 | 92.3% |
| Tablet | 472 | 80.3% |
| No Computing Device | 13 | 2.2% |
| Total | 588 | 100.0% |
Internet Access in Biltmore Forest
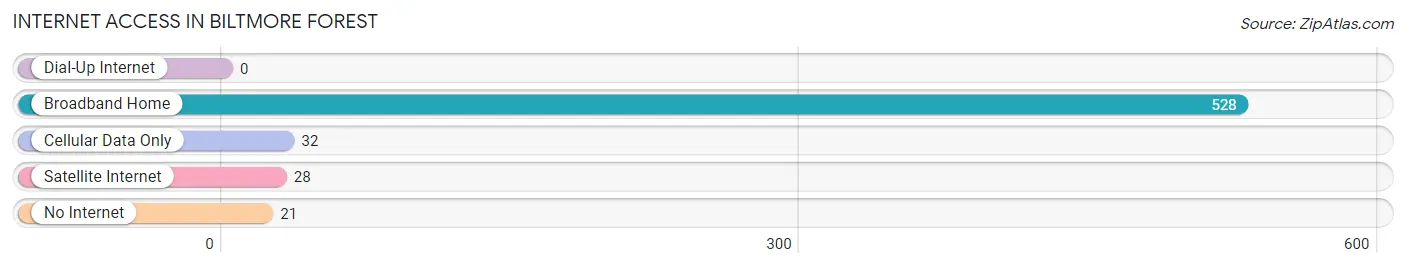
| Internet Type | # Households | % Households |
| Dial-Up Internet | 0 | 0.0% |
| Broadband Home | 528 | 89.8% |
| Cellular Data Only | 32 | 5.4% |
| Satellite Internet | 28 | 4.8% |
| No Internet | 21 | 3.6% |
| Total | 588 | 100.0% |
Biltmore Forest Summary
Biltmore Forest is a small town located in Buncombe County, North Carolina. It is situated in the Blue Ridge Mountains, just south of Asheville. The town was founded in 1923 by George W. Vanderbilt, who named it after his family’s estate, the Biltmore House. The town was incorporated in 1925 and has a population of approximately 1,000 people.
Geography
Biltmore Forest is located in the Blue Ridge Mountains of western North Carolina. The town is situated at an elevation of 2,400 feet and is surrounded by the Pisgah National Forest. The town is located just south of Asheville, and is approximately 20 miles from the Tennessee border. The town is located in a temperate climate, with average temperatures ranging from the mid-50s in the winter to the mid-80s in the summer.
Economy
The economy of Biltmore Forest is largely based on tourism. The town is home to the Biltmore Estate, which is a popular tourist destination. The estate includes the Biltmore House, a 250-room mansion built by George Vanderbilt in 1895. The estate also includes gardens, trails, and a winery. The town also has several restaurants, shops, and galleries.
Demographics
As of the 2010 census, the population of Biltmore Forest was 1,000 people. The racial makeup of the town was 94.2% White, 2.2% African American, 0.7% Native American, 0.7% Asian, 0.3% from other races, and 1.9% from two or more races. The median household income was $68,750, and the median family income was $77,500.
History
Biltmore Forest was founded in 1923 by George W. Vanderbilt. Vanderbilt was the grandson of Cornelius Vanderbilt, the founder of the Vanderbilt family fortune. Vanderbilt purchased 125,000 acres of land in the Blue Ridge Mountains and named it Biltmore Estate. He then built the Biltmore House, a 250-room mansion, on the estate. The town of Biltmore Forest was incorporated in 1925.
In the 1930s, the town began to develop as a residential community. The town was designed to be a self-contained community, with its own schools, churches, and businesses. The town was also designed to be a refuge from the hustle and bustle of the city.
In the 1950s, the town began to attract more tourists, as the Biltmore Estate became a popular destination. The town also began to attract more businesses, such as restaurants, shops, and galleries.
Today, Biltmore Forest is a small, quiet town with a population of approximately 1,000 people. The town is still largely residential, but it is also a popular tourist destination. The town is home to the Biltmore Estate, which is a popular tourist destination. The town also has several restaurants, shops, and galleries.
Common Questions
What is the Total Population of Biltmore Forest?
Total Population of Biltmore Forest is 1,700.
What is the Total Male Population of Biltmore Forest?
Total Male Population of Biltmore Forest is 866.
What is the Total Female Population of Biltmore Forest?
Total Female Population of Biltmore Forest is 834.
What is the Ratio of Males per 100 Females in Biltmore Forest?
There are 103.84 Males per 100 Females in Biltmore Forest.
What is the Ratio of Females per 100 Males in Biltmore Forest?
There are 96.30 Females per 100 Males in Biltmore Forest.
What is the Median Population Age in Biltmore Forest?
Median Population Age in Biltmore Forest is 50.2 Years.
What is the Average Family Size in Biltmore Forest
Average Family Size in Biltmore Forest is 3.2 People.
What is the Average Household Size in Biltmore Forest
Average Household Size in Biltmore Forest is 2.9 People.
What is Per Capita Income in Biltmore Forest?
Per Capita income in Biltmore Forest is $117,858.
What is the Median Family Income in Biltmore Forest?
Median Family Income in Biltmore Forest is $210,833.
What is the Median Household income in Biltmore Forest?
Median Household Income in Biltmore Forest is $174,286.
What is Income or Wage Gap in Biltmore Forest?
Income or Wage Gap in Biltmore Forest is 29.9%.
Women in Biltmore Forest earn 70.1 cents for every dollar earned by a man.
What is Family Income Deficit in Biltmore Forest?
Family Income Deficit in Biltmore Forest is $12,431.
Families that are below poverty line in Biltmore Forest earn $12,431 less on average than the poverty threshold level.
What is Inequality or Gini Index in Biltmore Forest?
Inequality or Gini Index in Biltmore Forest is 0.56.
How Large is the Labor Force in Biltmore Forest?
There are 694 People in the Labor Forcein in Biltmore Forest.
What is the Percentage of People in the Labor Force in Biltmore Forest?
51.0% of People are in the Labor Force in Biltmore Forest.
What is the Unemployment Rate in Biltmore Forest?
Unemployment Rate in Biltmore Forest is 2.4%.