Cities with the Highest Percentage of Population Employed in Public Administration in North Carolina
RELATED REPORTS & OPTIONS
Public Administration
North Carolina
Compare Cities
Map of Cities with the Highest Percentage of Population Employed in Public Administration in North Carolina
0.0%
50.0%
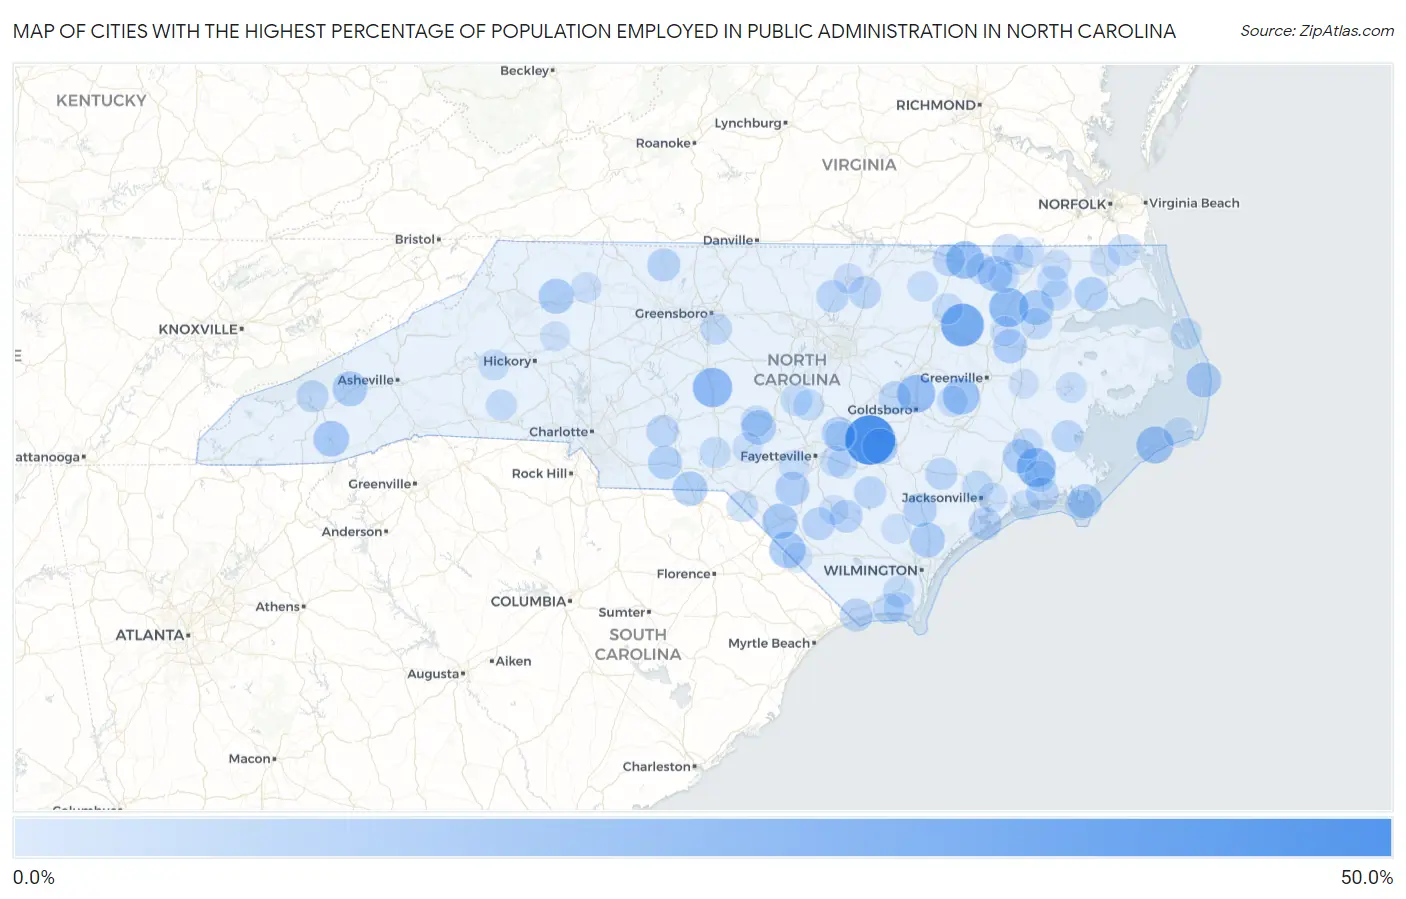
Cities with the Highest Percentage of Population Employed in Public Administration in North Carolina
| City | % Employed | vs State | vs National | |
| 1. | Vann Crossroads | 49.5% | 4.1%(+45.5)#1 | 4.7%(+44.8)#150 |
| 2. | Leggett | 35.3% | 4.1%(+31.2)#2 | 4.7%(+30.6)#339 |
| 3. | Seagrove | 28.2% | 4.1%(+24.1)#3 | 4.7%(+23.5)#557 |
| 4. | Lewiston Woodville | 27.5% | 4.1%(+23.4)#4 | 4.7%(+22.8)#593 |
| 5. | Neuse Forest | 27.3% | 4.1%(+23.3)#5 | 4.7%(+22.7)#595 |
| 6. | Pikeville | 25.4% | 4.1%(+21.4)#6 | 4.7%(+20.8)#697 |
| 7. | Cherry Branch | 25.3% | 4.1%(+21.2)#7 | 4.7%(+20.6)#711 |
| 8. | Barnardsville | 25.2% | 4.1%(+21.1)#8 | 4.7%(+20.5)#715 |
| 9. | Garysburg | 25.1% | 4.1%(+21.0)#9 | 4.7%(+20.4)#718 |
| 10. | Cape Colony | 24.3% | 4.1%(+20.2)#10 | 4.7%(+19.6)#793 |
| 11. | Ocracoke | 23.6% | 4.1%(+19.5)#11 | 4.7%(+18.9)#852 |
| 12. | Maury | 22.9% | 4.1%(+18.8)#12 | 4.7%(+18.2)#902 |
| 13. | Marietta | 21.9% | 4.1%(+17.8)#13 | 4.7%(+17.2)#990 |
| 14. | Glenville | 20.5% | 4.1%(+16.5)#14 | 4.7%(+15.9)#1,125 |
| 15. | Keener | 20.4% | 4.1%(+16.4)#15 | 4.7%(+15.7)#1,137 |
| 16. | Lasker | 20.0% | 4.1%(+15.9)#16 | 4.7%(+15.3)#1,190 |
| 17. | Raynham | 20.0% | 4.1%(+15.9)#17 | 4.7%(+15.3)#1,203 |
| 18. | Fairplains | 19.3% | 4.1%(+15.2)#18 | 4.7%(+14.6)#1,300 |
| 19. | Lake Junaluska | 19.3% | 4.1%(+15.2)#19 | 4.7%(+14.6)#1,301 |
| 20. | Rodanthe | 19.0% | 4.1%(+14.9)#20 | 4.7%(+14.3)#1,333 |
| 21. | Rocky Point | 19.0% | 4.1%(+14.9)#21 | 4.7%(+14.3)#1,335 |
| 22. | Askewville | 18.9% | 4.1%(+14.8)#22 | 4.7%(+14.2)#1,347 |
| 23. | Mcfarlan | 18.6% | 4.1%(+14.5)#23 | 4.7%(+13.9)#1,387 |
| 24. | Whispering Pines | 18.3% | 4.1%(+14.2)#24 | 4.7%(+13.6)#1,429 |
| 25. | Brices Creek | 18.2% | 4.1%(+14.1)#25 | 4.7%(+13.5)#1,440 |
| 26. | Everetts | 17.7% | 4.1%(+13.6)#26 | 4.7%(+13.0)#1,528 |
| 27. | Rennert | 17.6% | 4.1%(+13.6)#27 | 4.7%(+13.0)#1,537 |
| 28. | Marshallberg | 17.5% | 4.1%(+13.4)#28 | 4.7%(+12.8)#1,573 |
| 29. | Godwin | 17.2% | 4.1%(+13.1)#29 | 4.7%(+12.5)#1,629 |
| 30. | Polkton | 17.1% | 4.1%(+13.0)#30 | 4.7%(+12.4)#1,653 |
| 31. | Winfall | 16.8% | 4.1%(+12.7)#31 | 4.7%(+12.1)#1,701 |
| 32. | Watha | 16.3% | 4.1%(+12.2)#32 | 4.7%(+11.6)#1,812 |
| 33. | Danbury | 15.4% | 4.1%(+11.3)#33 | 4.7%(+10.7)#2,012 |
| 34. | Sunset Beach | 15.3% | 4.1%(+11.2)#34 | 4.7%(+10.6)#2,040 |
| 35. | Elizabethtown | 15.1% | 4.1%(+11.0)#35 | 4.7%(+10.4)#2,098 |
| 36. | Butters | 14.9% | 4.1%(+10.9)#36 | 4.7%(+10.3)#2,145 |
| 37. | Sneads Ferry | 14.9% | 4.1%(+10.8)#37 | 4.7%(+10.2)#2,164 |
| 38. | Newport | 14.7% | 4.1%(+10.6)#38 | 4.7%(+10.0)#2,205 |
| 39. | Princeton | 14.5% | 4.1%(+10.4)#39 | 4.7%(+9.78)#2,293 |
| 40. | Kittrell | 14.3% | 4.1%(+10.2)#40 | 4.7%(+9.60)#2,374 |
| 41. | Stem | 14.1% | 4.1%(+10.1)#41 | 4.7%(+9.44)#2,433 |
| 42. | Aquadale | 14.1% | 4.1%(+10.0)#42 | 4.7%(+9.41)#2,443 |
| 43. | South Rosemary | 14.0% | 4.1%(+9.91)#43 | 4.7%(+9.30)#2,473 |
| 44. | Beulaville | 13.9% | 4.1%(+9.84)#44 | 4.7%(+9.23)#2,492 |
| 45. | Roberdel | 13.9% | 4.1%(+9.81)#45 | 4.7%(+9.20)#2,512 |
| 46. | Garland | 13.7% | 4.1%(+9.67)#46 | 4.7%(+9.06)#2,560 |
| 47. | Cherokee | 13.6% | 4.1%(+9.52)#47 | 4.7%(+8.91)#2,623 |
| 48. | Spout Springs | 13.5% | 4.1%(+9.42)#48 | 4.7%(+8.81)#2,663 |
| 49. | Farmington | 13.4% | 4.1%(+9.32)#49 | 4.7%(+8.71)#2,715 |
| 50. | Vandemere | 13.3% | 4.1%(+9.26)#50 | 4.7%(+8.65)#2,734 |
| 51. | Severn | 13.0% | 4.1%(+8.97)#51 | 4.7%(+8.36)#2,836 |
| 52. | Pleasant Garden | 12.9% | 4.1%(+8.85)#52 | 4.7%(+8.24)#2,877 |
| 53. | Moyock | 12.7% | 4.1%(+8.66)#53 | 4.7%(+8.05)#2,933 |
| 54. | Windsor | 12.7% | 4.1%(+8.59)#54 | 4.7%(+7.98)#2,956 |
| 55. | Broadway | 12.5% | 4.1%(+8.44)#55 | 4.7%(+7.83)#3,005 |
| 56. | Havelock | 12.3% | 4.1%(+8.23)#56 | 4.7%(+7.62)#3,105 |
| 57. | Carthage | 12.3% | 4.1%(+8.22)#57 | 4.7%(+7.61)#3,107 |
| 58. | Mamers | 12.3% | 4.1%(+8.19)#58 | 4.7%(+7.58)#3,121 |
| 59. | Scotch Meadows | 12.3% | 4.1%(+8.18)#59 | 4.7%(+7.57)#3,131 |
| 60. | Bolivia | 12.1% | 4.1%(+8.05)#60 | 4.7%(+7.44)#3,212 |
| 61. | Half Moon | 12.1% | 4.1%(+8.02)#61 | 4.7%(+7.41)#3,229 |
| 62. | Ellerbe | 11.9% | 4.1%(+7.86)#62 | 4.7%(+7.26)#3,294 |
| 63. | Snow Hill | 11.9% | 4.1%(+7.81)#63 | 4.7%(+7.20)#3,318 |
| 64. | Harrellsville | 11.8% | 4.1%(+7.69)#64 | 4.7%(+7.08)#3,378 |
| 65. | Nags Head | 11.7% | 4.1%(+7.60)#65 | 4.7%(+6.99)#3,422 |
| 66. | Anderson Creek | 11.6% | 4.1%(+7.55)#66 | 4.7%(+6.94)#3,458 |
| 67. | Varnamtown | 11.6% | 4.1%(+7.53)#67 | 4.7%(+6.92)#3,467 |
| 68. | Woodland | 11.5% | 4.1%(+7.46)#68 | 4.7%(+6.85)#3,506 |
| 69. | Whitakers | 11.5% | 4.1%(+7.41)#69 | 4.7%(+6.80)#3,542 |
| 70. | Polkville | 11.4% | 4.1%(+7.32)#70 | 4.7%(+6.71)#3,586 |
| 71. | Colerain | 11.3% | 4.1%(+7.23)#71 | 4.7%(+6.62)#3,633 |
| 72. | Bridgeton | 11.0% | 4.1%(+6.97)#72 | 4.7%(+6.36)#3,784 |
| 73. | Salem | 11.0% | 4.1%(+6.94)#73 | 4.7%(+6.33)#3,795 |
| 74. | Belhaven | 11.0% | 4.1%(+6.91)#74 | 4.7%(+6.30)#3,810 |
| 75. | Glenwood | 10.9% | 4.1%(+6.84)#75 | 4.7%(+6.23)#3,846 |
| 76. | Stedman | 10.9% | 4.1%(+6.84)#76 | 4.7%(+6.23)#3,848 |
| 77. | Rockfish | 10.9% | 4.1%(+6.84)#77 | 4.7%(+6.23)#3,849 |
| 78. | Autryville | 10.9% | 4.1%(+6.79)#78 | 4.7%(+6.18)#3,876 |
| 79. | Como | 10.9% | 4.1%(+6.79)#79 | 4.7%(+6.18)#3,877 |
| 80. | Jackson | 10.7% | 4.1%(+6.66)#80 | 4.7%(+6.05)#3,964 |
| 81. | Falcon | 10.7% | 4.1%(+6.64)#81 | 4.7%(+6.03)#3,984 |
| 82. | Hollister | 10.7% | 4.1%(+6.59)#82 | 4.7%(+5.98)#4,023 |
| 83. | Gatesville | 10.6% | 4.1%(+6.54)#83 | 4.7%(+5.93)#4,053 |
| 84. | Brandywine Bay | 10.6% | 4.1%(+6.54)#84 | 4.7%(+5.93)#4,056 |
| 85. | Oak Island | 10.6% | 4.1%(+6.53)#85 | 4.7%(+5.93)#4,058 |
| 86. | Pleasant Hill | 10.4% | 4.1%(+6.31)#86 | 4.7%(+5.70)#4,216 |
| 87. | Oxford | 10.3% | 4.1%(+6.26)#87 | 4.7%(+5.65)#4,247 |
| 88. | South Mills | 10.2% | 4.1%(+6.13)#88 | 4.7%(+5.53)#4,326 |
| 89. | Pinebluff | 10.1% | 4.1%(+6.02)#89 | 4.7%(+5.41)#4,418 |
| 90. | Hatteras | 10.1% | 4.1%(+5.98)#90 | 4.7%(+5.37)#4,434 |
| 91. | Hamilton | 10.0% | 4.1%(+5.92)#91 | 4.7%(+5.31)#4,481 |
| 92. | Piney Green | 10.0% | 4.1%(+5.90)#92 | 4.7%(+5.29)#4,504 |
| 93. | Harkers Island | 9.9% | 4.1%(+5.83)#93 | 4.7%(+5.22)#4,553 |
| 94. | Atkinson | 9.9% | 4.1%(+5.81)#94 | 4.7%(+5.20)#4,570 |
| 95. | Taylorsville | 9.8% | 4.1%(+5.77)#95 | 4.7%(+5.16)#4,595 |
| 96. | Dublin | 9.7% | 4.1%(+5.65)#96 | 4.7%(+5.04)#4,699 |
| 97. | Washington | 9.7% | 4.1%(+5.62)#97 | 4.7%(+5.01)#4,717 |
| 98. | Bogue | 9.7% | 4.1%(+5.59)#98 | 4.7%(+4.98)#4,745 |
| 99. | Murfreesboro | 9.7% | 4.1%(+5.58)#99 | 4.7%(+4.98)#4,746 |
| 100. | Fair Bluff | 9.7% | 4.1%(+5.58)#100 | 4.7%(+4.97)#4,749 |
Common Questions
What are the Top 10 Cities with the Highest Percentage of Population Employed in Public Administration in North Carolina?
Top 10 Cities with the Highest Percentage of Population Employed in Public Administration in North Carolina are:
#1
49.5%
#2
35.3%
#3
28.2%
#4
27.5%
#5
27.3%
#6
25.4%
#7
25.1%
#8
23.6%
#9
22.9%
#10
21.9%
What city has the Highest Percentage of Population Employed in Public Administration in North Carolina?
Vann Crossroads has the Highest Percentage of Population Employed in Public Administration in North Carolina with 49.5%.
What is the Percentage of Population Employed in Public Administration in the State of North Carolina?
Percentage of Population Employed in Public Administration in North Carolina is 4.1%.
What is the Percentage of Population Employed in Public Administration in the United States?
Percentage of Population Employed in Public Administration in the United States is 4.7%.