Cities with the Lowest Poverty Level Among Married Couples in North Carolina
RELATED REPORTS & OPTIONS
Lowest Poverty | Married Couple
North Carolina
Compare Cities
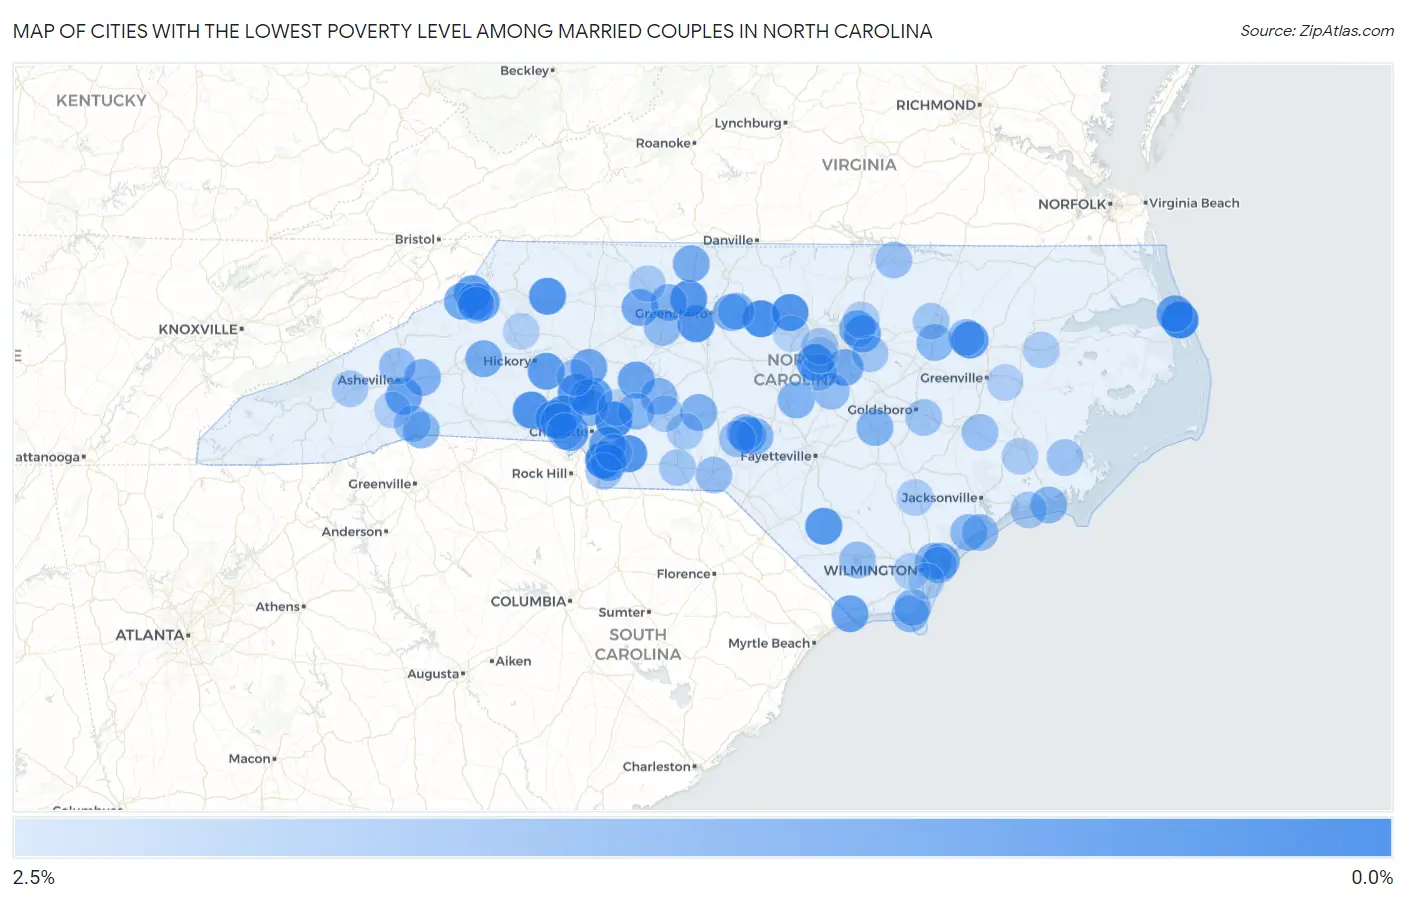
Map of Cities with the Lowest Poverty Level Among Married Couples in North Carolina
2.5%
0.0%
Cities with the Lowest Poverty Level Among Married Couples in North Carolina
| City | Married Couples Poverty | vs State | vs National | |
| 1. | Weddington | 0.14% | 4.5%(-4.35)#1 | 4.5%(-4.32)#16 |
| 2. | Kill Devil Hills | 0.21% | 4.5%(-4.28)#2 | 4.5%(-4.25)#34 |
| 3. | Harrisburg | 0.33% | 4.5%(-4.15)#3 | 4.5%(-4.13)#89 |
| 4. | Swepsonville | 0.40% | 4.5%(-4.09)#4 | 4.5%(-4.06)#139 |
| 5. | Cherryville | 0.49% | 4.5%(-4.00)#5 | 4.5%(-3.97)#232 |
| 6. | Hillsborough | 0.53% | 4.5%(-3.96)#6 | 4.5%(-3.93)#277 |
| 7. | Unionville | 0.56% | 4.5%(-3.92)#7 | 4.5%(-3.90)#329 |
| 8. | Jamestown | 0.57% | 4.5%(-3.92)#8 | 4.5%(-3.89)#336 |
| 9. | Westport | 0.59% | 4.5%(-3.89)#9 | 4.5%(-3.87)#371 |
| 10. | Apex | 0.60% | 4.5%(-3.89)#10 | 4.5%(-3.86)#377 |
| 11. | Millers Creek | 0.60% | 4.5%(-3.89)#11 | 4.5%(-3.86)#378 |
| 12. | Oak Ridge | 0.62% | 4.5%(-3.87)#12 | 4.5%(-3.84)#399 |
| 13. | Princeville | 0.66% | 4.5%(-3.83)#13 | 4.5%(-3.80)#450 |
| 14. | Bladenboro | 0.66% | 4.5%(-3.82)#14 | 4.5%(-3.80)#469 |
| 15. | Dallas | 0.67% | 4.5%(-3.82)#15 | 4.5%(-3.79)#483 |
| 16. | Belmont | 0.76% | 4.5%(-3.72)#16 | 4.5%(-3.70)#658 |
| 17. | Newton | 0.77% | 4.5%(-3.71)#17 | 4.5%(-3.69)#678 |
| 18. | Davidson | 0.79% | 4.5%(-3.70)#18 | 4.5%(-3.68)#716 |
| 19. | Seven Devils | 0.82% | 4.5%(-3.67)#19 | 4.5%(-3.64)#799 |
| 20. | Beech Mountain | 0.82% | 4.5%(-3.66)#20 | 4.5%(-3.64)#806 |
| 21. | Kitty Hawk | 0.82% | 4.5%(-3.66)#21 | 4.5%(-3.64)#808 |
| 22. | Stanley | 0.85% | 4.5%(-3.64)#22 | 4.5%(-3.62)#857 |
| 23. | Pinehurst | 0.89% | 4.5%(-3.59)#23 | 4.5%(-3.57)#942 |
| 24. | Carolina Shores | 0.90% | 4.5%(-3.59)#24 | 4.5%(-3.57)#943 |
| 25. | Matthews | 0.94% | 4.5%(-3.55)#25 | 4.5%(-3.53)#1,045 |
| 26. | Royal Pines | 0.94% | 4.5%(-3.55)#26 | 4.5%(-3.52)#1,050 |
| 27. | Faith | 0.94% | 4.5%(-3.54)#27 | 4.5%(-3.52)#1,064 |
| 28. | Rolesville | 0.98% | 4.5%(-3.51)#28 | 4.5%(-3.49)#1,149 |
| 29. | Troutman | 0.99% | 4.5%(-3.50)#29 | 4.5%(-3.47)#1,177 |
| 30. | Ranlo | 0.99% | 4.5%(-3.49)#30 | 4.5%(-3.47)#1,194 |
| 31. | Garner | 1.1% | 4.5%(-3.41)#31 | 4.5%(-3.39)#1,384 |
| 32. | Elk Park | 1.1% | 4.5%(-3.40)#32 | 4.5%(-3.37)#1,406 |
| 33. | Lewisville | 1.1% | 4.5%(-3.40)#33 | 4.5%(-3.37)#1,410 |
| 34. | Glen Alpine | 1.1% | 4.5%(-3.37)#34 | 4.5%(-3.34)#1,472 |
| 35. | Porters Neck | 1.1% | 4.5%(-3.37)#35 | 4.5%(-3.34)#1,473 |
| 36. | Wesley Chapel | 1.1% | 4.5%(-3.34)#36 | 4.5%(-3.32)#1,538 |
| 37. | Mayodan | 1.2% | 4.5%(-3.34)#37 | 4.5%(-3.31)#1,565 |
| 38. | Sedalia | 1.2% | 4.5%(-3.28)#38 | 4.5%(-3.26)#1,698 |
| 39. | Wake Forest | 1.2% | 4.5%(-3.27)#39 | 4.5%(-3.24)#1,734 |
| 40. | Black Mountain | 1.3% | 4.5%(-3.20)#40 | 4.5%(-3.17)#1,905 |
| 41. | Troy | 1.3% | 4.5%(-3.19)#41 | 4.5%(-3.16)#1,933 |
| 42. | Banner Elk | 1.3% | 4.5%(-3.18)#42 | 4.5%(-3.15)#1,956 |
| 43. | Walkertown | 1.3% | 4.5%(-3.16)#43 | 4.5%(-3.13)#1,999 |
| 44. | Broadway | 1.3% | 4.5%(-3.16)#44 | 4.5%(-3.13)#2,005 |
| 45. | Richfield | 1.3% | 4.5%(-3.14)#45 | 4.5%(-3.12)#2,061 |
| 46. | Newton Grove | 1.4% | 4.5%(-3.14)#46 | 4.5%(-3.11)#2,077 |
| 47. | Caswell Beach | 1.4% | 4.5%(-3.11)#47 | 4.5%(-3.08)#2,158 |
| 48. | Whitsett | 1.4% | 4.5%(-3.10)#48 | 4.5%(-3.07)#2,172 |
| 49. | Southern Pines | 1.4% | 4.5%(-3.08)#49 | 4.5%(-3.06)#2,220 |
| 50. | Mount Pleasant | 1.4% | 4.5%(-3.08)#50 | 4.5%(-3.05)#2,231 |
| 51. | Pine Knoll Shores | 1.4% | 4.5%(-3.08)#51 | 4.5%(-3.05)#2,239 |
| 52. | Southport | 1.4% | 4.5%(-3.06)#52 | 4.5%(-3.03)#2,279 |
| 53. | Saluda | 1.4% | 4.5%(-3.06)#53 | 4.5%(-3.03)#2,285 |
| 54. | Huntersville | 1.4% | 4.5%(-3.05)#54 | 4.5%(-3.03)#2,298 |
| 55. | Sharpsburg | 1.4% | 4.5%(-3.05)#55 | 4.5%(-3.02)#2,310 |
| 56. | Holly Ridge | 1.5% | 4.5%(-3.03)#56 | 4.5%(-3.01)#2,357 |
| 57. | Murraysville | 1.5% | 4.5%(-3.03)#57 | 4.5%(-3.00)#2,371 |
| 58. | Midway | 1.5% | 4.5%(-2.98)#58 | 4.5%(-2.95)#2,504 |
| 59. | Ogden | 1.5% | 4.5%(-2.95)#59 | 4.5%(-2.92)#2,587 |
| 60. | North Topsail Beach | 1.6% | 4.5%(-2.91)#60 | 4.5%(-2.88)#2,684 |
| 61. | Weaverville | 1.6% | 4.5%(-2.89)#61 | 4.5%(-2.87)#2,738 |
| 62. | Angier | 1.6% | 4.5%(-2.89)#62 | 4.5%(-2.87)#2,739 |
| 63. | Tarboro | 1.6% | 4.5%(-2.89)#63 | 4.5%(-2.86)#2,753 |
| 64. | Cornelius | 1.6% | 4.5%(-2.89)#64 | 4.5%(-2.86)#2,754 |
| 65. | Taylortown | 1.6% | 4.5%(-2.87)#65 | 4.5%(-2.85)#2,781 |
| 66. | East Flat Rock | 1.6% | 4.5%(-2.86)#66 | 4.5%(-2.84)#2,816 |
| 67. | East Rockingham | 1.6% | 4.5%(-2.86)#67 | 4.5%(-2.84)#2,817 |
| 68. | Lake Waccamaw | 1.6% | 4.5%(-2.85)#68 | 4.5%(-2.83)#2,844 |
| 69. | Foxfire | 1.6% | 4.5%(-2.85)#69 | 4.5%(-2.82)#2,856 |
| 70. | Norlina | 1.7% | 4.5%(-2.83)#70 | 4.5%(-2.81)#2,907 |
| 71. | Holly Springs | 1.7% | 4.5%(-2.81)#71 | 4.5%(-2.79)#2,956 |
| 72. | Dover | 1.7% | 4.5%(-2.79)#72 | 4.5%(-2.77)#3,000 |
| 73. | Sugar Mountain | 1.7% | 4.5%(-2.76)#73 | 4.5%(-2.74)#3,080 |
| 74. | Oriental | 1.7% | 4.5%(-2.75)#74 | 4.5%(-2.72)#3,121 |
| 75. | Elroy | 1.8% | 4.5%(-2.74)#75 | 4.5%(-2.71)#3,142 |
| 76. | Waxhaw | 1.8% | 4.5%(-2.72)#76 | 4.5%(-2.70)#3,165 |
| 77. | Lake Norman Of Catawba | 1.8% | 4.5%(-2.72)#77 | 4.5%(-2.70)#3,166 |
| 78. | Morrisville | 1.8% | 4.5%(-2.69)#78 | 4.5%(-2.66)#3,276 |
| 79. | Wendell | 1.8% | 4.5%(-2.69)#79 | 4.5%(-2.66)#3,278 |
| 80. | Dortches | 1.8% | 4.5%(-2.69)#80 | 4.5%(-2.66)#3,283 |
| 81. | Emerald Isle | 1.8% | 4.5%(-2.68)#81 | 4.5%(-2.66)#3,293 |
| 82. | Wadesboro | 1.8% | 4.5%(-2.67)#82 | 4.5%(-2.65)#3,316 |
| 83. | Cramerton | 1.9% | 4.5%(-2.64)#83 | 4.5%(-2.61)#3,394 |
| 84. | Lake Junaluska | 1.9% | 4.5%(-2.62)#84 | 4.5%(-2.60)#3,432 |
| 85. | Mount Gilead | 1.9% | 4.5%(-2.61)#85 | 4.5%(-2.59)#3,463 |
| 86. | King | 1.9% | 4.5%(-2.60)#86 | 4.5%(-2.58)#3,482 |
| 87. | Albemarle | 1.9% | 4.5%(-2.60)#87 | 4.5%(-2.57)#3,502 |
| 88. | Youngsville | 1.9% | 4.5%(-2.55)#88 | 4.5%(-2.52)#3,601 |
| 89. | Brices Creek | 1.9% | 4.5%(-2.54)#89 | 4.5%(-2.52)#3,613 |
| 90. | Wallace | 2.0% | 4.5%(-2.53)#90 | 4.5%(-2.50)#3,643 |
| 91. | Jamesville | 2.0% | 4.5%(-2.53)#91 | 4.5%(-2.50)#3,663 |
| 92. | Leland | 2.0% | 4.5%(-2.50)#92 | 4.5%(-2.47)#3,741 |
| 93. | Indian Trail | 2.0% | 4.5%(-2.49)#93 | 4.5%(-2.47)#3,744 |
| 94. | Mills River | 2.0% | 4.5%(-2.49)#94 | 4.5%(-2.46)#3,750 |
| 95. | Grimesland | 2.0% | 4.5%(-2.45)#95 | 4.5%(-2.42)#3,859 |
| 96. | Cedar Rock | 2.1% | 4.5%(-2.43)#96 | 4.5%(-2.40)#3,908 |
| 97. | Carrboro | 2.1% | 4.5%(-2.41)#97 | 4.5%(-2.39)#3,945 |
| 98. | Concord | 2.1% | 4.5%(-2.38)#98 | 4.5%(-2.36)#4,033 |
| 99. | Silver Lake | 2.1% | 4.5%(-2.38)#99 | 4.5%(-2.35)#4,055 |
| 100. | Cary | 2.1% | 4.5%(-2.38)#100 | 4.5%(-2.35)#4,061 |
Common Questions
What are the Top 10 Cities with the Lowest Poverty Level Among Married Couples in North Carolina?
Top 10 Cities with the Lowest Poverty Level Among Married Couples in North Carolina are:
#1
0.14%
#2
0.21%
#3
0.33%
#4
0.40%
#5
0.49%
#6
0.53%
#7
0.56%
#8
0.57%
#9
0.59%
#10
0.60%
What city has the Lowest Poverty Level Among Married Couples in North Carolina?
Weddington has the Lowest Poverty Level Among Married Couples in North Carolina with 0.14%.
What is the Poverty Level Among Married Couples in the State of North Carolina?
Poverty Level Among Married Couples in North Carolina is 4.5%.
What is the Poverty Level Among Married Couples in the United States?
Poverty Level Among Married Couples in the United States is 4.5%.