White Lake, NC
White Lake Map
White Lake Overview
997
TOTAL POPULATION
556
MALE POPULATION
441
FEMALE POPULATION
126.08
MALES / 100 FEMALES
79.32
FEMALES / 100 MALES
60.5
MEDIAN AGE
3.2
AVG FAMILY SIZE
2.4
AVG HOUSEHOLD SIZE
$34,490
PER CAPITA INCOME
$80,517
AVG FAMILY INCOME
$58,421
AVG HOUSEHOLD INCOME
1.5%
WAGE / INCOME GAP [ % ]
98.5¢/ $1
WAGE / INCOME GAP [ $ ]
0.45
INEQUALITY / GINI INDEX
314
LABOR FORCE [ PEOPLE ]
36.2%
PERCENT IN LABOR FORCE
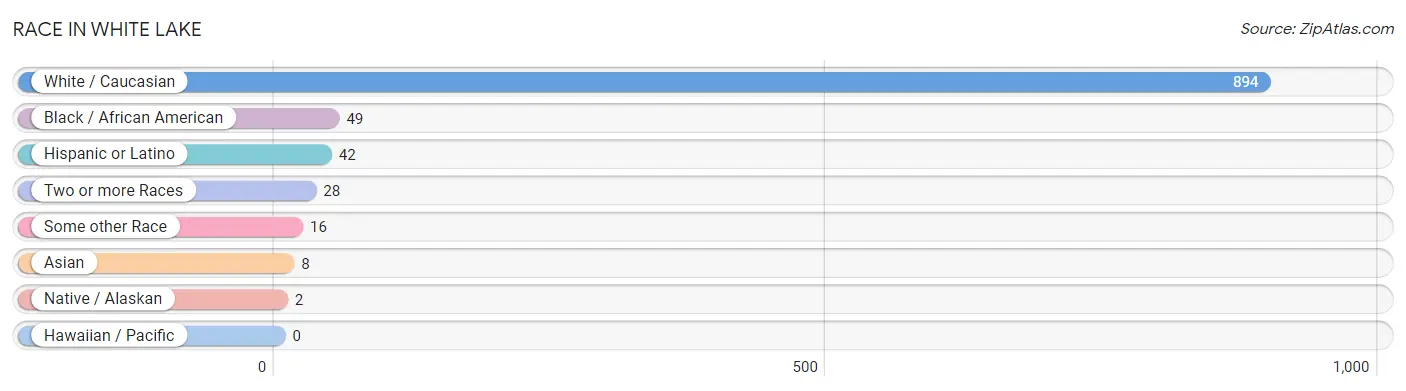
Race in White Lake
The most populous races in White Lake are White / Caucasian (894 | 89.7%), Black / African American (49 | 4.9%), and Hispanic or Latino (42 | 4.2%).
| Race | # Population | % Population |
| Asian | 8 | 0.8% |
| Black / African American | 49 | 4.9% |
| Hawaiian / Pacific | 0 | 0.0% |
| Hispanic or Latino | 42 | 4.2% |
| Native / Alaskan | 2 | 0.2% |
| White / Caucasian | 894 | 89.7% |
| Two or more Races | 28 | 2.8% |
| Some other Race | 16 | 1.6% |
| Total | 997 | 100.0% |
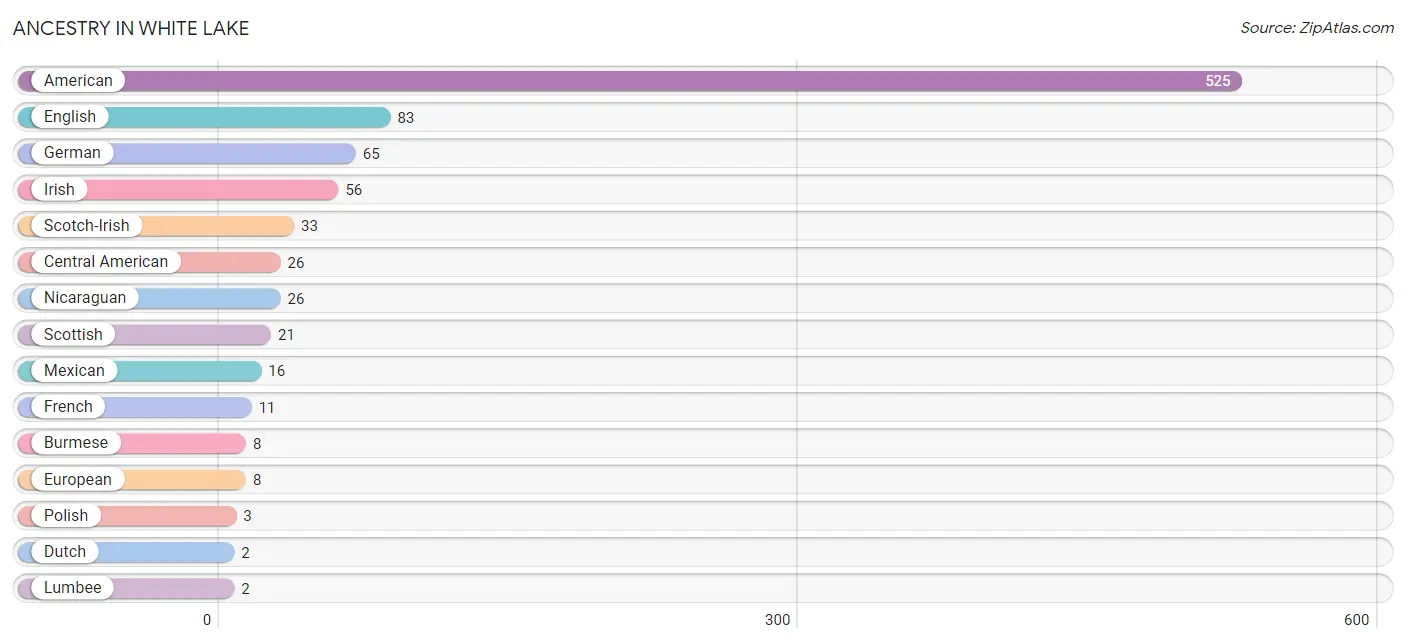
Ancestry in White Lake
The most populous ancestries reported in White Lake are American (525 | 52.7%), English (83 | 8.3%), German (65 | 6.5%), Irish (56 | 5.6%), and Scotch-Irish (33 | 3.3%), together accounting for 76.4% of all White Lake residents.
| Ancestry | # Population | % Population |
| American | 525 | 52.7% |
| British | 1 | 0.1% |
| Burmese | 8 | 0.8% |
| Central American | 26 | 2.6% |
| Dutch | 2 | 0.2% |
| English | 83 | 8.3% |
| European | 8 | 0.8% |
| French | 11 | 1.1% |
| German | 65 | 6.5% |
| Irish | 56 | 5.6% |
| Lumbee | 2 | 0.2% |
| Mexican | 16 | 1.6% |
| Nicaraguan | 26 | 2.6% |
| Norwegian | 2 | 0.2% |
| Polish | 3 | 0.3% |
| Scotch-Irish | 33 | 3.3% |
| Scottish | 21 | 2.1% | View All 17 Rows |
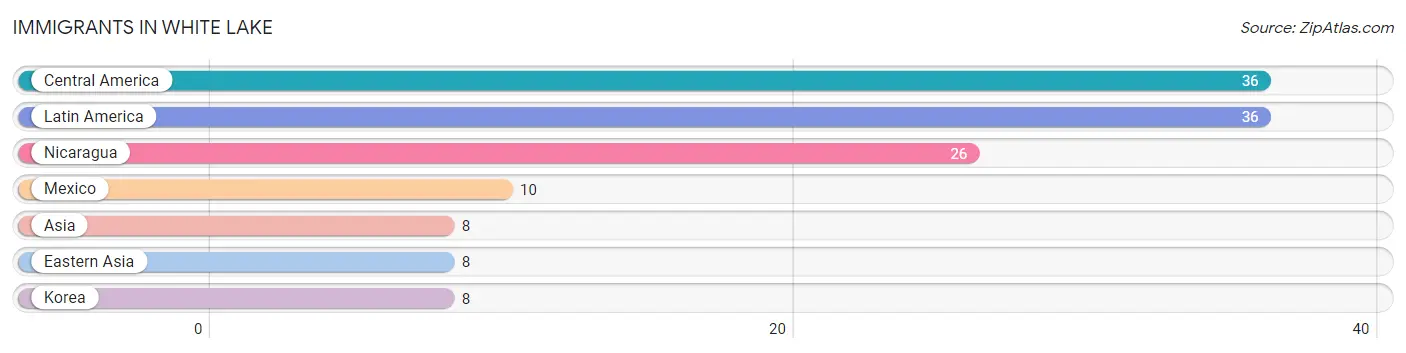
Immigrants in White Lake
The most numerous immigrant groups reported in White Lake came from Central America (36 | 3.6%), Latin America (36 | 3.6%), Nicaragua (26 | 2.6%), Mexico (10 | 1.0%), and Asia (8 | 0.8%), together accounting for 11.6% of all White Lake residents.
| Immigration Origin | # Population | % Population |
| Asia | 8 | 0.8% |
| Central America | 36 | 3.6% |
| Eastern Asia | 8 | 0.8% |
| Korea | 8 | 0.8% |
| Latin America | 36 | 3.6% |
| Mexico | 10 | 1.0% |
| Nicaragua | 26 | 2.6% | View All 7 Rows |
Sex and Age in White Lake
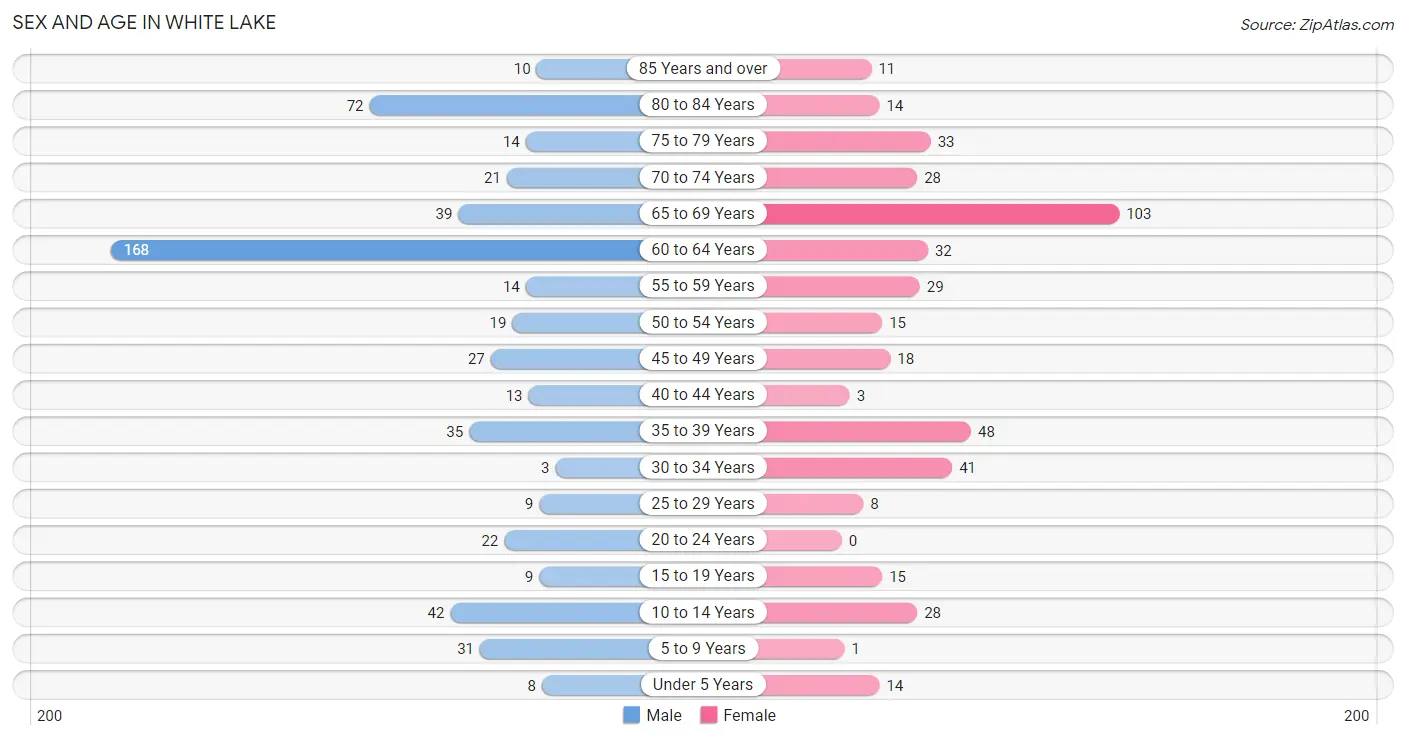
Sex and Age in White Lake
The most populous age groups in White Lake are 60 to 64 Years (168 | 30.2%) for men and 65 to 69 Years (103 | 23.4%) for women.
| Age Bracket | Male | Female |
| Under 5 Years | 8 (1.4%) | 14 (3.2%) |
| 5 to 9 Years | 31 (5.6%) | 1 (0.2%) |
| 10 to 14 Years | 42 (7.5%) | 28 (6.4%) |
| 15 to 19 Years | 9 (1.6%) | 15 (3.4%) |
| 20 to 24 Years | 22 (4.0%) | 0 (0.0%) |
| 25 to 29 Years | 9 (1.6%) | 8 (1.8%) |
| 30 to 34 Years | 3 (0.5%) | 41 (9.3%) |
| 35 to 39 Years | 35 (6.3%) | 48 (10.9%) |
| 40 to 44 Years | 13 (2.3%) | 3 (0.7%) |
| 45 to 49 Years | 27 (4.9%) | 18 (4.1%) |
| 50 to 54 Years | 19 (3.4%) | 15 (3.4%) |
| 55 to 59 Years | 14 (2.5%) | 29 (6.6%) |
| 60 to 64 Years | 168 (30.2%) | 32 (7.3%) |
| 65 to 69 Years | 39 (7.0%) | 103 (23.4%) |
| 70 to 74 Years | 21 (3.8%) | 28 (6.4%) |
| 75 to 79 Years | 14 (2.5%) | 33 (7.5%) |
| 80 to 84 Years | 72 (13.0%) | 14 (3.2%) |
| 85 Years and over | 10 (1.8%) | 11 (2.5%) |
| Total | 556 (100.0%) | 441 (100.0%) |
Families and Households in White Lake
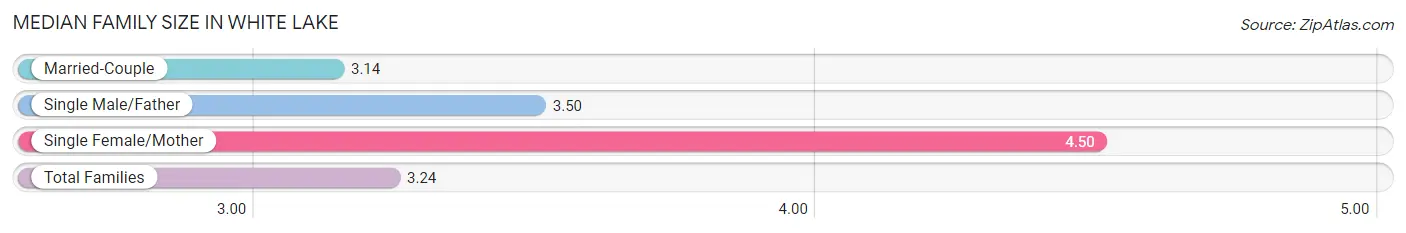
Median Family Size in White Lake
The median family size in White Lake is 3.24 persons per family, with single female/mother families (14 | 6.5%) accounting for the largest median family size of 4.5 persons per family. On the other hand, married-couple families (194 | 90.6%) represent the smallest median family size with 3.14 persons per family.
| Family Type | # Families | Family Size |
| Married-Couple | 194 (90.6%) | 3.14 |
| Single Male/Father | 6 (2.8%) | 3.50 |
| Single Female/Mother | 14 (6.5%) | 4.50 |
| Total Families | 214 (100.0%) | 3.24 |
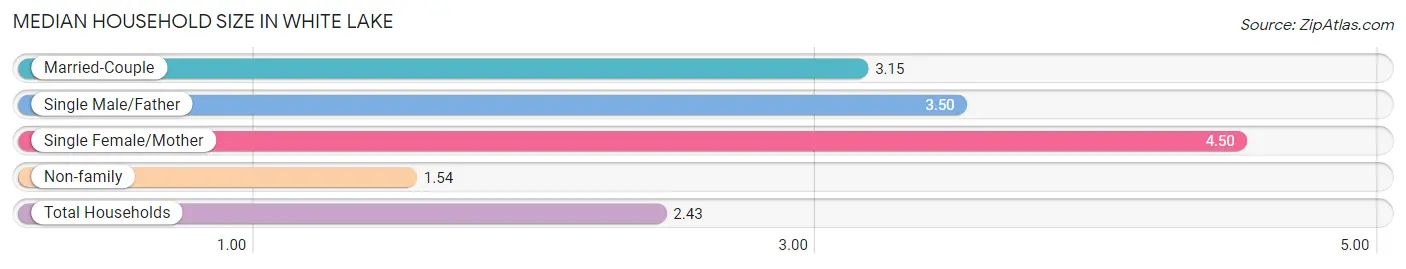
Median Household Size in White Lake
The median household size in White Lake is 2.43 persons per household, with single female/mother households (14 | 3.4%) accounting for the largest median household size of 4.5 persons per household. non-family households (196 | 47.8%) represent the smallest median household size with 1.54 persons per household.
| Household Type | # Households | Household Size |
| Married-Couple | 194 (47.3%) | 3.15 |
| Single Male/Father | 6 (1.5%) | 3.50 |
| Single Female/Mother | 14 (3.4%) | 4.50 |
| Non-family | 196 (47.8%) | 1.54 |
| Total Households | 410 (100.0%) | 2.43 |
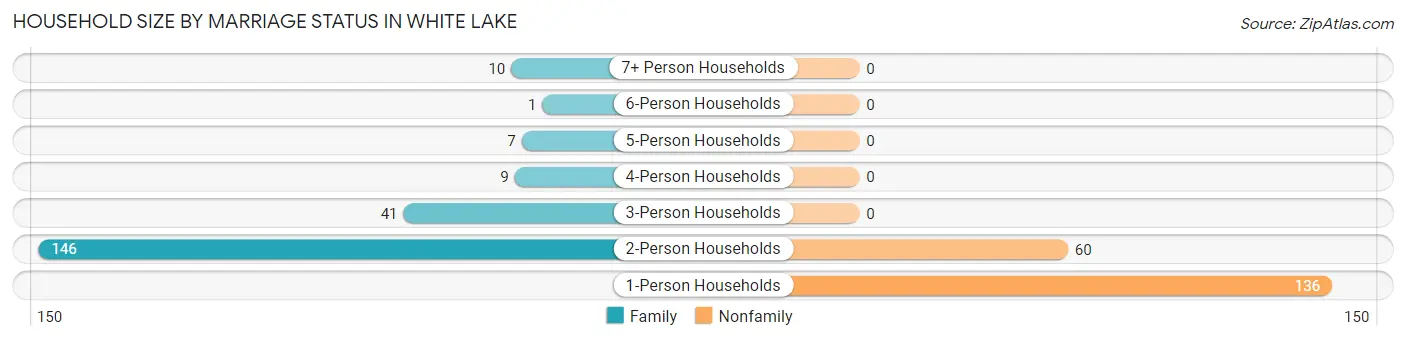
Household Size by Marriage Status in White Lake
Out of a total of 410 households in White Lake, 214 (52.2%) are family households, while 196 (47.8%) are nonfamily households. The most numerous type of family households are 2-person households, comprising 146, and the most common type of nonfamily households are 1-person households, comprising 136.
| Household Size | Family Households | Nonfamily Households |
| 1-Person Households | - | 136 (33.2%) |
| 2-Person Households | 146 (35.6%) | 60 (14.6%) |
| 3-Person Households | 41 (10.0%) | 0 (0.0%) |
| 4-Person Households | 9 (2.2%) | 0 (0.0%) |
| 5-Person Households | 7 (1.7%) | 0 (0.0%) |
| 6-Person Households | 1 (0.2%) | 0 (0.0%) |
| 7+ Person Households | 10 (2.4%) | 0 (0.0%) |
| Total | 214 (52.2%) | 196 (47.8%) |
Female Fertility in White Lake
Fertility by Age in White Lake
| Age Bracket | Women with Births | Births / 1,000 Women |
| 15 to 19 years | 0 (0.0%) | 0.0 |
| 20 to 34 years | 0 (0.0%) | 0.0 |
| 35 to 50 years | 0 (0.0%) | 0.0 |
| Total | 0 (0.0%) | 0.0 |
Fertility by Age by Marriage Status in White Lake
| Age Bracket | Married | Unmarried |
| 15 to 19 years | 0 (0.0%) | 0 (0.0%) |
| 20 to 34 years | 0 (0.0%) | 0 (0.0%) |
| 35 to 50 years | 0 (0.0%) | 0 (0.0%) |
| Total | 0 (0.0%) | 0 (0.0%) |
Fertility by Education in White Lake
| Educational Attainment | Women with Births | Births / 1,000 Women |
| Less than High School | 0 (0.0%) | 0.0 |
| High School Diploma | 0 (0.0%) | 0.0 |
| College or Associate's Degree | 0 (0.0%) | 0.0 |
| Bachelor's Degree | 0 (0.0%) | 0.0 |
| Graduate Degree | 0 (0.0%) | 0.0 |
| Total | 0 (0.0%) | 0.0 |
Fertility by Education by Marriage Status in White Lake
| Educational Attainment | Married | Unmarried |
| Less than High School | 0 (0.0%) | 0 (0.0%) |
| High School Diploma | 0 (0.0%) | 0 (0.0%) |
| College or Associate's Degree | 0 (0.0%) | 0 (0.0%) |
| Bachelor's Degree | 0 (0.0%) | 0 (0.0%) |
| Graduate Degree | 0 (0.0%) | 0 (0.0%) |
| Total | 0 (0.0%) | 0 (0.0%) |
Income in White Lake
Income Overview in White Lake
Per Capita Income in White Lake is $34,490, while median incomes of families and households are $80,517 and $58,421 respectively.
| Characteristic | Number | Measure |
| Per Capita Income | 997 | $34,490 |
| Median Family Income | 214 | $80,517 |
| Mean Family Income | 214 | $95,511 |
| Median Household Income | 410 | $58,421 |
| Mean Household Income | 410 | $71,559 |
| Income Deficit | 214 | $0 |
| Wage / Income Gap (%) | 997 | 1.49% |
| Wage / Income Gap ($) | 997 | 98.51¢ per $1 |
| Gini / Inequality Index | 997 | 0.45 |
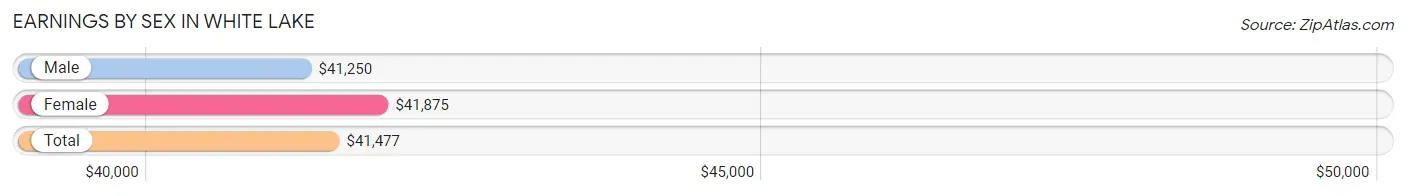
Earnings by Sex in White Lake
Average Earnings in White Lake are $41,477, $41,250 for men and $41,875 for women, a difference of 1.5%.
| Sex | Number | Average Earnings |
| Male | 184 (50.0%) | $41,250 |
| Female | 184 (50.0%) | $41,875 |
| Total | 368 (100.0%) | $41,477 |
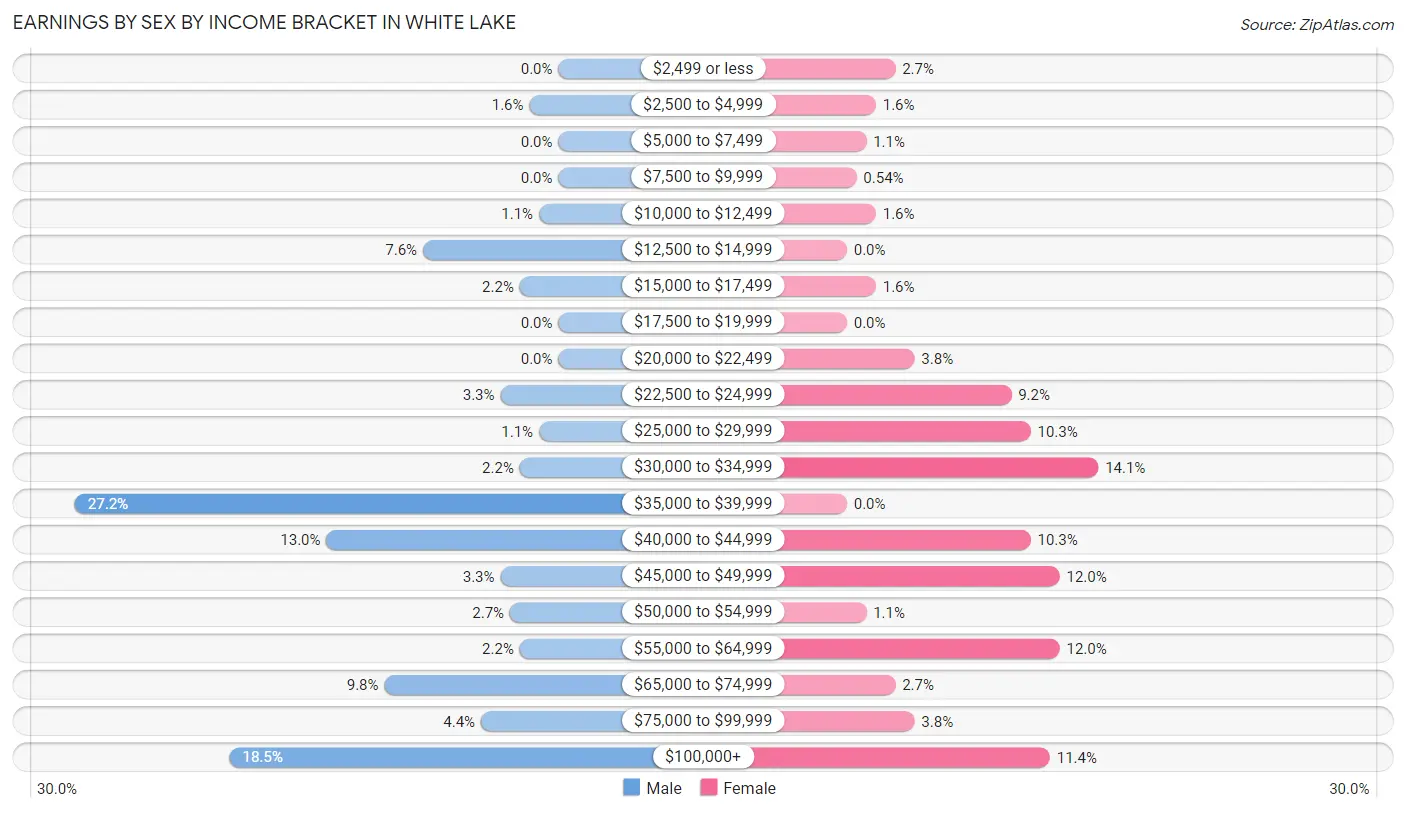
Earnings by Sex by Income Bracket in White Lake
The most common earnings brackets in White Lake are $35,000 to $39,999 for men (50 | 27.2%) and $30,000 to $34,999 for women (26 | 14.1%).
| Income | Male | Female |
| $2,499 or less | 0 (0.0%) | 5 (2.7%) |
| $2,500 to $4,999 | 3 (1.6%) | 3 (1.6%) |
| $5,000 to $7,499 | 0 (0.0%) | 2 (1.1%) |
| $7,500 to $9,999 | 0 (0.0%) | 1 (0.5%) |
| $10,000 to $12,499 | 2 (1.1%) | 3 (1.6%) |
| $12,500 to $14,999 | 14 (7.6%) | 0 (0.0%) |
| $15,000 to $17,499 | 4 (2.2%) | 3 (1.6%) |
| $17,500 to $19,999 | 0 (0.0%) | 0 (0.0%) |
| $20,000 to $22,499 | 0 (0.0%) | 7 (3.8%) |
| $22,500 to $24,999 | 6 (3.3%) | 17 (9.2%) |
| $25,000 to $29,999 | 2 (1.1%) | 19 (10.3%) |
| $30,000 to $34,999 | 4 (2.2%) | 26 (14.1%) |
| $35,000 to $39,999 | 50 (27.2%) | 0 (0.0%) |
| $40,000 to $44,999 | 24 (13.0%) | 19 (10.3%) |
| $45,000 to $49,999 | 6 (3.3%) | 22 (12.0%) |
| $50,000 to $54,999 | 5 (2.7%) | 2 (1.1%) |
| $55,000 to $64,999 | 4 (2.2%) | 22 (12.0%) |
| $65,000 to $74,999 | 18 (9.8%) | 5 (2.7%) |
| $75,000 to $99,999 | 8 (4.3%) | 7 (3.8%) |
| $100,000+ | 34 (18.5%) | 21 (11.4%) |
| Total | 184 (100.0%) | 184 (100.0%) |
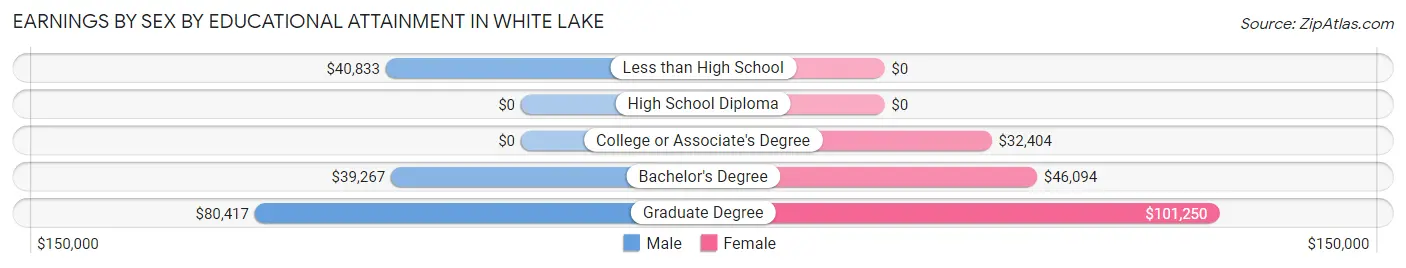
Earnings by Sex by Educational Attainment in White Lake
Average earnings in White Lake are $41,518 for men and $42,500 for women, a difference of 2.3%. Men with an educational attainment of graduate degree enjoy the highest average annual earnings of $80,417, while those with bachelor's degree education earn the least with $39,267. Women with an educational attainment of graduate degree earn the most with the average annual earnings of $101,250, while those with college or associate's degree education have the smallest earnings of $32,404.
| Educational Attainment | Male Income | Female Income |
| Less than High School | $40,833 | $0 |
| High School Diploma | - | - |
| College or Associate's Degree | - | - |
| Bachelor's Degree | $39,267 | $46,094 |
| Graduate Degree | $80,417 | $101,250 |
| Total | $41,518 | $42,500 |
Family Income in White Lake
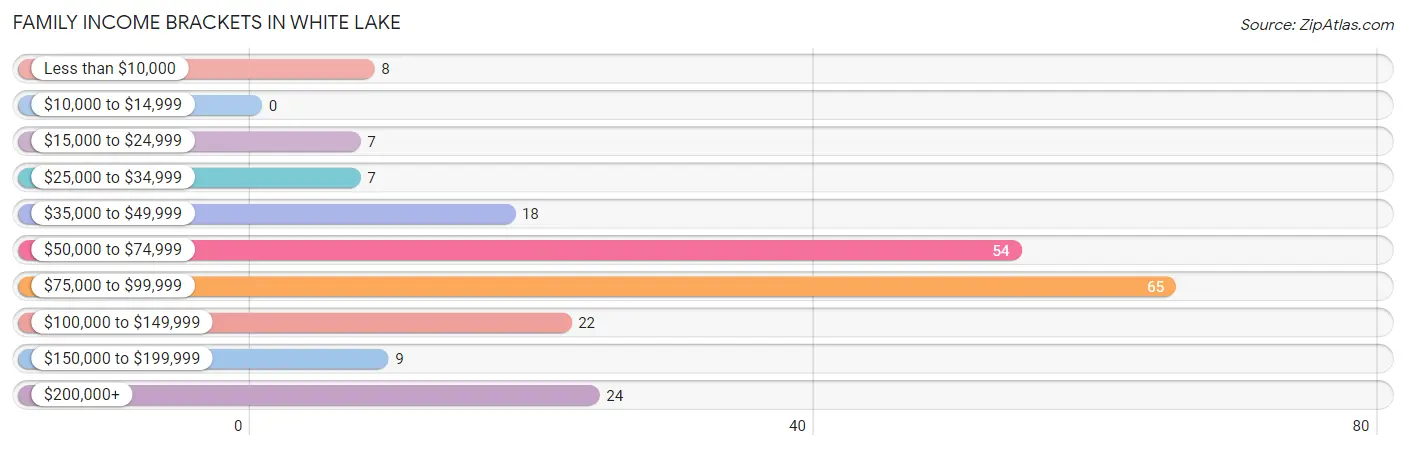
Family Income Brackets in White Lake
According to the White Lake family income data, there are 65 families falling into the $75,000 to $99,999 income range, which is the most common income bracket and makes up 30.4% of all families.
| Income Bracket | # Families | % Families |
| Less than $10,000 | 8 | 3.7% |
| $10,000 to $14,999 | 0 | 0.0% |
| $15,000 to $24,999 | 7 | 3.3% |
| $25,000 to $34,999 | 7 | 3.3% |
| $35,000 to $49,999 | 18 | 8.4% |
| $50,000 to $74,999 | 54 | 25.2% |
| $75,000 to $99,999 | 65 | 30.4% |
| $100,000 to $149,999 | 22 | 10.3% |
| $150,000 to $199,999 | 9 | 4.2% |
| $200,000+ | 24 | 11.2% |
Family Income by Famaliy Size in White Lake
2-person families (146 | 68.2%) account for the highest median family income in White Lake with $80,543 per family, while 2-person families (146 | 68.2%) have the highest median income of $40,272 per family member.
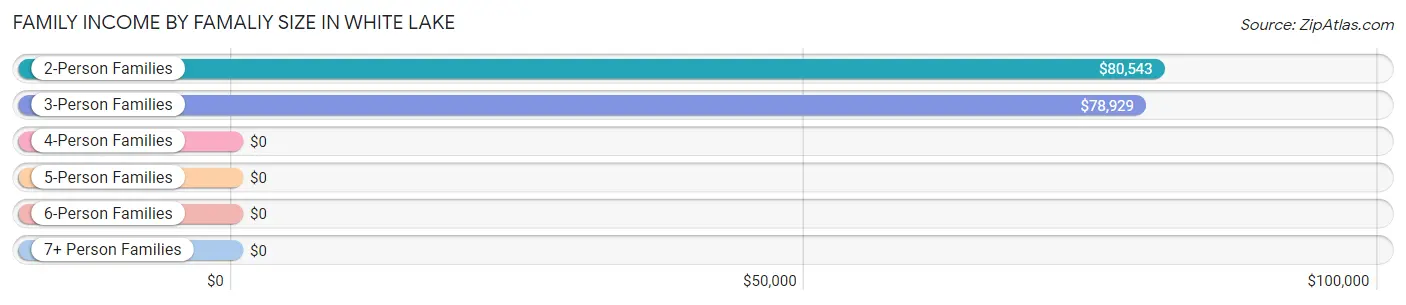
| Income Bracket | # Families | Median Income |
| 2-Person Families | 146 (68.2%) | $80,543 |
| 3-Person Families | 42 (19.6%) | $78,929 |
| 4-Person Families | 8 (3.7%) | $0 |
| 5-Person Families | 7 (3.3%) | $0 |
| 6-Person Families | 1 (0.5%) | $0 |
| 7+ Person Families | 10 (4.7%) | $0 |
| Total | 214 (100.0%) | $80,517 |
Family Income by Number of Earners in White Lake
The median family income in White Lake is $80,517, with families comprising 3+ earners (15) having the highest median family income of $250,001, while families with no earners (66) have the lowest median family income of $56,250, accounting for 7.0% and 30.8% of families, respectively.
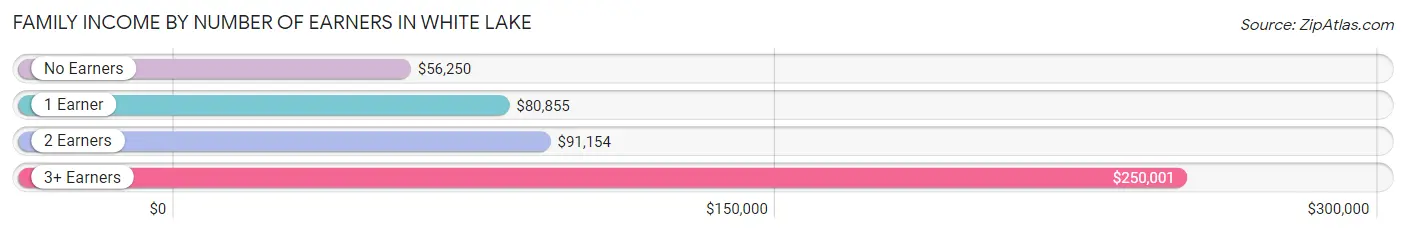
| Number of Earners | # Families | Median Income |
| No Earners | 66 (30.8%) | $56,250 |
| 1 Earner | 71 (33.2%) | $80,855 |
| 2 Earners | 62 (29.0%) | $91,154 |
| 3+ Earners | 15 (7.0%) | $250,001 |
| Total | 214 (100.0%) | $80,517 |
Household Income in White Lake
Household Income Brackets in White Lake
With 75 households falling in the category, the $75,000 to $99,999 income range is the most frequent in White Lake, accounting for 18.3% of all households. In contrast, only 9 households (2.2%) fall into the $150,000 to $199,999 income bracket, making it the least populous group.
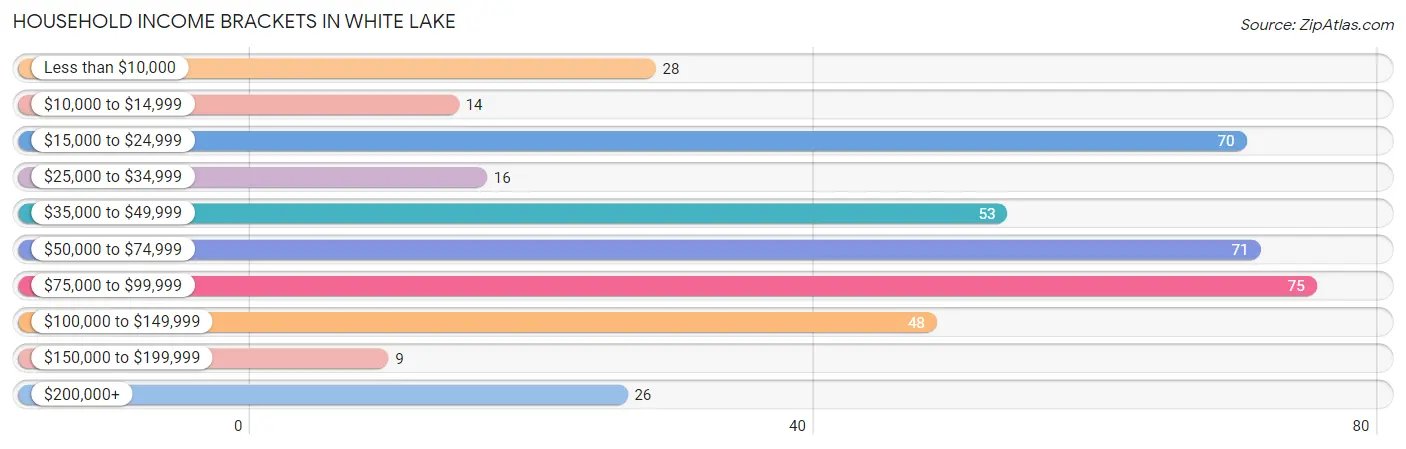
| Income Bracket | # Households | % Households |
| Less than $10,000 | 28 | 6.8% |
| $10,000 to $14,999 | 14 | 3.4% |
| $15,000 to $24,999 | 70 | 17.1% |
| $25,000 to $34,999 | 16 | 3.9% |
| $35,000 to $49,999 | 53 | 12.9% |
| $50,000 to $74,999 | 71 | 17.3% |
| $75,000 to $99,999 | 75 | 18.3% |
| $100,000 to $149,999 | 48 | 11.7% |
| $150,000 to $199,999 | 9 | 2.2% |
| $200,000+ | 26 | 6.3% |
Household Income by Householder Age in White Lake
The median household income in White Lake is $58,421, with the highest median household income of $91,923 found in the 25 to 44 years age bracket for the primary householder. A total of 70 households (17.1%) fall into this category.
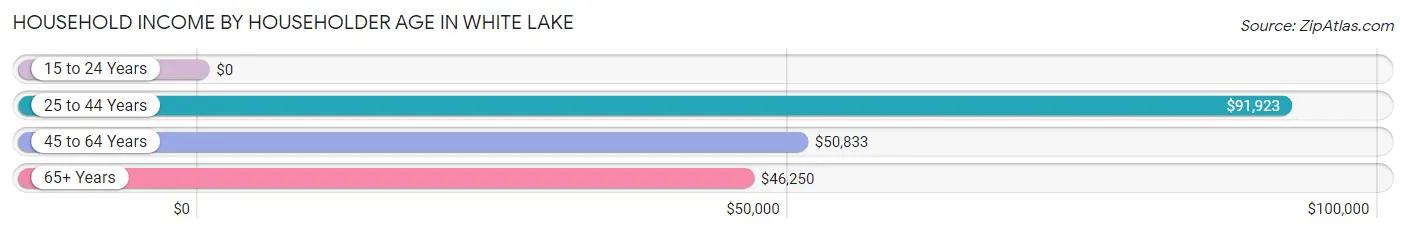
| Income Bracket | # Households | Median Income |
| 15 to 24 Years | 0 (0.0%) | $0 |
| 25 to 44 Years | 70 (17.1%) | $91,923 |
| 45 to 64 Years | 98 (23.9%) | $50,833 |
| 65+ Years | 242 (59.0%) | $46,250 |
| Total | 410 (100.0%) | $58,421 |
Poverty in White Lake
Income Below Poverty by Sex and Age in White Lake
With 26.6% poverty level for males and 11.2% for females among the residents of White Lake, 55 to 64 year old males and under 5 year old females are the most vulnerable to poverty, with 99 males (54.4%) and 6 females (60.0%) in their respective age groups living below the poverty level.
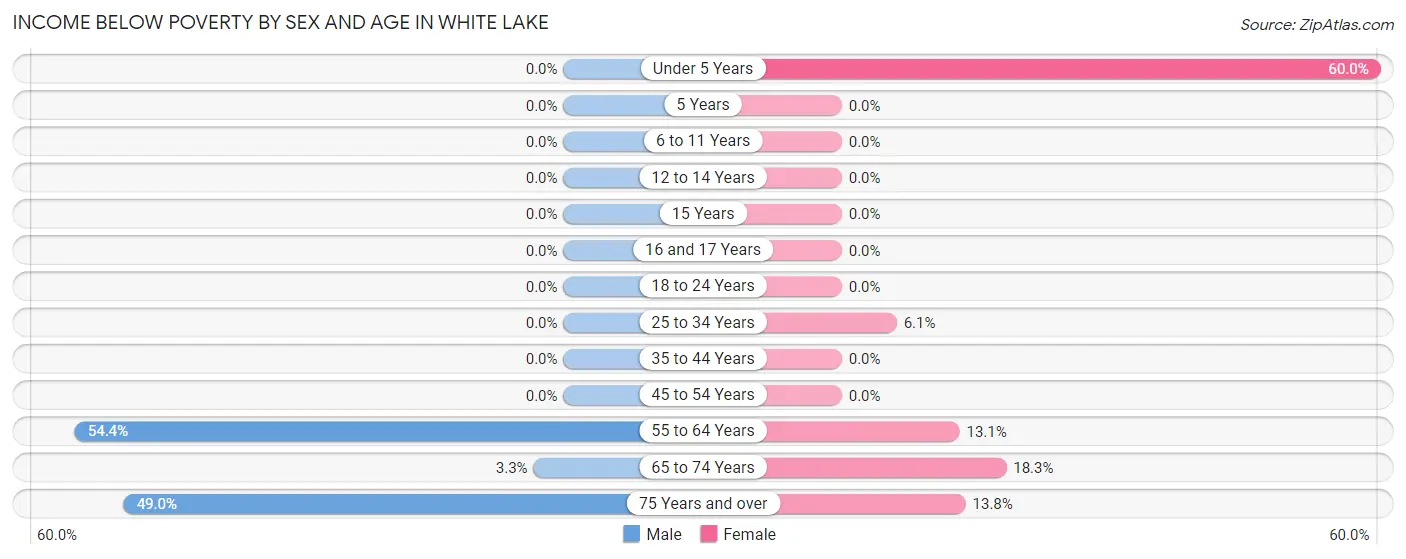
| Age Bracket | Male | Female |
| Under 5 Years | 0 (0.0%) | 6 (60.0%) |
| 5 Years | 0 (0.0%) | 0 (0.0%) |
| 6 to 11 Years | 0 (0.0%) | 0 (0.0%) |
| 12 to 14 Years | 0 (0.0%) | 0 (0.0%) |
| 15 Years | 0 (0.0%) | 0 (0.0%) |
| 16 and 17 Years | 0 (0.0%) | 0 (0.0%) |
| 18 to 24 Years | 0 (0.0%) | 0 (0.0%) |
| 25 to 34 Years | 0 (0.0%) | 3 (6.1%) |
| 35 to 44 Years | 0 (0.0%) | 0 (0.0%) |
| 45 to 54 Years | 0 (0.0%) | 0 (0.0%) |
| 55 to 64 Years | 99 (54.4%) | 8 (13.1%) |
| 65 to 74 Years | 2 (3.3%) | 24 (18.3%) |
| 75 Years and over | 47 (49.0%) | 8 (13.8%) |
| Total | 148 (26.6%) | 49 (11.2%) |
Income Above Poverty by Sex and Age in White Lake
According to the poverty statistics in White Lake, males aged under 5 years and females aged 6 to 11 years are the age groups that are most secure financially, with 100.0% of males and 100.0% of females in these age groups living above the poverty line.
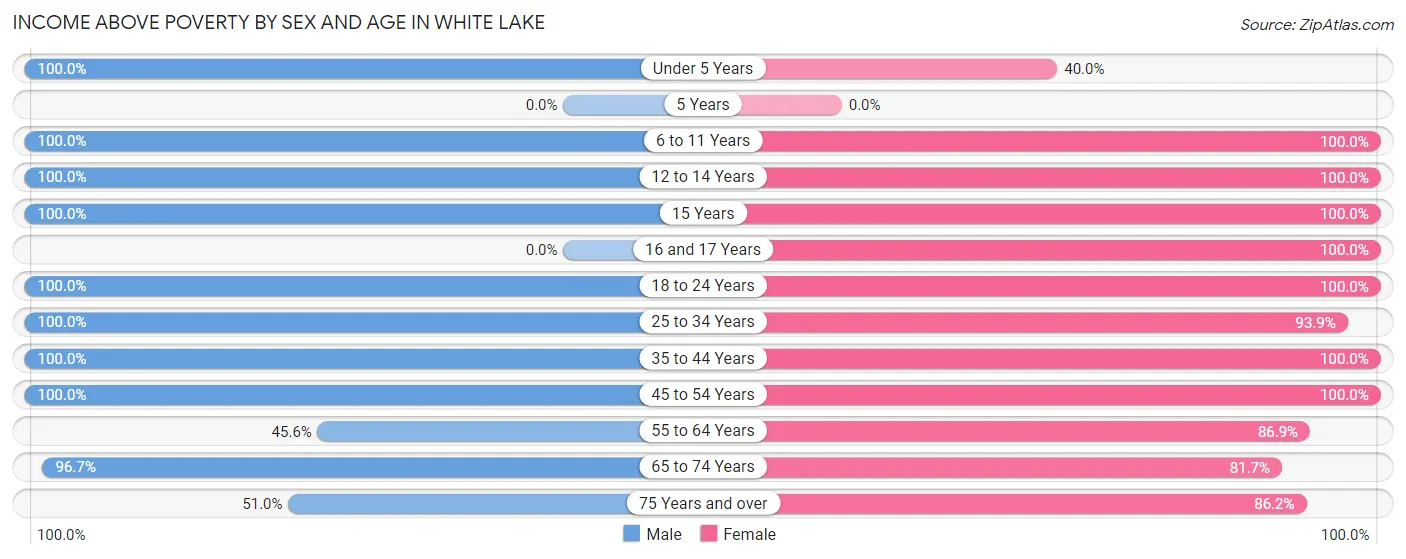
| Age Bracket | Male | Female |
| Under 5 Years | 8 (100.0%) | 4 (40.0%) |
| 5 Years | 0 (0.0%) | 0 (0.0%) |
| 6 to 11 Years | 49 (100.0%) | 13 (100.0%) |
| 12 to 14 Years | 24 (100.0%) | 15 (100.0%) |
| 15 Years | 3 (100.0%) | 3 (100.0%) |
| 16 and 17 Years | 0 (0.0%) | 2 (100.0%) |
| 18 to 24 Years | 28 (100.0%) | 10 (100.0%) |
| 25 to 34 Years | 12 (100.0%) | 46 (93.9%) |
| 35 to 44 Years | 48 (100.0%) | 51 (100.0%) |
| 45 to 54 Years | 46 (100.0%) | 33 (100.0%) |
| 55 to 64 Years | 83 (45.6%) | 53 (86.9%) |
| 65 to 74 Years | 58 (96.7%) | 107 (81.7%) |
| 75 Years and over | 49 (51.0%) | 50 (86.2%) |
| Total | 408 (73.4%) | 387 (88.8%) |
Income Below Poverty Among Married-Couple Families in White Lake
The poverty statistics for married-couple families in White Lake show that 4.1% or 8 of the total 194 families live below the poverty line. Families with no children have the highest poverty rate of 5.0%, comprising of 8 families. On the other hand, families with 1 or 2 children have the lowest poverty rate of 0.0%, which includes 0 families.

| Children | Above Poverty | Below Poverty |
| No Children | 151 (95.0%) | 8 (5.0%) |
| 1 or 2 Children | 19 (100.0%) | 0 (0.0%) |
| 3 or 4 Children | 6 (100.0%) | 0 (0.0%) |
| 5 or more Children | 10 (100.0%) | 0 (0.0%) |
| Total | 186 (95.9%) | 8 (4.1%) |
Income Below Poverty Among Single-Parent Households in White Lake
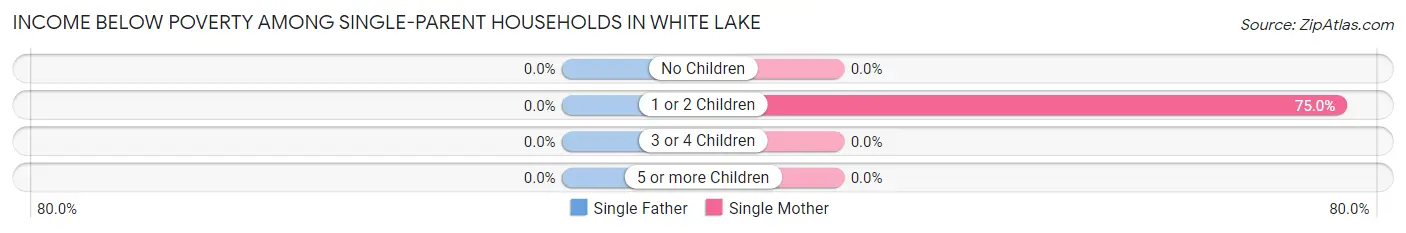
| Children | Single Father | Single Mother |
| No Children | 0 (0.0%) | 0 (0.0%) |
| 1 or 2 Children | 0 (0.0%) | 3 (75.0%) |
| 3 or 4 Children | 0 (0.0%) | 0 (0.0%) |
| 5 or more Children | 0 (0.0%) | 0 (0.0%) |
| Total | 0 (0.0%) | 3 (21.4%) |
Income Below Poverty Among Married-Couple vs Single-Parent Households in White Lake
The poverty data for White Lake shows that 8 of the married-couple family households (4.1%) and 3 of the single-parent households (15.0%) are living below the poverty level. Within the married-couple family households, those with no children have the highest poverty rate, with 8 households (5.0%) falling below the poverty line. Among the single-parent households, those with 1 or 2 children have the highest poverty rate, with 3 household (60.0%) living below poverty.
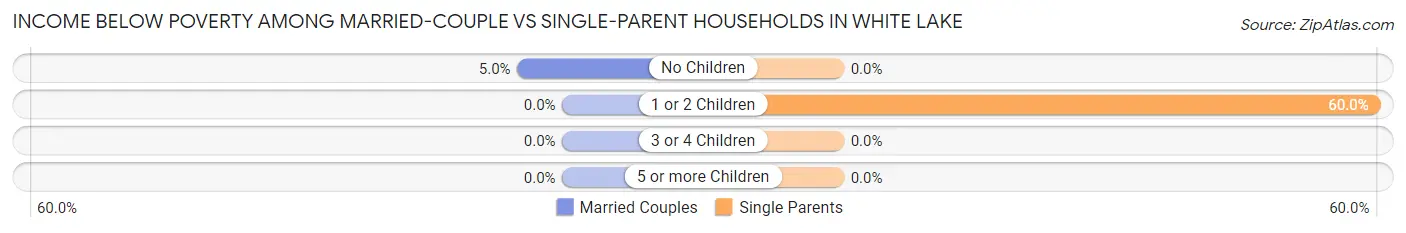
| Children | Married-Couple Families | Single-Parent Households |
| No Children | 8 (5.0%) | 0 (0.0%) |
| 1 or 2 Children | 0 (0.0%) | 3 (60.0%) |
| 3 or 4 Children | 0 (0.0%) | 0 (0.0%) |
| 5 or more Children | 0 (0.0%) | 0 (0.0%) |
| Total | 8 (4.1%) | 3 (15.0%) |
Employment Characteristics in White Lake
Employment by Class of Employer in White Lake
Among the 311 employed individuals in White Lake, private company employees (168 | 54.0%), state government employees (50 | 16.1%), and self-employed (not incorporated) (30 | 9.7%) make up the most common classes of employment.
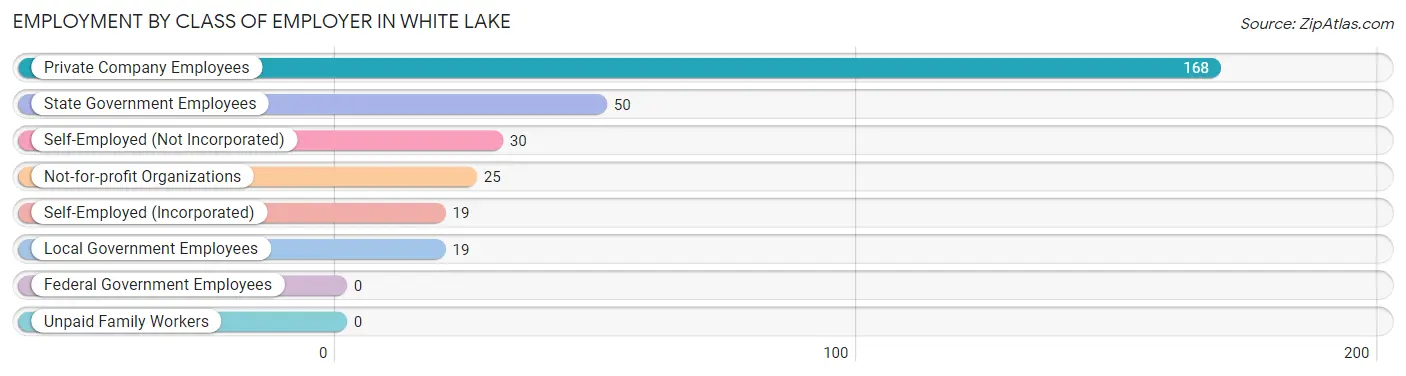
| Employer Class | # Employees | % Employees |
| Private Company Employees | 168 | 54.0% |
| Self-Employed (Incorporated) | 19 | 6.1% |
| Self-Employed (Not Incorporated) | 30 | 9.7% |
| Not-for-profit Organizations | 25 | 8.0% |
| Local Government Employees | 19 | 6.1% |
| State Government Employees | 50 | 16.1% |
| Federal Government Employees | 0 | 0.0% |
| Unpaid Family Workers | 0 | 0.0% |
| Total | 311 | 100.0% |
Employment Status by Age in White Lake
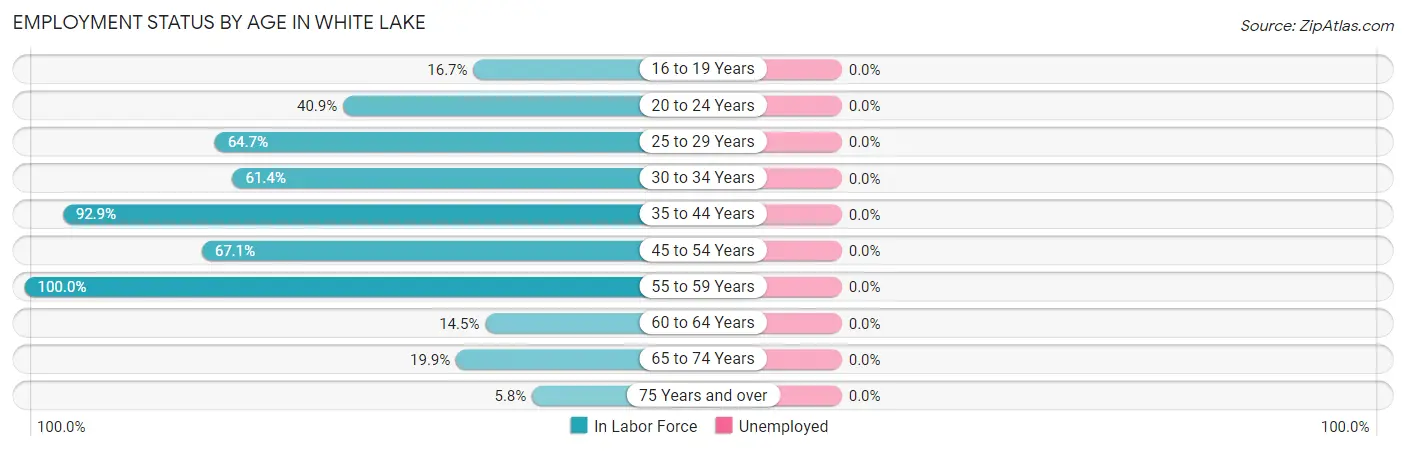
| Age Bracket | In Labor Force | Unemployed |
| 16 to 19 Years | 3 (16.7%) | 0 (0.0%) |
| 20 to 24 Years | 9 (40.9%) | 0 (0.0%) |
| 25 to 29 Years | 11 (64.7%) | 0 (0.0%) |
| 30 to 34 Years | 27 (61.4%) | 0 (0.0%) |
| 35 to 44 Years | 92 (92.9%) | 0 (0.0%) |
| 45 to 54 Years | 53 (67.1%) | 0 (0.0%) |
| 55 to 59 Years | 43 (100.0%) | 0 (0.0%) |
| 60 to 64 Years | 29 (14.5%) | 0 (0.0%) |
| 65 to 74 Years | 38 (19.9%) | 0 (0.0%) |
| 75 Years and over | 9 (5.8%) | 0 (0.0%) |
| Total | 314 (36.2%) | 0 (0.0%) |
Employment Status by Educational Attainment in White Lake
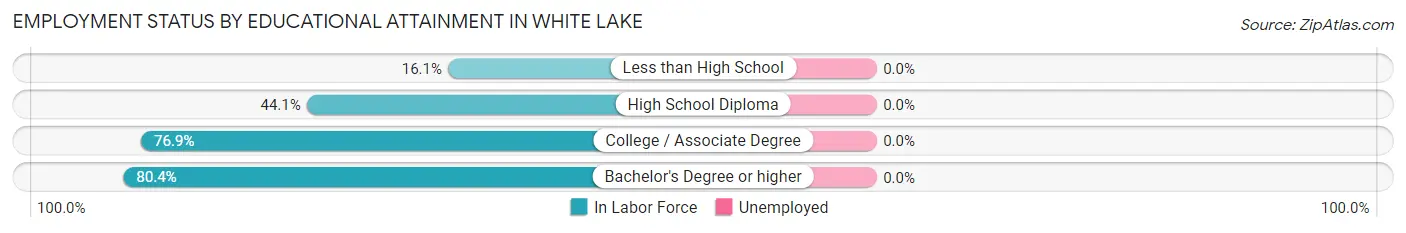
| Educational Attainment | In Labor Force | Unemployed |
| Less than High School | 19 (16.1%) | 0 (0.0%) |
| High School Diploma | 64 (44.1%) | 0 (0.0%) |
| College / Associate Degree | 90 (76.9%) | 0 (0.0%) |
| Bachelor's Degree or higher | 82 (80.4%) | 0 (0.0%) |
| Total | 255 (52.9%) | 0 (0.0%) |
Employment Occupations by Sex in White Lake
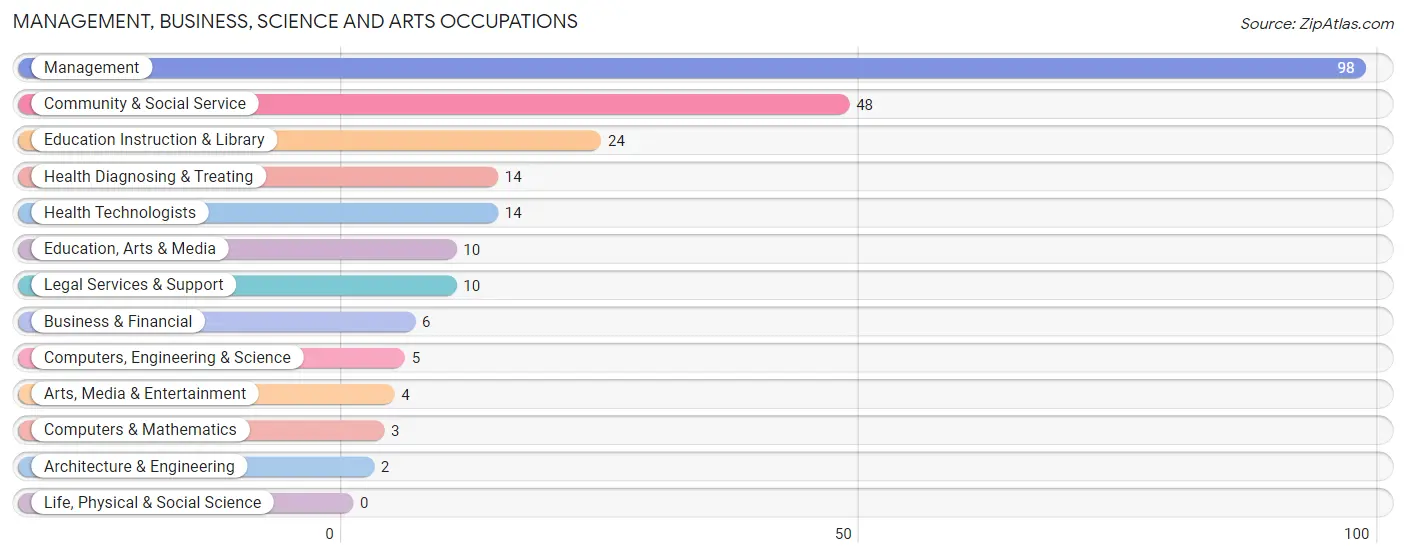
Management, Business, Science and Arts Occupations
The most common Management, Business, Science and Arts occupations in White Lake are Management (98 | 31.2%), Community & Social Service (48 | 15.3%), Education Instruction & Library (24 | 7.6%), Health Diagnosing & Treating (14 | 4.5%), and Health Technologists (14 | 4.5%).
Management, Business, Science and Arts Occupations by Sex
Within the Management, Business, Science and Arts occupations in White Lake, the most male-oriented occupations are Computers & Mathematics (100.0%), Legal Services & Support (100.0%), and Business & Financial (66.7%), while the most female-oriented occupations are Architecture & Engineering (100.0%), Arts, Media & Entertainment (100.0%), and Management (74.5%).
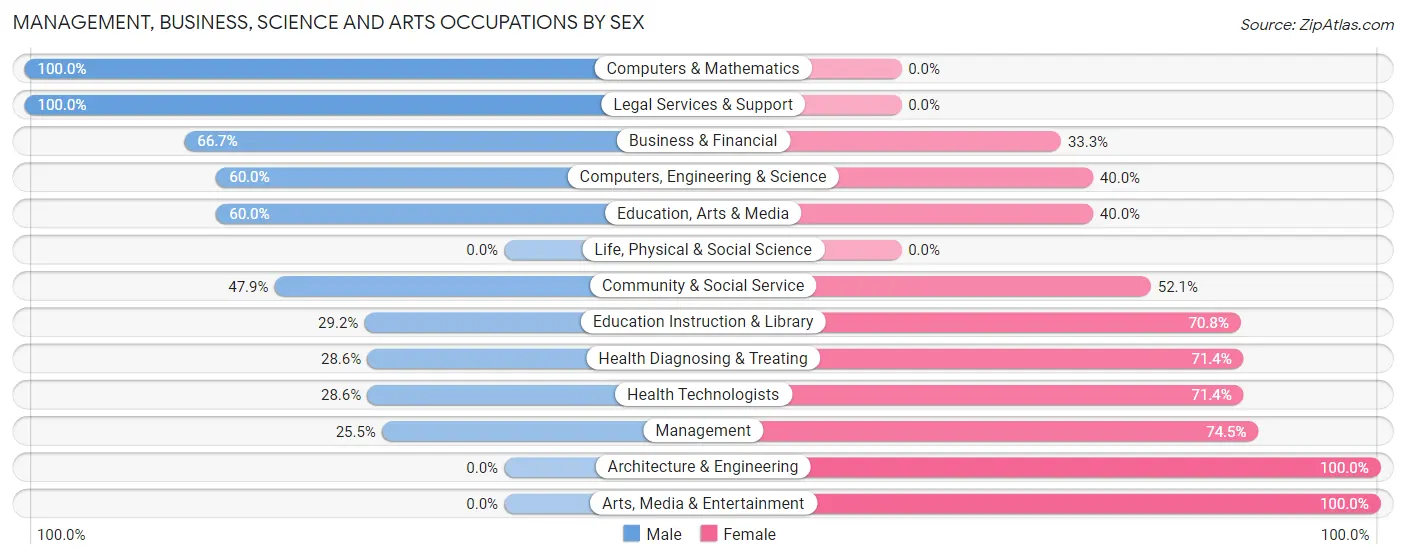
| Occupation | Male | Female |
| Management | 25 (25.5%) | 73 (74.5%) |
| Business & Financial | 4 (66.7%) | 2 (33.3%) |
| Computers, Engineering & Science | 3 (60.0%) | 2 (40.0%) |
| Computers & Mathematics | 3 (100.0%) | 0 (0.0%) |
| Architecture & Engineering | 0 (0.0%) | 2 (100.0%) |
| Life, Physical & Social Science | 0 (0.0%) | 0 (0.0%) |
| Community & Social Service | 23 (47.9%) | 25 (52.1%) |
| Education, Arts & Media | 6 (60.0%) | 4 (40.0%) |
| Legal Services & Support | 10 (100.0%) | 0 (0.0%) |
| Education Instruction & Library | 7 (29.2%) | 17 (70.8%) |
| Arts, Media & Entertainment | 0 (0.0%) | 4 (100.0%) |
| Health Diagnosing & Treating | 4 (28.6%) | 10 (71.4%) |
| Health Technologists | 4 (28.6%) | 10 (71.4%) |
| Total (Category) | 59 (34.5%) | 112 (65.5%) |
| Total (Overall) | 140 (44.6%) | 174 (55.4%) |
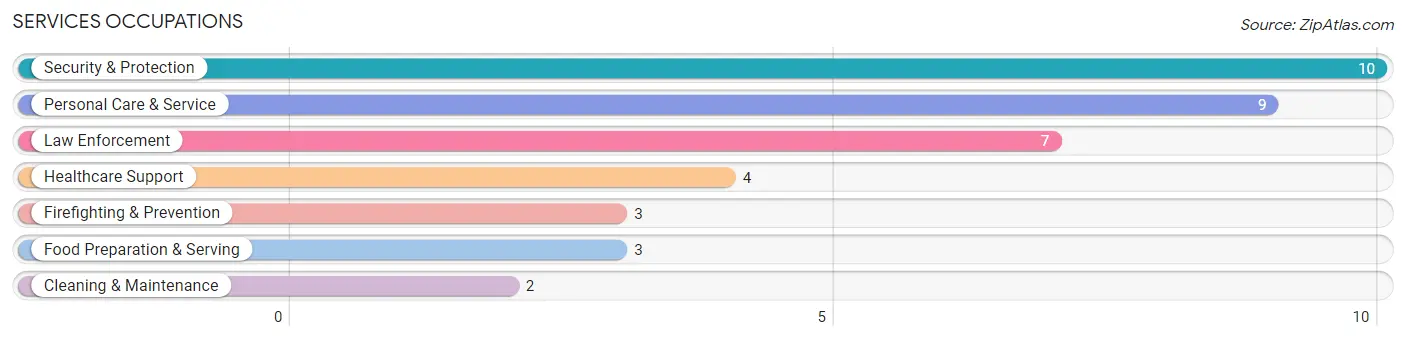
Services Occupations
The most common Services occupations in White Lake are Security & Protection (10 | 3.2%), Personal Care & Service (9 | 2.9%), Law Enforcement (7 | 2.2%), Healthcare Support (4 | 1.3%), and Firefighting & Prevention (3 | 1.0%).
Services Occupations by Sex
Within the Services occupations in White Lake, the most male-oriented occupations are Security & Protection (100.0%), Firefighting & Prevention (100.0%), and Law Enforcement (100.0%), while the most female-oriented occupations are Healthcare Support (100.0%), Food Preparation & Serving (100.0%), and Cleaning & Maintenance (100.0%).
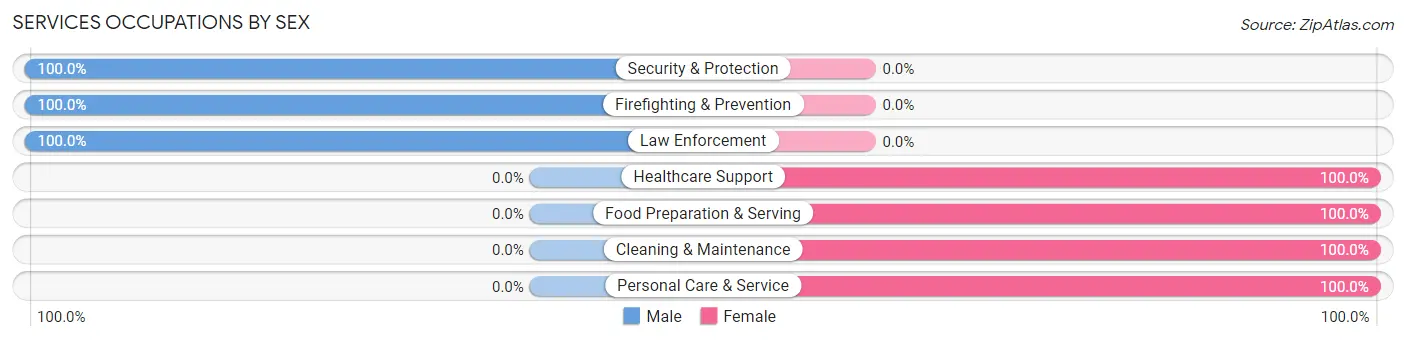
| Occupation | Male | Female |
| Healthcare Support | 0 (0.0%) | 4 (100.0%) |
| Security & Protection | 10 (100.0%) | 0 (0.0%) |
| Firefighting & Prevention | 3 (100.0%) | 0 (0.0%) |
| Law Enforcement | 7 (100.0%) | 0 (0.0%) |
| Food Preparation & Serving | 0 (0.0%) | 3 (100.0%) |
| Cleaning & Maintenance | 0 (0.0%) | 2 (100.0%) |
| Personal Care & Service | 0 (0.0%) | 9 (100.0%) |
| Total (Category) | 10 (35.7%) | 18 (64.3%) |
| Total (Overall) | 140 (44.6%) | 174 (55.4%) |
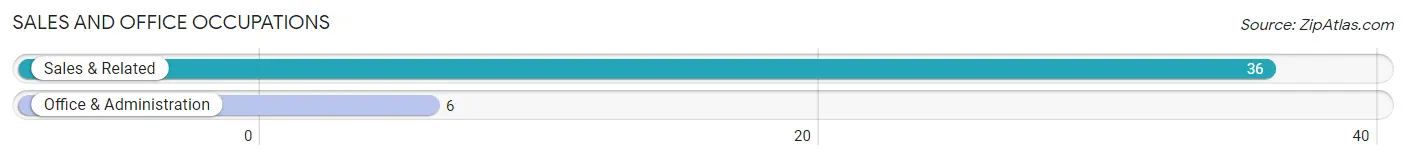
Sales and Office Occupations
The most common Sales and Office occupations in White Lake are Sales & Related (36 | 11.5%), and Office & Administration (6 | 1.9%).
Sales and Office Occupations by Sex
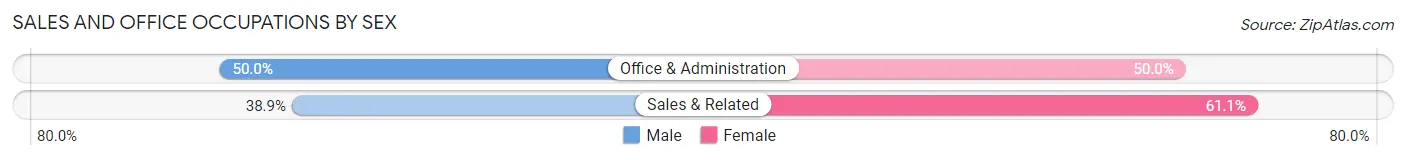
| Occupation | Male | Female |
| Sales & Related | 14 (38.9%) | 22 (61.1%) |
| Office & Administration | 3 (50.0%) | 3 (50.0%) |
| Total (Category) | 17 (40.5%) | 25 (59.5%) |
| Total (Overall) | 140 (44.6%) | 174 (55.4%) |
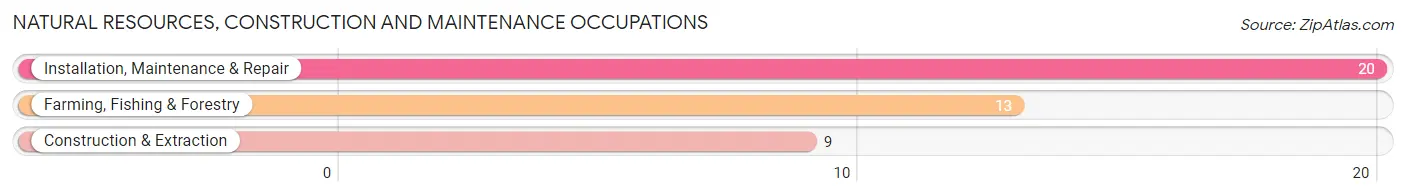
Natural Resources, Construction and Maintenance Occupations
The most common Natural Resources, Construction and Maintenance occupations in White Lake are Installation, Maintenance & Repair (20 | 6.4%), Farming, Fishing & Forestry (13 | 4.1%), and Construction & Extraction (9 | 2.9%).
Natural Resources, Construction and Maintenance Occupations by Sex
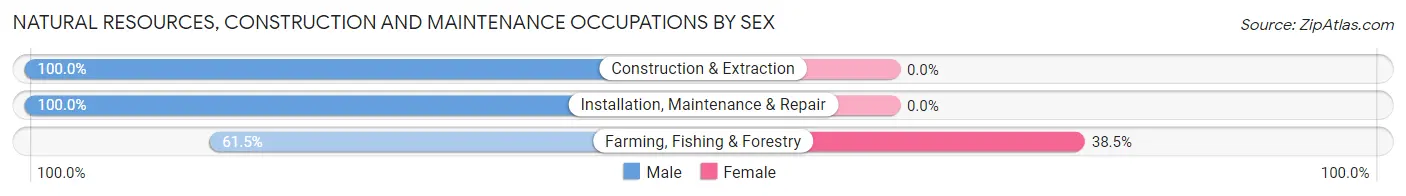
| Occupation | Male | Female |
| Farming, Fishing & Forestry | 8 (61.5%) | 5 (38.5%) |
| Construction & Extraction | 9 (100.0%) | 0 (0.0%) |
| Installation, Maintenance & Repair | 20 (100.0%) | 0 (0.0%) |
| Total (Category) | 37 (88.1%) | 5 (11.9%) |
| Total (Overall) | 140 (44.6%) | 174 (55.4%) |
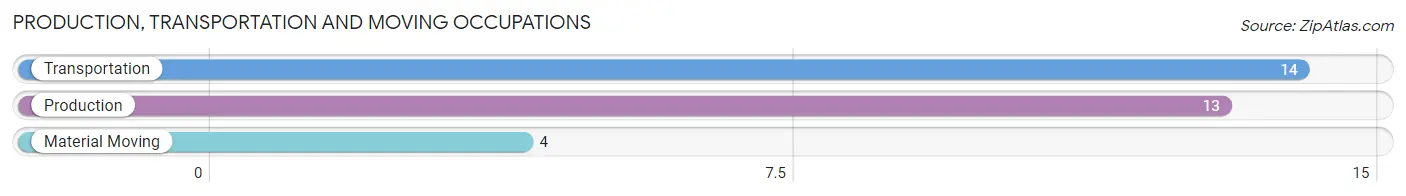
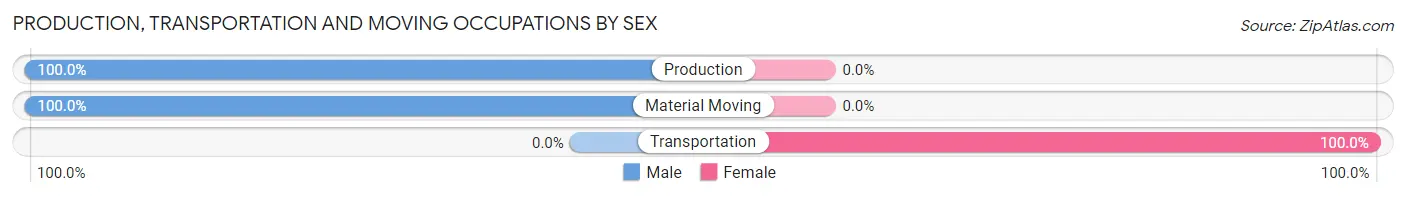
Production, Transportation and Moving Occupations
The most common Production, Transportation and Moving occupations in White Lake are Transportation (14 | 4.5%), Production (13 | 4.1%), and Material Moving (4 | 1.3%).
Production, Transportation and Moving Occupations by Sex
| Occupation | Male | Female |
| Production | 13 (100.0%) | 0 (0.0%) |
| Transportation | 0 (0.0%) | 14 (100.0%) |
| Material Moving | 4 (100.0%) | 0 (0.0%) |
| Total (Category) | 17 (54.8%) | 14 (45.2%) |
| Total (Overall) | 140 (44.6%) | 174 (55.4%) |
Employment Industries by Sex in White Lake
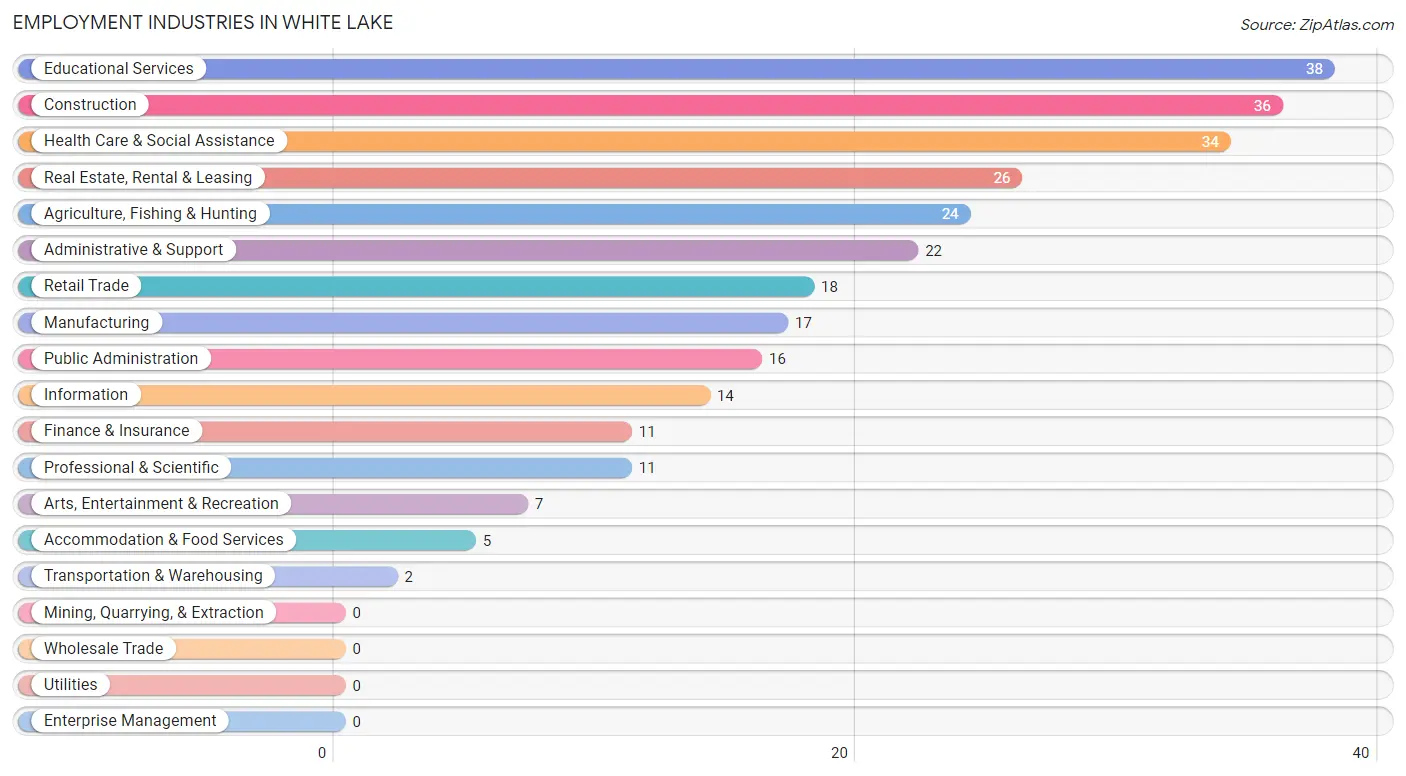
Employment Industries in White Lake
The major employment industries in White Lake include Educational Services (38 | 12.1%), Construction (36 | 11.5%), Health Care & Social Assistance (34 | 10.8%), Real Estate, Rental & Leasing (26 | 8.3%), and Agriculture, Fishing & Hunting (24 | 7.6%).
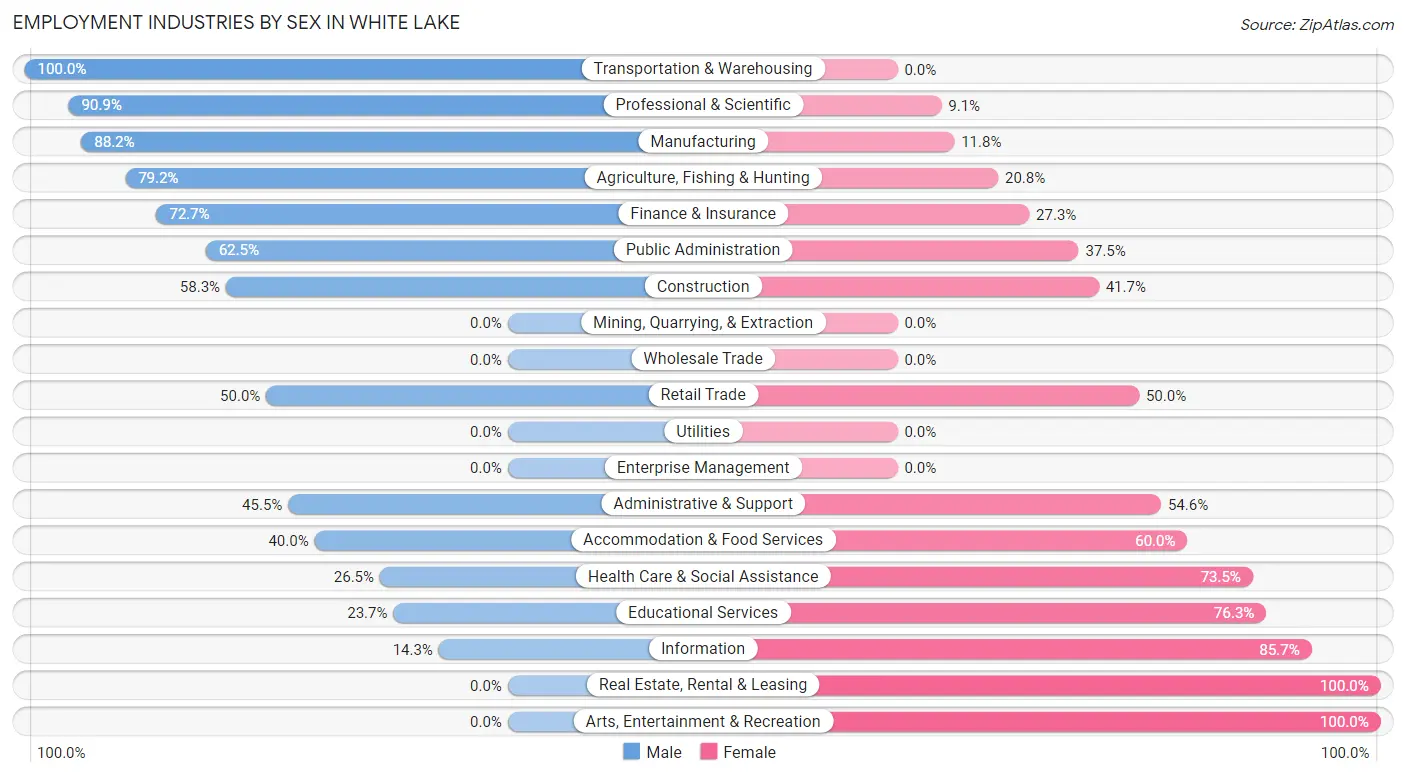
Employment Industries by Sex in White Lake
The White Lake industries that see more men than women are Transportation & Warehousing (100.0%), Professional & Scientific (90.9%), and Manufacturing (88.2%), whereas the industries that tend to have a higher number of women are Real Estate, Rental & Leasing (100.0%), Arts, Entertainment & Recreation (100.0%), and Information (85.7%).
| Industry | Male | Female |
| Agriculture, Fishing & Hunting | 19 (79.2%) | 5 (20.8%) |
| Mining, Quarrying, & Extraction | 0 (0.0%) | 0 (0.0%) |
| Construction | 21 (58.3%) | 15 (41.7%) |
| Manufacturing | 15 (88.2%) | 2 (11.8%) |
| Wholesale Trade | 0 (0.0%) | 0 (0.0%) |
| Retail Trade | 9 (50.0%) | 9 (50.0%) |
| Transportation & Warehousing | 2 (100.0%) | 0 (0.0%) |
| Utilities | 0 (0.0%) | 0 (0.0%) |
| Information | 2 (14.3%) | 12 (85.7%) |
| Finance & Insurance | 8 (72.7%) | 3 (27.3%) |
| Real Estate, Rental & Leasing | 0 (0.0%) | 26 (100.0%) |
| Professional & Scientific | 10 (90.9%) | 1 (9.1%) |
| Enterprise Management | 0 (0.0%) | 0 (0.0%) |
| Administrative & Support | 10 (45.5%) | 12 (54.5%) |
| Educational Services | 9 (23.7%) | 29 (76.3%) |
| Health Care & Social Assistance | 9 (26.5%) | 25 (73.5%) |
| Arts, Entertainment & Recreation | 0 (0.0%) | 7 (100.0%) |
| Accommodation & Food Services | 2 (40.0%) | 3 (60.0%) |
| Public Administration | 10 (62.5%) | 6 (37.5%) |
| Total | 140 (44.6%) | 174 (55.4%) |
Education in White Lake
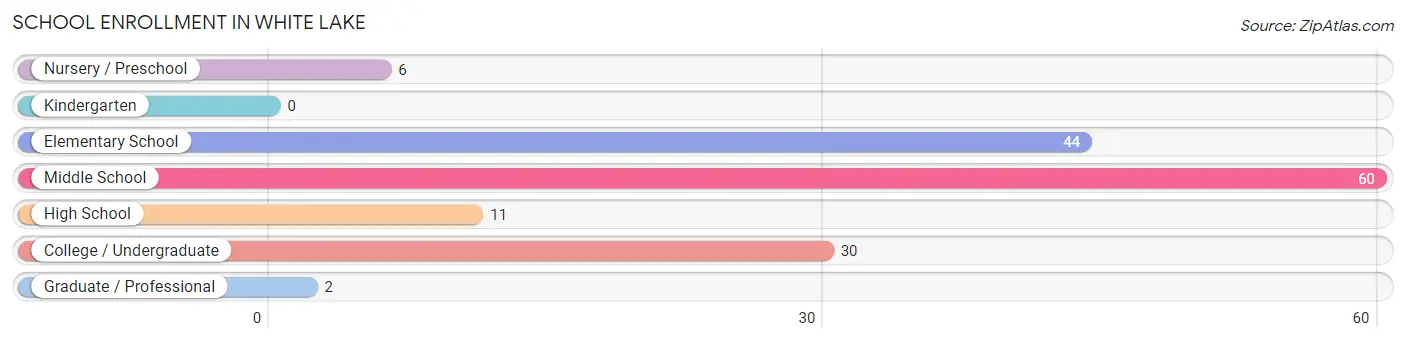
School Enrollment in White Lake
The most common levels of schooling among the 153 students in White Lake are middle school (60 | 39.2%), elementary school (44 | 28.8%), and college / undergraduate (30 | 19.6%).
| School Level | # Students | % Students |
| Nursery / Preschool | 6 | 3.9% |
| Kindergarten | 0 | 0.0% |
| Elementary School | 44 | 28.8% |
| Middle School | 60 | 39.2% |
| High School | 11 | 7.2% |
| College / Undergraduate | 30 | 19.6% |
| Graduate / Professional | 2 | 1.3% |
| Total | 153 | 100.0% |
School Enrollment by Age by Funding Source in White Lake
Out of a total of 153 students who are enrolled in schools in White Lake, 83 (54.2%) attend a private institution, while the remaining 70 (45.8%) are enrolled in public schools. The age group of 3 to 4 year olds has the highest likelihood of being enrolled in private schools, with 6 (100.0% in the age bracket) enrolled. Conversely, the age group of 18 to 19 year olds has the lowest likelihood of being enrolled in a private school, with 16 (100.0% in the age bracket) attending a public institution.
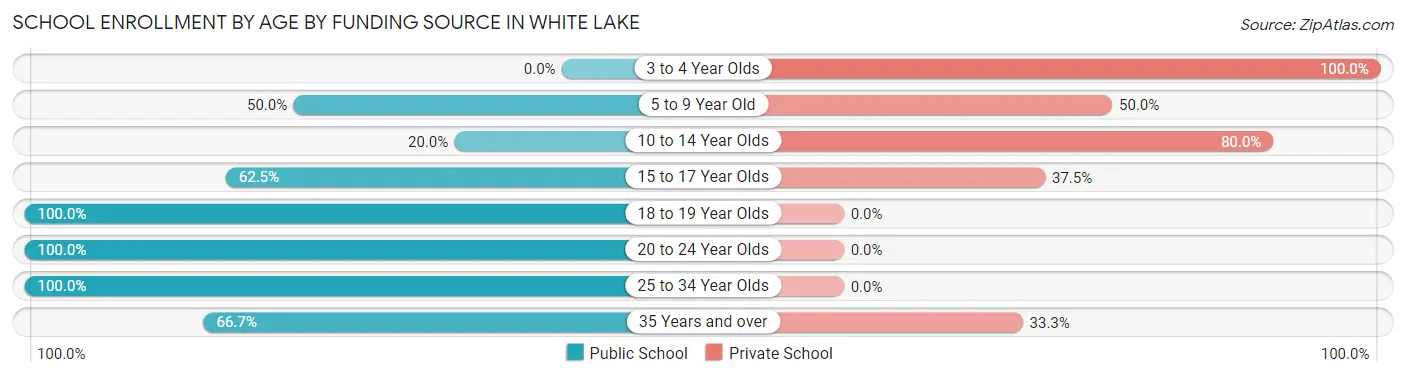
| Age Bracket | Public School | Private School |
| 3 to 4 Year Olds | 0 (0.0%) | 6 (100.0%) |
| 5 to 9 Year Old | 16 (50.0%) | 16 (50.0%) |
| 10 to 14 Year Olds | 14 (20.0%) | 56 (80.0%) |
| 15 to 17 Year Olds | 5 (62.5%) | 3 (37.5%) |
| 18 to 19 Year Olds | 16 (100.0%) | 0 (0.0%) |
| 20 to 24 Year Olds | 13 (100.0%) | 0 (0.0%) |
| 25 to 34 Year Olds | 2 (100.0%) | 0 (0.0%) |
| 35 Years and over | 4 (66.7%) | 2 (33.3%) |
| Total | 70 (45.8%) | 83 (54.2%) |
Educational Attainment by Field of Study in White Lake
Business (49 | 22.5%), education (48 | 22.0%), science & technology (27 | 12.4%), social sciences (16 | 7.3%), and liberal arts & history (14 | 6.4%) are the most common fields of study among 218 individuals in White Lake who have obtained a bachelor's degree or higher.
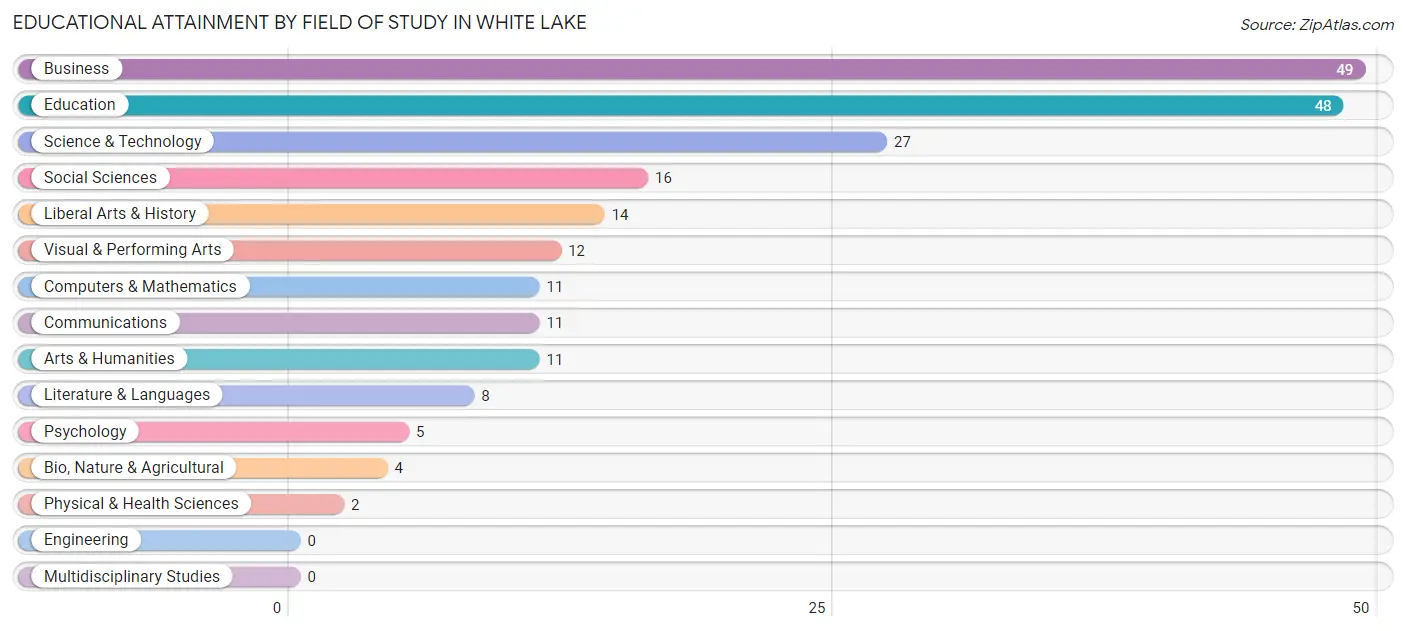
| Field of Study | # Graduates | % Graduates |
| Computers & Mathematics | 11 | 5.1% |
| Bio, Nature & Agricultural | 4 | 1.8% |
| Physical & Health Sciences | 2 | 0.9% |
| Psychology | 5 | 2.3% |
| Social Sciences | 16 | 7.3% |
| Engineering | 0 | 0.0% |
| Multidisciplinary Studies | 0 | 0.0% |
| Science & Technology | 27 | 12.4% |
| Business | 49 | 22.5% |
| Education | 48 | 22.0% |
| Literature & Languages | 8 | 3.7% |
| Liberal Arts & History | 14 | 6.4% |
| Visual & Performing Arts | 12 | 5.5% |
| Communications | 11 | 5.1% |
| Arts & Humanities | 11 | 5.1% |
| Total | 218 | 100.0% |
Transportation & Commute in White Lake
Vehicle Availability by Sex in White Lake
The most prevalent vehicle ownership categories in White Lake are males with 2 vehicles (80, accounting for 58.4%) and females with 2 vehicles (95, making up 46.0%).
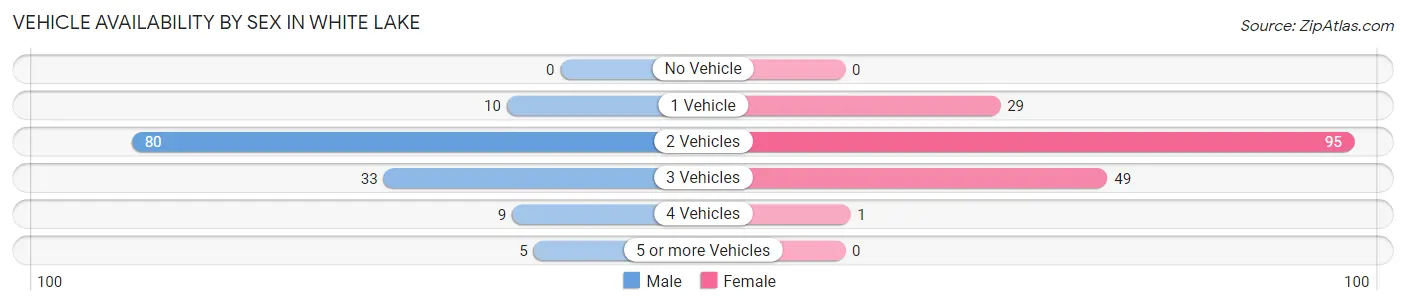
| Vehicles Available | Male | Female |
| No Vehicle | 0 (0.0%) | 0 (0.0%) |
| 1 Vehicle | 10 (7.3%) | 29 (16.7%) |
| 2 Vehicles | 80 (58.4%) | 95 (54.6%) |
| 3 Vehicles | 33 (24.1%) | 49 (28.2%) |
| 4 Vehicles | 9 (6.6%) | 1 (0.6%) |
| 5 or more Vehicles | 5 (3.6%) | 0 (0.0%) |
| Total | 137 (100.0%) | 174 (100.0%) |
Commute Time in White Lake
The most frequently occuring commute durations in White Lake are 10 to 14 minutes (75 commuters, 25.4%), 15 to 19 minutes (62 commuters, 21.0%), and 45 to 59 minutes (44 commuters, 14.9%).
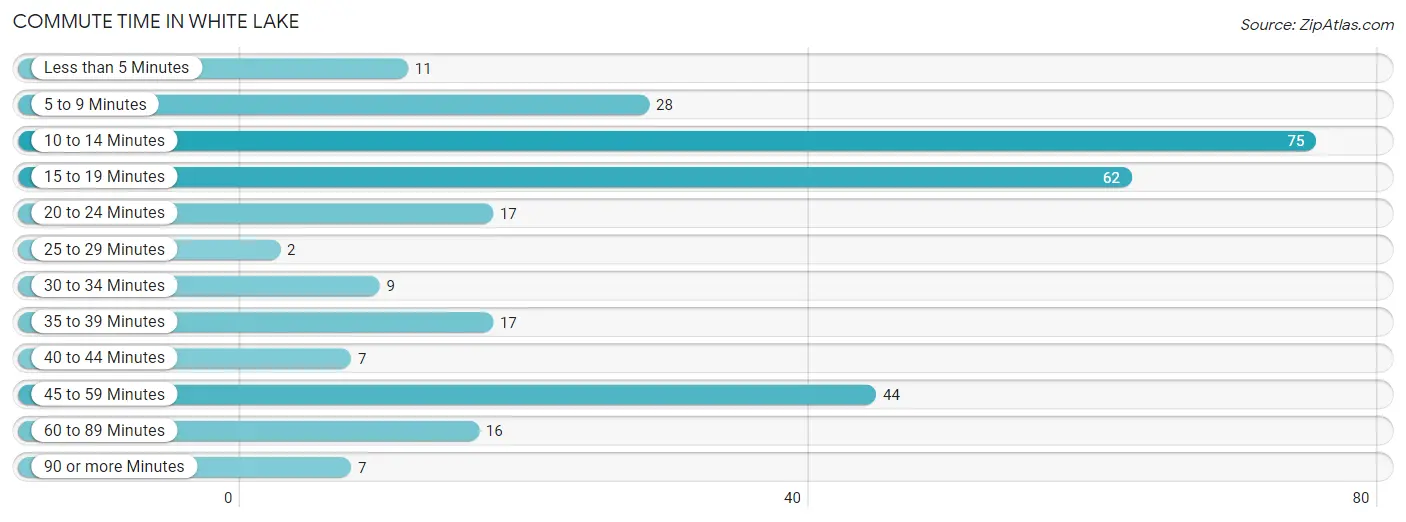
| Commute Time | # Commuters | % Commuters |
| Less than 5 Minutes | 11 | 3.7% |
| 5 to 9 Minutes | 28 | 9.5% |
| 10 to 14 Minutes | 75 | 25.4% |
| 15 to 19 Minutes | 62 | 21.0% |
| 20 to 24 Minutes | 17 | 5.8% |
| 25 to 29 Minutes | 2 | 0.7% |
| 30 to 34 Minutes | 9 | 3.0% |
| 35 to 39 Minutes | 17 | 5.8% |
| 40 to 44 Minutes | 7 | 2.4% |
| 45 to 59 Minutes | 44 | 14.9% |
| 60 to 89 Minutes | 16 | 5.4% |
| 90 or more Minutes | 7 | 2.4% |
Commute Time by Sex in White Lake
The most common commute times in White Lake are 45 to 59 minutes (42 commuters, 31.3%) for males and 15 to 19 minutes (54 commuters, 33.5%) for females.
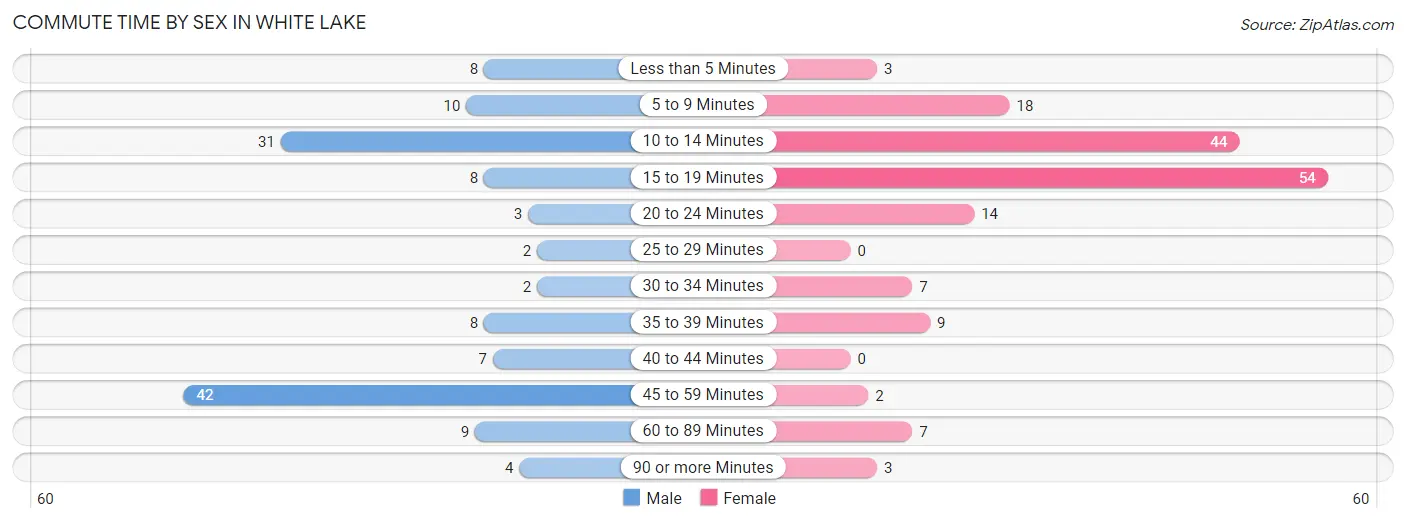
| Commute Time | Male | Female |
| Less than 5 Minutes | 8 (6.0%) | 3 (1.9%) |
| 5 to 9 Minutes | 10 (7.5%) | 18 (11.2%) |
| 10 to 14 Minutes | 31 (23.1%) | 44 (27.3%) |
| 15 to 19 Minutes | 8 (6.0%) | 54 (33.5%) |
| 20 to 24 Minutes | 3 (2.2%) | 14 (8.7%) |
| 25 to 29 Minutes | 2 (1.5%) | 0 (0.0%) |
| 30 to 34 Minutes | 2 (1.5%) | 7 (4.3%) |
| 35 to 39 Minutes | 8 (6.0%) | 9 (5.6%) |
| 40 to 44 Minutes | 7 (5.2%) | 0 (0.0%) |
| 45 to 59 Minutes | 42 (31.3%) | 2 (1.2%) |
| 60 to 89 Minutes | 9 (6.7%) | 7 (4.3%) |
| 90 or more Minutes | 4 (3.0%) | 3 (1.9%) |
Time of Departure to Work by Sex in White Lake
The most frequent times of departure to work in White Lake are 7:00 AM to 7:29 AM (46, 34.3%) for males and 7:00 AM to 7:29 AM (61, 37.9%) for females.
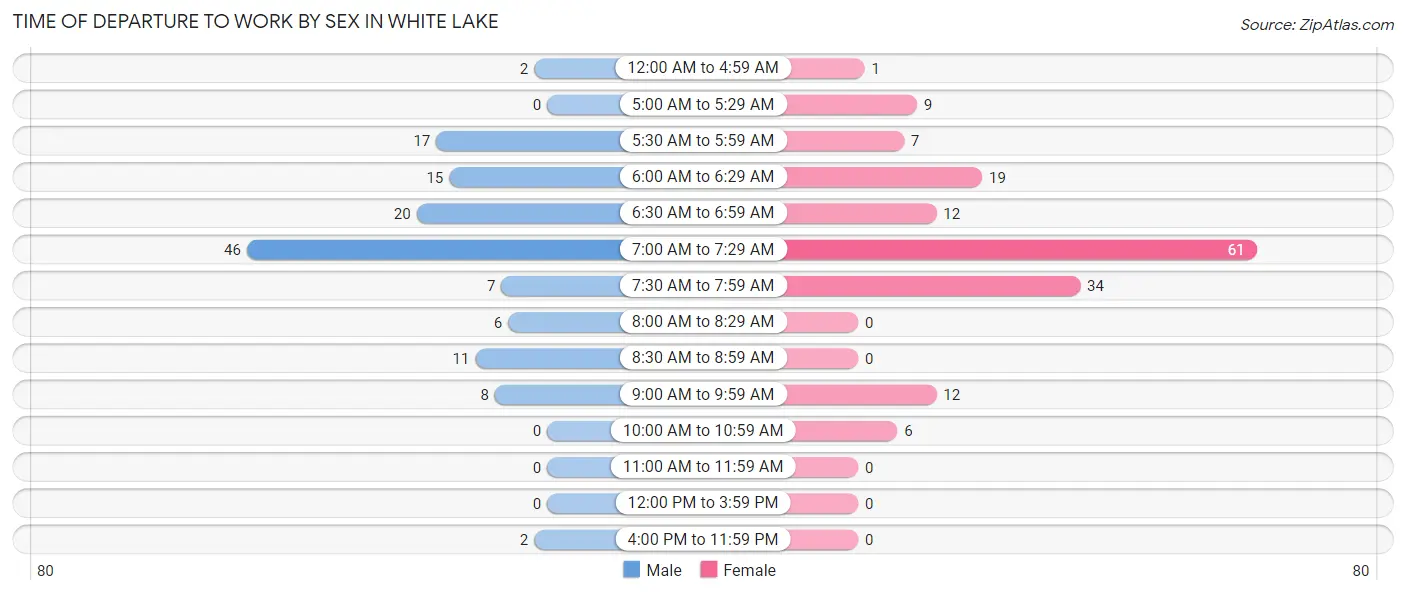
| Time of Departure | Male | Female |
| 12:00 AM to 4:59 AM | 2 (1.5%) | 1 (0.6%) |
| 5:00 AM to 5:29 AM | 0 (0.0%) | 9 (5.6%) |
| 5:30 AM to 5:59 AM | 17 (12.7%) | 7 (4.3%) |
| 6:00 AM to 6:29 AM | 15 (11.2%) | 19 (11.8%) |
| 6:30 AM to 6:59 AM | 20 (14.9%) | 12 (7.4%) |
| 7:00 AM to 7:29 AM | 46 (34.3%) | 61 (37.9%) |
| 7:30 AM to 7:59 AM | 7 (5.2%) | 34 (21.1%) |
| 8:00 AM to 8:29 AM | 6 (4.5%) | 0 (0.0%) |
| 8:30 AM to 8:59 AM | 11 (8.2%) | 0 (0.0%) |
| 9:00 AM to 9:59 AM | 8 (6.0%) | 12 (7.4%) |
| 10:00 AM to 10:59 AM | 0 (0.0%) | 6 (3.7%) |
| 11:00 AM to 11:59 AM | 0 (0.0%) | 0 (0.0%) |
| 12:00 PM to 3:59 PM | 0 (0.0%) | 0 (0.0%) |
| 4:00 PM to 11:59 PM | 2 (1.5%) | 0 (0.0%) |
| Total | 134 (100.0%) | 161 (100.0%) |
Housing Occupancy in White Lake
Occupancy by Ownership in White Lake
Of the total 410 dwellings in White Lake, owner-occupied units account for 259 (63.2%), while renter-occupied units make up 151 (36.8%).
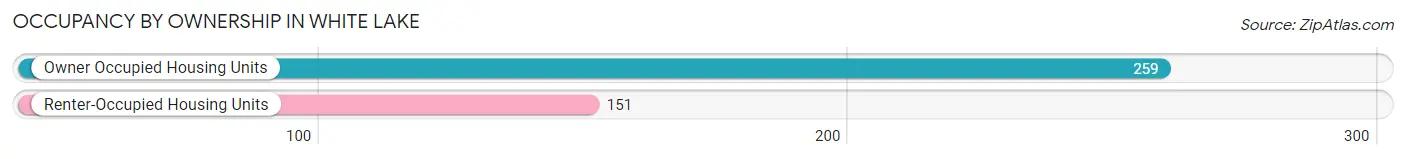
| Occupancy | # Housing Units | % Housing Units |
| Owner Occupied Housing Units | 259 | 63.2% |
| Renter-Occupied Housing Units | 151 | 36.8% |
| Total Occupied Housing Units | 410 | 100.0% |
Occupancy by Household Size in White Lake
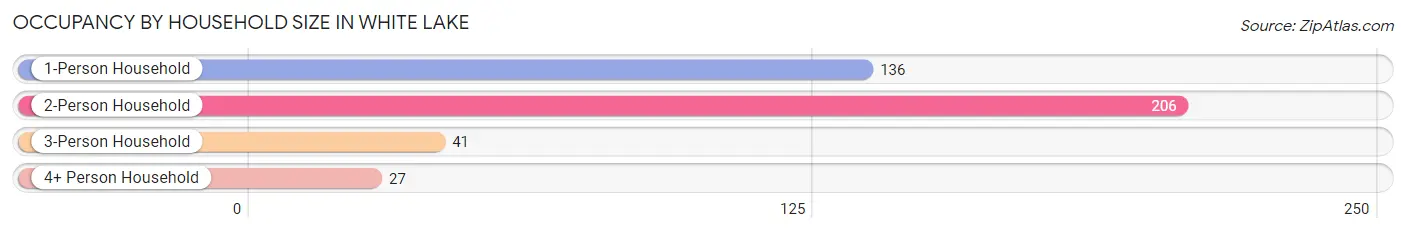
| Household Size | # Housing Units | % Housing Units |
| 1-Person Household | 136 | 33.2% |
| 2-Person Household | 206 | 50.2% |
| 3-Person Household | 41 | 10.0% |
| 4+ Person Household | 27 | 6.6% |
| Total Housing Units | 410 | 100.0% |
Occupancy by Ownership by Household Size in White Lake
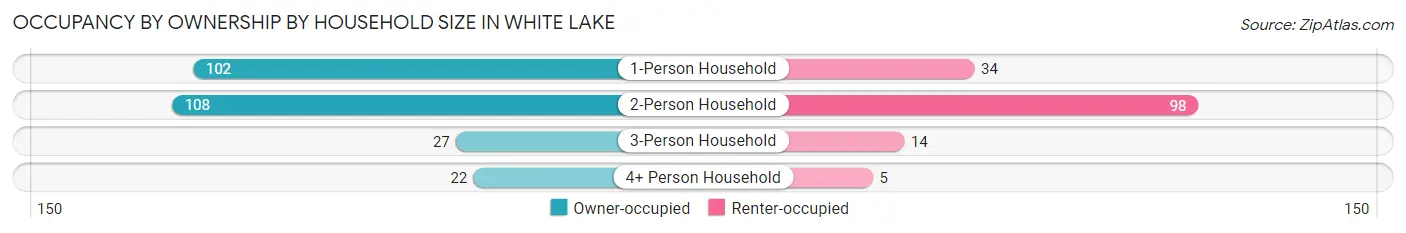
| Household Size | Owner-occupied | Renter-occupied |
| 1-Person Household | 102 (75.0%) | 34 (25.0%) |
| 2-Person Household | 108 (52.4%) | 98 (47.6%) |
| 3-Person Household | 27 (65.8%) | 14 (34.2%) |
| 4+ Person Household | 22 (81.5%) | 5 (18.5%) |
| Total Housing Units | 259 (63.2%) | 151 (36.8%) |
Occupancy by Educational Attainment in White Lake
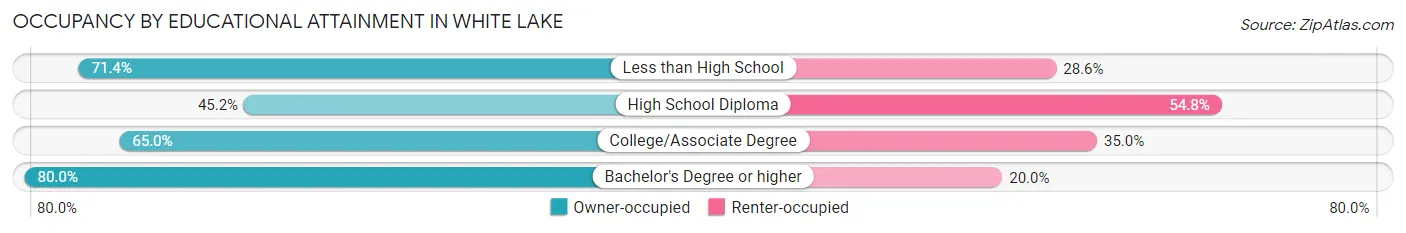
| Household Size | Owner-occupied | Renter-occupied |
| Less than High School | 5 (71.4%) | 2 (28.6%) |
| High School Diploma | 66 (45.2%) | 80 (54.8%) |
| College/Associate Degree | 76 (65.0%) | 41 (35.0%) |
| Bachelor's Degree or higher | 112 (80.0%) | 28 (20.0%) |
Occupancy by Age of Householder in White Lake
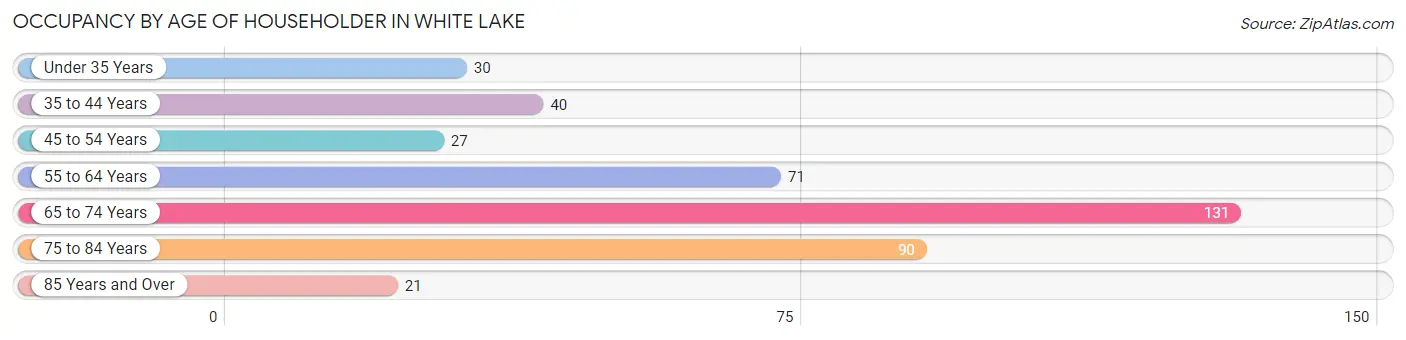
| Age Bracket | # Households | % Households |
| Under 35 Years | 30 | 7.3% |
| 35 to 44 Years | 40 | 9.8% |
| 45 to 54 Years | 27 | 6.6% |
| 55 to 64 Years | 71 | 17.3% |
| 65 to 74 Years | 131 | 32.0% |
| 75 to 84 Years | 90 | 22.0% |
| 85 Years and Over | 21 | 5.1% |
| Total | 410 | 100.0% |
Housing Finances in White Lake
Median Income by Occupancy in White Lake
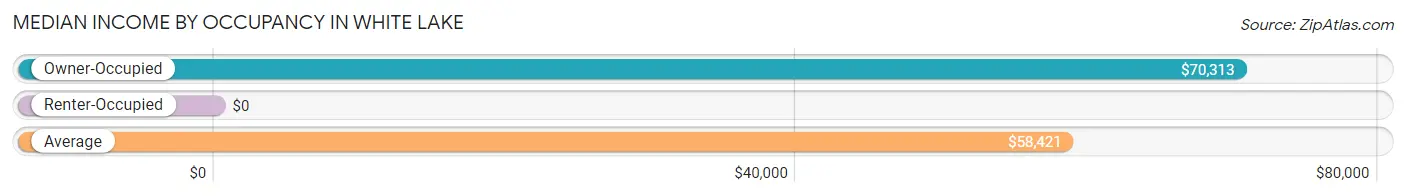
| Occupancy Type | # Households | Median Income |
| Owner-Occupied | 259 (63.2%) | $70,313 |
| Renter-Occupied | 151 (36.8%) | $0 |
| Average | 410 (100.0%) | $58,421 |
Occupancy by Householder Income Bracket in White Lake
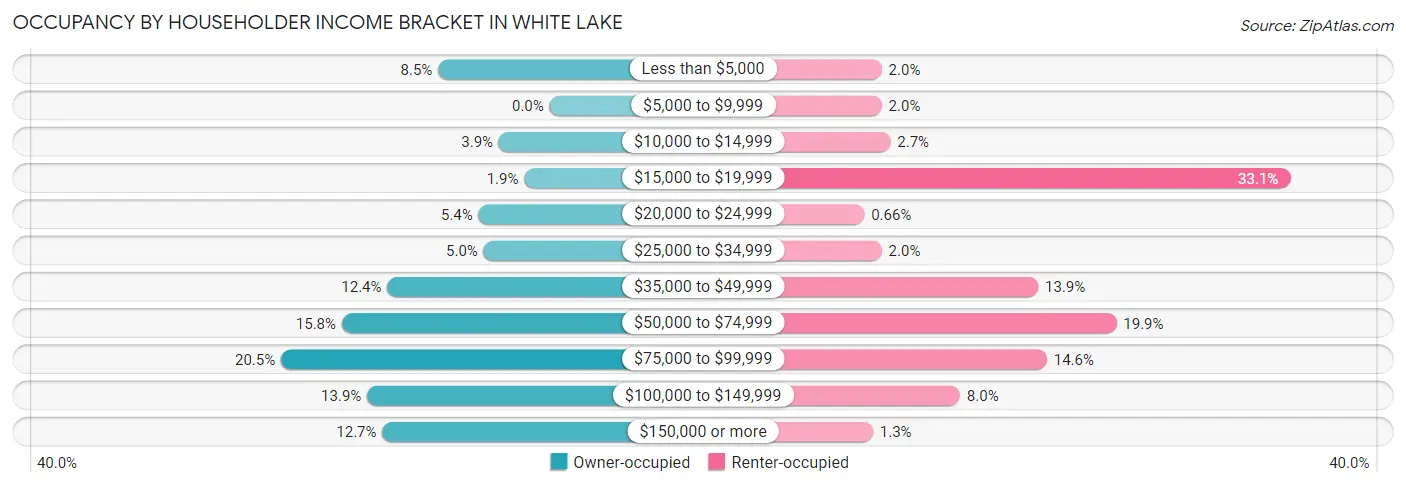
| Income Bracket | Owner-occupied | Renter-occupied |
| Less than $5,000 | 22 (8.5%) | 3 (2.0%) |
| $5,000 to $9,999 | 0 (0.0%) | 3 (2.0%) |
| $10,000 to $14,999 | 10 (3.9%) | 4 (2.6%) |
| $15,000 to $19,999 | 5 (1.9%) | 50 (33.1%) |
| $20,000 to $24,999 | 14 (5.4%) | 1 (0.7%) |
| $25,000 to $34,999 | 13 (5.0%) | 3 (2.0%) |
| $35,000 to $49,999 | 32 (12.4%) | 21 (13.9%) |
| $50,000 to $74,999 | 41 (15.8%) | 30 (19.9%) |
| $75,000 to $99,999 | 53 (20.5%) | 22 (14.6%) |
| $100,000 to $149,999 | 36 (13.9%) | 12 (8.0%) |
| $150,000 or more | 33 (12.7%) | 2 (1.3%) |
| Total | 259 (100.0%) | 151 (100.0%) |
Monthly Housing Cost Tiers in White Lake
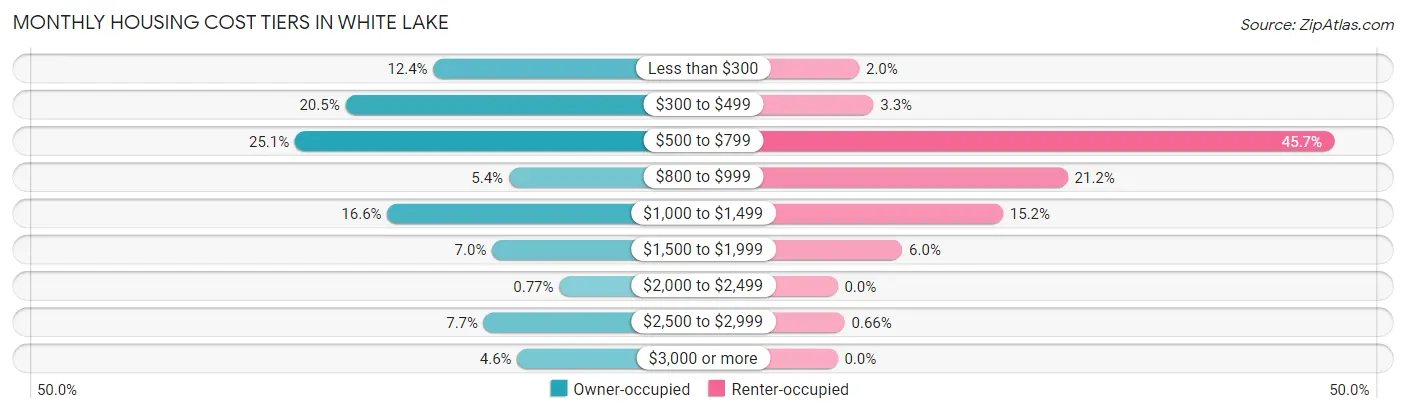
| Monthly Cost | Owner-occupied | Renter-occupied |
| Less than $300 | 32 (12.4%) | 3 (2.0%) |
| $300 to $499 | 53 (20.5%) | 5 (3.3%) |
| $500 to $799 | 65 (25.1%) | 69 (45.7%) |
| $800 to $999 | 14 (5.4%) | 32 (21.2%) |
| $1,000 to $1,499 | 43 (16.6%) | 23 (15.2%) |
| $1,500 to $1,999 | 18 (7.0%) | 9 (6.0%) |
| $2,000 to $2,499 | 2 (0.8%) | 0 (0.0%) |
| $2,500 to $2,999 | 20 (7.7%) | 1 (0.7%) |
| $3,000 or more | 12 (4.6%) | 0 (0.0%) |
| Total | 259 (100.0%) | 151 (100.0%) |
Physical Housing Characteristics in White Lake
Housing Structures in White Lake

| Structure Type | # Housing Units | % Housing Units |
| Single Unit, Detached | 264 | 64.4% |
| Single Unit, Attached | 0 | 0.0% |
| 2 Unit Apartments | 7 | 1.7% |
| 3 or 4 Unit Apartments | 0 | 0.0% |
| 5 to 9 Unit Apartments | 23 | 5.6% |
| 10 or more Apartments | 20 | 4.9% |
| Mobile Home / Other | 96 | 23.4% |
| Total | 410 | 100.0% |
Housing Structures by Occupancy in White Lake
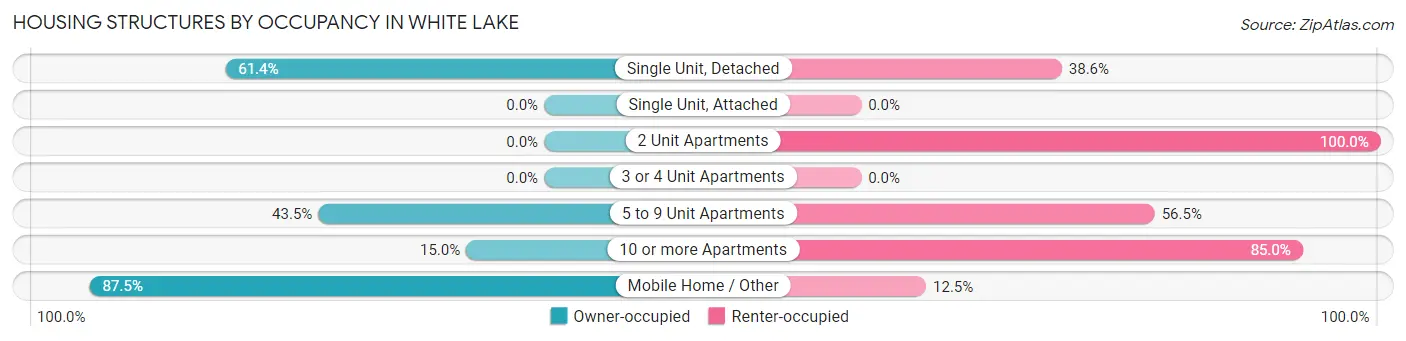
| Structure Type | Owner-occupied | Renter-occupied |
| Single Unit, Detached | 162 (61.4%) | 102 (38.6%) |
| Single Unit, Attached | 0 (0.0%) | 0 (0.0%) |
| 2 Unit Apartments | 0 (0.0%) | 7 (100.0%) |
| 3 or 4 Unit Apartments | 0 (0.0%) | 0 (0.0%) |
| 5 to 9 Unit Apartments | 10 (43.5%) | 13 (56.5%) |
| 10 or more Apartments | 3 (15.0%) | 17 (85.0%) |
| Mobile Home / Other | 84 (87.5%) | 12 (12.5%) |
| Total | 259 (63.2%) | 151 (36.8%) |
Housing Structures by Number of Rooms in White Lake
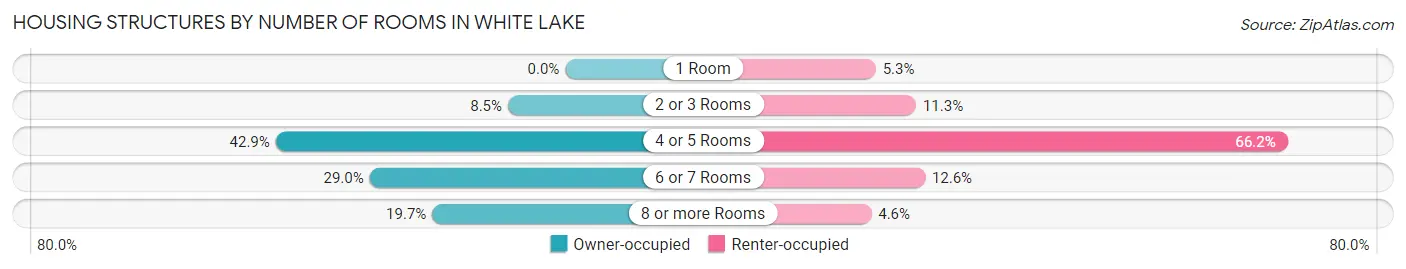
| Number of Rooms | Owner-occupied | Renter-occupied |
| 1 Room | 0 (0.0%) | 8 (5.3%) |
| 2 or 3 Rooms | 22 (8.5%) | 17 (11.3%) |
| 4 or 5 Rooms | 111 (42.9%) | 100 (66.2%) |
| 6 or 7 Rooms | 75 (29.0%) | 19 (12.6%) |
| 8 or more Rooms | 51 (19.7%) | 7 (4.6%) |
| Total | 259 (100.0%) | 151 (100.0%) |
Housing Structure by Heating Type in White Lake
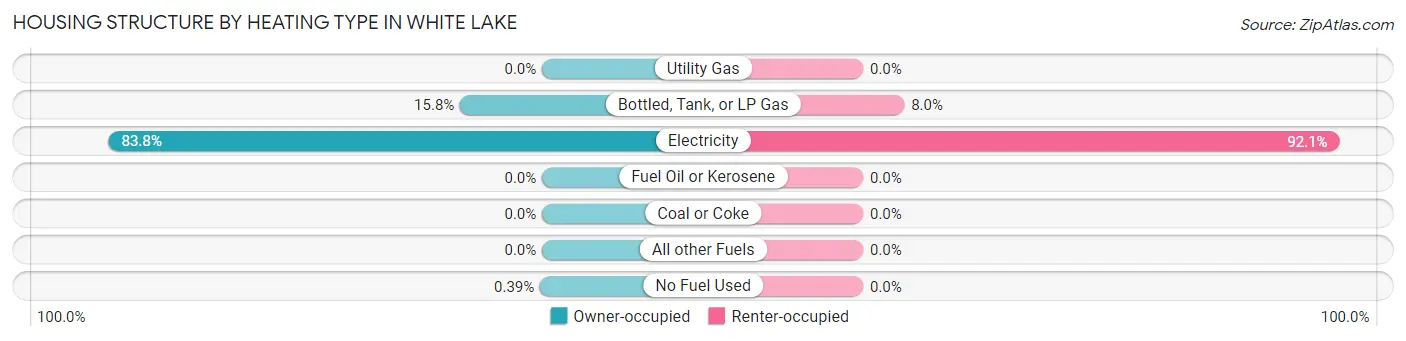
| Heating Type | Owner-occupied | Renter-occupied |
| Utility Gas | 0 (0.0%) | 0 (0.0%) |
| Bottled, Tank, or LP Gas | 41 (15.8%) | 12 (8.0%) |
| Electricity | 217 (83.8%) | 139 (92.0%) |
| Fuel Oil or Kerosene | 0 (0.0%) | 0 (0.0%) |
| Coal or Coke | 0 (0.0%) | 0 (0.0%) |
| All other Fuels | 0 (0.0%) | 0 (0.0%) |
| No Fuel Used | 1 (0.4%) | 0 (0.0%) |
| Total | 259 (100.0%) | 151 (100.0%) |
Household Vehicle Usage in White Lake
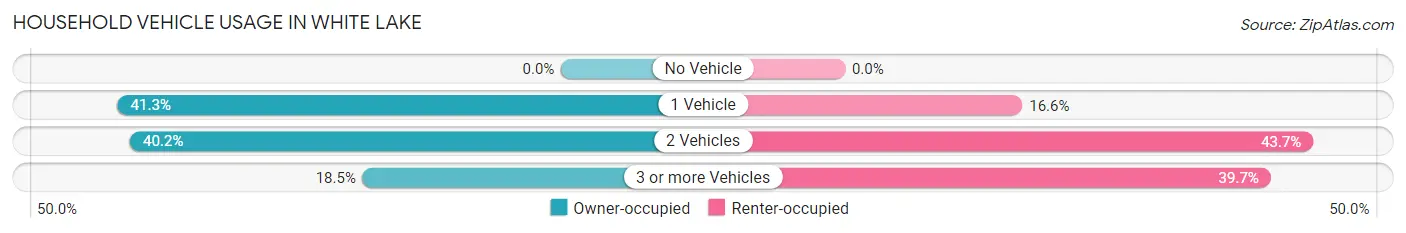
| Vehicles per Household | Owner-occupied | Renter-occupied |
| No Vehicle | 0 (0.0%) | 0 (0.0%) |
| 1 Vehicle | 107 (41.3%) | 25 (16.6%) |
| 2 Vehicles | 104 (40.2%) | 66 (43.7%) |
| 3 or more Vehicles | 48 (18.5%) | 60 (39.7%) |
| Total | 259 (100.0%) | 151 (100.0%) |
Real Estate & Mortgages in White Lake
Real Estate and Mortgage Overview in White Lake
| Characteristic | Without Mortgage | With Mortgage |
| Housing Units | 162 | 97 |
| Median Property Value | $100,000 | $229,500 |
| Median Household Income | $48,438 | $32 |
| Monthly Housing Costs | $489 | $12 |
| Real Estate Taxes | $1,000 | $0 |
Property Value by Mortgage Status in White Lake
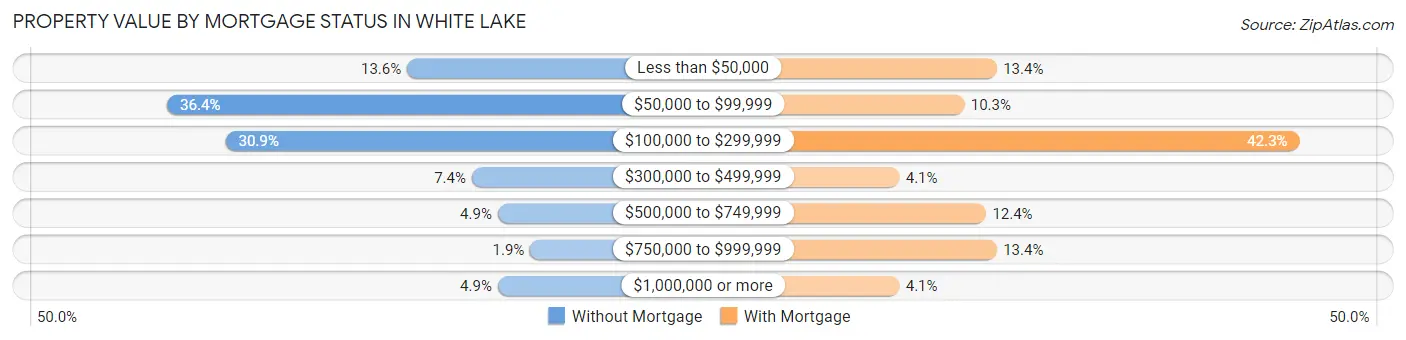
| Property Value | Without Mortgage | With Mortgage |
| Less than $50,000 | 22 (13.6%) | 13 (13.4%) |
| $50,000 to $99,999 | 59 (36.4%) | 10 (10.3%) |
| $100,000 to $299,999 | 50 (30.9%) | 41 (42.3%) |
| $300,000 to $499,999 | 12 (7.4%) | 4 (4.1%) |
| $500,000 to $749,999 | 8 (4.9%) | 12 (12.4%) |
| $750,000 to $999,999 | 3 (1.8%) | 13 (13.4%) |
| $1,000,000 or more | 8 (4.9%) | 4 (4.1%) |
| Total | 162 (100.0%) | 97 (100.0%) |
Household Income by Mortgage Status in White Lake
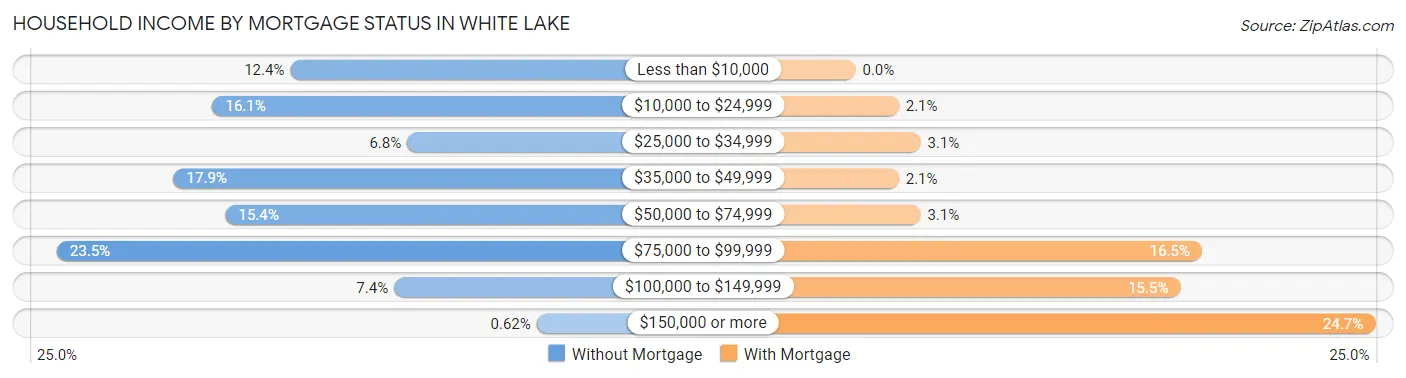
| Household Income | Without Mortgage | With Mortgage |
| Less than $10,000 | 20 (12.3%) | 0 (0.0%) |
| $10,000 to $24,999 | 26 (16.1%) | 2 (2.1%) |
| $25,000 to $34,999 | 11 (6.8%) | 3 (3.1%) |
| $35,000 to $49,999 | 29 (17.9%) | 2 (2.1%) |
| $50,000 to $74,999 | 25 (15.4%) | 3 (3.1%) |
| $75,000 to $99,999 | 38 (23.5%) | 16 (16.5%) |
| $100,000 to $149,999 | 12 (7.4%) | 15 (15.5%) |
| $150,000 or more | 1 (0.6%) | 24 (24.7%) |
| Total | 162 (100.0%) | 97 (100.0%) |
Property Value to Household Income Ratio in White Lake
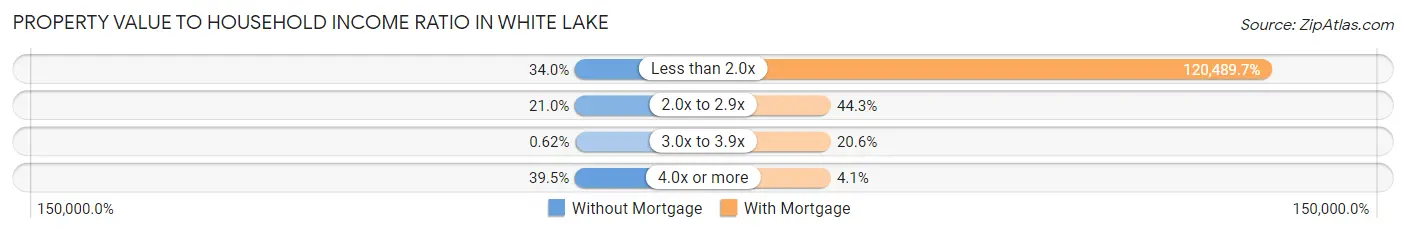
| Value-to-Income Ratio | Without Mortgage | With Mortgage |
| Less than 2.0x | 55 (34.0%) | 116,875 (120,489.7%) |
| 2.0x to 2.9x | 34 (21.0%) | 43 (44.3%) |
| 3.0x to 3.9x | 1 (0.6%) | 20 (20.6%) |
| 4.0x or more | 64 (39.5%) | 4 (4.1%) |
| Total | 162 (100.0%) | 97 (100.0%) |
Real Estate Taxes by Mortgage Status in White Lake
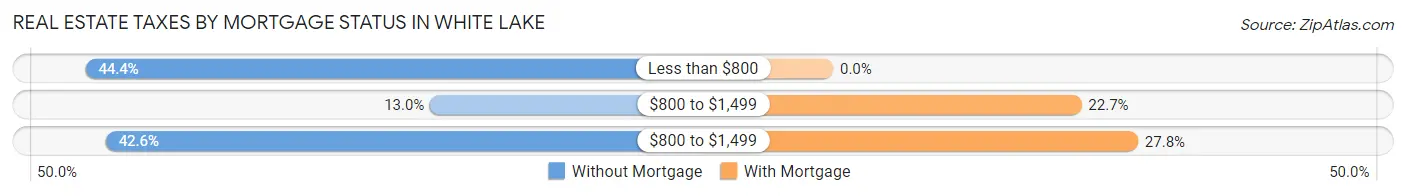
| Property Taxes | Without Mortgage | With Mortgage |
| Less than $800 | 72 (44.4%) | 0 (0.0%) |
| $800 to $1,499 | 21 (13.0%) | 22 (22.7%) |
| $800 to $1,499 | 69 (42.6%) | 27 (27.8%) |
| Total | 162 (100.0%) | 97 (100.0%) |
Health & Disability in White Lake
Health Insurance Coverage by Age in White Lake
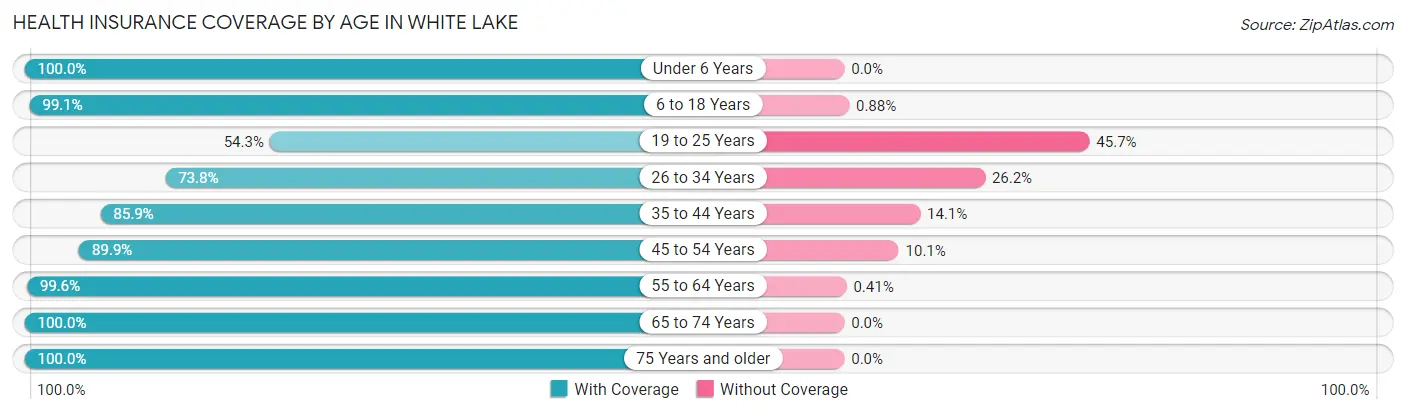
| Age Bracket | With Coverage | Without Coverage |
| Under 6 Years | 22 (100.0%) | 0 (0.0%) |
| 6 to 18 Years | 112 (99.1%) | 1 (0.9%) |
| 19 to 25 Years | 19 (54.3%) | 16 (45.7%) |
| 26 to 34 Years | 45 (73.8%) | 16 (26.2%) |
| 35 to 44 Years | 85 (85.9%) | 14 (14.1%) |
| 45 to 54 Years | 71 (89.9%) | 8 (10.1%) |
| 55 to 64 Years | 242 (99.6%) | 1 (0.4%) |
| 65 to 74 Years | 191 (100.0%) | 0 (0.0%) |
| 75 Years and older | 154 (100.0%) | 0 (0.0%) |
| Total | 941 (94.4%) | 56 (5.6%) |
Health Insurance Coverage by Citizenship Status in White Lake
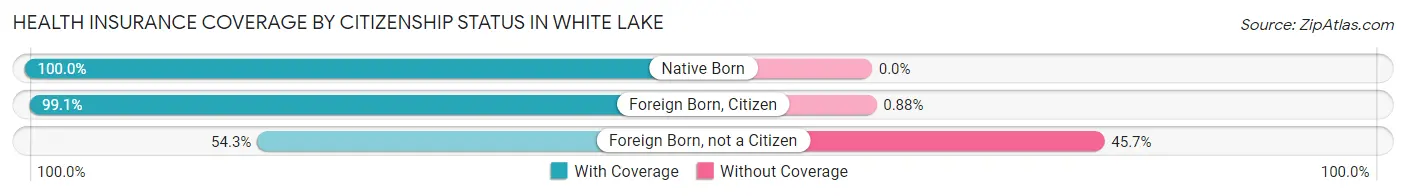
| Citizenship Status | With Coverage | Without Coverage |
| Native Born | 22 (100.0%) | 0 (0.0%) |
| Foreign Born, Citizen | 112 (99.1%) | 1 (0.9%) |
| Foreign Born, not a Citizen | 19 (54.3%) | 16 (45.7%) |
Health Insurance Coverage by Household Income in White Lake
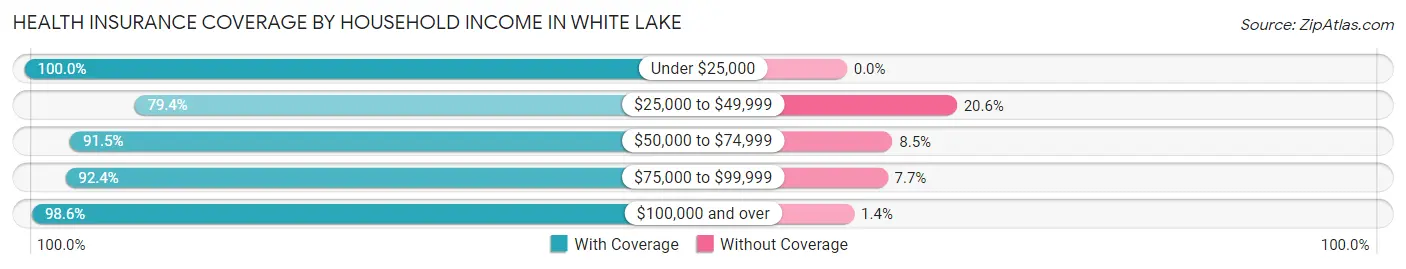
| Household Income | With Coverage | Without Coverage |
| Under $25,000 | 224 (100.0%) | 0 (0.0%) |
| $25,000 to $49,999 | 81 (79.4%) | 21 (20.6%) |
| $50,000 to $74,999 | 182 (91.5%) | 17 (8.5%) |
| $75,000 to $99,999 | 169 (92.3%) | 14 (7.6%) |
| $100,000 and over | 285 (98.6%) | 4 (1.4%) |
Public vs Private Health Insurance Coverage by Age in White Lake
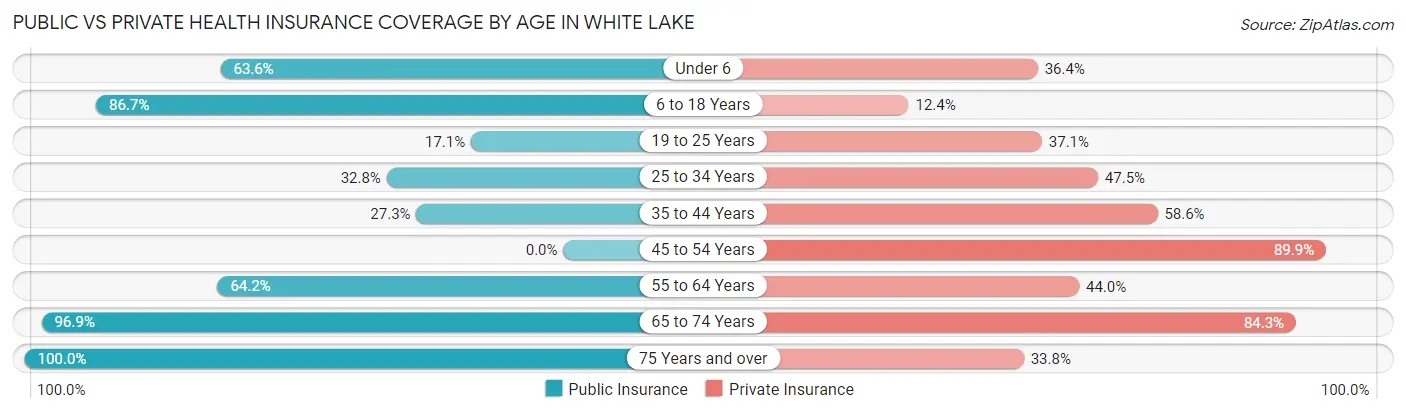
| Age Bracket | Public Insurance | Private Insurance |
| Under 6 | 14 (63.6%) | 8 (36.4%) |
| 6 to 18 Years | 98 (86.7%) | 14 (12.4%) |
| 19 to 25 Years | 6 (17.1%) | 13 (37.1%) |
| 25 to 34 Years | 20 (32.8%) | 29 (47.5%) |
| 35 to 44 Years | 27 (27.3%) | 58 (58.6%) |
| 45 to 54 Years | 0 (0.0%) | 71 (89.9%) |
| 55 to 64 Years | 156 (64.2%) | 107 (44.0%) |
| 65 to 74 Years | 185 (96.9%) | 161 (84.3%) |
| 75 Years and over | 154 (100.0%) | 52 (33.8%) |
| Total | 660 (66.2%) | 513 (51.4%) |
Disability Status by Sex by Age in White Lake
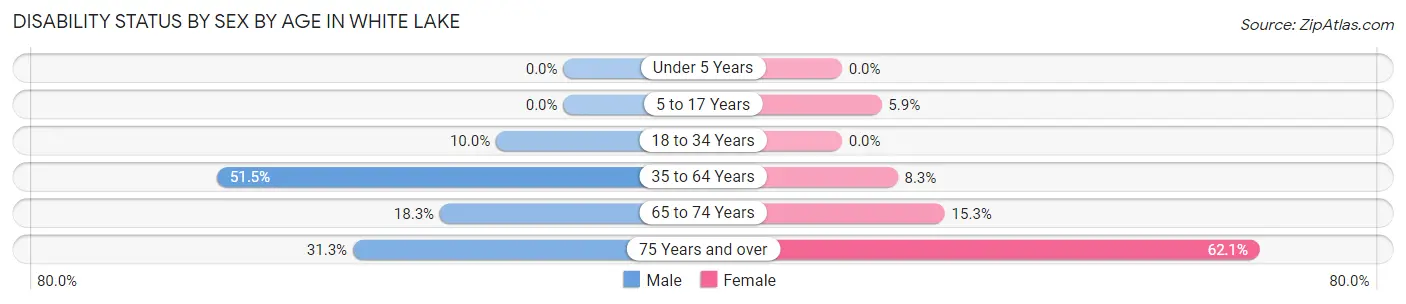
| Age Bracket | Male | Female |
| Under 5 Years | 0 (0.0%) | 0 (0.0%) |
| 5 to 17 Years | 0 (0.0%) | 2 (5.9%) |
| 18 to 34 Years | 4 (10.0%) | 0 (0.0%) |
| 35 to 64 Years | 142 (51.4%) | 12 (8.3%) |
| 65 to 74 Years | 11 (18.3%) | 20 (15.3%) |
| 75 Years and over | 30 (31.2%) | 36 (62.1%) |
Disability Class by Sex by Age in White Lake
Disability Class: Hearing Difficulty
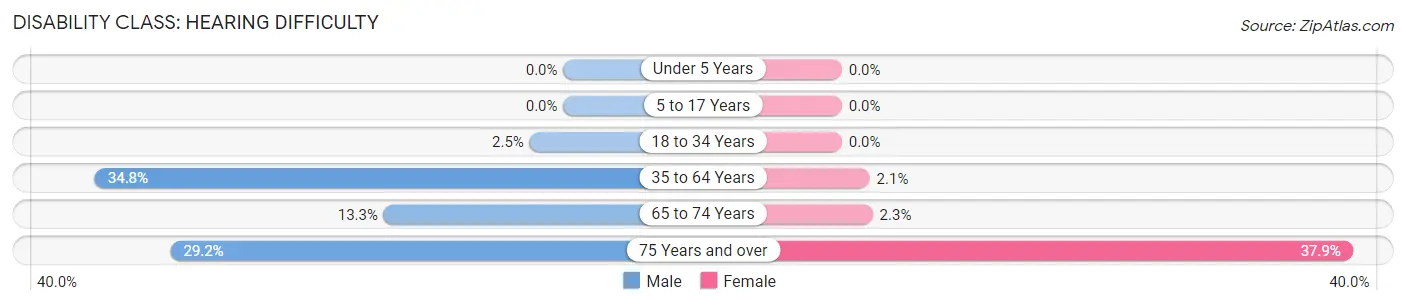
| Age Bracket | Male | Female |
| Under 5 Years | 0 (0.0%) | 0 (0.0%) |
| 5 to 17 Years | 0 (0.0%) | 0 (0.0%) |
| 18 to 34 Years | 1 (2.5%) | 0 (0.0%) |
| 35 to 64 Years | 96 (34.8%) | 3 (2.1%) |
| 65 to 74 Years | 8 (13.3%) | 3 (2.3%) |
| 75 Years and over | 28 (29.2%) | 22 (37.9%) |
Disability Class: Vision Difficulty
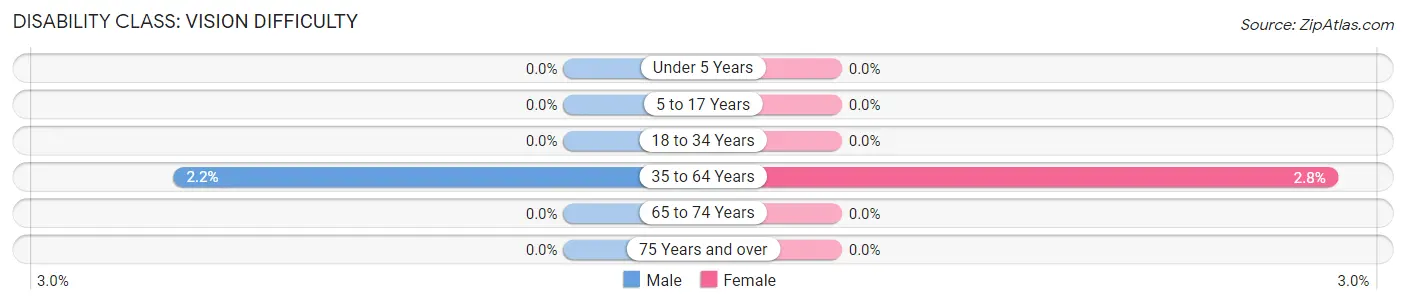
| Age Bracket | Male | Female |
| Under 5 Years | 0 (0.0%) | 0 (0.0%) |
| 5 to 17 Years | 0 (0.0%) | 0 (0.0%) |
| 18 to 34 Years | 0 (0.0%) | 0 (0.0%) |
| 35 to 64 Years | 6 (2.2%) | 4 (2.8%) |
| 65 to 74 Years | 0 (0.0%) | 0 (0.0%) |
| 75 Years and over | 0 (0.0%) | 0 (0.0%) |
Disability Class: Cognitive Difficulty
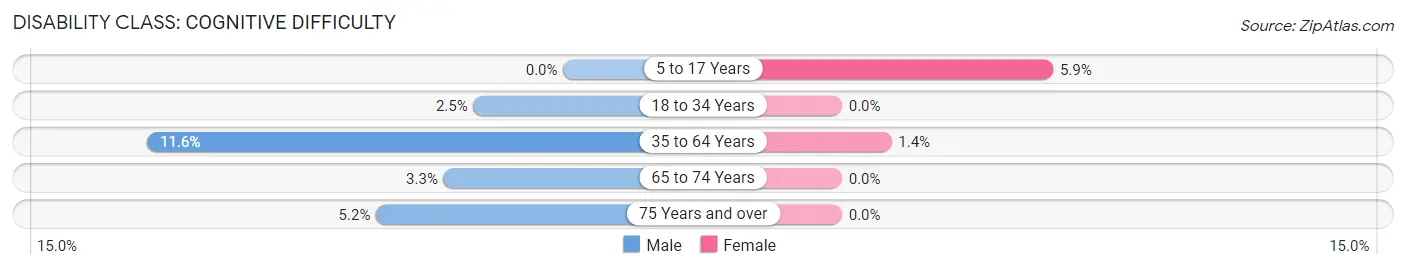
| Age Bracket | Male | Female |
| 5 to 17 Years | 0 (0.0%) | 2 (5.9%) |
| 18 to 34 Years | 1 (2.5%) | 0 (0.0%) |
| 35 to 64 Years | 32 (11.6%) | 2 (1.4%) |
| 65 to 74 Years | 2 (3.3%) | 0 (0.0%) |
| 75 Years and over | 5 (5.2%) | 0 (0.0%) |
Disability Class: Ambulatory Difficulty
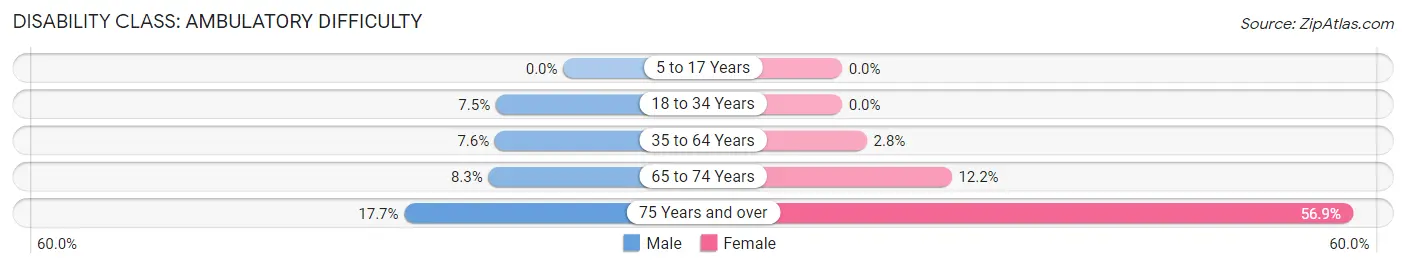
| Age Bracket | Male | Female |
| 5 to 17 Years | 0 (0.0%) | 0 (0.0%) |
| 18 to 34 Years | 3 (7.5%) | 0 (0.0%) |
| 35 to 64 Years | 21 (7.6%) | 4 (2.8%) |
| 65 to 74 Years | 5 (8.3%) | 16 (12.2%) |
| 75 Years and over | 17 (17.7%) | 33 (56.9%) |
Disability Class: Self-Care Difficulty
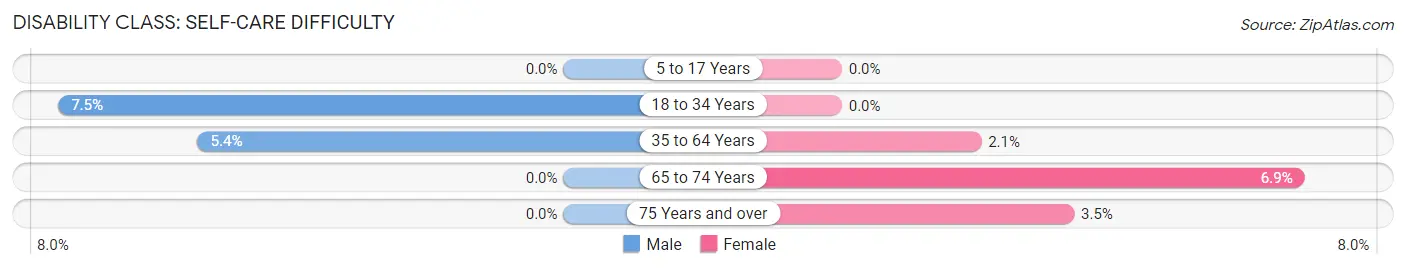
| Age Bracket | Male | Female |
| 5 to 17 Years | 0 (0.0%) | 0 (0.0%) |
| 18 to 34 Years | 3 (7.5%) | 0 (0.0%) |
| 35 to 64 Years | 15 (5.4%) | 3 (2.1%) |
| 65 to 74 Years | 0 (0.0%) | 9 (6.9%) |
| 75 Years and over | 0 (0.0%) | 2 (3.5%) |
Technology Access in White Lake
Computing Device Access in White Lake
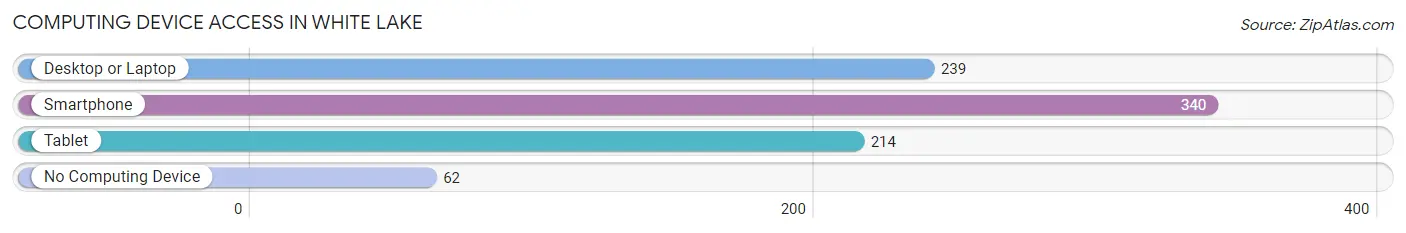
| Device Type | # Households | % Households |
| Desktop or Laptop | 239 | 58.3% |
| Smartphone | 340 | 82.9% |
| Tablet | 214 | 52.2% |
| No Computing Device | 62 | 15.1% |
| Total | 410 | 100.0% |
Internet Access in White Lake
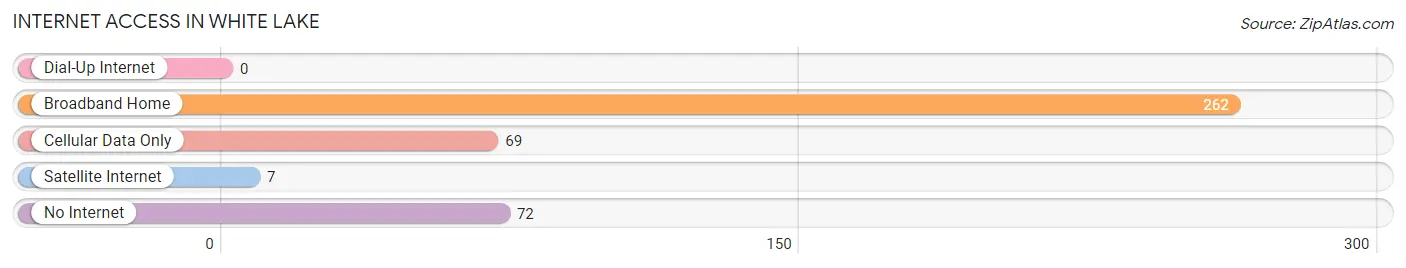
| Internet Type | # Households | % Households |
| Dial-Up Internet | 0 | 0.0% |
| Broadband Home | 262 | 63.9% |
| Cellular Data Only | 69 | 16.8% |
| Satellite Internet | 7 | 1.7% |
| No Internet | 72 | 17.6% |
| Total | 410 | 100.0% |
White Lake Summary
White Lake is a small town located in Bladen County, North Carolina. It is situated on the banks of the White Lake, a shallow, freshwater lake that is part of the Cape Fear River Basin. The town has a population of approximately 1,500 people and is located about 30 miles from the city of Wilmington.
History
White Lake was first settled in the early 1700s by a group of settlers from Scotland. The town was originally known as White Lake Crossroads, and was a popular stop for travelers on their way to Wilmington. In 1845, the town was officially incorporated and renamed White Lake.
The town was a popular destination for vacationers in the late 19th and early 20th centuries. The lake was a popular spot for swimming, fishing, and boating. The town also had a number of resorts and hotels, as well as a boardwalk and amusement park.
In the 1950s, the town began to decline as the popularity of the lake began to wane. The amusement park closed in the 1960s, and the boardwalk was destroyed by a hurricane in the 1970s. The town has since become a quiet, rural community.
Geography
White Lake is located in southeastern North Carolina, about 30 miles from Wilmington. The town is situated on the banks of the White Lake, a shallow, freshwater lake that is part of the Cape Fear River Basin. The lake is approximately 4,000 acres in size and is a popular spot for fishing, swimming, and boating.
The town is surrounded by a number of small towns and villages, including Elizabethtown, Bladenboro, and Dublin. The town is also close to the cities of Fayetteville and Raleigh.
Economy
White Lake is a small, rural community with a limited economy. The town is home to a number of small businesses, including restaurants, convenience stores, and a few small manufacturing companies. The town also has a number of small farms and agricultural businesses.
The town is also home to a number of tourist attractions, including the White Lake State Park, which offers camping, fishing, and boating. The town also has a number of bed and breakfasts, as well as a number of antique shops.
Demographics
As of the 2010 census, White Lake had a population of 1,500 people. The town is predominantly white, with a small African American population. The median household income is $35,000, and the median age is 44. The town has a high rate of poverty, with nearly 30% of the population living below the poverty line.
Common Questions
What is the Total Population of White Lake?
Total Population of White Lake is 997.
What is the Total Male Population of White Lake?
Total Male Population of White Lake is 556.
What is the Total Female Population of White Lake?
Total Female Population of White Lake is 441.
What is the Ratio of Males per 100 Females in White Lake?
There are 126.08 Males per 100 Females in White Lake.
What is the Ratio of Females per 100 Males in White Lake?
There are 79.32 Females per 100 Males in White Lake.
What is the Median Population Age in White Lake?
Median Population Age in White Lake is 60.5 Years.
What is the Average Family Size in White Lake
Average Family Size in White Lake is 3.2 People.
What is the Average Household Size in White Lake
Average Household Size in White Lake is 2.4 People.
What is Per Capita Income in White Lake?
Per Capita income in White Lake is $34,490.
What is the Median Family Income in White Lake?
Median Family Income in White Lake is $80,517.
What is the Median Household income in White Lake?
Median Household Income in White Lake is $58,421.
What is Income or Wage Gap in White Lake?
Income or Wage Gap in White Lake is 1.5%.
Women in White Lake earn 98.5 cents for every dollar earned by a man.
What is Inequality or Gini Index in White Lake?
Inequality or Gini Index in White Lake is 0.45.
How Large is the Labor Force in White Lake?
There are 314 People in the Labor Forcein in White Lake.
What is the Percentage of People in the Labor Force in White Lake?
36.2% of People are in the Labor Force in White Lake.