Porters Neck, NC
Porters Neck Map
Porters Neck Overview
7,165
TOTAL POPULATION
3,312
MALE POPULATION
3,853
FEMALE POPULATION
85.96
MALES / 100 FEMALES
116.33
FEMALES / 100 MALES
50.8
MEDIAN AGE
2.8
AVG FAMILY SIZE
2.2
AVG HOUSEHOLD SIZE
$63,936
PER CAPITA INCOME
$153,994
AVG FAMILY INCOME
$111,733
AVG HOUSEHOLD INCOME
57.4%
WAGE / INCOME GAP [ % ]
42.6¢/ $1
WAGE / INCOME GAP [ $ ]
0.45
INEQUALITY / GINI INDEX
3,395
LABOR FORCE [ PEOPLE ]
54.5%
PERCENT IN LABOR FORCE
13.7%
UNEMPLOYMENT RATE
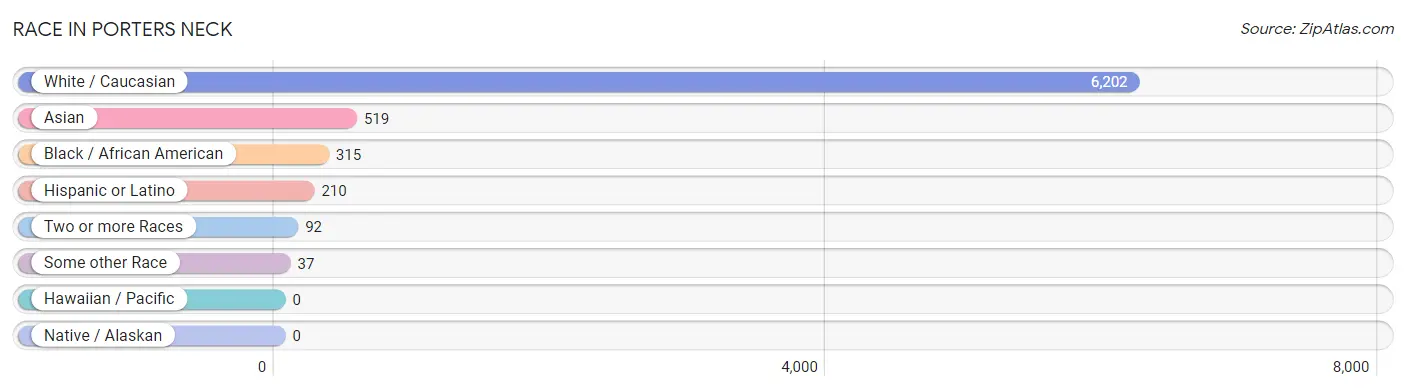
Race in Porters Neck
The most populous races in Porters Neck are White / Caucasian (6,202 | 86.6%), Asian (519 | 7.2%), and Black / African American (315 | 4.4%).
| Race | # Population | % Population |
| Asian | 519 | 7.2% |
| Black / African American | 315 | 4.4% |
| Hawaiian / Pacific | 0 | 0.0% |
| Hispanic or Latino | 210 | 2.9% |
| Native / Alaskan | 0 | 0.0% |
| White / Caucasian | 6,202 | 86.6% |
| Two or more Races | 92 | 1.3% |
| Some other Race | 37 | 0.5% |
| Total | 7,165 | 100.0% |
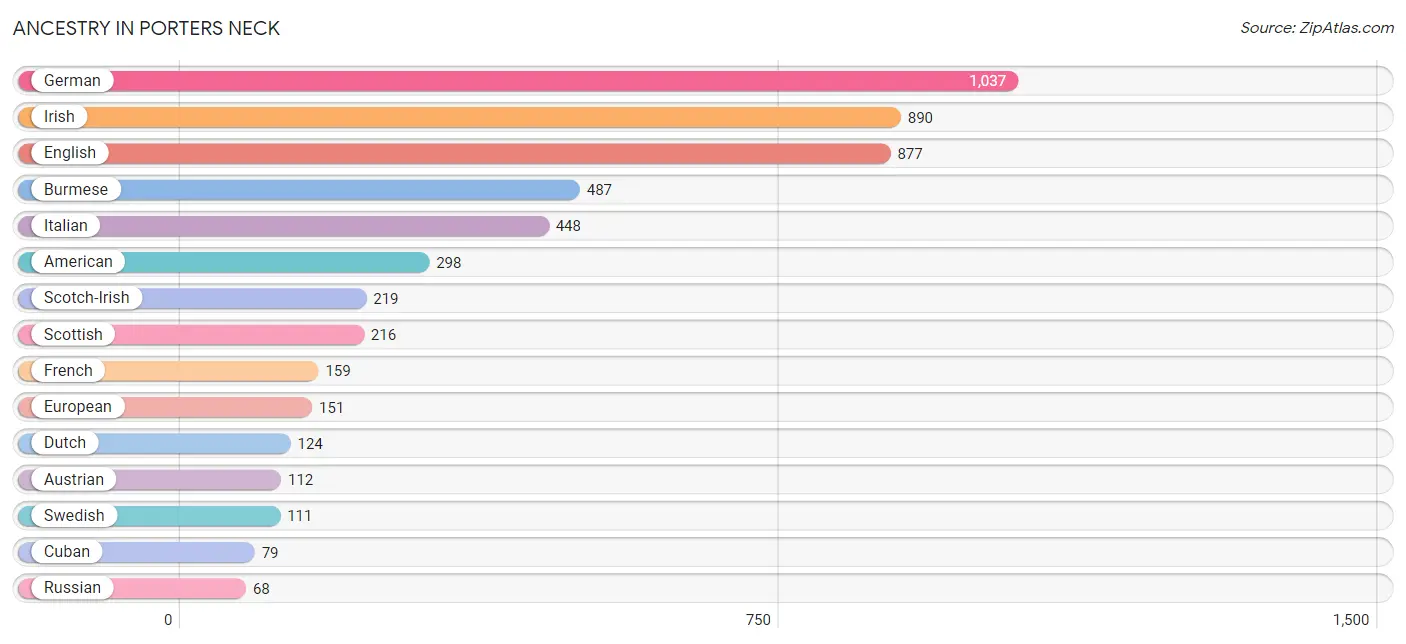
Ancestry in Porters Neck
The most populous ancestries reported in Porters Neck are German (1,037 | 14.5%), Irish (890 | 12.4%), English (877 | 12.2%), Burmese (487 | 6.8%), and Italian (448 | 6.2%), together accounting for 52.2% of all Porters Neck residents.
| Ancestry | # Population | % Population |
| American | 298 | 4.2% |
| Arab | 60 | 0.8% |
| Austrian | 112 | 1.6% |
| British | 20 | 0.3% |
| Burmese | 487 | 6.8% |
| Central American | 37 | 0.5% |
| Cuban | 79 | 1.1% |
| Danish | 29 | 0.4% |
| Dutch | 124 | 1.7% |
| Eastern European | 67 | 0.9% |
| Egyptian | 23 | 0.3% |
| English | 877 | 12.2% |
| European | 151 | 2.1% |
| French | 159 | 2.2% |
| French Canadian | 34 | 0.5% |
| German | 1,037 | 14.5% |
| Greek | 21 | 0.3% |
| Honduran | 37 | 0.5% |
| Hungarian | 35 | 0.5% |
| Indian (Asian) | 32 | 0.4% |
| Iranian | 18 | 0.3% |
| Irish | 890 | 12.4% |
| Israeli | 16 | 0.2% |
| Italian | 448 | 6.2% |
| Latvian | 12 | 0.2% |
| Lebanese | 37 | 0.5% |
| Lithuanian | 16 | 0.2% |
| Mexican | 34 | 0.5% |
| Northern European | 52 | 0.7% |
| Norwegian | 14 | 0.2% |
| Polish | 63 | 0.9% |
| Portuguese | 17 | 0.2% |
| Russian | 68 | 0.9% |
| Scandinavian | 33 | 0.5% |
| Scotch-Irish | 219 | 3.1% |
| Scottish | 216 | 3.0% |
| South American | 43 | 0.6% |
| Spanish | 17 | 0.2% |
| Swedish | 111 | 1.5% |
| Swiss | 25 | 0.4% |
| Ukrainian | 18 | 0.3% |
| Venezuelan | 43 | 0.6% |
| Welsh | 23 | 0.3% | View All 43 Rows |
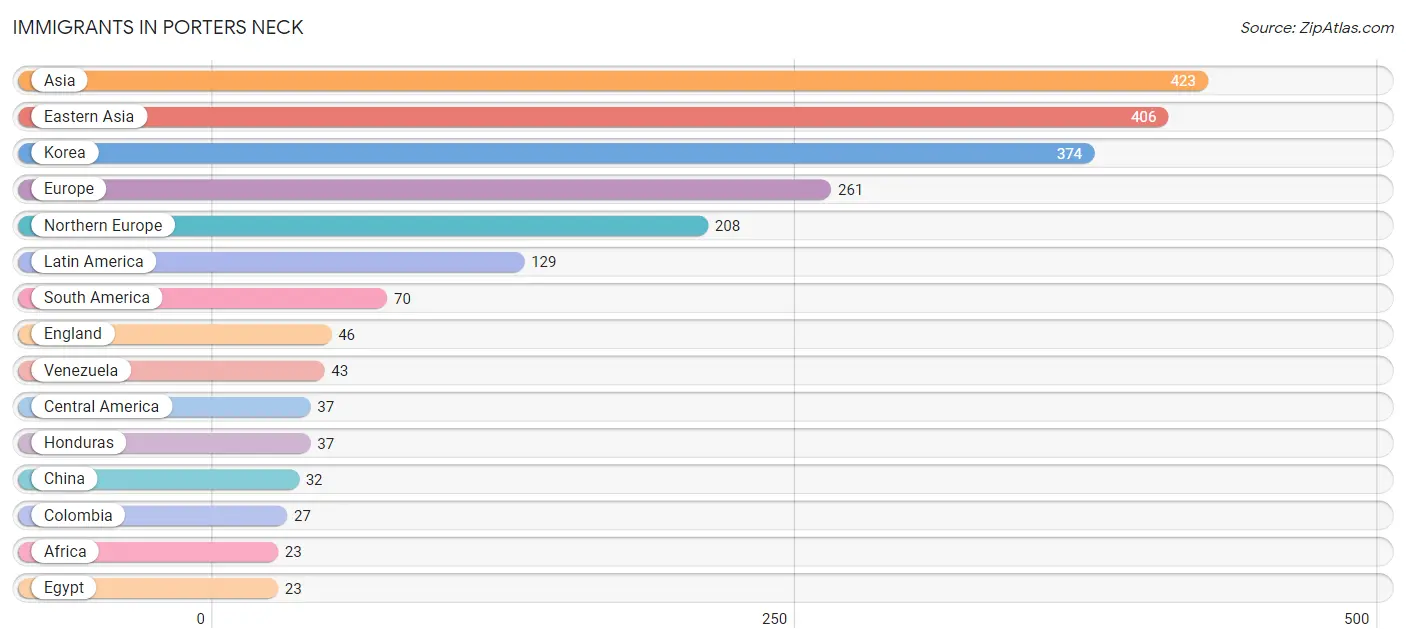
Immigrants in Porters Neck
The most numerous immigrant groups reported in Porters Neck came from Asia (423 | 5.9%), Eastern Asia (406 | 5.7%), Korea (374 | 5.2%), Europe (261 | 3.6%), and Northern Europe (208 | 2.9%), together accounting for 23.3% of all Porters Neck residents.
| Immigration Origin | # Population | % Population |
| Africa | 23 | 0.3% |
| Asia | 423 | 5.9% |
| Caribbean | 22 | 0.3% |
| Central America | 37 | 0.5% |
| China | 32 | 0.4% |
| Colombia | 27 | 0.4% |
| Cuba | 22 | 0.3% |
| Eastern Asia | 406 | 5.7% |
| Eastern Europe | 12 | 0.2% |
| Egypt | 23 | 0.3% |
| England | 46 | 0.6% |
| Europe | 261 | 3.6% |
| Germany | 4 | 0.1% |
| Honduras | 37 | 0.5% |
| Korea | 374 | 5.2% |
| Latin America | 129 | 1.8% |
| Latvia | 12 | 0.2% |
| Northern Africa | 23 | 0.3% |
| Northern Europe | 208 | 2.9% |
| Philippines | 17 | 0.2% |
| Portugal | 15 | 0.2% |
| South America | 70 | 1.0% |
| South Eastern Asia | 17 | 0.2% |
| Southern Europe | 15 | 0.2% |
| Venezuela | 43 | 0.6% |
| Western Europe | 4 | 0.1% | View All 26 Rows |
Sex and Age in Porters Neck
Sex and Age in Porters Neck
The most populous age groups in Porters Neck are 60 to 64 Years (322 | 9.7%) for men and 85 Years and over (485 | 12.6%) for women.
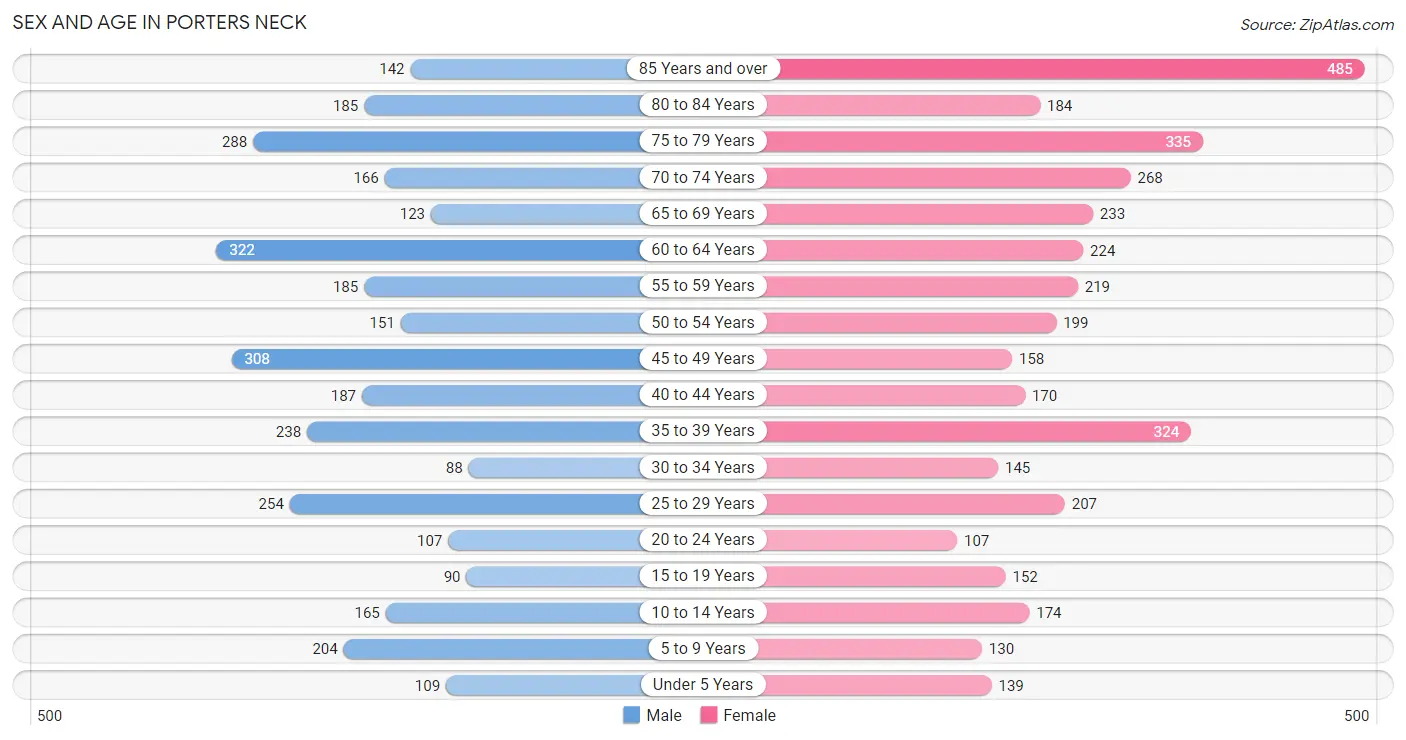
| Age Bracket | Male | Female |
| Under 5 Years | 109 (3.3%) | 139 (3.6%) |
| 5 to 9 Years | 204 (6.2%) | 130 (3.4%) |
| 10 to 14 Years | 165 (5.0%) | 174 (4.5%) |
| 15 to 19 Years | 90 (2.7%) | 152 (3.9%) |
| 20 to 24 Years | 107 (3.2%) | 107 (2.8%) |
| 25 to 29 Years | 254 (7.7%) | 207 (5.4%) |
| 30 to 34 Years | 88 (2.7%) | 145 (3.8%) |
| 35 to 39 Years | 238 (7.2%) | 324 (8.4%) |
| 40 to 44 Years | 187 (5.7%) | 170 (4.4%) |
| 45 to 49 Years | 308 (9.3%) | 158 (4.1%) |
| 50 to 54 Years | 151 (4.6%) | 199 (5.2%) |
| 55 to 59 Years | 185 (5.6%) | 219 (5.7%) |
| 60 to 64 Years | 322 (9.7%) | 224 (5.8%) |
| 65 to 69 Years | 123 (3.7%) | 233 (6.0%) |
| 70 to 74 Years | 166 (5.0%) | 268 (7.0%) |
| 75 to 79 Years | 288 (8.7%) | 335 (8.7%) |
| 80 to 84 Years | 185 (5.6%) | 184 (4.8%) |
| 85 Years and over | 142 (4.3%) | 485 (12.6%) |
| Total | 3,312 (100.0%) | 3,853 (100.0%) |
Families and Households in Porters Neck
Median Family Size in Porters Neck
The median family size in Porters Neck is 2.76 persons per family, with single female/mother families (63 | 3.1%) accounting for the largest median family size of 3.06 persons per family. On the other hand, single male/father families (30 | 1.5%) represent the smallest median family size with 2.17 persons per family.
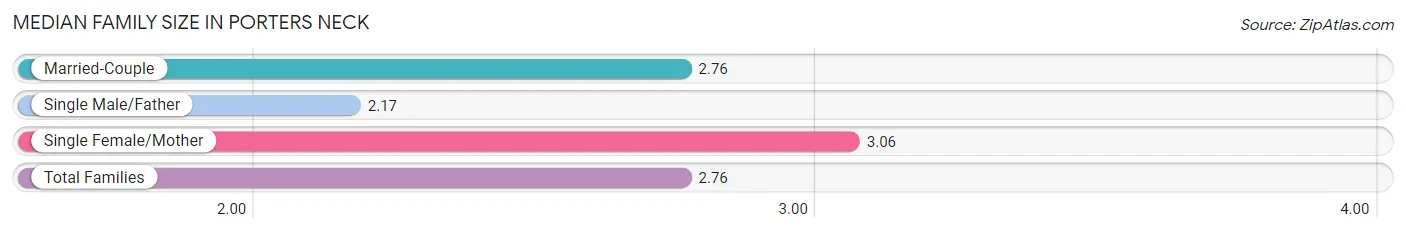
| Family Type | # Families | Family Size |
| Married-Couple | 1,963 (95.5%) | 2.76 |
| Single Male/Father | 30 (1.5%) | 2.17 |
| Single Female/Mother | 63 (3.1%) | 3.06 |
| Total Families | 2,056 (100.0%) | 2.76 |
Median Household Size in Porters Neck
The median household size in Porters Neck is 2.18 persons per household, with single female/mother households (63 | 2.0%) accounting for the largest median household size of 3.06 persons per household. non-family households (1,104 | 34.9%) represent the smallest median household size with 1.08 persons per household.
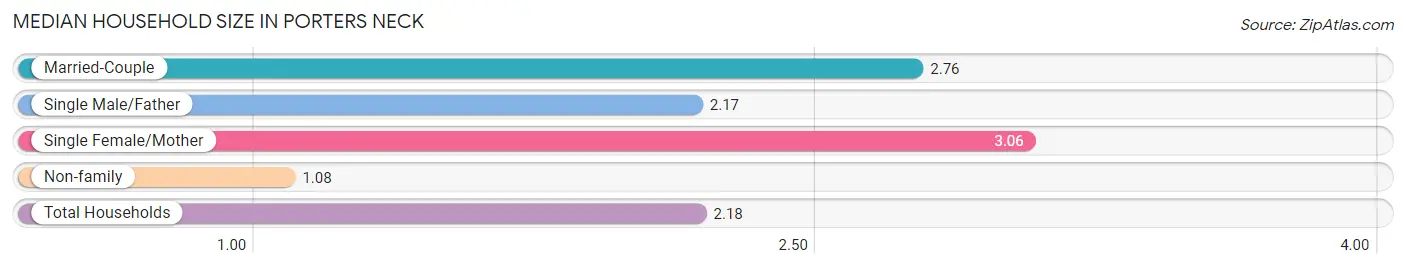
| Household Type | # Households | Household Size |
| Married-Couple | 1,963 (62.1%) | 2.76 |
| Single Male/Father | 30 (0.9%) | 2.17 |
| Single Female/Mother | 63 (2.0%) | 3.06 |
| Non-family | 1,104 (34.9%) | 1.08 |
| Total Households | 3,160 (100.0%) | 2.18 |
Household Size by Marriage Status in Porters Neck
Out of a total of 3,160 households in Porters Neck, 2,056 (65.1%) are family households, while 1,104 (34.9%) are nonfamily households. The most numerous type of family households are 2-person households, comprising 1,127, and the most common type of nonfamily households are 1-person households, comprising 1,002.
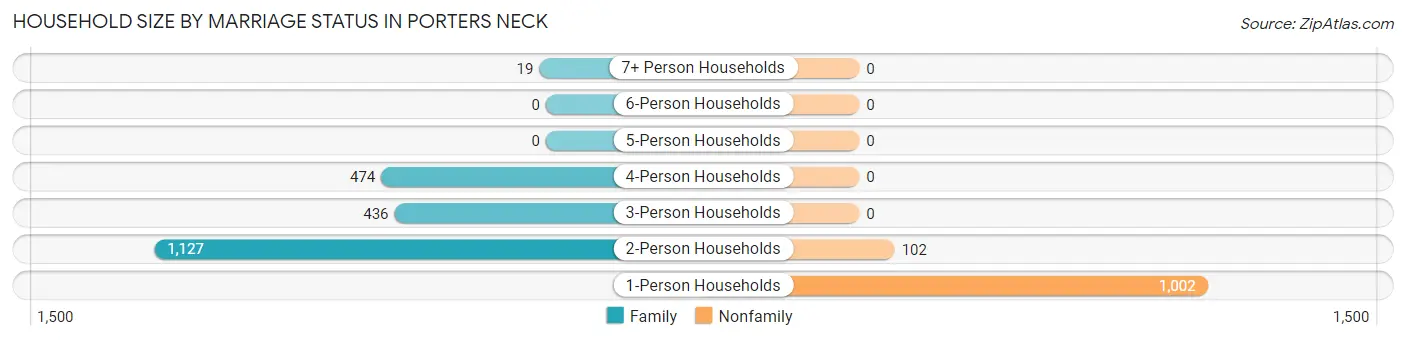
| Household Size | Family Households | Nonfamily Households |
| 1-Person Households | - | 1,002 (31.7%) |
| 2-Person Households | 1,127 (35.7%) | 102 (3.2%) |
| 3-Person Households | 436 (13.8%) | 0 (0.0%) |
| 4-Person Households | 474 (15.0%) | 0 (0.0%) |
| 5-Person Households | 0 (0.0%) | 0 (0.0%) |
| 6-Person Households | 0 (0.0%) | 0 (0.0%) |
| 7+ Person Households | 19 (0.6%) | 0 (0.0%) |
| Total | 2,056 (65.1%) | 1,104 (34.9%) |
Female Fertility in Porters Neck
Fertility by Age in Porters Neck
Average fertility rate in Porters Neck is 9.0 births per 1,000 women. Women in the age bracket of 35 to 50 years have the highest fertility rate with 17.0 births per 1,000 women. Women in the age bracket of 35 to 50 years acount for 100.0% of all women with births.
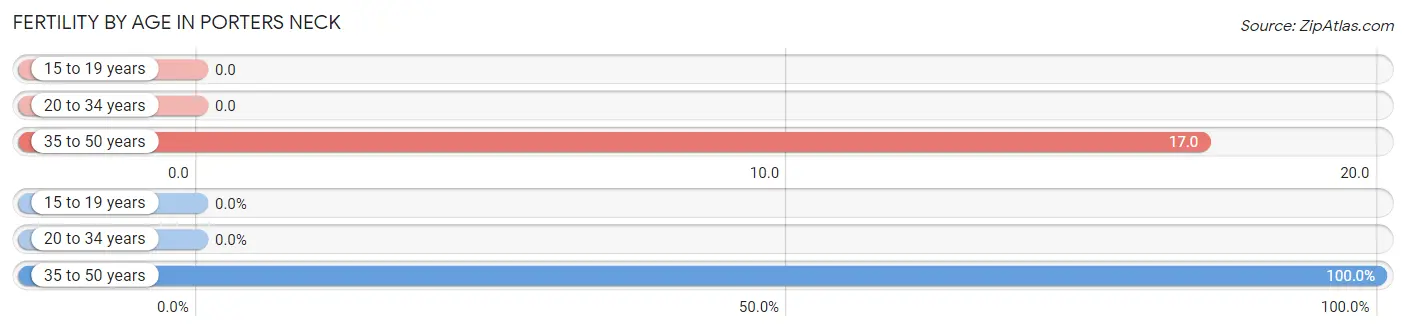
| Age Bracket | Women with Births | Births / 1,000 Women |
| 15 to 19 years | 0 (0.0%) | 0.0 |
| 20 to 34 years | 0 (0.0%) | 0.0 |
| 35 to 50 years | 12 (100.0%) | 17.0 |
| Total | 12 (100.0%) | 9.0 |
Fertility by Age by Marriage Status in Porters Neck
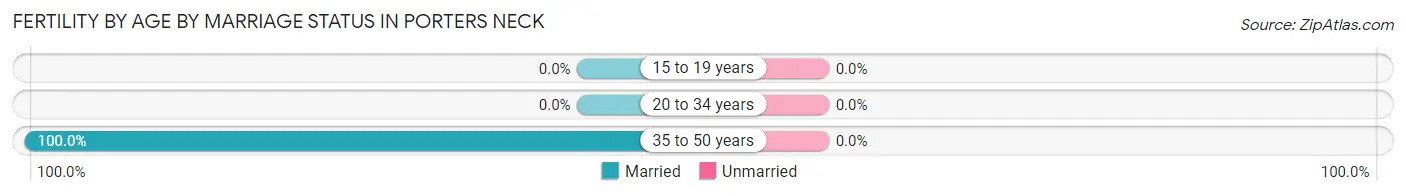
| Age Bracket | Married | Unmarried |
| 15 to 19 years | 0 (0.0%) | 0 (0.0%) |
| 20 to 34 years | 0 (0.0%) | 0 (0.0%) |
| 35 to 50 years | 12 (100.0%) | 0 (0.0%) |
| Total | 12 (100.0%) | 0 (0.0%) |
Fertility by Education in Porters Neck
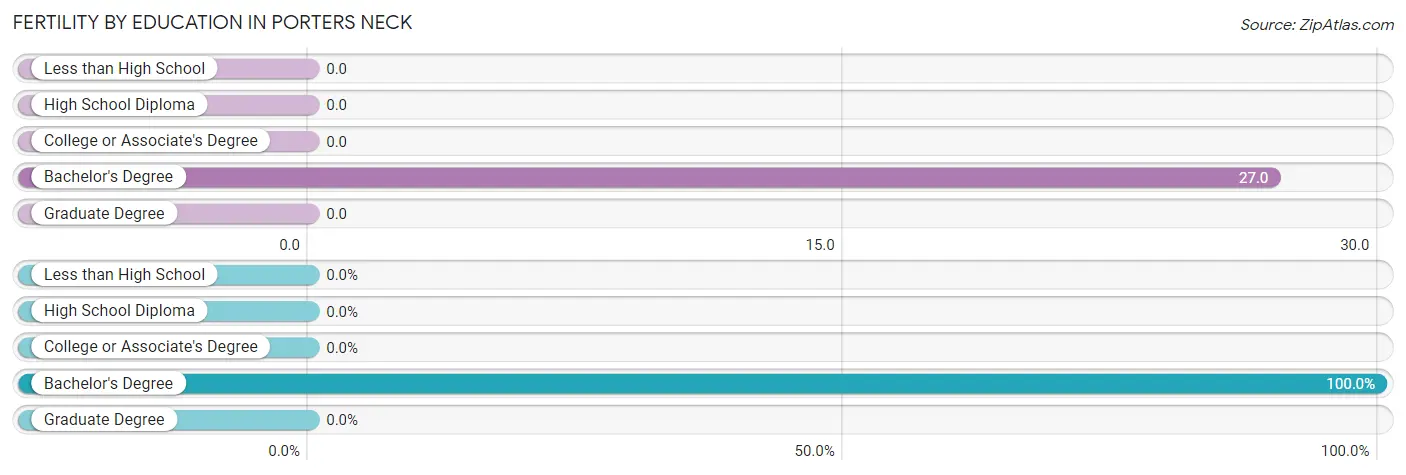
| Educational Attainment | Women with Births | Births / 1,000 Women |
| Less than High School | 0 (0.0%) | 0.0 |
| High School Diploma | 0 (0.0%) | 0.0 |
| College or Associate's Degree | 0 (0.0%) | 0.0 |
| Bachelor's Degree | 12 (100.0%) | 27.0 |
| Graduate Degree | 0 (0.0%) | 0.0 |
| Total | 12 (100.0%) | 9.0 |
Fertility by Education by Marriage Status in Porters Neck
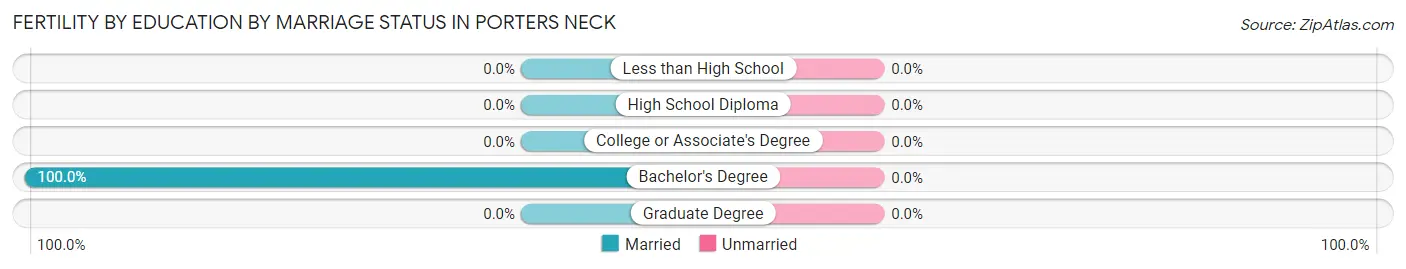
| Educational Attainment | Married | Unmarried |
| Less than High School | 0 (0.0%) | 0 (0.0%) |
| High School Diploma | 0 (0.0%) | 0 (0.0%) |
| College or Associate's Degree | 0 (0.0%) | 0 (0.0%) |
| Bachelor's Degree | 12 (100.0%) | 0 (0.0%) |
| Graduate Degree | 0 (0.0%) | 0 (0.0%) |
| Total | 12 (100.0%) | 0 (0.0%) |
Income in Porters Neck
Income Overview in Porters Neck
Per Capita Income in Porters Neck is $63,936, while median incomes of families and households are $153,994 and $111,733 respectively.
| Characteristic | Number | Measure |
| Per Capita Income | 7,165 | $63,936 |
| Median Family Income | 2,056 | $153,994 |
| Mean Family Income | 2,056 | $182,439 |
| Median Household Income | 3,160 | $111,733 |
| Mean Household Income | 3,160 | $143,978 |
| Income Deficit | 2,056 | $0 |
| Wage / Income Gap (%) | 7,165 | 57.43% |
| Wage / Income Gap ($) | 7,165 | 42.57¢ per $1 |
| Gini / Inequality Index | 7,165 | 0.45 |
Earnings by Sex in Porters Neck
Average Earnings in Porters Neck are $73,906, $97,607 for men and $41,548 for women, a difference of 57.4%.
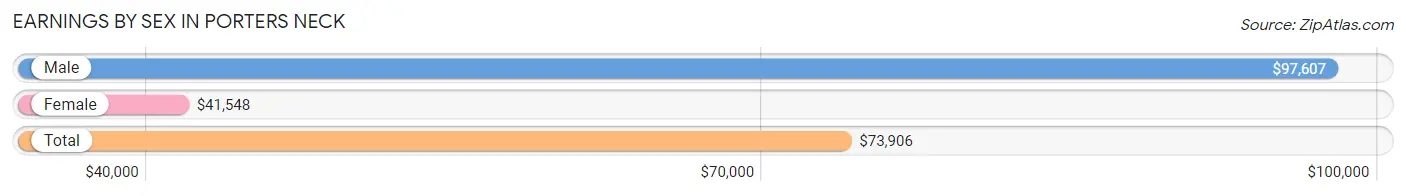
| Sex | Number | Average Earnings |
| Male | 1,787 (55.0%) | $97,607 |
| Female | 1,462 (45.0%) | $41,548 |
| Total | 3,249 (100.0%) | $73,906 |
Earnings by Sex by Income Bracket in Porters Neck
The most common earnings brackets in Porters Neck are $100,000+ for men (860 | 48.1%) and $100,000+ for women (345 | 23.6%).
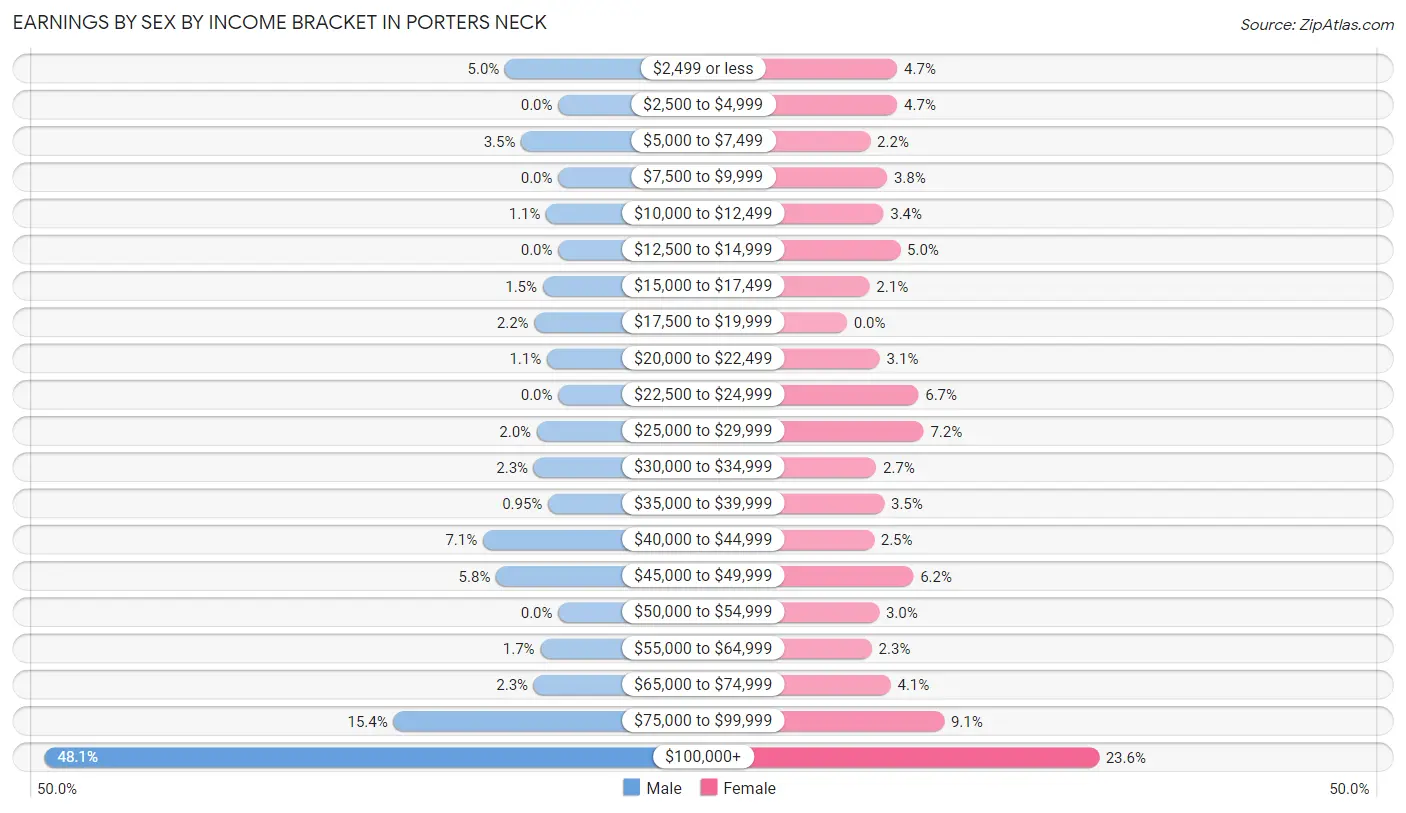
| Income | Male | Female |
| $2,499 or less | 89 (5.0%) | 69 (4.7%) |
| $2,500 to $4,999 | 0 (0.0%) | 69 (4.7%) |
| $5,000 to $7,499 | 62 (3.5%) | 32 (2.2%) |
| $7,500 to $9,999 | 0 (0.0%) | 55 (3.8%) |
| $10,000 to $12,499 | 20 (1.1%) | 50 (3.4%) |
| $12,500 to $14,999 | 0 (0.0%) | 73 (5.0%) |
| $15,000 to $17,499 | 26 (1.5%) | 31 (2.1%) |
| $17,500 to $19,999 | 40 (2.2%) | 0 (0.0%) |
| $20,000 to $22,499 | 19 (1.1%) | 45 (3.1%) |
| $22,500 to $24,999 | 0 (0.0%) | 98 (6.7%) |
| $25,000 to $29,999 | 36 (2.0%) | 105 (7.2%) |
| $30,000 to $34,999 | 41 (2.3%) | 40 (2.7%) |
| $35,000 to $39,999 | 17 (0.9%) | 51 (3.5%) |
| $40,000 to $44,999 | 126 (7.0%) | 37 (2.5%) |
| $45,000 to $49,999 | 104 (5.8%) | 91 (6.2%) |
| $50,000 to $54,999 | 0 (0.0%) | 44 (3.0%) |
| $55,000 to $64,999 | 30 (1.7%) | 34 (2.3%) |
| $65,000 to $74,999 | 41 (2.3%) | 60 (4.1%) |
| $75,000 to $99,999 | 276 (15.4%) | 133 (9.1%) |
| $100,000+ | 860 (48.1%) | 345 (23.6%) |
| Total | 1,787 (100.0%) | 1,462 (100.0%) |
Earnings by Sex by Educational Attainment in Porters Neck
Average earnings in Porters Neck are $102,889 for men and $46,163 for women, a difference of 55.1%. Men with an educational attainment of graduate degree enjoy the highest average annual earnings of $154,944, while those with high school diploma education earn the least with $40,188. Women with an educational attainment of graduate degree earn the most with the average annual earnings of $89,115, while those with college or associate's degree education have the smallest earnings of $29,651.
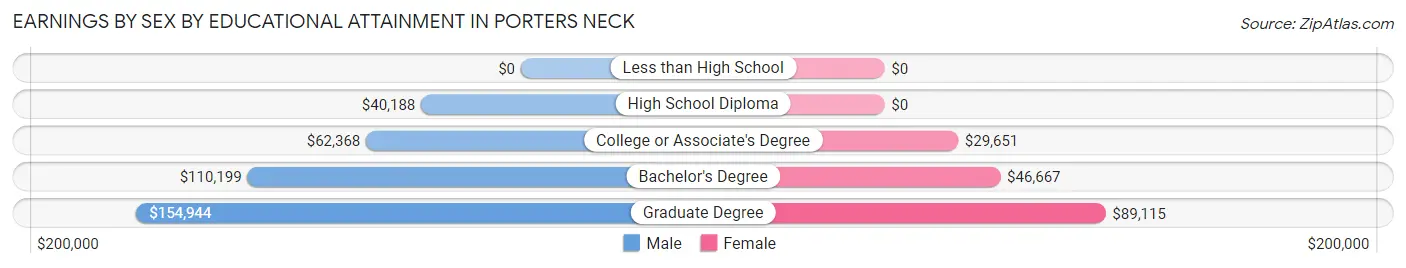
| Educational Attainment | Male Income | Female Income |
| Less than High School | - | - |
| High School Diploma | $40,188 | $0 |
| College or Associate's Degree | $62,368 | $29,651 |
| Bachelor's Degree | $110,199 | $46,667 |
| Graduate Degree | $154,944 | $89,115 |
| Total | $102,889 | $46,163 |
Family Income in Porters Neck
Family Income Brackets in Porters Neck
According to the Porters Neck family income data, there are 584 families falling into the $200,000+ income range, which is the most common income bracket and makes up 28.4% of all families.
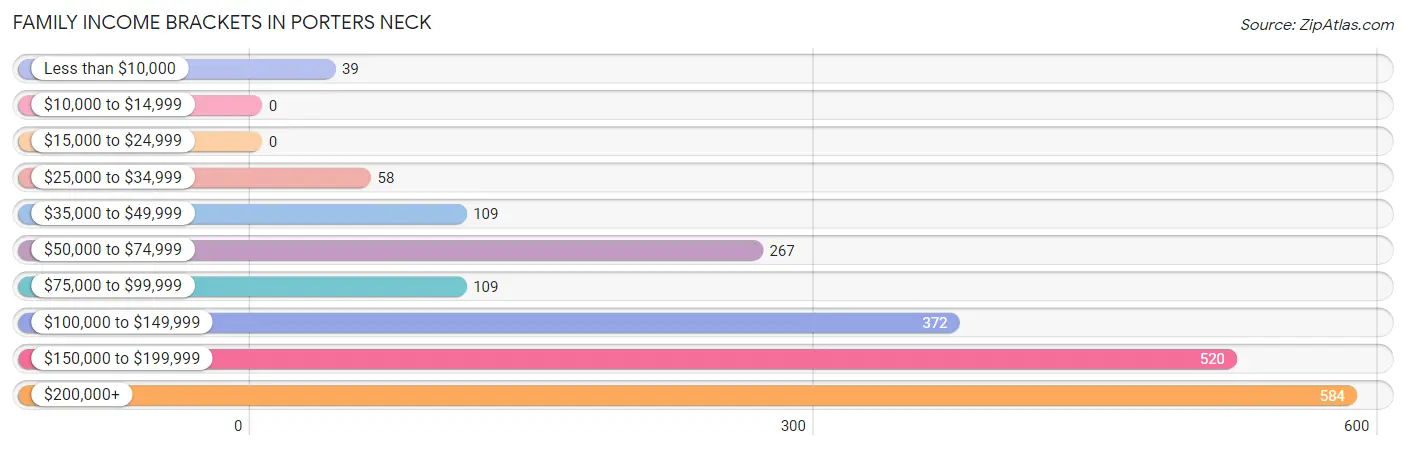
| Income Bracket | # Families | % Families |
| Less than $10,000 | 39 | 1.9% |
| $10,000 to $14,999 | 0 | 0.0% |
| $15,000 to $24,999 | 0 | 0.0% |
| $25,000 to $34,999 | 58 | 2.8% |
| $35,000 to $49,999 | 109 | 5.3% |
| $50,000 to $74,999 | 267 | 13.0% |
| $75,000 to $99,999 | 109 | 5.3% |
| $100,000 to $149,999 | 372 | 18.1% |
| $150,000 to $199,999 | 520 | 25.3% |
| $200,000+ | 584 | 28.4% |
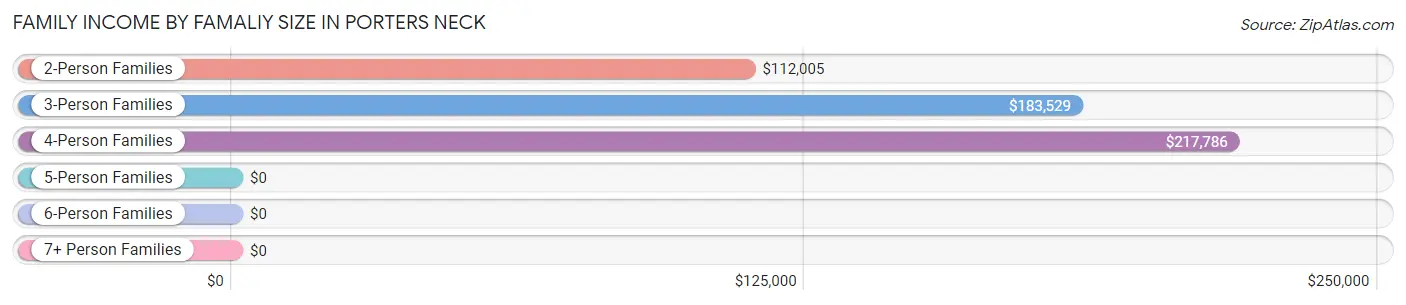
Family Income by Famaliy Size in Porters Neck
4-person families (474 | 23.1%) account for the highest median family income in Porters Neck with $217,786 per family, while 3-person families (436 | 21.2%) have the highest median income of $61,176 per family member.
| Income Bracket | # Families | Median Income |
| 2-Person Families | 1,127 (54.8%) | $112,005 |
| 3-Person Families | 436 (21.2%) | $183,529 |
| 4-Person Families | 474 (23.1%) | $217,786 |
| 5-Person Families | 0 (0.0%) | $0 |
| 6-Person Families | 0 (0.0%) | $0 |
| 7+ Person Families | 19 (0.9%) | $0 |
| Total | 2,056 (100.0%) | $153,994 |
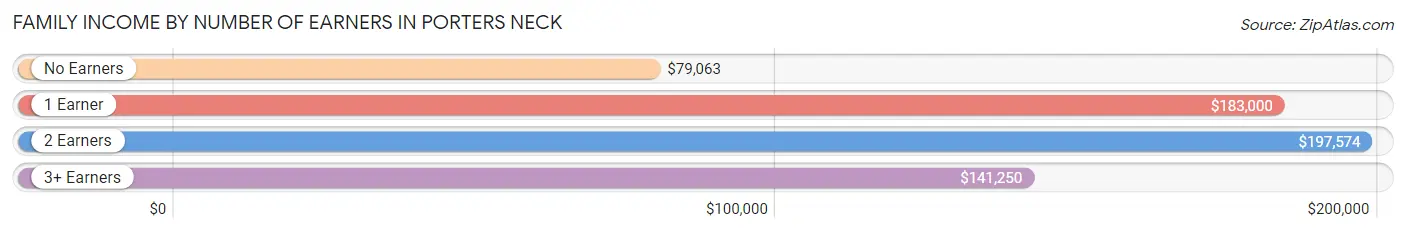
Family Income by Number of Earners in Porters Neck
The median family income in Porters Neck is $153,994, with families comprising 2 earners (913) having the highest median family income of $197,574, while families with no earners (557) have the lowest median family income of $79,063, accounting for 44.4% and 27.1% of families, respectively.
| Number of Earners | # Families | Median Income |
| No Earners | 557 (27.1%) | $79,063 |
| 1 Earner | 486 (23.6%) | $183,000 |
| 2 Earners | 913 (44.4%) | $197,574 |
| 3+ Earners | 100 (4.9%) | $141,250 |
| Total | 2,056 (100.0%) | $153,994 |
Household Income in Porters Neck
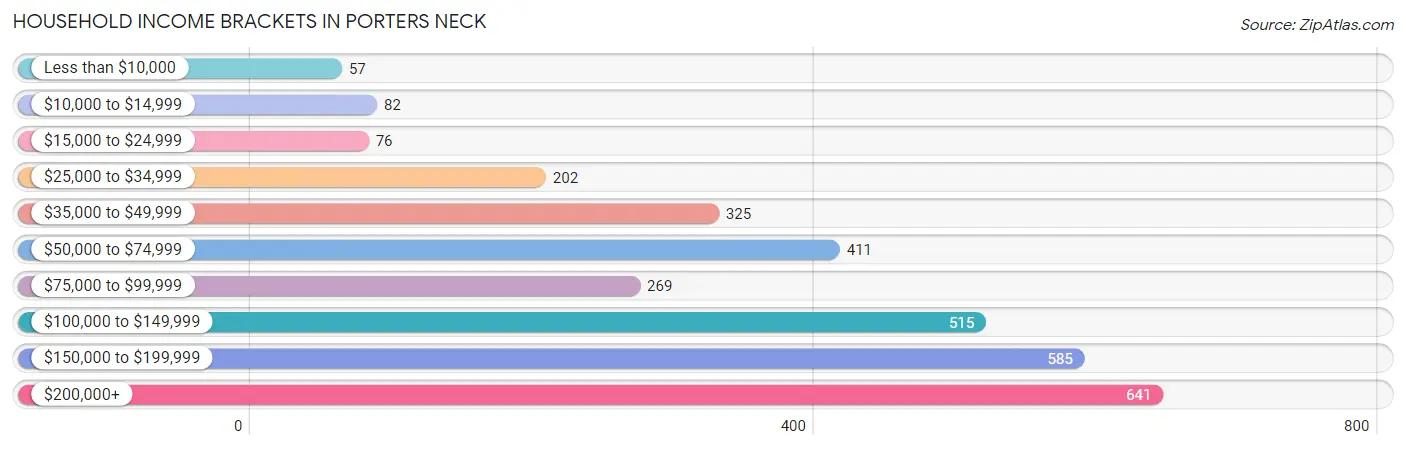
Household Income Brackets in Porters Neck
With 641 households falling in the category, the $200,000+ income range is the most frequent in Porters Neck, accounting for 20.3% of all households. In contrast, only 57 households (1.8%) fall into the less than $10,000 income bracket, making it the least populous group.
| Income Bracket | # Households | % Households |
| Less than $10,000 | 57 | 1.8% |
| $10,000 to $14,999 | 82 | 2.6% |
| $15,000 to $24,999 | 76 | 2.4% |
| $25,000 to $34,999 | 202 | 6.4% |
| $35,000 to $49,999 | 325 | 10.3% |
| $50,000 to $74,999 | 411 | 13.0% |
| $75,000 to $99,999 | 269 | 8.5% |
| $100,000 to $149,999 | 515 | 16.3% |
| $150,000 to $199,999 | 585 | 18.5% |
| $200,000+ | 641 | 20.3% |
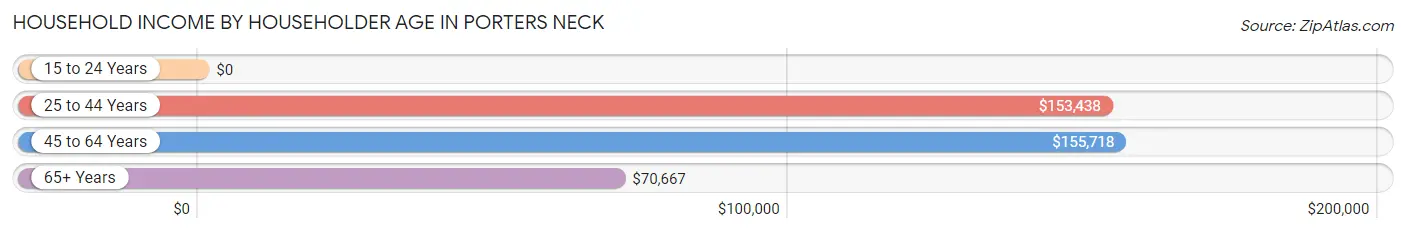
Household Income by Householder Age in Porters Neck
The median household income in Porters Neck is $111,733, with the highest median household income of $155,718 found in the 45 to 64 years age bracket for the primary householder. A total of 1,025 households (32.4%) fall into this category.
| Income Bracket | # Households | Median Income |
| 15 to 24 Years | 0 (0.0%) | $0 |
| 25 to 44 Years | 747 (23.6%) | $153,438 |
| 45 to 64 Years | 1,025 (32.4%) | $155,718 |
| 65+ Years | 1,388 (43.9%) | $70,667 |
| Total | 3,160 (100.0%) | $111,733 |
Poverty in Porters Neck
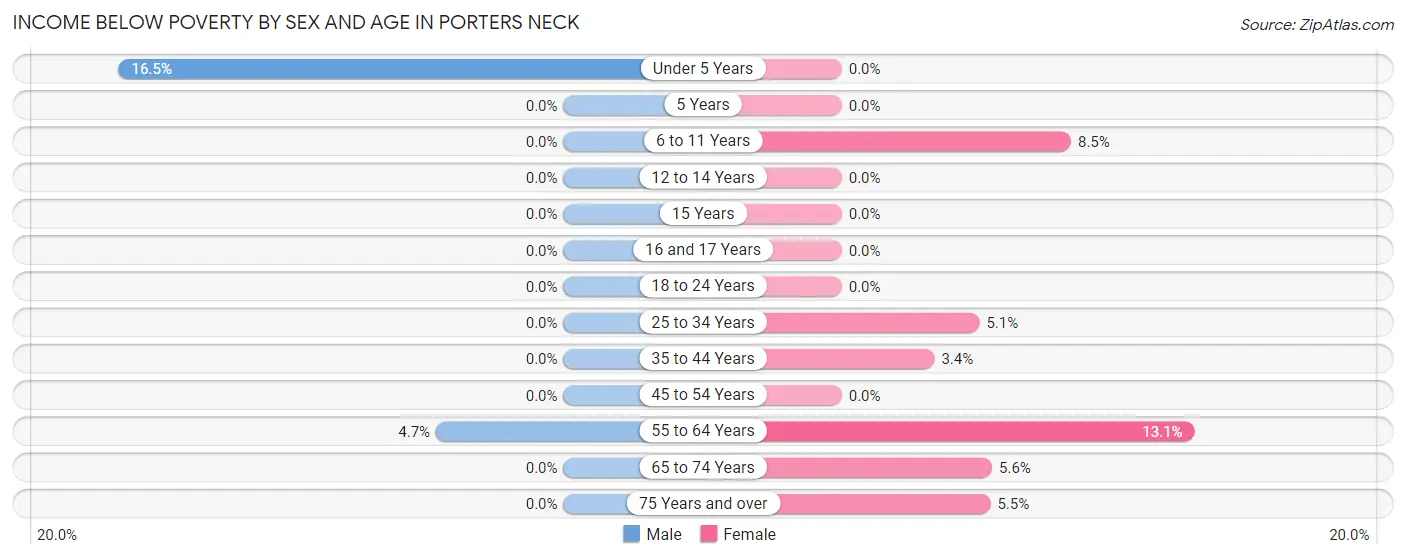
Income Below Poverty by Sex and Age in Porters Neck
With 1.3% poverty level for males and 5.0% for females among the residents of Porters Neck, under 5 year old males and 55 to 64 year old females are the most vulnerable to poverty, with 18 males (16.5%) and 58 females (13.1%) in their respective age groups living below the poverty level.
| Age Bracket | Male | Female |
| Under 5 Years | 18 (16.5%) | 0 (0.0%) |
| 5 Years | 0 (0.0%) | 0 (0.0%) |
| 6 to 11 Years | 0 (0.0%) | 16 (8.5%) |
| 12 to 14 Years | 0 (0.0%) | 0 (0.0%) |
| 15 Years | 0 (0.0%) | 0 (0.0%) |
| 16 and 17 Years | 0 (0.0%) | 0 (0.0%) |
| 18 to 24 Years | 0 (0.0%) | 0 (0.0%) |
| 25 to 34 Years | 0 (0.0%) | 18 (5.1%) |
| 35 to 44 Years | 0 (0.0%) | 17 (3.4%) |
| 45 to 54 Years | 0 (0.0%) | 0 (0.0%) |
| 55 to 64 Years | 22 (4.7%) | 58 (13.1%) |
| 65 to 74 Years | 0 (0.0%) | 27 (5.6%) |
| 75 Years and over | 0 (0.0%) | 46 (5.5%) |
| Total | 40 (1.3%) | 182 (5.0%) |
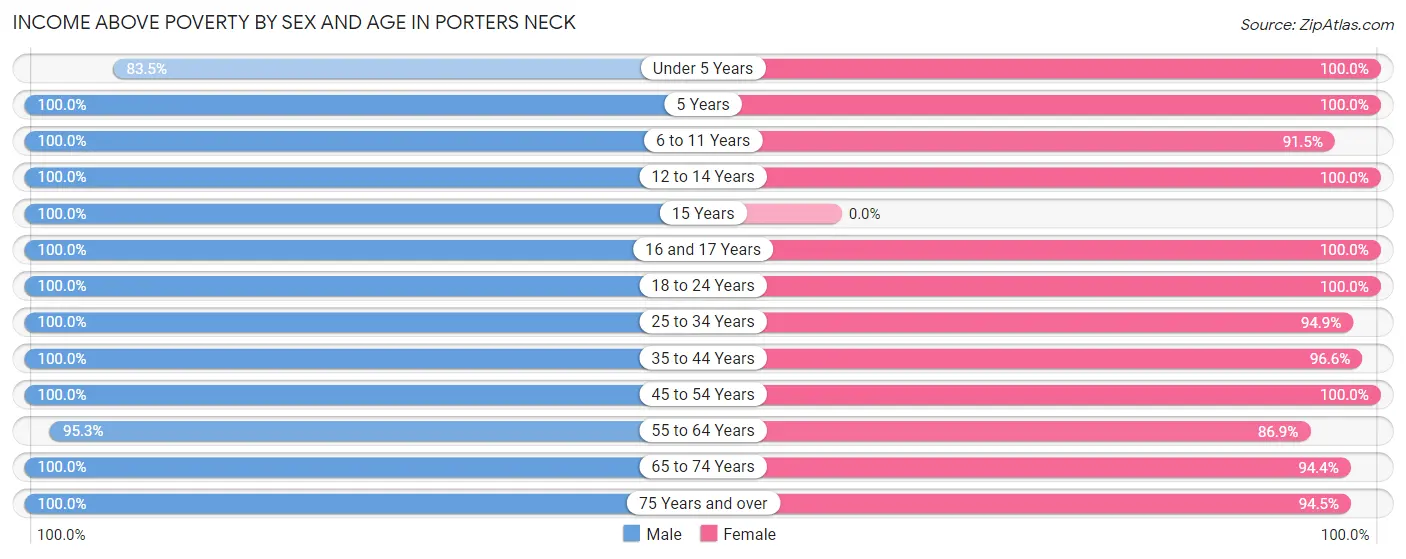
Income Above Poverty by Sex and Age in Porters Neck
According to the poverty statistics in Porters Neck, males aged 5 years and females aged under 5 years are the age groups that are most secure financially, with 100.0% of males and 100.0% of females in these age groups living above the poverty line.
| Age Bracket | Male | Female |
| Under 5 Years | 91 (83.5%) | 139 (100.0%) |
| 5 Years | 47 (100.0%) | 40 (100.0%) |
| 6 to 11 Years | 235 (100.0%) | 172 (91.5%) |
| 12 to 14 Years | 87 (100.0%) | 76 (100.0%) |
| 15 Years | 15 (100.0%) | 0 (0.0%) |
| 16 and 17 Years | 52 (100.0%) | 81 (100.0%) |
| 18 to 24 Years | 130 (100.0%) | 178 (100.0%) |
| 25 to 34 Years | 342 (100.0%) | 334 (94.9%) |
| 35 to 44 Years | 425 (100.0%) | 477 (96.6%) |
| 45 to 54 Years | 459 (100.0%) | 357 (100.0%) |
| 55 to 64 Years | 443 (95.3%) | 385 (86.9%) |
| 65 to 74 Years | 289 (100.0%) | 457 (94.4%) |
| 75 Years and over | 555 (100.0%) | 787 (94.5%) |
| Total | 3,170 (98.8%) | 3,483 (95.0%) |
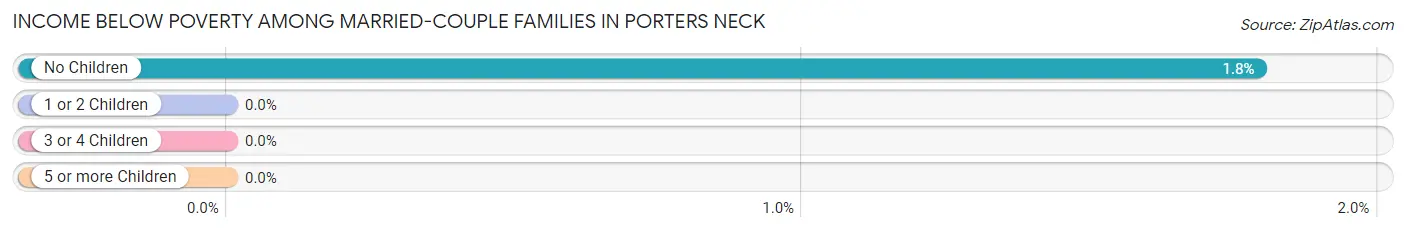
Income Below Poverty Among Married-Couple Families in Porters Neck
The poverty statistics for married-couple families in Porters Neck show that 1.1% or 22 of the total 1,963 families live below the poverty line. Families with no children have the highest poverty rate of 1.8%, comprising of 22 families. On the other hand, families with 1 or 2 children have the lowest poverty rate of 0.0%, which includes 0 families.
| Children | Above Poverty | Below Poverty |
| No Children | 1,207 (98.2%) | 22 (1.8%) |
| 1 or 2 Children | 715 (100.0%) | 0 (0.0%) |
| 3 or 4 Children | 19 (100.0%) | 0 (0.0%) |
| 5 or more Children | 0 (0.0%) | 0 (0.0%) |
| Total | 1,941 (98.9%) | 22 (1.1%) |
Income Below Poverty Among Single-Parent Households in Porters Neck
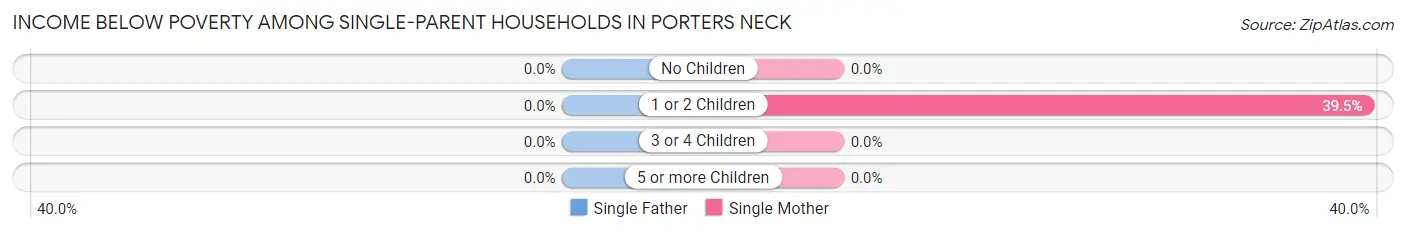
| Children | Single Father | Single Mother |
| No Children | 0 (0.0%) | 0 (0.0%) |
| 1 or 2 Children | 0 (0.0%) | 17 (39.5%) |
| 3 or 4 Children | 0 (0.0%) | 0 (0.0%) |
| 5 or more Children | 0 (0.0%) | 0 (0.0%) |
| Total | 0 (0.0%) | 17 (27.0%) |
Income Below Poverty Among Married-Couple vs Single-Parent Households in Porters Neck
The poverty data for Porters Neck shows that 22 of the married-couple family households (1.1%) and 17 of the single-parent households (18.3%) are living below the poverty level. Within the married-couple family households, those with no children have the highest poverty rate, with 22 households (1.8%) falling below the poverty line. Among the single-parent households, those with 1 or 2 children have the highest poverty rate, with 17 household (39.5%) living below poverty.
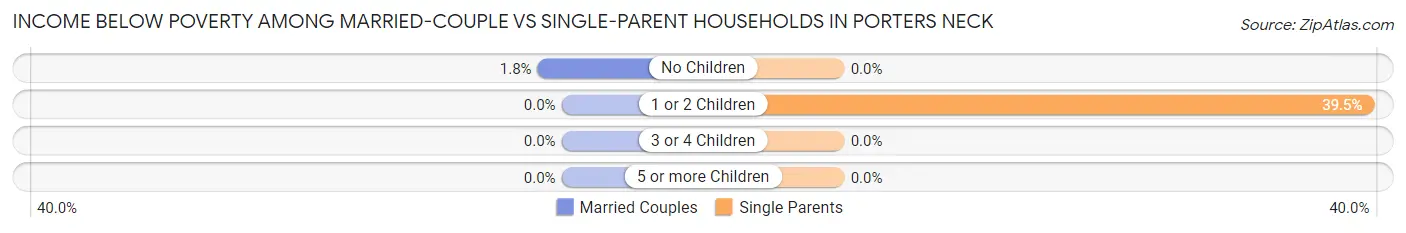
| Children | Married-Couple Families | Single-Parent Households |
| No Children | 22 (1.8%) | 0 (0.0%) |
| 1 or 2 Children | 0 (0.0%) | 17 (39.5%) |
| 3 or 4 Children | 0 (0.0%) | 0 (0.0%) |
| 5 or more Children | 0 (0.0%) | 0 (0.0%) |
| Total | 22 (1.1%) | 17 (18.3%) |
Employment Characteristics in Porters Neck
Employment by Class of Employer in Porters Neck
Among the 2,871 employed individuals in Porters Neck, private company employees (2,064 | 71.9%), self-employed (not incorporated) (237 | 8.3%), and not-for-profit organizations (173 | 6.0%) make up the most common classes of employment.
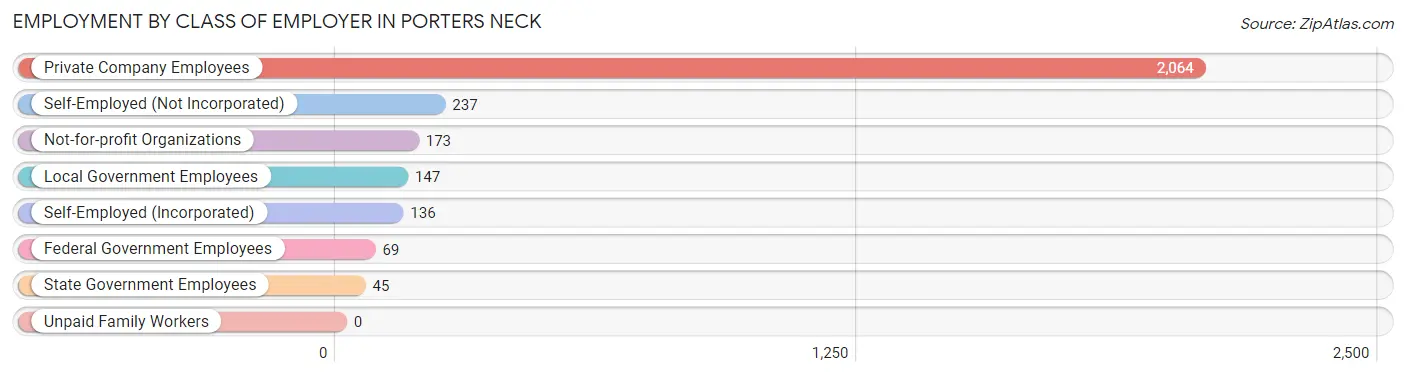
| Employer Class | # Employees | % Employees |
| Private Company Employees | 2,064 | 71.9% |
| Self-Employed (Incorporated) | 136 | 4.7% |
| Self-Employed (Not Incorporated) | 237 | 8.3% |
| Not-for-profit Organizations | 173 | 6.0% |
| Local Government Employees | 147 | 5.1% |
| State Government Employees | 45 | 1.6% |
| Federal Government Employees | 69 | 2.4% |
| Unpaid Family Workers | 0 | 0.0% |
| Total | 2,871 | 100.0% |
Employment Status by Age in Porters Neck
According to the labor force statistics for Porters Neck, out of the total population over 16 years of age (6,229), 54.5% or 3,395 individuals are in the labor force, with 13.7% or 465 of them unemployed. The age group with the highest labor force participation rate is 45 to 54 years, with 92.9% or 758 individuals in the labor force. Within the labor force, the 35 to 44 years age range has the highest percentage of unemployed individuals, with 44.4% or 374 of them being unemployed.
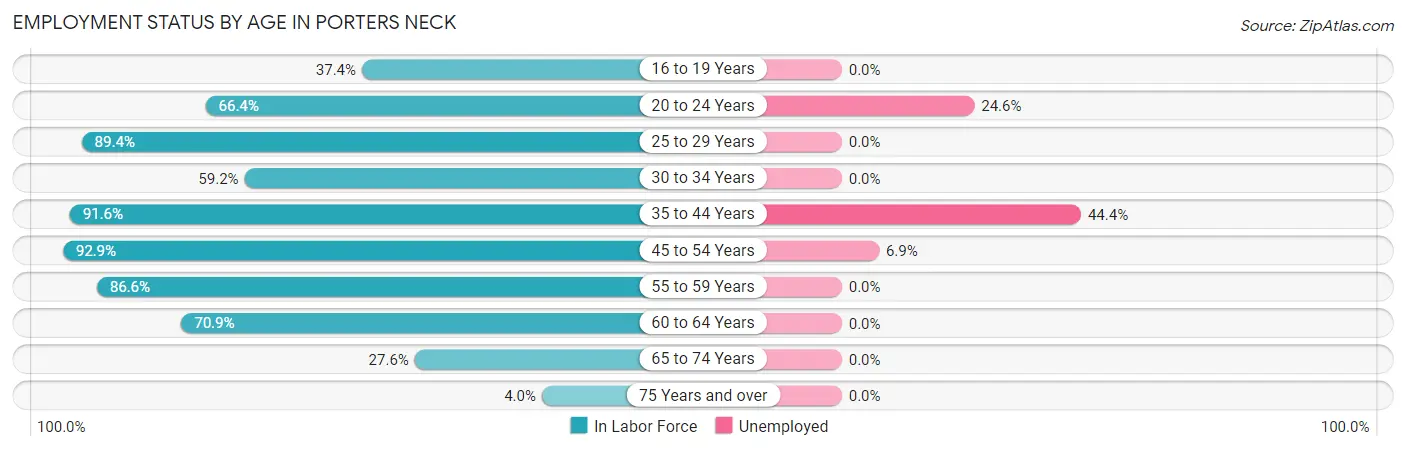
| Age Bracket | In Labor Force | Unemployed |
| 16 to 19 Years | 85 (37.4%) | 0 (0.0%) |
| 20 to 24 Years | 142 (66.4%) | 35 (24.6%) |
| 25 to 29 Years | 412 (89.4%) | 0 (0.0%) |
| 30 to 34 Years | 138 (59.2%) | 0 (0.0%) |
| 35 to 44 Years | 842 (91.6%) | 374 (44.4%) |
| 45 to 54 Years | 758 (92.9%) | 52 (6.9%) |
| 55 to 59 Years | 350 (86.6%) | 0 (0.0%) |
| 60 to 64 Years | 387 (70.9%) | 0 (0.0%) |
| 65 to 74 Years | 218 (27.6%) | 0 (0.0%) |
| 75 Years and over | 65 (4.0%) | 0 (0.0%) |
| Total | 3,395 (54.5%) | 465 (13.7%) |
Employment Status by Educational Attainment in Porters Neck
According to labor force statistics for Porters Neck, 85.4% of individuals (2,886) out of the total population between 25 and 64 years of age (3,379) are in the labor force, with 14.9% or 430 of them being unemployed. The group with the highest labor force participation rate are those with the educational attainment of less than high school, with 100.0% or 83 individuals in the labor force. Within the labor force, individuals with bachelor's degree or higher education have the highest percentage of unemployment, with 19.8% or 429 of them being unemployed.
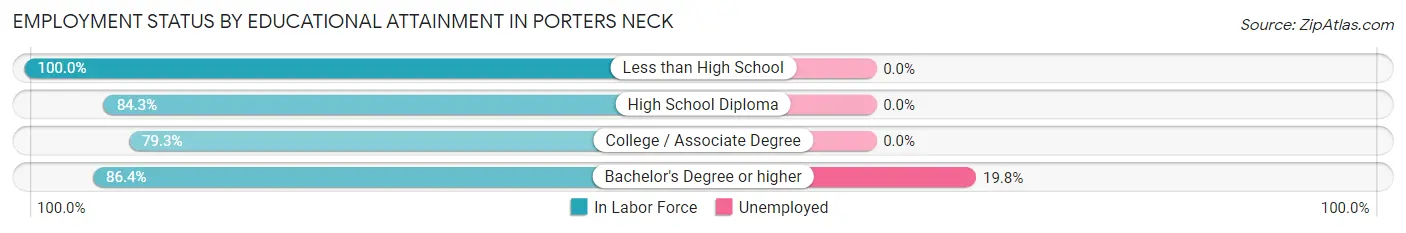
| Educational Attainment | In Labor Force | Unemployed |
| Less than High School | 83 (100.0%) | 0 (0.0%) |
| High School Diploma | 198 (84.3%) | 0 (0.0%) |
| College / Associate Degree | 437 (79.3%) | 0 (0.0%) |
| Bachelor's Degree or higher | 2,169 (86.4%) | 497 (19.8%) |
| Total | 2,886 (85.4%) | 503 (14.9%) |
Employment Occupations by Sex in Porters Neck
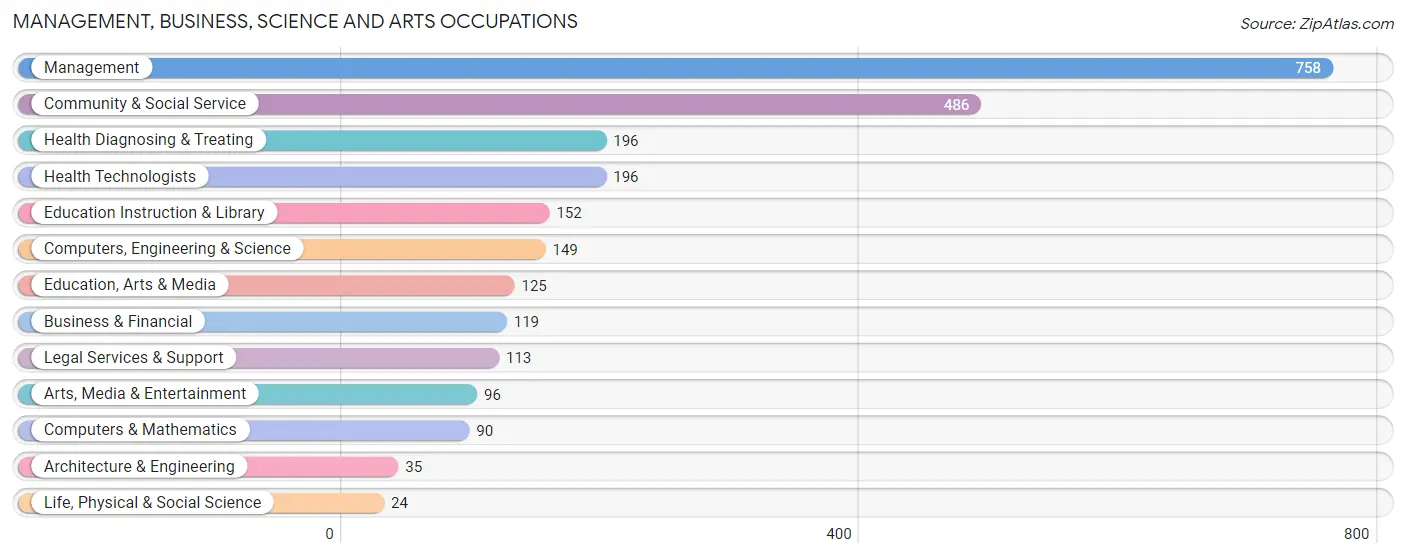
Management, Business, Science and Arts Occupations
The most common Management, Business, Science and Arts occupations in Porters Neck are Management (758 | 26.1%), Community & Social Service (486 | 16.8%), Health Diagnosing & Treating (196 | 6.8%), Health Technologists (196 | 6.8%), and Education Instruction & Library (152 | 5.2%).
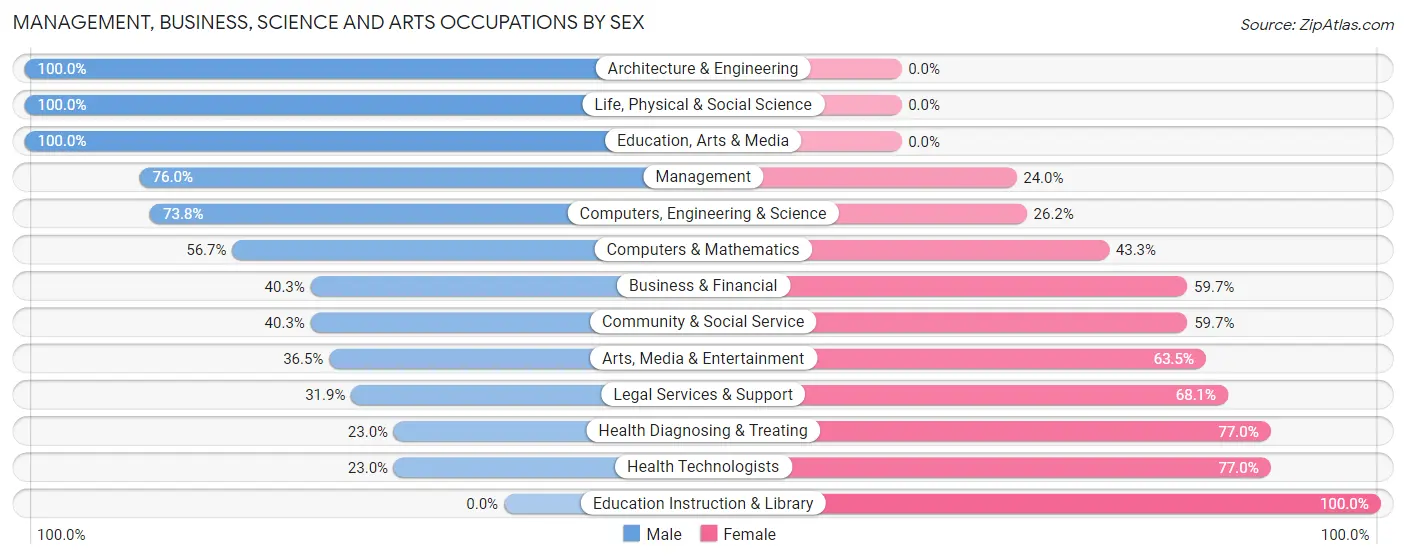
Management, Business, Science and Arts Occupations by Sex
Within the Management, Business, Science and Arts occupations in Porters Neck, the most male-oriented occupations are Architecture & Engineering (100.0%), Life, Physical & Social Science (100.0%), and Education, Arts & Media (100.0%), while the most female-oriented occupations are Education Instruction & Library (100.0%), Health Diagnosing & Treating (77.0%), and Health Technologists (77.0%).
| Occupation | Male | Female |
| Management | 576 (76.0%) | 182 (24.0%) |
| Business & Financial | 48 (40.3%) | 71 (59.7%) |
| Computers, Engineering & Science | 110 (73.8%) | 39 (26.2%) |
| Computers & Mathematics | 51 (56.7%) | 39 (43.3%) |
| Architecture & Engineering | 35 (100.0%) | 0 (0.0%) |
| Life, Physical & Social Science | 24 (100.0%) | 0 (0.0%) |
| Community & Social Service | 196 (40.3%) | 290 (59.7%) |
| Education, Arts & Media | 125 (100.0%) | 0 (0.0%) |
| Legal Services & Support | 36 (31.9%) | 77 (68.1%) |
| Education Instruction & Library | 0 (0.0%) | 152 (100.0%) |
| Arts, Media & Entertainment | 35 (36.5%) | 61 (63.5%) |
| Health Diagnosing & Treating | 45 (23.0%) | 151 (77.0%) |
| Health Technologists | 45 (23.0%) | 151 (77.0%) |
| Total (Category) | 975 (57.1%) | 733 (42.9%) |
| Total (Overall) | 1,552 (53.5%) | 1,348 (46.5%) |
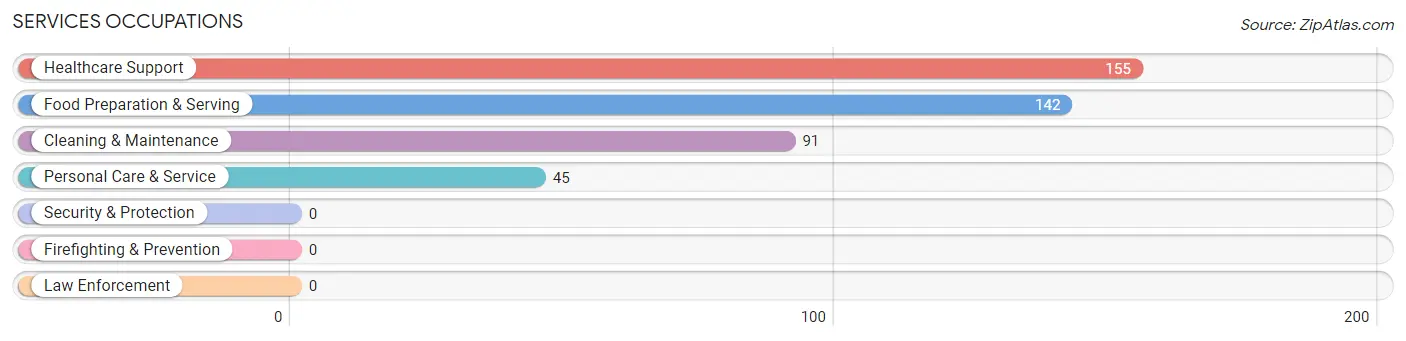
Services Occupations
The most common Services occupations in Porters Neck are Healthcare Support (155 | 5.3%), Food Preparation & Serving (142 | 4.9%), Cleaning & Maintenance (91 | 3.1%), and Personal Care & Service (45 | 1.5%).
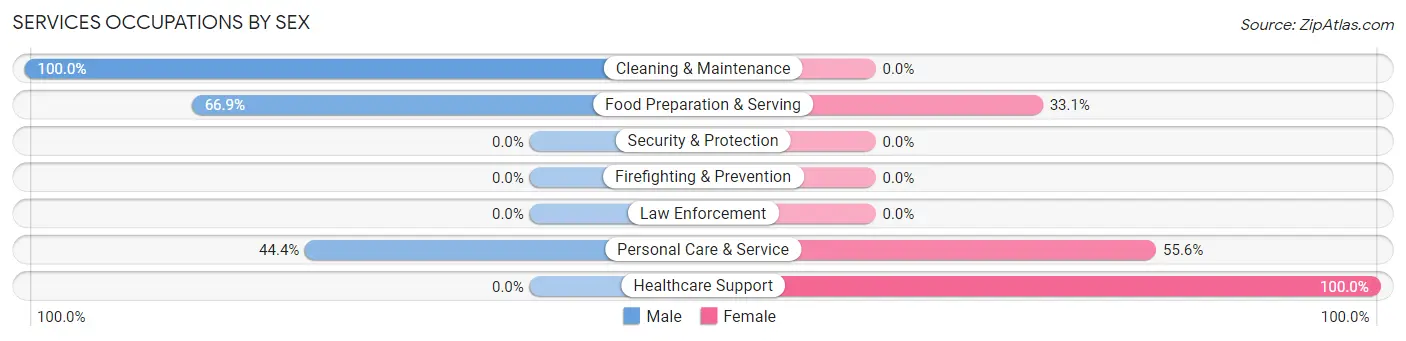
Services Occupations by Sex
Within the Services occupations in Porters Neck, the most male-oriented occupations are Cleaning & Maintenance (100.0%), Food Preparation & Serving (66.9%), and Personal Care & Service (44.4%), while the most female-oriented occupations are Healthcare Support (100.0%), Personal Care & Service (55.6%), and Food Preparation & Serving (33.1%).
| Occupation | Male | Female |
| Healthcare Support | 0 (0.0%) | 155 (100.0%) |
| Security & Protection | 0 (0.0%) | 0 (0.0%) |
| Firefighting & Prevention | 0 (0.0%) | 0 (0.0%) |
| Law Enforcement | 0 (0.0%) | 0 (0.0%) |
| Food Preparation & Serving | 95 (66.9%) | 47 (33.1%) |
| Cleaning & Maintenance | 91 (100.0%) | 0 (0.0%) |
| Personal Care & Service | 20 (44.4%) | 25 (55.6%) |
| Total (Category) | 206 (47.6%) | 227 (52.4%) |
| Total (Overall) | 1,552 (53.5%) | 1,348 (46.5%) |
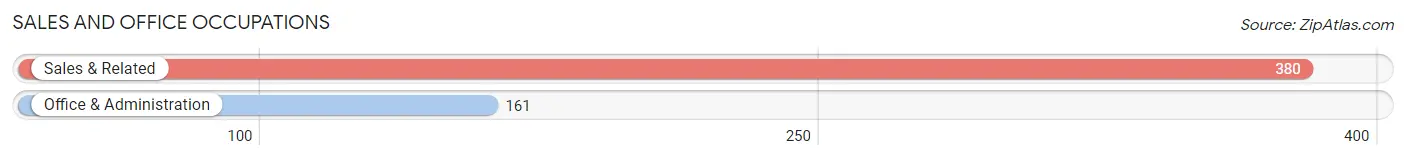
Sales and Office Occupations
The most common Sales and Office occupations in Porters Neck are Sales & Related (380 | 13.1%), and Office & Administration (161 | 5.6%).
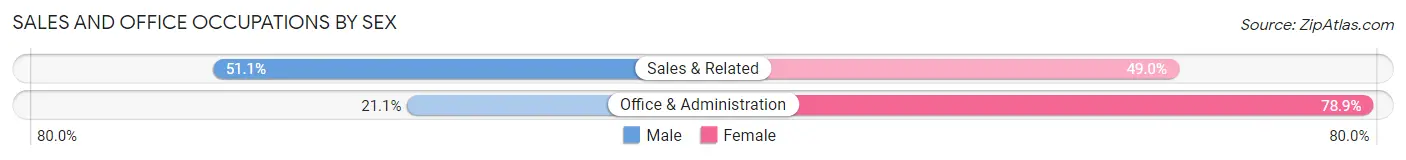
Sales and Office Occupations by Sex
| Occupation | Male | Female |
| Sales & Related | 194 (51.0%) | 186 (48.9%) |
| Office & Administration | 34 (21.1%) | 127 (78.9%) |
| Total (Category) | 228 (42.1%) | 313 (57.9%) |
| Total (Overall) | 1,552 (53.5%) | 1,348 (46.5%) |
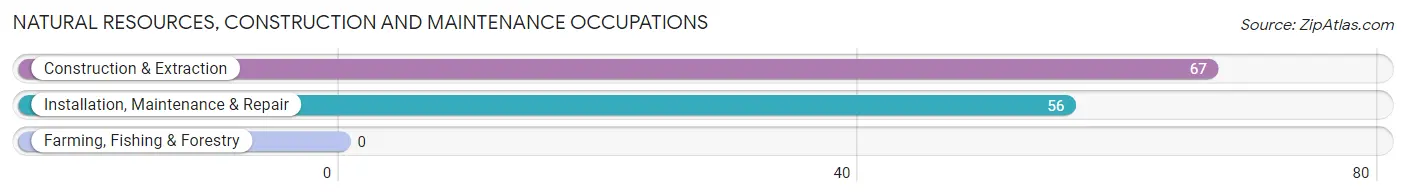
Natural Resources, Construction and Maintenance Occupations
The most common Natural Resources, Construction and Maintenance occupations in Porters Neck are Construction & Extraction (67 | 2.3%), and Installation, Maintenance & Repair (56 | 1.9%).
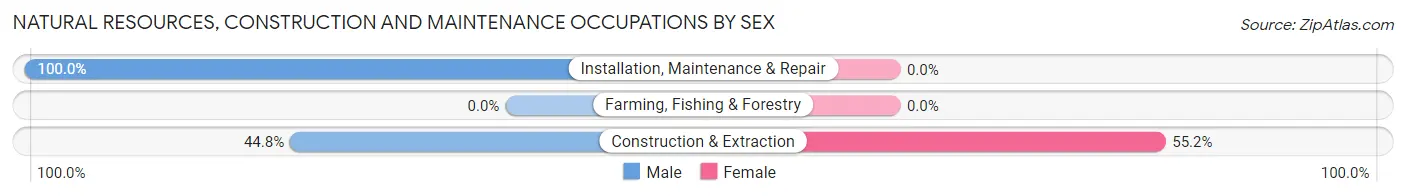
Natural Resources, Construction and Maintenance Occupations by Sex
| Occupation | Male | Female |
| Farming, Fishing & Forestry | 0 (0.0%) | 0 (0.0%) |
| Construction & Extraction | 30 (44.8%) | 37 (55.2%) |
| Installation, Maintenance & Repair | 56 (100.0%) | 0 (0.0%) |
| Total (Category) | 86 (69.9%) | 37 (30.1%) |
| Total (Overall) | 1,552 (53.5%) | 1,348 (46.5%) |
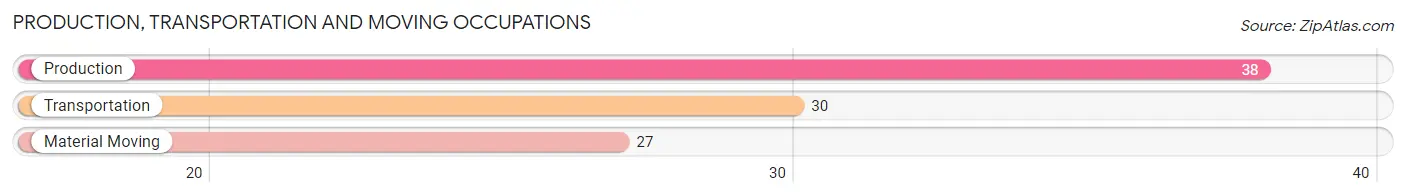
Production, Transportation and Moving Occupations
The most common Production, Transportation and Moving occupations in Porters Neck are Production (38 | 1.3%), Transportation (30 | 1.0%), and Material Moving (27 | 0.9%).
Production, Transportation and Moving Occupations by Sex
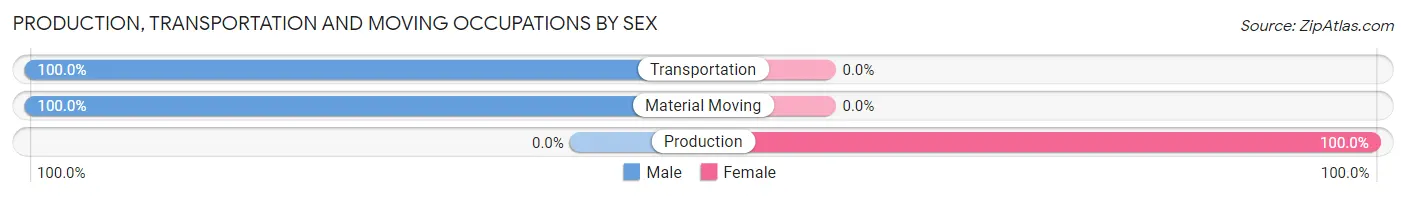
| Occupation | Male | Female |
| Production | 0 (0.0%) | 38 (100.0%) |
| Transportation | 30 (100.0%) | 0 (0.0%) |
| Material Moving | 27 (100.0%) | 0 (0.0%) |
| Total (Category) | 57 (60.0%) | 38 (40.0%) |
| Total (Overall) | 1,552 (53.5%) | 1,348 (46.5%) |
Employment Industries by Sex in Porters Neck
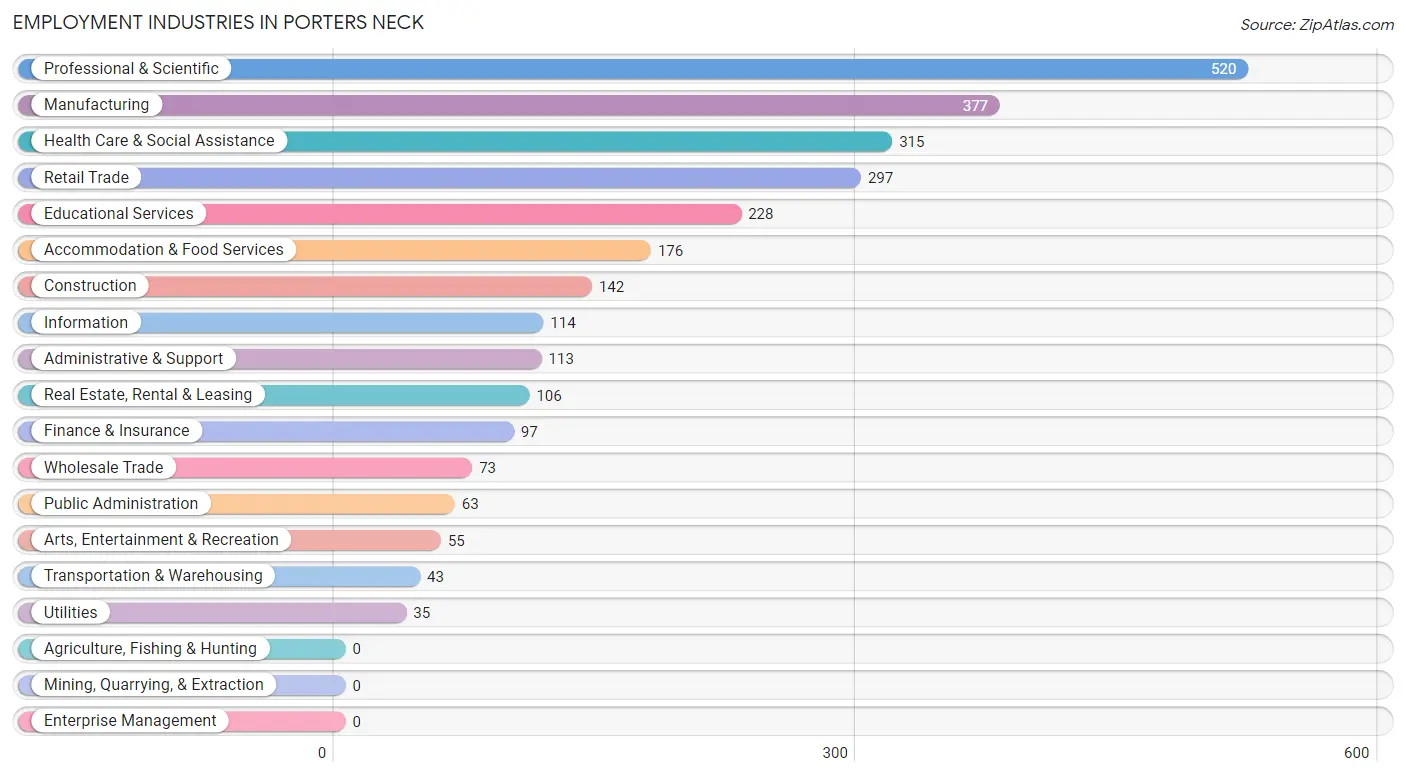
Employment Industries in Porters Neck
The major employment industries in Porters Neck include Professional & Scientific (520 | 17.9%), Manufacturing (377 | 13.0%), Health Care & Social Assistance (315 | 10.9%), Retail Trade (297 | 10.2%), and Educational Services (228 | 7.9%).
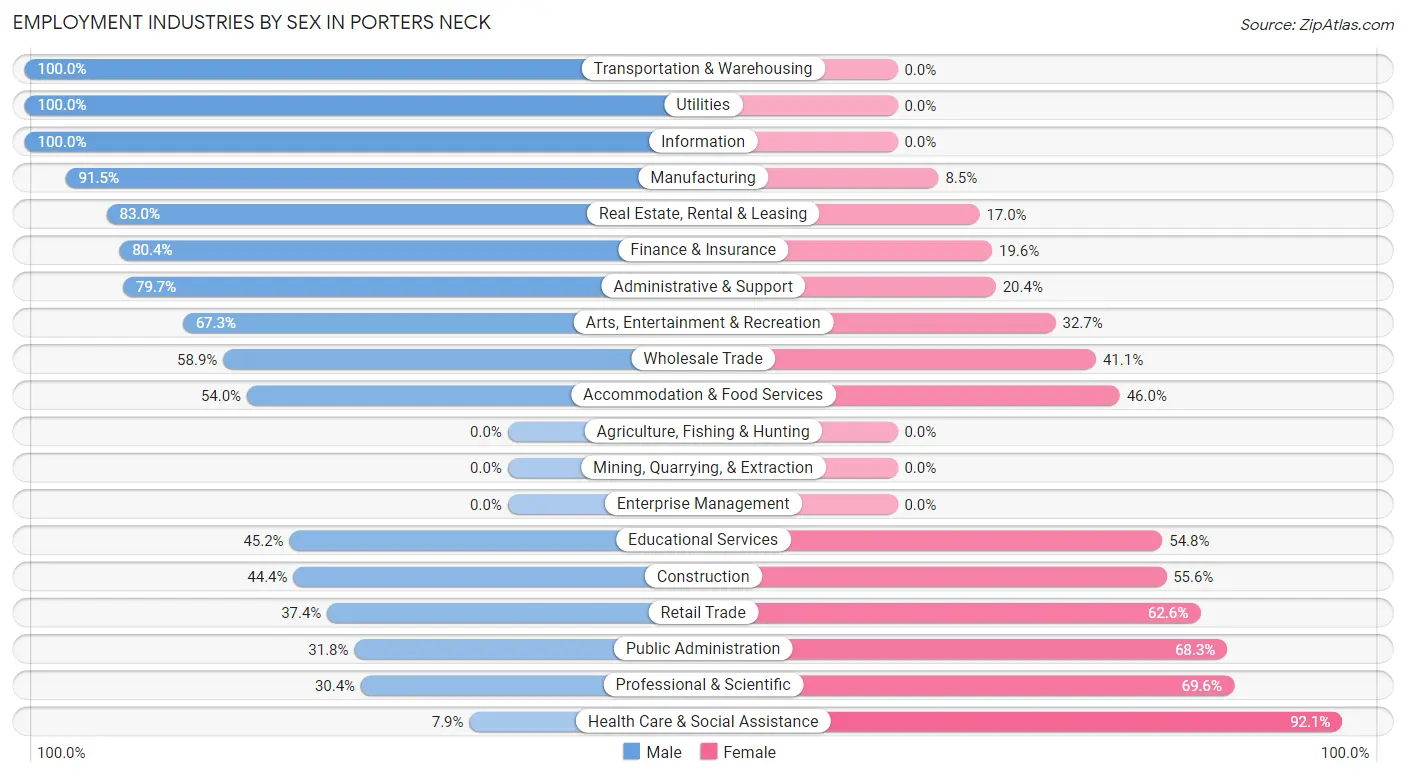
Employment Industries by Sex in Porters Neck
The Porters Neck industries that see more men than women are Transportation & Warehousing (100.0%), Utilities (100.0%), and Information (100.0%), whereas the industries that tend to have a higher number of women are Health Care & Social Assistance (92.1%), Professional & Scientific (69.6%), and Public Administration (68.2%).
| Industry | Male | Female |
| Agriculture, Fishing & Hunting | 0 (0.0%) | 0 (0.0%) |
| Mining, Quarrying, & Extraction | 0 (0.0%) | 0 (0.0%) |
| Construction | 63 (44.4%) | 79 (55.6%) |
| Manufacturing | 345 (91.5%) | 32 (8.5%) |
| Wholesale Trade | 43 (58.9%) | 30 (41.1%) |
| Retail Trade | 111 (37.4%) | 186 (62.6%) |
| Transportation & Warehousing | 43 (100.0%) | 0 (0.0%) |
| Utilities | 35 (100.0%) | 0 (0.0%) |
| Information | 114 (100.0%) | 0 (0.0%) |
| Finance & Insurance | 78 (80.4%) | 19 (19.6%) |
| Real Estate, Rental & Leasing | 88 (83.0%) | 18 (17.0%) |
| Professional & Scientific | 158 (30.4%) | 362 (69.6%) |
| Enterprise Management | 0 (0.0%) | 0 (0.0%) |
| Administrative & Support | 90 (79.6%) | 23 (20.3%) |
| Educational Services | 103 (45.2%) | 125 (54.8%) |
| Health Care & Social Assistance | 25 (7.9%) | 290 (92.1%) |
| Arts, Entertainment & Recreation | 37 (67.3%) | 18 (32.7%) |
| Accommodation & Food Services | 95 (54.0%) | 81 (46.0%) |
| Public Administration | 20 (31.8%) | 43 (68.2%) |
| Total | 1,552 (53.5%) | 1,348 (46.5%) |
Education in Porters Neck
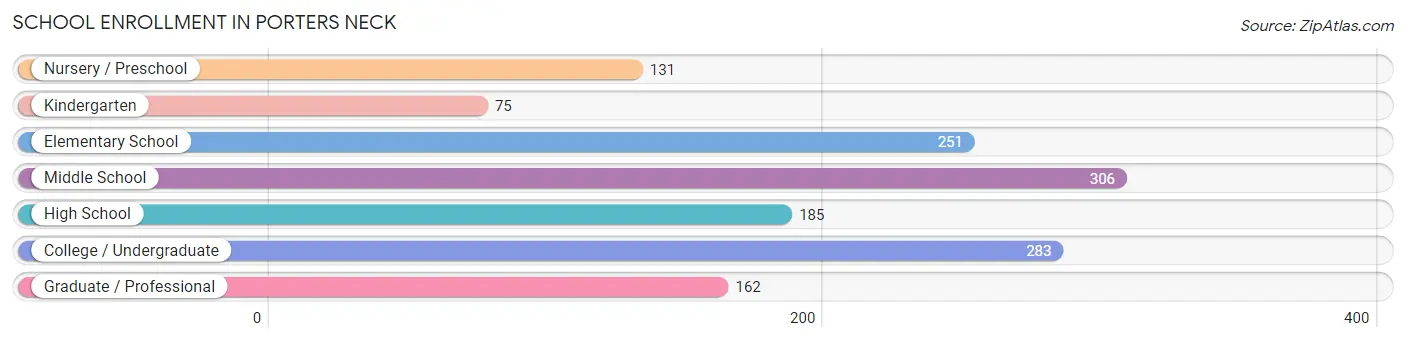
School Enrollment in Porters Neck
The most common levels of schooling among the 1,393 students in Porters Neck are middle school (306 | 22.0%), college / undergraduate (283 | 20.3%), and elementary school (251 | 18.0%).
| School Level | # Students | % Students |
| Nursery / Preschool | 131 | 9.4% |
| Kindergarten | 75 | 5.4% |
| Elementary School | 251 | 18.0% |
| Middle School | 306 | 22.0% |
| High School | 185 | 13.3% |
| College / Undergraduate | 283 | 20.3% |
| Graduate / Professional | 162 | 11.6% |
| Total | 1,393 | 100.0% |
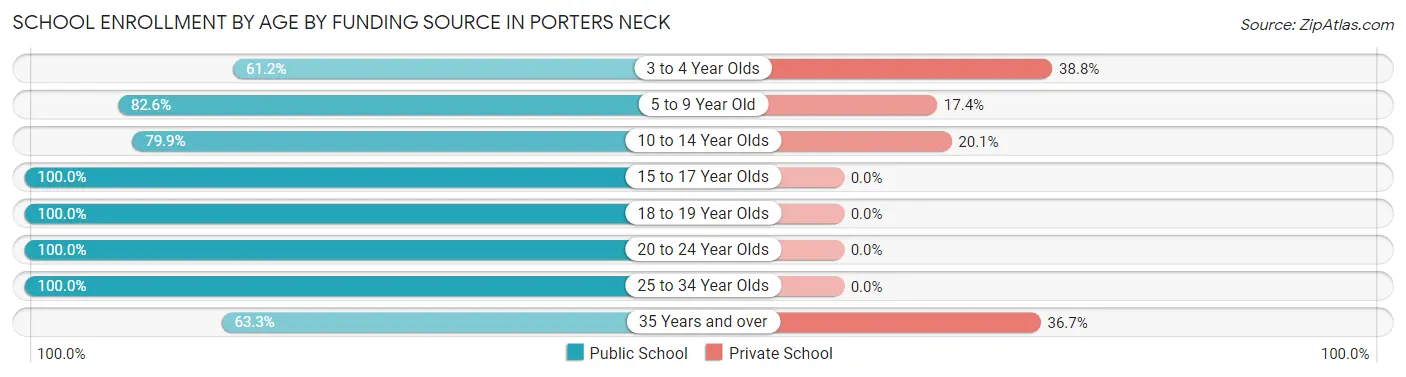
School Enrollment by Age by Funding Source in Porters Neck
Out of a total of 1,393 students who are enrolled in schools in Porters Neck, 188 (13.5%) attend a private institution, while the remaining 1,205 (86.5%) are enrolled in public schools. The age group of 3 to 4 year olds has the highest likelihood of being enrolled in private schools, with 40 (38.8% in the age bracket) enrolled. Conversely, the age group of 15 to 17 year olds has the lowest likelihood of being enrolled in a private school, with 148 (100.0% in the age bracket) attending a public institution.
| Age Bracket | Public School | Private School |
| 3 to 4 Year Olds | 63 (61.2%) | 40 (38.8%) |
| 5 to 9 Year Old | 276 (82.6%) | 58 (17.4%) |
| 10 to 14 Year Olds | 271 (79.9%) | 68 (20.1%) |
| 15 to 17 Year Olds | 148 (100.0%) | 0 (0.0%) |
| 18 to 19 Year Olds | 28 (100.0%) | 0 (0.0%) |
| 20 to 24 Year Olds | 214 (100.0%) | 0 (0.0%) |
| 25 to 34 Year Olds | 167 (100.0%) | 0 (0.0%) |
| 35 Years and over | 38 (63.3%) | 22 (36.7%) |
| Total | 1,205 (86.5%) | 188 (13.5%) |
Educational Attainment by Field of Study in Porters Neck
Business (687 | 16.2%), engineering (527 | 12.4%), communications (454 | 10.7%), computers & mathematics (409 | 9.7%), and education (322 | 7.6%) are the most common fields of study among 4,232 individuals in Porters Neck who have obtained a bachelor's degree or higher.
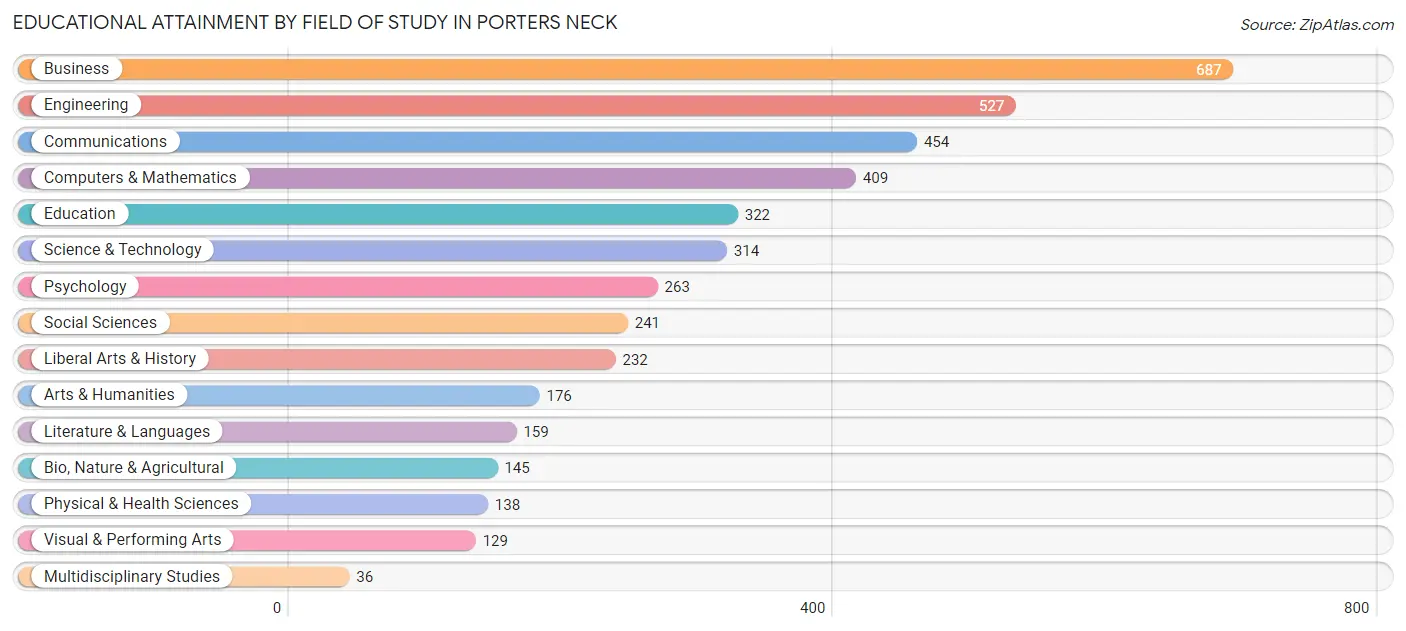
| Field of Study | # Graduates | % Graduates |
| Computers & Mathematics | 409 | 9.7% |
| Bio, Nature & Agricultural | 145 | 3.4% |
| Physical & Health Sciences | 138 | 3.3% |
| Psychology | 263 | 6.2% |
| Social Sciences | 241 | 5.7% |
| Engineering | 527 | 12.4% |
| Multidisciplinary Studies | 36 | 0.9% |
| Science & Technology | 314 | 7.4% |
| Business | 687 | 16.2% |
| Education | 322 | 7.6% |
| Literature & Languages | 159 | 3.8% |
| Liberal Arts & History | 232 | 5.5% |
| Visual & Performing Arts | 129 | 3.0% |
| Communications | 454 | 10.7% |
| Arts & Humanities | 176 | 4.2% |
| Total | 4,232 | 100.0% |
Transportation & Commute in Porters Neck
Vehicle Availability by Sex in Porters Neck
The most prevalent vehicle ownership categories in Porters Neck are males with 2 vehicles (994, accounting for 65.3%) and females with 2 vehicles (752, making up 73.7%).
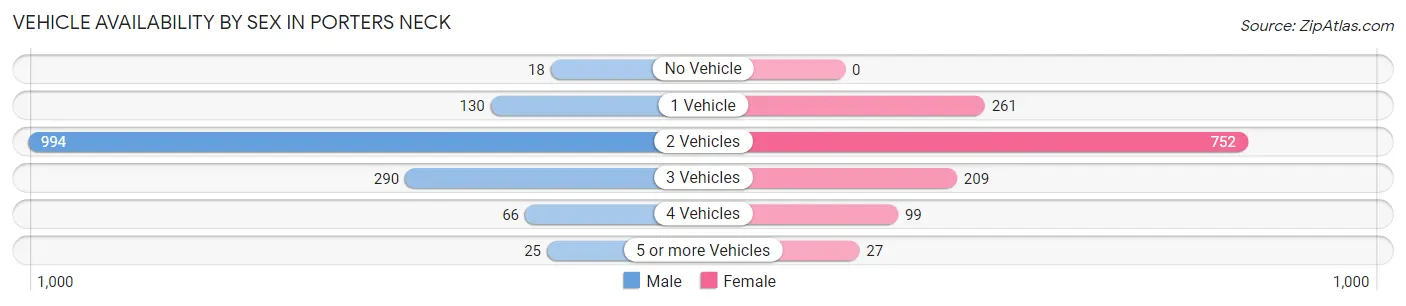
| Vehicles Available | Male | Female |
| No Vehicle | 18 (1.2%) | 0 (0.0%) |
| 1 Vehicle | 130 (8.5%) | 261 (19.4%) |
| 2 Vehicles | 994 (65.3%) | 752 (55.8%) |
| 3 Vehicles | 290 (19.0%) | 209 (15.5%) |
| 4 Vehicles | 66 (4.3%) | 99 (7.3%) |
| 5 or more Vehicles | 25 (1.6%) | 27 (2.0%) |
| Total | 1,523 (100.0%) | 1,348 (100.0%) |
Commute Time in Porters Neck
The most frequently occuring commute durations in Porters Neck are 30 to 34 minutes (497 commuters, 23.1%), 20 to 24 minutes (453 commuters, 21.1%), and 10 to 14 minutes (398 commuters, 18.5%).
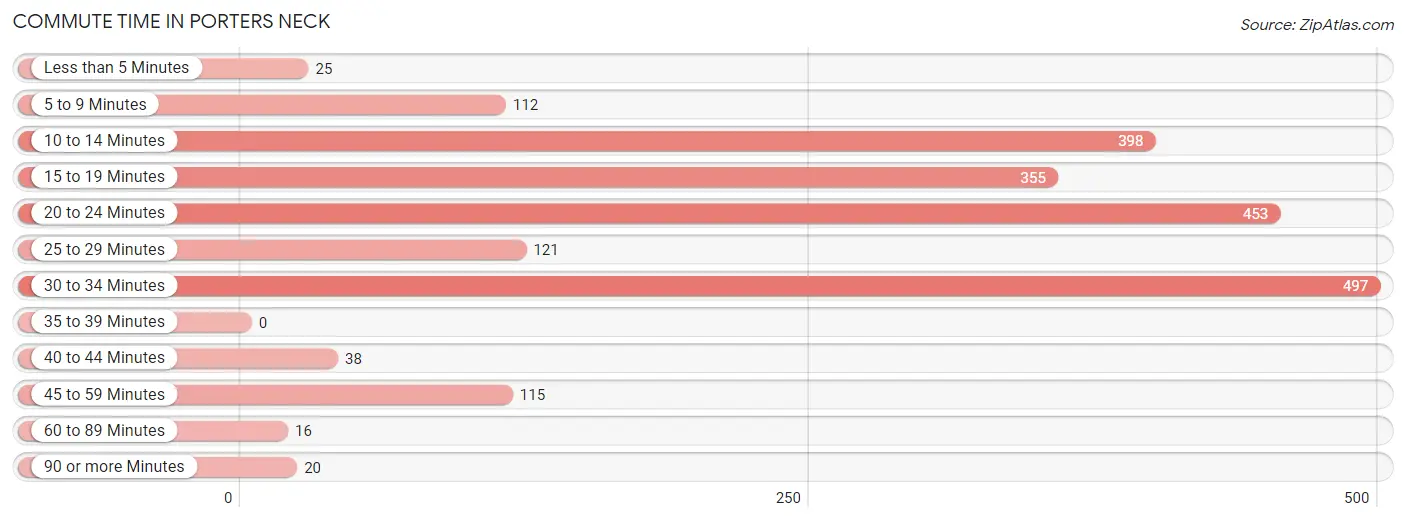
| Commute Time | # Commuters | % Commuters |
| Less than 5 Minutes | 25 | 1.2% |
| 5 to 9 Minutes | 112 | 5.2% |
| 10 to 14 Minutes | 398 | 18.5% |
| 15 to 19 Minutes | 355 | 16.5% |
| 20 to 24 Minutes | 453 | 21.1% |
| 25 to 29 Minutes | 121 | 5.6% |
| 30 to 34 Minutes | 497 | 23.1% |
| 35 to 39 Minutes | 0 | 0.0% |
| 40 to 44 Minutes | 38 | 1.8% |
| 45 to 59 Minutes | 115 | 5.3% |
| 60 to 89 Minutes | 16 | 0.7% |
| 90 or more Minutes | 20 | 0.9% |
Commute Time by Sex in Porters Neck
The most common commute times in Porters Neck are 10 to 14 minutes (234 commuters, 22.1%) for males and 30 to 34 minutes (307 commuters, 28.2%) for females.
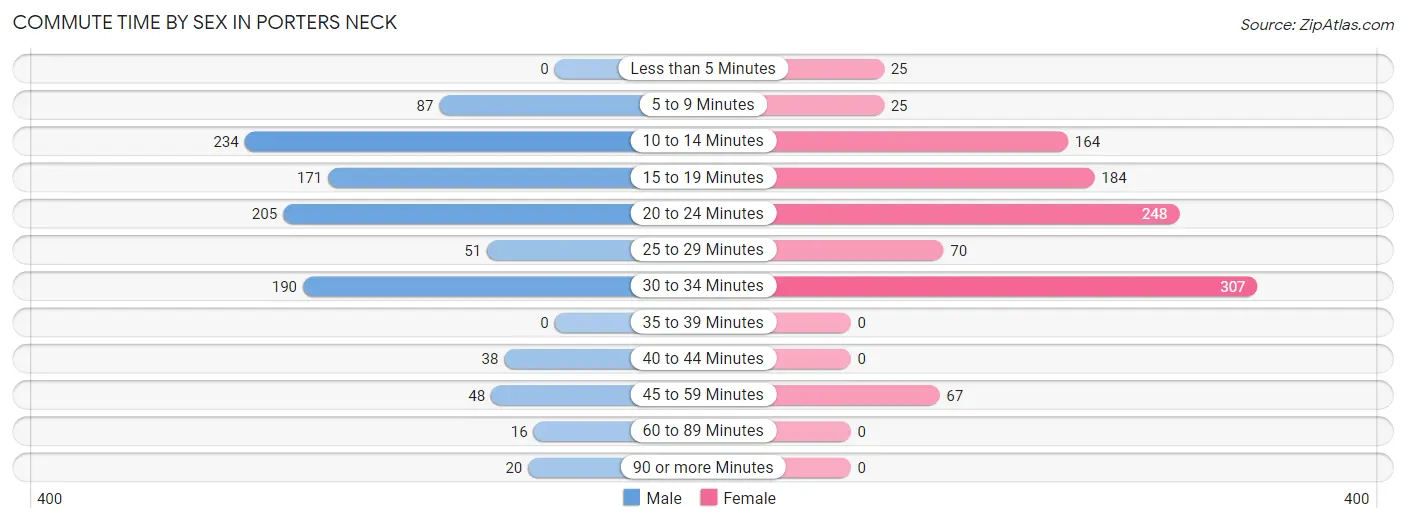
| Commute Time | Male | Female |
| Less than 5 Minutes | 0 (0.0%) | 25 (2.3%) |
| 5 to 9 Minutes | 87 (8.2%) | 25 (2.3%) |
| 10 to 14 Minutes | 234 (22.1%) | 164 (15.0%) |
| 15 to 19 Minutes | 171 (16.1%) | 184 (16.9%) |
| 20 to 24 Minutes | 205 (19.3%) | 248 (22.8%) |
| 25 to 29 Minutes | 51 (4.8%) | 70 (6.4%) |
| 30 to 34 Minutes | 190 (17.9%) | 307 (28.2%) |
| 35 to 39 Minutes | 0 (0.0%) | 0 (0.0%) |
| 40 to 44 Minutes | 38 (3.6%) | 0 (0.0%) |
| 45 to 59 Minutes | 48 (4.5%) | 67 (6.1%) |
| 60 to 89 Minutes | 16 (1.5%) | 0 (0.0%) |
| 90 or more Minutes | 20 (1.9%) | 0 (0.0%) |
Time of Departure to Work by Sex in Porters Neck
The most frequent times of departure to work in Porters Neck are 7:00 AM to 7:29 AM (226, 21.3%) for males and 7:00 AM to 7:29 AM (253, 23.2%) for females.
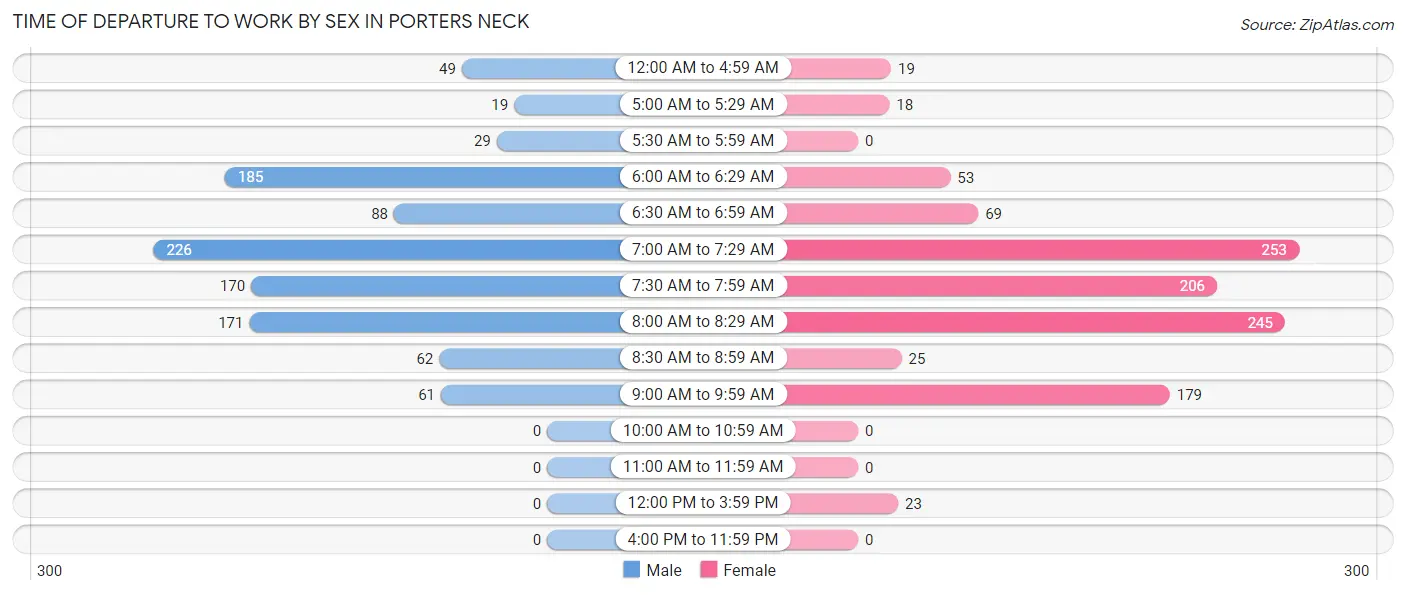
| Time of Departure | Male | Female |
| 12:00 AM to 4:59 AM | 49 (4.6%) | 19 (1.7%) |
| 5:00 AM to 5:29 AM | 19 (1.8%) | 18 (1.7%) |
| 5:30 AM to 5:59 AM | 29 (2.7%) | 0 (0.0%) |
| 6:00 AM to 6:29 AM | 185 (17.4%) | 53 (4.9%) |
| 6:30 AM to 6:59 AM | 88 (8.3%) | 69 (6.3%) |
| 7:00 AM to 7:29 AM | 226 (21.3%) | 253 (23.2%) |
| 7:30 AM to 7:59 AM | 170 (16.0%) | 206 (18.9%) |
| 8:00 AM to 8:29 AM | 171 (16.1%) | 245 (22.5%) |
| 8:30 AM to 8:59 AM | 62 (5.9%) | 25 (2.3%) |
| 9:00 AM to 9:59 AM | 61 (5.8%) | 179 (16.4%) |
| 10:00 AM to 10:59 AM | 0 (0.0%) | 0 (0.0%) |
| 11:00 AM to 11:59 AM | 0 (0.0%) | 0 (0.0%) |
| 12:00 PM to 3:59 PM | 0 (0.0%) | 23 (2.1%) |
| 4:00 PM to 11:59 PM | 0 (0.0%) | 0 (0.0%) |
| Total | 1,060 (100.0%) | 1,090 (100.0%) |
Housing Occupancy in Porters Neck
Occupancy by Ownership in Porters Neck
Of the total 3,160 dwellings in Porters Neck, owner-occupied units account for 2,435 (77.1%), while renter-occupied units make up 725 (22.9%).
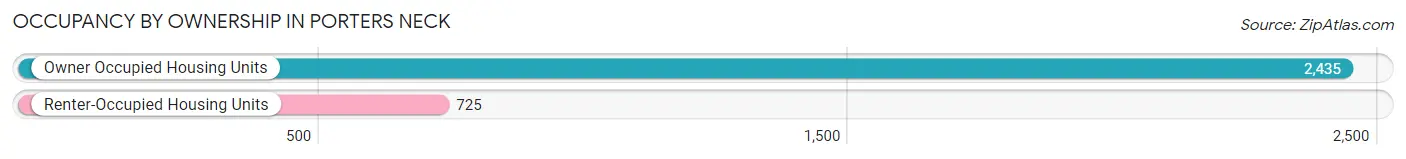
| Occupancy | # Housing Units | % Housing Units |
| Owner Occupied Housing Units | 2,435 | 77.1% |
| Renter-Occupied Housing Units | 725 | 22.9% |
| Total Occupied Housing Units | 3,160 | 100.0% |
Occupancy by Household Size in Porters Neck
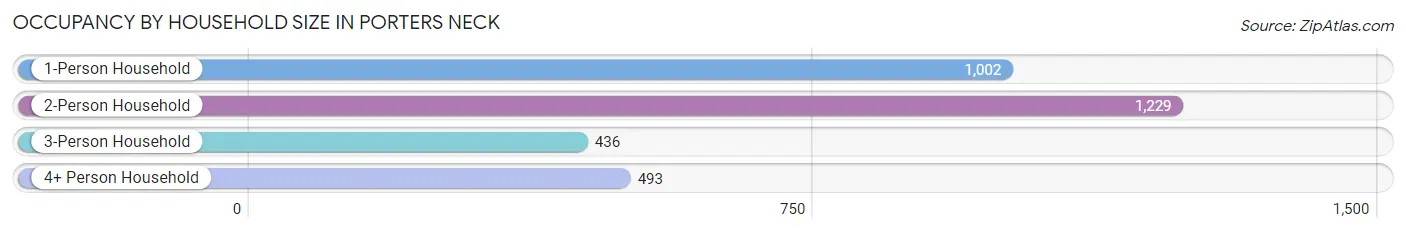
| Household Size | # Housing Units | % Housing Units |
| 1-Person Household | 1,002 | 31.7% |
| 2-Person Household | 1,229 | 38.9% |
| 3-Person Household | 436 | 13.8% |
| 4+ Person Household | 493 | 15.6% |
| Total Housing Units | 3,160 | 100.0% |
Occupancy by Ownership by Household Size in Porters Neck
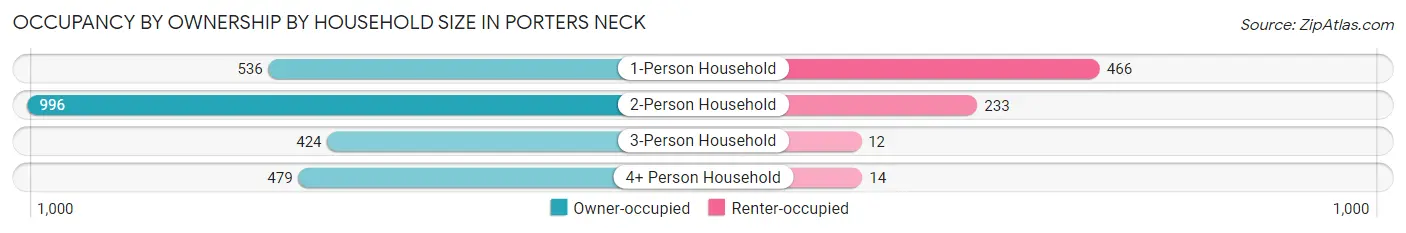
| Household Size | Owner-occupied | Renter-occupied |
| 1-Person Household | 536 (53.5%) | 466 (46.5%) |
| 2-Person Household | 996 (81.0%) | 233 (19.0%) |
| 3-Person Household | 424 (97.3%) | 12 (2.8%) |
| 4+ Person Household | 479 (97.2%) | 14 (2.8%) |
| Total Housing Units | 2,435 (77.1%) | 725 (22.9%) |
Occupancy by Educational Attainment in Porters Neck
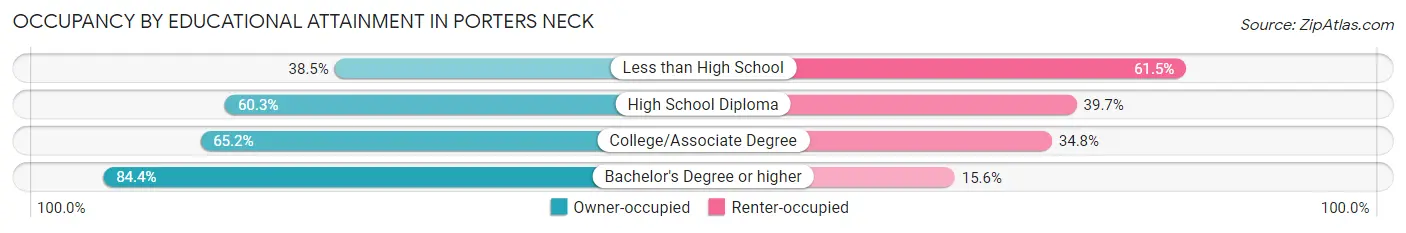
| Household Size | Owner-occupied | Renter-occupied |
| Less than High School | 37 (38.5%) | 59 (61.5%) |
| High School Diploma | 138 (60.3%) | 91 (39.7%) |
| College/Associate Degree | 451 (65.2%) | 241 (34.8%) |
| Bachelor's Degree or higher | 1,809 (84.4%) | 334 (15.6%) |
Occupancy by Age of Householder in Porters Neck
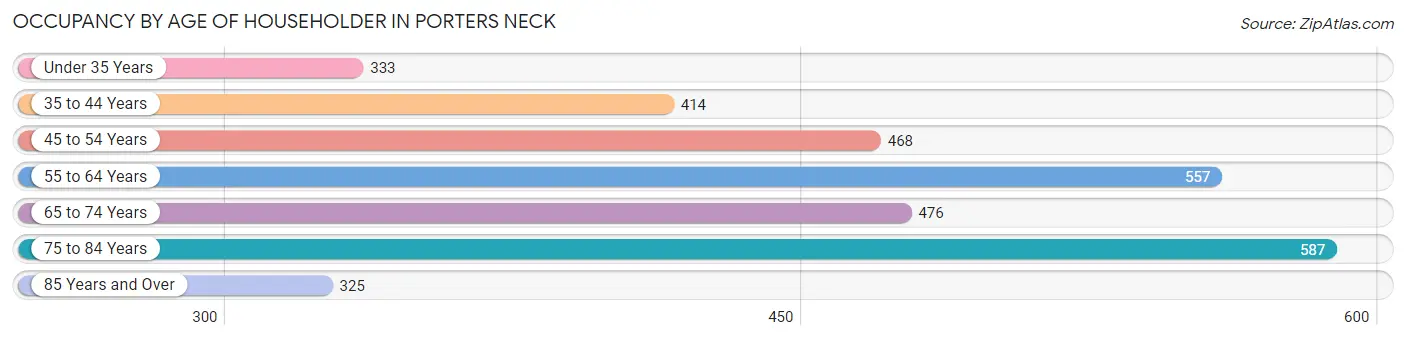
| Age Bracket | # Households | % Households |
| Under 35 Years | 333 | 10.5% |
| 35 to 44 Years | 414 | 13.1% |
| 45 to 54 Years | 468 | 14.8% |
| 55 to 64 Years | 557 | 17.6% |
| 65 to 74 Years | 476 | 15.1% |
| 75 to 84 Years | 587 | 18.6% |
| 85 Years and Over | 325 | 10.3% |
| Total | 3,160 | 100.0% |
Housing Finances in Porters Neck
Median Income by Occupancy in Porters Neck
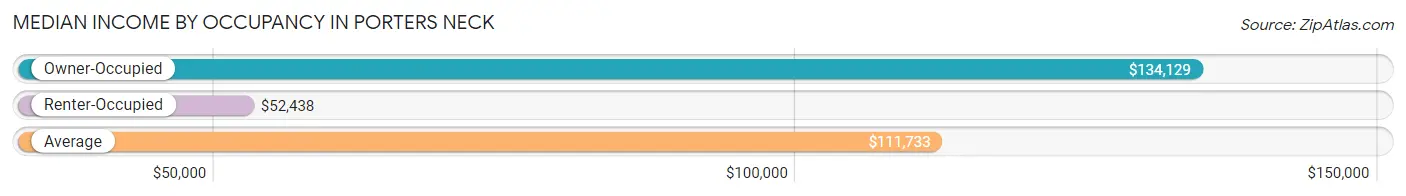
| Occupancy Type | # Households | Median Income |
| Owner-Occupied | 2,435 (77.1%) | $134,129 |
| Renter-Occupied | 725 (22.9%) | $52,438 |
| Average | 3,160 (100.0%) | $111,733 |
Occupancy by Householder Income Bracket in Porters Neck
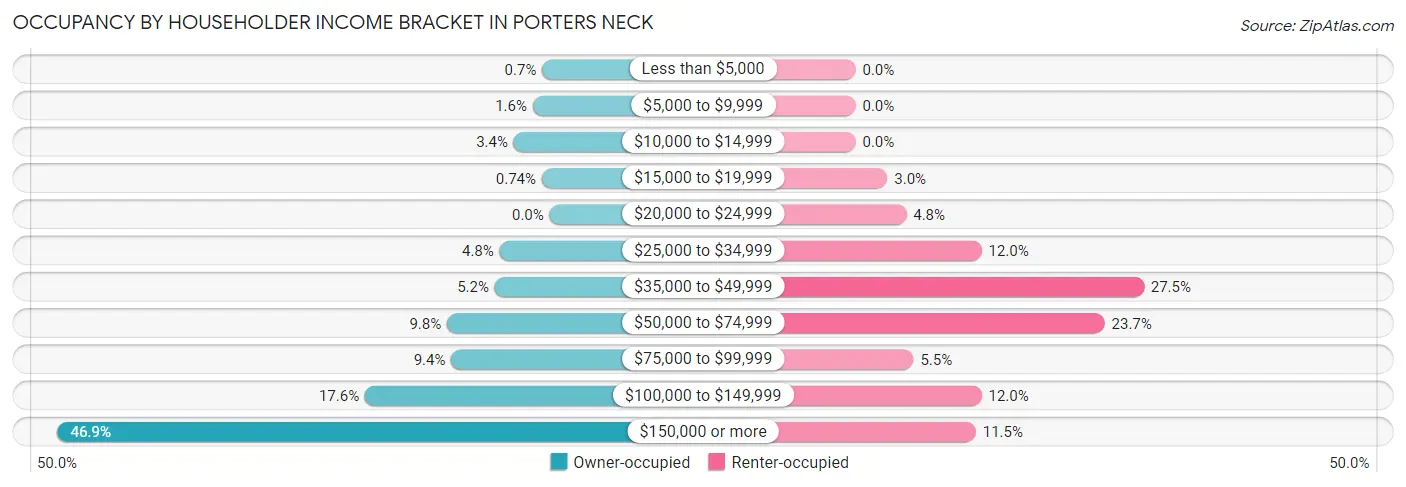
| Income Bracket | Owner-occupied | Renter-occupied |
| Less than $5,000 | 17 (0.7%) | 0 (0.0%) |
| $5,000 to $9,999 | 39 (1.6%) | 0 (0.0%) |
| $10,000 to $14,999 | 83 (3.4%) | 0 (0.0%) |
| $15,000 to $19,999 | 18 (0.7%) | 22 (3.0%) |
| $20,000 to $24,999 | 0 (0.0%) | 35 (4.8%) |
| $25,000 to $34,999 | 116 (4.8%) | 87 (12.0%) |
| $35,000 to $49,999 | 127 (5.2%) | 199 (27.5%) |
| $50,000 to $74,999 | 238 (9.8%) | 172 (23.7%) |
| $75,000 to $99,999 | 228 (9.4%) | 40 (5.5%) |
| $100,000 to $149,999 | 428 (17.6%) | 87 (12.0%) |
| $150,000 or more | 1,141 (46.9%) | 83 (11.5%) |
| Total | 2,435 (100.0%) | 725 (100.0%) |
Monthly Housing Cost Tiers in Porters Neck
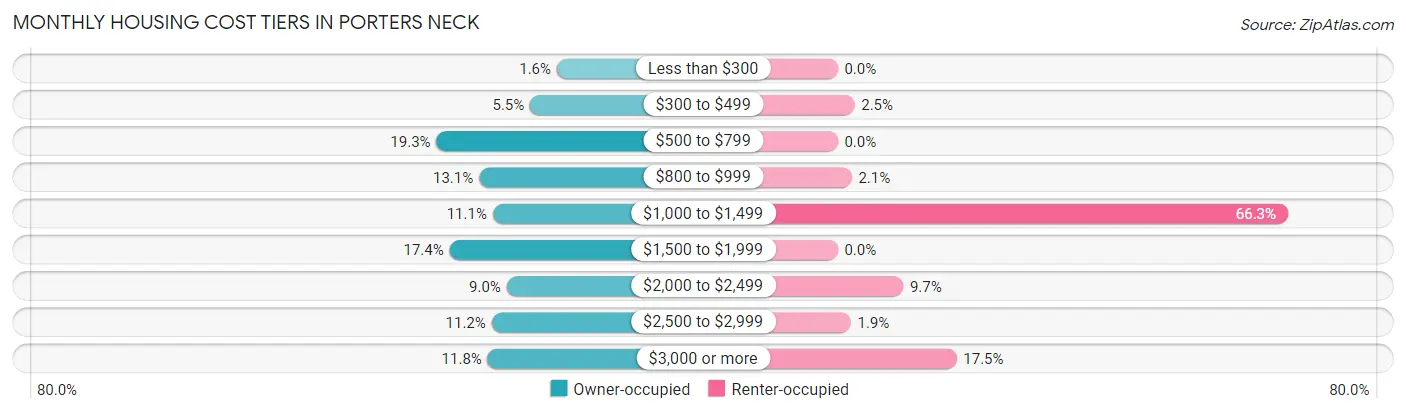
| Monthly Cost | Owner-occupied | Renter-occupied |
| Less than $300 | 39 (1.6%) | 0 (0.0%) |
| $300 to $499 | 135 (5.5%) | 18 (2.5%) |
| $500 to $799 | 471 (19.3%) | 0 (0.0%) |
| $800 to $999 | 318 (13.1%) | 15 (2.1%) |
| $1,000 to $1,499 | 269 (11.1%) | 481 (66.3%) |
| $1,500 to $1,999 | 424 (17.4%) | 0 (0.0%) |
| $2,000 to $2,499 | 219 (9.0%) | 70 (9.7%) |
| $2,500 to $2,999 | 273 (11.2%) | 14 (1.9%) |
| $3,000 or more | 287 (11.8%) | 127 (17.5%) |
| Total | 2,435 (100.0%) | 725 (100.0%) |
Physical Housing Characteristics in Porters Neck
Housing Structures in Porters Neck
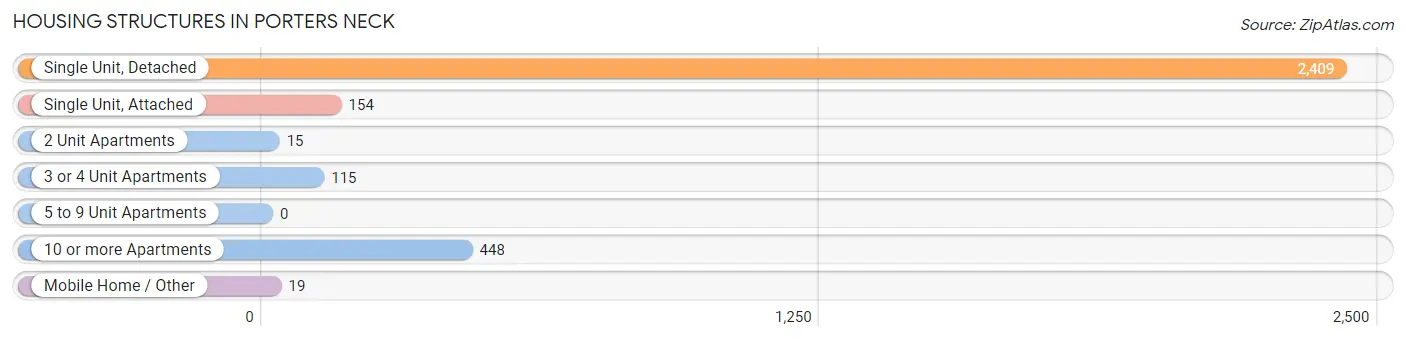
| Structure Type | # Housing Units | % Housing Units |
| Single Unit, Detached | 2,409 | 76.2% |
| Single Unit, Attached | 154 | 4.9% |
| 2 Unit Apartments | 15 | 0.5% |
| 3 or 4 Unit Apartments | 115 | 3.6% |
| 5 to 9 Unit Apartments | 0 | 0.0% |
| 10 or more Apartments | 448 | 14.2% |
| Mobile Home / Other | 19 | 0.6% |
| Total | 3,160 | 100.0% |
Housing Structures by Occupancy in Porters Neck
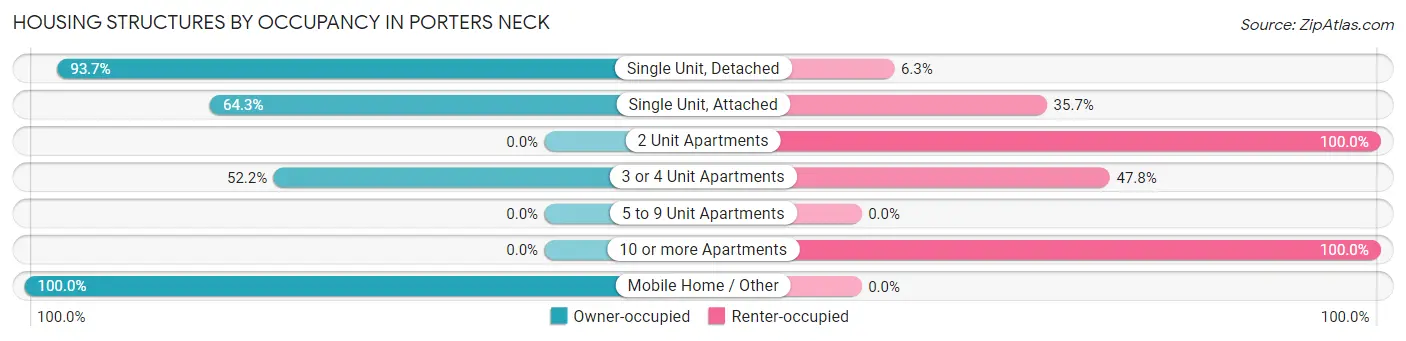
| Structure Type | Owner-occupied | Renter-occupied |
| Single Unit, Detached | 2,257 (93.7%) | 152 (6.3%) |
| Single Unit, Attached | 99 (64.3%) | 55 (35.7%) |
| 2 Unit Apartments | 0 (0.0%) | 15 (100.0%) |
| 3 or 4 Unit Apartments | 60 (52.2%) | 55 (47.8%) |
| 5 to 9 Unit Apartments | 0 (0.0%) | 0 (0.0%) |
| 10 or more Apartments | 0 (0.0%) | 448 (100.0%) |
| Mobile Home / Other | 19 (100.0%) | 0 (0.0%) |
| Total | 2,435 (77.1%) | 725 (22.9%) |
Housing Structures by Number of Rooms in Porters Neck
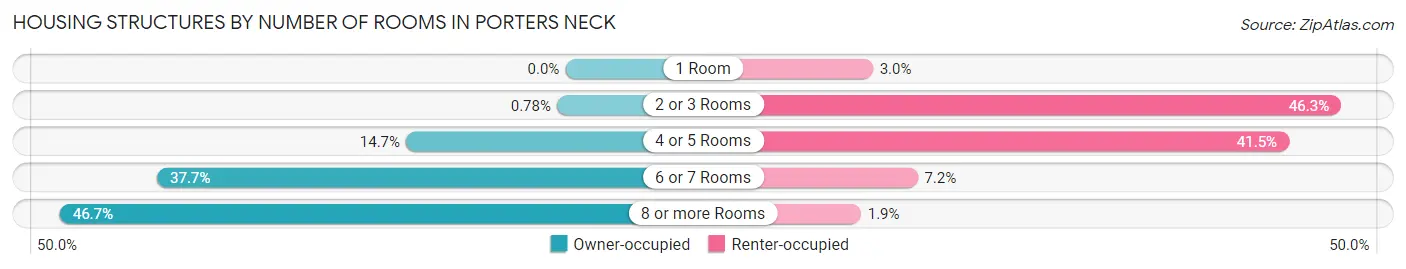
| Number of Rooms | Owner-occupied | Renter-occupied |
| 1 Room | 0 (0.0%) | 22 (3.0%) |
| 2 or 3 Rooms | 19 (0.8%) | 336 (46.3%) |
| 4 or 5 Rooms | 359 (14.7%) | 301 (41.5%) |
| 6 or 7 Rooms | 919 (37.7%) | 52 (7.2%) |
| 8 or more Rooms | 1,138 (46.7%) | 14 (1.9%) |
| Total | 2,435 (100.0%) | 725 (100.0%) |
Housing Structure by Heating Type in Porters Neck
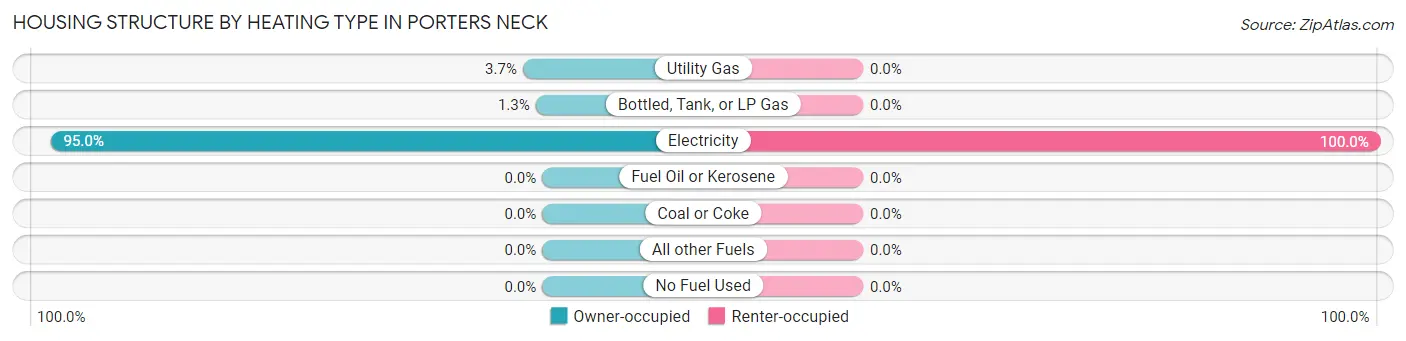
| Heating Type | Owner-occupied | Renter-occupied |
| Utility Gas | 91 (3.7%) | 0 (0.0%) |
| Bottled, Tank, or LP Gas | 31 (1.3%) | 0 (0.0%) |
| Electricity | 2,313 (95.0%) | 725 (100.0%) |
| Fuel Oil or Kerosene | 0 (0.0%) | 0 (0.0%) |
| Coal or Coke | 0 (0.0%) | 0 (0.0%) |
| All other Fuels | 0 (0.0%) | 0 (0.0%) |
| No Fuel Used | 0 (0.0%) | 0 (0.0%) |
| Total | 2,435 (100.0%) | 725 (100.0%) |
Household Vehicle Usage in Porters Neck
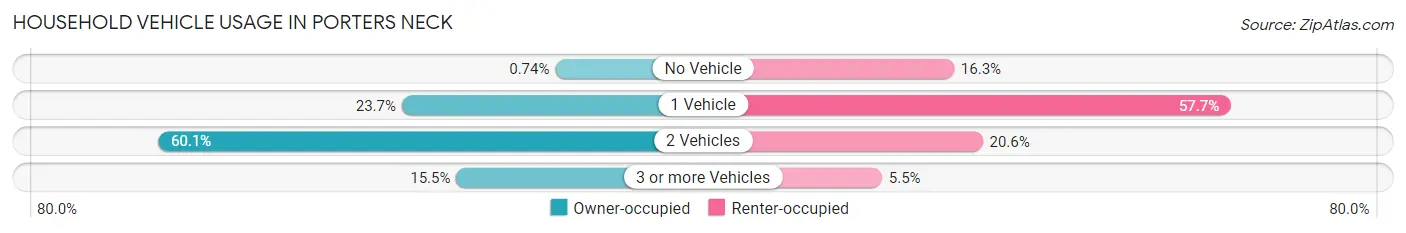
| Vehicles per Household | Owner-occupied | Renter-occupied |
| No Vehicle | 18 (0.7%) | 118 (16.3%) |
| 1 Vehicle | 576 (23.7%) | 418 (57.7%) |
| 2 Vehicles | 1,463 (60.1%) | 149 (20.5%) |
| 3 or more Vehicles | 378 (15.5%) | 40 (5.5%) |
| Total | 2,435 (100.0%) | 725 (100.0%) |
Real Estate & Mortgages in Porters Neck
Real Estate and Mortgage Overview in Porters Neck
| Characteristic | Without Mortgage | With Mortgage |
| Housing Units | 954 | 1,481 |
| Median Property Value | $483,300 | $446,000 |
| Median Household Income | $110,917 | $789 |
| Monthly Housing Costs | $713 | $287 |
| Real Estate Taxes | $2,566 | $22 |
Property Value by Mortgage Status in Porters Neck
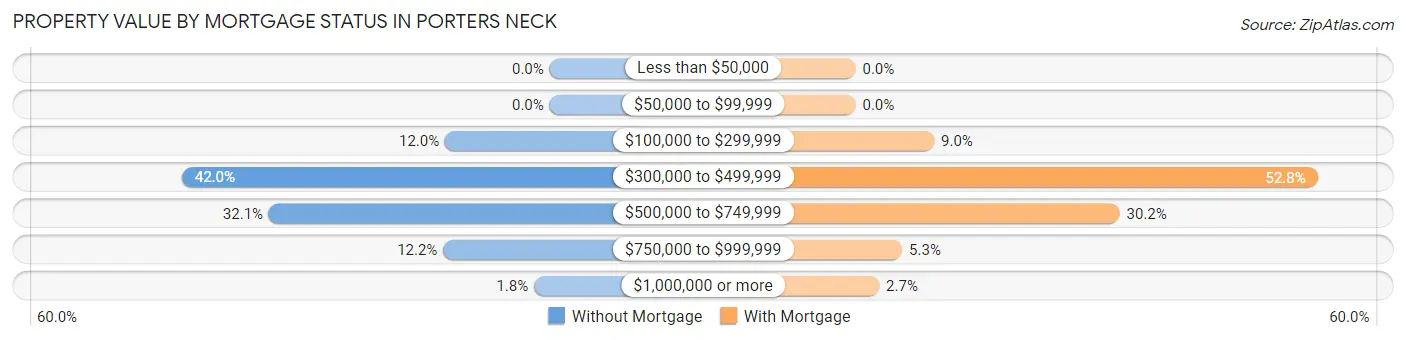
| Property Value | Without Mortgage | With Mortgage |
| Less than $50,000 | 0 (0.0%) | 0 (0.0%) |
| $50,000 to $99,999 | 0 (0.0%) | 0 (0.0%) |
| $100,000 to $299,999 | 114 (11.9%) | 133 (9.0%) |
| $300,000 to $499,999 | 401 (42.0%) | 782 (52.8%) |
| $500,000 to $749,999 | 306 (32.1%) | 447 (30.2%) |
| $750,000 to $999,999 | 116 (12.2%) | 79 (5.3%) |
| $1,000,000 or more | 17 (1.8%) | 40 (2.7%) |
| Total | 954 (100.0%) | 1,481 (100.0%) |
Household Income by Mortgage Status in Porters Neck
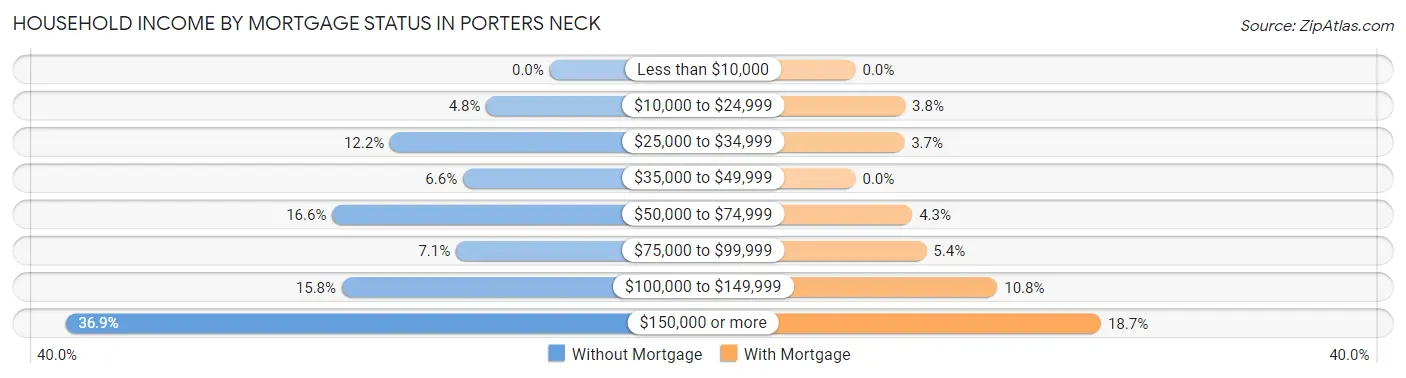
| Household Income | Without Mortgage | With Mortgage |
| Less than $10,000 | 0 (0.0%) | 0 (0.0%) |
| $10,000 to $24,999 | 46 (4.8%) | 56 (3.8%) |
| $25,000 to $34,999 | 116 (12.2%) | 55 (3.7%) |
| $35,000 to $49,999 | 63 (6.6%) | 0 (0.0%) |
| $50,000 to $74,999 | 158 (16.6%) | 64 (4.3%) |
| $75,000 to $99,999 | 68 (7.1%) | 80 (5.4%) |
| $100,000 to $149,999 | 151 (15.8%) | 160 (10.8%) |
| $150,000 or more | 352 (36.9%) | 277 (18.7%) |
| Total | 954 (100.0%) | 1,481 (100.0%) |
Property Value to Household Income Ratio in Porters Neck
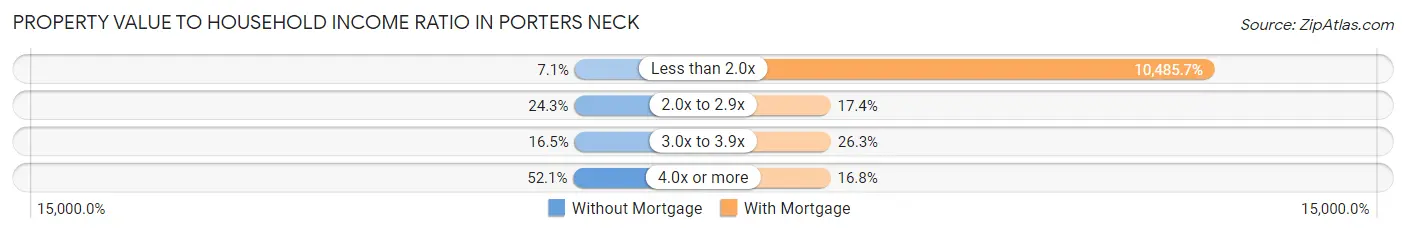
| Value-to-Income Ratio | Without Mortgage | With Mortgage |
| Less than 2.0x | 68 (7.1%) | 155,293 (10,485.7%) |
| 2.0x to 2.9x | 232 (24.3%) | 257 (17.3%) |
| 3.0x to 3.9x | 157 (16.5%) | 390 (26.3%) |
| 4.0x or more | 497 (52.1%) | 248 (16.8%) |
| Total | 954 (100.0%) | 1,481 (100.0%) |
Real Estate Taxes by Mortgage Status in Porters Neck
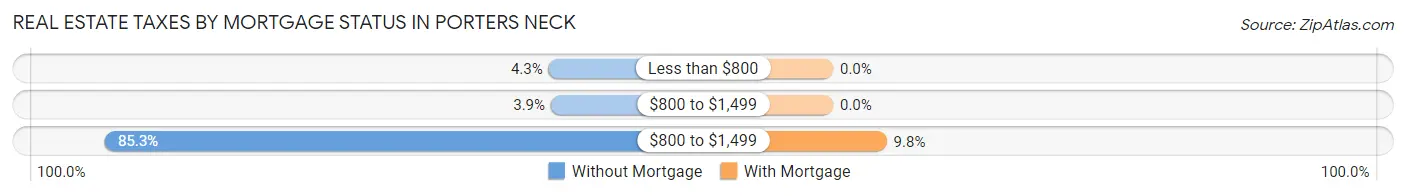
| Property Taxes | Without Mortgage | With Mortgage |
| Less than $800 | 41 (4.3%) | 0 (0.0%) |
| $800 to $1,499 | 37 (3.9%) | 0 (0.0%) |
| $800 to $1,499 | 814 (85.3%) | 145 (9.8%) |
| Total | 954 (100.0%) | 1,481 (100.0%) |
Health & Disability in Porters Neck
Health Insurance Coverage by Age in Porters Neck
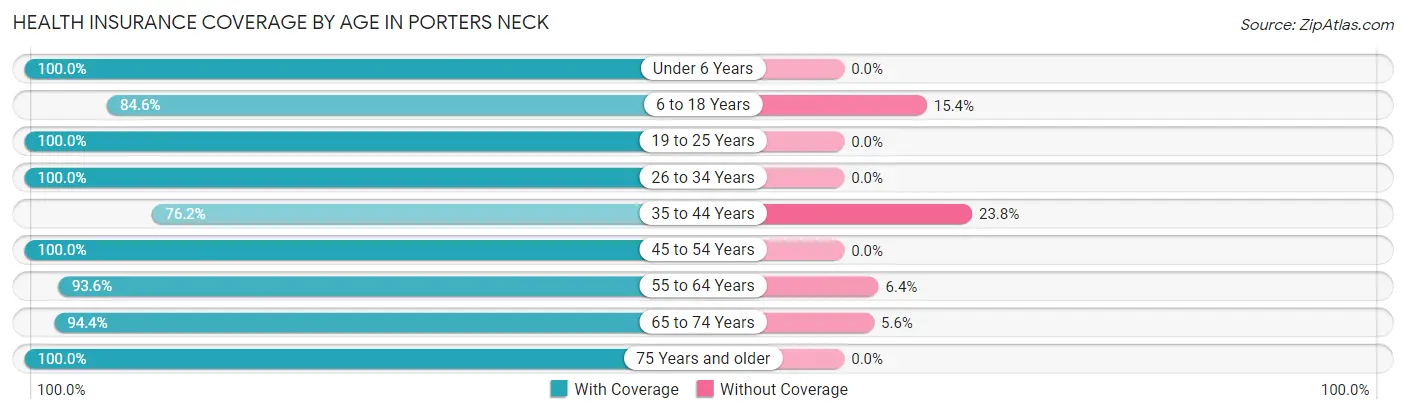
| Age Bracket | With Coverage | Without Coverage |
| Under 6 Years | 335 (100.0%) | 0 (0.0%) |
| 6 to 18 Years | 621 (84.6%) | 113 (15.4%) |
| 19 to 25 Years | 331 (100.0%) | 0 (0.0%) |
| 26 to 34 Years | 636 (100.0%) | 0 (0.0%) |
| 35 to 44 Years | 700 (76.2%) | 219 (23.8%) |
| 45 to 54 Years | 816 (100.0%) | 0 (0.0%) |
| 55 to 64 Years | 850 (93.6%) | 58 (6.4%) |
| 65 to 74 Years | 730 (94.4%) | 43 (5.6%) |
| 75 Years and older | 1,388 (100.0%) | 0 (0.0%) |
| Total | 6,407 (93.7%) | 433 (6.3%) |
Health Insurance Coverage by Citizenship Status in Porters Neck
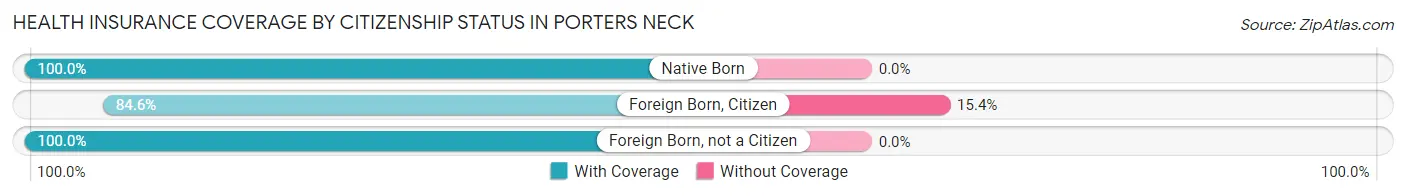
| Citizenship Status | With Coverage | Without Coverage |
| Native Born | 335 (100.0%) | 0 (0.0%) |
| Foreign Born, Citizen | 621 (84.6%) | 113 (15.4%) |
| Foreign Born, not a Citizen | 331 (100.0%) | 0 (0.0%) |
Health Insurance Coverage by Household Income in Porters Neck
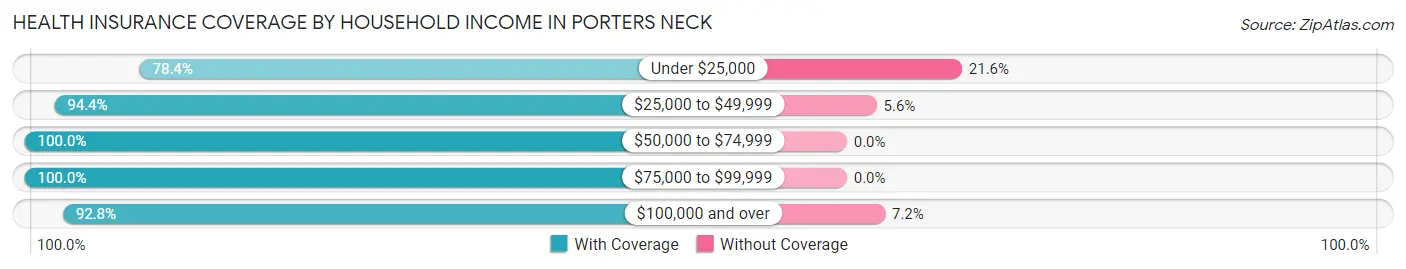
| Household Income | With Coverage | Without Coverage |
| Under $25,000 | 211 (78.4%) | 58 (21.6%) |
| $25,000 to $49,999 | 727 (94.4%) | 43 (5.6%) |
| $50,000 to $74,999 | 682 (100.0%) | 0 (0.0%) |
| $75,000 to $99,999 | 483 (100.0%) | 0 (0.0%) |
| $100,000 and over | 4,304 (92.8%) | 332 (7.2%) |
Public vs Private Health Insurance Coverage by Age in Porters Neck
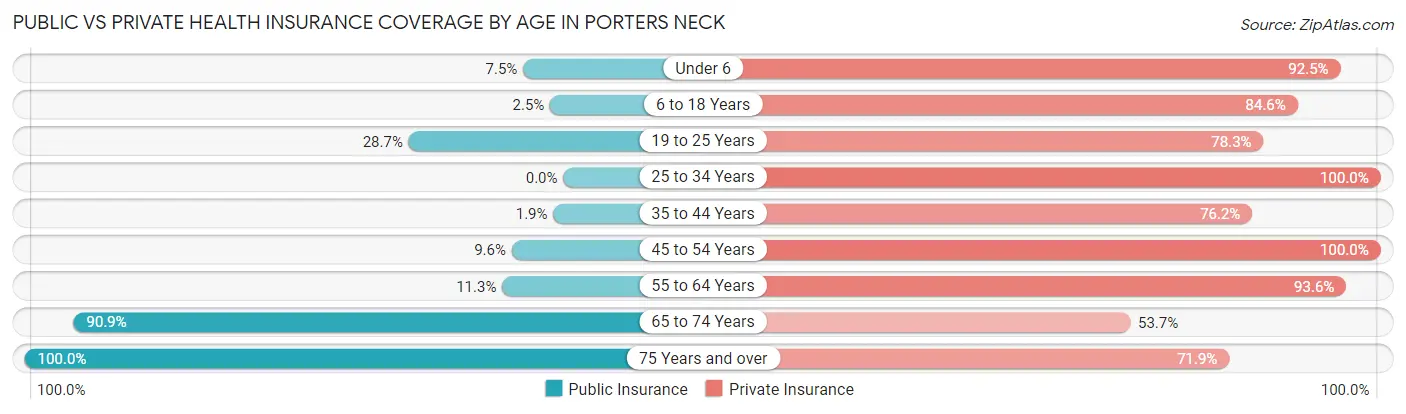
| Age Bracket | Public Insurance | Private Insurance |
| Under 6 | 25 (7.5%) | 310 (92.5%) |
| 6 to 18 Years | 18 (2.5%) | 621 (84.6%) |
| 19 to 25 Years | 95 (28.7%) | 259 (78.2%) |
| 25 to 34 Years | 0 (0.0%) | 636 (100.0%) |
| 35 to 44 Years | 17 (1.8%) | 700 (76.2%) |
| 45 to 54 Years | 78 (9.6%) | 816 (100.0%) |
| 55 to 64 Years | 103 (11.3%) | 850 (93.6%) |
| 65 to 74 Years | 703 (90.9%) | 415 (53.7%) |
| 75 Years and over | 1,388 (100.0%) | 998 (71.9%) |
| Total | 2,427 (35.5%) | 5,605 (81.9%) |
Disability Status by Sex by Age in Porters Neck
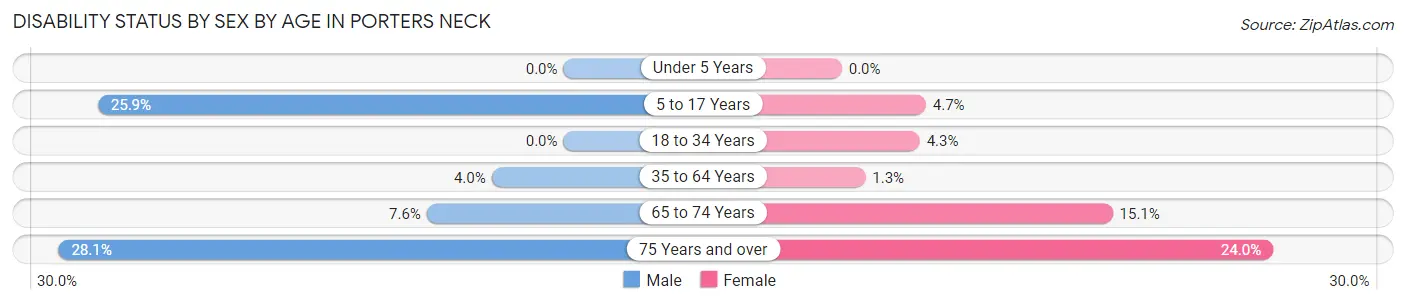
| Age Bracket | Male | Female |
| Under 5 Years | 0 (0.0%) | 0 (0.0%) |
| 5 to 17 Years | 113 (25.9%) | 18 (4.7%) |
| 18 to 34 Years | 0 (0.0%) | 23 (4.3%) |
| 35 to 64 Years | 54 (4.0%) | 17 (1.3%) |
| 65 to 74 Years | 22 (7.6%) | 73 (15.1%) |
| 75 Years and over | 156 (28.1%) | 200 (24.0%) |
Disability Class by Sex by Age in Porters Neck
Disability Class: Hearing Difficulty
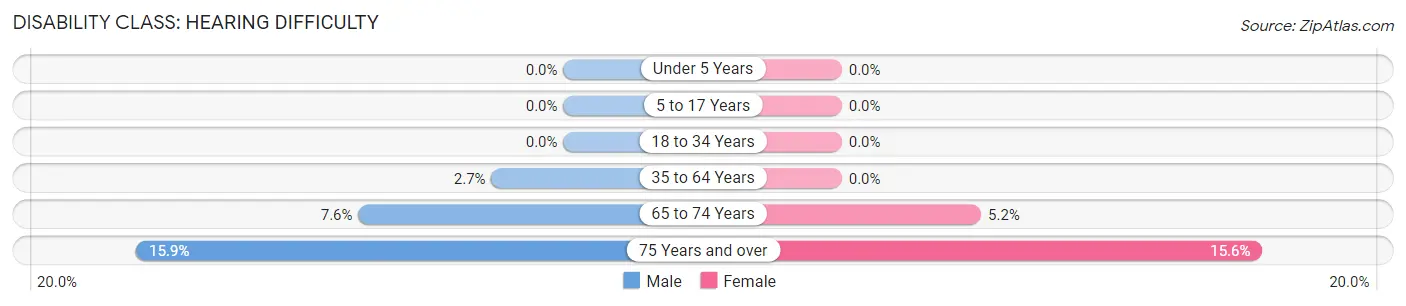
| Age Bracket | Male | Female |
| Under 5 Years | 0 (0.0%) | 0 (0.0%) |
| 5 to 17 Years | 0 (0.0%) | 0 (0.0%) |
| 18 to 34 Years | 0 (0.0%) | 0 (0.0%) |
| 35 to 64 Years | 36 (2.7%) | 0 (0.0%) |
| 65 to 74 Years | 22 (7.6%) | 25 (5.2%) |
| 75 Years and over | 88 (15.9%) | 130 (15.6%) |
Disability Class: Vision Difficulty
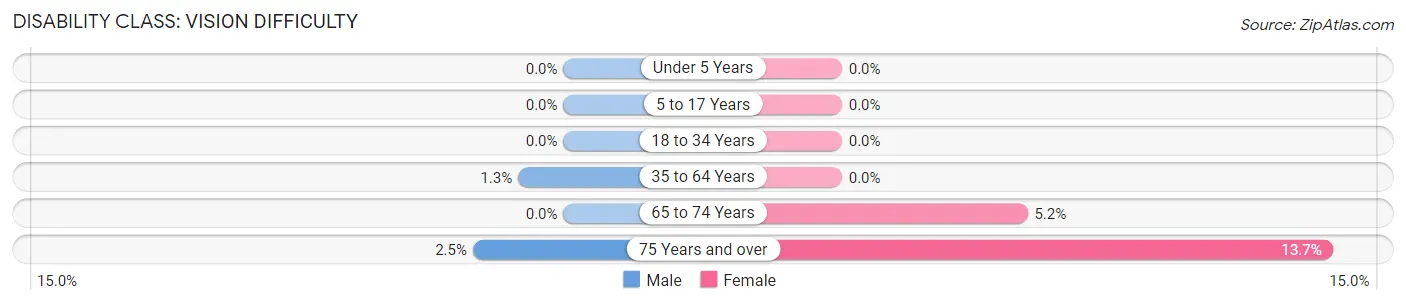
| Age Bracket | Male | Female |
| Under 5 Years | 0 (0.0%) | 0 (0.0%) |
| 5 to 17 Years | 0 (0.0%) | 0 (0.0%) |
| 18 to 34 Years | 0 (0.0%) | 0 (0.0%) |
| 35 to 64 Years | 17 (1.3%) | 0 (0.0%) |
| 65 to 74 Years | 0 (0.0%) | 25 (5.2%) |
| 75 Years and over | 14 (2.5%) | 114 (13.7%) |
Disability Class: Cognitive Difficulty
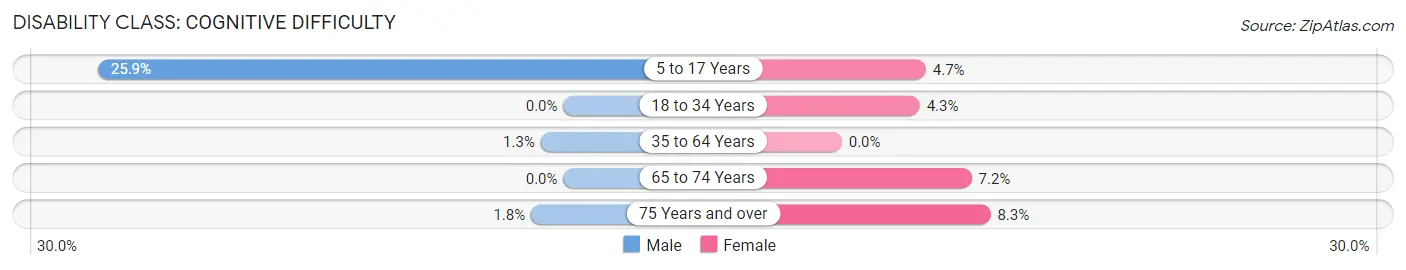
| Age Bracket | Male | Female |
| 5 to 17 Years | 113 (25.9%) | 18 (4.7%) |
| 18 to 34 Years | 0 (0.0%) | 23 (4.3%) |
| 35 to 64 Years | 17 (1.3%) | 0 (0.0%) |
| 65 to 74 Years | 0 (0.0%) | 35 (7.2%) |
| 75 Years and over | 10 (1.8%) | 69 (8.3%) |
Disability Class: Ambulatory Difficulty
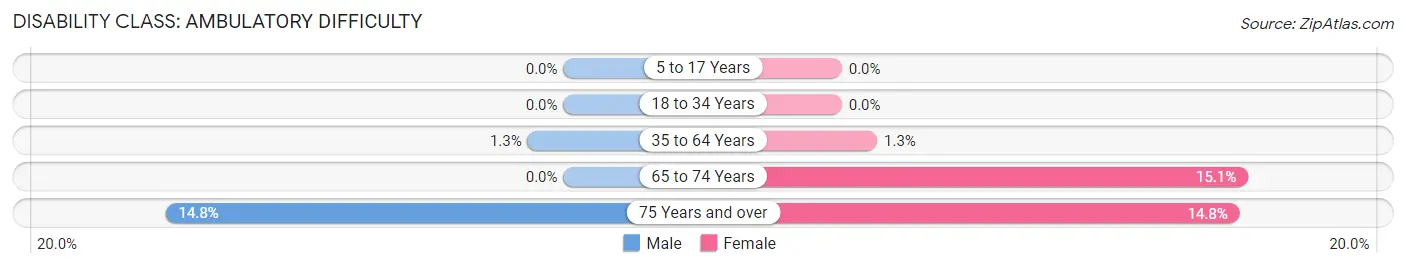
| Age Bracket | Male | Female |
| 5 to 17 Years | 0 (0.0%) | 0 (0.0%) |
| 18 to 34 Years | 0 (0.0%) | 0 (0.0%) |
| 35 to 64 Years | 18 (1.3%) | 17 (1.3%) |
| 65 to 74 Years | 0 (0.0%) | 73 (15.1%) |
| 75 Years and over | 82 (14.8%) | 123 (14.8%) |
Disability Class: Self-Care Difficulty
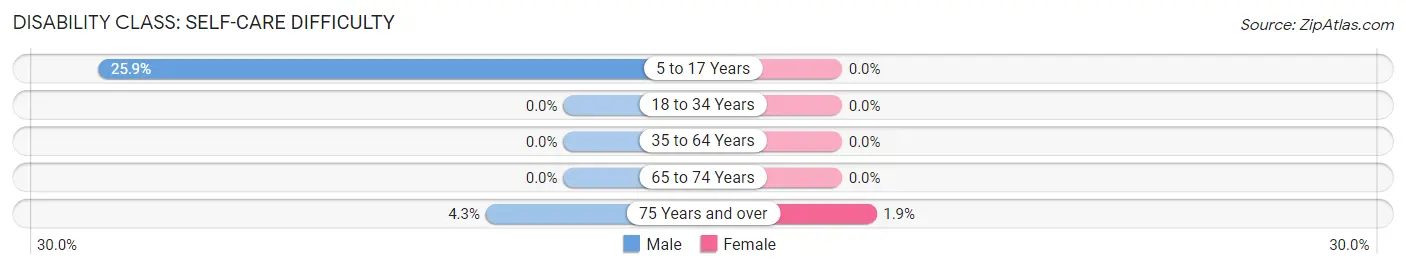
| Age Bracket | Male | Female |
| 5 to 17 Years | 113 (25.9%) | 0 (0.0%) |
| 18 to 34 Years | 0 (0.0%) | 0 (0.0%) |
| 35 to 64 Years | 0 (0.0%) | 0 (0.0%) |
| 65 to 74 Years | 0 (0.0%) | 0 (0.0%) |
| 75 Years and over | 24 (4.3%) | 16 (1.9%) |
Technology Access in Porters Neck
Computing Device Access in Porters Neck
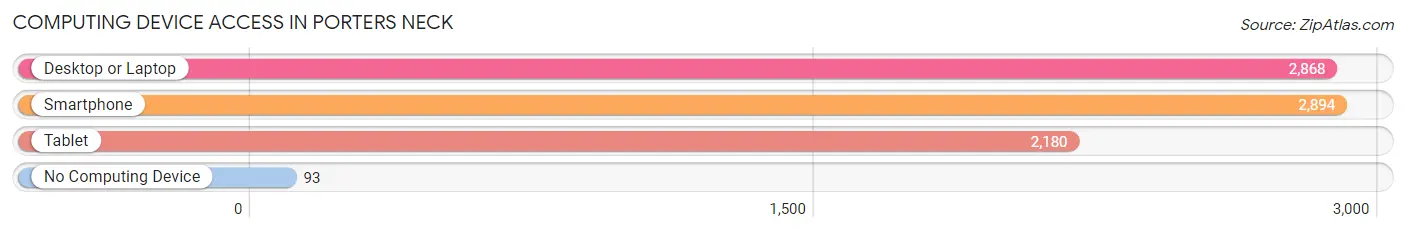
| Device Type | # Households | % Households |
| Desktop or Laptop | 2,868 | 90.8% |
| Smartphone | 2,894 | 91.6% |
| Tablet | 2,180 | 69.0% |
| No Computing Device | 93 | 2.9% |
| Total | 3,160 | 100.0% |
Internet Access in Porters Neck
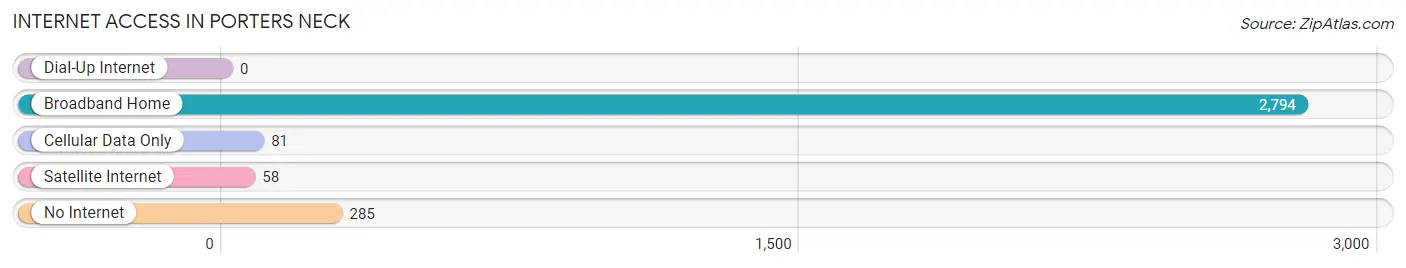
| Internet Type | # Households | % Households |
| Dial-Up Internet | 0 | 0.0% |
| Broadband Home | 2,794 | 88.4% |
| Cellular Data Only | 81 | 2.6% |
| Satellite Internet | 58 | 1.8% |
| No Internet | 285 | 9.0% |
| Total | 3,160 | 100.0% |
Porters Neck Summary
Porters Neck is an unincorporated community located in New Hanover County, North Carolina. It is situated on the north side of the Cape Fear River, approximately 15 miles north of Wilmington. The area is known for its rural charm and is home to a variety of businesses, including a golf course, marina, and several restaurants.
History
The area now known as Porters Neck was first settled in the late 1700s by a group of Scottish immigrants. The area was originally known as Porter's Neck, named after the family who owned the land. The area was primarily used for farming and fishing, and the community grew slowly over the years.
In the early 1900s, the area began to develop as a resort destination. The Porters Neck Country Club was established in the 1920s, and the area began to attract more visitors. The area was also home to a number of summer camps, including Camp Porters Neck, which was established in the 1930s.
In the 1950s, the area began to experience rapid growth as more people moved to the area. The population of Porters Neck increased from just over 500 in 1950 to over 1,000 by 1960. The area continued to grow throughout the 1960s and 1970s, and by 1980 the population had reached over 2,000.
Geography
Porters Neck is located in New Hanover County, North Carolina. It is situated on the north side of the Cape Fear River, approximately 15 miles north of Wilmington. The area is known for its rural charm and is home to a variety of businesses, including a golf course, marina, and several restaurants.
The area is mostly flat, with some rolling hills. The soil is mostly sandy loam, with some areas of clay. The climate is humid subtropical, with hot, humid summers and mild winters.
Economy
The economy of Porters Neck is largely based on tourism and retail. The area is home to a number of businesses, including a golf course, marina, and several restaurants. The area is also home to a number of summer camps, which attract visitors from all over the country.
The area is also home to a number of manufacturing and industrial businesses. The area is home to a number of companies that produce a variety of products, including furniture, textiles, and electronics.
Demographics
As of the 2010 census, the population of Porters Neck was 2,845. The population is primarily white (90.2%), with a small African American population (4.2%). The median household income is $68,944, and the median home value is $250,000.
The area is home to a number of churches, including the Porters Neck Presbyterian Church, which was established in 1845. The area is also home to a number of schools, including the Porters Neck Elementary School and the Porters Neck Middle School.
Conclusion
Porters Neck is an unincorporated community located in New Hanover County, North Carolina. It is situated on the north side of the Cape Fear River, approximately 15 miles north of Wilmington. The area is known for its rural charm and is home to a variety of businesses, including a golf course, marina, and several restaurants. The economy of Porters Neck is largely based on tourism and retail, and the area is home to a number of manufacturing and industrial businesses. As of the 2010 census, the population of Porters Neck was 2,845. The population is primarily white (90.2%), with a small African American population (4.2%). The median household income is $68,944, and the median home value is $250,000.
Common Questions
What is the Total Population of Porters Neck?
Total Population of Porters Neck is 7,165.
What is the Total Male Population of Porters Neck?
Total Male Population of Porters Neck is 3,312.
What is the Total Female Population of Porters Neck?
Total Female Population of Porters Neck is 3,853.
What is the Ratio of Males per 100 Females in Porters Neck?
There are 85.96 Males per 100 Females in Porters Neck.
What is the Ratio of Females per 100 Males in Porters Neck?
There are 116.33 Females per 100 Males in Porters Neck.
What is the Median Population Age in Porters Neck?
Median Population Age in Porters Neck is 50.8 Years.
What is the Average Family Size in Porters Neck
Average Family Size in Porters Neck is 2.8 People.
What is the Average Household Size in Porters Neck
Average Household Size in Porters Neck is 2.2 People.
What is Per Capita Income in Porters Neck?
Per Capita income in Porters Neck is $63,936.
What is the Median Family Income in Porters Neck?
Median Family Income in Porters Neck is $153,994.
What is the Median Household income in Porters Neck?
Median Household Income in Porters Neck is $111,733.
What is Income or Wage Gap in Porters Neck?
Income or Wage Gap in Porters Neck is 57.4%.
Women in Porters Neck earn 42.6 cents for every dollar earned by a man.
What is Inequality or Gini Index in Porters Neck?
Inequality or Gini Index in Porters Neck is 0.45.
How Large is the Labor Force in Porters Neck?
There are 3,395 People in the Labor Forcein in Porters Neck.
What is the Percentage of People in the Labor Force in Porters Neck?
54.5% of People are in the Labor Force in Porters Neck.
What is the Unemployment Rate in Porters Neck?
Unemployment Rate in Porters Neck is 13.7%.