Cities with the Most Immigrants from Bosnia and Herzegovina in Iowa
RELATED REPORTS & OPTIONS
Bosnia and Herzegovina
Iowa
Compare Cities
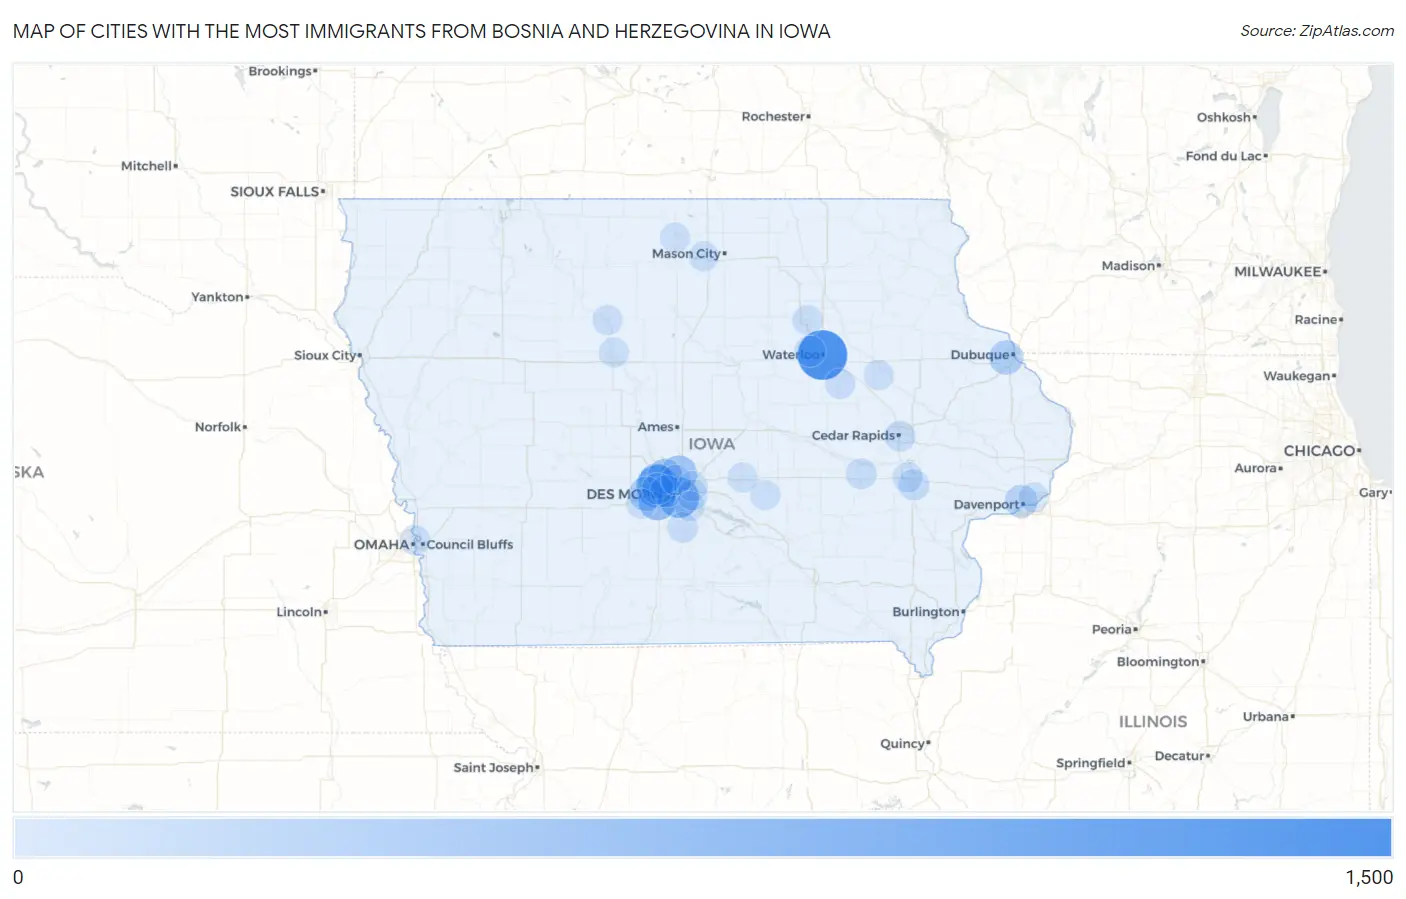
Map of Cities with the Most Immigrants from Bosnia and Herzegovina in Iowa
0
1,500
Cities with the Most Immigrants from Bosnia and Herzegovina in Iowa
| City | Bosnia and Herzegovina | vs State | vs National | |
| 1. | Waterloo | 1,280 | 5,751(22.26%)#1 | 106,359(1.20%)#7 |
| 2. | Urbandale | 788 | 5,751(13.70%)#2 | 106,359(0.74%)#15 |
| 3. | Des Moines | 675 | 5,751(11.74%)#3 | 106,359(0.63%)#19 |
| 4. | West Des Moines | 515 | 5,751(8.95%)#4 | 106,359(0.48%)#29 |
| 5. | Ankeny | 411 | 5,751(7.15%)#5 | 106,359(0.39%)#41 |
| 6. | Grimes | 338 | 5,751(5.88%)#6 | 106,359(0.32%)#50 |
| 7. | Johnston | 302 | 5,751(5.25%)#7 | 106,359(0.28%)#61 |
| 8. | Waukee | 283 | 5,751(4.92%)#8 | 106,359(0.27%)#65 |
| 9. | Dubuque | 257 | 5,751(4.47%)#9 | 106,359(0.24%)#72 |
| 10. | Davenport | 175 | 5,751(3.04%)#10 | 106,359(0.16%)#102 |
| 11. | Windsor Heights | 128 | 5,751(2.23%)#11 | 106,359(0.12%)#134 |
| 12. | Clive | 79 | 5,751(1.37%)#12 | 106,359(0.07%)#232 |
| 13. | Cedar Falls | 70 | 5,751(1.22%)#13 | 106,359(0.07%)#256 |
| 14. | Iowa City | 60 | 5,751(1.04%)#14 | 106,359(0.06%)#285 |
| 15. | Cedar Rapids | 42 | 5,751(0.73%)#15 | 106,359(0.04%)#387 |
| 16. | Conroy | 35 | 5,751(0.61%)#16 | 106,359(0.03%)#446 |
| 17. | Pleasant Hill | 31 | 5,751(0.54%)#17 | 106,359(0.03%)#483 |
| 18. | Indianola | 26 | 5,751(0.45%)#18 | 106,359(0.02%)#528 |
| 19. | Saylorville | 19 | 5,751(0.33%)#19 | 106,359(0.02%)#627 |
| 20. | Waverly | 18 | 5,751(0.31%)#20 | 106,359(0.02%)#651 |
| 21. | La Porte City | 15 | 5,751(0.26%)#21 | 106,359(0.01%)#730 |
| 22. | Clear Lake | 14 | 5,751(0.24%)#22 | 106,359(0.01%)#749 |
| 23. | Carter Lake | 12 | 5,751(0.21%)#23 | 106,359(0.01%)#797 |
| 24. | Forest City | 9 | 5,751(0.16%)#24 | 106,359(0.01%)#900 |
| 25. | Bettendorf | 8 | 5,751(0.14%)#25 | 106,359(0.01%)#916 |
| 26. | Altoona | 8 | 5,751(0.14%)#26 | 106,359(0.01%)#922 |
| 27. | Humboldt | 6 | 5,751(0.10%)#27 | 106,359(0.01%)#981 |
| 28. | Fort Dodge | 5 | 5,751(0.09%)#28 | 106,359(0.00%)#994 |
| 29. | Coralville | 5 | 5,751(0.09%)#29 | 106,359(0.00%)#995 |
| 30. | Sully | 5 | 5,751(0.09%)#30 | 106,359(0.00%)#1,006 |
| 31. | Newton | 4 | 5,751(0.07%)#31 | 106,359(0.00%)#1,019 |
| 32. | Carlisle | 4 | 5,751(0.07%)#32 | 106,359(0.00%)#1,024 |
| 33. | Van Meter | 3 | 5,751(0.05%)#33 | 106,359(0.00%)#1,040 |
| 34. | Rowley | 2 | 5,751(0.03%)#34 | 106,359(0.00%)#1,058 |
Common Questions
What are the Top 10 Cities with the Most Immigrants from Bosnia and Herzegovina in Iowa?
Top 10 Cities with the Most Immigrants from Bosnia and Herzegovina in Iowa are:
#1
1,280
#2
788
#3
675
#4
515
#5
411
#6
338
#7
302
#8
283
#9
257
#10
175
What city has the Most Immigrants from Bosnia and Herzegovina in Iowa?
Waterloo has the Most Immigrants from Bosnia and Herzegovina in Iowa with 1,280.
What is the Total Immigrants from Bosnia and Herzegovina in the State of Iowa?
Total Immigrants from Bosnia and Herzegovina in Iowa is 5,751.
What is the Total Immigrants from Bosnia and Herzegovina in the United States?
Total Immigrants from Bosnia and Herzegovina in the United States is 106,359.