Washtenaw County, MI
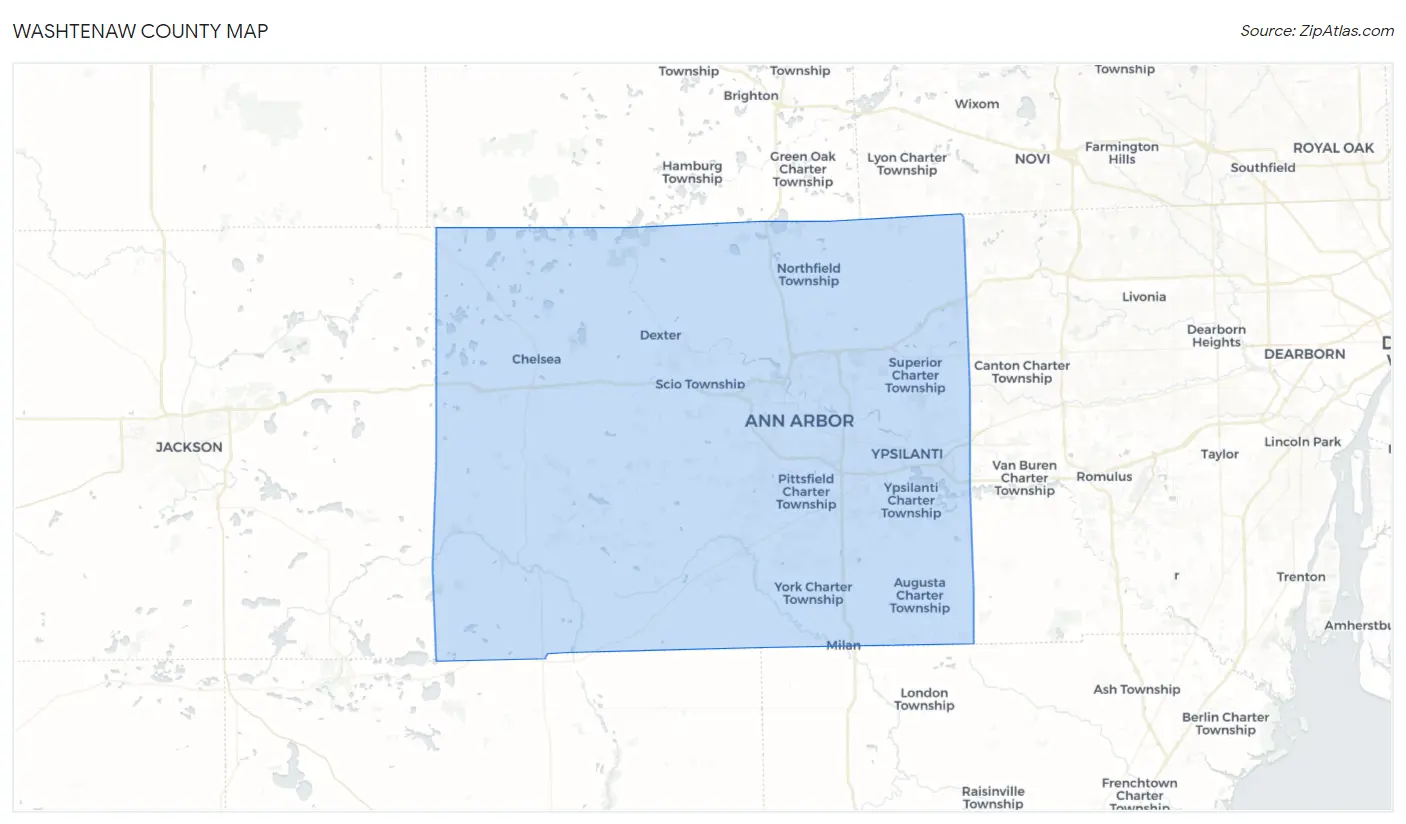
Washtenaw County Map
Washtenaw County Overview
370,231
TOTAL POPULATION
185,097
MALE POPULATION
185,134
FEMALE POPULATION
99.98
MALES / 100 FEMALES
100.02
FEMALES / 100 MALES
34.4
MEDIAN AGE
3.0
AVG FAMILY SIZE
2.4
AVG HOUSEHOLD SIZE
$49,568
PER CAPITA INCOME
$118,144
AVG FAMILY INCOME
$84,245
AVG HOUSEHOLD INCOME
32.6%
WAGE / INCOME GAP [ % ]
67.4¢/ $1
WAGE / INCOME GAP [ $ ]
$11,300
FAMILY INCOME DEFICIT
0.49
INEQUALITY / GINI INDEX
198,159
LABOR FORCE [ PEOPLE ]
63.7%
PERCENT IN LABOR FORCE
4.7%
UNEMPLOYMENT RATE
Washtenaw County Area Codes
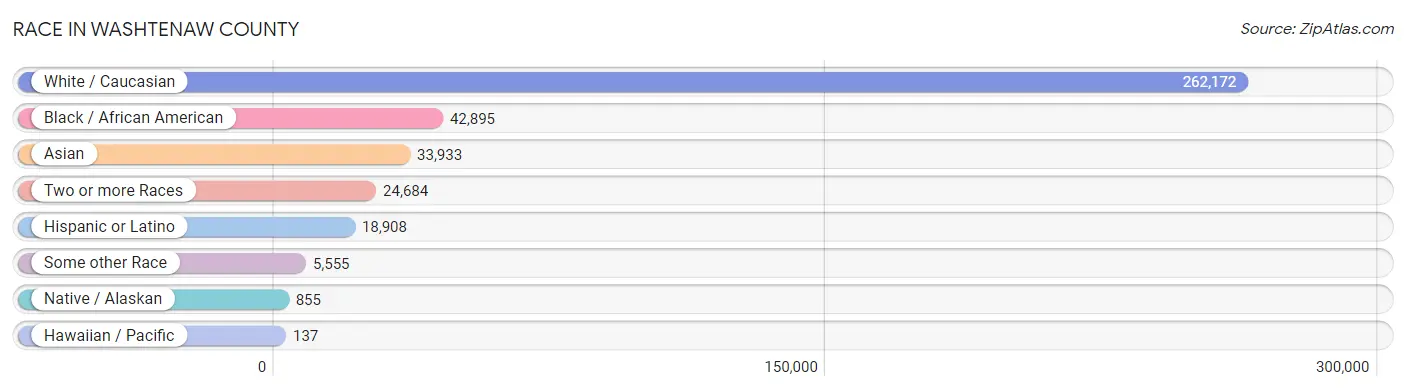
Race in Washtenaw County
The most populous races in Washtenaw County are White / Caucasian (262,172 | 70.8%), Black / African American (42,895 | 11.6%), and Asian (33,933 | 9.2%).
| Race | # Population | % Population |
| Asian | 33,933 | 9.2% |
| Black / African American | 42,895 | 11.6% |
| Hawaiian / Pacific | 137 | 0.0% |
| Hispanic or Latino | 18,908 | 5.1% |
| Native / Alaskan | 855 | 0.2% |
| White / Caucasian | 262,172 | 70.8% |
| Two or more Races | 24,684 | 6.7% |
| Some other Race | 5,555 | 1.5% |
| Total | 370,231 | 100.0% |
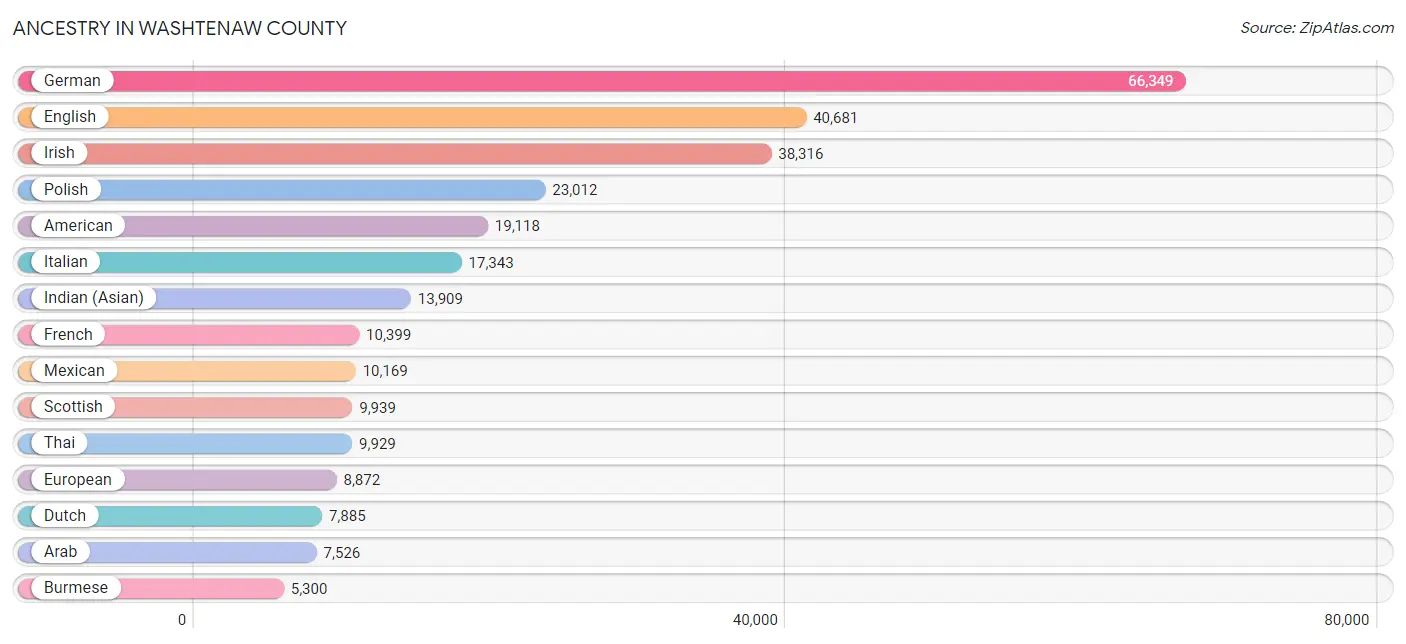
Ancestry in Washtenaw County
The most populous ancestries reported in Washtenaw County are German (66,349 | 17.9%), English (40,681 | 11.0%), Irish (38,316 | 10.3%), Polish (23,012 | 6.2%), and American (19,118 | 5.2%), together accounting for 50.6% of all Washtenaw County residents.
| Ancestry | # Population | % Population |
| Afghan | 308 | 0.1% |
| African | 1,426 | 0.4% |
| Alaska Native | 3 | 0.0% |
| Alaskan Athabascan | 30 | 0.0% |
| Albanian | 746 | 0.2% |
| Alsatian | 8 | 0.0% |
| American | 19,118 | 5.2% |
| Apache | 21 | 0.0% |
| Arab | 7,526 | 2.0% |
| Argentinean | 49 | 0.0% |
| Armenian | 725 | 0.2% |
| Assyrian / Chaldean / Syriac | 127 | 0.0% |
| Australian | 71 | 0.0% |
| Austrian | 1,280 | 0.4% |
| Bahamian | 34 | 0.0% |
| Bangladeshi | 38 | 0.0% |
| Barbadian | 4 | 0.0% |
| Basque | 18 | 0.0% |
| Belgian | 1,060 | 0.3% |
| Belizean | 8 | 0.0% |
| Bhutanese | 2,101 | 0.6% |
| Blackfeet | 486 | 0.1% |
| Bolivian | 110 | 0.0% |
| Brazilian | 355 | 0.1% |
| British | 3,805 | 1.0% |
| British West Indian | 5 | 0.0% |
| Bulgarian | 140 | 0.0% |
| Burmese | 5,300 | 1.4% |
| Cajun | 22 | 0.0% |
| Cambodian | 44 | 0.0% |
| Canadian | 1,465 | 0.4% |
| Carpatho Rusyn | 142 | 0.0% |
| Celtic | 181 | 0.1% |
| Central American | 2,175 | 0.6% |
| Central American Indian | 158 | 0.0% |
| Cherokee | 982 | 0.3% |
| Cheyenne | 10 | 0.0% |
| Chickasaw | 35 | 0.0% |
| Chilean | 357 | 0.1% |
| Chinese | 2 | 0.0% |
| Chippewa | 608 | 0.2% |
| Choctaw | 152 | 0.0% |
| Colombian | 616 | 0.2% |
| Comanche | 38 | 0.0% |
| Costa Rican | 166 | 0.0% |
| Creek | 23 | 0.0% |
| Croatian | 601 | 0.2% |
| Cuban | 635 | 0.2% |
| Cypriot | 46 | 0.0% |
| Czech | 1,982 | 0.5% |
| Czechoslovakian | 401 | 0.1% |
| Danish | 1,319 | 0.4% |
| Delaware | 4 | 0.0% |
| Dominican | 109 | 0.0% |
| Dutch | 7,885 | 2.1% |
| Eastern European | 2,394 | 0.6% |
| Ecuadorian | 136 | 0.0% |
| Egyptian | 516 | 0.1% |
| English | 40,681 | 11.0% |
| Estonian | 8 | 0.0% |
| Ethiopian | 244 | 0.1% |
| European | 8,872 | 2.4% |
| Filipino | 1,442 | 0.4% |
| Finnish | 2,304 | 0.6% |
| French | 10,399 | 2.8% |
| French American Indian | 72 | 0.0% |
| French Canadian | 3,281 | 0.9% |
| German | 66,349 | 17.9% |
| Ghanaian | 351 | 0.1% |
| Greek | 2,304 | 0.6% |
| Guamanian / Chamorro | 107 | 0.0% |
| Guatemalan | 639 | 0.2% |
| Guyanese | 35 | 0.0% |
| Haitian | 89 | 0.0% |
| Honduran | 831 | 0.2% |
| Hungarian | 3,790 | 1.0% |
| Icelander | 178 | 0.1% |
| Indian (Asian) | 13,909 | 3.8% |
| Indonesian | 148 | 0.0% |
| Inupiat | 9 | 0.0% |
| Iranian | 958 | 0.3% |
| Iraqi | 1,036 | 0.3% |
| Irish | 38,316 | 10.3% |
| Iroquois | 40 | 0.0% |
| Israeli | 261 | 0.1% |
| Italian | 17,343 | 4.7% |
| Jamaican | 573 | 0.2% |
| Japanese | 101 | 0.0% |
| Jordanian | 700 | 0.2% |
| Kenyan | 89 | 0.0% |
| Korean | 2,161 | 0.6% |
| Laotian | 165 | 0.0% |
| Latvian | 228 | 0.1% |
| Lebanese | 1,197 | 0.3% |
| Liberian | 35 | 0.0% |
| Lithuanian | 1,731 | 0.5% |
| Lumbee | 56 | 0.0% |
| Luxembourger | 29 | 0.0% |
| Macedonian | 131 | 0.0% |
| Malaysian | 24 | 0.0% |
| Maltese | 465 | 0.1% |
| Menominee | 5 | 0.0% |
| Mexican | 10,169 | 2.8% |
| Mexican American Indian | 210 | 0.1% |
| Mongolian | 128 | 0.0% |
| Moroccan | 91 | 0.0% |
| Native Hawaiian | 162 | 0.0% |
| Navajo | 87 | 0.0% |
| Nicaraguan | 8 | 0.0% |
| Nigerian | 979 | 0.3% |
| Northern European | 1,015 | 0.3% |
| Norwegian | 3,986 | 1.1% |
| Okinawan | 89 | 0.0% |
| Ottawa | 109 | 0.0% |
| Pakistani | 419 | 0.1% |
| Palestinian | 624 | 0.2% |
| Panamanian | 151 | 0.0% |
| Paraguayan | 61 | 0.0% |
| Pennsylvania German | 79 | 0.0% |
| Peruvian | 436 | 0.1% |
| Polish | 23,012 | 6.2% |
| Portuguese | 355 | 0.1% |
| Potawatomi | 89 | 0.0% |
| Pueblo | 13 | 0.0% |
| Puerto Rican | 1,986 | 0.5% |
| Romanian | 1,901 | 0.5% |
| Russian | 4,744 | 1.3% |
| Salvadoran | 380 | 0.1% |
| Samoan | 123 | 0.0% |
| Scandinavian | 903 | 0.2% |
| Scotch-Irish | 2,853 | 0.8% |
| Scottish | 9,939 | 2.7% |
| Seminole | 15 | 0.0% |
| Senegalese | 48 | 0.0% |
| Serbian | 311 | 0.1% |
| Sioux | 42 | 0.0% |
| Slavic | 119 | 0.0% |
| Slovak | 936 | 0.3% |
| Slovene | 259 | 0.1% |
| Somali | 163 | 0.0% |
| South African | 72 | 0.0% |
| South American | 2,397 | 0.6% |
| South American Indian | 22 | 0.0% |
| Spaniard | 517 | 0.1% |
| Spanish | 445 | 0.1% |
| Spanish American | 23 | 0.0% |
| Spanish American Indian | 5 | 0.0% |
| Sri Lankan | 1,295 | 0.4% |
| Subsaharan African | 4,308 | 1.2% |
| Sudanese | 82 | 0.0% |
| Swedish | 4,768 | 1.3% |
| Swiss | 1,372 | 0.4% |
| Syrian | 648 | 0.2% |
| Thai | 9,929 | 2.7% |
| Trinidadian and Tobagonian | 108 | 0.0% |
| Turkish | 517 | 0.1% |
| Ugandan | 6 | 0.0% |
| Ukrainian | 1,840 | 0.5% |
| Uruguayan | 79 | 0.0% |
| Venezuelan | 385 | 0.1% |
| Vietnamese | 156 | 0.0% |
| Welsh | 2,676 | 0.7% |
| West Indian | 137 | 0.0% |
| Yaqui | 20 | 0.0% |
| Yugoslavian | 114 | 0.0% |
| Zimbabwean | 96 | 0.0% | View All 166 Rows |
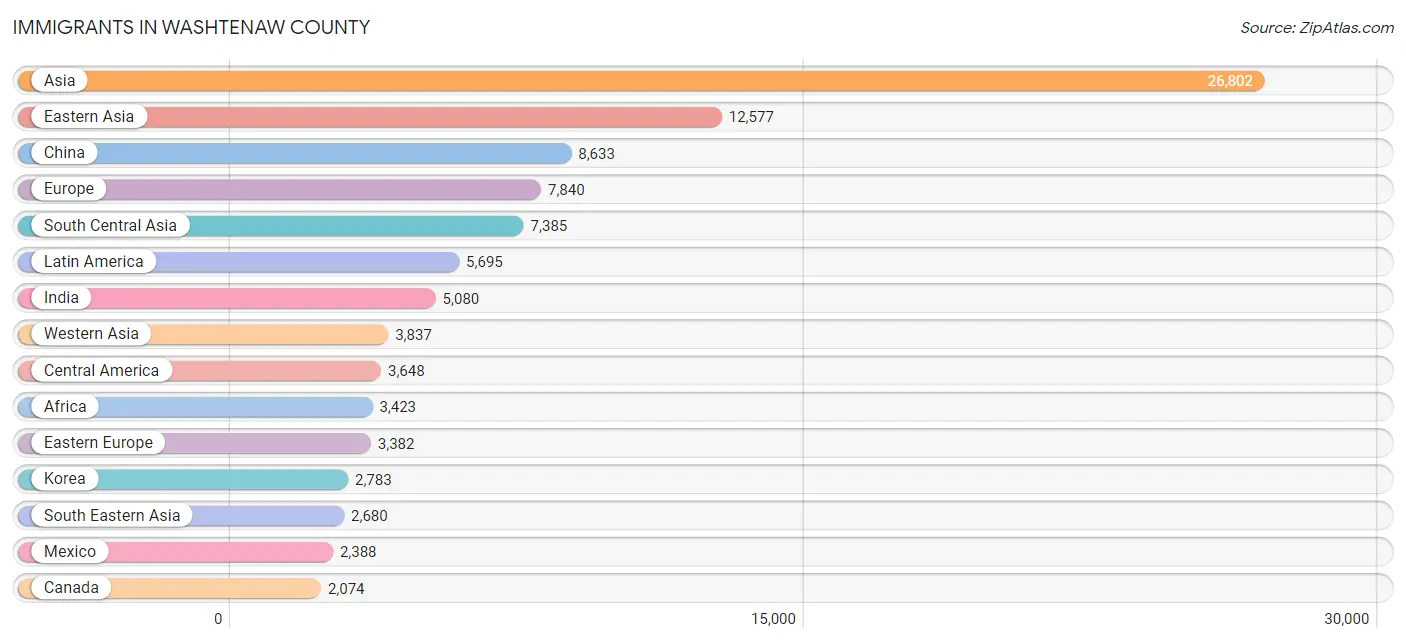
Immigrants in Washtenaw County
The most numerous immigrant groups reported in Washtenaw County came from Asia (26,802 | 7.2%), Eastern Asia (12,577 | 3.4%), China (8,633 | 2.3%), Europe (7,840 | 2.1%), and South Central Asia (7,385 | 2.0%), together accounting for 17.1% of all Washtenaw County residents.
| Immigration Origin | # Population | % Population |
| Afghanistan | 235 | 0.1% |
| Africa | 3,423 | 0.9% |
| Albania | 604 | 0.2% |
| Argentina | 35 | 0.0% |
| Armenia | 42 | 0.0% |
| Asia | 26,802 | 7.2% |
| Australia | 215 | 0.1% |
| Austria | 92 | 0.0% |
| Bahamas | 12 | 0.0% |
| Bangladesh | 164 | 0.0% |
| Barbados | 4 | 0.0% |
| Belarus | 34 | 0.0% |
| Belgium | 27 | 0.0% |
| Bolivia | 42 | 0.0% |
| Bosnia and Herzegovina | 28 | 0.0% |
| Brazil | 532 | 0.1% |
| Bulgaria | 31 | 0.0% |
| Cambodia | 35 | 0.0% |
| Cameroon | 71 | 0.0% |
| Canada | 2,074 | 0.6% |
| Caribbean | 374 | 0.1% |
| Central America | 3,648 | 1.0% |
| Chile | 111 | 0.0% |
| China | 8,633 | 2.3% |
| Colombia | 300 | 0.1% |
| Congo | 48 | 0.0% |
| Costa Rica | 141 | 0.0% |
| Cuba | 78 | 0.0% |
| Czechoslovakia | 144 | 0.0% |
| Denmark | 77 | 0.0% |
| Dominican Republic | 47 | 0.0% |
| Eastern Africa | 1,015 | 0.3% |
| Eastern Asia | 12,577 | 3.4% |
| Eastern Europe | 3,382 | 0.9% |
| Ecuador | 81 | 0.0% |
| Egypt | 342 | 0.1% |
| El Salvador | 191 | 0.1% |
| England | 634 | 0.2% |
| Eritrea | 43 | 0.0% |
| Ethiopia | 168 | 0.1% |
| Europe | 7,840 | 2.1% |
| France | 281 | 0.1% |
| Germany | 1,346 | 0.4% |
| Ghana | 311 | 0.1% |
| Greece | 166 | 0.0% |
| Guatemala | 460 | 0.1% |
| Guyana | 54 | 0.0% |
| Haiti | 5 | 0.0% |
| Honduras | 468 | 0.1% |
| Hong Kong | 160 | 0.0% |
| Hungary | 52 | 0.0% |
| India | 5,080 | 1.4% |
| Indonesia | 170 | 0.1% |
| Iran | 688 | 0.2% |
| Iraq | 1,054 | 0.3% |
| Ireland | 123 | 0.0% |
| Israel | 290 | 0.1% |
| Italy | 149 | 0.0% |
| Jamaica | 54 | 0.0% |
| Japan | 1,131 | 0.3% |
| Jordan | 517 | 0.1% |
| Kazakhstan | 99 | 0.0% |
| Kenya | 270 | 0.1% |
| Korea | 2,783 | 0.7% |
| Kuwait | 67 | 0.0% |
| Laos | 10 | 0.0% |
| Latin America | 5,695 | 1.5% |
| Latvia | 125 | 0.0% |
| Lebanon | 448 | 0.1% |
| Liberia | 58 | 0.0% |
| Lithuania | 163 | 0.0% |
| Malaysia | 215 | 0.1% |
| Mexico | 2,388 | 0.6% |
| Middle Africa | 172 | 0.1% |
| Moldova | 10 | 0.0% |
| Morocco | 92 | 0.0% |
| Nepal | 129 | 0.0% |
| Netherlands | 225 | 0.1% |
| Nigeria | 569 | 0.2% |
| North Macedonia | 18 | 0.0% |
| Northern Africa | 616 | 0.2% |
| Northern Europe | 1,856 | 0.5% |
| Norway | 25 | 0.0% |
| Oceania | 222 | 0.1% |
| Pakistan | 889 | 0.2% |
| Peru | 58 | 0.0% |
| Philippines | 1,056 | 0.3% |
| Poland | 220 | 0.1% |
| Romania | 718 | 0.2% |
| Russia | 733 | 0.2% |
| Saudi Arabia | 394 | 0.1% |
| Scotland | 65 | 0.0% |
| Senegal | 79 | 0.0% |
| Serbia | 49 | 0.0% |
| Sierra Leone | 5 | 0.0% |
| Singapore | 86 | 0.0% |
| Somalia | 244 | 0.1% |
| South Africa | 143 | 0.0% |
| South America | 1,673 | 0.4% |
| South Central Asia | 7,385 | 2.0% |
| South Eastern Asia | 2,680 | 0.7% |
| Southern Europe | 506 | 0.1% |
| Spain | 183 | 0.1% |
| Sri Lanka | 40 | 0.0% |
| Sudan | 34 | 0.0% |
| Sweden | 57 | 0.0% |
| Switzerland | 79 | 0.0% |
| Syria | 223 | 0.1% |
| Taiwan | 1,313 | 0.4% |
| Thailand | 208 | 0.1% |
| Trinidad and Tobago | 112 | 0.0% |
| Turkey | 369 | 0.1% |
| Uganda | 30 | 0.0% |
| Ukraine | 198 | 0.1% |
| Uruguay | 79 | 0.0% |
| Uzbekistan | 53 | 0.0% |
| Venezuela | 329 | 0.1% |
| Vietnam | 779 | 0.2% |
| West Indies | 22 | 0.0% |
| Western Africa | 1,289 | 0.4% |
| Western Asia | 3,837 | 1.0% |
| Western Europe | 2,050 | 0.5% |
| Yemen | 328 | 0.1% |
| Zaire | 53 | 0.0% |
| Zimbabwe | 94 | 0.0% | View All 125 Rows |
Sex and Age in Washtenaw County
Sex and Age in Washtenaw County
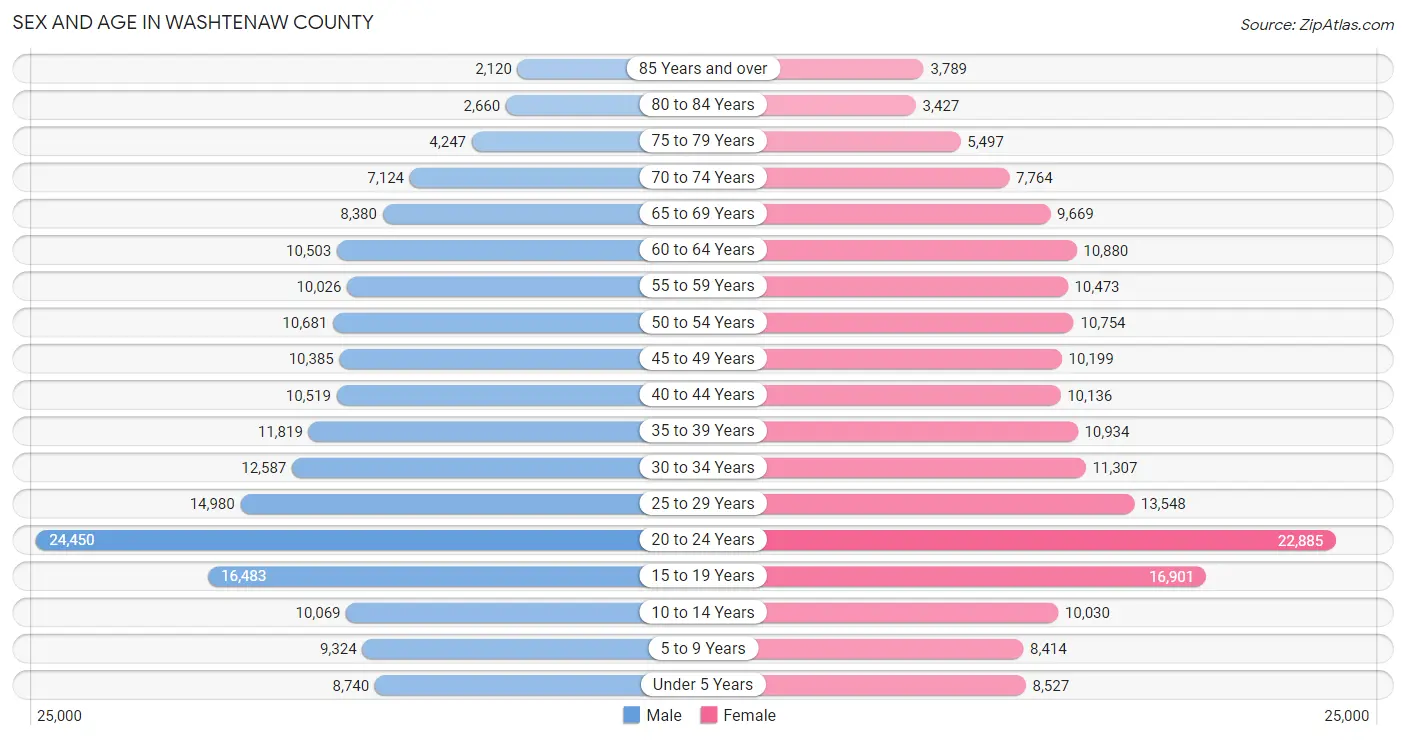
The most populous age groups in Washtenaw County are 20 to 24 Years (24,450 | 13.2%) for men and 20 to 24 Years (22,885 | 12.4%) for women.
| Age Bracket | Male | Female |
| Under 5 Years | 8,740 (4.7%) | 8,527 (4.6%) |
| 5 to 9 Years | 9,324 (5.0%) | 8,414 (4.5%) |
| 10 to 14 Years | 10,069 (5.4%) | 10,030 (5.4%) |
| 15 to 19 Years | 16,483 (8.9%) | 16,901 (9.1%) |
| 20 to 24 Years | 24,450 (13.2%) | 22,885 (12.4%) |
| 25 to 29 Years | 14,980 (8.1%) | 13,548 (7.3%) |
| 30 to 34 Years | 12,587 (6.8%) | 11,307 (6.1%) |
| 35 to 39 Years | 11,819 (6.4%) | 10,934 (5.9%) |
| 40 to 44 Years | 10,519 (5.7%) | 10,136 (5.5%) |
| 45 to 49 Years | 10,385 (5.6%) | 10,199 (5.5%) |
| 50 to 54 Years | 10,681 (5.8%) | 10,754 (5.8%) |
| 55 to 59 Years | 10,026 (5.4%) | 10,473 (5.7%) |
| 60 to 64 Years | 10,503 (5.7%) | 10,880 (5.9%) |
| 65 to 69 Years | 8,380 (4.5%) | 9,669 (5.2%) |
| 70 to 74 Years | 7,124 (3.8%) | 7,764 (4.2%) |
| 75 to 79 Years | 4,247 (2.3%) | 5,497 (3.0%) |
| 80 to 84 Years | 2,660 (1.4%) | 3,427 (1.8%) |
| 85 Years and over | 2,120 (1.1%) | 3,789 (2.1%) |
| Total | 185,097 (100.0%) | 185,134 (100.0%) |
Families and Households in Washtenaw County
Median Family Size in Washtenaw County
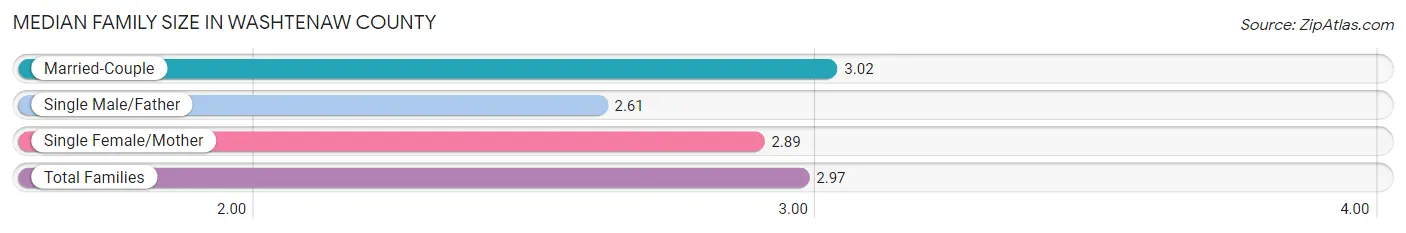
The median family size in Washtenaw County is 2.97 persons per family, with married-couple families (66,231 | 78.6%) accounting for the largest median family size of 3.02 persons per family. On the other hand, single male/father families (5,436 | 6.5%) represent the smallest median family size with 2.61 persons per family.
| Family Type | # Families | Family Size |
| Married-Couple | 66,231 (78.6%) | 3.02 |
| Single Male/Father | 5,436 (6.5%) | 2.61 |
| Single Female/Mother | 12,561 (14.9%) | 2.89 |
| Total Families | 84,228 (100.0%) | 2.97 |
Median Household Size in Washtenaw County
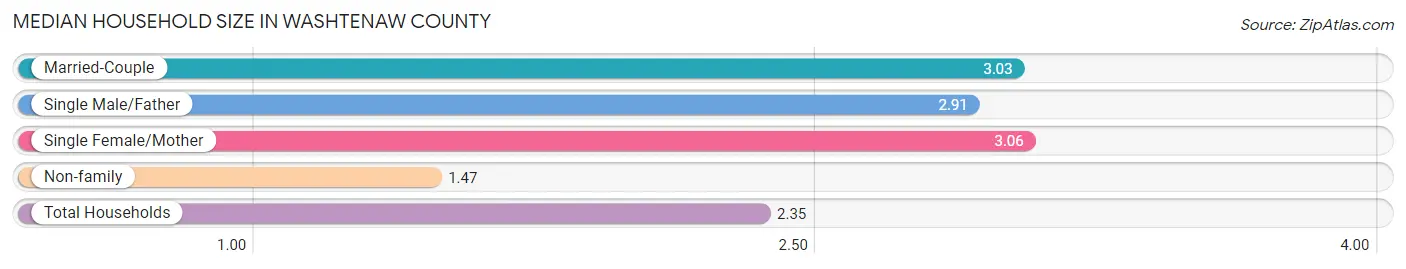
The median household size in Washtenaw County is 2.35 persons per household, with single female/mother households (12,561 | 8.5%) accounting for the largest median household size of 3.06 persons per household. non-family households (64,476 | 43.4%) represent the smallest median household size with 1.47 persons per household.
| Household Type | # Households | Household Size |
| Married-Couple | 66,231 (44.5%) | 3.03 |
| Single Male/Father | 5,436 (3.7%) | 2.91 |
| Single Female/Mother | 12,561 (8.5%) | 3.06 |
| Non-family | 64,476 (43.4%) | 1.47 |
| Total Households | 148,704 (100.0%) | 2.35 |
Household Size by Marriage Status in Washtenaw County
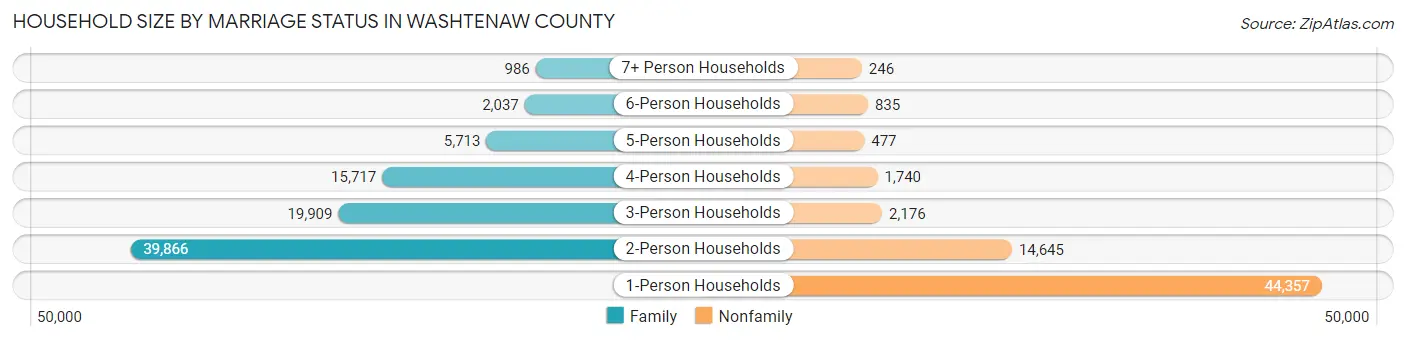
Out of a total of 148,704 households in Washtenaw County, 84,228 (56.6%) are family households, while 64,476 (43.4%) are nonfamily households. The most numerous type of family households are 2-person households, comprising 39,866, and the most common type of nonfamily households are 1-person households, comprising 44,357.
| Household Size | Family Households | Nonfamily Households |
| 1-Person Households | - | 44,357 (29.8%) |
| 2-Person Households | 39,866 (26.8%) | 14,645 (9.9%) |
| 3-Person Households | 19,909 (13.4%) | 2,176 (1.5%) |
| 4-Person Households | 15,717 (10.6%) | 1,740 (1.2%) |
| 5-Person Households | 5,713 (3.8%) | 477 (0.3%) |
| 6-Person Households | 2,037 (1.4%) | 835 (0.6%) |
| 7+ Person Households | 986 (0.7%) | 246 (0.2%) |
| Total | 84,228 (56.6%) | 64,476 (43.4%) |
Female Fertility in Washtenaw County
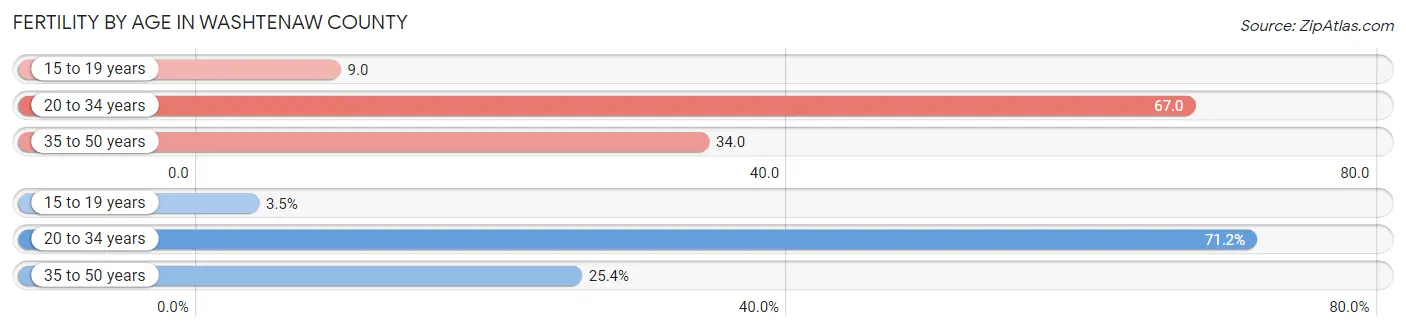
Fertility by Age in Washtenaw County
Average fertility rate in Washtenaw County is 46.0 births per 1,000 women. Women in the age bracket of 20 to 34 years have the highest fertility rate with 67.0 births per 1,000 women. Women in the age bracket of 20 to 34 years acount for 71.2% of all women with births.
| Age Bracket | Women with Births | Births / 1,000 Women |
| 15 to 19 years | 155 (3.5%) | 9.0 |
| 20 to 34 years | 3,193 (71.2%) | 67.0 |
| 35 to 50 years | 1,138 (25.4%) | 34.0 |
| Total | 4,486 (100.0%) | 46.0 |
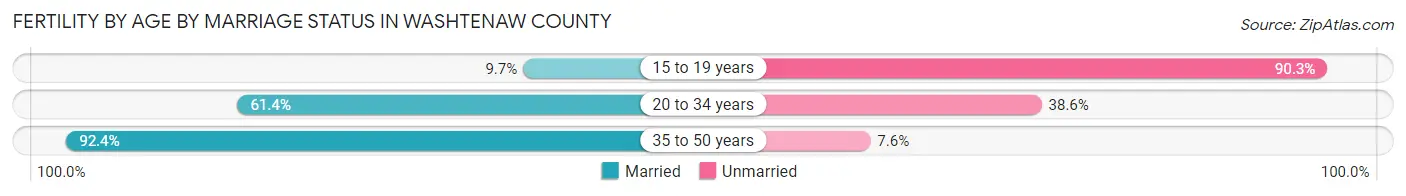
Fertility by Age by Marriage Status in Washtenaw County
67.5% of women with births (4,486) in Washtenaw County are married. The highest percentage of unmarried women with births falls into 15 to 19 years age bracket with 90.3% of them unmarried at the time of birth, while the lowest percentage of unmarried women with births belong to 35 to 50 years age bracket with 7.6% of them unmarried.
| Age Bracket | Married | Unmarried |
| 15 to 19 years | 15 (9.7%) | 140 (90.3%) |
| 20 to 34 years | 1,961 (61.4%) | 1,232 (38.6%) |
| 35 to 50 years | 1,052 (92.4%) | 86 (7.6%) |
| Total | 3,028 (67.5%) | 1,458 (32.5%) |
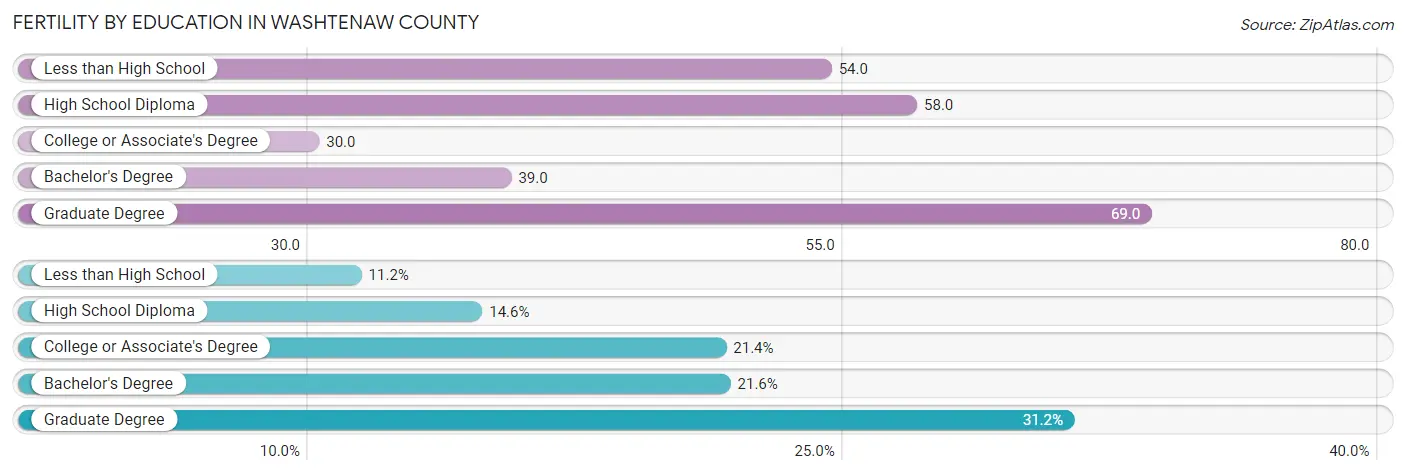
Fertility by Education in Washtenaw County
Average fertility rate in Washtenaw County is 46.0 births per 1,000 women. Women with the education attainment of graduate degree have the highest fertility rate of 69.0 births per 1,000 women, while women with the education attainment of college or associate's degree have the lowest fertility at 30.0 births per 1,000 women. Women with the education attainment of graduate degree represent 31.2% of all women with births.
| Educational Attainment | Women with Births | Births / 1,000 Women |
| Less than High School | 502 (11.2%) | 54.0 |
| High School Diploma | 654 (14.6%) | 58.0 |
| College or Associate's Degree | 962 (21.4%) | 30.0 |
| Bachelor's Degree | 967 (21.6%) | 39.0 |
| Graduate Degree | 1,401 (31.2%) | 69.0 |
| Total | 4,486 (100.0%) | 46.0 |
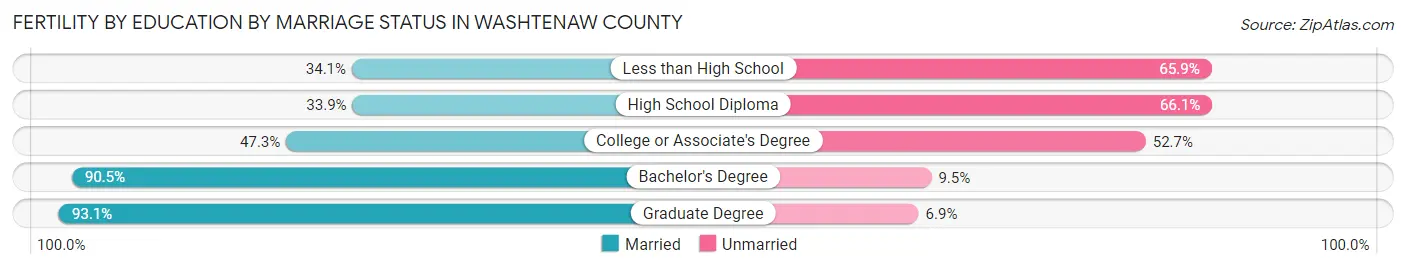
Fertility by Education by Marriage Status in Washtenaw County
32.5% of women with births in Washtenaw County are unmarried. Women with the educational attainment of graduate degree are most likely to be married with 93.1% of them married at childbirth, while women with the educational attainment of high school diploma are least likely to be married with 66.1% of them unmarried at childbirth.
| Educational Attainment | Married | Unmarried |
| Less than High School | 171 (34.1%) | 331 (65.9%) |
| High School Diploma | 222 (33.9%) | 432 (66.1%) |
| College or Associate's Degree | 455 (47.3%) | 507 (52.7%) |
| Bachelor's Degree | 875 (90.5%) | 92 (9.5%) |
| Graduate Degree | 1,304 (93.1%) | 97 (6.9%) |
| Total | 3,028 (67.5%) | 1,458 (32.5%) |
Income in Washtenaw County
Income Overview in Washtenaw County
Per Capita Income in Washtenaw County is $49,568, while median incomes of families and households are $118,144 and $84,245 respectively.
| Characteristic | Number | Measure |
| Per Capita Income | 370,231 | $49,568 |
| Median Family Income | 84,228 | $118,144 |
| Mean Family Income | 84,228 | $154,903 |
| Median Household Income | 148,704 | $84,245 |
| Mean Household Income | 148,704 | $118,384 |
| Income Deficit | 84,228 | $11,300 |
| Wage / Income Gap (%) | 370,231 | 32.63% |
| Wage / Income Gap ($) | 370,231 | 67.37¢ per $1 |
| Gini / Inequality Index | 370,231 | 0.49 |
Earnings by Sex in Washtenaw County
Average Earnings in Washtenaw County are $39,045, $46,960 for men and $31,637 for women, a difference of 32.6%.
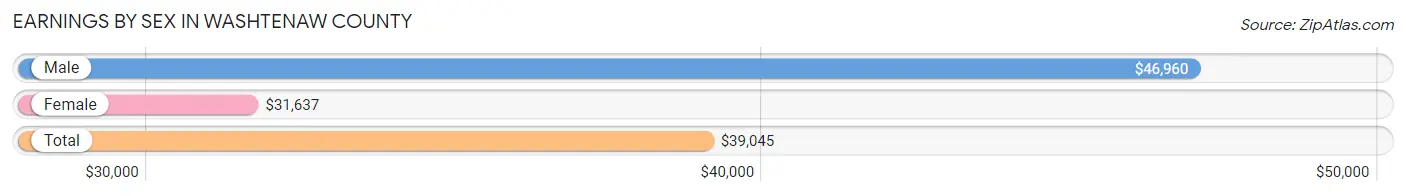
| Sex | Number | Average Earnings |
| Male | 116,877 (52.4%) | $46,960 |
| Female | 105,991 (47.6%) | $31,637 |
| Total | 222,868 (100.0%) | $39,045 |
Earnings by Sex by Income Bracket in Washtenaw County
The most common earnings brackets in Washtenaw County are $100,000+ for men (29,336 | 25.1%) and $100,000+ for women (12,255 | 11.6%).
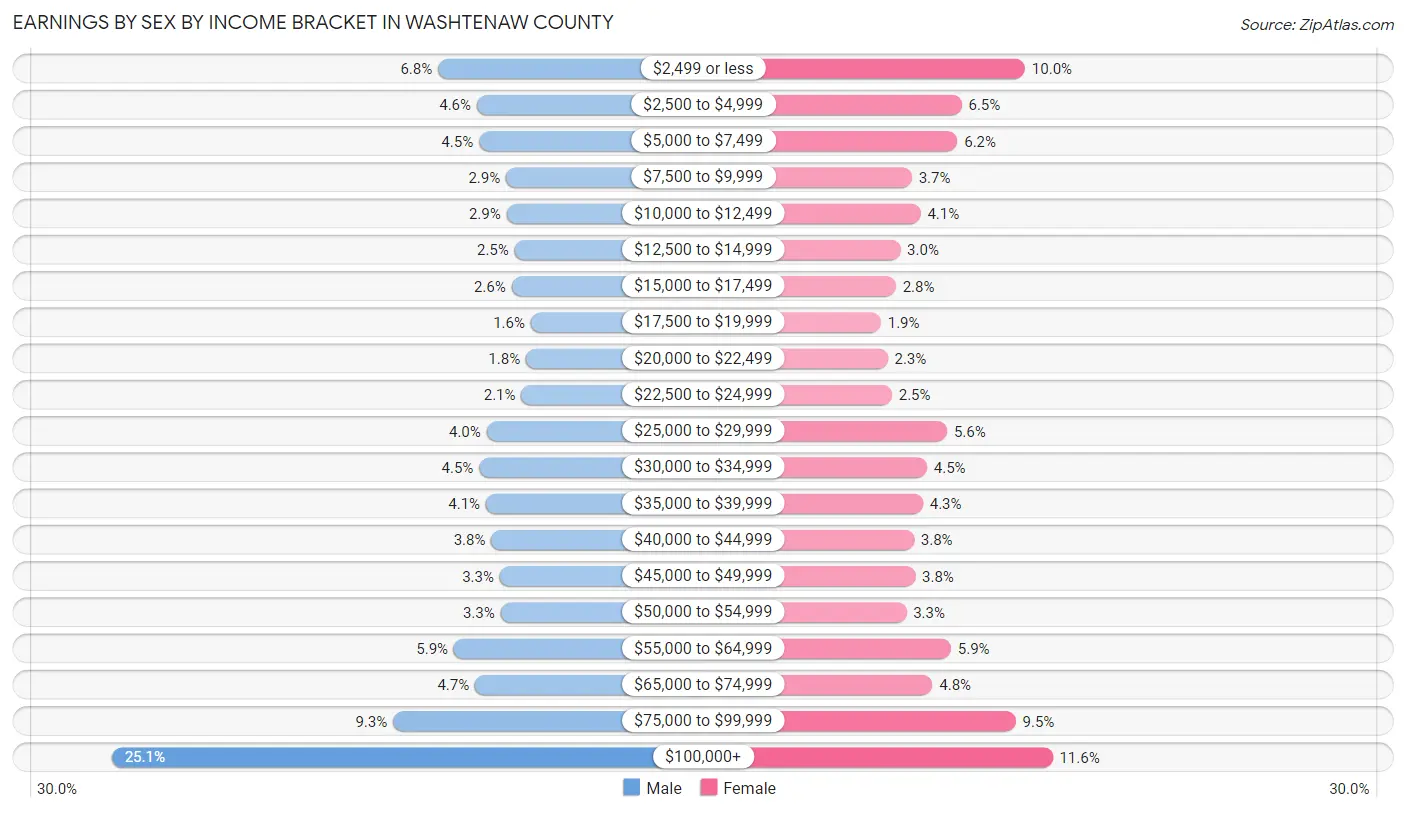
| Income | Male | Female |
| $2,499 or less | 7,897 (6.8%) | 10,610 (10.0%) |
| $2,500 to $4,999 | 5,348 (4.6%) | 6,833 (6.5%) |
| $5,000 to $7,499 | 5,218 (4.5%) | 6,580 (6.2%) |
| $7,500 to $9,999 | 3,440 (2.9%) | 3,870 (3.6%) |
| $10,000 to $12,499 | 3,403 (2.9%) | 4,391 (4.1%) |
| $12,500 to $14,999 | 2,876 (2.5%) | 3,177 (3.0%) |
| $15,000 to $17,499 | 3,079 (2.6%) | 2,911 (2.8%) |
| $17,500 to $19,999 | 1,810 (1.5%) | 2,023 (1.9%) |
| $20,000 to $22,499 | 2,128 (1.8%) | 2,424 (2.3%) |
| $22,500 to $24,999 | 2,431 (2.1%) | 2,681 (2.5%) |
| $25,000 to $29,999 | 4,710 (4.0%) | 5,972 (5.6%) |
| $30,000 to $34,999 | 5,200 (4.4%) | 4,769 (4.5%) |
| $35,000 to $39,999 | 4,755 (4.1%) | 4,526 (4.3%) |
| $40,000 to $44,999 | 4,409 (3.8%) | 3,992 (3.8%) |
| $45,000 to $49,999 | 3,849 (3.3%) | 4,067 (3.8%) |
| $50,000 to $54,999 | 3,801 (3.3%) | 3,544 (3.3%) |
| $55,000 to $64,999 | 6,856 (5.9%) | 6,205 (5.9%) |
| $65,000 to $74,999 | 5,472 (4.7%) | 5,102 (4.8%) |
| $75,000 to $99,999 | 10,859 (9.3%) | 10,059 (9.5%) |
| $100,000+ | 29,336 (25.1%) | 12,255 (11.6%) |
| Total | 116,877 (100.0%) | 105,991 (100.0%) |
Earnings by Sex by Educational Attainment in Washtenaw County
Average earnings in Washtenaw County are $66,058 for men and $46,386 for women, a difference of 29.8%. Men with an educational attainment of graduate degree enjoy the highest average annual earnings of $106,262, while those with less than high school education earn the least with $27,959. Women with an educational attainment of graduate degree earn the most with the average annual earnings of $70,459, while those with less than high school education have the smallest earnings of $14,201.
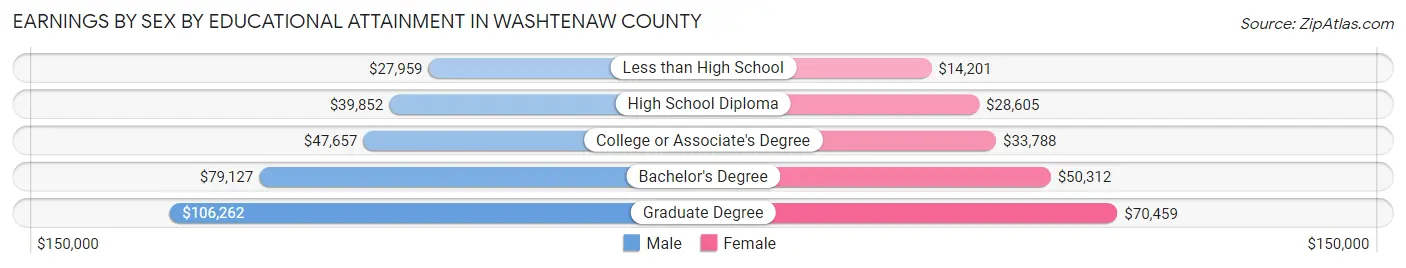
| Educational Attainment | Male Income | Female Income |
| Less than High School | $27,959 | $14,201 |
| High School Diploma | $39,852 | $28,605 |
| College or Associate's Degree | $47,657 | $33,788 |
| Bachelor's Degree | $79,127 | $50,312 |
| Graduate Degree | $106,262 | $70,459 |
| Total | $66,058 | $46,386 |
Family Income in Washtenaw County
Family Income Brackets in Washtenaw County
According to the Washtenaw County family income data, there are 19,541 families falling into the $200,000+ income range, which is the most common income bracket and makes up 23.2% of all families. Conversely, the $10,000 to $14,999 income bracket is the least frequent group with only 1,432 families (1.7%) belonging to this category.
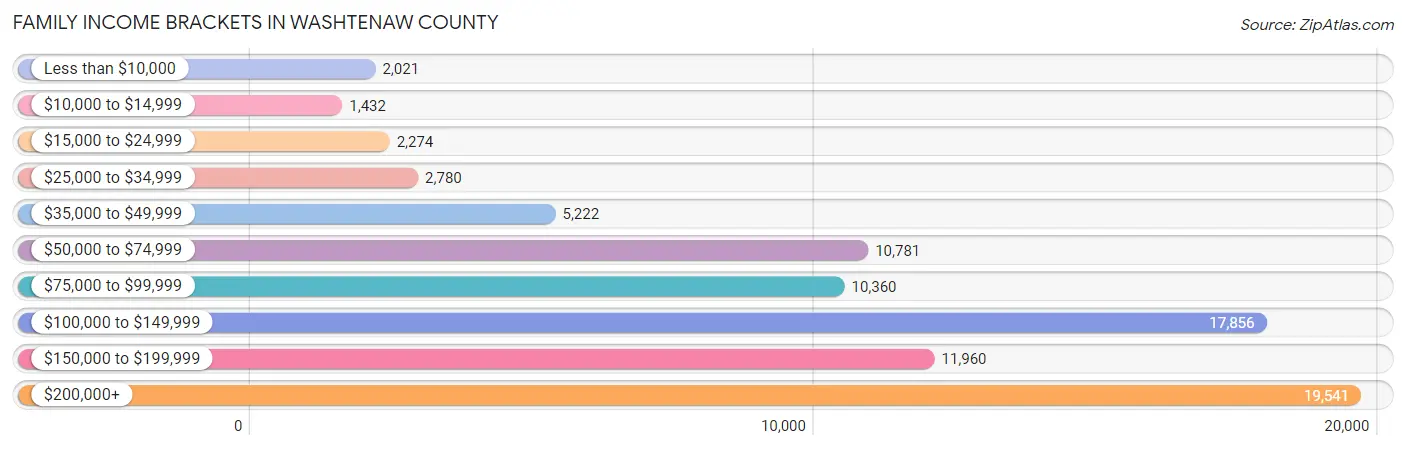
| Income Bracket | # Families | % Families |
| Less than $10,000 | 2,021 | 2.4% |
| $10,000 to $14,999 | 1,432 | 1.7% |
| $15,000 to $24,999 | 2,274 | 2.7% |
| $25,000 to $34,999 | 2,780 | 3.3% |
| $35,000 to $49,999 | 5,222 | 6.2% |
| $50,000 to $74,999 | 10,781 | 12.8% |
| $75,000 to $99,999 | 10,360 | 12.3% |
| $100,000 to $149,999 | 17,856 | 21.2% |
| $150,000 to $199,999 | 11,960 | 14.2% |
| $200,000+ | 19,541 | 23.2% |
Family Income by Famaliy Size in Washtenaw County
4-person families (15,143 | 18.0%) account for the highest median family income in Washtenaw County with $148,319 per family, while 2-person families (42,025 | 49.9%) have the highest median income of $51,362 per family member.
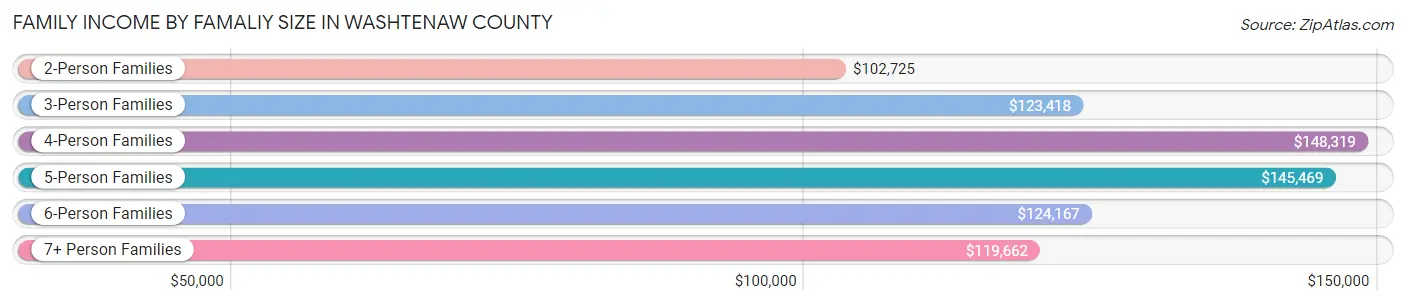
| Income Bracket | # Families | Median Income |
| 2-Person Families | 42,025 (49.9%) | $102,725 |
| 3-Person Families | 18,945 (22.5%) | $123,418 |
| 4-Person Families | 15,143 (18.0%) | $148,319 |
| 5-Person Families | 5,321 (6.3%) | $145,469 |
| 6-Person Families | 1,998 (2.4%) | $124,167 |
| 7+ Person Families | 796 (0.9%) | $119,662 |
| Total | 84,228 (100.0%) | $118,144 |
Family Income by Number of Earners in Washtenaw County
The median family income in Washtenaw County is $118,144, with families comprising 3+ earners (8,972) having the highest median family income of $167,096, while families with no earners (11,059) have the lowest median family income of $75,454, accounting for 10.6% and 13.1% of families, respectively.
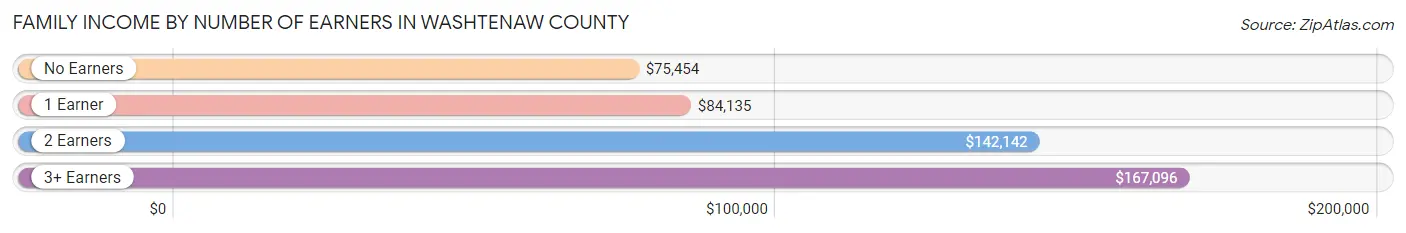
| Number of Earners | # Families | Median Income |
| No Earners | 11,059 (13.1%) | $75,454 |
| 1 Earner | 25,033 (29.7%) | $84,135 |
| 2 Earners | 39,164 (46.5%) | $142,142 |
| 3+ Earners | 8,972 (10.6%) | $167,096 |
| Total | 84,228 (100.0%) | $118,144 |
Household Income in Washtenaw County
Household Income Brackets in Washtenaw County
With 25,280 households falling in the category, the $100,000 to $149,999 income range is the most frequent in Washtenaw County, accounting for 17.0% of all households. In contrast, only 4,759 households (3.2%) fall into the $10,000 to $14,999 income bracket, making it the least populous group.
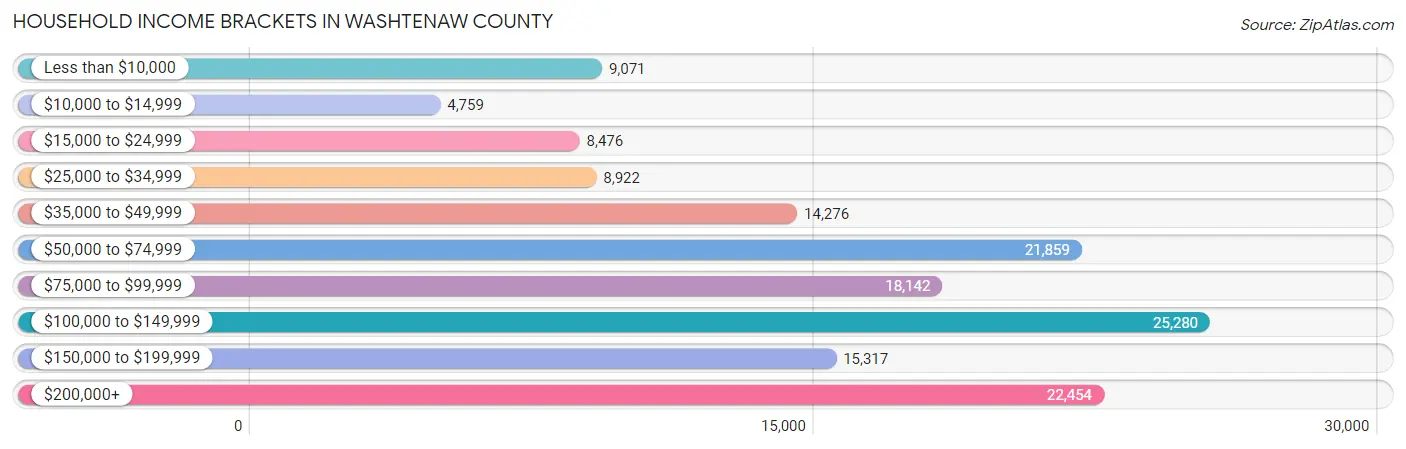
| Income Bracket | # Households | % Households |
| Less than $10,000 | 9,071 | 6.1% |
| $10,000 to $14,999 | 4,759 | 3.2% |
| $15,000 to $24,999 | 8,476 | 5.7% |
| $25,000 to $34,999 | 8,922 | 6.0% |
| $35,000 to $49,999 | 14,276 | 9.6% |
| $50,000 to $74,999 | 21,859 | 14.7% |
| $75,000 to $99,999 | 18,142 | 12.2% |
| $100,000 to $149,999 | 25,280 | 17.0% |
| $150,000 to $199,999 | 15,317 | 10.3% |
| $200,000+ | 22,454 | 15.1% |
Household Income by Householder Age in Washtenaw County
The median household income in Washtenaw County is $84,245, with the highest median household income of $113,968 found in the 45 to 64 years age bracket for the primary householder. A total of 48,676 households (32.7%) fall into this category. Meanwhile, the 15 to 24 years age bracket for the primary householder has the lowest median household income of $32,121, with 16,756 households (11.3%) in this group.
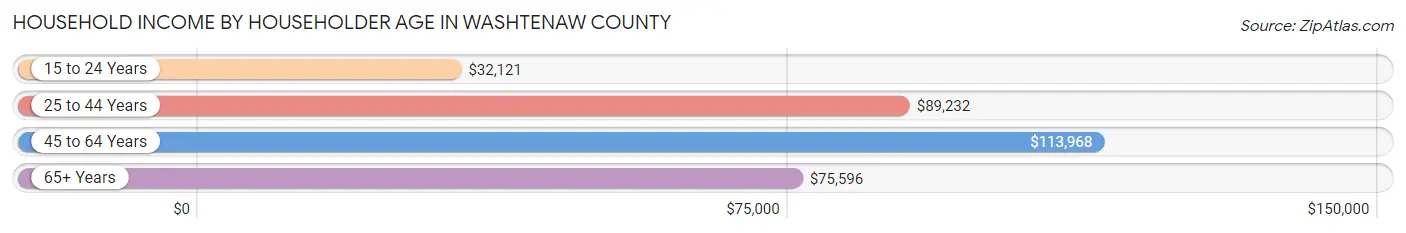
| Income Bracket | # Households | Median Income |
| 15 to 24 Years | 16,756 (11.3%) | $32,121 |
| 25 to 44 Years | 49,240 (33.1%) | $89,232 |
| 45 to 64 Years | 48,676 (32.7%) | $113,968 |
| 65+ Years | 34,032 (22.9%) | $75,596 |
| Total | 148,704 (100.0%) | $84,245 |
Poverty in Washtenaw County
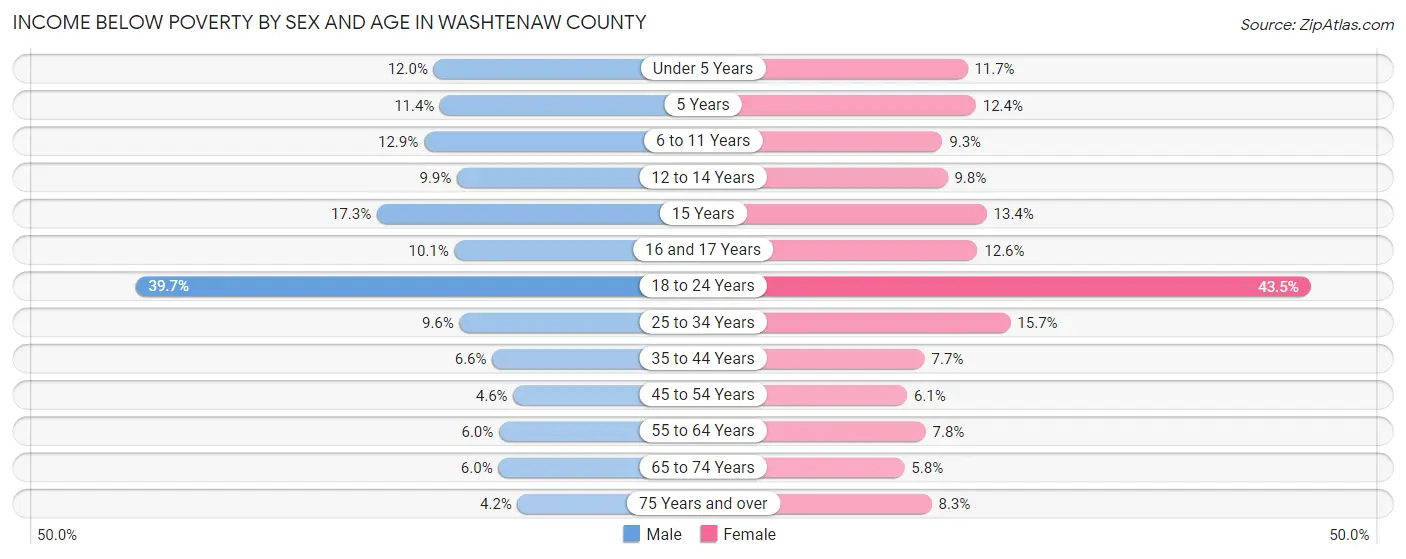
Income Below Poverty by Sex and Age in Washtenaw County
With 13.1% poverty level for males and 14.5% for females among the residents of Washtenaw County, 18 to 24 year old males and 18 to 24 year old females are the most vulnerable to poverty, with 11,498 males (39.7%) and 11,609 females (43.5%) in their respective age groups living below the poverty level.
| Age Bracket | Male | Female |
| Under 5 Years | 1,040 (12.0%) | 987 (11.7%) |
| 5 Years | 205 (11.4%) | 189 (12.4%) |
| 6 to 11 Years | 1,477 (12.9%) | 1,016 (9.3%) |
| 12 to 14 Years | 599 (9.9%) | 575 (9.8%) |
| 15 Years | 370 (17.3%) | 256 (13.4%) |
| 16 and 17 Years | 419 (10.1%) | 513 (12.6%) |
| 18 to 24 Years | 11,498 (39.7%) | 11,609 (43.5%) |
| 25 to 34 Years | 2,527 (9.6%) | 3,726 (15.7%) |
| 35 to 44 Years | 1,423 (6.6%) | 1,567 (7.7%) |
| 45 to 54 Years | 953 (4.6%) | 1,249 (6.0%) |
| 55 to 64 Years | 1,210 (6.0%) | 1,645 (7.8%) |
| 65 to 74 Years | 919 (6.0%) | 1,000 (5.8%) |
| 75 Years and over | 375 (4.2%) | 1,011 (8.3%) |
| Total | 23,015 (13.1%) | 25,343 (14.5%) |
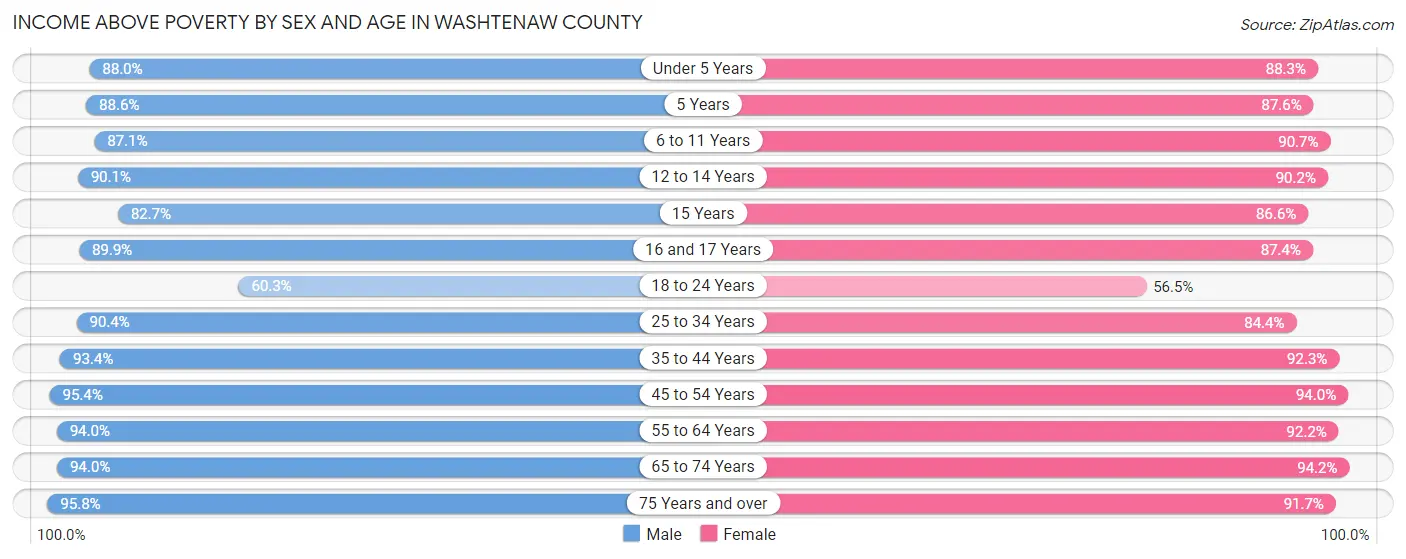
Income Above Poverty by Sex and Age in Washtenaw County
According to the poverty statistics in Washtenaw County, males aged 75 years and over and females aged 65 to 74 years are the age groups that are most secure financially, with 95.8% of males and 94.2% of females in these age groups living above the poverty line.
| Age Bracket | Male | Female |
| Under 5 Years | 7,607 (88.0%) | 7,478 (88.3%) |
| 5 Years | 1,589 (88.6%) | 1,330 (87.6%) |
| 6 to 11 Years | 9,945 (87.1%) | 9,876 (90.7%) |
| 12 to 14 Years | 5,473 (90.1%) | 5,285 (90.2%) |
| 15 Years | 1,770 (82.7%) | 1,649 (86.6%) |
| 16 and 17 Years | 3,734 (89.9%) | 3,565 (87.4%) |
| 18 to 24 Years | 17,467 (60.3%) | 15,079 (56.5%) |
| 25 to 34 Years | 23,717 (90.4%) | 20,076 (84.4%) |
| 35 to 44 Years | 20,160 (93.4%) | 18,806 (92.3%) |
| 45 to 54 Years | 19,633 (95.4%) | 19,406 (94.0%) |
| 55 to 64 Years | 19,098 (94.0%) | 19,497 (92.2%) |
| 65 to 74 Years | 14,349 (94.0%) | 16,219 (94.2%) |
| 75 Years and over | 8,465 (95.8%) | 11,121 (91.7%) |
| Total | 153,007 (86.9%) | 149,387 (85.5%) |
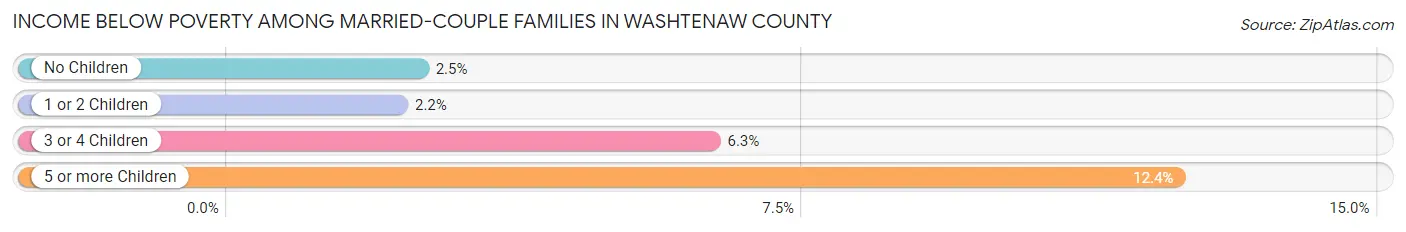
Income Below Poverty Among Married-Couple Families in Washtenaw County
The poverty statistics for married-couple families in Washtenaw County show that 2.7% or 1,808 of the total 66,231 families live below the poverty line. Families with 5 or more children have the highest poverty rate of 12.4%, comprising of 47 families. On the other hand, families with 1 or 2 children have the lowest poverty rate of 2.2%, which includes 473 families.
| Children | Above Poverty | Below Poverty |
| No Children | 38,953 (97.5%) | 996 (2.5%) |
| 1 or 2 Children | 20,794 (97.8%) | 473 (2.2%) |
| 3 or 4 Children | 4,343 (93.7%) | 292 (6.3%) |
| 5 or more Children | 333 (87.6%) | 47 (12.4%) |
| Total | 64,423 (97.3%) | 1,808 (2.7%) |
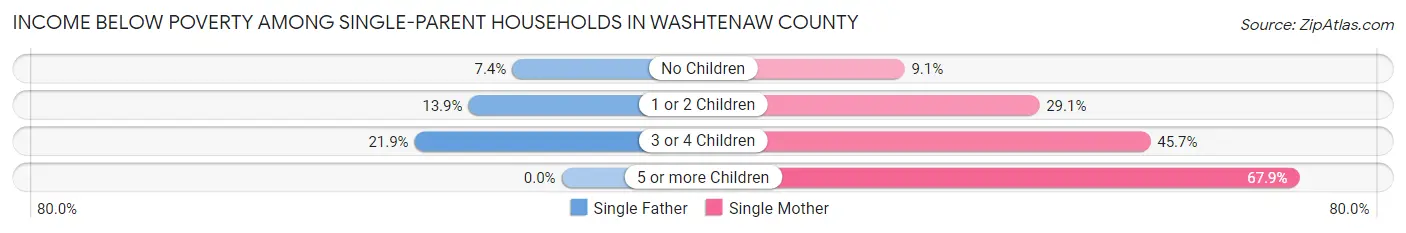
Income Below Poverty Among Single-Parent Households in Washtenaw County
According to the poverty data in Washtenaw County, 11.1% or 601 single-father households and 22.4% or 2,814 single-mother households are living below the poverty line. Among single-father households, those with 3 or 4 children have the highest poverty rate, with 62 households (21.9%) experiencing poverty. Likewise, among single-mother households, those with 5 or more children have the highest poverty rate, with 110 households (67.9%) falling below the poverty line.
| Children | Single Father | Single Mother |
| No Children | 197 (7.4%) | 476 (9.1%) |
| 1 or 2 Children | 342 (13.9%) | 1,825 (29.1%) |
| 3 or 4 Children | 62 (21.9%) | 403 (45.7%) |
| 5 or more Children | 0 (0.0%) | 110 (67.9%) |
| Total | 601 (11.1%) | 2,814 (22.4%) |
Income Below Poverty Among Married-Couple vs Single-Parent Households in Washtenaw County
The poverty data for Washtenaw County shows that 1,808 of the married-couple family households (2.7%) and 3,415 of the single-parent households (19.0%) are living below the poverty level. Within the married-couple family households, those with 5 or more children have the highest poverty rate, with 47 households (12.4%) falling below the poverty line. Among the single-parent households, those with 5 or more children have the highest poverty rate, with 110 household (62.9%) living below poverty.
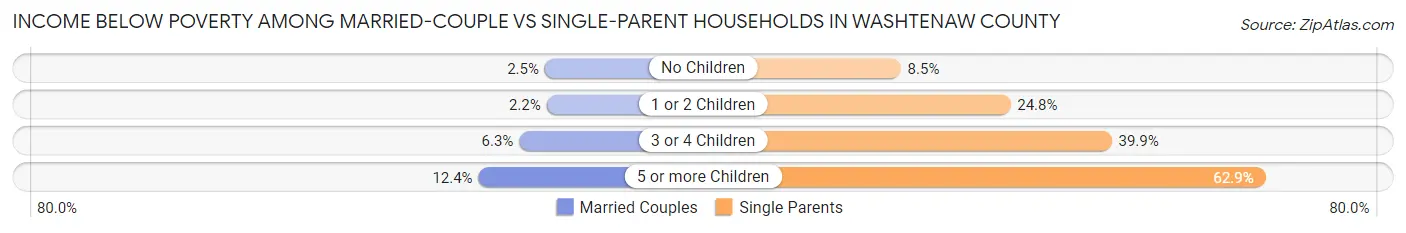
| Children | Married-Couple Families | Single-Parent Households |
| No Children | 996 (2.5%) | 673 (8.5%) |
| 1 or 2 Children | 473 (2.2%) | 2,167 (24.8%) |
| 3 or 4 Children | 292 (6.3%) | 465 (39.9%) |
| 5 or more Children | 47 (12.4%) | 110 (62.9%) |
| Total | 1,808 (2.7%) | 3,415 (19.0%) |
Employment Characteristics in Washtenaw County
Employment by Class of Employer in Washtenaw County
Among the 184,417 employed individuals in Washtenaw County, private company employees (106,272 | 57.6%), not-for-profit organizations (26,515 | 14.4%), and state government employees (24,161 | 13.1%) make up the most common classes of employment.
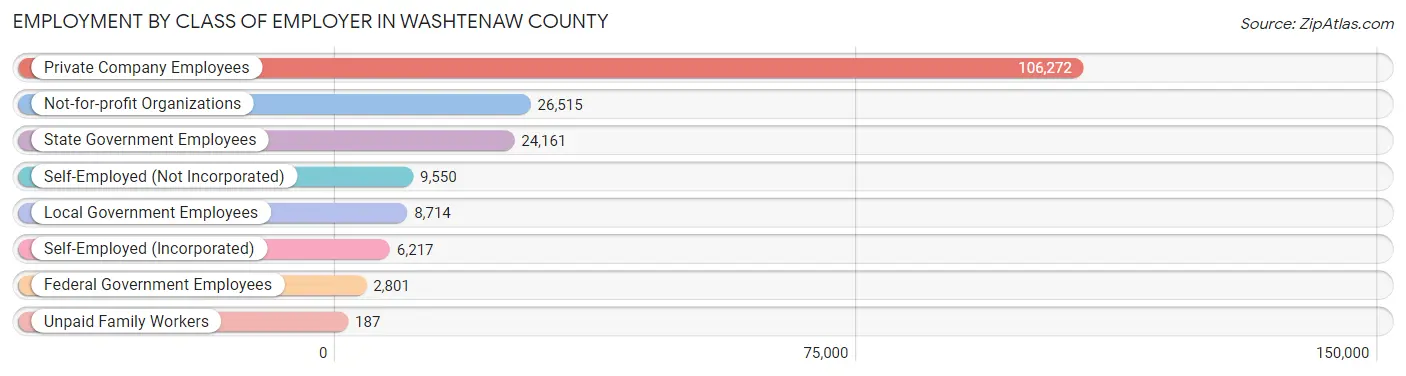
| Employer Class | # Employees | % Employees |
| Private Company Employees | 106,272 | 57.6% |
| Self-Employed (Incorporated) | 6,217 | 3.4% |
| Self-Employed (Not Incorporated) | 9,550 | 5.2% |
| Not-for-profit Organizations | 26,515 | 14.4% |
| Local Government Employees | 8,714 | 4.7% |
| State Government Employees | 24,161 | 13.1% |
| Federal Government Employees | 2,801 | 1.5% |
| Unpaid Family Workers | 187 | 0.1% |
| Total | 184,417 | 100.0% |
Employment Status by Age in Washtenaw County
According to the labor force statistics for Washtenaw County, out of the total population over 16 years of age (311,081), 63.7% or 198,159 individuals are in the labor force, with 4.7% or 9,313 of them unemployed. The age group with the highest labor force participation rate is 35 to 44 years, with 84.6% or 36,723 individuals in the labor force. Within the labor force, the 16 to 19 years age range has the highest percentage of unemployed individuals, with 14.1% or 1,564 of them being unemployed.
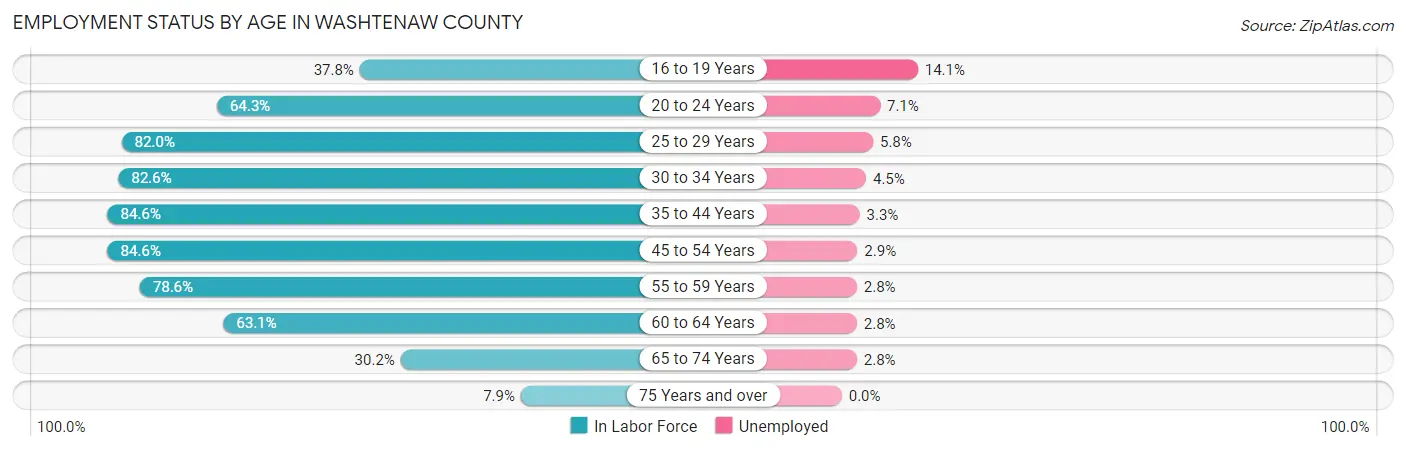
| Age Bracket | In Labor Force | Unemployed |
| 16 to 19 Years | 11,090 (37.8%) | 1,564 (14.1%) |
| 20 to 24 Years | 30,436 (64.3%) | 2,161 (7.1%) |
| 25 to 29 Years | 23,393 (82.0%) | 1,357 (5.8%) |
| 30 to 34 Years | 19,736 (82.6%) | 888 (4.5%) |
| 35 to 44 Years | 36,723 (84.6%) | 1,212 (3.3%) |
| 45 to 54 Years | 35,548 (84.6%) | 1,031 (2.9%) |
| 55 to 59 Years | 16,112 (78.6%) | 451 (2.8%) |
| 60 to 64 Years | 13,493 (63.1%) | 378 (2.8%) |
| 65 to 74 Years | 9,947 (30.2%) | 279 (2.8%) |
| 75 Years and over | 1,717 (7.9%) | 0 (0.0%) |
| Total | 198,159 (63.7%) | 9,313 (4.7%) |
Employment Status by Educational Attainment in Washtenaw County
According to labor force statistics for Washtenaw County, 80.7% of individuals (145,043) out of the total population between 25 and 64 years of age (179,731) are in the labor force, with 3.6% or 5,222 of them being unemployed. The group with the highest labor force participation rate are those with the educational attainment of bachelor's degree or higher, with 85.9% or 91,904 individuals in the labor force. Within the labor force, individuals with less than high school education have the highest percentage of unemployment, with 15.4% or 594 of them being unemployed.
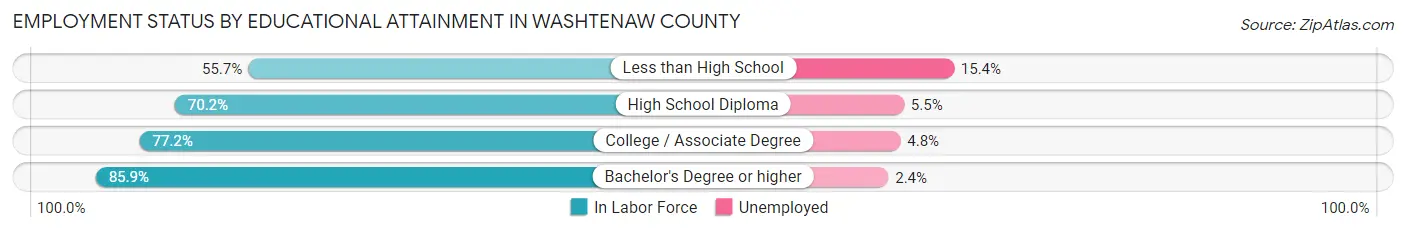
| Educational Attainment | In Labor Force | Unemployed |
| Less than High School | 3,856 (55.7%) | 1,066 (15.4%) |
| High School Diploma | 16,378 (70.2%) | 1,283 (5.5%) |
| College / Associate Degree | 32,800 (77.2%) | 2,039 (4.8%) |
| Bachelor's Degree or higher | 91,904 (85.9%) | 2,568 (2.4%) |
| Total | 145,043 (80.7%) | 6,470 (3.6%) |
Employment Occupations by Sex in Washtenaw County
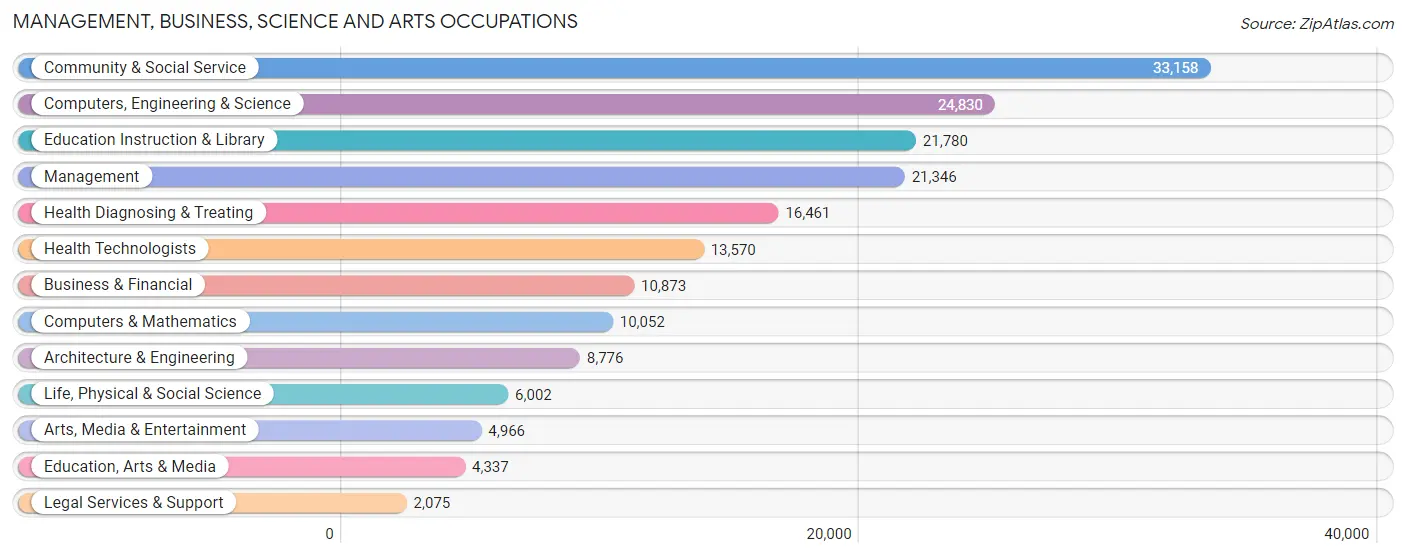
Management, Business, Science and Arts Occupations
The most common Management, Business, Science and Arts occupations in Washtenaw County are Community & Social Service (33,158 | 17.6%), Computers, Engineering & Science (24,830 | 13.2%), Education Instruction & Library (21,780 | 11.5%), Management (21,346 | 11.3%), and Health Diagnosing & Treating (16,461 | 8.7%).
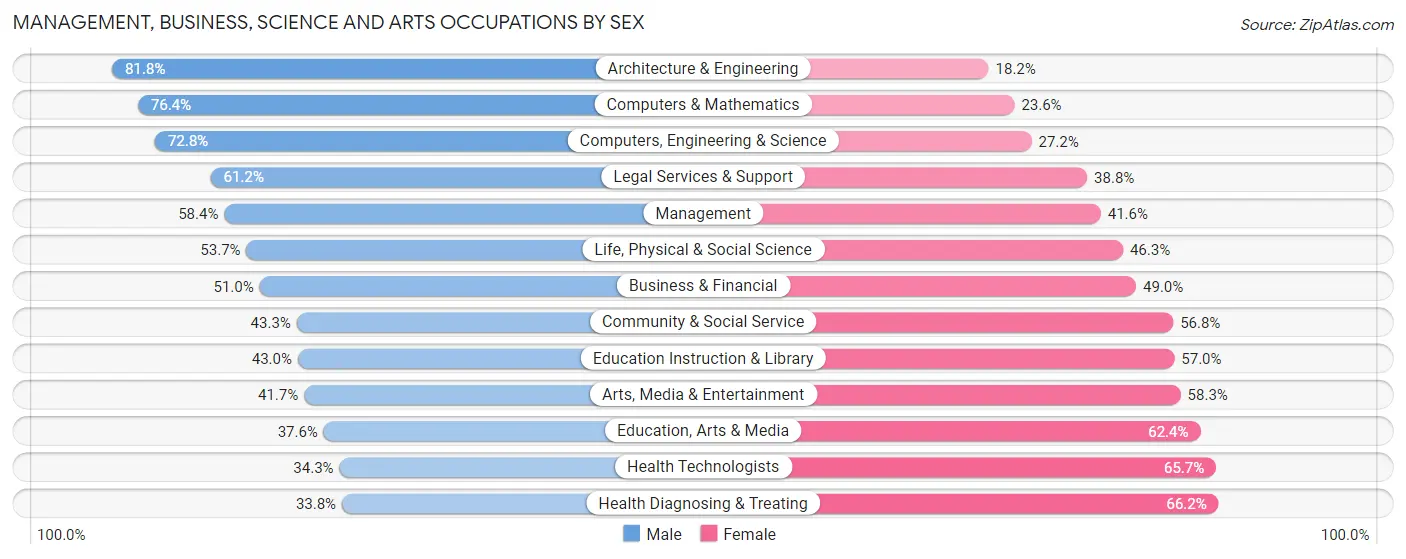
Management, Business, Science and Arts Occupations by Sex
Within the Management, Business, Science and Arts occupations in Washtenaw County, the most male-oriented occupations are Architecture & Engineering (81.8%), Computers & Mathematics (76.4%), and Computers, Engineering & Science (72.8%), while the most female-oriented occupations are Health Diagnosing & Treating (66.2%), Health Technologists (65.7%), and Education, Arts & Media (62.4%).
| Occupation | Male | Female |
| Management | 12,458 (58.4%) | 8,888 (41.6%) |
| Business & Financial | 5,544 (51.0%) | 5,329 (49.0%) |
| Computers, Engineering & Science | 18,077 (72.8%) | 6,753 (27.2%) |
| Computers & Mathematics | 7,677 (76.4%) | 2,375 (23.6%) |
| Architecture & Engineering | 7,175 (81.8%) | 1,601 (18.2%) |
| Life, Physical & Social Science | 3,225 (53.7%) | 2,777 (46.3%) |
| Community & Social Service | 14,340 (43.2%) | 18,818 (56.8%) |
| Education, Arts & Media | 1,631 (37.6%) | 2,706 (62.4%) |
| Legal Services & Support | 1,270 (61.2%) | 805 (38.8%) |
| Education Instruction & Library | 9,368 (43.0%) | 12,412 (57.0%) |
| Arts, Media & Entertainment | 2,071 (41.7%) | 2,895 (58.3%) |
| Health Diagnosing & Treating | 5,563 (33.8%) | 10,898 (66.2%) |
| Health Technologists | 4,659 (34.3%) | 8,911 (65.7%) |
| Total (Category) | 55,982 (52.5%) | 50,686 (47.5%) |
| Total (Overall) | 99,055 (52.5%) | 89,620 (47.5%) |
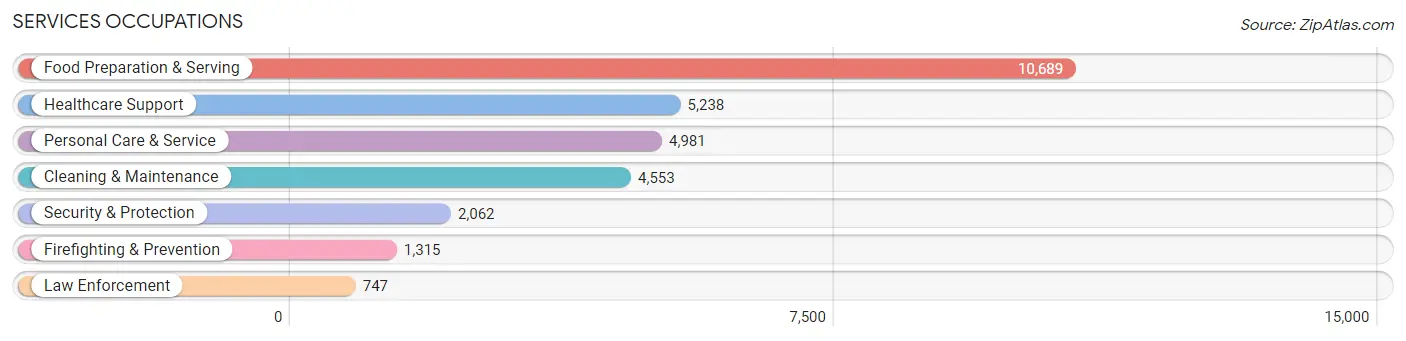
Services Occupations
The most common Services occupations in Washtenaw County are Food Preparation & Serving (10,689 | 5.7%), Healthcare Support (5,238 | 2.8%), Personal Care & Service (4,981 | 2.6%), Cleaning & Maintenance (4,553 | 2.4%), and Security & Protection (2,062 | 1.1%).
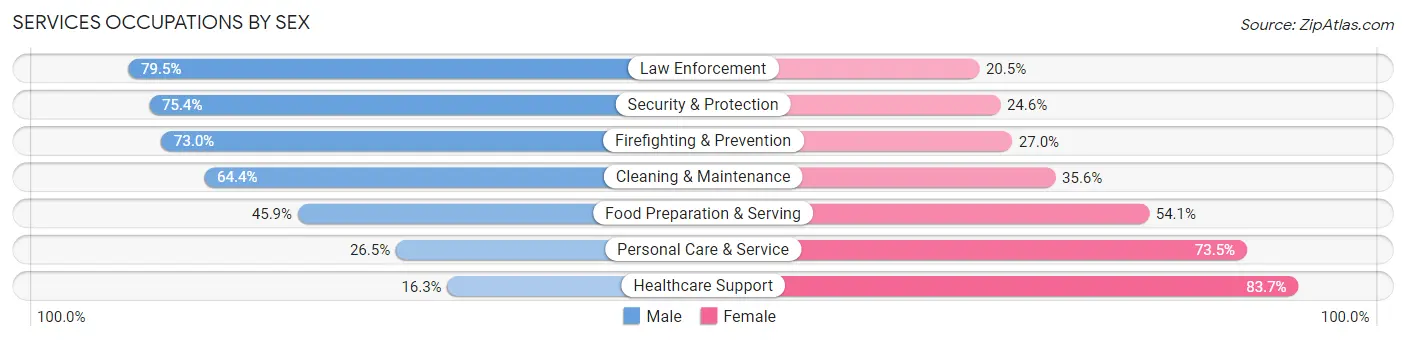
Services Occupations by Sex
Within the Services occupations in Washtenaw County, the most male-oriented occupations are Law Enforcement (79.5%), Security & Protection (75.4%), and Firefighting & Prevention (73.0%), while the most female-oriented occupations are Healthcare Support (83.7%), Personal Care & Service (73.5%), and Food Preparation & Serving (54.1%).
| Occupation | Male | Female |
| Healthcare Support | 852 (16.3%) | 4,386 (83.7%) |
| Security & Protection | 1,554 (75.4%) | 508 (24.6%) |
| Firefighting & Prevention | 960 (73.0%) | 355 (27.0%) |
| Law Enforcement | 594 (79.5%) | 153 (20.5%) |
| Food Preparation & Serving | 4,905 (45.9%) | 5,784 (54.1%) |
| Cleaning & Maintenance | 2,934 (64.4%) | 1,619 (35.6%) |
| Personal Care & Service | 1,318 (26.5%) | 3,663 (73.5%) |
| Total (Category) | 11,563 (42.0%) | 15,960 (58.0%) |
| Total (Overall) | 99,055 (52.5%) | 89,620 (47.5%) |
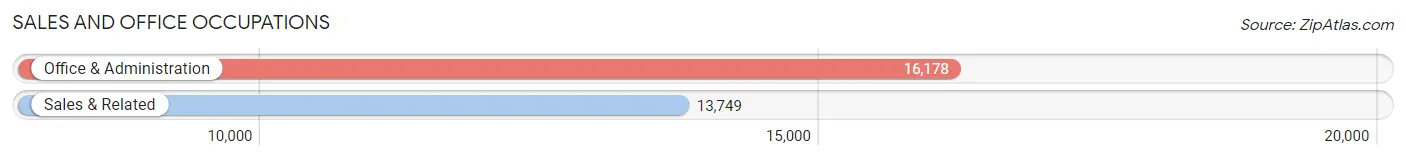
Sales and Office Occupations
The most common Sales and Office occupations in Washtenaw County are Office & Administration (16,178 | 8.6%), and Sales & Related (13,749 | 7.3%).
Sales and Office Occupations by Sex
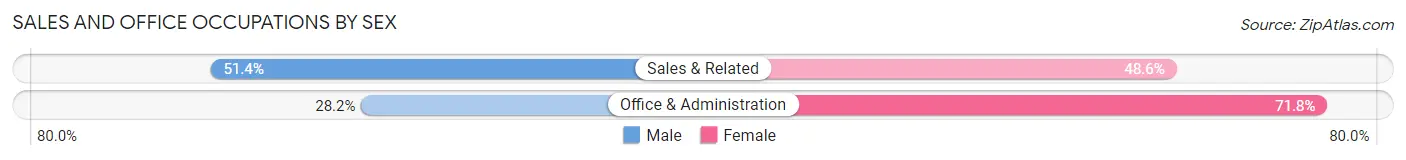
| Occupation | Male | Female |
| Sales & Related | 7,066 (51.4%) | 6,683 (48.6%) |
| Office & Administration | 4,563 (28.2%) | 11,615 (71.8%) |
| Total (Category) | 11,629 (38.9%) | 18,298 (61.1%) |
| Total (Overall) | 99,055 (52.5%) | 89,620 (47.5%) |
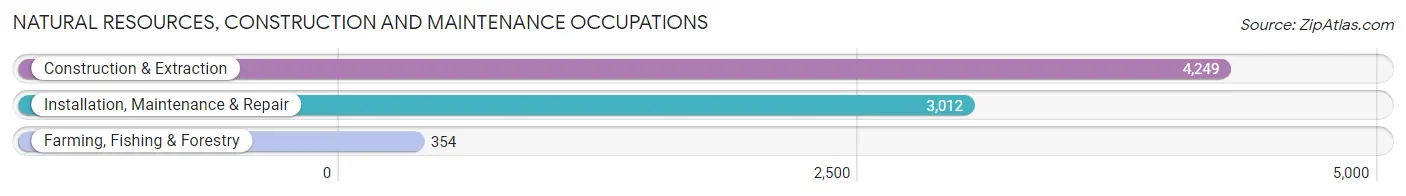
Natural Resources, Construction and Maintenance Occupations
The most common Natural Resources, Construction and Maintenance occupations in Washtenaw County are Construction & Extraction (4,249 | 2.2%), Installation, Maintenance & Repair (3,012 | 1.6%), and Farming, Fishing & Forestry (354 | 0.2%).
Natural Resources, Construction and Maintenance Occupations by Sex
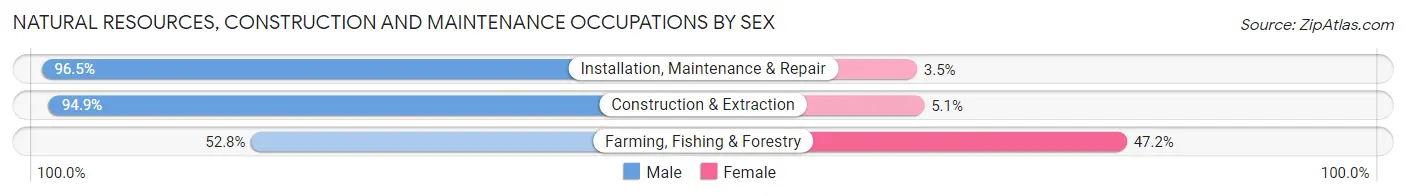
| Occupation | Male | Female |
| Farming, Fishing & Forestry | 187 (52.8%) | 167 (47.2%) |
| Construction & Extraction | 4,034 (94.9%) | 215 (5.1%) |
| Installation, Maintenance & Repair | 2,906 (96.5%) | 106 (3.5%) |
| Total (Category) | 7,127 (93.6%) | 488 (6.4%) |
| Total (Overall) | 99,055 (52.5%) | 89,620 (47.5%) |
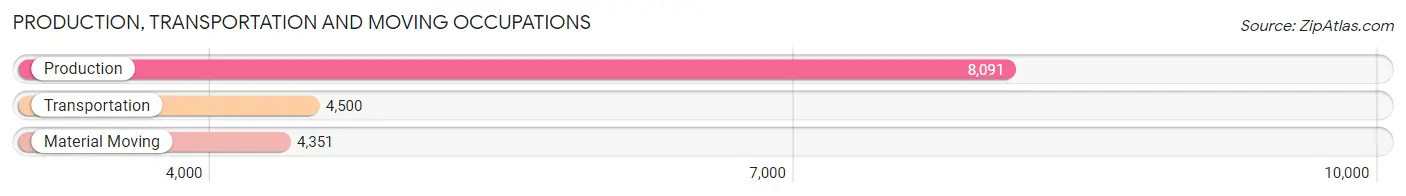
Production, Transportation and Moving Occupations
The most common Production, Transportation and Moving occupations in Washtenaw County are Production (8,091 | 4.3%), Transportation (4,500 | 2.4%), and Material Moving (4,351 | 2.3%).
Production, Transportation and Moving Occupations by Sex
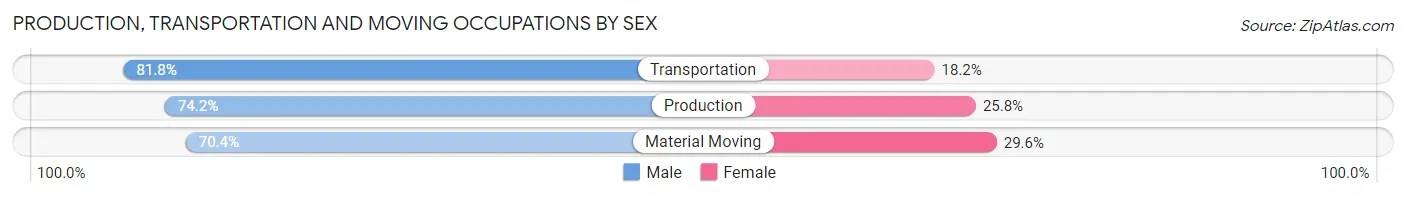
| Occupation | Male | Female |
| Production | 6,007 (74.2%) | 2,084 (25.8%) |
| Transportation | 3,683 (81.8%) | 817 (18.2%) |
| Material Moving | 3,064 (70.4%) | 1,287 (29.6%) |
| Total (Category) | 12,754 (75.3%) | 4,188 (24.7%) |
| Total (Overall) | 99,055 (52.5%) | 89,620 (47.5%) |
Employment Industries by Sex in Washtenaw County
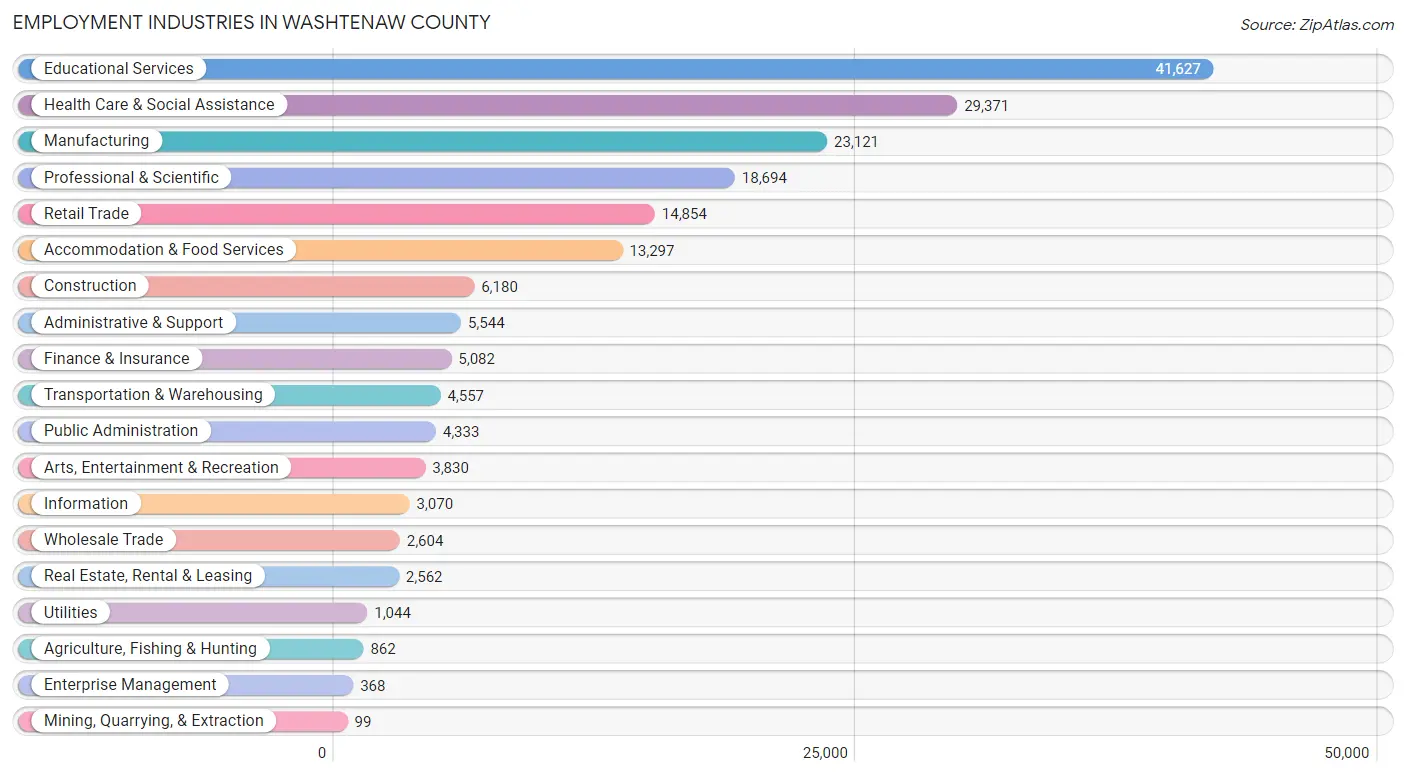
Employment Industries in Washtenaw County
The major employment industries in Washtenaw County include Educational Services (41,627 | 22.1%), Health Care & Social Assistance (29,371 | 15.6%), Manufacturing (23,121 | 12.2%), Professional & Scientific (18,694 | 9.9%), and Retail Trade (14,854 | 7.9%).
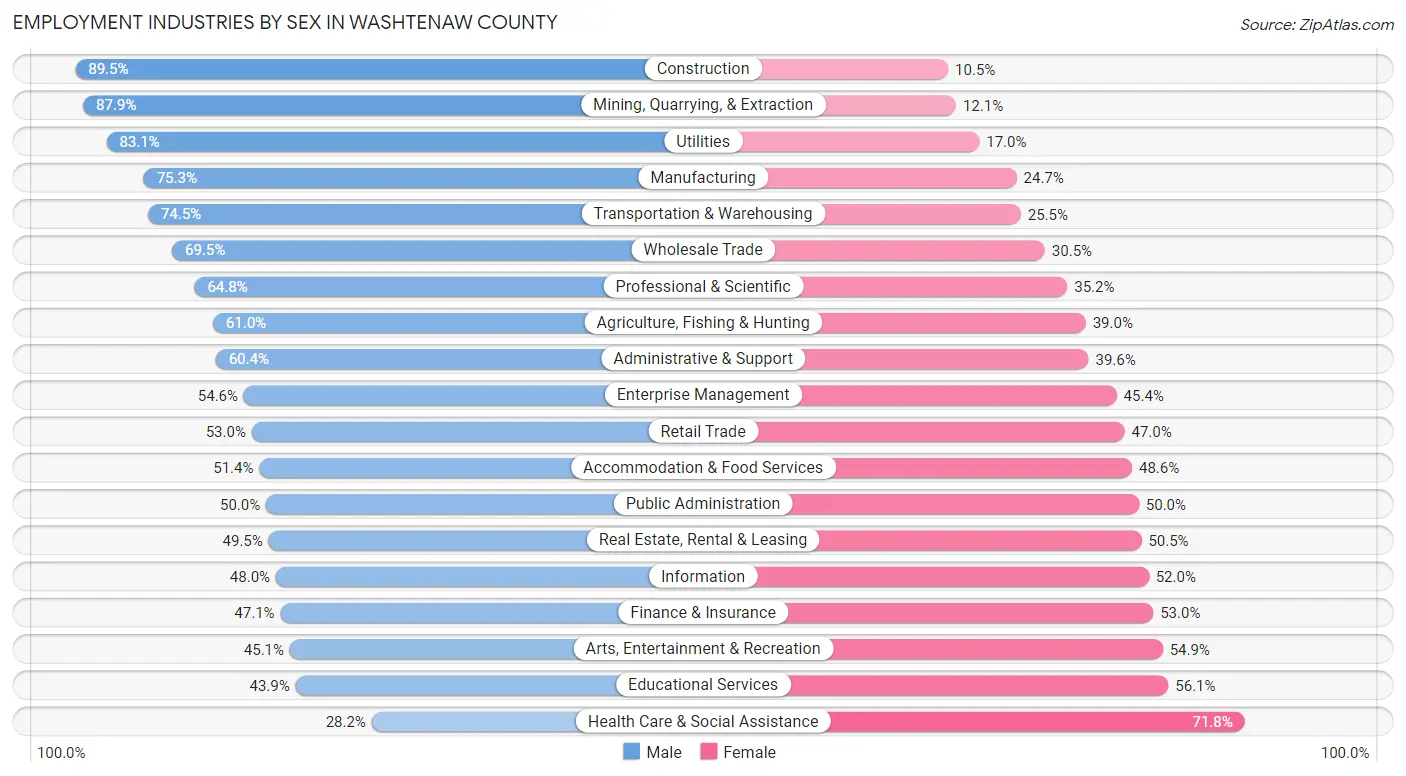
Employment Industries by Sex in Washtenaw County
The Washtenaw County industries that see more men than women are Construction (89.5%), Mining, Quarrying, & Extraction (87.9%), and Utilities (83.1%), whereas the industries that tend to have a higher number of women are Health Care & Social Assistance (71.8%), Educational Services (56.1%), and Arts, Entertainment & Recreation (54.9%).
| Industry | Male | Female |
| Agriculture, Fishing & Hunting | 526 (61.0%) | 336 (39.0%) |
| Mining, Quarrying, & Extraction | 87 (87.9%) | 12 (12.1%) |
| Construction | 5,531 (89.5%) | 649 (10.5%) |
| Manufacturing | 17,417 (75.3%) | 5,704 (24.7%) |
| Wholesale Trade | 1,809 (69.5%) | 795 (30.5%) |
| Retail Trade | 7,871 (53.0%) | 6,983 (47.0%) |
| Transportation & Warehousing | 3,393 (74.5%) | 1,164 (25.5%) |
| Utilities | 867 (83.1%) | 177 (17.0%) |
| Information | 1,473 (48.0%) | 1,597 (52.0%) |
| Finance & Insurance | 2,391 (47.0%) | 2,691 (52.9%) |
| Real Estate, Rental & Leasing | 1,268 (49.5%) | 1,294 (50.5%) |
| Professional & Scientific | 12,121 (64.8%) | 6,573 (35.2%) |
| Enterprise Management | 201 (54.6%) | 167 (45.4%) |
| Administrative & Support | 3,351 (60.4%) | 2,193 (39.6%) |
| Educational Services | 18,283 (43.9%) | 23,344 (56.1%) |
| Health Care & Social Assistance | 8,271 (28.2%) | 21,100 (71.8%) |
| Arts, Entertainment & Recreation | 1,727 (45.1%) | 2,103 (54.9%) |
| Accommodation & Food Services | 6,838 (51.4%) | 6,459 (48.6%) |
| Public Administration | 2,168 (50.0%) | 2,165 (50.0%) |
| Total | 99,055 (52.5%) | 89,620 (47.5%) |
Education in Washtenaw County
School Enrollment in Washtenaw County
The most common levels of schooling among the 124,245 students in Washtenaw County are college / undergraduate (49,467 | 39.8%), graduate / professional (18,786 | 15.1%), and high school (17,528 | 14.1%).
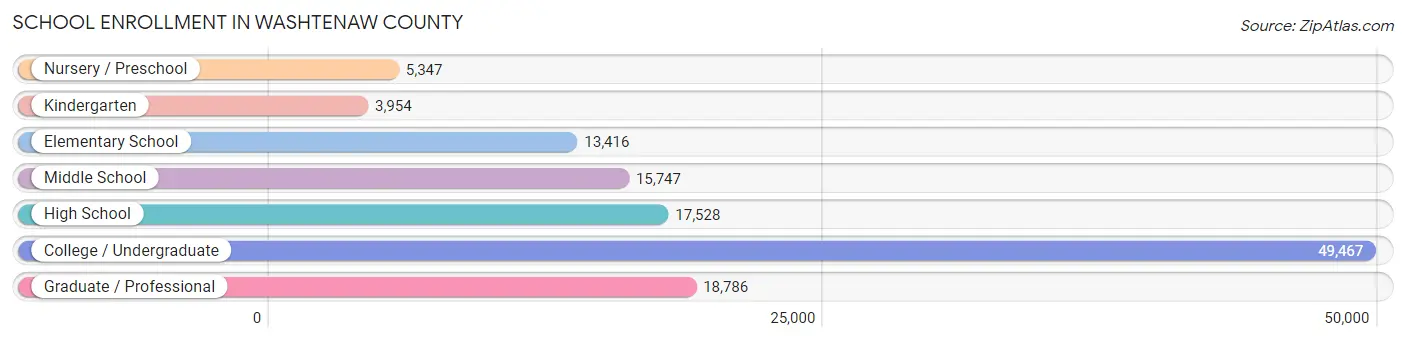
| School Level | # Students | % Students |
| Nursery / Preschool | 5,347 | 4.3% |
| Kindergarten | 3,954 | 3.2% |
| Elementary School | 13,416 | 10.8% |
| Middle School | 15,747 | 12.7% |
| High School | 17,528 | 14.1% |
| College / Undergraduate | 49,467 | 39.8% |
| Graduate / Professional | 18,786 | 15.1% |
| Total | 124,245 | 100.0% |
School Enrollment by Age by Funding Source in Washtenaw County
Out of a total of 124,245 students who are enrolled in schools in Washtenaw County, 12,549 (10.1%) attend a private institution, while the remaining 111,696 (89.9%) are enrolled in public schools. The age group of 3 to 4 year olds has the highest likelihood of being enrolled in private schools, with 2,338 (52.8% in the age bracket) enrolled. Conversely, the age group of 20 to 24 year olds has the lowest likelihood of being enrolled in a private school, with 32,597 (95.9% in the age bracket) attending a public institution.
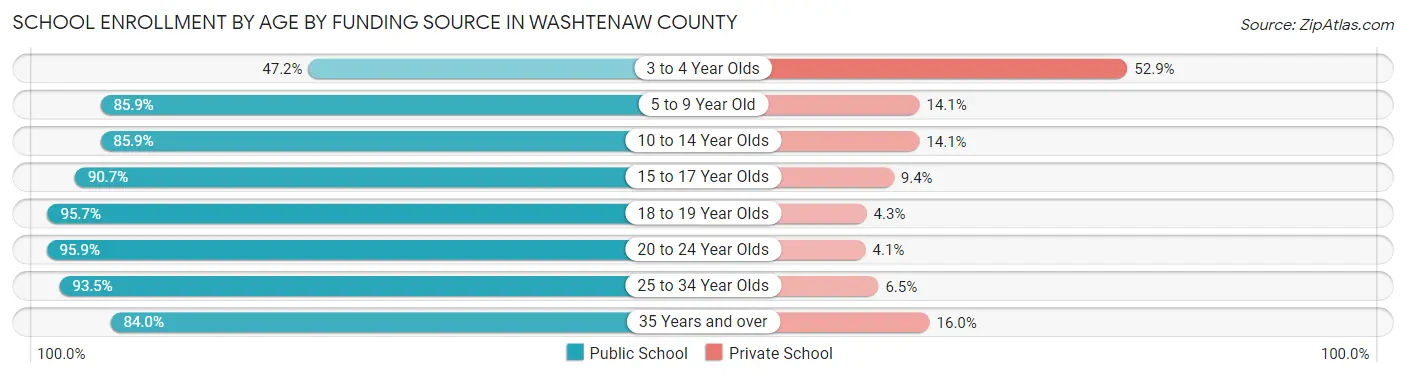
| Age Bracket | Public School | Private School |
| 3 to 4 Year Olds | 2,086 (47.1%) | 2,338 (52.8%) |
| 5 to 9 Year Old | 14,304 (85.9%) | 2,353 (14.1%) |
| 10 to 14 Year Olds | 16,905 (85.9%) | 2,778 (14.1%) |
| 15 to 17 Year Olds | 11,006 (90.6%) | 1,135 (9.3%) |
| 18 to 19 Year Olds | 17,775 (95.7%) | 794 (4.3%) |
| 20 to 24 Year Olds | 32,597 (95.9%) | 1,388 (4.1%) |
| 25 to 34 Year Olds | 12,132 (93.5%) | 840 (6.5%) |
| 35 Years and over | 4,883 (84.0%) | 931 (16.0%) |
| Total | 111,696 (89.9%) | 12,549 (10.1%) |
Educational Attainment by Field of Study in Washtenaw County
Engineering (18,080 | 12.1%), business (17,699 | 11.8%), science & technology (14,641 | 9.8%), bio, nature & agricultural (13,332 | 8.9%), and social sciences (12,324 | 8.3%) are the most common fields of study among 149,360 individuals in Washtenaw County who have obtained a bachelor's degree or higher.
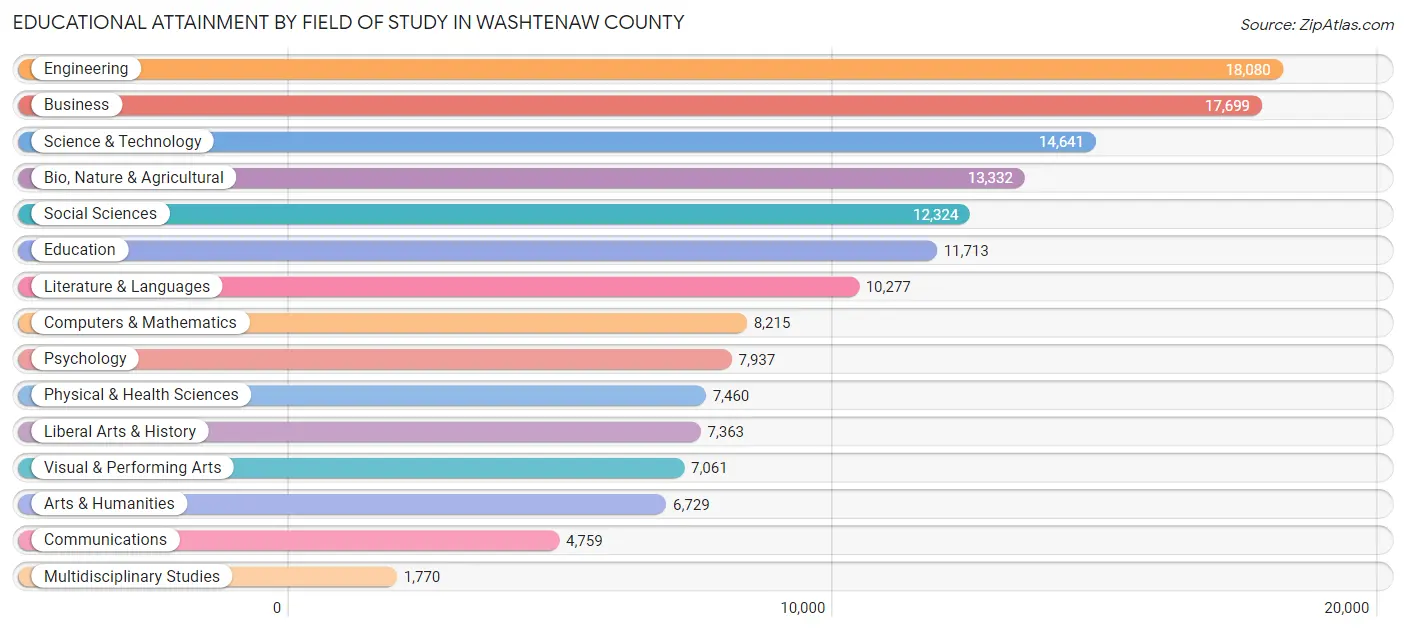
| Field of Study | # Graduates | % Graduates |
| Computers & Mathematics | 8,215 | 5.5% |
| Bio, Nature & Agricultural | 13,332 | 8.9% |
| Physical & Health Sciences | 7,460 | 5.0% |
| Psychology | 7,937 | 5.3% |
| Social Sciences | 12,324 | 8.3% |
| Engineering | 18,080 | 12.1% |
| Multidisciplinary Studies | 1,770 | 1.2% |
| Science & Technology | 14,641 | 9.8% |
| Business | 17,699 | 11.8% |
| Education | 11,713 | 7.8% |
| Literature & Languages | 10,277 | 6.9% |
| Liberal Arts & History | 7,363 | 4.9% |
| Visual & Performing Arts | 7,061 | 4.7% |
| Communications | 4,759 | 3.2% |
| Arts & Humanities | 6,729 | 4.5% |
| Total | 149,360 | 100.0% |
Transportation & Commute in Washtenaw County
Vehicle Availability by Sex in Washtenaw County
The most prevalent vehicle ownership categories in Washtenaw County are males with 2 vehicles (42,823, accounting for 45.1%) and females with 2 vehicles (35,980, making up 50.7%).
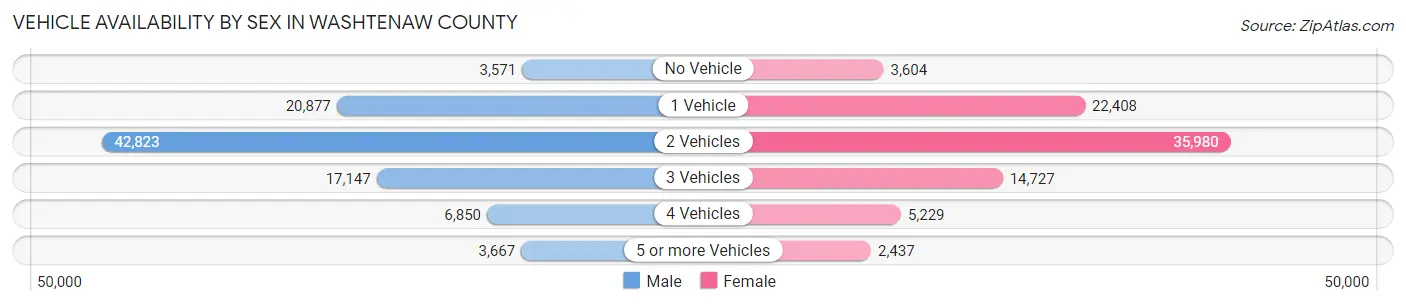
| Vehicles Available | Male | Female |
| No Vehicle | 3,571 (3.8%) | 3,604 (4.3%) |
| 1 Vehicle | 20,877 (22.0%) | 22,408 (26.6%) |
| 2 Vehicles | 42,823 (45.1%) | 35,980 (42.6%) |
| 3 Vehicles | 17,147 (18.1%) | 14,727 (17.4%) |
| 4 Vehicles | 6,850 (7.2%) | 5,229 (6.2%) |
| 5 or more Vehicles | 3,667 (3.9%) | 2,437 (2.9%) |
| Total | 94,935 (100.0%) | 84,385 (100.0%) |
Commute Time in Washtenaw County
The most frequently occuring commute durations in Washtenaw County are 15 to 19 minutes (28,016 commuters, 18.5%), 20 to 24 minutes (25,755 commuters, 17.0%), and 10 to 14 minutes (22,320 commuters, 14.7%).
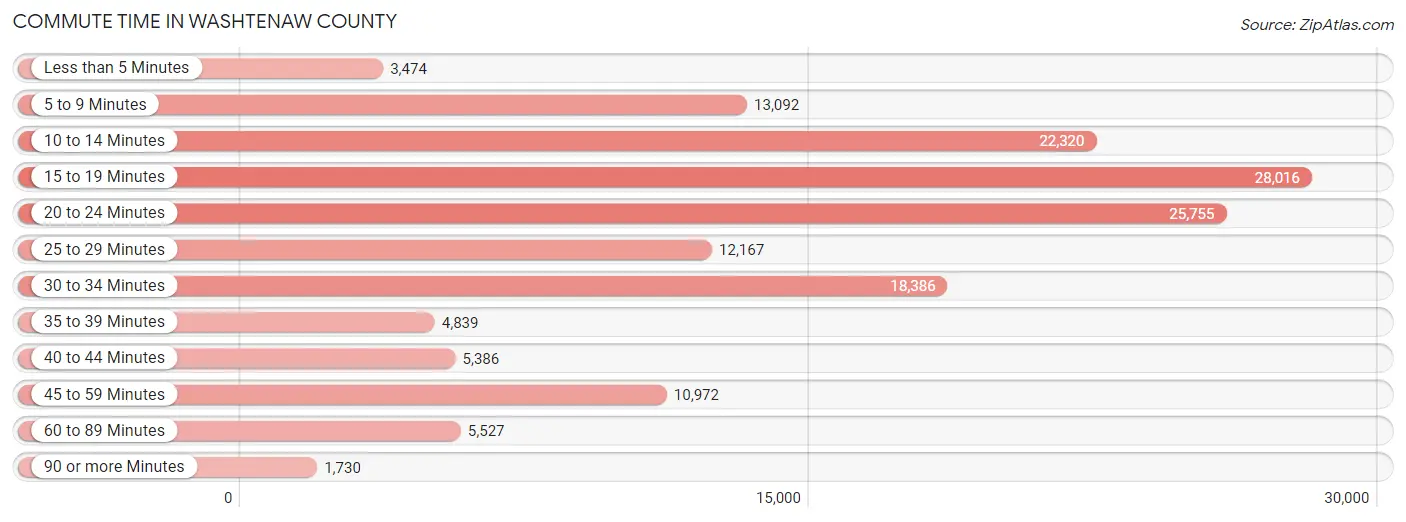
| Commute Time | # Commuters | % Commuters |
| Less than 5 Minutes | 3,474 | 2.3% |
| 5 to 9 Minutes | 13,092 | 8.6% |
| 10 to 14 Minutes | 22,320 | 14.7% |
| 15 to 19 Minutes | 28,016 | 18.5% |
| 20 to 24 Minutes | 25,755 | 17.0% |
| 25 to 29 Minutes | 12,167 | 8.0% |
| 30 to 34 Minutes | 18,386 | 12.1% |
| 35 to 39 Minutes | 4,839 | 3.2% |
| 40 to 44 Minutes | 5,386 | 3.5% |
| 45 to 59 Minutes | 10,972 | 7.2% |
| 60 to 89 Minutes | 5,527 | 3.6% |
| 90 or more Minutes | 1,730 | 1.1% |
Commute Time by Sex in Washtenaw County
The most common commute times in Washtenaw County are 15 to 19 minutes (14,807 commuters, 18.6%) for males and 20 to 24 minutes (13,784 commuters, 19.1%) for females.
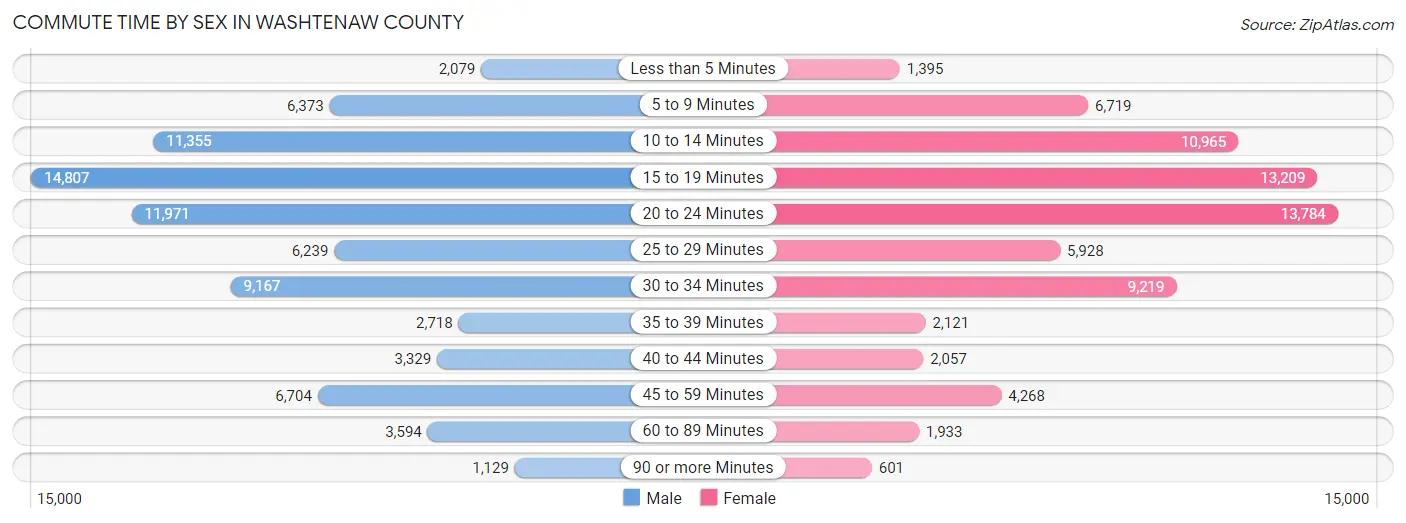
| Commute Time | Male | Female |
| Less than 5 Minutes | 2,079 (2.6%) | 1,395 (1.9%) |
| 5 to 9 Minutes | 6,373 (8.0%) | 6,719 (9.3%) |
| 10 to 14 Minutes | 11,355 (14.3%) | 10,965 (15.2%) |
| 15 to 19 Minutes | 14,807 (18.6%) | 13,209 (18.3%) |
| 20 to 24 Minutes | 11,971 (15.1%) | 13,784 (19.1%) |
| 25 to 29 Minutes | 6,239 (7.9%) | 5,928 (8.2%) |
| 30 to 34 Minutes | 9,167 (11.5%) | 9,219 (12.8%) |
| 35 to 39 Minutes | 2,718 (3.4%) | 2,121 (2.9%) |
| 40 to 44 Minutes | 3,329 (4.2%) | 2,057 (2.9%) |
| 45 to 59 Minutes | 6,704 (8.4%) | 4,268 (5.9%) |
| 60 to 89 Minutes | 3,594 (4.5%) | 1,933 (2.7%) |
| 90 or more Minutes | 1,129 (1.4%) | 601 (0.8%) |
Time of Departure to Work by Sex in Washtenaw County
The most frequent times of departure to work in Washtenaw County are 8:00 AM to 8:29 AM (10,194, 12.8%) for males and 8:00 AM to 8:29 AM (9,885, 13.7%) for females.
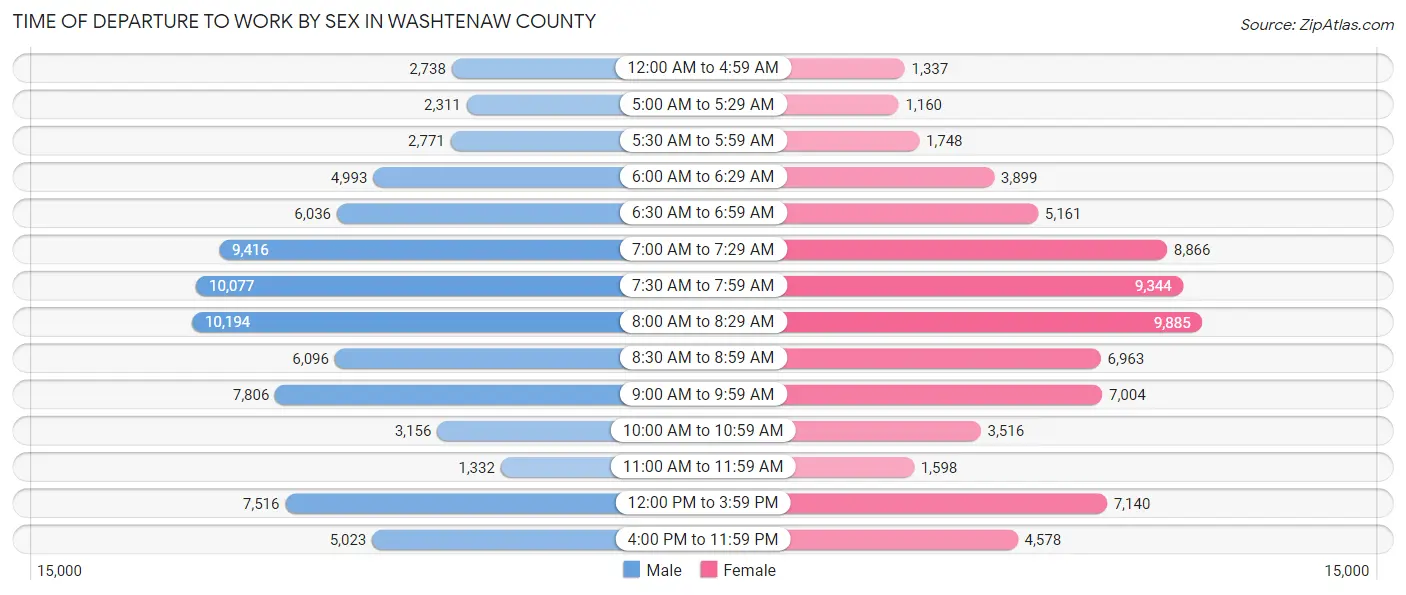
| Time of Departure | Male | Female |
| 12:00 AM to 4:59 AM | 2,738 (3.5%) | 1,337 (1.8%) |
| 5:00 AM to 5:29 AM | 2,311 (2.9%) | 1,160 (1.6%) |
| 5:30 AM to 5:59 AM | 2,771 (3.5%) | 1,748 (2.4%) |
| 6:00 AM to 6:29 AM | 4,993 (6.3%) | 3,899 (5.4%) |
| 6:30 AM to 6:59 AM | 6,036 (7.6%) | 5,161 (7.1%) |
| 7:00 AM to 7:29 AM | 9,416 (11.8%) | 8,866 (12.3%) |
| 7:30 AM to 7:59 AM | 10,077 (12.7%) | 9,344 (12.9%) |
| 8:00 AM to 8:29 AM | 10,194 (12.8%) | 9,885 (13.7%) |
| 8:30 AM to 8:59 AM | 6,096 (7.7%) | 6,963 (9.6%) |
| 9:00 AM to 9:59 AM | 7,806 (9.8%) | 7,004 (9.7%) |
| 10:00 AM to 10:59 AM | 3,156 (4.0%) | 3,516 (4.9%) |
| 11:00 AM to 11:59 AM | 1,332 (1.7%) | 1,598 (2.2%) |
| 12:00 PM to 3:59 PM | 7,516 (9.5%) | 7,140 (9.9%) |
| 4:00 PM to 11:59 PM | 5,023 (6.3%) | 4,578 (6.3%) |
| Total | 79,465 (100.0%) | 72,199 (100.0%) |
Housing Occupancy in Washtenaw County
Occupancy by Ownership in Washtenaw County
Of the total 148,704 dwellings in Washtenaw County, owner-occupied units account for 91,057 (61.2%), while renter-occupied units make up 57,647 (38.8%).
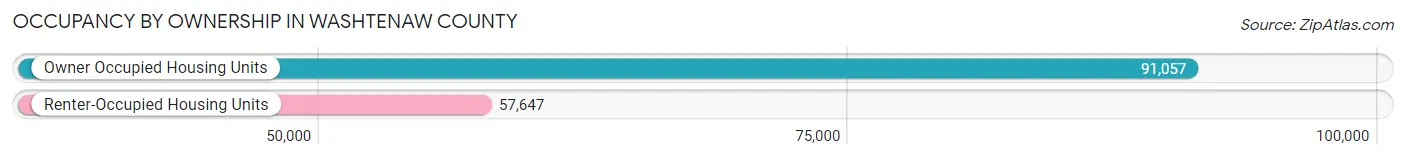
| Occupancy | # Housing Units | % Housing Units |
| Owner Occupied Housing Units | 91,057 | 61.2% |
| Renter-Occupied Housing Units | 57,647 | 38.8% |
| Total Occupied Housing Units | 148,704 | 100.0% |
Occupancy by Household Size in Washtenaw County
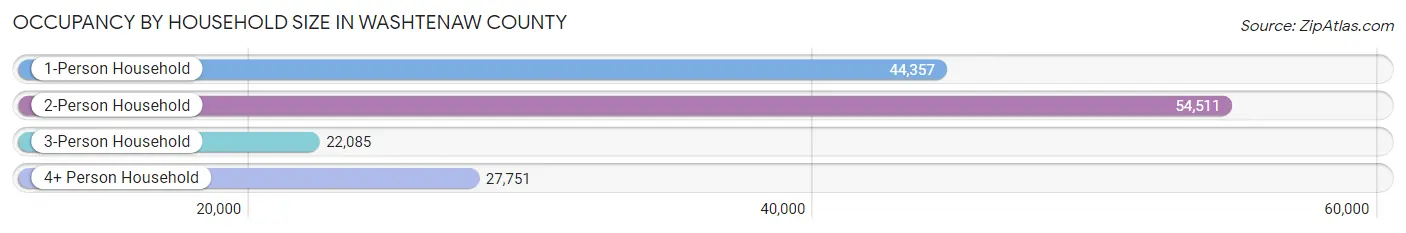
| Household Size | # Housing Units | % Housing Units |
| 1-Person Household | 44,357 | 29.8% |
| 2-Person Household | 54,511 | 36.7% |
| 3-Person Household | 22,085 | 14.8% |
| 4+ Person Household | 27,751 | 18.7% |
| Total Housing Units | 148,704 | 100.0% |
Occupancy by Ownership by Household Size in Washtenaw County
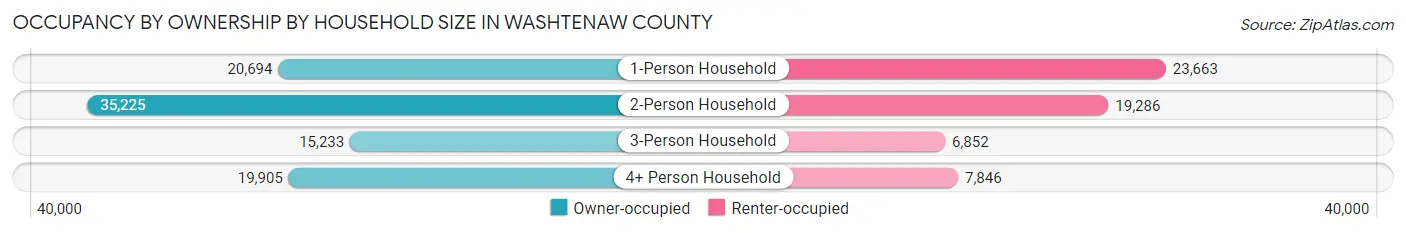
| Household Size | Owner-occupied | Renter-occupied |
| 1-Person Household | 20,694 (46.7%) | 23,663 (53.3%) |
| 2-Person Household | 35,225 (64.6%) | 19,286 (35.4%) |
| 3-Person Household | 15,233 (69.0%) | 6,852 (31.0%) |
| 4+ Person Household | 19,905 (71.7%) | 7,846 (28.3%) |
| Total Housing Units | 91,057 (61.2%) | 57,647 (38.8%) |
Occupancy by Educational Attainment in Washtenaw County
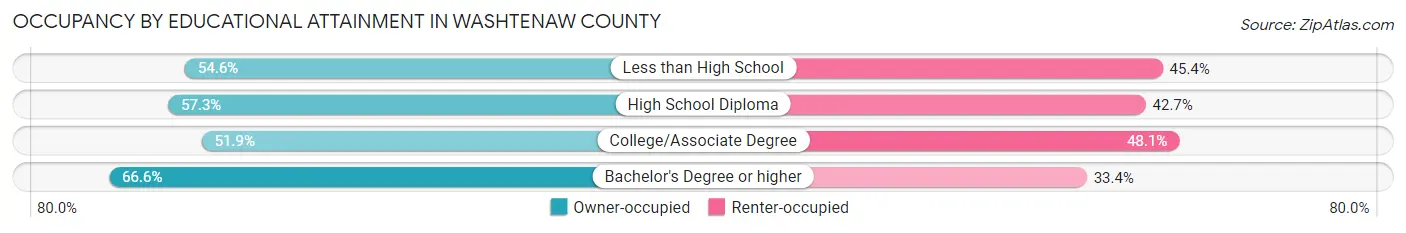
| Household Size | Owner-occupied | Renter-occupied |
| Less than High School | 2,442 (54.6%) | 2,033 (45.4%) |
| High School Diploma | 10,440 (57.3%) | 7,793 (42.7%) |
| College/Associate Degree | 20,354 (51.9%) | 18,836 (48.1%) |
| Bachelor's Degree or higher | 57,821 (66.6%) | 28,985 (33.4%) |
Occupancy by Age of Householder in Washtenaw County
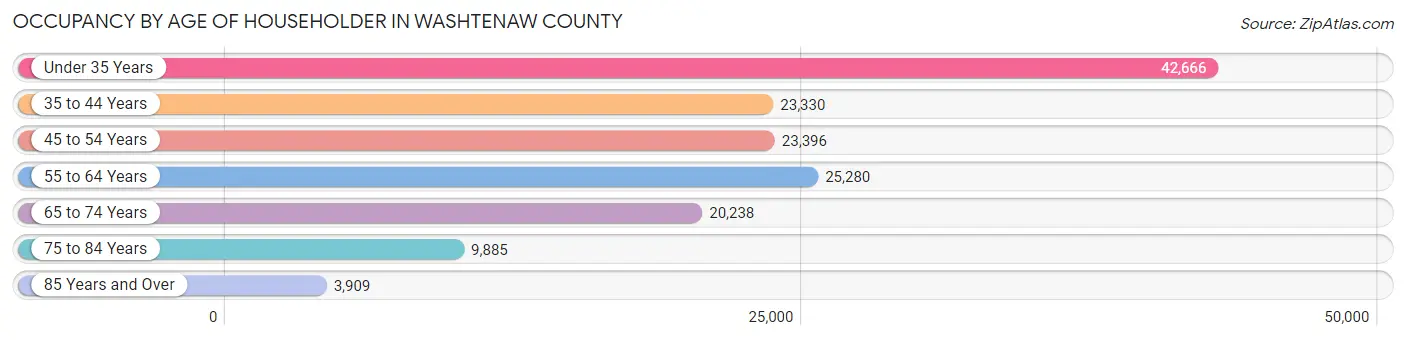
| Age Bracket | # Households | % Households |
| Under 35 Years | 42,666 | 28.7% |
| 35 to 44 Years | 23,330 | 15.7% |
| 45 to 54 Years | 23,396 | 15.7% |
| 55 to 64 Years | 25,280 | 17.0% |
| 65 to 74 Years | 20,238 | 13.6% |
| 75 to 84 Years | 9,885 | 6.7% |
| 85 Years and Over | 3,909 | 2.6% |
| Total | 148,704 | 100.0% |
Housing Finances in Washtenaw County
Median Income by Occupancy in Washtenaw County
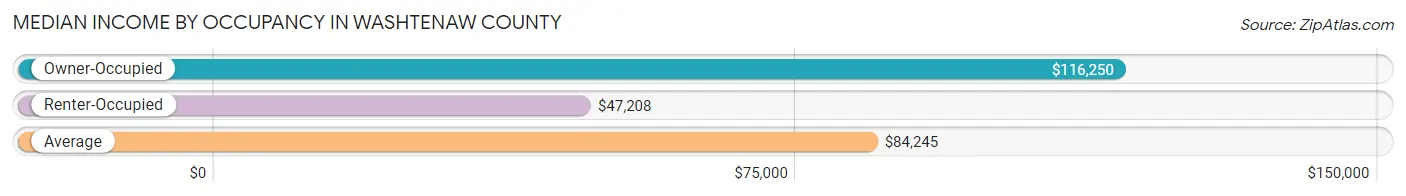
| Occupancy Type | # Households | Median Income |
| Owner-Occupied | 91,057 (61.2%) | $116,250 |
| Renter-Occupied | 57,647 (38.8%) | $47,208 |
| Average | 148,704 (100.0%) | $84,245 |
Occupancy by Householder Income Bracket in Washtenaw County
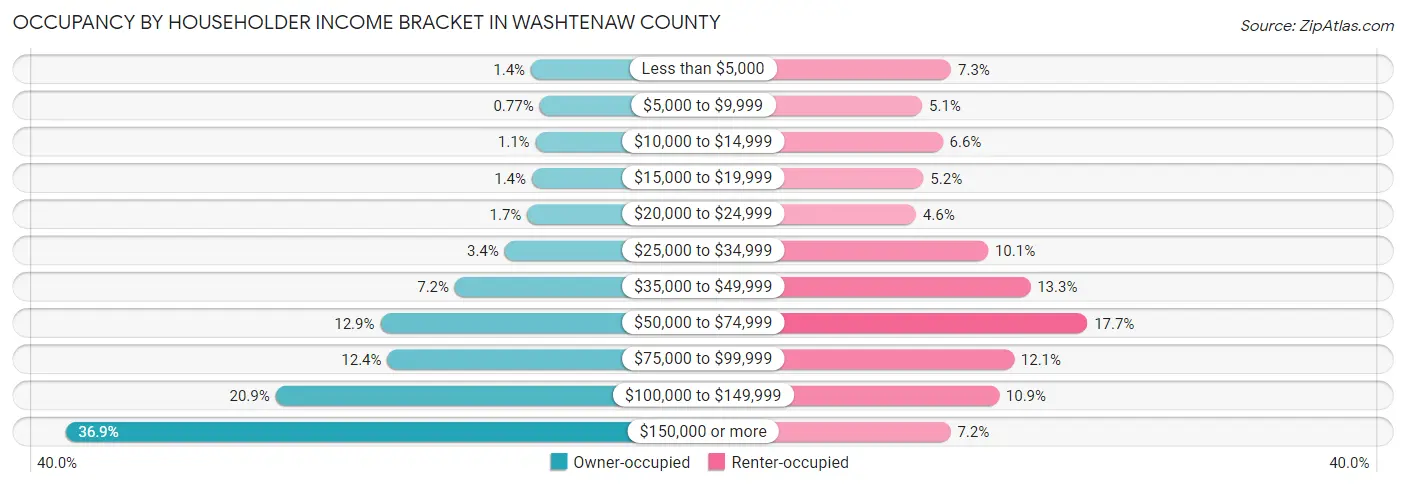
| Income Bracket | Owner-occupied | Renter-occupied |
| Less than $5,000 | 1,289 (1.4%) | 4,195 (7.3%) |
| $5,000 to $9,999 | 701 (0.8%) | 2,925 (5.1%) |
| $10,000 to $14,999 | 981 (1.1%) | 3,820 (6.6%) |
| $15,000 to $19,999 | 1,232 (1.3%) | 2,979 (5.2%) |
| $20,000 to $24,999 | 1,554 (1.7%) | 2,650 (4.6%) |
| $25,000 to $34,999 | 3,124 (3.4%) | 5,815 (10.1%) |
| $35,000 to $49,999 | 6,573 (7.2%) | 7,671 (13.3%) |
| $50,000 to $74,999 | 11,743 (12.9%) | 10,175 (17.6%) |
| $75,000 to $99,999 | 11,258 (12.4%) | 6,954 (12.1%) |
| $100,000 to $149,999 | 19,011 (20.9%) | 6,293 (10.9%) |
| $150,000 or more | 33,591 (36.9%) | 4,170 (7.2%) |
| Total | 91,057 (100.0%) | 57,647 (100.0%) |
Monthly Housing Cost Tiers in Washtenaw County
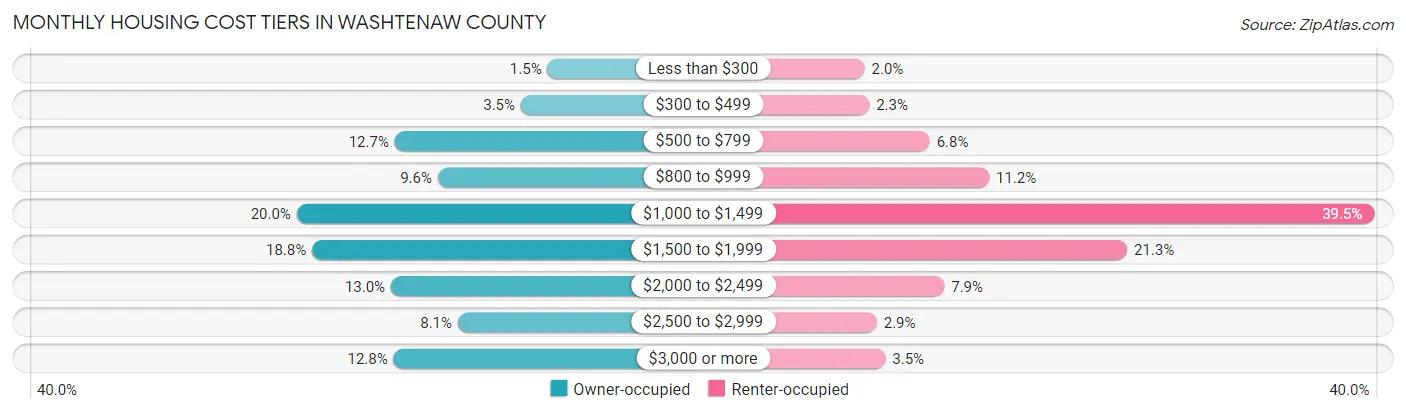
| Monthly Cost | Owner-occupied | Renter-occupied |
| Less than $300 | 1,360 (1.5%) | 1,153 (2.0%) |
| $300 to $499 | 3,146 (3.5%) | 1,350 (2.3%) |
| $500 to $799 | 11,600 (12.7%) | 3,918 (6.8%) |
| $800 to $999 | 8,716 (9.6%) | 6,438 (11.2%) |
| $1,000 to $1,499 | 18,179 (20.0%) | 22,790 (39.5%) |
| $1,500 to $1,999 | 17,150 (18.8%) | 12,294 (21.3%) |
| $2,000 to $2,499 | 11,855 (13.0%) | 4,538 (7.9%) |
| $2,500 to $2,999 | 7,368 (8.1%) | 1,670 (2.9%) |
| $3,000 or more | 11,683 (12.8%) | 2,034 (3.5%) |
| Total | 91,057 (100.0%) | 57,647 (100.0%) |
Physical Housing Characteristics in Washtenaw County
Housing Structures in Washtenaw County
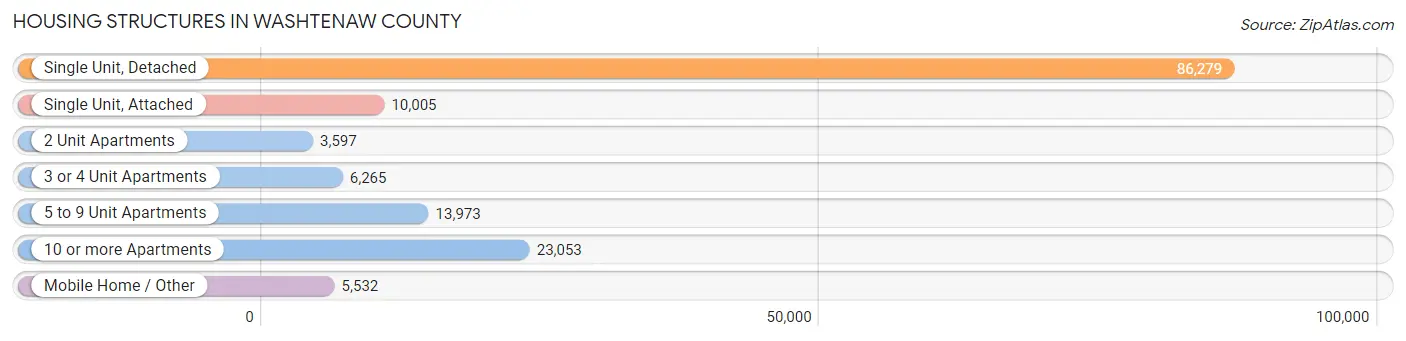
| Structure Type | # Housing Units | % Housing Units |
| Single Unit, Detached | 86,279 | 58.0% |
| Single Unit, Attached | 10,005 | 6.7% |
| 2 Unit Apartments | 3,597 | 2.4% |
| 3 or 4 Unit Apartments | 6,265 | 4.2% |
| 5 to 9 Unit Apartments | 13,973 | 9.4% |
| 10 or more Apartments | 23,053 | 15.5% |
| Mobile Home / Other | 5,532 | 3.7% |
| Total | 148,704 | 100.0% |
Housing Structures by Occupancy in Washtenaw County
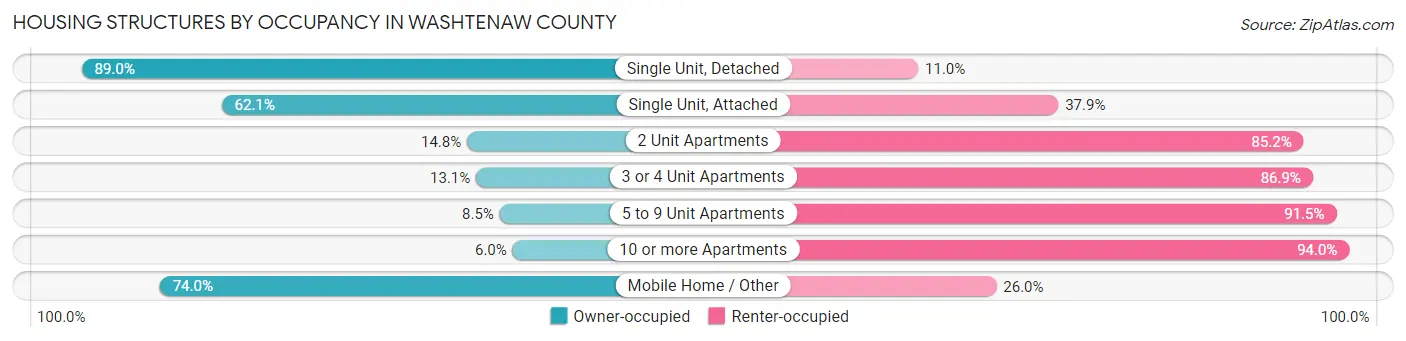
| Structure Type | Owner-occupied | Renter-occupied |
| Single Unit, Detached | 76,820 (89.0%) | 9,459 (11.0%) |
| Single Unit, Attached | 6,209 (62.1%) | 3,796 (37.9%) |
| 2 Unit Apartments | 533 (14.8%) | 3,064 (85.2%) |
| 3 or 4 Unit Apartments | 819 (13.1%) | 5,446 (86.9%) |
| 5 to 9 Unit Apartments | 1,192 (8.5%) | 12,781 (91.5%) |
| 10 or more Apartments | 1,392 (6.0%) | 21,661 (94.0%) |
| Mobile Home / Other | 4,092 (74.0%) | 1,440 (26.0%) |
| Total | 91,057 (61.2%) | 57,647 (38.8%) |
Housing Structures by Number of Rooms in Washtenaw County
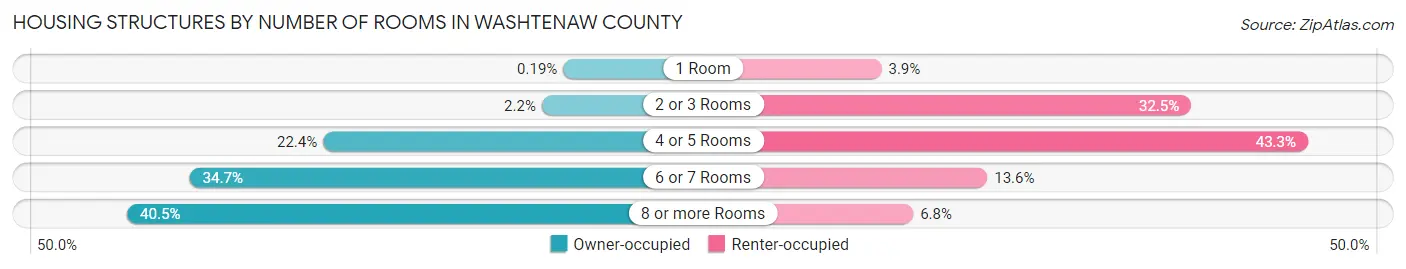
| Number of Rooms | Owner-occupied | Renter-occupied |
| 1 Room | 174 (0.2%) | 2,218 (3.8%) |
| 2 or 3 Rooms | 1,973 (2.2%) | 18,720 (32.5%) |
| 4 or 5 Rooms | 20,396 (22.4%) | 24,945 (43.3%) |
| 6 or 7 Rooms | 31,624 (34.7%) | 7,857 (13.6%) |
| 8 or more Rooms | 36,890 (40.5%) | 3,907 (6.8%) |
| Total | 91,057 (100.0%) | 57,647 (100.0%) |
Housing Structure by Heating Type in Washtenaw County
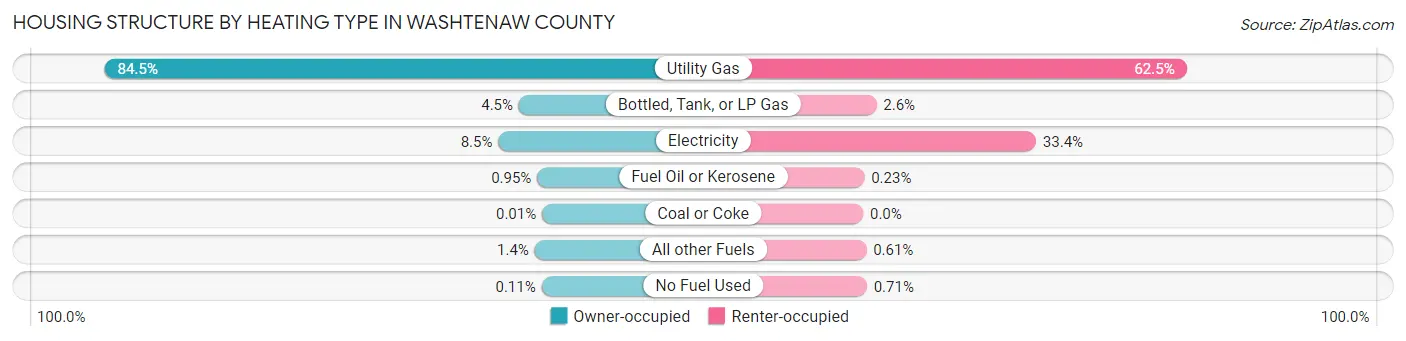
| Heating Type | Owner-occupied | Renter-occupied |
| Utility Gas | 76,981 (84.5%) | 36,023 (62.5%) |
| Bottled, Tank, or LP Gas | 4,092 (4.5%) | 1,480 (2.6%) |
| Electricity | 7,709 (8.5%) | 19,253 (33.4%) |
| Fuel Oil or Kerosene | 863 (0.9%) | 133 (0.2%) |
| Coal or Coke | 10 (0.0%) | 0 (0.0%) |
| All other Fuels | 1,305 (1.4%) | 350 (0.6%) |
| No Fuel Used | 97 (0.1%) | 408 (0.7%) |
| Total | 91,057 (100.0%) | 57,647 (100.0%) |
Household Vehicle Usage in Washtenaw County
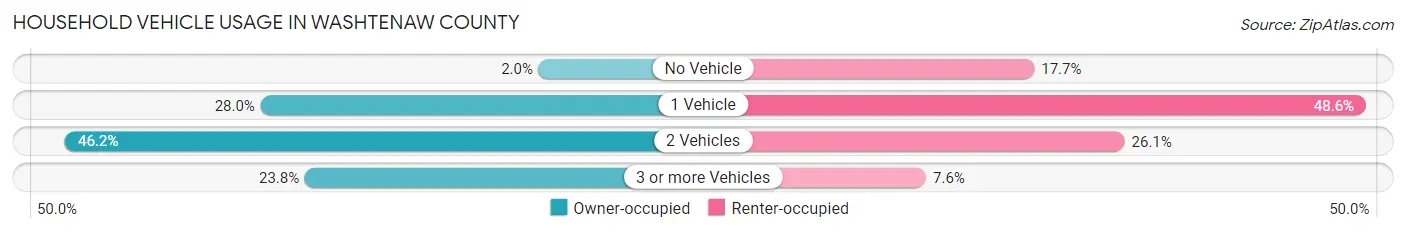
| Vehicles per Household | Owner-occupied | Renter-occupied |
| No Vehicle | 1,819 (2.0%) | 10,193 (17.7%) |
| 1 Vehicle | 25,457 (28.0%) | 28,031 (48.6%) |
| 2 Vehicles | 42,088 (46.2%) | 15,052 (26.1%) |
| 3 or more Vehicles | 21,693 (23.8%) | 4,371 (7.6%) |
| Total | 91,057 (100.0%) | 57,647 (100.0%) |
Real Estate & Mortgages in Washtenaw County
Real Estate and Mortgage Overview in Washtenaw County
| Characteristic | Without Mortgage | With Mortgage |
| Housing Units | 32,196 | 58,861 |
| Median Property Value | $318,700 | $345,000 |
| Median Household Income | $88,997 | $24,692 |
| Monthly Housing Costs | $832 | $11,202 |
| Real Estate Taxes | $5,055 | $1,779 |
Property Value by Mortgage Status in Washtenaw County
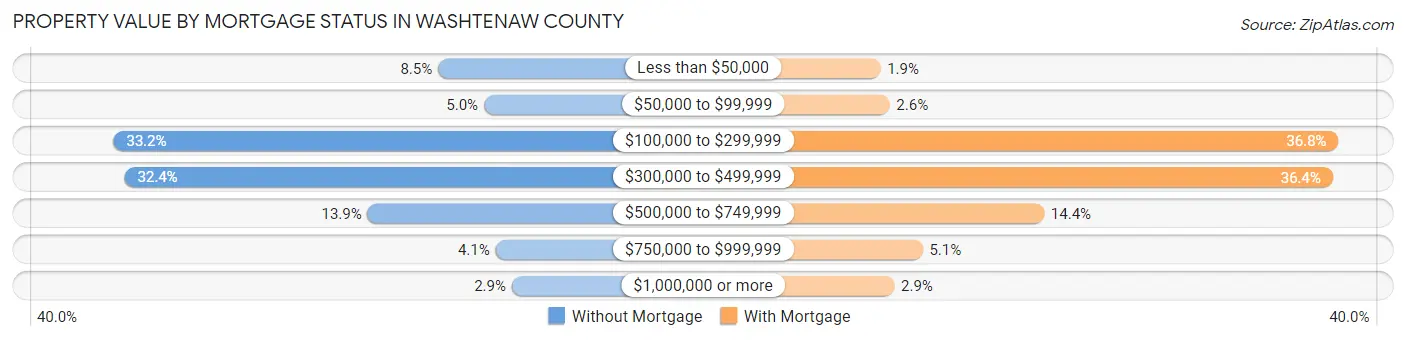
| Property Value | Without Mortgage | With Mortgage |
| Less than $50,000 | 2,736 (8.5%) | 1,106 (1.9%) |
| $50,000 to $99,999 | 1,609 (5.0%) | 1,520 (2.6%) |
| $100,000 to $299,999 | 10,701 (33.2%) | 21,657 (36.8%) |
| $300,000 to $499,999 | 10,428 (32.4%) | 21,400 (36.4%) |
| $500,000 to $749,999 | 4,466 (13.9%) | 8,445 (14.3%) |
| $750,000 to $999,999 | 1,328 (4.1%) | 3,004 (5.1%) |
| $1,000,000 or more | 928 (2.9%) | 1,729 (2.9%) |
| Total | 32,196 (100.0%) | 58,861 (100.0%) |
Household Income by Mortgage Status in Washtenaw County
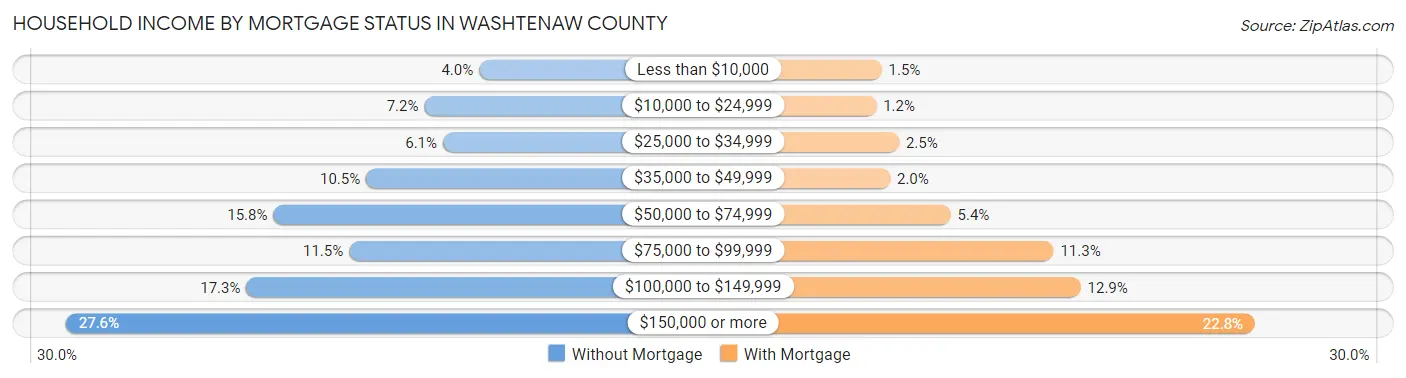
| Household Income | Without Mortgage | With Mortgage |
| Less than $10,000 | 1,297 (4.0%) | 879 (1.5%) |
| $10,000 to $24,999 | 2,306 (7.2%) | 693 (1.2%) |
| $25,000 to $34,999 | 1,965 (6.1%) | 1,461 (2.5%) |
| $35,000 to $49,999 | 3,378 (10.5%) | 1,159 (2.0%) |
| $50,000 to $74,999 | 5,084 (15.8%) | 3,195 (5.4%) |
| $75,000 to $99,999 | 3,689 (11.5%) | 6,659 (11.3%) |
| $100,000 to $149,999 | 5,578 (17.3%) | 7,569 (12.9%) |
| $150,000 or more | 8,899 (27.6%) | 13,433 (22.8%) |
| Total | 32,196 (100.0%) | 58,861 (100.0%) |
Property Value to Household Income Ratio in Washtenaw County
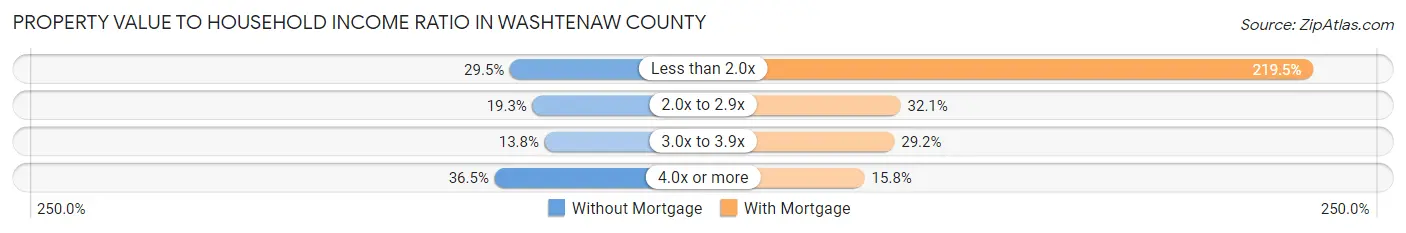
| Value-to-Income Ratio | Without Mortgage | With Mortgage |
| Less than 2.0x | 9,506 (29.5%) | 129,184 (219.5%) |
| 2.0x to 2.9x | 6,218 (19.3%) | 18,903 (32.1%) |
| 3.0x to 3.9x | 4,448 (13.8%) | 17,206 (29.2%) |
| 4.0x or more | 11,763 (36.5%) | 9,275 (15.8%) |
| Total | 32,196 (100.0%) | 58,861 (100.0%) |
Real Estate Taxes by Mortgage Status in Washtenaw County
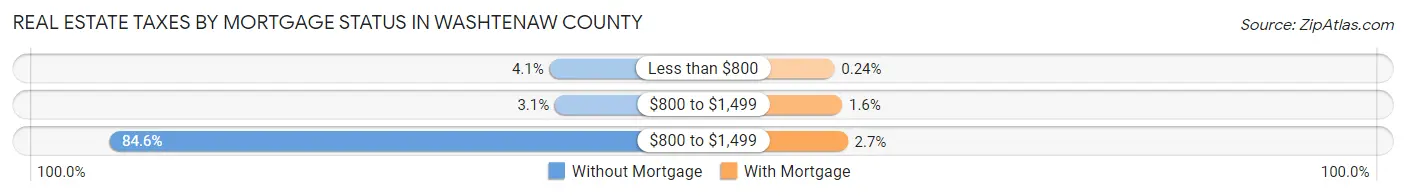
| Property Taxes | Without Mortgage | With Mortgage |
| Less than $800 | 1,326 (4.1%) | 139 (0.2%) |
| $800 to $1,499 | 1,002 (3.1%) | 968 (1.6%) |
| $800 to $1,499 | 27,226 (84.6%) | 1,566 (2.7%) |
| Total | 32,196 (100.0%) | 58,861 (100.0%) |
Health & Disability in Washtenaw County
Health Insurance Coverage by Age in Washtenaw County
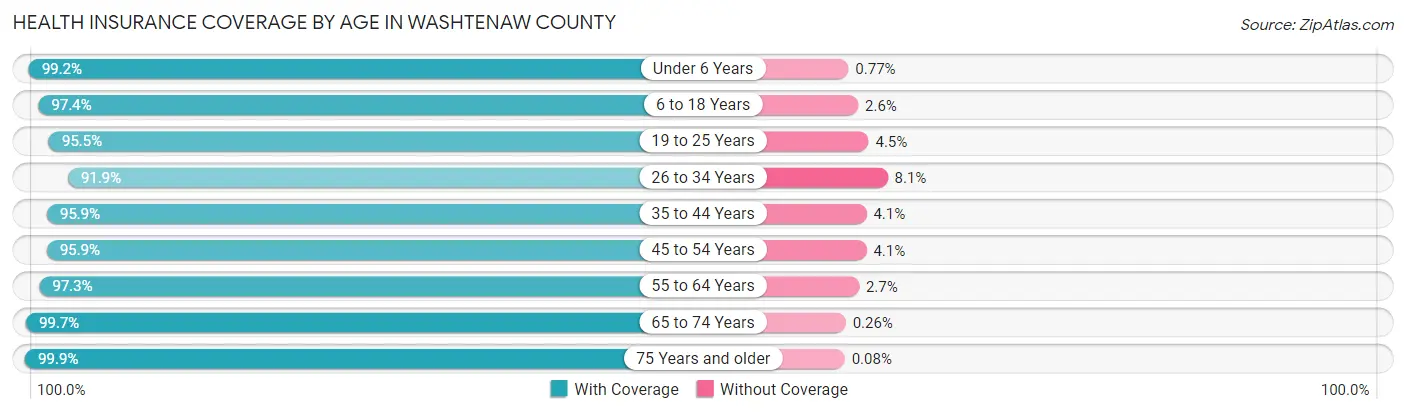
| Age Bracket | With Coverage | Without Coverage |
| Under 6 Years | 20,468 (99.2%) | 159 (0.8%) |
| 6 to 18 Years | 55,081 (97.4%) | 1,451 (2.6%) |
| 19 to 25 Years | 60,673 (95.5%) | 2,871 (4.5%) |
| 26 to 34 Years | 42,411 (91.9%) | 3,724 (8.1%) |
| 35 to 44 Years | 40,482 (95.9%) | 1,748 (4.1%) |
| 45 to 54 Years | 39,561 (95.9%) | 1,703 (4.1%) |
| 55 to 64 Years | 40,377 (97.3%) | 1,137 (2.7%) |
| 65 to 74 Years | 32,404 (99.7%) | 83 (0.3%) |
| 75 Years and older | 20,955 (99.9%) | 17 (0.1%) |
| Total | 352,412 (96.5%) | 12,893 (3.5%) |
Health Insurance Coverage by Citizenship Status in Washtenaw County
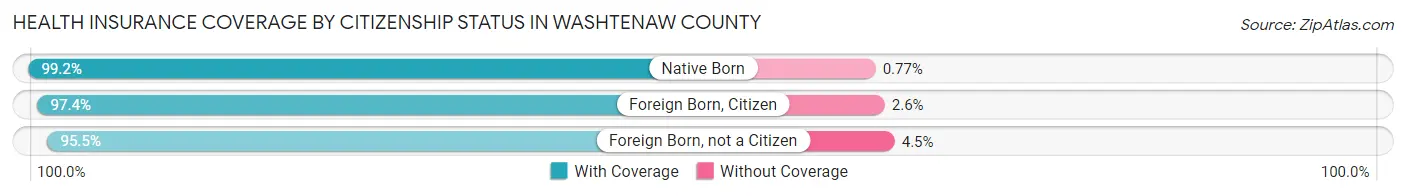
| Citizenship Status | With Coverage | Without Coverage |
| Native Born | 20,468 (99.2%) | 159 (0.8%) |
| Foreign Born, Citizen | 55,081 (97.4%) | 1,451 (2.6%) |
| Foreign Born, not a Citizen | 60,673 (95.5%) | 2,871 (4.5%) |
Health Insurance Coverage by Household Income in Washtenaw County
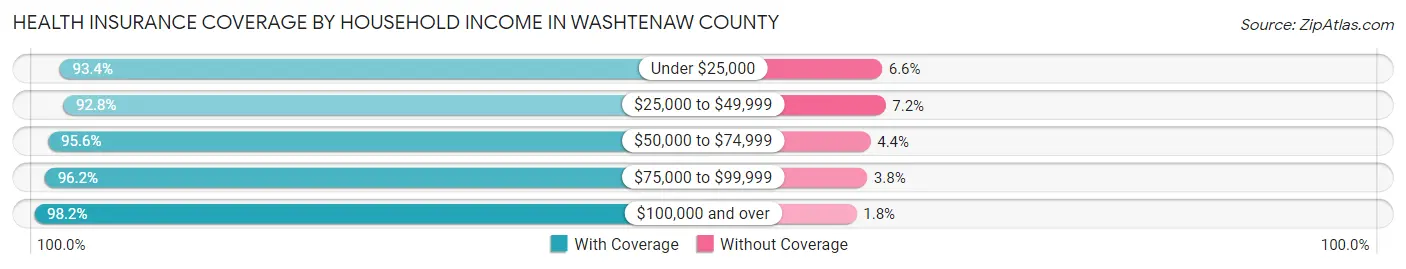
| Household Income | With Coverage | Without Coverage |
| Under $25,000 | 35,713 (93.4%) | 2,509 (6.6%) |
| $25,000 to $49,999 | 40,165 (92.8%) | 3,124 (7.2%) |
| $50,000 to $74,999 | 44,350 (95.6%) | 2,039 (4.4%) |
| $75,000 to $99,999 | 40,599 (96.2%) | 1,589 (3.8%) |
| $100,000 and over | 176,331 (98.2%) | 3,211 (1.8%) |
Public vs Private Health Insurance Coverage by Age in Washtenaw County
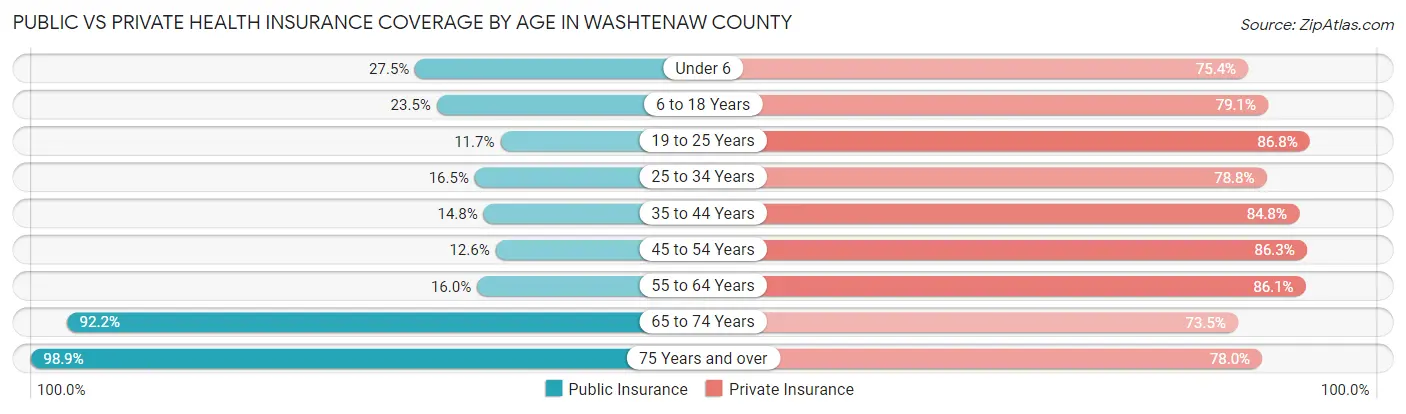
| Age Bracket | Public Insurance | Private Insurance |
| Under 6 | 5,674 (27.5%) | 15,549 (75.4%) |
| 6 to 18 Years | 13,297 (23.5%) | 44,701 (79.1%) |
| 19 to 25 Years | 7,444 (11.7%) | 55,165 (86.8%) |
| 25 to 34 Years | 7,589 (16.5%) | 36,351 (78.8%) |
| 35 to 44 Years | 6,257 (14.8%) | 35,820 (84.8%) |
| 45 to 54 Years | 5,198 (12.6%) | 35,589 (86.3%) |
| 55 to 64 Years | 6,655 (16.0%) | 35,722 (86.1%) |
| 65 to 74 Years | 29,951 (92.2%) | 23,868 (73.5%) |
| 75 Years and over | 20,748 (98.9%) | 16,354 (78.0%) |
| Total | 102,813 (28.1%) | 299,119 (81.9%) |
Disability Status by Sex by Age in Washtenaw County
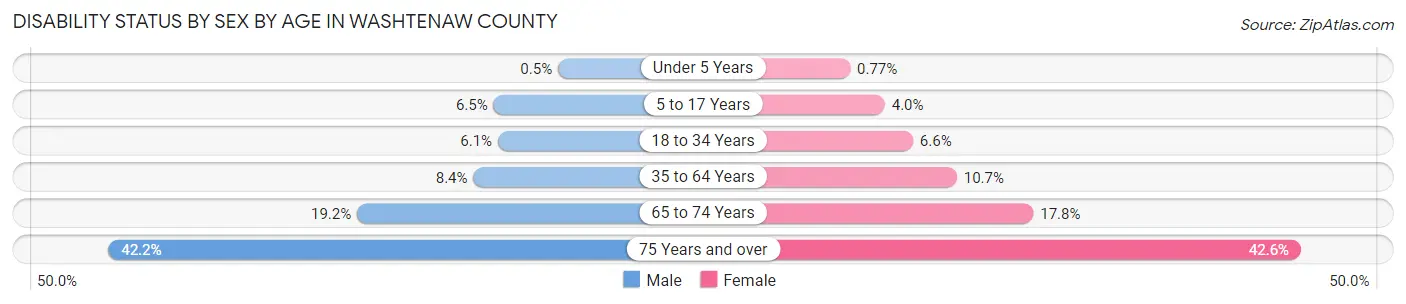
| Age Bracket | Male | Female |
| Under 5 Years | 44 (0.5%) | 66 (0.8%) |
| 5 to 17 Years | 1,671 (6.5%) | 978 (4.0%) |
| 18 to 34 Years | 3,727 (6.1%) | 3,821 (6.6%) |
| 35 to 64 Years | 5,232 (8.4%) | 6,653 (10.7%) |
| 65 to 74 Years | 2,924 (19.2%) | 3,059 (17.8%) |
| 75 Years and over | 3,733 (42.2%) | 5,170 (42.6%) |
Disability Class by Sex by Age in Washtenaw County
Disability Class: Hearing Difficulty
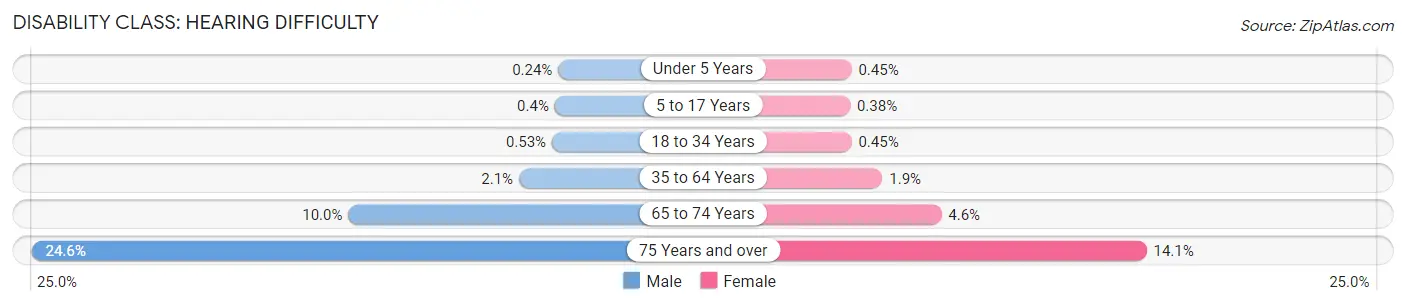
| Age Bracket | Male | Female |
| Under 5 Years | 21 (0.2%) | 38 (0.4%) |
| 5 to 17 Years | 103 (0.4%) | 92 (0.4%) |
| 18 to 34 Years | 326 (0.5%) | 260 (0.4%) |
| 35 to 64 Years | 1,290 (2.1%) | 1,173 (1.9%) |
| 65 to 74 Years | 1,524 (10.0%) | 796 (4.6%) |
| 75 Years and over | 2,177 (24.6%) | 1,715 (14.1%) |
Disability Class: Vision Difficulty
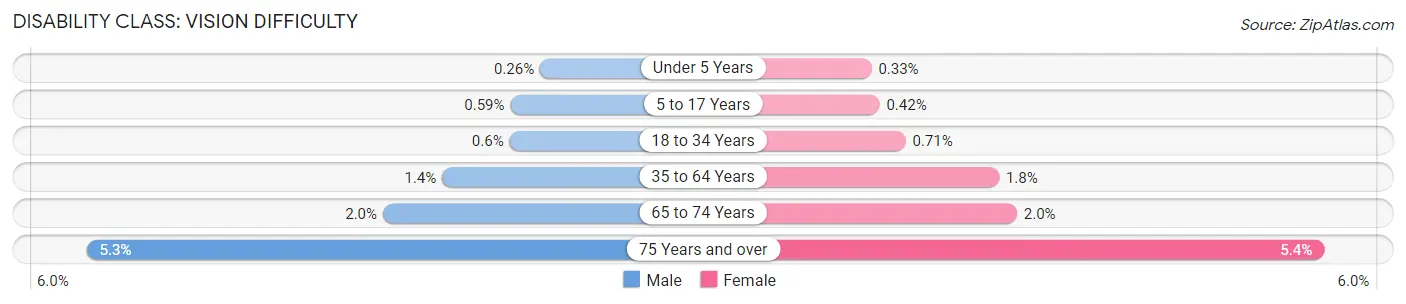
| Age Bracket | Male | Female |
| Under 5 Years | 23 (0.3%) | 28 (0.3%) |
| 5 to 17 Years | 152 (0.6%) | 104 (0.4%) |
| 18 to 34 Years | 371 (0.6%) | 412 (0.7%) |
| 35 to 64 Years | 849 (1.3%) | 1,092 (1.8%) |
| 65 to 74 Years | 307 (2.0%) | 336 (1.9%) |
| 75 Years and over | 469 (5.3%) | 652 (5.4%) |
Disability Class: Cognitive Difficulty
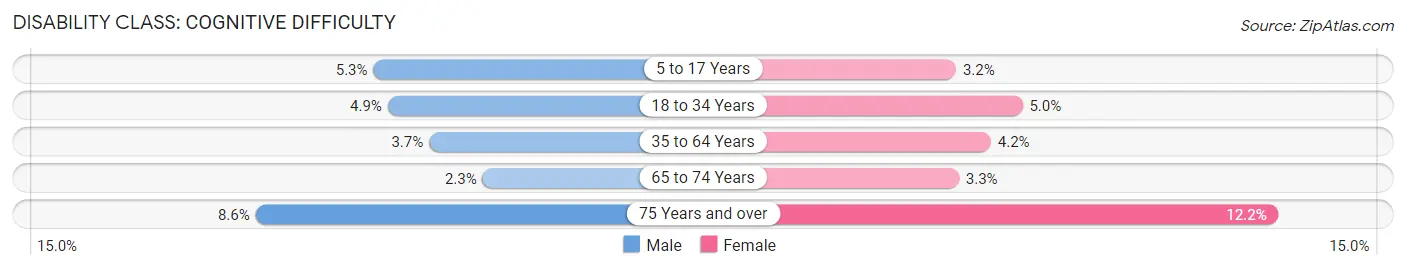
| Age Bracket | Male | Female |
| 5 to 17 Years | 1,363 (5.3%) | 780 (3.2%) |
| 18 to 34 Years | 3,004 (4.9%) | 2,914 (5.0%) |
| 35 to 64 Years | 2,344 (3.7%) | 2,588 (4.2%) |
| 65 to 74 Years | 343 (2.2%) | 562 (3.3%) |
| 75 Years and over | 758 (8.6%) | 1,475 (12.2%) |
Disability Class: Ambulatory Difficulty
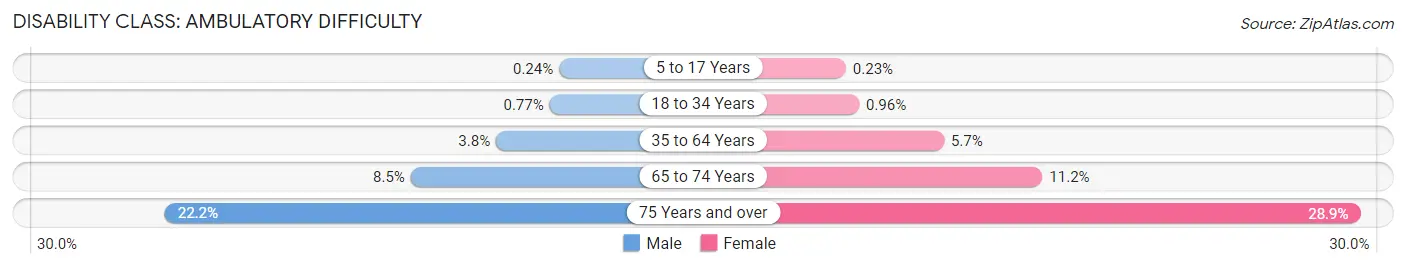
| Age Bracket | Male | Female |
| 5 to 17 Years | 63 (0.2%) | 56 (0.2%) |
| 18 to 34 Years | 470 (0.8%) | 556 (1.0%) |
| 35 to 64 Years | 2,351 (3.7%) | 3,545 (5.7%) |
| 65 to 74 Years | 1,298 (8.5%) | 1,924 (11.2%) |
| 75 Years and over | 1,962 (22.2%) | 3,503 (28.9%) |
Disability Class: Self-Care Difficulty
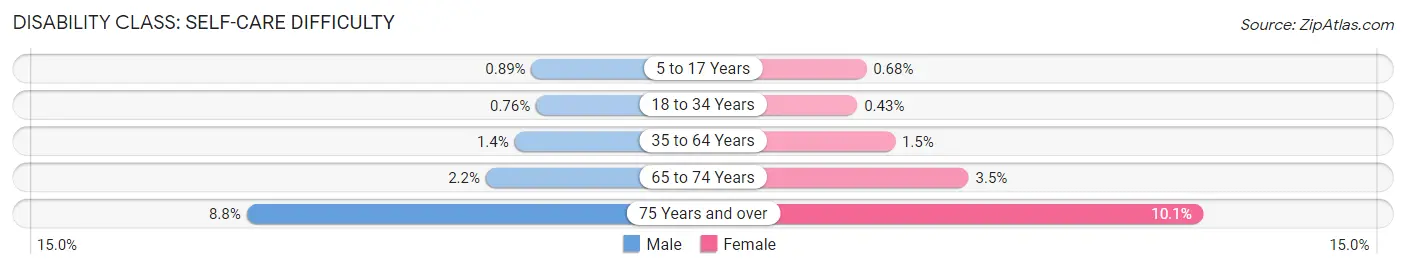
| Age Bracket | Male | Female |
| 5 to 17 Years | 230 (0.9%) | 166 (0.7%) |
| 18 to 34 Years | 467 (0.8%) | 251 (0.4%) |
| 35 to 64 Years | 854 (1.4%) | 920 (1.5%) |
| 65 to 74 Years | 330 (2.2%) | 608 (3.5%) |
| 75 Years and over | 780 (8.8%) | 1,222 (10.1%) |
Technology Access in Washtenaw County
Computing Device Access in Washtenaw County
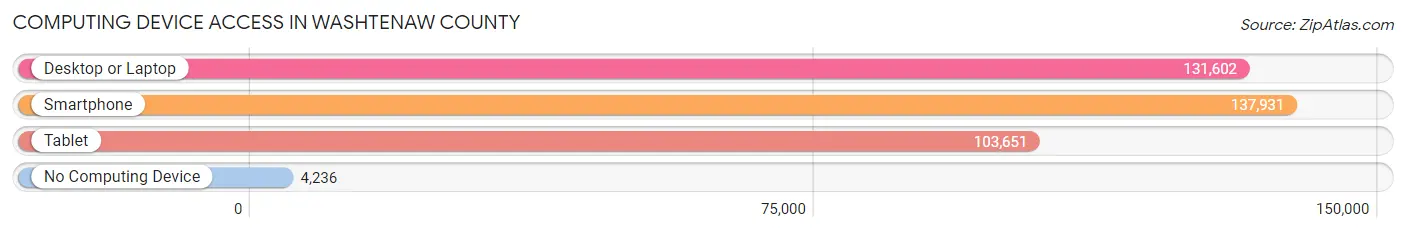
| Device Type | # Households | % Households |
| Desktop or Laptop | 131,602 | 88.5% |
| Smartphone | 137,931 | 92.8% |
| Tablet | 103,651 | 69.7% |
| No Computing Device | 4,236 | 2.9% |
| Total | 148,704 | 100.0% |
Internet Access in Washtenaw County
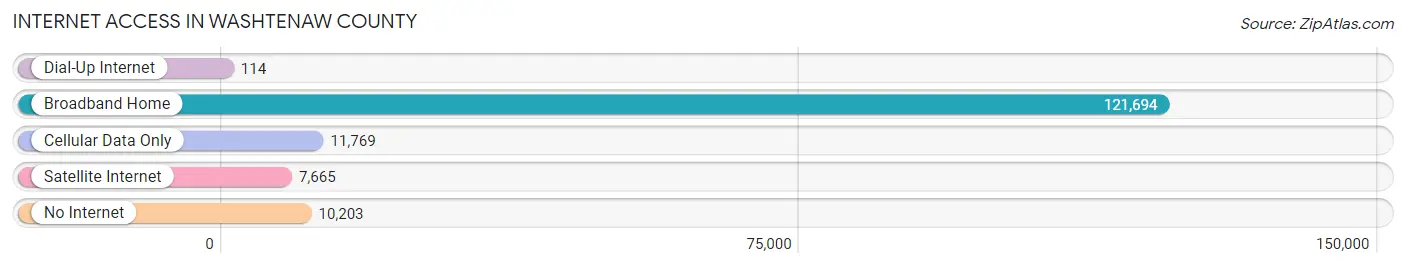
| Internet Type | # Households | % Households |
| Dial-Up Internet | 114 | 0.1% |
| Broadband Home | 121,694 | 81.8% |
| Cellular Data Only | 11,769 | 7.9% |
| Satellite Internet | 7,665 | 5.1% |
| No Internet | 10,203 | 6.9% |
| Total | 148,704 | 100.0% |
Washtenaw County Summary
Washtenaw County, Michigan is located in the southeastern part of the state, just west of Detroit. It is bordered by Livingston County to the north, Oakland County to the east, Wayne County to the south, and Monroe County to the west. The county seat is Ann Arbor, and the county is home to the University of Michigan.
History
Washtenaw County was established in 1822, and was named after the Washtenaw River, which was named after the Chippewa word for “far away waters.” The county was originally part of the Michigan Territory, and was one of the first counties to be organized in the state.
The county was initially populated by Native Americans, and the first European settlers arrived in the early 1800s. The first permanent settlement was established in 1824, and the county was officially organized in 1827.
The county was initially an agricultural area, and the first railroad was built in 1838. The railroad connected the county to Detroit, and allowed for the growth of industry in the area.
In the late 1800s, the University of Michigan was established in Ann Arbor, and the city quickly became the county’s largest population center. The university has since become one of the most prestigious universities in the country, and has helped to shape the county’s economy and culture.
Geography
Washtenaw County is located in the southeastern part of the state, and covers an area of 617 square miles. The county is mostly flat, with some rolling hills in the northern part of the county. The Huron River runs through the county, and there are several smaller rivers and streams.
The county is home to several parks and natural areas, including the Huron-Clinton Metroparks, the Waterloo Recreation Area, and the Pinckney State Recreation Area.
Economy
Washtenaw County’s economy is largely driven by the University of Michigan, which is the county’s largest employer. The university employs over 30,000 people, and is one of the largest employers in the state.
The county is also home to several large companies, including Domino’s Pizza, Borders Group, and the Ann Arbor News. The county is also home to several smaller businesses, including technology companies, restaurants, and retail stores.
The county’s economy is also supported by agriculture, and the county is home to several farms and orchards.
Demographics
As of the 2010 census, Washtenaw County had a population of 344,791. The population is largely white (83.3%), with smaller percentages of African Americans (7.2%), Asians (4.7%), and Hispanics (3.2%).
The median household income in the county is $60,890, and the median home value is $220,000. The county’s unemployment rate is 4.2%, which is lower than the national average.
Conclusion
Washtenaw County, Michigan is a vibrant and diverse county located in the southeastern part of the state. The county is home to the University of Michigan, which is the county’s largest employer, and the county’s economy is largely driven by the university. The county is also home to several large companies, and is supported by agriculture and small businesses. The county’s population is largely white, with smaller percentages of African Americans, Asians, and Hispanics. The median household income in the county is $60,890, and the median home value is $220,000.
Common Questions
What is the Total Population of Washtenaw County?
Total Population of Washtenaw County is 370,231.
What is the Total Male Population of Washtenaw County?
Total Male Population of Washtenaw County is 185,097.
What is the Total Female Population of Washtenaw County?
Total Female Population of Washtenaw County is 185,134.
What is the Ratio of Males per 100 Females in Washtenaw County?
There are 99.98 Males per 100 Females in Washtenaw County.
What is the Ratio of Females per 100 Males in Washtenaw County?
There are 100.02 Females per 100 Males in Washtenaw County.
What is the Median Population Age in Washtenaw County?
Median Population Age in Washtenaw County is 34.4 Years.
What is the Average Family Size in Washtenaw County
Average Family Size in Washtenaw County is 3.0 People.
What is the Average Household Size in Washtenaw County
Average Household Size in Washtenaw County is 2.4 People.
What is Per Capita Income in Washtenaw County?
Per Capita income in Washtenaw County is $49,568.
What is the Median Family Income in Washtenaw County?
Median Family Income in Washtenaw County is $118,144.
What is the Median Household income in Washtenaw County?
Median Household Income in Washtenaw County is $84,245.
What is Income or Wage Gap in Washtenaw County?
Income or Wage Gap in Washtenaw County is 32.6%.
Women in Washtenaw County earn 67.4 cents for every dollar earned by a man.
What is Family Income Deficit in Washtenaw County?
Family Income Deficit in Washtenaw County is $11,300.
Families that are below poverty line in Washtenaw County earn $11,300 less on average than the poverty threshold level.
What is Inequality or Gini Index in Washtenaw County?
Inequality or Gini Index in Washtenaw County is 0.49.
How Large is the Labor Force in Washtenaw County?
There are 198,159 People in the Labor Forcein in Washtenaw County.
What is the Percentage of People in the Labor Force in Washtenaw County?
63.7% of People are in the Labor Force in Washtenaw County.
What is the Unemployment Rate in Washtenaw County?
Unemployment Rate in Washtenaw County is 4.7%.