St. Clair County, MI
St. Clair County Map
St. Clair County Overview
160,257
TOTAL POPULATION
80,273
MALE POPULATION
79,984
FEMALE POPULATION
100.36
MALES / 100 FEMALES
99.64
FEMALES / 100 MALES
44.1
MEDIAN AGE
2.9
AVG FAMILY SIZE
2.4
AVG HOUSEHOLD SIZE
$35,483
PER CAPITA INCOME
$81,992
AVG FAMILY INCOME
$66,887
AVG HOUSEHOLD INCOME
39.5%
WAGE / INCOME GAP [ % ]
60.5¢/ $1
WAGE / INCOME GAP [ $ ]
$11,663
FAMILY INCOME DEFICIT
0.43
INEQUALITY / GINI INDEX
79,446
LABOR FORCE [ PEOPLE ]
60.2%
PERCENT IN LABOR FORCE
6.7%
UNEMPLOYMENT RATE
St. Clair County Area Codes
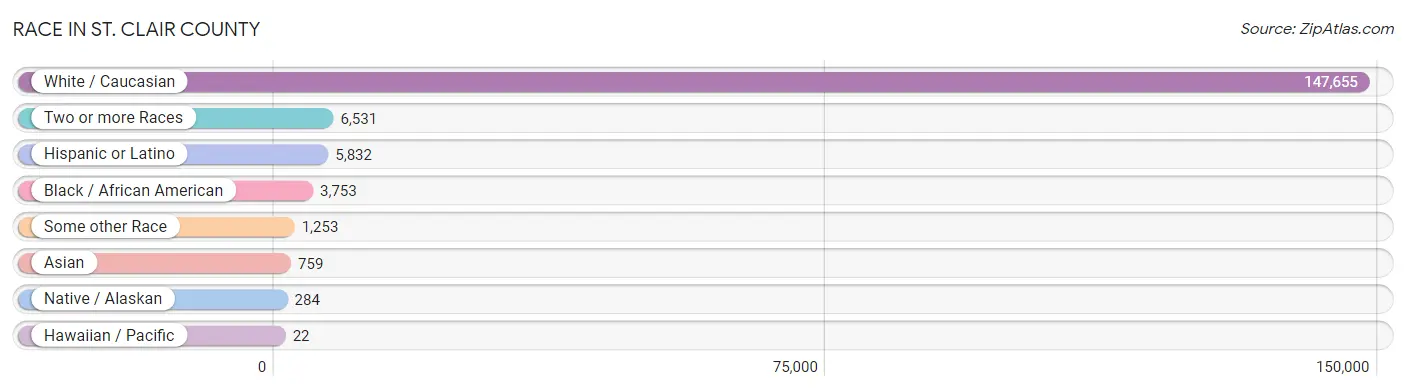
Race in St. Clair County
The most populous races in St. Clair County are White / Caucasian (147,655 | 92.1%), Two or more Races (6,531 | 4.1%), and Hispanic or Latino (5,832 | 3.6%).
| Race | # Population | % Population |
| Asian | 759 | 0.5% |
| Black / African American | 3,753 | 2.3% |
| Hawaiian / Pacific | 22 | 0.0% |
| Hispanic or Latino | 5,832 | 3.6% |
| Native / Alaskan | 284 | 0.2% |
| White / Caucasian | 147,655 | 92.1% |
| Two or more Races | 6,531 | 4.1% |
| Some other Race | 1,253 | 0.8% |
| Total | 160,257 | 100.0% |
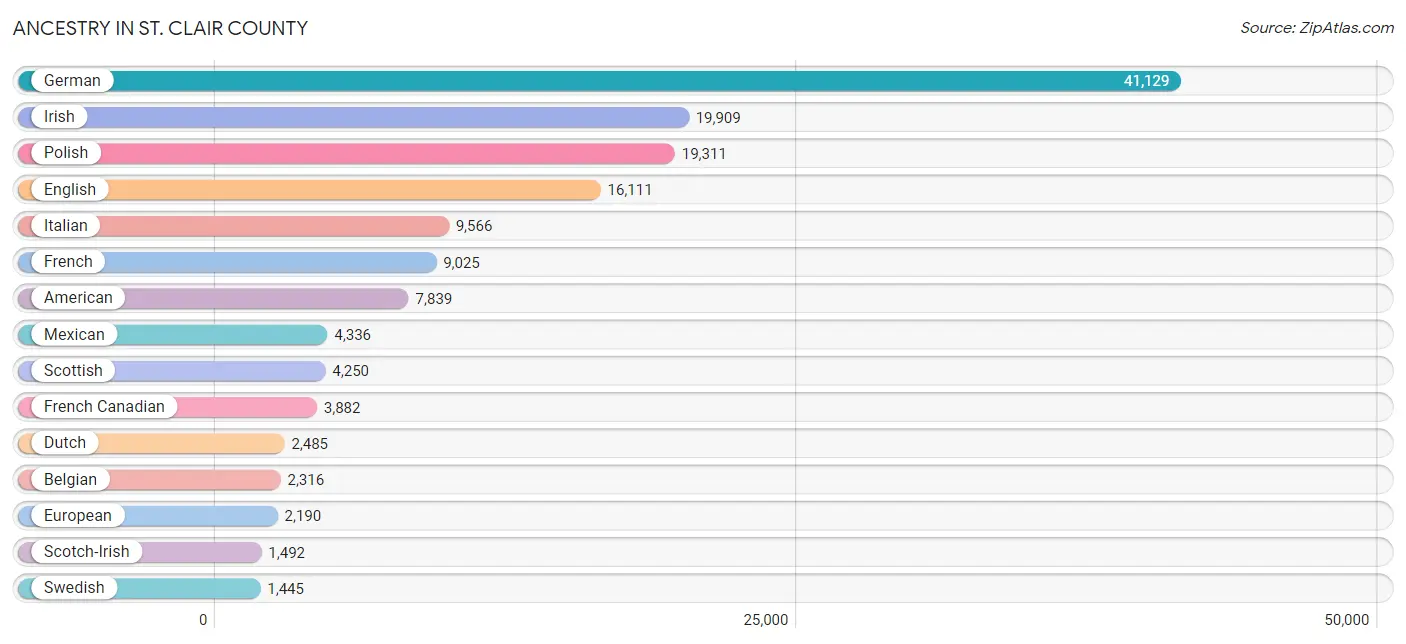
Ancestry in St. Clair County
The most populous ancestries reported in St. Clair County are German (41,129 | 25.7%), Irish (19,909 | 12.4%), Polish (19,311 | 12.0%), English (16,111 | 10.1%), and Italian (9,566 | 6.0%), together accounting for 66.2% of all St. Clair County residents.
| Ancestry | # Population | % Population |
| African | 194 | 0.1% |
| Albanian | 101 | 0.1% |
| American | 7,839 | 4.9% |
| Apache | 79 | 0.1% |
| Arab | 886 | 0.5% |
| Armenian | 80 | 0.1% |
| Assyrian / Chaldean / Syriac | 156 | 0.1% |
| Australian | 194 | 0.1% |
| Austrian | 387 | 0.2% |
| Barbadian | 6 | 0.0% |
| Belgian | 2,316 | 1.5% |
| Bhutanese | 142 | 0.1% |
| Blackfeet | 242 | 0.2% |
| Brazilian | 2 | 0.0% |
| British | 839 | 0.5% |
| Bulgarian | 18 | 0.0% |
| Burmese | 260 | 0.2% |
| Cajun | 80 | 0.1% |
| Canadian | 1,270 | 0.8% |
| Carpatho Rusyn | 11 | 0.0% |
| Celtic | 71 | 0.0% |
| Central American | 178 | 0.1% |
| Central American Indian | 34 | 0.0% |
| Cherokee | 263 | 0.2% |
| Cheyenne | 16 | 0.0% |
| Chippewa | 231 | 0.1% |
| Choctaw | 21 | 0.0% |
| Colombian | 12 | 0.0% |
| Creek | 18 | 0.0% |
| Croatian | 140 | 0.1% |
| Cuban | 290 | 0.2% |
| Czech | 596 | 0.4% |
| Czechoslovakian | 224 | 0.1% |
| Danish | 276 | 0.2% |
| Dominican | 28 | 0.0% |
| Dutch | 2,485 | 1.5% |
| Eastern European | 268 | 0.2% |
| Ecuadorian | 16 | 0.0% |
| Egyptian | 138 | 0.1% |
| English | 16,111 | 10.1% |
| European | 2,190 | 1.4% |
| Finnish | 798 | 0.5% |
| French | 9,025 | 5.6% |
| French American Indian | 59 | 0.0% |
| French Canadian | 3,882 | 2.4% |
| German | 41,129 | 25.7% |
| Ghanaian | 7 | 0.0% |
| Greek | 620 | 0.4% |
| Guamanian / Chamorro | 3 | 0.0% |
| Guatemalan | 57 | 0.0% |
| Honduran | 14 | 0.0% |
| Hopi | 6 | 0.0% |
| Hungarian | 1,433 | 0.9% |
| Icelander | 27 | 0.0% |
| Indian (Asian) | 165 | 0.1% |
| Indonesian | 34 | 0.0% |
| Iranian | 48 | 0.0% |
| Iraqi | 35 | 0.0% |
| Irish | 19,909 | 12.4% |
| Iroquois | 33 | 0.0% |
| Italian | 9,566 | 6.0% |
| Jamaican | 178 | 0.1% |
| Korean | 468 | 0.3% |
| Lebanese | 535 | 0.3% |
| Lithuanian | 248 | 0.2% |
| Lumbee | 9 | 0.0% |
| Macedonian | 269 | 0.2% |
| Maltese | 82 | 0.1% |
| Menominee | 13 | 0.0% |
| Mexican | 4,336 | 2.7% |
| Mexican American Indian | 18 | 0.0% |
| Moroccan | 7 | 0.0% |
| Native Hawaiian | 60 | 0.0% |
| Navajo | 7 | 0.0% |
| Nicaraguan | 97 | 0.1% |
| Nigerian | 146 | 0.1% |
| Northern European | 205 | 0.1% |
| Norwegian | 898 | 0.6% |
| Ottawa | 21 | 0.0% |
| Pakistani | 53 | 0.0% |
| Palestinian | 44 | 0.0% |
| Panamanian | 10 | 0.0% |
| Pennsylvania German | 24 | 0.0% |
| Pima | 17 | 0.0% |
| Polish | 19,311 | 12.0% |
| Portuguese | 85 | 0.1% |
| Potawatomi | 5 | 0.0% |
| Puerto Rican | 246 | 0.2% |
| Romanian | 544 | 0.3% |
| Russian | 871 | 0.5% |
| Scandinavian | 532 | 0.3% |
| Scotch-Irish | 1,492 | 0.9% |
| Scottish | 4,250 | 2.6% |
| Serbian | 128 | 0.1% |
| Sioux | 97 | 0.1% |
| Slavic | 106 | 0.1% |
| Slovak | 628 | 0.4% |
| Slovene | 13 | 0.0% |
| South American | 28 | 0.0% |
| South American Indian | 4 | 0.0% |
| Spaniard | 149 | 0.1% |
| Spanish | 73 | 0.1% |
| Sri Lankan | 103 | 0.1% |
| Subsaharan African | 347 | 0.2% |
| Swedish | 1,445 | 0.9% |
| Swiss | 184 | 0.1% |
| Syrian | 86 | 0.1% |
| Thai | 159 | 0.1% |
| Turkish | 55 | 0.0% |
| Ukrainian | 415 | 0.3% |
| Welsh | 531 | 0.3% |
| Yugoslavian | 153 | 0.1% | View All 112 Rows |
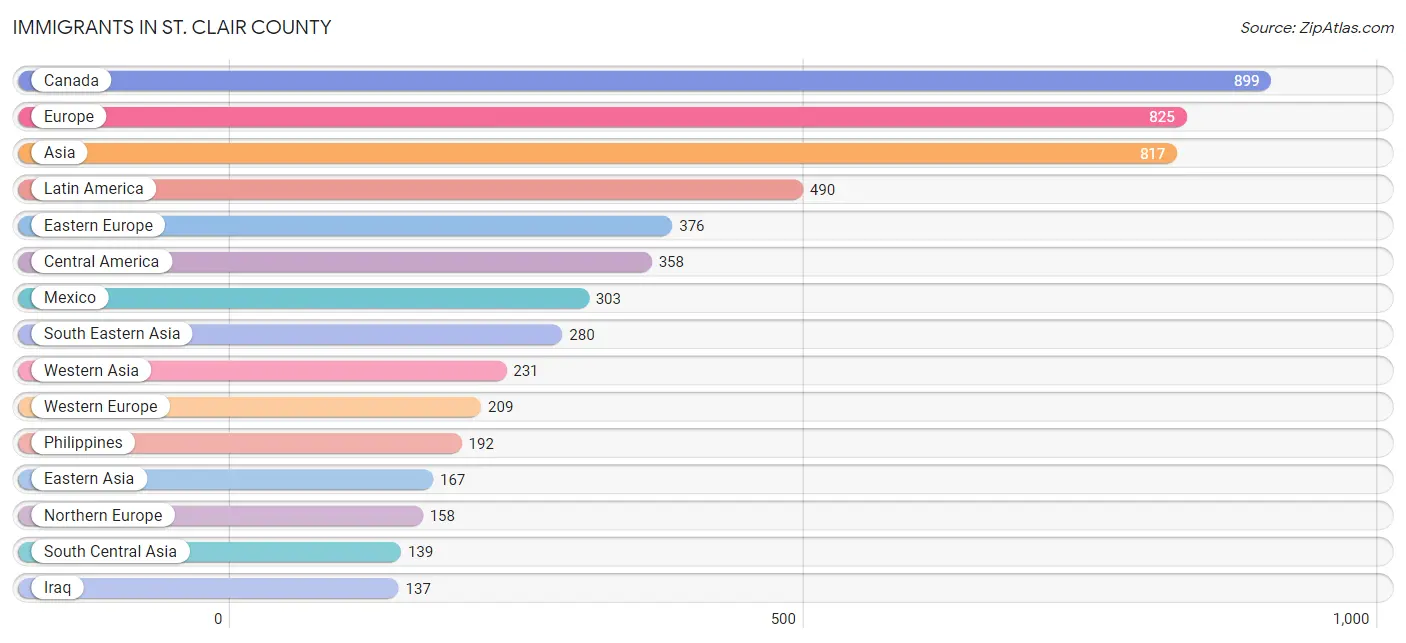
Immigrants in St. Clair County
The most numerous immigrant groups reported in St. Clair County came from Canada (899 | 0.6%), Europe (825 | 0.5%), Asia (817 | 0.5%), Latin America (490 | 0.3%), and Eastern Europe (376 | 0.2%), together accounting for 2.1% of all St. Clair County residents.
| Immigration Origin | # Population | % Population |
| Africa | 41 | 0.0% |
| Albania | 8 | 0.0% |
| Argentina | 6 | 0.0% |
| Armenia | 6 | 0.0% |
| Asia | 817 | 0.5% |
| Australia | 4 | 0.0% |
| Austria | 10 | 0.0% |
| Belgium | 5 | 0.0% |
| Bosnia and Herzegovina | 11 | 0.0% |
| Brazil | 42 | 0.0% |
| Canada | 899 | 0.6% |
| Caribbean | 72 | 0.0% |
| Central America | 358 | 0.2% |
| China | 56 | 0.0% |
| Colombia | 12 | 0.0% |
| Costa Rica | 13 | 0.0% |
| Cuba | 46 | 0.0% |
| Czechoslovakia | 12 | 0.0% |
| Eastern Africa | 11 | 0.0% |
| Eastern Asia | 167 | 0.1% |
| Eastern Europe | 376 | 0.2% |
| Egypt | 13 | 0.0% |
| England | 66 | 0.0% |
| Europe | 825 | 0.5% |
| France | 30 | 0.0% |
| Germany | 118 | 0.1% |
| Ghana | 7 | 0.0% |
| Greece | 37 | 0.0% |
| Guatemala | 11 | 0.0% |
| Honduras | 22 | 0.0% |
| India | 86 | 0.1% |
| Indonesia | 29 | 0.0% |
| Iran | 31 | 0.0% |
| Iraq | 137 | 0.1% |
| Ireland | 13 | 0.0% |
| Italy | 40 | 0.0% |
| Jamaica | 20 | 0.0% |
| Japan | 29 | 0.0% |
| Kenya | 11 | 0.0% |
| Korea | 82 | 0.1% |
| Latin America | 490 | 0.3% |
| Lebanon | 40 | 0.0% |
| Lithuania | 7 | 0.0% |
| Mexico | 303 | 0.2% |
| Netherlands | 46 | 0.0% |
| North Macedonia | 14 | 0.0% |
| Northern Africa | 13 | 0.0% |
| Northern Europe | 158 | 0.1% |
| Oceania | 9 | 0.0% |
| Pakistan | 22 | 0.0% |
| Panama | 9 | 0.0% |
| Philippines | 192 | 0.1% |
| Poland | 21 | 0.0% |
| Romania | 42 | 0.0% |
| Russia | 78 | 0.1% |
| Saudi Arabia | 32 | 0.0% |
| Scotland | 57 | 0.0% |
| Serbia | 13 | 0.0% |
| Singapore | 4 | 0.0% |
| South America | 60 | 0.0% |
| South Central Asia | 139 | 0.1% |
| South Eastern Asia | 280 | 0.2% |
| Southern Europe | 82 | 0.1% |
| Spain | 5 | 0.0% |
| Syria | 1 | 0.0% |
| Thailand | 4 | 0.0% |
| Ukraine | 48 | 0.0% |
| Vietnam | 17 | 0.0% |
| West Indies | 6 | 0.0% |
| Western Africa | 7 | 0.0% |
| Western Asia | 231 | 0.1% |
| Western Europe | 209 | 0.1% | View All 72 Rows |
Sex and Age in St. Clair County
Sex and Age in St. Clair County
The most populous age groups in St. Clair County are 55 to 59 Years (6,821 | 8.5%) for men and 55 to 59 Years (6,630 | 8.3%) for women.
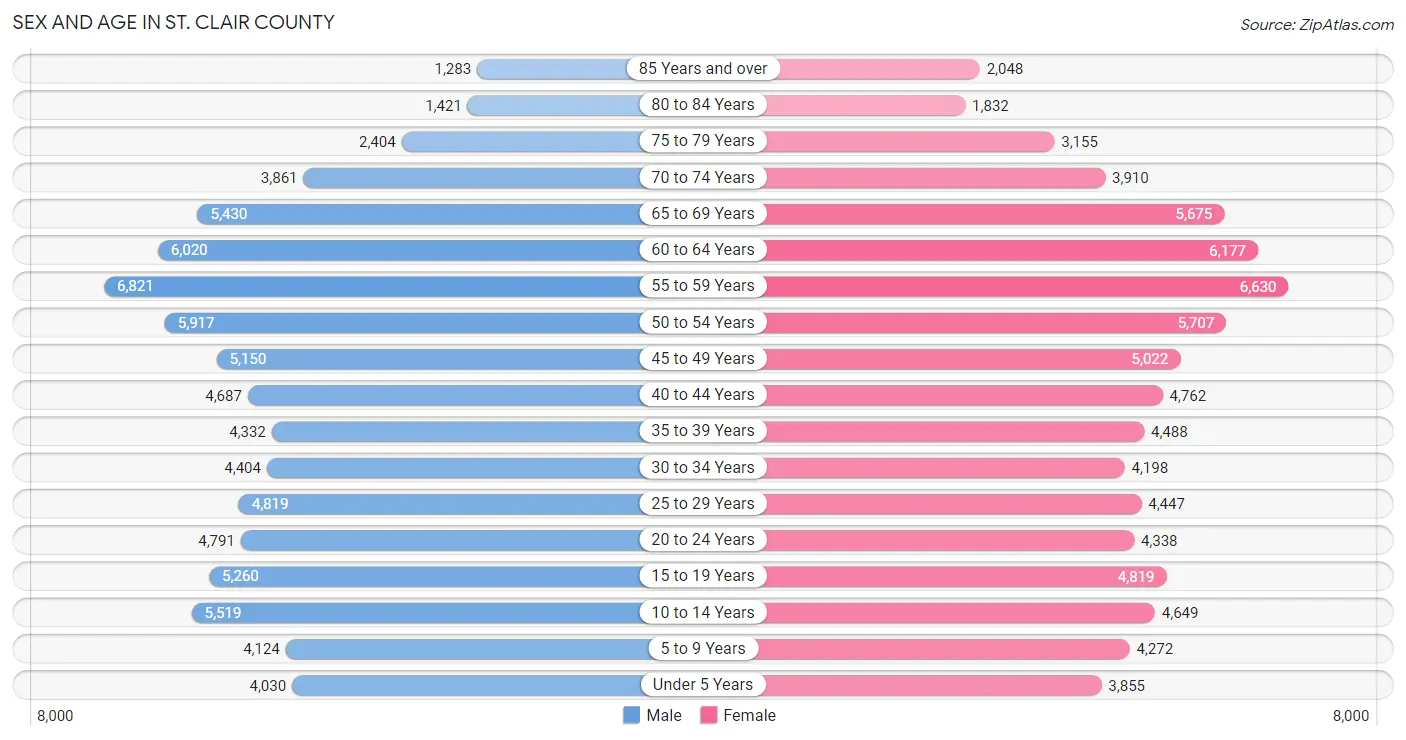
| Age Bracket | Male | Female |
| Under 5 Years | 4,030 (5.0%) | 3,855 (4.8%) |
| 5 to 9 Years | 4,124 (5.1%) | 4,272 (5.3%) |
| 10 to 14 Years | 5,519 (6.9%) | 4,649 (5.8%) |
| 15 to 19 Years | 5,260 (6.6%) | 4,819 (6.0%) |
| 20 to 24 Years | 4,791 (6.0%) | 4,338 (5.4%) |
| 25 to 29 Years | 4,819 (6.0%) | 4,447 (5.6%) |
| 30 to 34 Years | 4,404 (5.5%) | 4,198 (5.2%) |
| 35 to 39 Years | 4,332 (5.4%) | 4,488 (5.6%) |
| 40 to 44 Years | 4,687 (5.8%) | 4,762 (5.9%) |
| 45 to 49 Years | 5,150 (6.4%) | 5,022 (6.3%) |
| 50 to 54 Years | 5,917 (7.4%) | 5,707 (7.1%) |
| 55 to 59 Years | 6,821 (8.5%) | 6,630 (8.3%) |
| 60 to 64 Years | 6,020 (7.5%) | 6,177 (7.7%) |
| 65 to 69 Years | 5,430 (6.8%) | 5,675 (7.1%) |
| 70 to 74 Years | 3,861 (4.8%) | 3,910 (4.9%) |
| 75 to 79 Years | 2,404 (3.0%) | 3,155 (3.9%) |
| 80 to 84 Years | 1,421 (1.8%) | 1,832 (2.3%) |
| 85 Years and over | 1,283 (1.6%) | 2,048 (2.6%) |
| Total | 80,273 (100.0%) | 79,984 (100.0%) |
Families and Households in St. Clair County
Median Family Size in St. Clair County
The median family size in St. Clair County is 2.89 persons per family, with married-couple families (33,295 | 75.1%) accounting for the largest median family size of 2.94 persons per family. On the other hand, single male/father families (3,499 | 7.9%) represent the smallest median family size with 2.66 persons per family.
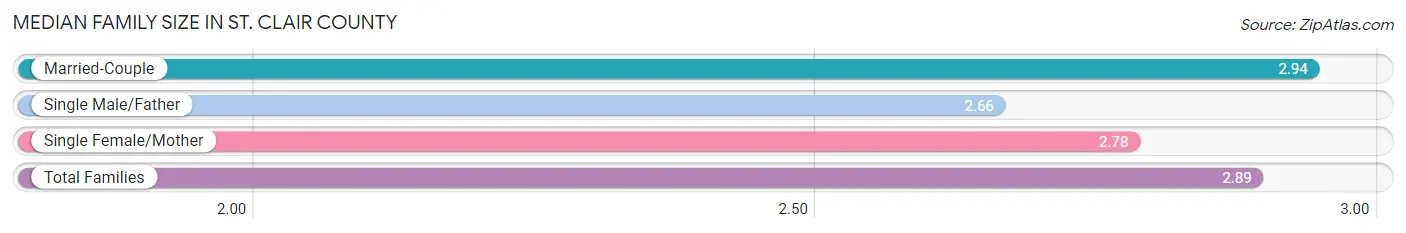
| Family Type | # Families | Family Size |
| Married-Couple | 33,295 (75.1%) | 2.94 |
| Single Male/Father | 3,499 (7.9%) | 2.66 |
| Single Female/Mother | 7,546 (17.0%) | 2.78 |
| Total Families | 44,340 (100.0%) | 2.89 |
Median Household Size in St. Clair County
The median household size in St. Clair County is 2.40 persons per household, with single male/father households (3,499 | 5.3%) accounting for the largest median household size of 3.06 persons per household. non-family households (21,649 | 32.8%) represent the smallest median household size with 1.22 persons per household.
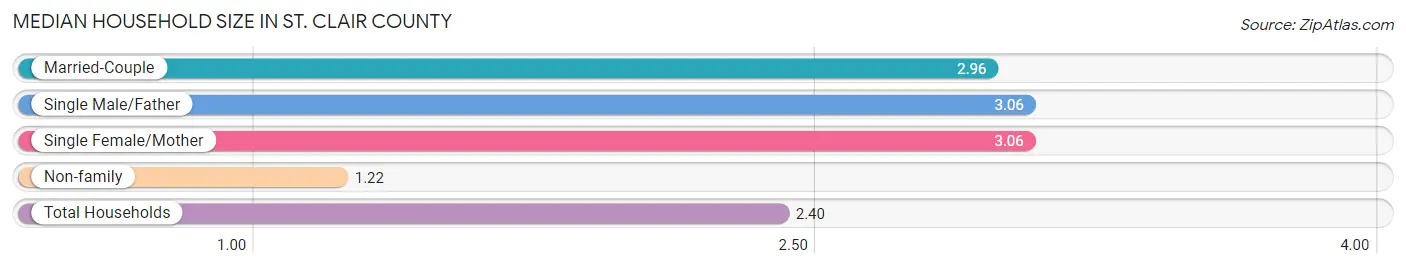
| Household Type | # Households | Household Size |
| Married-Couple | 33,295 (50.5%) | 2.96 |
| Single Male/Father | 3,499 (5.3%) | 3.06 |
| Single Female/Mother | 7,546 (11.4%) | 3.06 |
| Non-family | 21,649 (32.8%) | 1.22 |
| Total Households | 65,989 (100.0%) | 2.40 |
Household Size by Marriage Status in St. Clair County
Out of a total of 65,989 households in St. Clair County, 44,340 (67.2%) are family households, while 21,649 (32.8%) are nonfamily households. The most numerous type of family households are 2-person households, comprising 21,163, and the most common type of nonfamily households are 1-person households, comprising 17,810.
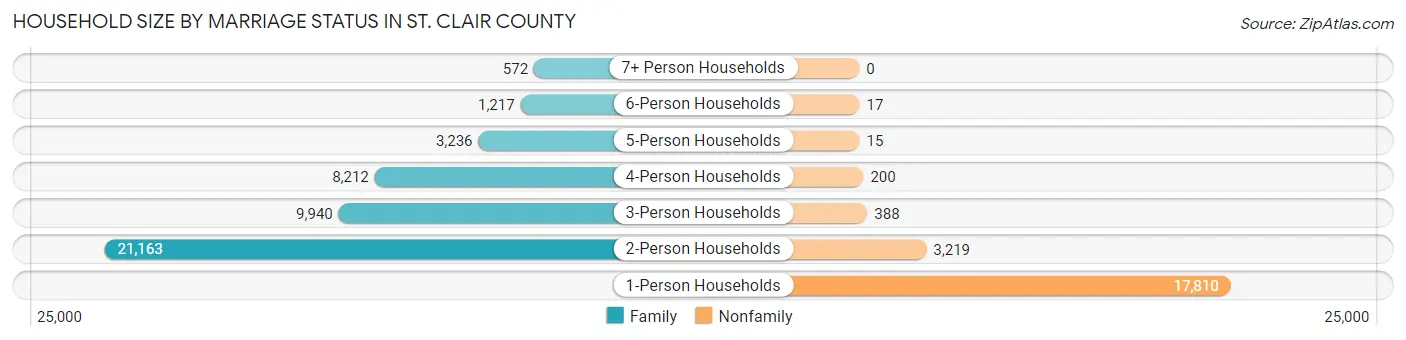
| Household Size | Family Households | Nonfamily Households |
| 1-Person Households | - | 17,810 (27.0%) |
| 2-Person Households | 21,163 (32.1%) | 3,219 (4.9%) |
| 3-Person Households | 9,940 (15.1%) | 388 (0.6%) |
| 4-Person Households | 8,212 (12.4%) | 200 (0.3%) |
| 5-Person Households | 3,236 (4.9%) | 15 (0.0%) |
| 6-Person Households | 1,217 (1.8%) | 17 (0.0%) |
| 7+ Person Households | 572 (0.9%) | 0 (0.0%) |
| Total | 44,340 (67.2%) | 21,649 (32.8%) |
Female Fertility in St. Clair County
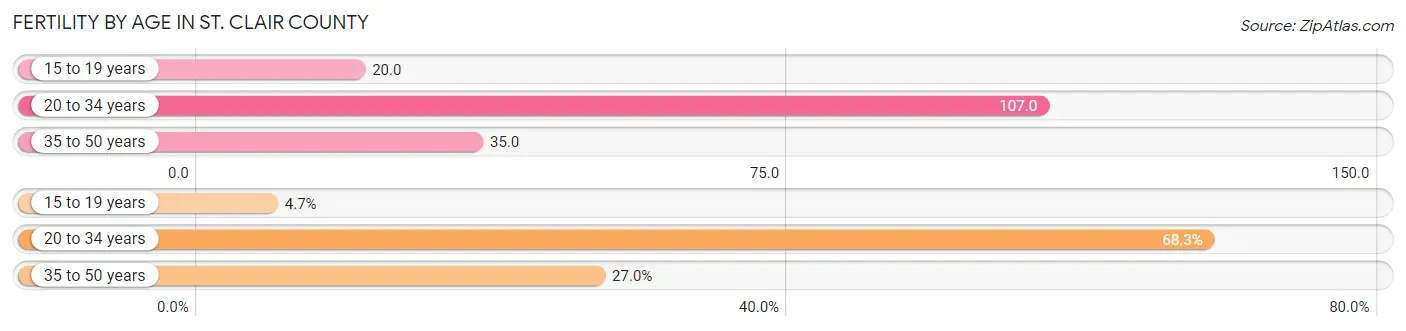
Fertility by Age in St. Clair County
Average fertility rate in St. Clair County is 61.0 births per 1,000 women. Women in the age bracket of 20 to 34 years have the highest fertility rate with 107.0 births per 1,000 women. Women in the age bracket of 20 to 34 years acount for 68.3% of all women with births.
| Age Bracket | Women with Births | Births / 1,000 Women |
| 15 to 19 years | 96 (4.7%) | 20.0 |
| 20 to 34 years | 1,384 (68.3%) | 107.0 |
| 35 to 50 years | 546 (27.0%) | 35.0 |
| Total | 2,026 (100.0%) | 61.0 |
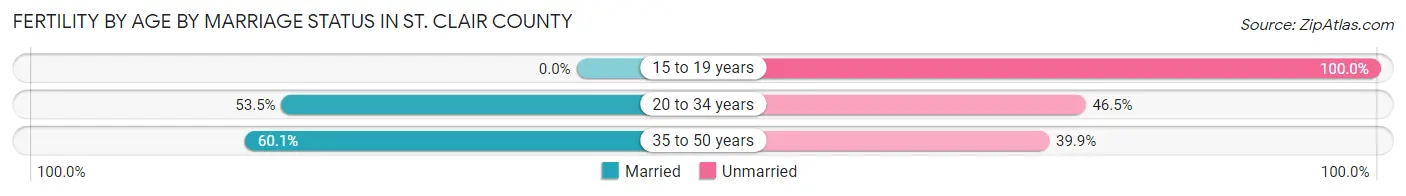
Fertility by Age by Marriage Status in St. Clair County
52.7% of women with births (2,026) in St. Clair County are married. The highest percentage of unmarried women with births falls into 15 to 19 years age bracket with 100.0% of them unmarried at the time of birth, while the lowest percentage of unmarried women with births belong to 35 to 50 years age bracket with 39.9% of them unmarried.
| Age Bracket | Married | Unmarried |
| 15 to 19 years | 0 (0.0%) | 96 (100.0%) |
| 20 to 34 years | 740 (53.5%) | 644 (46.5%) |
| 35 to 50 years | 328 (60.1%) | 218 (39.9%) |
| Total | 1,068 (52.7%) | 958 (47.3%) |
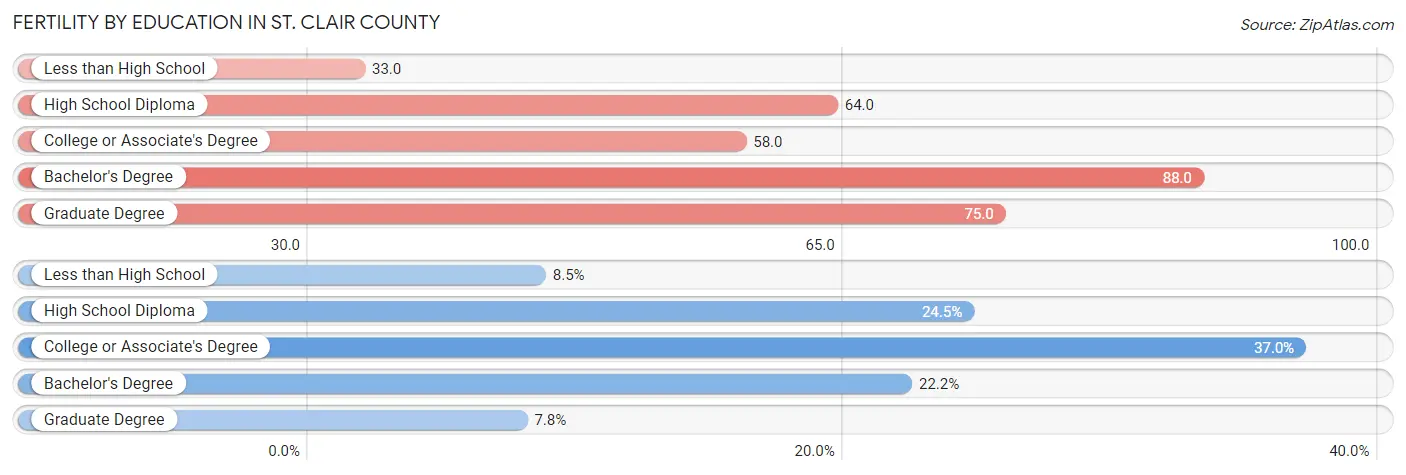
Fertility by Education in St. Clair County
Average fertility rate in St. Clair County is 61.0 births per 1,000 women. Women with the education attainment of bachelor's degree have the highest fertility rate of 88.0 births per 1,000 women, while women with the education attainment of less than high school have the lowest fertility at 33.0 births per 1,000 women. Women with the education attainment of college or associate's degree represent 37.0% of all women with births.
| Educational Attainment | Women with Births | Births / 1,000 Women |
| Less than High School | 172 (8.5%) | 33.0 |
| High School Diploma | 497 (24.5%) | 64.0 |
| College or Associate's Degree | 749 (37.0%) | 58.0 |
| Bachelor's Degree | 450 (22.2%) | 88.0 |
| Graduate Degree | 158 (7.8%) | 75.0 |
| Total | 2,026 (100.0%) | 61.0 |
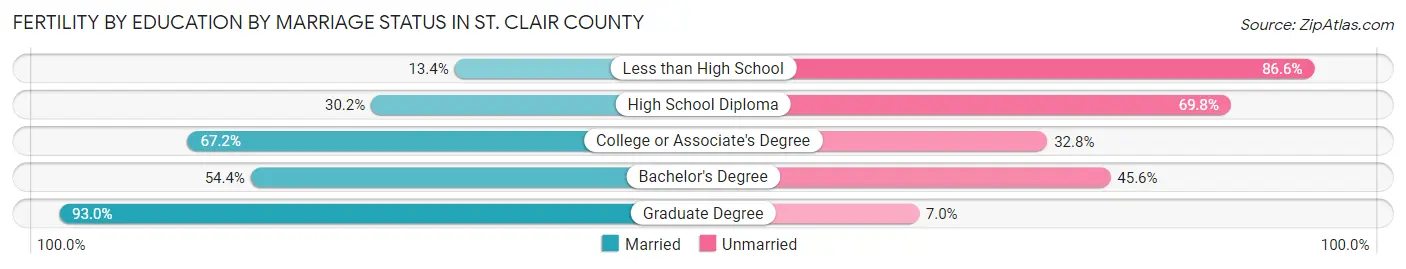
Fertility by Education by Marriage Status in St. Clair County
47.3% of women with births in St. Clair County are unmarried. Women with the educational attainment of graduate degree are most likely to be married with 93.0% of them married at childbirth, while women with the educational attainment of less than high school are least likely to be married with 86.6% of them unmarried at childbirth.
| Educational Attainment | Married | Unmarried |
| Less than High School | 23 (13.4%) | 149 (86.6%) |
| High School Diploma | 150 (30.2%) | 347 (69.8%) |
| College or Associate's Degree | 503 (67.2%) | 246 (32.8%) |
| Bachelor's Degree | 245 (54.4%) | 205 (45.6%) |
| Graduate Degree | 147 (93.0%) | 11 (7.0%) |
| Total | 1,068 (52.7%) | 958 (47.3%) |
Income in St. Clair County
Income Overview in St. Clair County
Per Capita Income in St. Clair County is $35,483, while median incomes of families and households are $81,992 and $66,887 respectively.
| Characteristic | Number | Measure |
| Per Capita Income | 160,257 | $35,483 |
| Median Family Income | 44,340 | $81,992 |
| Mean Family Income | 44,340 | $98,842 |
| Median Household Income | 65,989 | $66,887 |
| Mean Household Income | 65,989 | $85,544 |
| Income Deficit | 44,340 | $11,663 |
| Wage / Income Gap (%) | 160,257 | 39.47% |
| Wage / Income Gap ($) | 160,257 | 60.53¢ per $1 |
| Gini / Inequality Index | 160,257 | 0.43 |
Earnings by Sex in St. Clair County
Average Earnings in St. Clair County are $37,598, $48,622 for men and $29,429 for women, a difference of 39.5%.
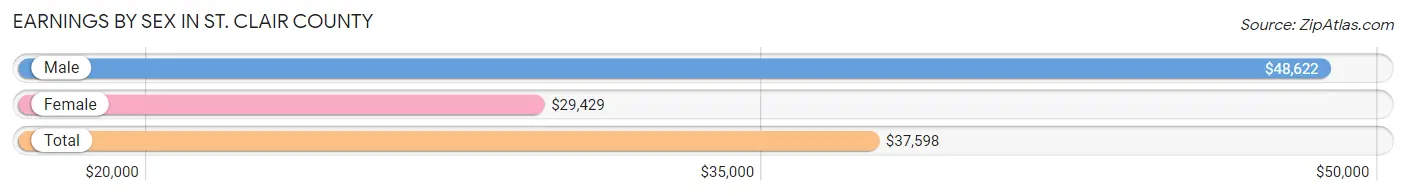
| Sex | Number | Average Earnings |
| Male | 44,636 (54.3%) | $48,622 |
| Female | 37,601 (45.7%) | $29,429 |
| Total | 82,237 (100.0%) | $37,598 |
Earnings by Sex by Income Bracket in St. Clair County
The most common earnings brackets in St. Clair County are $100,000+ for men (7,237 | 16.2%) and $30,000 to $34,999 for women (2,859 | 7.6%).
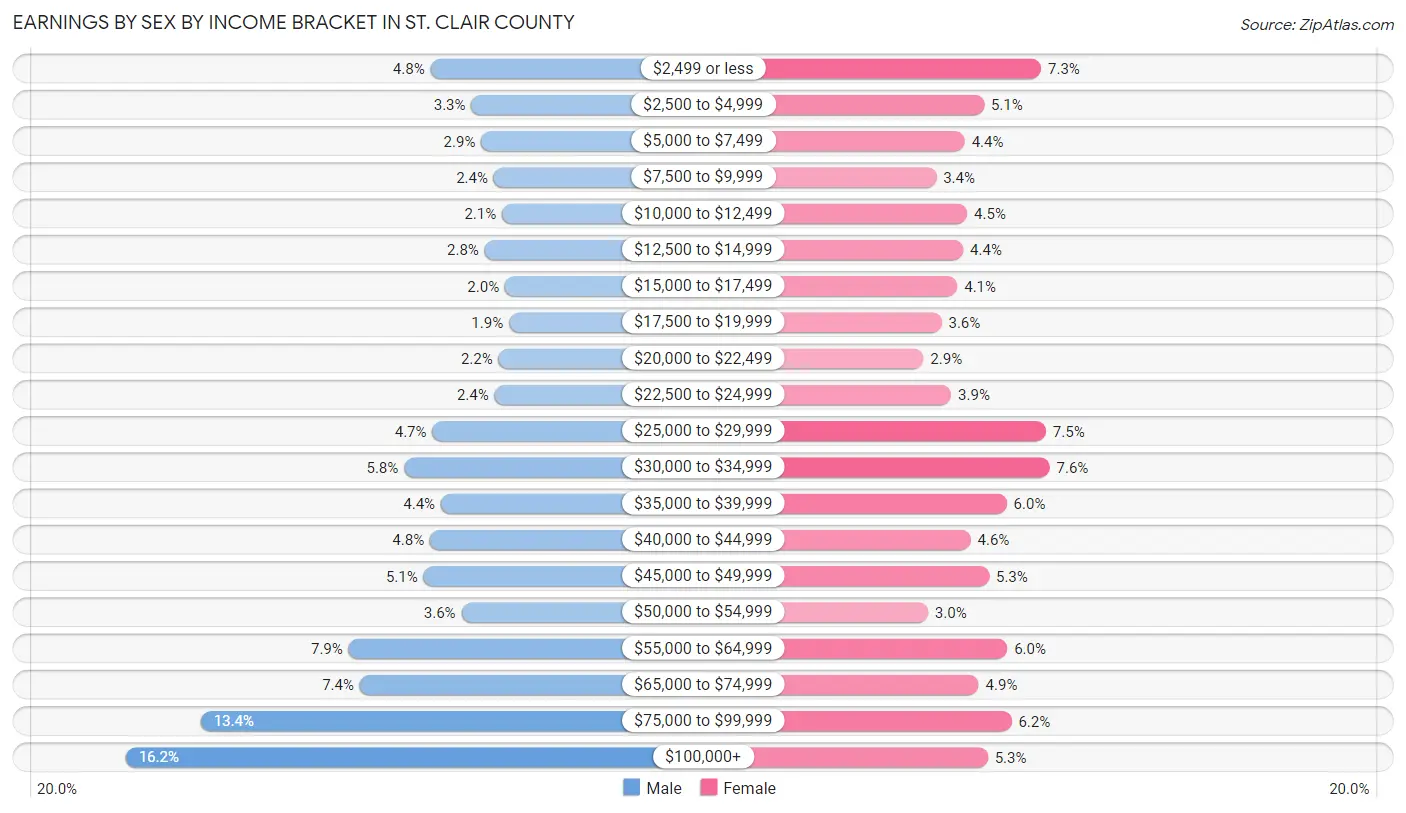
| Income | Male | Female |
| $2,499 or less | 2,138 (4.8%) | 2,739 (7.3%) |
| $2,500 to $4,999 | 1,453 (3.3%) | 1,931 (5.1%) |
| $5,000 to $7,499 | 1,288 (2.9%) | 1,662 (4.4%) |
| $7,500 to $9,999 | 1,079 (2.4%) | 1,260 (3.4%) |
| $10,000 to $12,499 | 944 (2.1%) | 1,696 (4.5%) |
| $12,500 to $14,999 | 1,232 (2.8%) | 1,641 (4.4%) |
| $15,000 to $17,499 | 894 (2.0%) | 1,557 (4.1%) |
| $17,500 to $19,999 | 825 (1.8%) | 1,335 (3.5%) |
| $20,000 to $22,499 | 1,000 (2.2%) | 1,078 (2.9%) |
| $22,500 to $24,999 | 1,067 (2.4%) | 1,470 (3.9%) |
| $25,000 to $29,999 | 2,109 (4.7%) | 2,805 (7.5%) |
| $30,000 to $34,999 | 2,578 (5.8%) | 2,859 (7.6%) |
| $35,000 to $39,999 | 1,962 (4.4%) | 2,252 (6.0%) |
| $40,000 to $44,999 | 2,146 (4.8%) | 1,745 (4.6%) |
| $45,000 to $49,999 | 2,253 (5.1%) | 2,006 (5.3%) |
| $50,000 to $54,999 | 1,619 (3.6%) | 1,144 (3.0%) |
| $55,000 to $64,999 | 3,509 (7.9%) | 2,261 (6.0%) |
| $65,000 to $74,999 | 3,320 (7.4%) | 1,857 (4.9%) |
| $75,000 to $99,999 | 5,983 (13.4%) | 2,319 (6.2%) |
| $100,000+ | 7,237 (16.2%) | 1,984 (5.3%) |
| Total | 44,636 (100.0%) | 37,601 (100.0%) |
Earnings by Sex by Educational Attainment in St. Clair County
Average earnings in St. Clair County are $56,508 for men and $33,584 for women, a difference of 40.6%. Men with an educational attainment of graduate degree enjoy the highest average annual earnings of $96,006, while those with less than high school education earn the least with $39,697. Women with an educational attainment of graduate degree earn the most with the average annual earnings of $66,338, while those with less than high school education have the smallest earnings of $17,267.
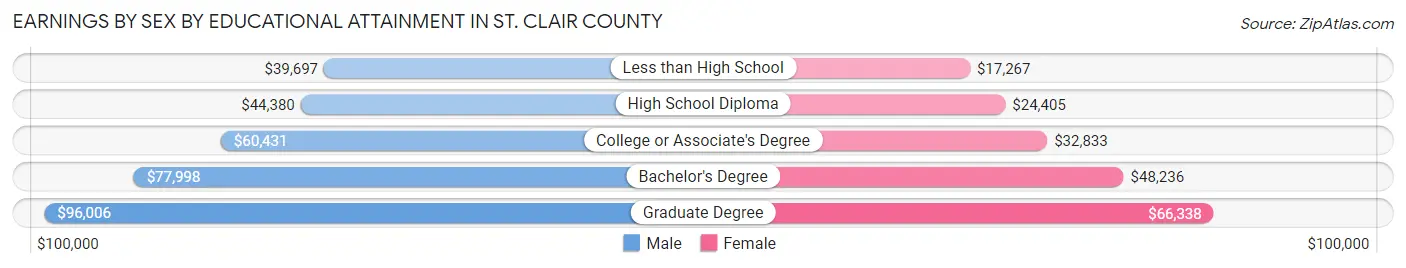
| Educational Attainment | Male Income | Female Income |
| Less than High School | $39,697 | $17,267 |
| High School Diploma | $44,380 | $24,405 |
| College or Associate's Degree | $60,431 | $32,833 |
| Bachelor's Degree | $77,998 | $48,236 |
| Graduate Degree | $96,006 | $66,338 |
| Total | $56,508 | $33,584 |
Family Income in St. Clair County
Family Income Brackets in St. Clair County
According to the St. Clair County family income data, there are 8,957 families falling into the $100,000 to $149,999 income range, which is the most common income bracket and makes up 20.2% of all families. Conversely, the $10,000 to $14,999 income bracket is the least frequent group with only 1,020 families (2.3%) belonging to this category.
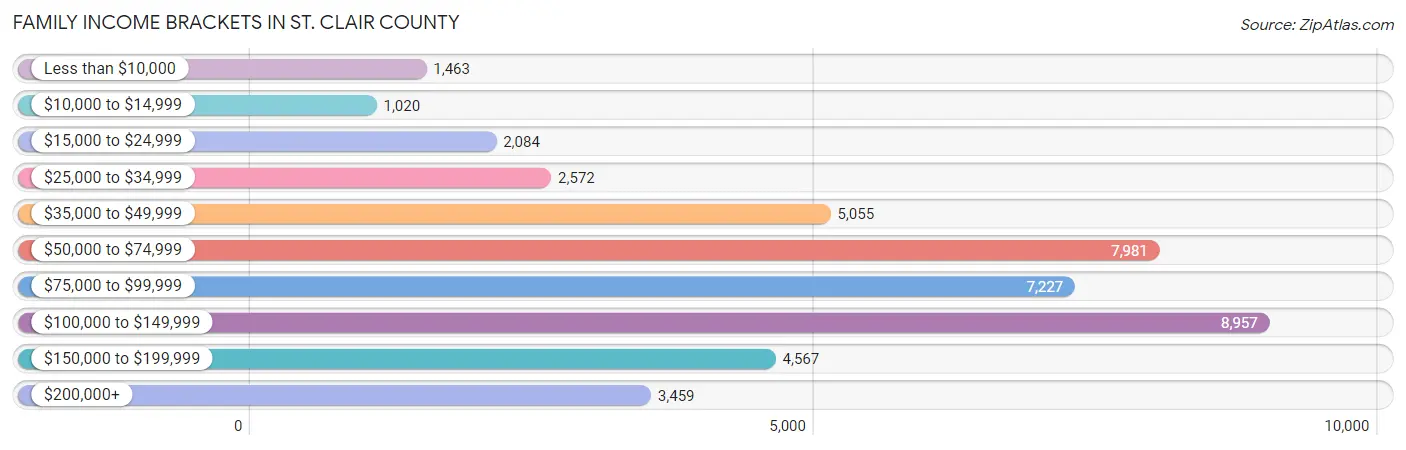
| Income Bracket | # Families | % Families |
| Less than $10,000 | 1,463 | 3.3% |
| $10,000 to $14,999 | 1,020 | 2.3% |
| $15,000 to $24,999 | 2,084 | 4.7% |
| $25,000 to $34,999 | 2,572 | 5.8% |
| $35,000 to $49,999 | 5,055 | 11.4% |
| $50,000 to $74,999 | 7,981 | 18.0% |
| $75,000 to $99,999 | 7,227 | 16.3% |
| $100,000 to $149,999 | 8,957 | 20.2% |
| $150,000 to $199,999 | 4,567 | 10.3% |
| $200,000+ | 3,459 | 7.8% |
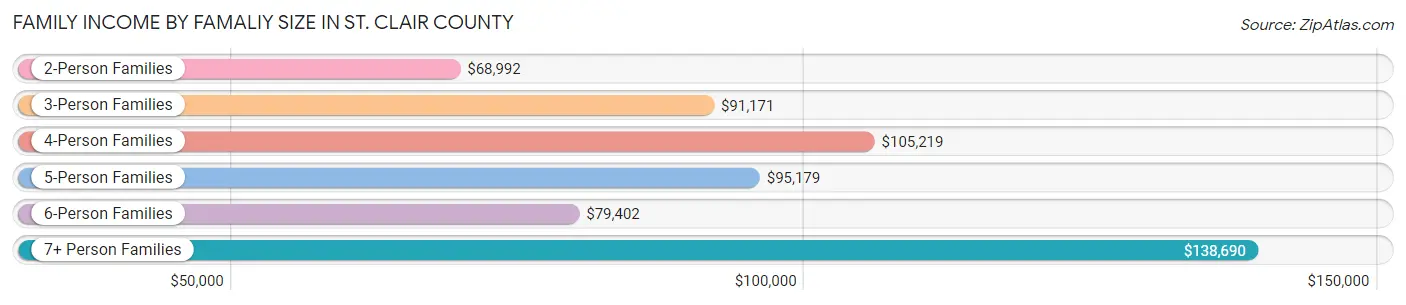
Family Income by Famaliy Size in St. Clair County
7+ person families (462 | 1.0%) account for the highest median family income in St. Clair County with $138,690 per family, while 2-person families (22,446 | 50.6%) have the highest median income of $34,496 per family member.
| Income Bracket | # Families | Median Income |
| 2-Person Families | 22,446 (50.6%) | $68,992 |
| 3-Person Families | 10,288 (23.2%) | $91,171 |
| 4-Person Families | 7,241 (16.3%) | $105,219 |
| 5-Person Families | 2,860 (6.5%) | $95,179 |
| 6-Person Families | 1,043 (2.4%) | $79,402 |
| 7+ Person Families | 462 (1.0%) | $138,690 |
| Total | 44,340 (100.0%) | $81,992 |
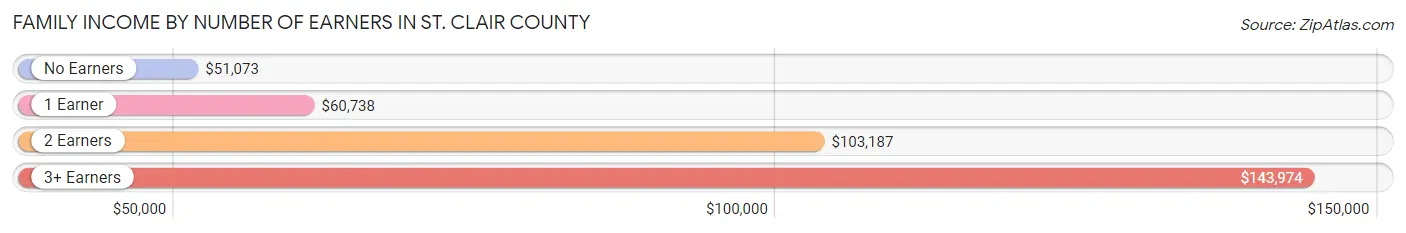
Family Income by Number of Earners in St. Clair County
The median family income in St. Clair County is $81,992, with families comprising 3+ earners (5,731) having the highest median family income of $143,974, while families with no earners (8,997) have the lowest median family income of $51,073, accounting for 12.9% and 20.3% of families, respectively.
| Number of Earners | # Families | Median Income |
| No Earners | 8,997 (20.3%) | $51,073 |
| 1 Earner | 13,838 (31.2%) | $60,738 |
| 2 Earners | 15,774 (35.6%) | $103,187 |
| 3+ Earners | 5,731 (12.9%) | $143,974 |
| Total | 44,340 (100.0%) | $81,992 |
Household Income in St. Clair County
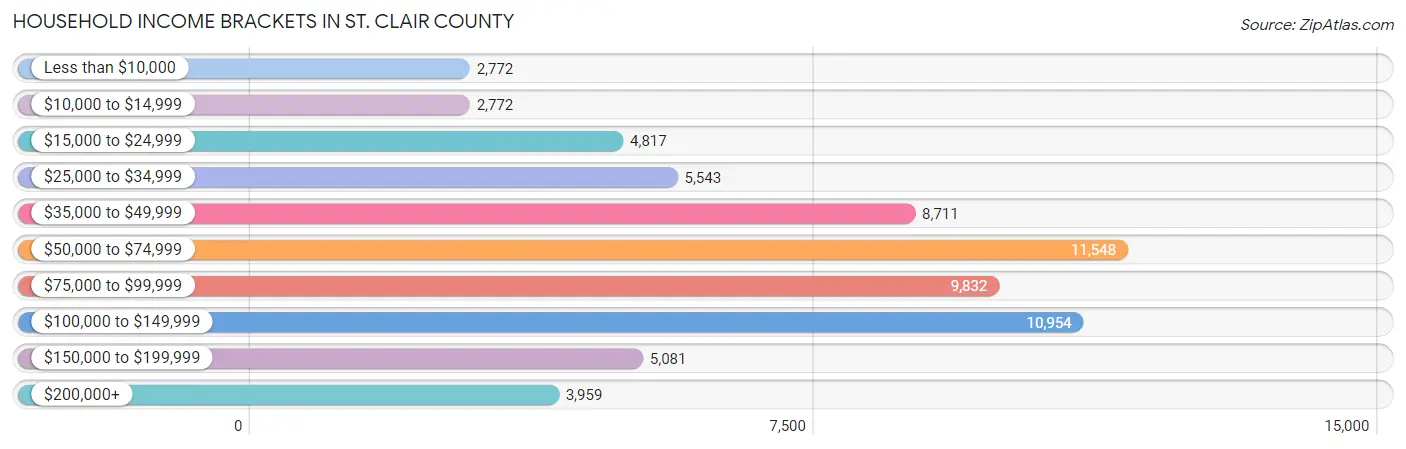
Household Income Brackets in St. Clair County
With 11,548 households falling in the category, the $50,000 to $74,999 income range is the most frequent in St. Clair County, accounting for 17.5% of all households. In contrast, only 2,772 households (4.2%) fall into the less than $10,000 income bracket, making it the least populous group.
| Income Bracket | # Households | % Households |
| Less than $10,000 | 2,772 | 4.2% |
| $10,000 to $14,999 | 2,772 | 4.2% |
| $15,000 to $24,999 | 4,817 | 7.3% |
| $25,000 to $34,999 | 5,543 | 8.4% |
| $35,000 to $49,999 | 8,711 | 13.2% |
| $50,000 to $74,999 | 11,548 | 17.5% |
| $75,000 to $99,999 | 9,832 | 14.9% |
| $100,000 to $149,999 | 10,954 | 16.6% |
| $150,000 to $199,999 | 5,081 | 7.7% |
| $200,000+ | 3,959 | 6.0% |
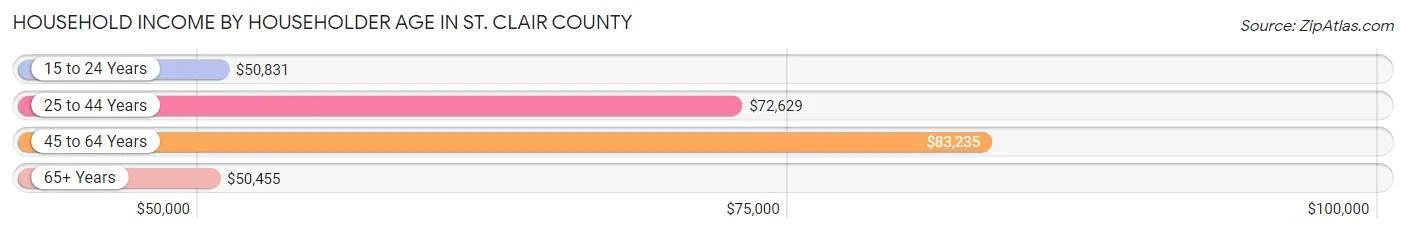
Household Income by Householder Age in St. Clair County
The median household income in St. Clair County is $66,887, with the highest median household income of $83,235 found in the 45 to 64 years age bracket for the primary householder. A total of 26,906 households (40.8%) fall into this category. Meanwhile, the 65+ years age bracket for the primary householder has the lowest median household income of $50,455, with 19,957 households (30.2%) in this group.
| Income Bracket | # Households | Median Income |
| 15 to 24 Years | 1,541 (2.3%) | $50,831 |
| 25 to 44 Years | 17,585 (26.7%) | $72,629 |
| 45 to 64 Years | 26,906 (40.8%) | $83,235 |
| 65+ Years | 19,957 (30.2%) | $50,455 |
| Total | 65,989 (100.0%) | $66,887 |
Poverty in St. Clair County
Income Below Poverty by Sex and Age in St. Clair County
With 10.7% poverty level for males and 13.0% for females among the residents of St. Clair County, 6 to 11 year old males and 5 year old females are the most vulnerable to poverty, with 1,182 males (22.4%) and 153 females (24.4%) in their respective age groups living below the poverty level.

| Age Bracket | Male | Female |
| Under 5 Years | 676 (17.3%) | 614 (16.3%) |
| 5 Years | 141 (22.3%) | 153 (24.4%) |
| 6 to 11 Years | 1,182 (22.4%) | 1,046 (19.5%) |
| 12 to 14 Years | 582 (16.9%) | 324 (12.0%) |
| 15 Years | 117 (13.4%) | 181 (18.8%) |
| 16 and 17 Years | 202 (8.3%) | 356 (16.3%) |
| 18 to 24 Years | 820 (12.2%) | 771 (12.9%) |
| 25 to 34 Years | 1,102 (12.1%) | 1,815 (21.1%) |
| 35 to 44 Years | 760 (8.5%) | 1,117 (12.1%) |
| 45 to 54 Years | 920 (8.4%) | 1,005 (9.4%) |
| 55 to 64 Years | 1,126 (8.8%) | 1,382 (10.8%) |
| 65 to 74 Years | 619 (6.7%) | 787 (8.3%) |
| 75 Years and over | 277 (5.6%) | 686 (10.2%) |
| Total | 8,524 (10.7%) | 10,237 (13.0%) |
Income Above Poverty by Sex and Age in St. Clair County
According to the poverty statistics in St. Clair County, males aged 75 years and over and females aged 65 to 74 years are the age groups that are most secure financially, with 94.4% of males and 91.7% of females in these age groups living above the poverty line.
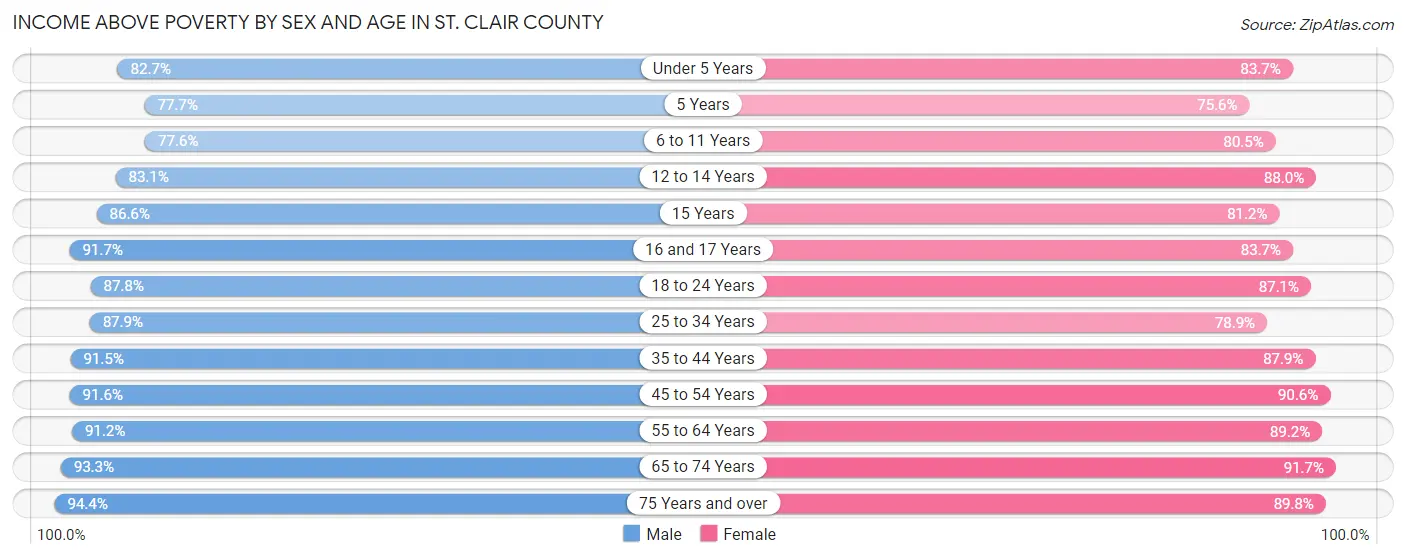
| Age Bracket | Male | Female |
| Under 5 Years | 3,238 (82.7%) | 3,145 (83.7%) |
| 5 Years | 492 (77.7%) | 475 (75.6%) |
| 6 to 11 Years | 4,101 (77.6%) | 4,317 (80.5%) |
| 12 to 14 Years | 2,865 (83.1%) | 2,380 (88.0%) |
| 15 Years | 758 (86.6%) | 781 (81.2%) |
| 16 and 17 Years | 2,221 (91.7%) | 1,831 (83.7%) |
| 18 to 24 Years | 5,880 (87.8%) | 5,186 (87.1%) |
| 25 to 34 Years | 8,012 (87.9%) | 6,792 (78.9%) |
| 35 to 44 Years | 8,156 (91.5%) | 8,087 (87.9%) |
| 45 to 54 Years | 10,077 (91.6%) | 9,724 (90.6%) |
| 55 to 64 Years | 11,670 (91.2%) | 11,359 (89.1%) |
| 65 to 74 Years | 8,577 (93.3%) | 8,684 (91.7%) |
| 75 Years and over | 4,703 (94.4%) | 6,048 (89.8%) |
| Total | 70,750 (89.2%) | 68,809 (87.1%) |
Income Below Poverty Among Married-Couple Families in St. Clair County
The poverty statistics for married-couple families in St. Clair County show that 4.2% or 1,405 of the total 33,295 families live below the poverty line. Families with 5 or more children have the highest poverty rate of 24.5%, comprising of 39 families. On the other hand, families with no children have the lowest poverty rate of 3.4%, which includes 765 families.
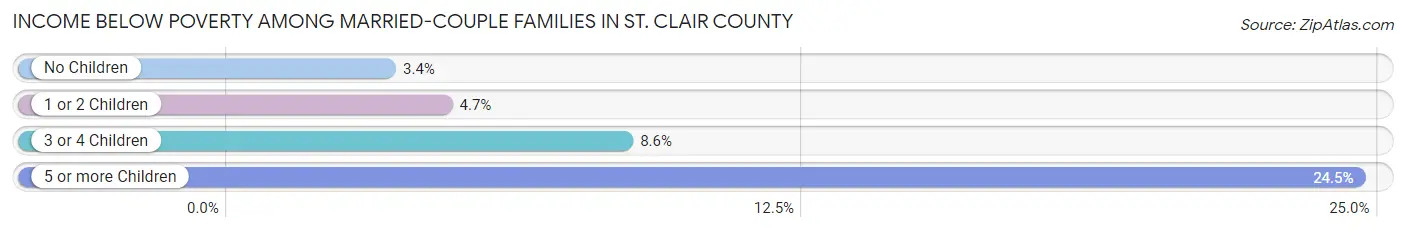
| Children | Above Poverty | Below Poverty |
| No Children | 21,442 (96.6%) | 765 (3.4%) |
| 1 or 2 Children | 8,214 (95.3%) | 402 (4.7%) |
| 3 or 4 Children | 2,114 (91.4%) | 199 (8.6%) |
| 5 or more Children | 120 (75.5%) | 39 (24.5%) |
| Total | 31,890 (95.8%) | 1,405 (4.2%) |
Income Below Poverty Among Single-Parent Households in St. Clair County
According to the poverty data in St. Clair County, 14.9% or 520 single-father households and 25.4% or 1,918 single-mother households are living below the poverty line. Among single-father households, those with 3 or 4 children have the highest poverty rate, with 36 households (20.8%) experiencing poverty. Likewise, among single-mother households, those with 3 or 4 children have the highest poverty rate, with 552 households (69.0%) falling below the poverty line.
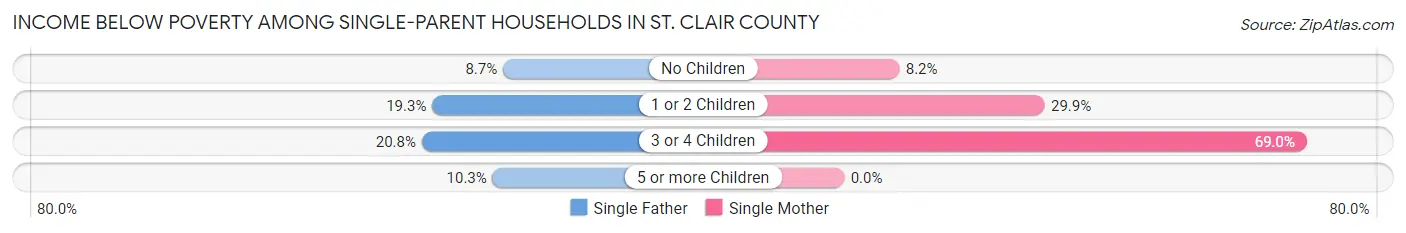
| Children | Single Father | Single Mother |
| No Children | 126 (8.7%) | 246 (8.2%) |
| 1 or 2 Children | 354 (19.3%) | 1,120 (29.9%) |
| 3 or 4 Children | 36 (20.8%) | 552 (69.0%) |
| 5 or more Children | 4 (10.3%) | 0 (0.0%) |
| Total | 520 (14.9%) | 1,918 (25.4%) |
Income Below Poverty Among Married-Couple vs Single-Parent Households in St. Clair County
The poverty data for St. Clair County shows that 1,405 of the married-couple family households (4.2%) and 2,438 of the single-parent households (22.1%) are living below the poverty level. Within the married-couple family households, those with 5 or more children have the highest poverty rate, with 39 households (24.5%) falling below the poverty line. Among the single-parent households, those with 3 or 4 children have the highest poverty rate, with 588 household (60.4%) living below poverty.
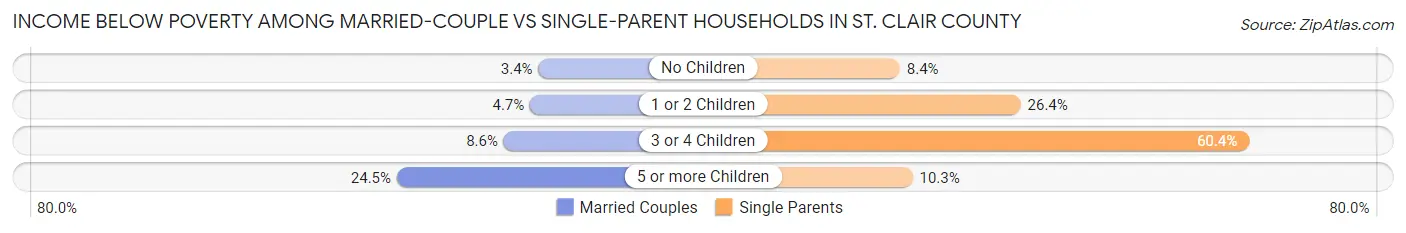
| Children | Married-Couple Families | Single-Parent Households |
| No Children | 765 (3.4%) | 372 (8.4%) |
| 1 or 2 Children | 402 (4.7%) | 1,474 (26.4%) |
| 3 or 4 Children | 199 (8.6%) | 588 (60.4%) |
| 5 or more Children | 39 (24.5%) | 4 (10.3%) |
| Total | 1,405 (4.2%) | 2,438 (22.1%) |
Employment Characteristics in St. Clair County
Employment by Class of Employer in St. Clair County
Among the 71,975 employed individuals in St. Clair County, private company employees (51,305 | 71.3%), not-for-profit organizations (5,631 | 7.8%), and local government employees (5,213 | 7.2%) make up the most common classes of employment.
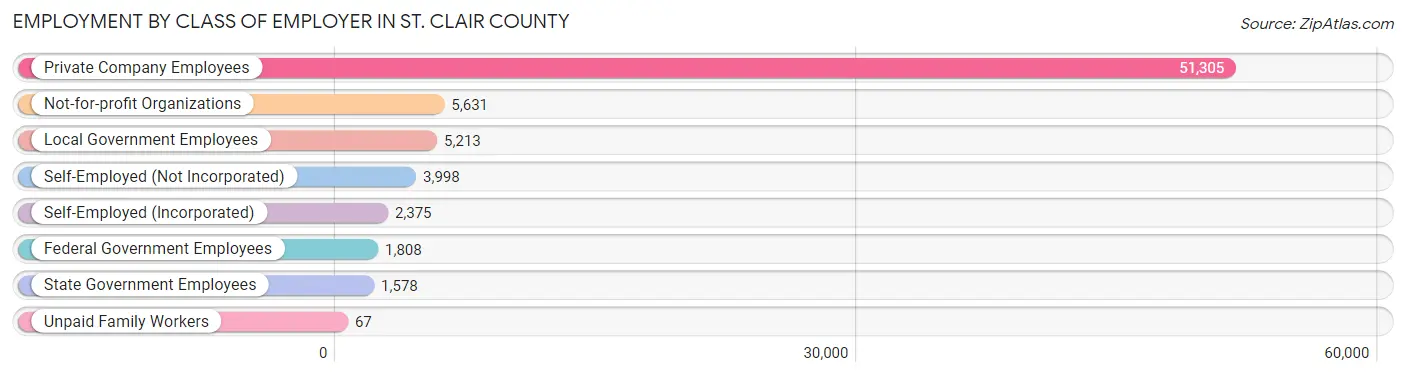
| Employer Class | # Employees | % Employees |
| Private Company Employees | 51,305 | 71.3% |
| Self-Employed (Incorporated) | 2,375 | 3.3% |
| Self-Employed (Not Incorporated) | 3,998 | 5.6% |
| Not-for-profit Organizations | 5,631 | 7.8% |
| Local Government Employees | 5,213 | 7.2% |
| State Government Employees | 1,578 | 2.2% |
| Federal Government Employees | 1,808 | 2.5% |
| Unpaid Family Workers | 67 | 0.1% |
| Total | 71,975 | 100.0% |
Employment Status by Age in St. Clair County
According to the labor force statistics for St. Clair County, out of the total population over 16 years of age (131,970), 60.2% or 79,446 individuals are in the labor force, with 6.7% or 5,323 of them unemployed. The age group with the highest labor force participation rate is 30 to 34 years, with 85.4% or 7,346 individuals in the labor force. Within the labor force, the 16 to 19 years age range has the highest percentage of unemployed individuals, with 16.9% or 664 of them being unemployed.
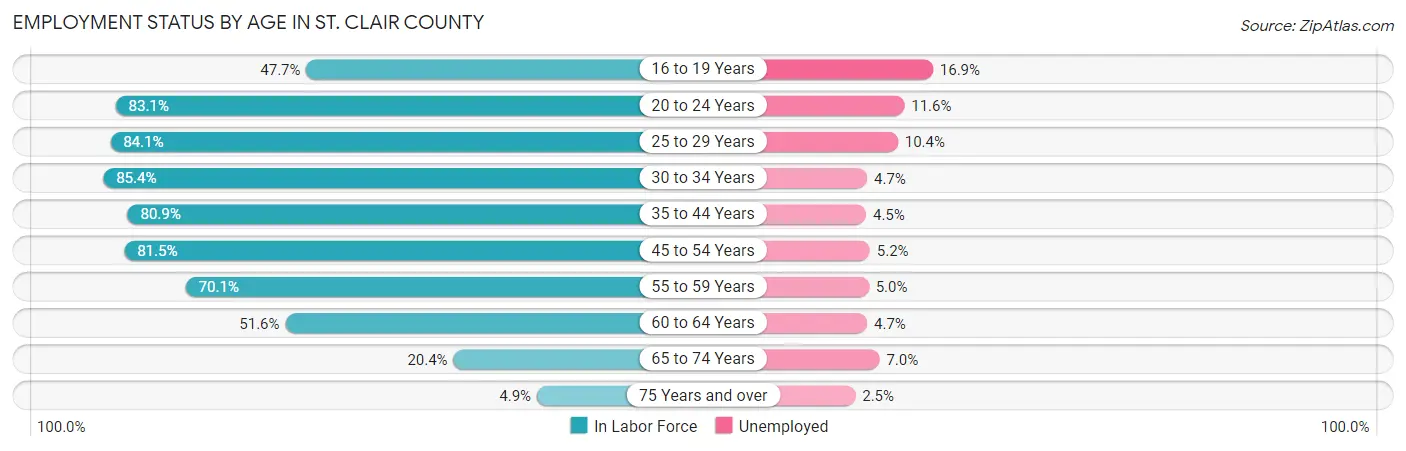
| Age Bracket | In Labor Force | Unemployed |
| 16 to 19 Years | 3,931 (47.7%) | 664 (16.9%) |
| 20 to 24 Years | 7,586 (83.1%) | 880 (11.6%) |
| 25 to 29 Years | 7,793 (84.1%) | 810 (10.4%) |
| 30 to 34 Years | 7,346 (85.4%) | 345 (4.7%) |
| 35 to 44 Years | 14,780 (80.9%) | 665 (4.5%) |
| 45 to 54 Years | 17,764 (81.5%) | 924 (5.2%) |
| 55 to 59 Years | 9,429 (70.1%) | 471 (5.0%) |
| 60 to 64 Years | 6,294 (51.6%) | 296 (4.7%) |
| 65 to 74 Years | 3,851 (20.4%) | 270 (7.0%) |
| 75 Years and over | 595 (4.9%) | 15 (2.5%) |
| Total | 79,446 (60.2%) | 5,323 (6.7%) |
Employment Status by Educational Attainment in St. Clair County
According to labor force statistics for St. Clair County, 75.9% of individuals (63,438) out of the total population between 25 and 64 years of age (83,581) are in the labor force, with 5.5% or 3,489 of them being unemployed. The group with the highest labor force participation rate are those with the educational attainment of bachelor's degree or higher, with 85.7% or 14,644 individuals in the labor force. Within the labor force, individuals with less than high school education have the highest percentage of unemployment, with 11.2% or 416 of them being unemployed.
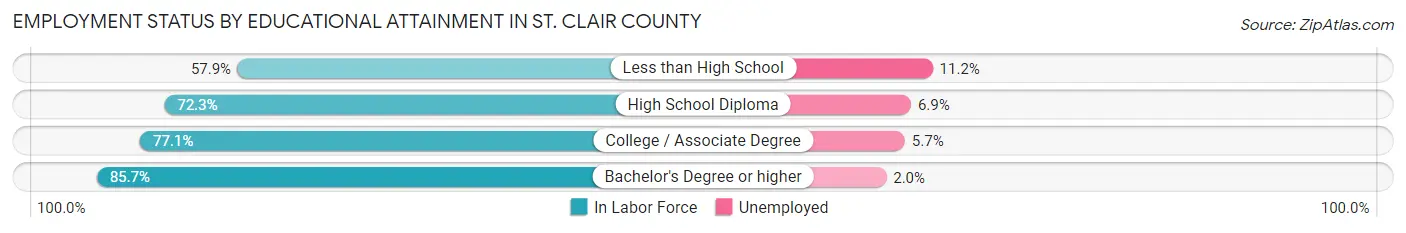
| Educational Attainment | In Labor Force | Unemployed |
| Less than High School | 3,716 (57.9%) | 719 (11.2%) |
| High School Diploma | 18,687 (72.3%) | 1,783 (6.9%) |
| College / Associate Degree | 26,391 (77.1%) | 1,951 (5.7%) |
| Bachelor's Degree or higher | 14,644 (85.7%) | 342 (2.0%) |
| Total | 63,438 (75.9%) | 4,597 (5.5%) |
Employment Occupations by Sex in St. Clair County
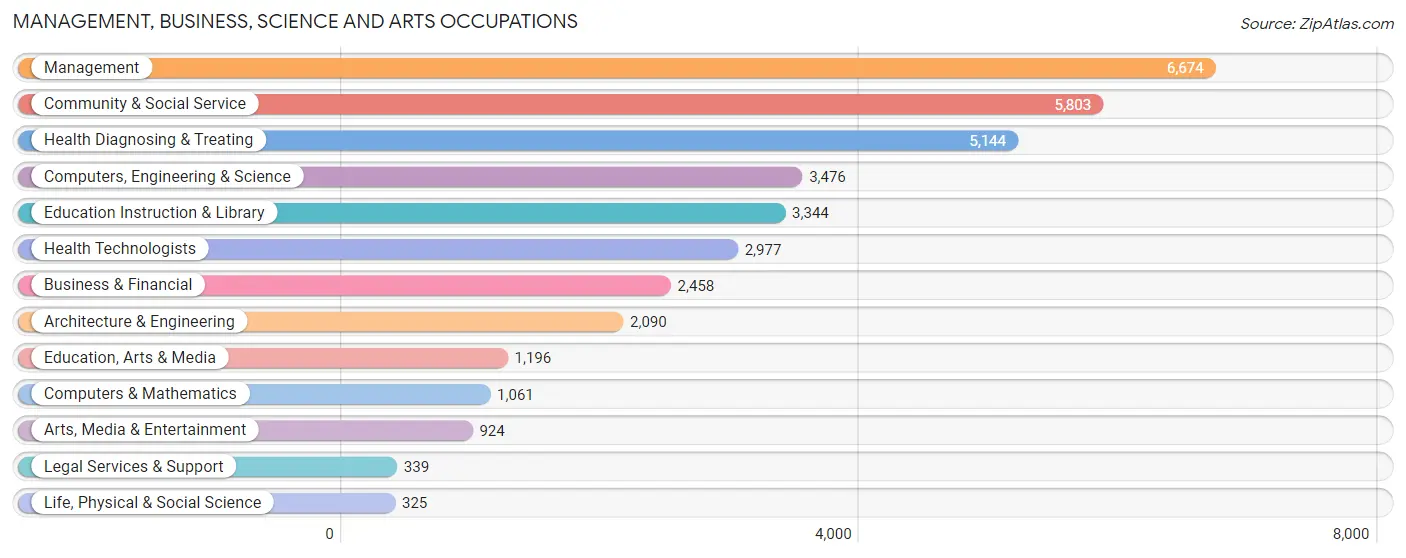
Management, Business, Science and Arts Occupations
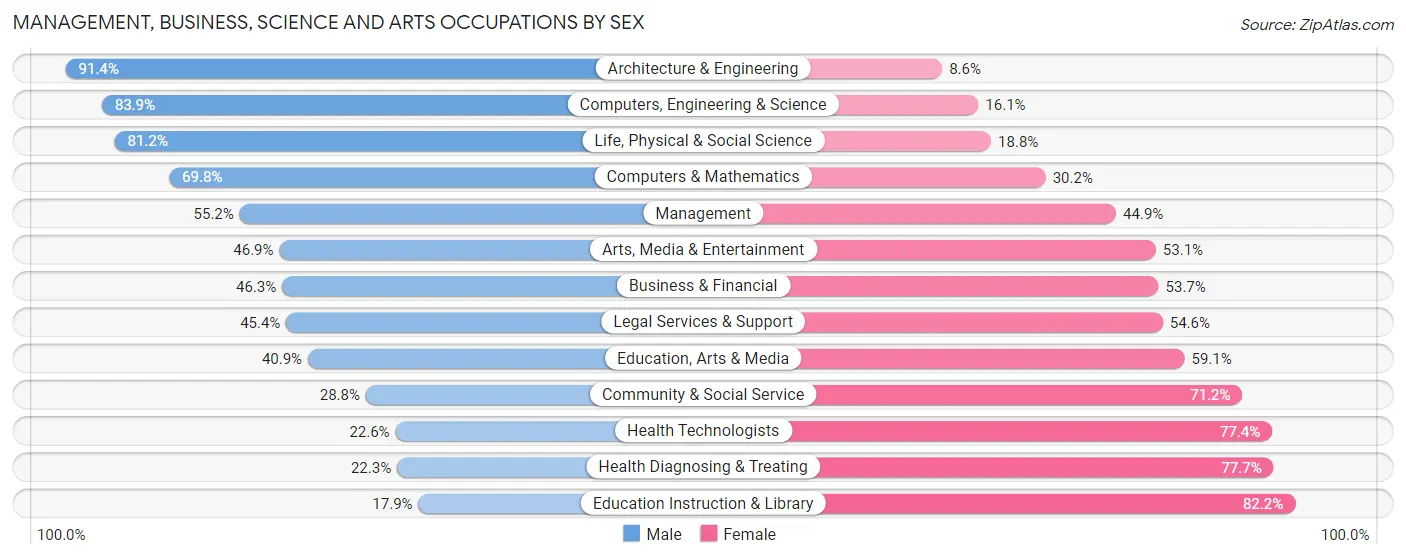
The most common Management, Business, Science and Arts occupations in St. Clair County are Management (6,674 | 9.0%), Community & Social Service (5,803 | 7.9%), Health Diagnosing & Treating (5,144 | 7.0%), Computers, Engineering & Science (3,476 | 4.7%), and Education Instruction & Library (3,344 | 4.5%).
Management, Business, Science and Arts Occupations by Sex
Within the Management, Business, Science and Arts occupations in St. Clair County, the most male-oriented occupations are Architecture & Engineering (91.4%), Computers, Engineering & Science (83.9%), and Life, Physical & Social Science (81.2%), while the most female-oriented occupations are Education Instruction & Library (82.2%), Health Diagnosing & Treating (77.7%), and Health Technologists (77.4%).
| Occupation | Male | Female |
| Management | 3,681 (55.1%) | 2,993 (44.9%) |
| Business & Financial | 1,138 (46.3%) | 1,320 (53.7%) |
| Computers, Engineering & Science | 2,916 (83.9%) | 560 (16.1%) |
| Computers & Mathematics | 741 (69.8%) | 320 (30.2%) |
| Architecture & Engineering | 1,911 (91.4%) | 179 (8.6%) |
| Life, Physical & Social Science | 264 (81.2%) | 61 (18.8%) |
| Community & Social Service | 1,673 (28.8%) | 4,130 (71.2%) |
| Education, Arts & Media | 489 (40.9%) | 707 (59.1%) |
| Legal Services & Support | 154 (45.4%) | 185 (54.6%) |
| Education Instruction & Library | 597 (17.8%) | 2,747 (82.2%) |
| Arts, Media & Entertainment | 433 (46.9%) | 491 (53.1%) |
| Health Diagnosing & Treating | 1,148 (22.3%) | 3,996 (77.7%) |
| Health Technologists | 674 (22.6%) | 2,303 (77.4%) |
| Total (Category) | 10,556 (44.8%) | 12,999 (55.2%) |
| Total (Overall) | 40,002 (54.1%) | 33,962 (45.9%) |
Services Occupations
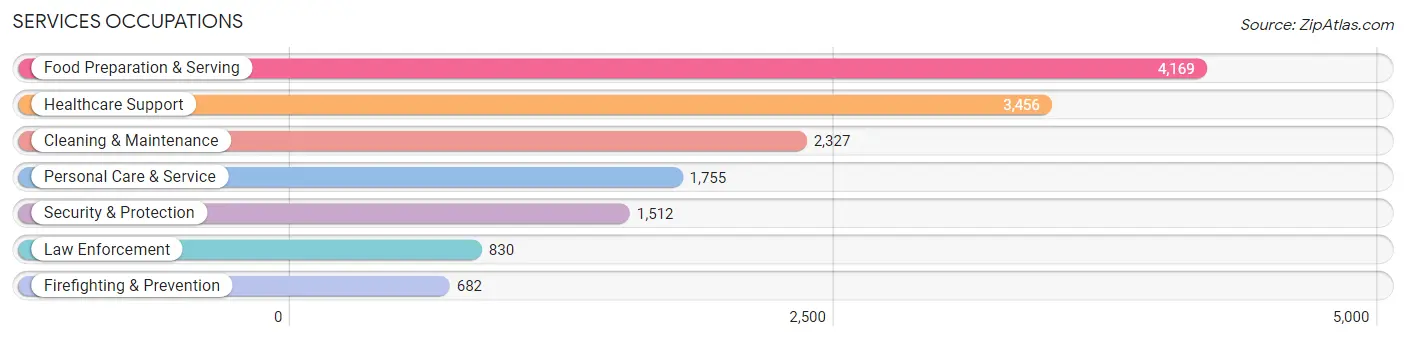
The most common Services occupations in St. Clair County are Food Preparation & Serving (4,169 | 5.6%), Healthcare Support (3,456 | 4.7%), Cleaning & Maintenance (2,327 | 3.2%), Personal Care & Service (1,755 | 2.4%), and Security & Protection (1,512 | 2.0%).
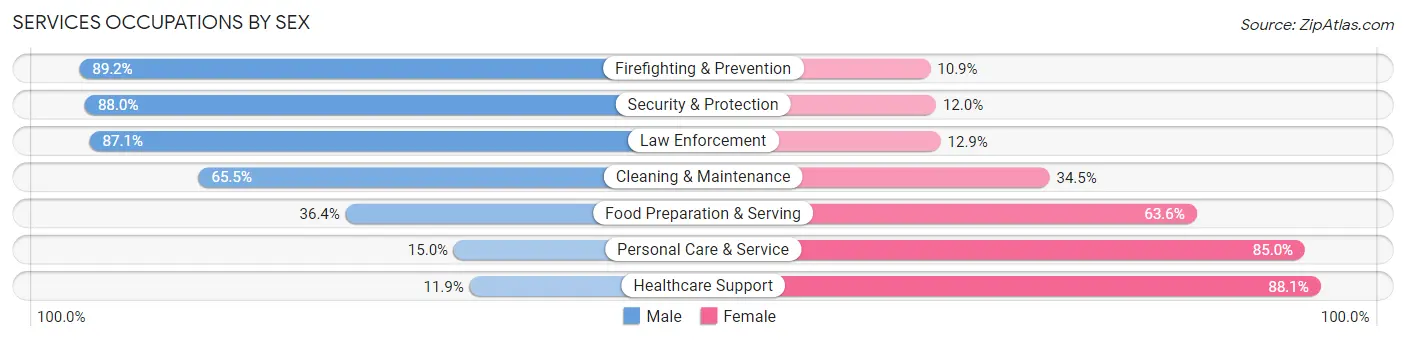
Services Occupations by Sex
Within the Services occupations in St. Clair County, the most male-oriented occupations are Firefighting & Prevention (89.1%), Security & Protection (88.0%), and Law Enforcement (87.1%), while the most female-oriented occupations are Healthcare Support (88.1%), Personal Care & Service (85.0%), and Food Preparation & Serving (63.6%).
| Occupation | Male | Female |
| Healthcare Support | 411 (11.9%) | 3,045 (88.1%) |
| Security & Protection | 1,331 (88.0%) | 181 (12.0%) |
| Firefighting & Prevention | 608 (89.1%) | 74 (10.8%) |
| Law Enforcement | 723 (87.1%) | 107 (12.9%) |
| Food Preparation & Serving | 1,519 (36.4%) | 2,650 (63.6%) |
| Cleaning & Maintenance | 1,525 (65.5%) | 802 (34.5%) |
| Personal Care & Service | 263 (15.0%) | 1,492 (85.0%) |
| Total (Category) | 5,049 (38.2%) | 8,170 (61.8%) |
| Total (Overall) | 40,002 (54.1%) | 33,962 (45.9%) |
Sales and Office Occupations
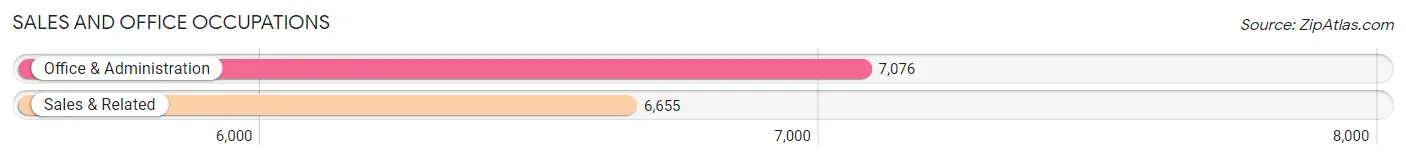
The most common Sales and Office occupations in St. Clair County are Office & Administration (7,076 | 9.6%), and Sales & Related (6,655 | 9.0%).
Sales and Office Occupations by Sex
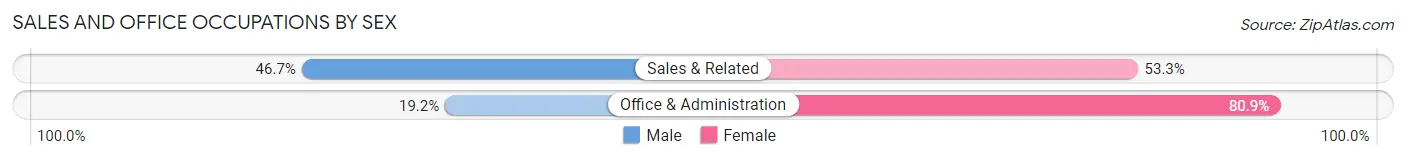
| Occupation | Male | Female |
| Sales & Related | 3,109 (46.7%) | 3,546 (53.3%) |
| Office & Administration | 1,355 (19.2%) | 5,721 (80.8%) |
| Total (Category) | 4,464 (32.5%) | 9,267 (67.5%) |
| Total (Overall) | 40,002 (54.1%) | 33,962 (45.9%) |
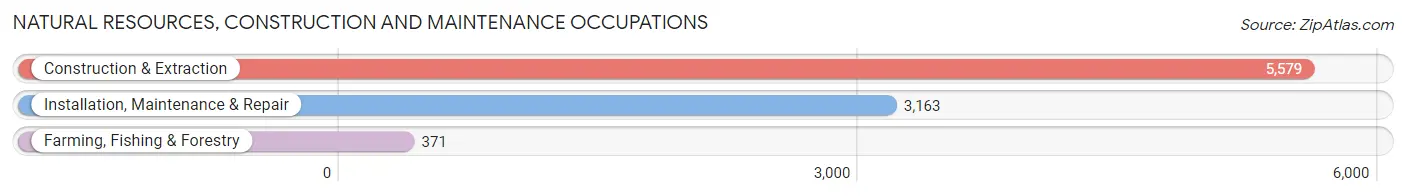
Natural Resources, Construction and Maintenance Occupations
The most common Natural Resources, Construction and Maintenance occupations in St. Clair County are Construction & Extraction (5,579 | 7.5%), Installation, Maintenance & Repair (3,163 | 4.3%), and Farming, Fishing & Forestry (371 | 0.5%).
Natural Resources, Construction and Maintenance Occupations by Sex
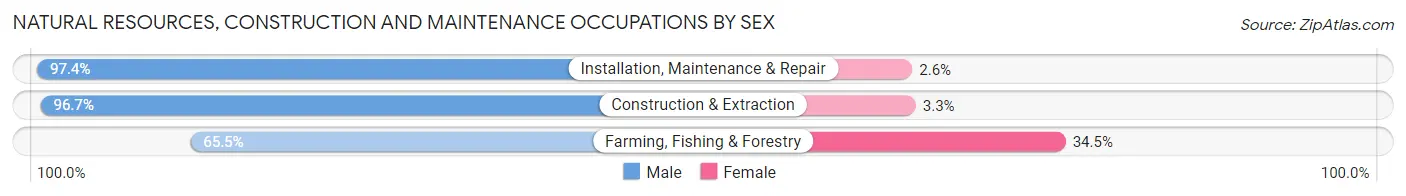
| Occupation | Male | Female |
| Farming, Fishing & Forestry | 243 (65.5%) | 128 (34.5%) |
| Construction & Extraction | 5,394 (96.7%) | 185 (3.3%) |
| Installation, Maintenance & Repair | 3,081 (97.4%) | 82 (2.6%) |
| Total (Category) | 8,718 (95.7%) | 395 (4.3%) |
| Total (Overall) | 40,002 (54.1%) | 33,962 (45.9%) |
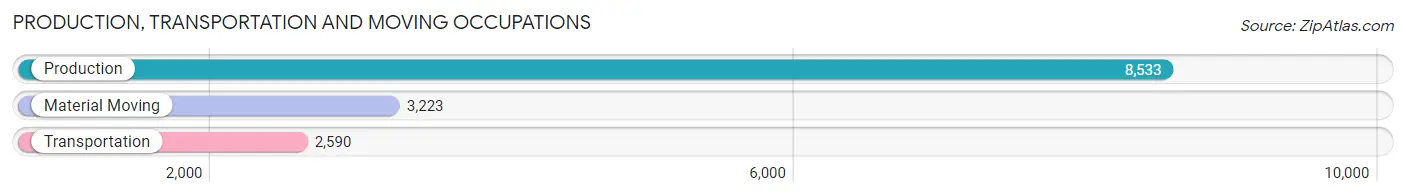
Production, Transportation and Moving Occupations
The most common Production, Transportation and Moving occupations in St. Clair County are Production (8,533 | 11.5%), Material Moving (3,223 | 4.4%), and Transportation (2,590 | 3.5%).
Production, Transportation and Moving Occupations by Sex
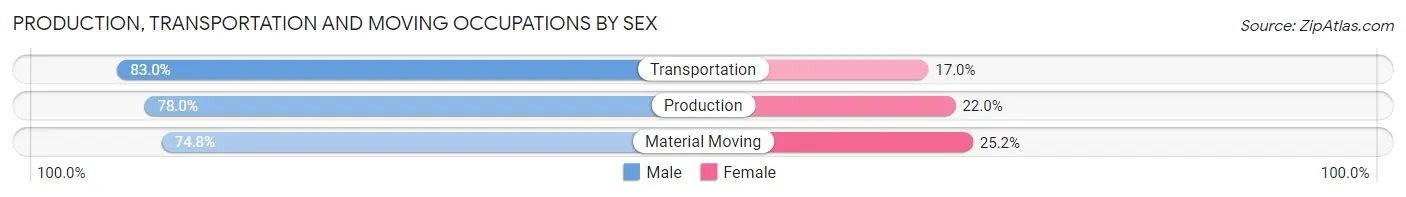
| Occupation | Male | Female |
| Production | 6,655 (78.0%) | 1,878 (22.0%) |
| Transportation | 2,149 (83.0%) | 441 (17.0%) |
| Material Moving | 2,411 (74.8%) | 812 (25.2%) |
| Total (Category) | 11,215 (78.2%) | 3,131 (21.8%) |
| Total (Overall) | 40,002 (54.1%) | 33,962 (45.9%) |
Employment Industries by Sex in St. Clair County
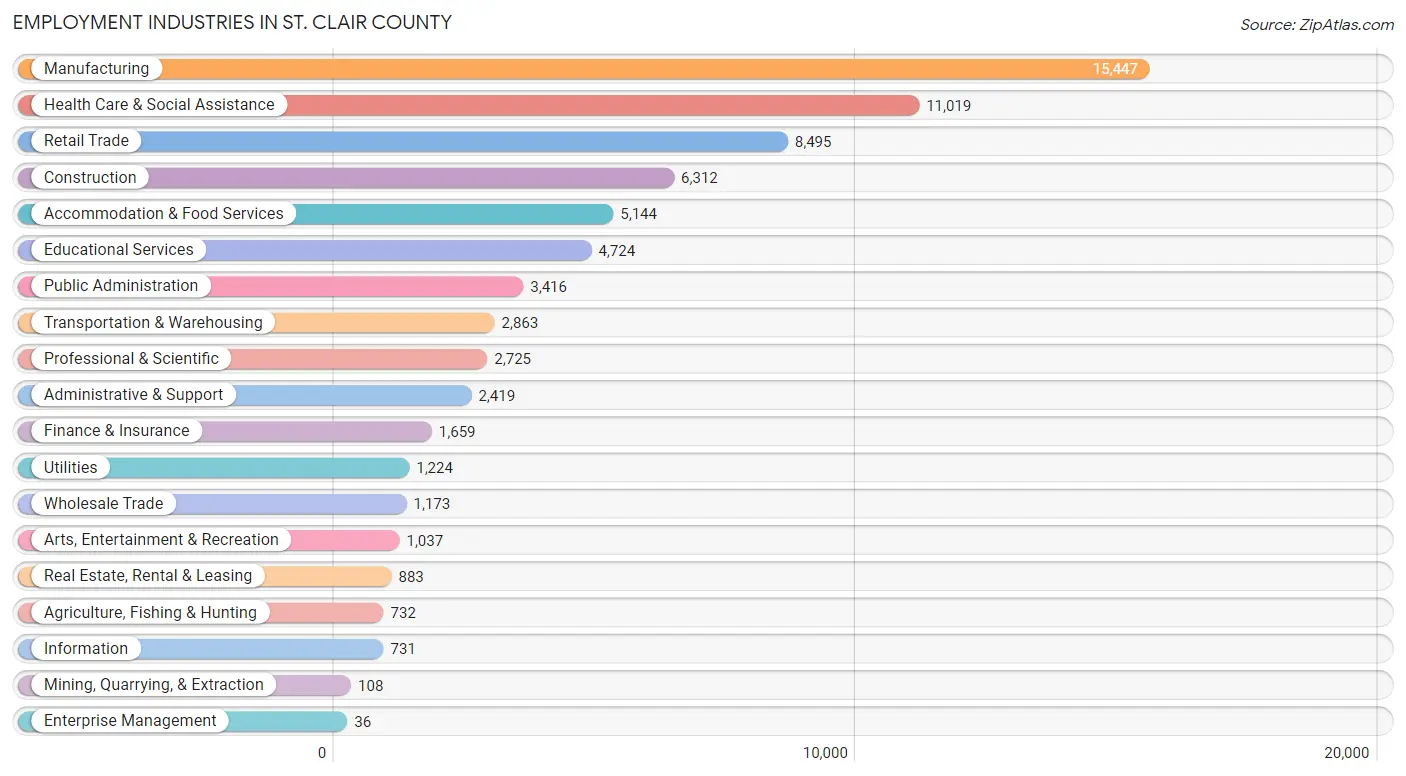
Employment Industries in St. Clair County
The major employment industries in St. Clair County include Manufacturing (15,447 | 20.9%), Health Care & Social Assistance (11,019 | 14.9%), Retail Trade (8,495 | 11.5%), Construction (6,312 | 8.5%), and Accommodation & Food Services (5,144 | 7.0%).
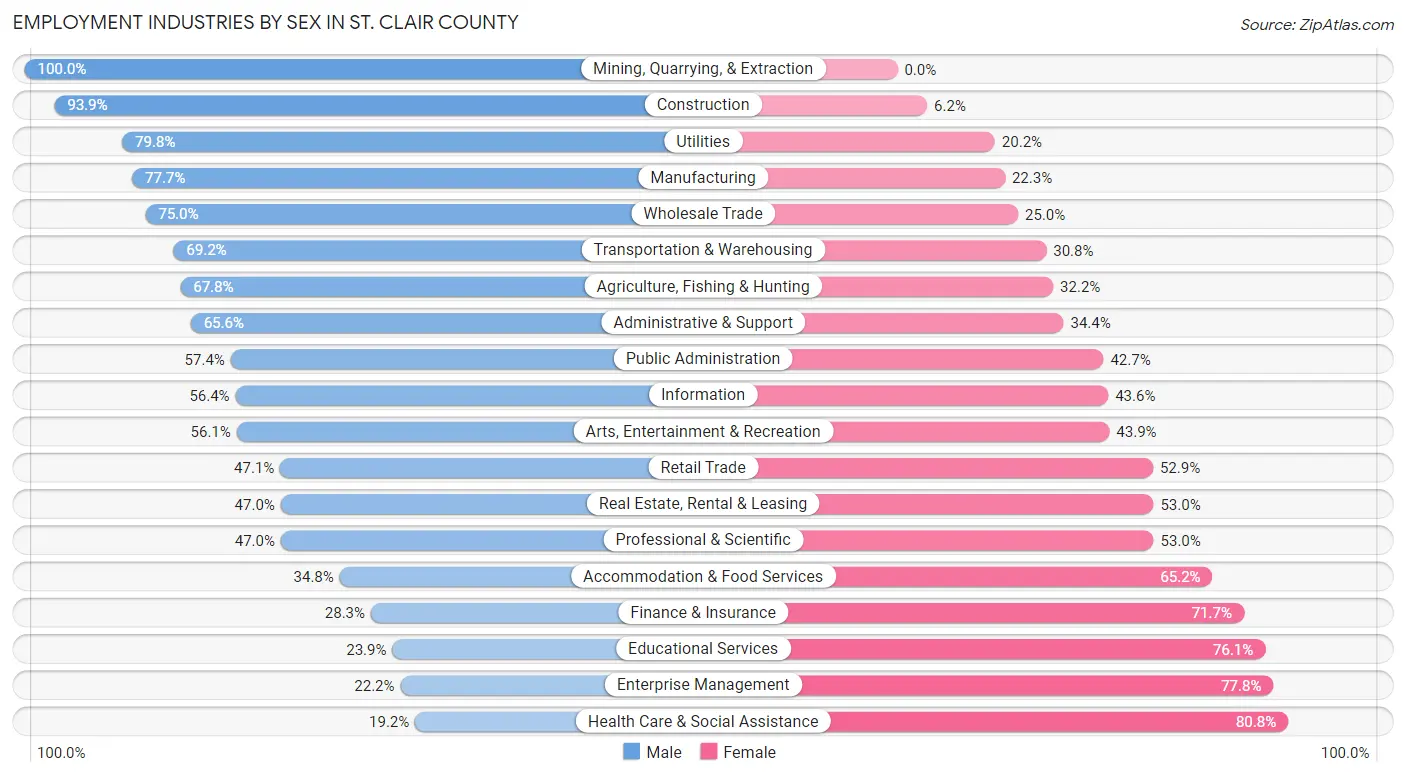
Employment Industries by Sex in St. Clair County
The St. Clair County industries that see more men than women are Mining, Quarrying, & Extraction (100.0%), Construction (93.9%), and Utilities (79.8%), whereas the industries that tend to have a higher number of women are Health Care & Social Assistance (80.8%), Enterprise Management (77.8%), and Educational Services (76.1%).
| Industry | Male | Female |
| Agriculture, Fishing & Hunting | 496 (67.8%) | 236 (32.2%) |
| Mining, Quarrying, & Extraction | 108 (100.0%) | 0 (0.0%) |
| Construction | 5,924 (93.9%) | 388 (6.1%) |
| Manufacturing | 12,008 (77.7%) | 3,439 (22.3%) |
| Wholesale Trade | 880 (75.0%) | 293 (25.0%) |
| Retail Trade | 4,001 (47.1%) | 4,494 (52.9%) |
| Transportation & Warehousing | 1,981 (69.2%) | 882 (30.8%) |
| Utilities | 977 (79.8%) | 247 (20.2%) |
| Information | 412 (56.4%) | 319 (43.6%) |
| Finance & Insurance | 470 (28.3%) | 1,189 (71.7%) |
| Real Estate, Rental & Leasing | 415 (47.0%) | 468 (53.0%) |
| Professional & Scientific | 1,280 (47.0%) | 1,445 (53.0%) |
| Enterprise Management | 8 (22.2%) | 28 (77.8%) |
| Administrative & Support | 1,587 (65.6%) | 832 (34.4%) |
| Educational Services | 1,129 (23.9%) | 3,595 (76.1%) |
| Health Care & Social Assistance | 2,112 (19.2%) | 8,907 (80.8%) |
| Arts, Entertainment & Recreation | 582 (56.1%) | 455 (43.9%) |
| Accommodation & Food Services | 1,790 (34.8%) | 3,354 (65.2%) |
| Public Administration | 1,959 (57.4%) | 1,457 (42.6%) |
| Total | 40,002 (54.1%) | 33,962 (45.9%) |
Education in St. Clair County
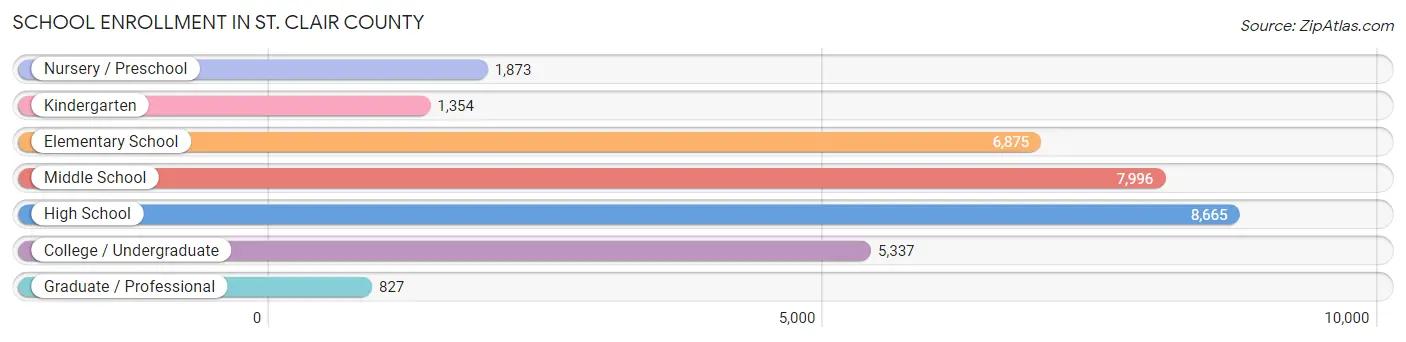
School Enrollment in St. Clair County
The most common levels of schooling among the 32,927 students in St. Clair County are high school (8,665 | 26.3%), middle school (7,996 | 24.3%), and elementary school (6,875 | 20.9%).
| School Level | # Students | % Students |
| Nursery / Preschool | 1,873 | 5.7% |
| Kindergarten | 1,354 | 4.1% |
| Elementary School | 6,875 | 20.9% |
| Middle School | 7,996 | 24.3% |
| High School | 8,665 | 26.3% |
| College / Undergraduate | 5,337 | 16.2% |
| Graduate / Professional | 827 | 2.5% |
| Total | 32,927 | 100.0% |
School Enrollment by Age by Funding Source in St. Clair County
Out of a total of 32,927 students who are enrolled in schools in St. Clair County, 3,885 (11.8%) attend a private institution, while the remaining 29,042 (88.2%) are enrolled in public schools. The age group of 3 to 4 year olds has the highest likelihood of being enrolled in private schools, with 540 (40.5% in the age bracket) enrolled. Conversely, the age group of 18 to 19 year olds has the lowest likelihood of being enrolled in a private school, with 2,214 (94.0% in the age bracket) attending a public institution.
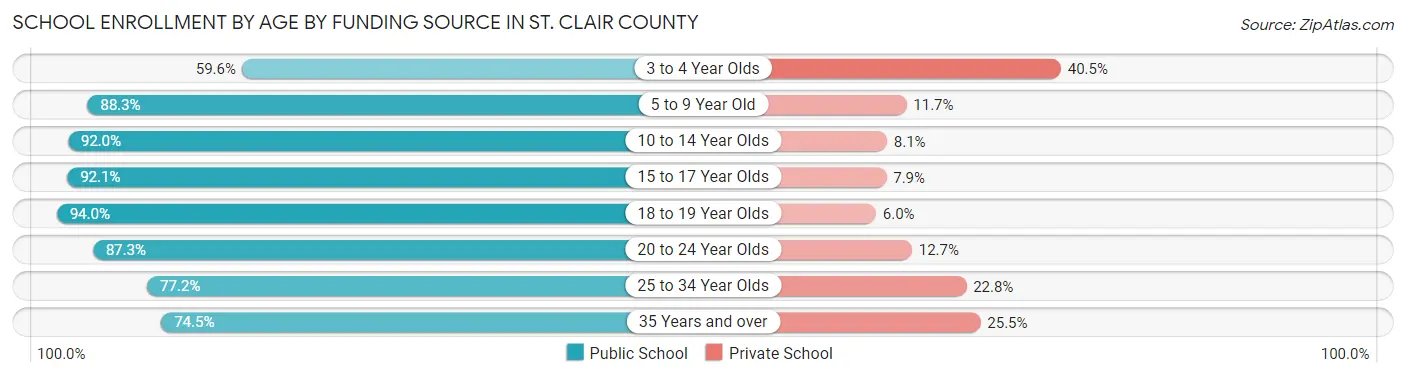
| Age Bracket | Public School | Private School |
| 3 to 4 Year Olds | 795 (59.6%) | 540 (40.5%) |
| 5 to 9 Year Old | 6,838 (88.3%) | 904 (11.7%) |
| 10 to 14 Year Olds | 9,115 (91.9%) | 798 (8.1%) |
| 15 to 17 Year Olds | 5,669 (92.1%) | 489 (7.9%) |
| 18 to 19 Year Olds | 2,214 (94.0%) | 141 (6.0%) |
| 20 to 24 Year Olds | 2,202 (87.3%) | 320 (12.7%) |
| 25 to 34 Year Olds | 1,194 (77.2%) | 353 (22.8%) |
| 35 Years and over | 1,010 (74.5%) | 345 (25.5%) |
| Total | 29,042 (88.2%) | 3,885 (11.8%) |
Educational Attainment by Field of Study in St. Clair County
Business (5,028 | 20.5%), education (4,417 | 18.0%), science & technology (2,901 | 11.8%), arts & humanities (2,084 | 8.5%), and engineering (1,952 | 8.0%) are the most common fields of study among 24,512 individuals in St. Clair County who have obtained a bachelor's degree or higher.
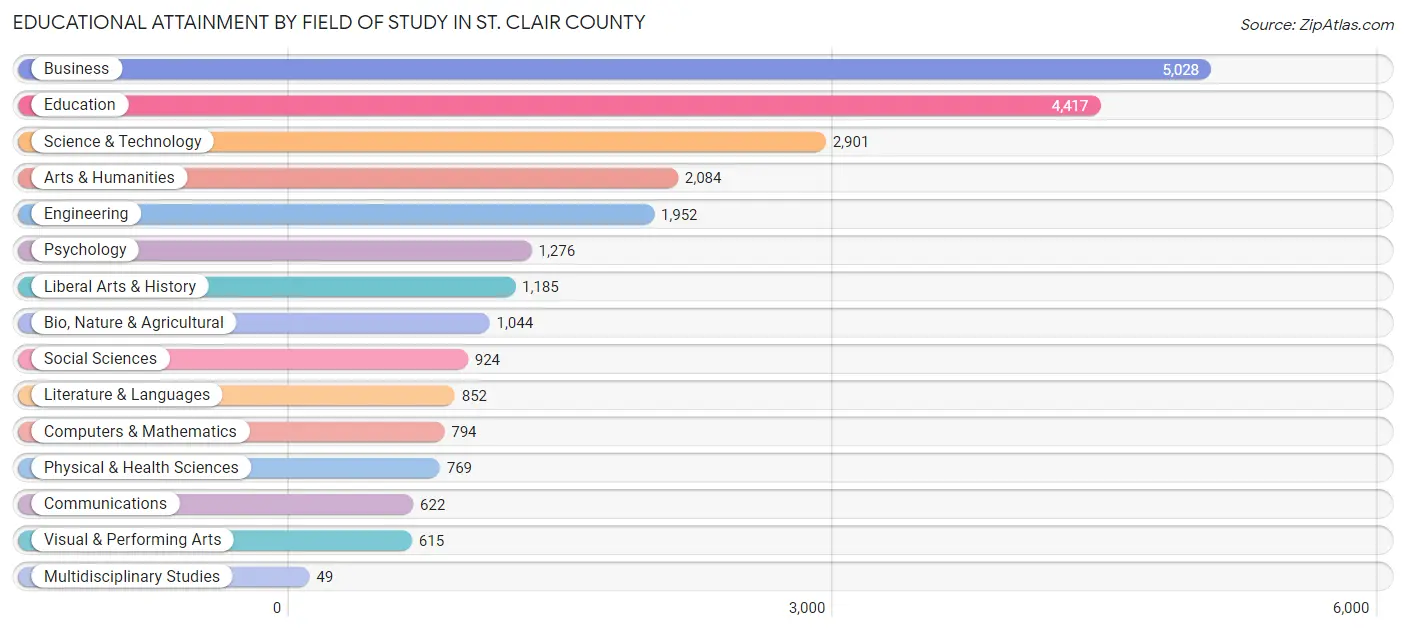
| Field of Study | # Graduates | % Graduates |
| Computers & Mathematics | 794 | 3.2% |
| Bio, Nature & Agricultural | 1,044 | 4.3% |
| Physical & Health Sciences | 769 | 3.1% |
| Psychology | 1,276 | 5.2% |
| Social Sciences | 924 | 3.8% |
| Engineering | 1,952 | 8.0% |
| Multidisciplinary Studies | 49 | 0.2% |
| Science & Technology | 2,901 | 11.8% |
| Business | 5,028 | 20.5% |
| Education | 4,417 | 18.0% |
| Literature & Languages | 852 | 3.5% |
| Liberal Arts & History | 1,185 | 4.8% |
| Visual & Performing Arts | 615 | 2.5% |
| Communications | 622 | 2.5% |
| Arts & Humanities | 2,084 | 8.5% |
| Total | 24,512 | 100.0% |
Transportation & Commute in St. Clair County
Vehicle Availability by Sex in St. Clair County
The most prevalent vehicle ownership categories in St. Clair County are males with 2 vehicles (16,488, accounting for 42.1%) and females with 2 vehicles (12,348, making up 50.3%).
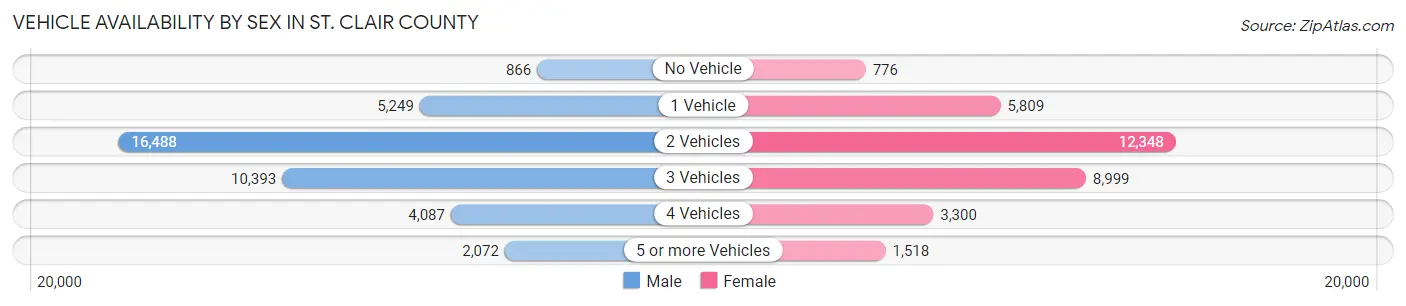
| Vehicles Available | Male | Female |
| No Vehicle | 866 (2.2%) | 776 (2.4%) |
| 1 Vehicle | 5,249 (13.4%) | 5,809 (17.7%) |
| 2 Vehicles | 16,488 (42.1%) | 12,348 (37.7%) |
| 3 Vehicles | 10,393 (26.5%) | 8,999 (27.5%) |
| 4 Vehicles | 4,087 (10.4%) | 3,300 (10.1%) |
| 5 or more Vehicles | 2,072 (5.3%) | 1,518 (4.6%) |
| Total | 39,155 (100.0%) | 32,750 (100.0%) |
Commute Time in St. Clair County
The most frequently occuring commute durations in St. Clair County are 15 to 19 minutes (9,220 commuters, 13.6%), 10 to 14 minutes (8,872 commuters, 13.1%), and 5 to 9 minutes (7,713 commuters, 11.4%).
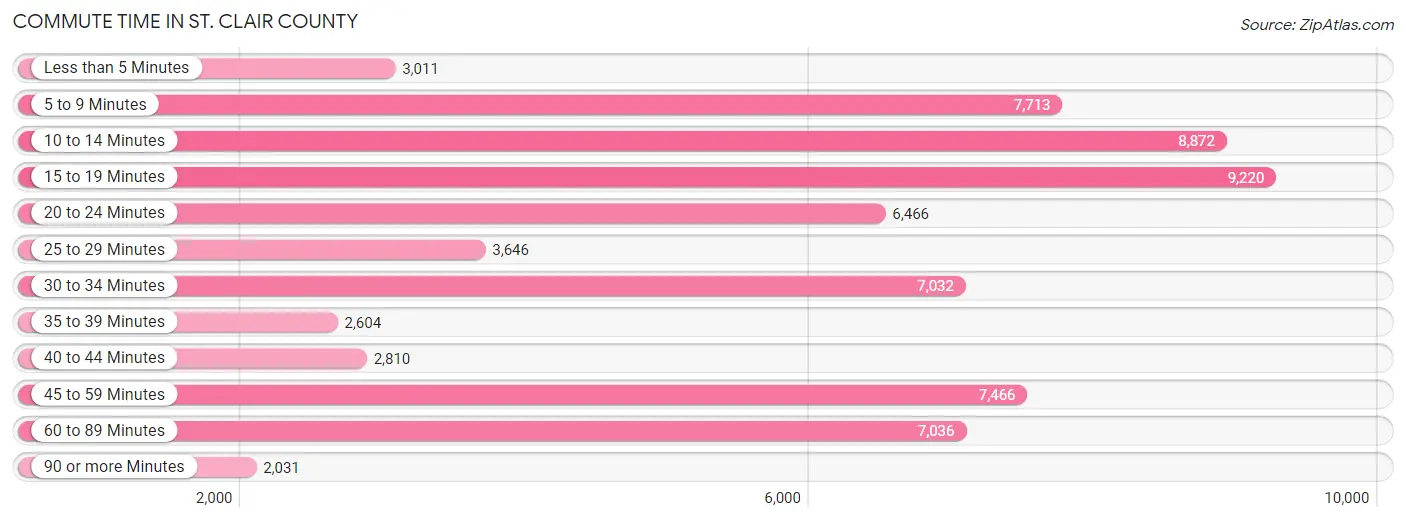
| Commute Time | # Commuters | % Commuters |
| Less than 5 Minutes | 3,011 | 4.4% |
| 5 to 9 Minutes | 7,713 | 11.4% |
| 10 to 14 Minutes | 8,872 | 13.1% |
| 15 to 19 Minutes | 9,220 | 13.6% |
| 20 to 24 Minutes | 6,466 | 9.5% |
| 25 to 29 Minutes | 3,646 | 5.4% |
| 30 to 34 Minutes | 7,032 | 10.4% |
| 35 to 39 Minutes | 2,604 | 3.8% |
| 40 to 44 Minutes | 2,810 | 4.1% |
| 45 to 59 Minutes | 7,466 | 11.0% |
| 60 to 89 Minutes | 7,036 | 10.4% |
| 90 or more Minutes | 2,031 | 3.0% |
Commute Time by Sex in St. Clair County
The most common commute times in St. Clair County are 15 to 19 minutes (4,952 commuters, 13.2%) for males and 10 to 14 minutes (4,809 commuters, 15.8%) for females.
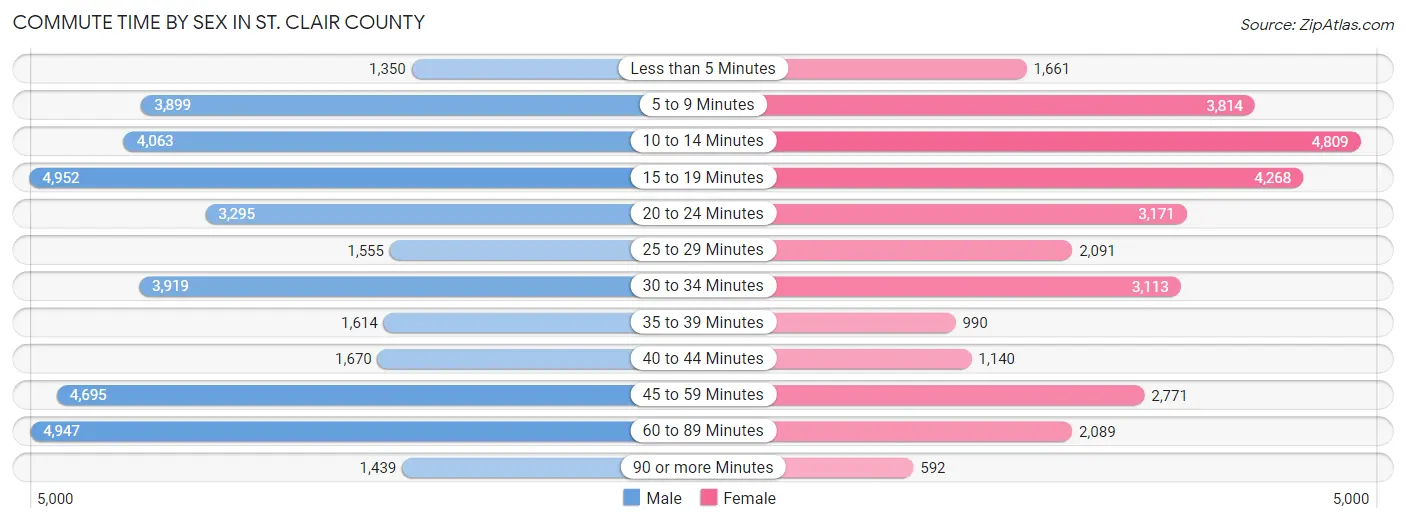
| Commute Time | Male | Female |
| Less than 5 Minutes | 1,350 (3.6%) | 1,661 (5.4%) |
| 5 to 9 Minutes | 3,899 (10.4%) | 3,814 (12.5%) |
| 10 to 14 Minutes | 4,063 (10.9%) | 4,809 (15.8%) |
| 15 to 19 Minutes | 4,952 (13.2%) | 4,268 (14.0%) |
| 20 to 24 Minutes | 3,295 (8.8%) | 3,171 (10.4%) |
| 25 to 29 Minutes | 1,555 (4.2%) | 2,091 (6.9%) |
| 30 to 34 Minutes | 3,919 (10.5%) | 3,113 (10.2%) |
| 35 to 39 Minutes | 1,614 (4.3%) | 990 (3.2%) |
| 40 to 44 Minutes | 1,670 (4.5%) | 1,140 (3.7%) |
| 45 to 59 Minutes | 4,695 (12.6%) | 2,771 (9.1%) |
| 60 to 89 Minutes | 4,947 (13.2%) | 2,089 (6.9%) |
| 90 or more Minutes | 1,439 (3.8%) | 592 (1.9%) |
Time of Departure to Work by Sex in St. Clair County
The most frequent times of departure to work in St. Clair County are 6:00 AM to 6:29 AM (4,316, 11.5%) for males and 7:00 AM to 7:29 AM (4,659, 15.3%) for females.
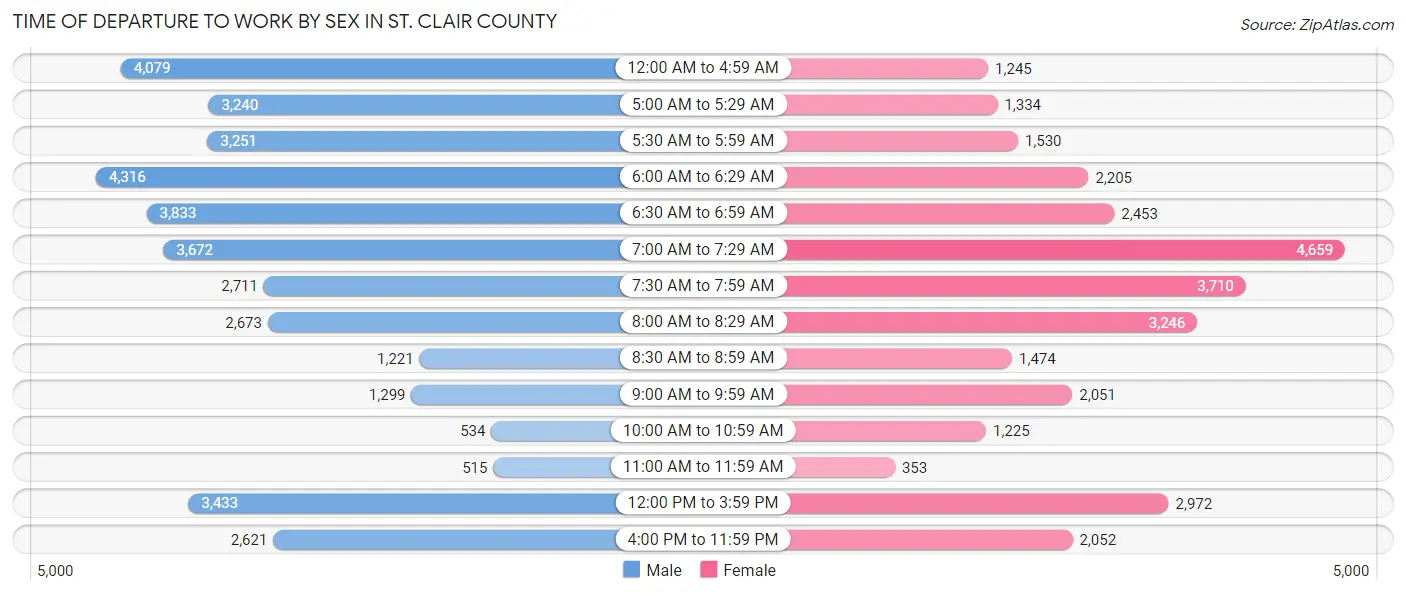
| Time of Departure | Male | Female |
| 12:00 AM to 4:59 AM | 4,079 (10.9%) | 1,245 (4.1%) |
| 5:00 AM to 5:29 AM | 3,240 (8.7%) | 1,334 (4.4%) |
| 5:30 AM to 5:59 AM | 3,251 (8.7%) | 1,530 (5.0%) |
| 6:00 AM to 6:29 AM | 4,316 (11.5%) | 2,205 (7.2%) |
| 6:30 AM to 6:59 AM | 3,833 (10.2%) | 2,453 (8.0%) |
| 7:00 AM to 7:29 AM | 3,672 (9.8%) | 4,659 (15.3%) |
| 7:30 AM to 7:59 AM | 2,711 (7.2%) | 3,710 (12.2%) |
| 8:00 AM to 8:29 AM | 2,673 (7.1%) | 3,246 (10.6%) |
| 8:30 AM to 8:59 AM | 1,221 (3.3%) | 1,474 (4.8%) |
| 9:00 AM to 9:59 AM | 1,299 (3.5%) | 2,051 (6.7%) |
| 10:00 AM to 10:59 AM | 534 (1.4%) | 1,225 (4.0%) |
| 11:00 AM to 11:59 AM | 515 (1.4%) | 353 (1.2%) |
| 12:00 PM to 3:59 PM | 3,433 (9.2%) | 2,972 (9.7%) |
| 4:00 PM to 11:59 PM | 2,621 (7.0%) | 2,052 (6.7%) |
| Total | 37,398 (100.0%) | 30,509 (100.0%) |
Housing Occupancy in St. Clair County
Occupancy by Ownership in St. Clair County
Of the total 65,989 dwellings in St. Clair County, owner-occupied units account for 52,974 (80.3%), while renter-occupied units make up 13,015 (19.7%).
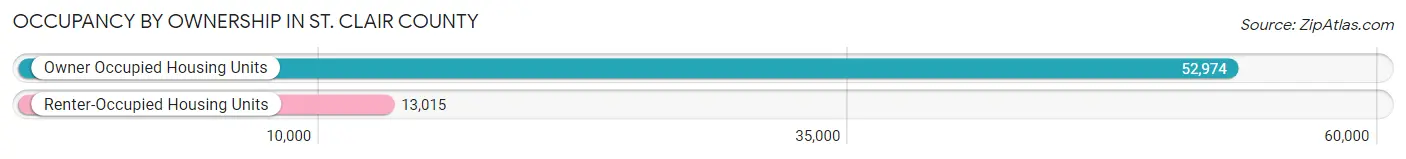
| Occupancy | # Housing Units | % Housing Units |
| Owner Occupied Housing Units | 52,974 | 80.3% |
| Renter-Occupied Housing Units | 13,015 | 19.7% |
| Total Occupied Housing Units | 65,989 | 100.0% |
Occupancy by Household Size in St. Clair County
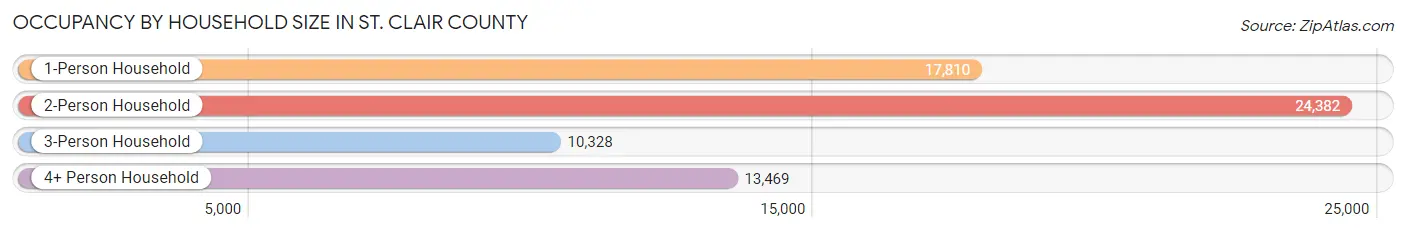
| Household Size | # Housing Units | % Housing Units |
| 1-Person Household | 17,810 | 27.0% |
| 2-Person Household | 24,382 | 36.9% |
| 3-Person Household | 10,328 | 15.7% |
| 4+ Person Household | 13,469 | 20.4% |
| Total Housing Units | 65,989 | 100.0% |
Occupancy by Ownership by Household Size in St. Clair County
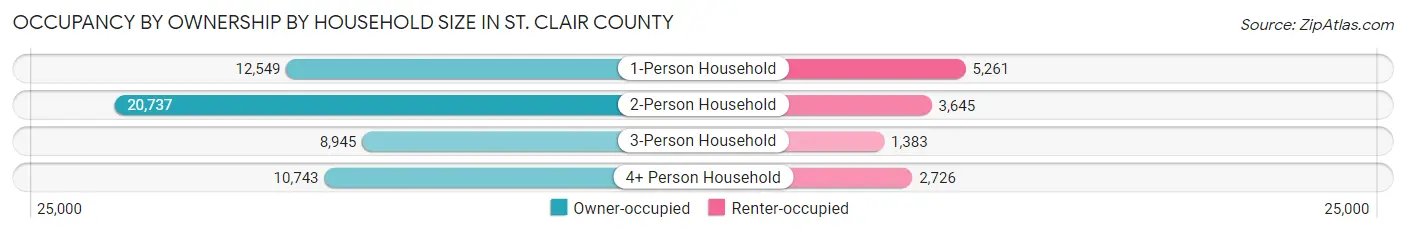
| Household Size | Owner-occupied | Renter-occupied |
| 1-Person Household | 12,549 (70.5%) | 5,261 (29.5%) |
| 2-Person Household | 20,737 (85.1%) | 3,645 (14.9%) |
| 3-Person Household | 8,945 (86.6%) | 1,383 (13.4%) |
| 4+ Person Household | 10,743 (79.8%) | 2,726 (20.2%) |
| Total Housing Units | 52,974 (80.3%) | 13,015 (19.7%) |
Occupancy by Educational Attainment in St. Clair County
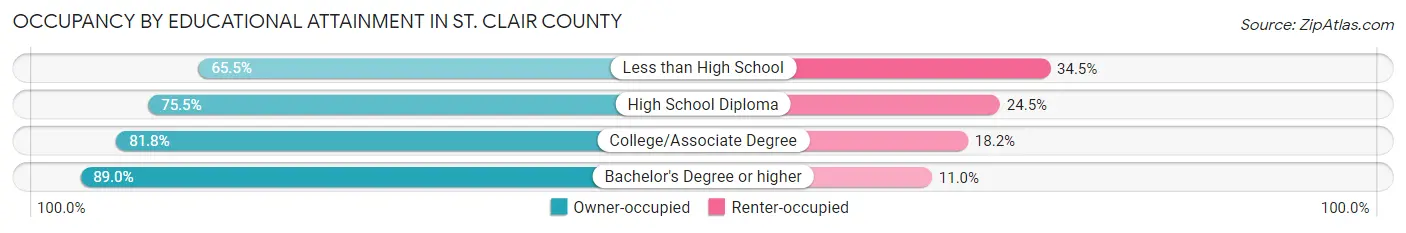
| Household Size | Owner-occupied | Renter-occupied |
| Less than High School | 2,915 (65.5%) | 1,534 (34.5%) |
| High School Diploma | 15,456 (75.5%) | 5,023 (24.5%) |
| College/Associate Degree | 22,019 (81.8%) | 4,897 (18.2%) |
| Bachelor's Degree or higher | 12,584 (89.0%) | 1,561 (11.0%) |
Occupancy by Age of Householder in St. Clair County
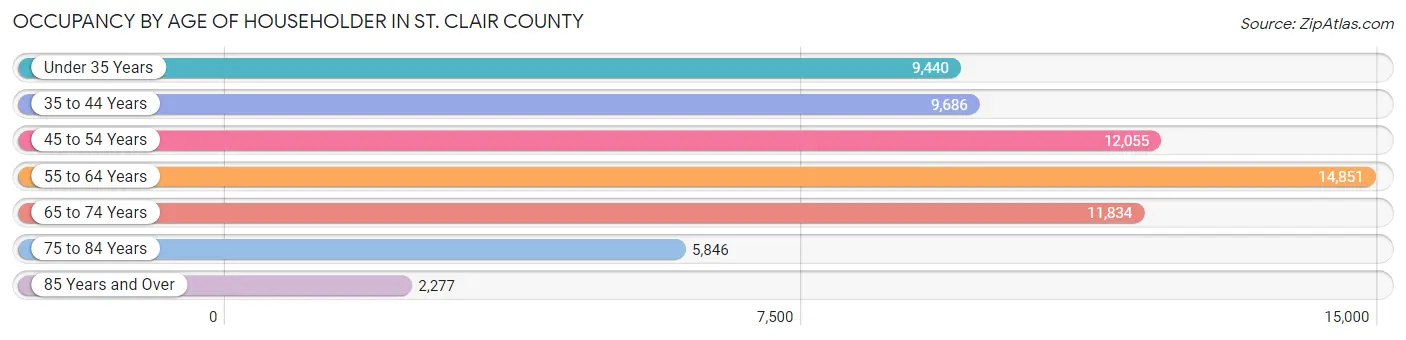
| Age Bracket | # Households | % Households |
| Under 35 Years | 9,440 | 14.3% |
| 35 to 44 Years | 9,686 | 14.7% |
| 45 to 54 Years | 12,055 | 18.3% |
| 55 to 64 Years | 14,851 | 22.5% |
| 65 to 74 Years | 11,834 | 17.9% |
| 75 to 84 Years | 5,846 | 8.9% |
| 85 Years and Over | 2,277 | 3.5% |
| Total | 65,989 | 100.0% |
Housing Finances in St. Clair County
Median Income by Occupancy in St. Clair County
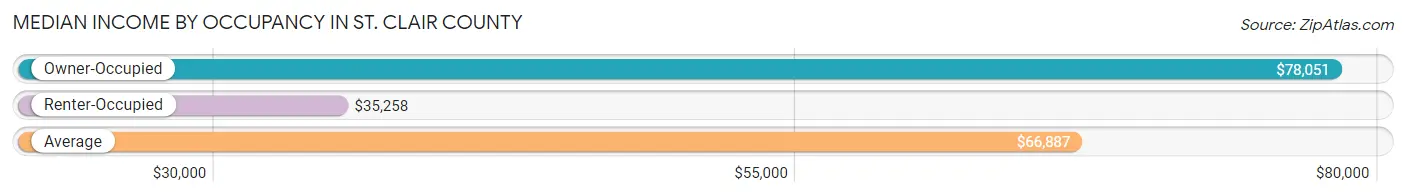
| Occupancy Type | # Households | Median Income |
| Owner-Occupied | 52,974 (80.3%) | $78,051 |
| Renter-Occupied | 13,015 (19.7%) | $35,258 |
| Average | 65,989 (100.0%) | $66,887 |
Occupancy by Householder Income Bracket in St. Clair County

| Income Bracket | Owner-occupied | Renter-occupied |
| Less than $5,000 | 1,074 (2.0%) | 540 (4.2%) |
| $5,000 to $9,999 | 467 (0.9%) | 668 (5.1%) |
| $10,000 to $14,999 | 1,153 (2.2%) | 1,596 (12.3%) |
| $15,000 to $19,999 | 1,443 (2.7%) | 745 (5.7%) |
| $20,000 to $24,999 | 1,633 (3.1%) | 1,008 (7.7%) |
| $25,000 to $34,999 | 3,661 (6.9%) | 1,912 (14.7%) |
| $35,000 to $49,999 | 6,546 (12.4%) | 2,158 (16.6%) |
| $50,000 to $74,999 | 9,552 (18.0%) | 2,028 (15.6%) |
| $75,000 to $99,999 | 8,419 (15.9%) | 1,388 (10.7%) |
| $100,000 to $149,999 | 10,212 (19.3%) | 749 (5.8%) |
| $150,000 or more | 8,814 (16.6%) | 223 (1.7%) |
| Total | 52,974 (100.0%) | 13,015 (100.0%) |
Monthly Housing Cost Tiers in St. Clair County
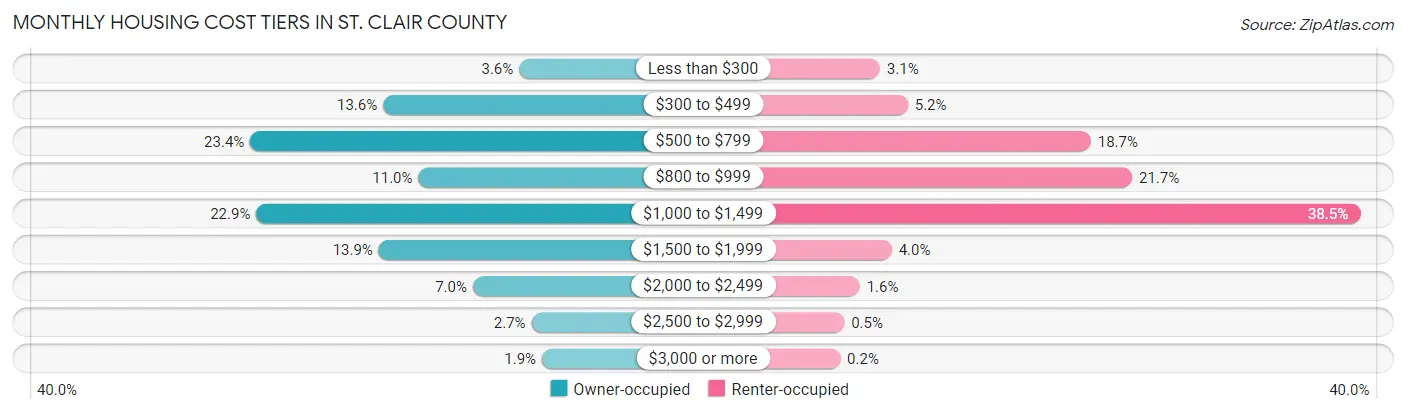
| Monthly Cost | Owner-occupied | Renter-occupied |
| Less than $300 | 1,897 (3.6%) | 408 (3.1%) |
| $300 to $499 | 7,205 (13.6%) | 674 (5.2%) |
| $500 to $799 | 12,388 (23.4%) | 2,429 (18.7%) |
| $800 to $999 | 5,827 (11.0%) | 2,824 (21.7%) |
| $1,000 to $1,499 | 12,154 (22.9%) | 5,010 (38.5%) |
| $1,500 to $1,999 | 7,375 (13.9%) | 521 (4.0%) |
| $2,000 to $2,499 | 3,702 (7.0%) | 213 (1.6%) |
| $2,500 to $2,999 | 1,417 (2.7%) | 65 (0.5%) |
| $3,000 or more | 1,009 (1.9%) | 26 (0.2%) |
| Total | 52,974 (100.0%) | 13,015 (100.0%) |
Physical Housing Characteristics in St. Clair County
Housing Structures in St. Clair County
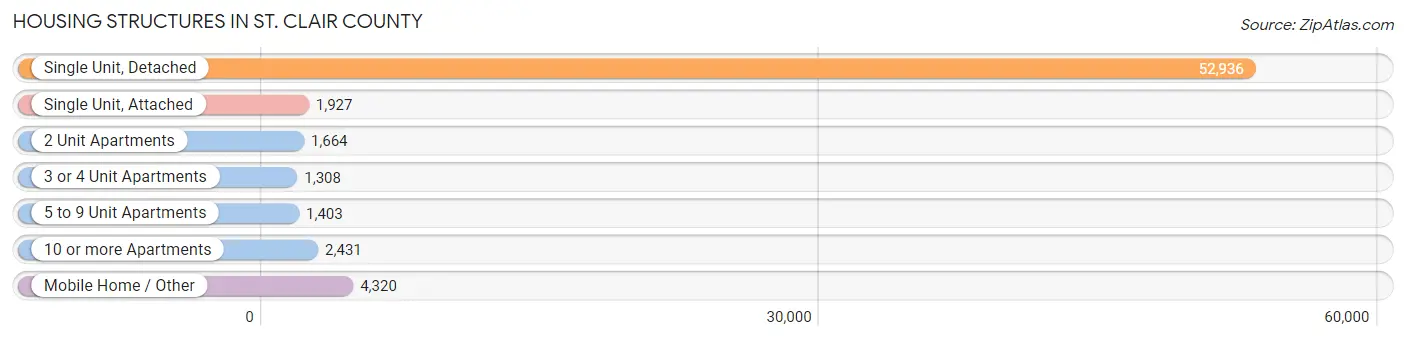
| Structure Type | # Housing Units | % Housing Units |
| Single Unit, Detached | 52,936 | 80.2% |
| Single Unit, Attached | 1,927 | 2.9% |
| 2 Unit Apartments | 1,664 | 2.5% |
| 3 or 4 Unit Apartments | 1,308 | 2.0% |
| 5 to 9 Unit Apartments | 1,403 | 2.1% |
| 10 or more Apartments | 2,431 | 3.7% |
| Mobile Home / Other | 4,320 | 6.6% |
| Total | 65,989 | 100.0% |
Housing Structures by Occupancy in St. Clair County
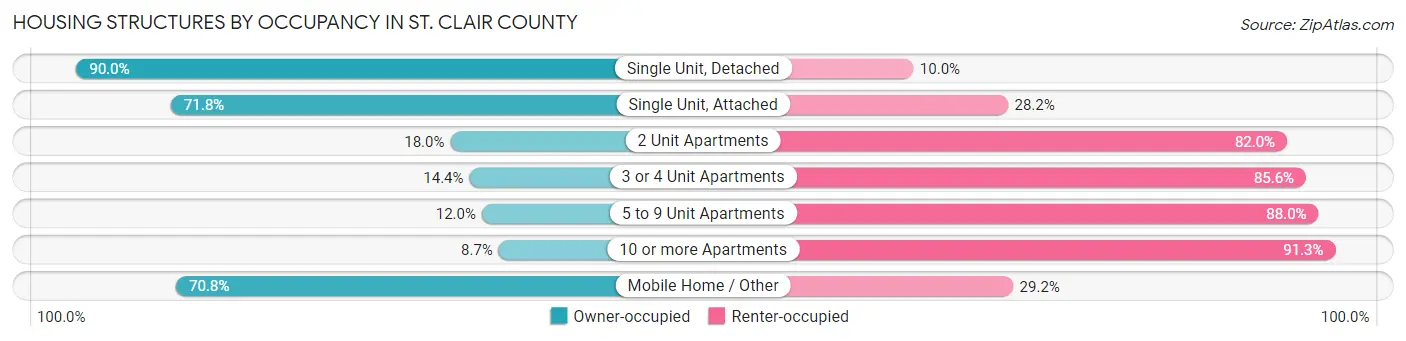
| Structure Type | Owner-occupied | Renter-occupied |
| Single Unit, Detached | 47,662 (90.0%) | 5,274 (10.0%) |
| Single Unit, Attached | 1,384 (71.8%) | 543 (28.2%) |
| 2 Unit Apartments | 300 (18.0%) | 1,364 (82.0%) |
| 3 or 4 Unit Apartments | 188 (14.4%) | 1,120 (85.6%) |
| 5 to 9 Unit Apartments | 168 (12.0%) | 1,235 (88.0%) |
| 10 or more Apartments | 212 (8.7%) | 2,219 (91.3%) |
| Mobile Home / Other | 3,060 (70.8%) | 1,260 (29.2%) |
| Total | 52,974 (80.3%) | 13,015 (19.7%) |
Housing Structures by Number of Rooms in St. Clair County
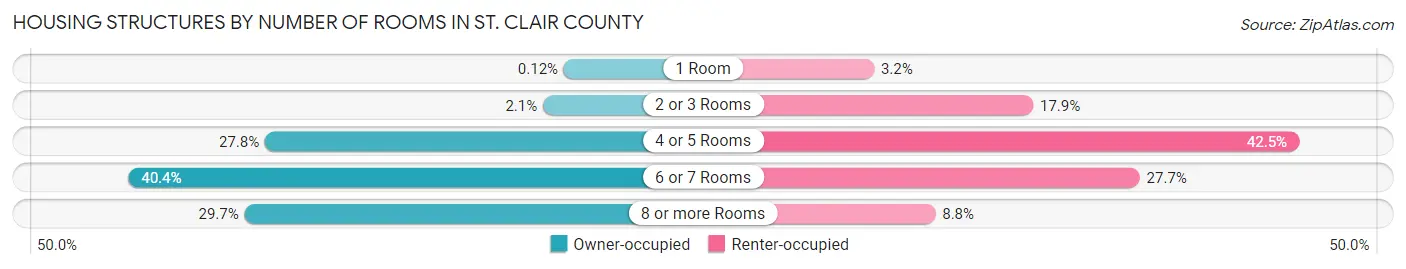
| Number of Rooms | Owner-occupied | Renter-occupied |
| 1 Room | 62 (0.1%) | 410 (3.2%) |
| 2 or 3 Rooms | 1,088 (2.1%) | 2,324 (17.9%) |
| 4 or 5 Rooms | 14,704 (27.8%) | 5,525 (42.4%) |
| 6 or 7 Rooms | 21,407 (40.4%) | 3,608 (27.7%) |
| 8 or more Rooms | 15,713 (29.7%) | 1,148 (8.8%) |
| Total | 52,974 (100.0%) | 13,015 (100.0%) |
Housing Structure by Heating Type in St. Clair County
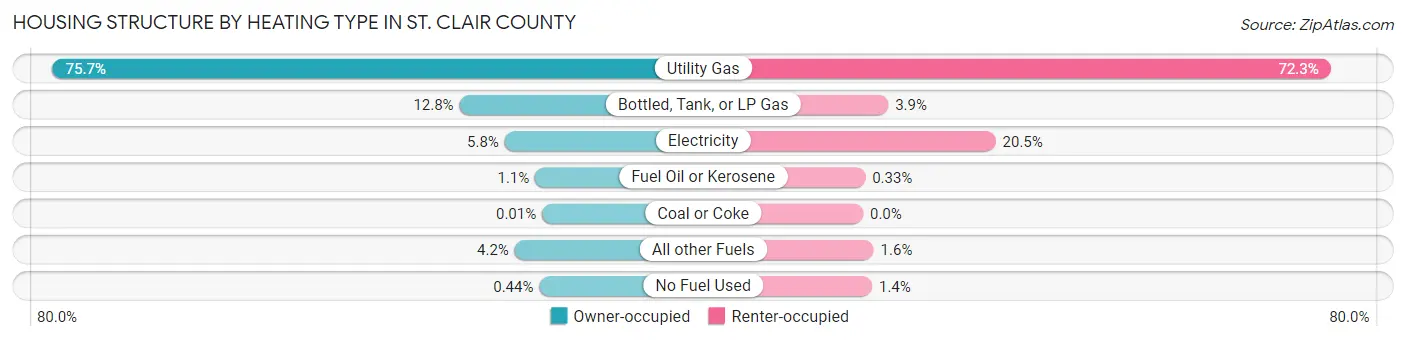
| Heating Type | Owner-occupied | Renter-occupied |
| Utility Gas | 40,079 (75.7%) | 9,404 (72.3%) |
| Bottled, Tank, or LP Gas | 6,772 (12.8%) | 506 (3.9%) |
| Electricity | 3,066 (5.8%) | 2,667 (20.5%) |
| Fuel Oil or Kerosene | 573 (1.1%) | 43 (0.3%) |
| Coal or Coke | 7 (0.0%) | 0 (0.0%) |
| All other Fuels | 2,246 (4.2%) | 214 (1.6%) |
| No Fuel Used | 231 (0.4%) | 181 (1.4%) |
| Total | 52,974 (100.0%) | 13,015 (100.0%) |
Household Vehicle Usage in St. Clair County
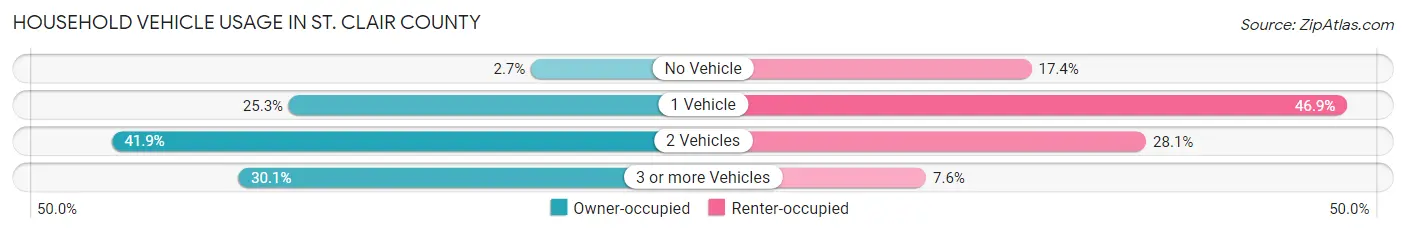
| Vehicles per Household | Owner-occupied | Renter-occupied |
| No Vehicle | 1,439 (2.7%) | 2,267 (17.4%) |
| 1 Vehicle | 13,416 (25.3%) | 6,102 (46.9%) |
| 2 Vehicles | 22,190 (41.9%) | 3,660 (28.1%) |
| 3 or more Vehicles | 15,929 (30.1%) | 986 (7.6%) |
| Total | 52,974 (100.0%) | 13,015 (100.0%) |
Real Estate & Mortgages in St. Clair County
Real Estate and Mortgage Overview in St. Clair County
| Characteristic | Without Mortgage | With Mortgage |
| Housing Units | 22,293 | 30,681 |
| Median Property Value | $183,900 | $207,100 |
| Median Household Income | $58,609 | $6,403 |
| Monthly Housing Costs | $561 | $931 |
| Real Estate Taxes | $2,324 | $1,477 |
Property Value by Mortgage Status in St. Clair County
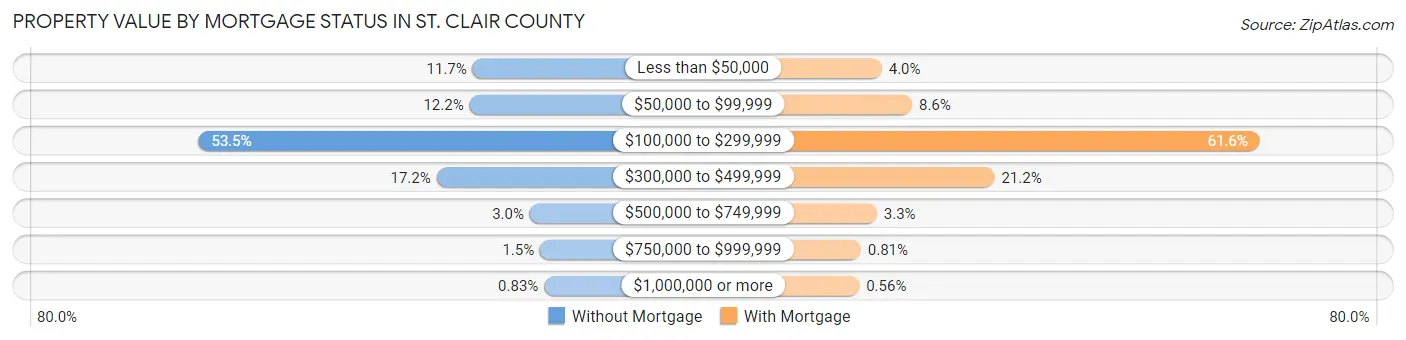
| Property Value | Without Mortgage | With Mortgage |
| Less than $50,000 | 2,614 (11.7%) | 1,228 (4.0%) |
| $50,000 to $99,999 | 2,721 (12.2%) | 2,642 (8.6%) |
| $100,000 to $299,999 | 11,934 (53.5%) | 18,898 (61.6%) |
| $300,000 to $499,999 | 3,841 (17.2%) | 6,496 (21.2%) |
| $500,000 to $749,999 | 674 (3.0%) | 997 (3.3%) |
| $750,000 to $999,999 | 323 (1.5%) | 249 (0.8%) |
| $1,000,000 or more | 186 (0.8%) | 171 (0.6%) |
| Total | 22,293 (100.0%) | 30,681 (100.0%) |
Household Income by Mortgage Status in St. Clair County
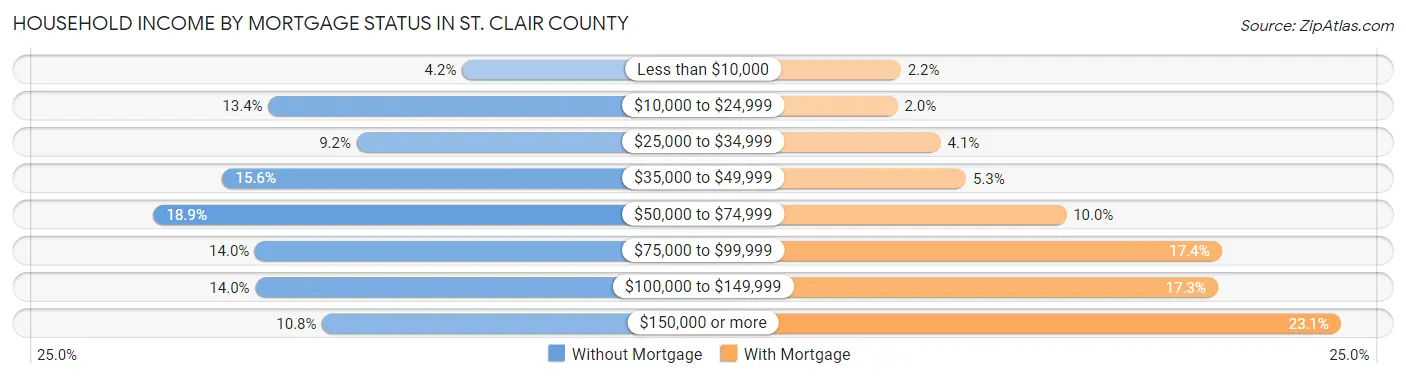
| Household Income | Without Mortgage | With Mortgage |
| Less than $10,000 | 927 (4.2%) | 659 (2.1%) |
| $10,000 to $24,999 | 2,985 (13.4%) | 614 (2.0%) |
| $25,000 to $34,999 | 2,047 (9.2%) | 1,244 (4.1%) |
| $35,000 to $49,999 | 3,470 (15.6%) | 1,614 (5.3%) |
| $50,000 to $74,999 | 4,204 (18.9%) | 3,076 (10.0%) |
| $75,000 to $99,999 | 3,126 (14.0%) | 5,348 (17.4%) |
| $100,000 to $149,999 | 3,123 (14.0%) | 5,293 (17.2%) |
| $150,000 or more | 2,411 (10.8%) | 7,089 (23.1%) |
| Total | 22,293 (100.0%) | 30,681 (100.0%) |
Property Value to Household Income Ratio in St. Clair County
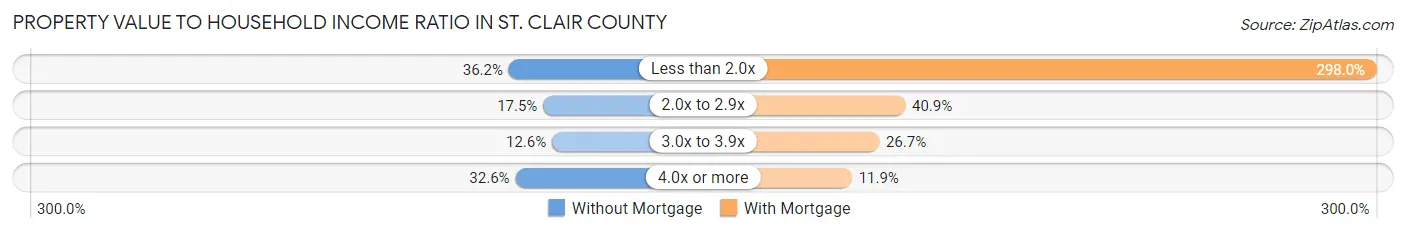
| Value-to-Income Ratio | Without Mortgage | With Mortgage |
| Less than 2.0x | 8,073 (36.2%) | 91,440 (298.0%) |
| 2.0x to 2.9x | 3,890 (17.4%) | 12,556 (40.9%) |
| 3.0x to 3.9x | 2,814 (12.6%) | 8,202 (26.7%) |
| 4.0x or more | 7,268 (32.6%) | 3,643 (11.9%) |
| Total | 22,293 (100.0%) | 30,681 (100.0%) |
Real Estate Taxes by Mortgage Status in St. Clair County
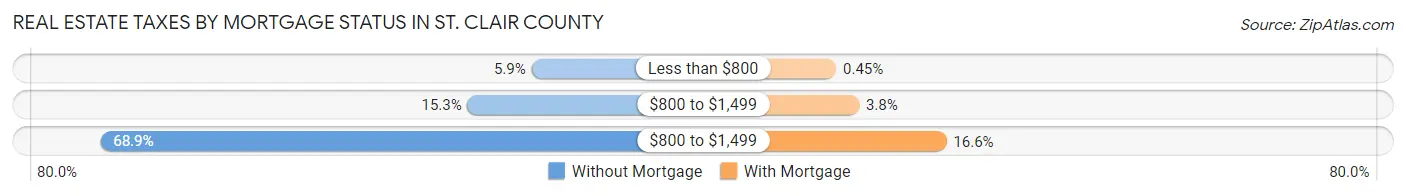
| Property Taxes | Without Mortgage | With Mortgage |
| Less than $800 | 1,322 (5.9%) | 137 (0.4%) |
| $800 to $1,499 | 3,407 (15.3%) | 1,164 (3.8%) |
| $800 to $1,499 | 15,368 (68.9%) | 5,084 (16.6%) |
| Total | 22,293 (100.0%) | 30,681 (100.0%) |
Health & Disability in St. Clair County
Health Insurance Coverage by Age in St. Clair County
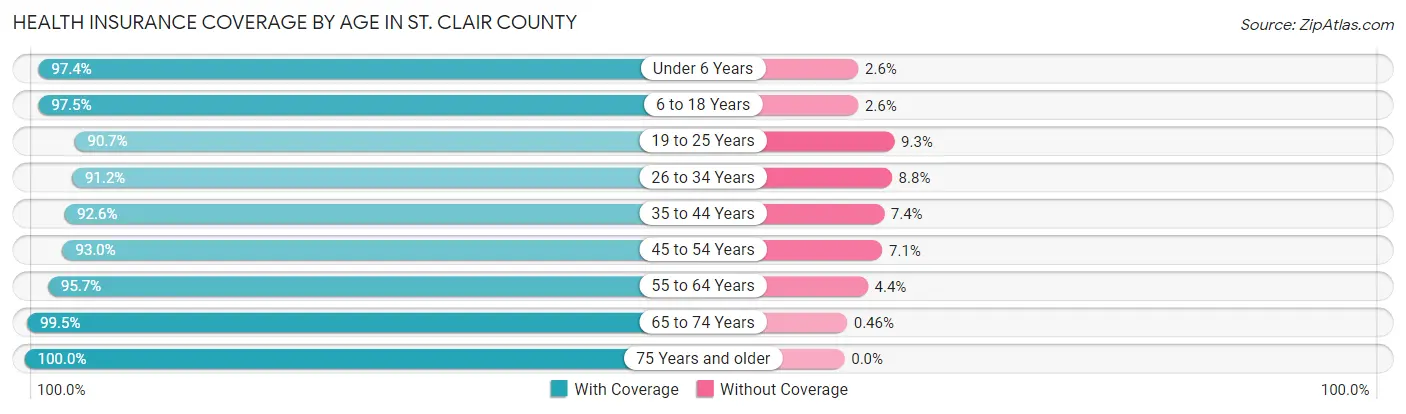
| Age Bracket | With Coverage | Without Coverage |
| Under 6 Years | 8,952 (97.4%) | 237 (2.6%) |
| 6 to 18 Years | 25,142 (97.5%) | 658 (2.5%) |
| 19 to 25 Years | 10,961 (90.7%) | 1,122 (9.3%) |
| 26 to 34 Years | 14,750 (91.2%) | 1,429 (8.8%) |
| 35 to 44 Years | 16,769 (92.6%) | 1,334 (7.4%) |
| 45 to 54 Years | 20,194 (92.9%) | 1,532 (7.0%) |
| 55 to 64 Years | 24,416 (95.7%) | 1,111 (4.3%) |
| 65 to 74 Years | 18,581 (99.5%) | 86 (0.5%) |
| 75 Years and older | 11,714 (100.0%) | 0 (0.0%) |
| Total | 151,479 (95.3%) | 7,509 (4.7%) |
Health Insurance Coverage by Citizenship Status in St. Clair County
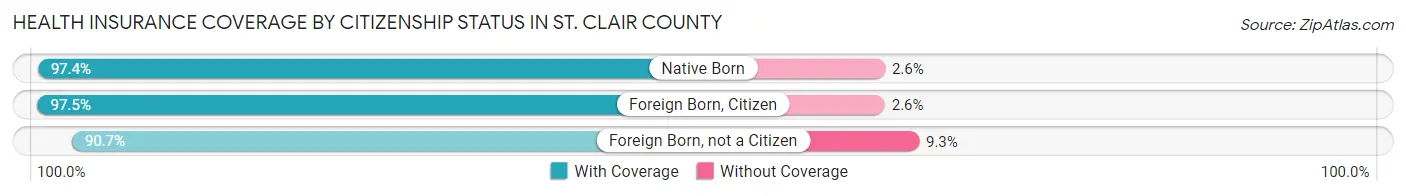
| Citizenship Status | With Coverage | Without Coverage |
| Native Born | 8,952 (97.4%) | 237 (2.6%) |
| Foreign Born, Citizen | 25,142 (97.5%) | 658 (2.5%) |
| Foreign Born, not a Citizen | 10,961 (90.7%) | 1,122 (9.3%) |
Health Insurance Coverage by Household Income in St. Clair County
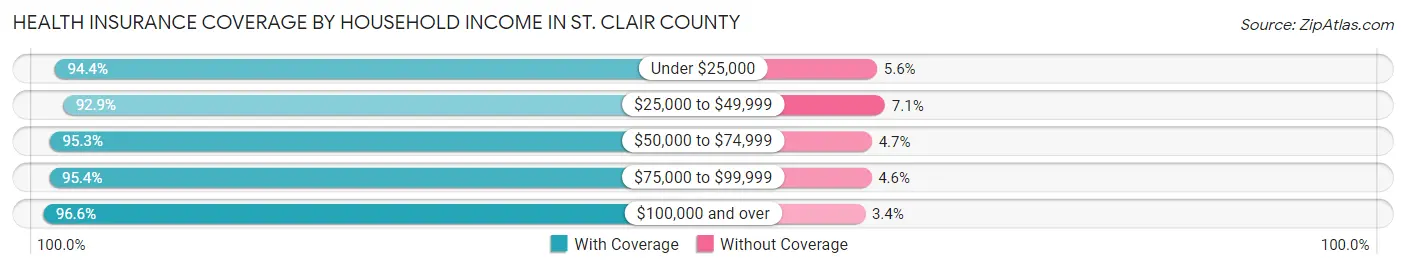
| Household Income | With Coverage | Without Coverage |
| Under $25,000 | 16,807 (94.4%) | 1,002 (5.6%) |
| $25,000 to $49,999 | 26,294 (92.9%) | 2,022 (7.1%) |
| $50,000 to $74,999 | 25,458 (95.3%) | 1,248 (4.7%) |
| $75,000 to $99,999 | 24,344 (95.4%) | 1,168 (4.6%) |
| $100,000 and over | 58,195 (96.6%) | 2,052 (3.4%) |
Public vs Private Health Insurance Coverage by Age in St. Clair County
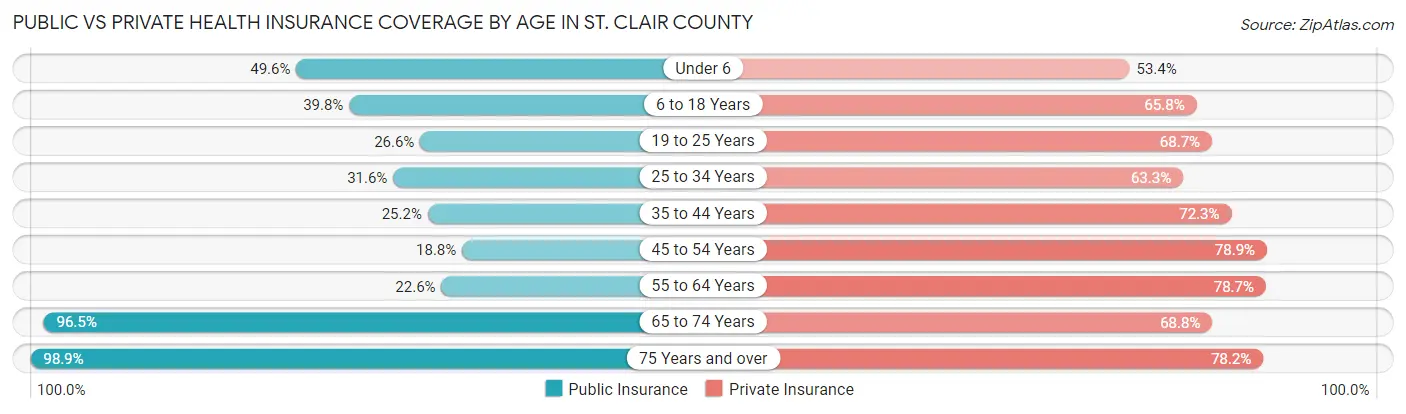
| Age Bracket | Public Insurance | Private Insurance |
| Under 6 | 4,555 (49.6%) | 4,908 (53.4%) |
| 6 to 18 Years | 10,256 (39.8%) | 16,985 (65.8%) |
| 19 to 25 Years | 3,210 (26.6%) | 8,300 (68.7%) |
| 25 to 34 Years | 5,110 (31.6%) | 10,245 (63.3%) |
| 35 to 44 Years | 4,557 (25.2%) | 13,088 (72.3%) |
| 45 to 54 Years | 4,082 (18.8%) | 17,141 (78.9%) |
| 55 to 64 Years | 5,776 (22.6%) | 20,090 (78.7%) |
| 65 to 74 Years | 18,010 (96.5%) | 12,834 (68.8%) |
| 75 Years and over | 11,588 (98.9%) | 9,161 (78.2%) |
| Total | 67,144 (42.2%) | 112,752 (70.9%) |
Disability Status by Sex by Age in St. Clair County
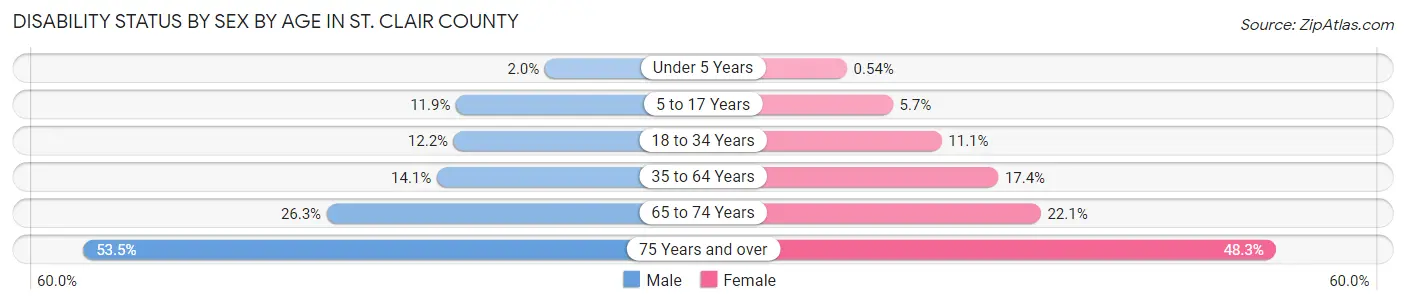
| Age Bracket | Male | Female |
| Under 5 Years | 82 (2.0%) | 21 (0.5%) |
| 5 to 17 Years | 1,544 (11.9%) | 682 (5.7%) |
| 18 to 34 Years | 1,923 (12.2%) | 1,618 (11.1%) |
| 35 to 64 Years | 4,596 (14.1%) | 5,682 (17.4%) |
| 65 to 74 Years | 2,421 (26.3%) | 2,096 (22.1%) |
| 75 Years and over | 2,663 (53.5%) | 3,254 (48.3%) |
Disability Class by Sex by Age in St. Clair County
Disability Class: Hearing Difficulty
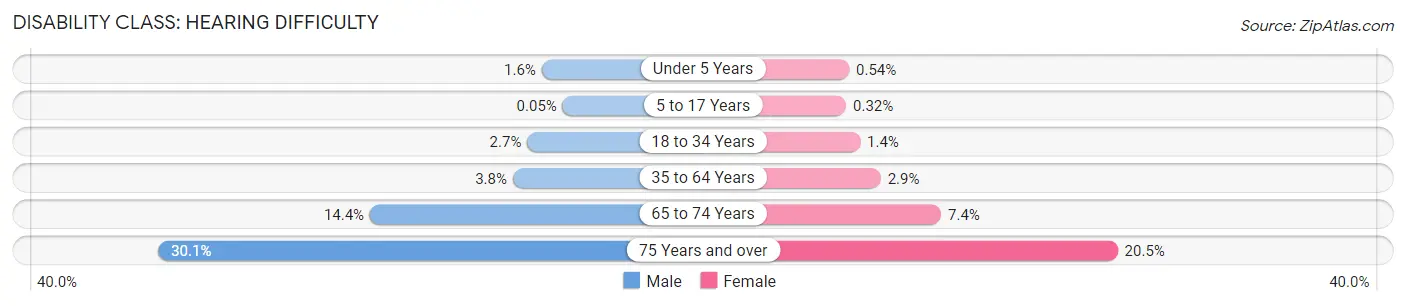
| Age Bracket | Male | Female |
| Under 5 Years | 65 (1.6%) | 21 (0.5%) |
| 5 to 17 Years | 6 (0.1%) | 39 (0.3%) |
| 18 to 34 Years | 422 (2.7%) | 199 (1.4%) |
| 35 to 64 Years | 1,225 (3.7%) | 944 (2.9%) |
| 65 to 74 Years | 1,321 (14.4%) | 698 (7.4%) |
| 75 Years and over | 1,498 (30.1%) | 1,379 (20.5%) |
Disability Class: Vision Difficulty
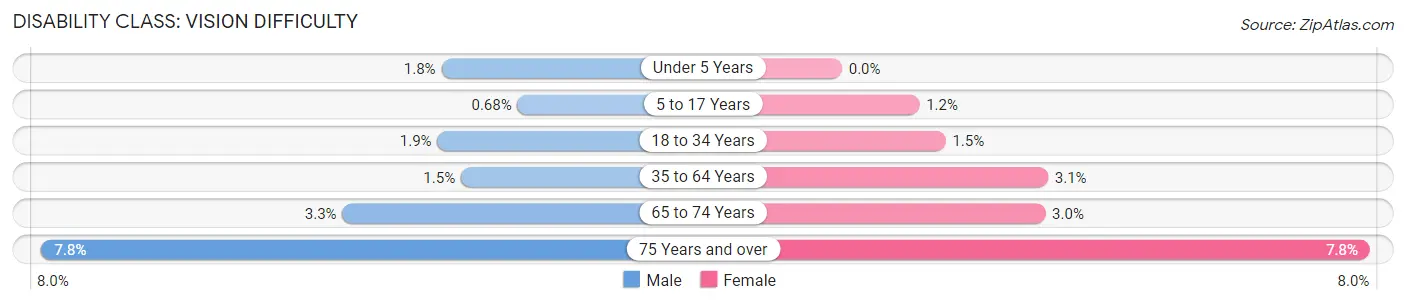
| Age Bracket | Male | Female |
| Under 5 Years | 73 (1.8%) | 0 (0.0%) |
| 5 to 17 Years | 88 (0.7%) | 139 (1.1%) |
| 18 to 34 Years | 295 (1.9%) | 224 (1.5%) |
| 35 to 64 Years | 497 (1.5%) | 999 (3.1%) |
| 65 to 74 Years | 302 (3.3%) | 286 (3.0%) |
| 75 Years and over | 386 (7.7%) | 528 (7.8%) |
Disability Class: Cognitive Difficulty
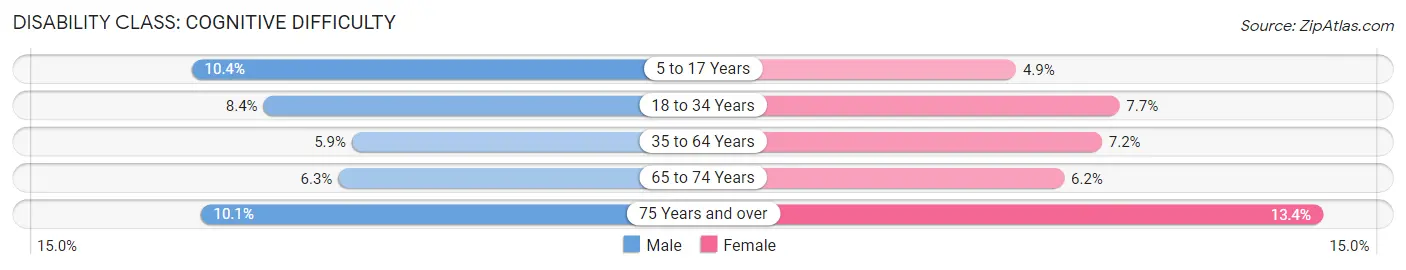
| Age Bracket | Male | Female |
| 5 to 17 Years | 1,339 (10.3%) | 585 (4.9%) |
| 18 to 34 Years | 1,316 (8.4%) | 1,128 (7.7%) |
| 35 to 64 Years | 1,925 (5.9%) | 2,367 (7.2%) |
| 65 to 74 Years | 577 (6.3%) | 586 (6.2%) |
| 75 Years and over | 503 (10.1%) | 902 (13.4%) |
Disability Class: Ambulatory Difficulty
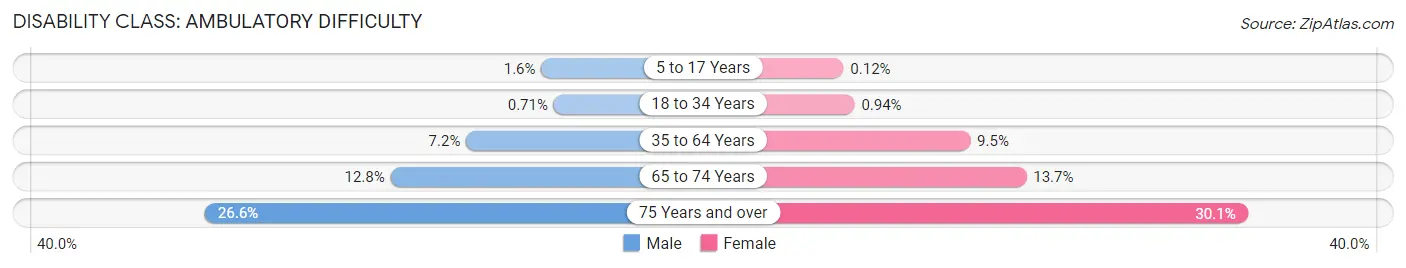
| Age Bracket | Male | Female |
| 5 to 17 Years | 211 (1.6%) | 15 (0.1%) |
| 18 to 34 Years | 112 (0.7%) | 137 (0.9%) |
| 35 to 64 Years | 2,357 (7.2%) | 3,114 (9.5%) |
| 65 to 74 Years | 1,180 (12.8%) | 1,298 (13.7%) |
| 75 Years and over | 1,325 (26.6%) | 2,028 (30.1%) |
Disability Class: Self-Care Difficulty
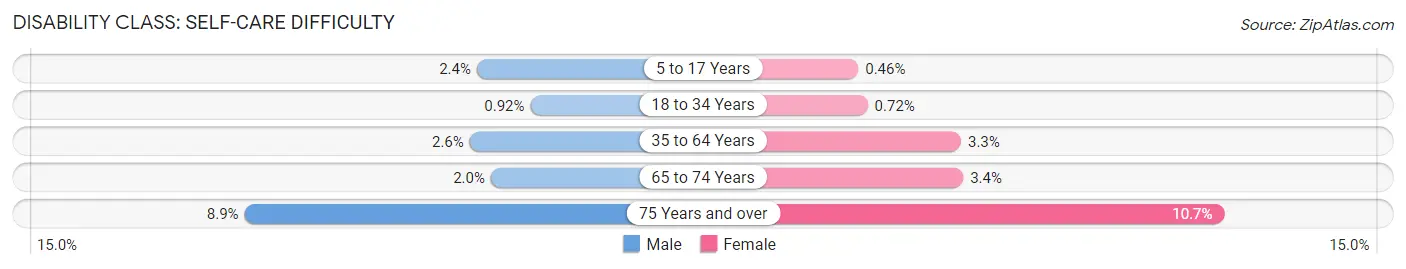
| Age Bracket | Male | Female |
| 5 to 17 Years | 312 (2.4%) | 56 (0.5%) |
| 18 to 34 Years | 145 (0.9%) | 105 (0.7%) |
| 35 to 64 Years | 852 (2.6%) | 1,085 (3.3%) |
| 65 to 74 Years | 186 (2.0%) | 320 (3.4%) |
| 75 Years and over | 442 (8.9%) | 717 (10.6%) |
Technology Access in St. Clair County
Computing Device Access in St. Clair County
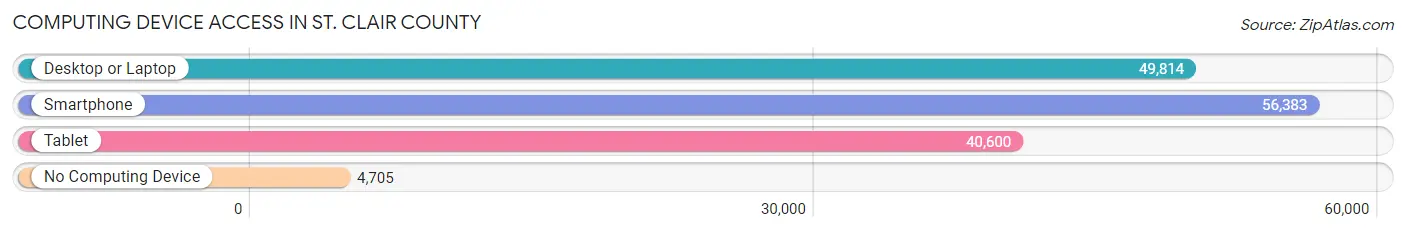
| Device Type | # Households | % Households |
| Desktop or Laptop | 49,814 | 75.5% |
| Smartphone | 56,383 | 85.4% |
| Tablet | 40,600 | 61.5% |
| No Computing Device | 4,705 | 7.1% |
| Total | 65,989 | 100.0% |
Internet Access in St. Clair County
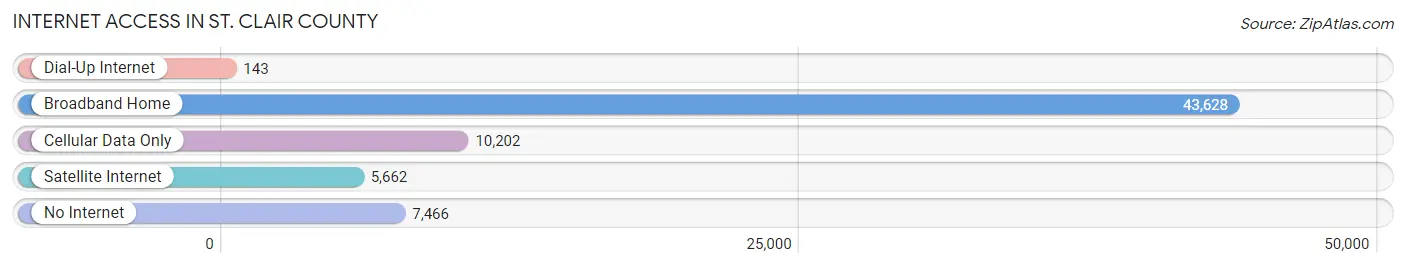
| Internet Type | # Households | % Households |
| Dial-Up Internet | 143 | 0.2% |
| Broadband Home | 43,628 | 66.1% |
| Cellular Data Only | 10,202 | 15.5% |
| Satellite Internet | 5,662 | 8.6% |
| No Internet | 7,466 | 11.3% |
| Total | 65,989 | 100.0% |
St. Clair County Summary
St. Clair County is a county located in the U.S. state of Michigan. As of the 2010 census, the population was 163,040, making it the fifth-most populous county in Michigan. The county seat is Port Huron, located at the northern tip of the county on the St. Clair River, which forms the border with Canada. The county was created on September 10, 1820, and was fully organized on December 31, 1820. It was named for Arthur St. Clair, an officer in the French and Indian War and Governor of the Northwest Territory.
History
The area that is now St. Clair County was inhabited by Native Americans for thousands of years prior to European exploration. The first Europeans to explore the area were French fur traders, who established trading posts in the area in the late 17th century. The area was part of the large French colony of New France, which was ceded to Great Britain in 1763 after the French and Indian War. The area then became part of the British Province of Quebec, which was divided into Upper and Lower Canada in 1791.
In 1805, the area that is now St. Clair County became part of the Michigan Territory, which was created by the United States Congress. The county was officially organized on December 31, 1820, and was named for Arthur St. Clair, an officer in the French and Indian War and Governor of the Northwest Territory.
Geography
St. Clair County is located in the eastern portion of Michigan's Lower Peninsula, along the St. Clair River, which forms the border with Canada. The county is bordered by Sanilac County to the north, Macomb County to the west, and Lapeer County to the south. The county covers an area of 583 square miles, of which 581 square miles is land and 2 square miles is water.
The county is divided into two distinct regions. The northern portion of the county is part of the Thumb region, while the southern portion is part of the Metro Detroit area. The county is home to several small towns and villages, including Algonac, Marine City, St. Clair, and Port Huron.
Economy
St. Clair County is home to a diverse economy, with a mix of manufacturing, agriculture, and tourism. The county is home to several large manufacturing companies, including General Motors, Chrysler, and Ford. The county is also home to several agricultural operations, including dairy farms, fruit orchards, and vegetable farms.
The county is also home to several tourist attractions, including the Blue Water Bridge, which connects Port Huron to Sarnia, Ontario, and the St. Clair River, which is popular for fishing and boating. The county is also home to several parks and recreation areas, including the St. Clair County Park and the St. Clair River Trail.
Demographics
As of the 2010 census, there were 163,040 people, 63,945 households, and 43,845 families residing in the county. The population density was 279.3 people per square mile. There were 68,945 housing units at an average density of 118.2 per square mile. The racial makeup of the county was 90.2% White, 5.3% Black or African American, 0.6% Native American, 0.8% Asian, 0.1% Pacific Islander, 1.3% from other races, and 1.7% from two or more races. Hispanic or Latino of any race were 4.2% of the population.
The median income for a household in the county was $45,945, and the median income for a family was $54,945. The per capita income for the county was $22,945. About 10.2% of families and 13.3% of the population were below the poverty line, including 19.2% of those under age 18 and 8.2% of those age 65 or over.
Common Questions
What is the Total Population of St. Clair County?
Total Population of St. Clair County is 160,257.
What is the Total Male Population of St. Clair County?
Total Male Population of St. Clair County is 80,273.
What is the Total Female Population of St. Clair County?
Total Female Population of St. Clair County is 79,984.
What is the Ratio of Males per 100 Females in St. Clair County?
There are 100.36 Males per 100 Females in St. Clair County.
What is the Ratio of Females per 100 Males in St. Clair County?
There are 99.64 Females per 100 Males in St. Clair County.
What is the Median Population Age in St. Clair County?
Median Population Age in St. Clair County is 44.1 Years.
What is the Average Family Size in St. Clair County
Average Family Size in St. Clair County is 2.9 People.
What is the Average Household Size in St. Clair County
Average Household Size in St. Clair County is 2.4 People.
What is Per Capita Income in St. Clair County?
Per Capita income in St. Clair County is $35,483.
What is the Median Family Income in St. Clair County?
Median Family Income in St. Clair County is $81,992.
What is the Median Household income in St. Clair County?
Median Household Income in St. Clair County is $66,887.
What is Income or Wage Gap in St. Clair County?
Income or Wage Gap in St. Clair County is 39.5%.
Women in St. Clair County earn 60.5 cents for every dollar earned by a man.
What is Family Income Deficit in St. Clair County?
Family Income Deficit in St. Clair County is $11,663.
Families that are below poverty line in St. Clair County earn $11,663 less on average than the poverty threshold level.
What is Inequality or Gini Index in St. Clair County?
Inequality or Gini Index in St. Clair County is 0.43.
How Large is the Labor Force in St. Clair County?
There are 79,446 People in the Labor Forcein in St. Clair County.
What is the Percentage of People in the Labor Force in St. Clair County?
60.2% of People are in the Labor Force in St. Clair County.
What is the Unemployment Rate in St. Clair County?
Unemployment Rate in St. Clair County is 6.7%.