Shiawassee County, MI
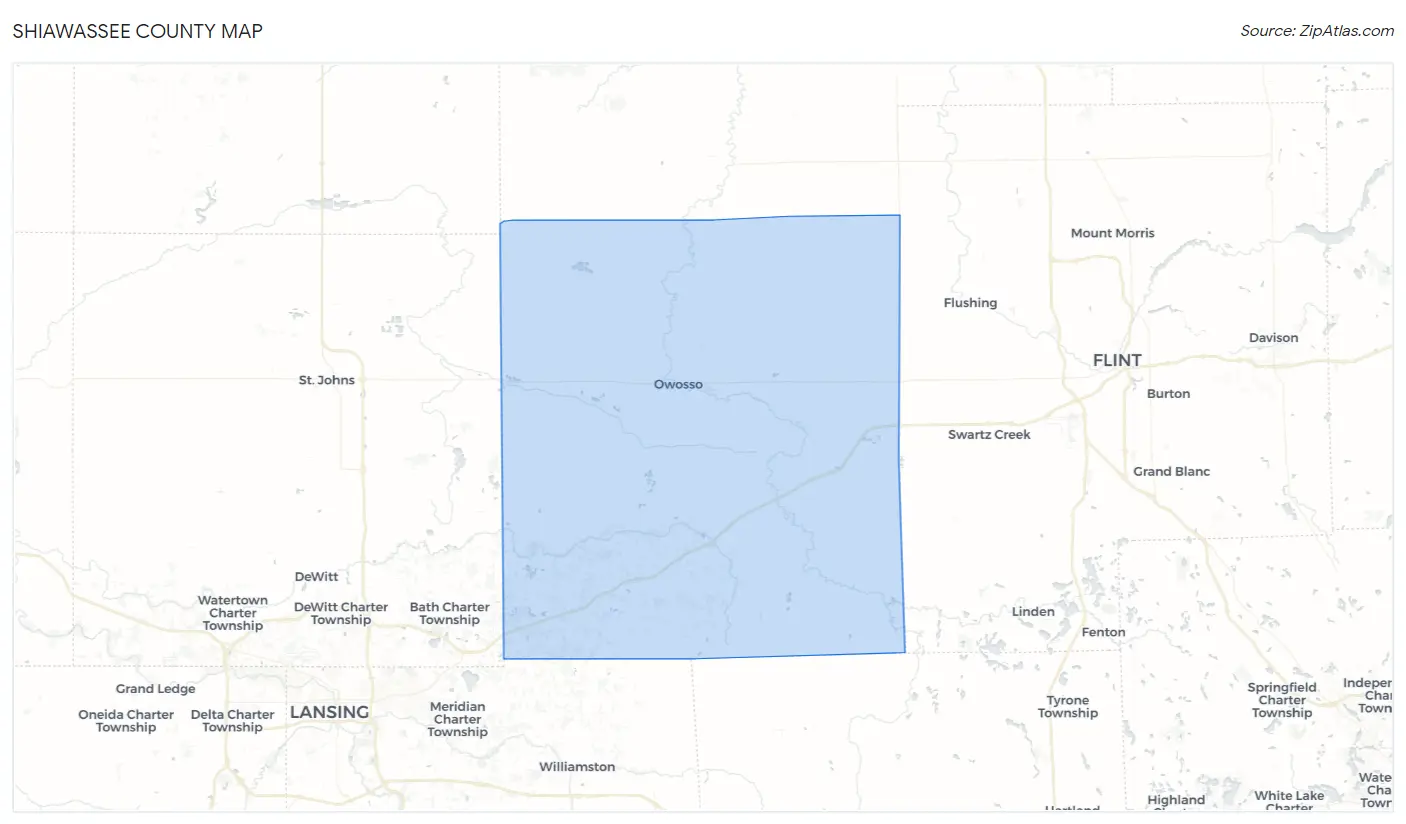
Shiawassee County Map
Shiawassee County Overview
68,124
TOTAL POPULATION
33,970
MALE POPULATION
34,154
FEMALE POPULATION
99.46
MALES / 100 FEMALES
100.54
FEMALES / 100 MALES
43.2
MEDIAN AGE
3.0
AVG FAMILY SIZE
2.4
AVG HOUSEHOLD SIZE
$33,328
PER CAPITA INCOME
$78,144
AVG FAMILY INCOME
$62,498
AVG HOUSEHOLD INCOME
31.1%
WAGE / INCOME GAP [ % ]
68.9¢/ $1
WAGE / INCOME GAP [ $ ]
$10,777
FAMILY INCOME DEFICIT
0.41
INEQUALITY / GINI INDEX
33,384
LABOR FORCE [ PEOPLE ]
59.6%
PERCENT IN LABOR FORCE
4.1%
UNEMPLOYMENT RATE
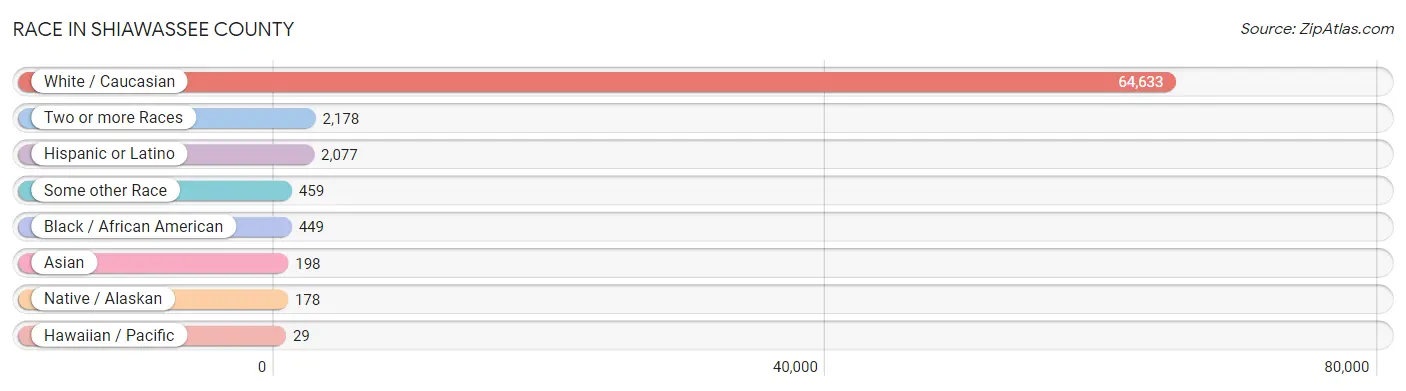
Race in Shiawassee County
The most populous races in Shiawassee County are White / Caucasian (64,633 | 94.9%), Two or more Races (2,178 | 3.2%), and Hispanic or Latino (2,077 | 3.0%).
| Race | # Population | % Population |
| Asian | 198 | 0.3% |
| Black / African American | 449 | 0.7% |
| Hawaiian / Pacific | 29 | 0.0% |
| Hispanic or Latino | 2,077 | 3.0% |
| Native / Alaskan | 178 | 0.3% |
| White / Caucasian | 64,633 | 94.9% |
| Two or more Races | 2,178 | 3.2% |
| Some other Race | 459 | 0.7% |
| Total | 68,124 | 100.0% |
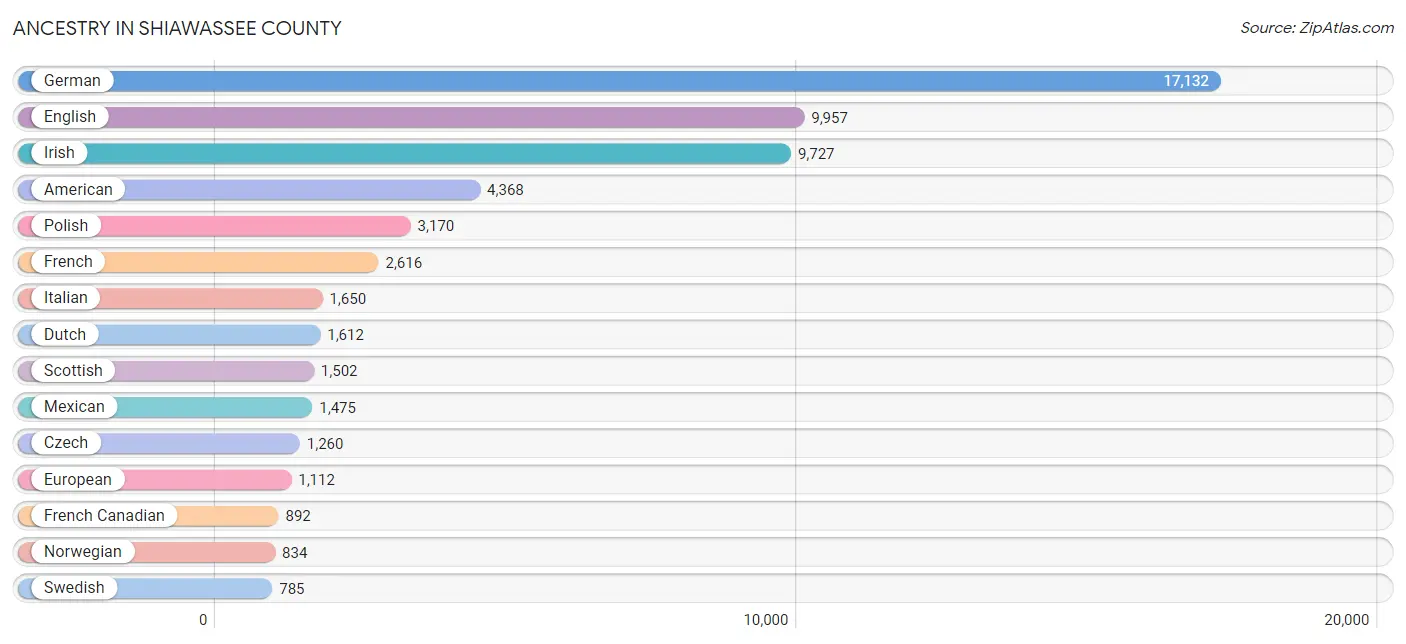
Ancestry in Shiawassee County
The most populous ancestries reported in Shiawassee County are German (17,132 | 25.2%), English (9,957 | 14.6%), Irish (9,727 | 14.3%), American (4,368 | 6.4%), and Polish (3,170 | 4.6%), together accounting for 65.1% of all Shiawassee County residents.
| Ancestry | # Population | % Population |
| African | 99 | 0.2% |
| American | 4,368 | 6.4% |
| Apache | 58 | 0.1% |
| Arab | 303 | 0.4% |
| Armenian | 7 | 0.0% |
| Assyrian / Chaldean / Syriac | 3 | 0.0% |
| Austrian | 149 | 0.2% |
| Belgian | 241 | 0.4% |
| Bhutanese | 163 | 0.2% |
| Blackfeet | 17 | 0.0% |
| Bolivian | 28 | 0.0% |
| British | 162 | 0.2% |
| Bulgarian | 24 | 0.0% |
| Burmese | 21 | 0.0% |
| Canadian | 197 | 0.3% |
| Central American | 69 | 0.1% |
| Central American Indian | 6 | 0.0% |
| Cherokee | 70 | 0.1% |
| Cheyenne | 4 | 0.0% |
| Chippewa | 96 | 0.1% |
| Colombian | 40 | 0.1% |
| Comanche | 9 | 0.0% |
| Costa Rican | 29 | 0.0% |
| Croatian | 125 | 0.2% |
| Cuban | 102 | 0.2% |
| Czech | 1,260 | 1.8% |
| Czechoslovakian | 532 | 0.8% |
| Danish | 143 | 0.2% |
| Dutch | 1,612 | 2.4% |
| Eastern European | 220 | 0.3% |
| English | 9,957 | 14.6% |
| European | 1,112 | 1.6% |
| Finnish | 540 | 0.8% |
| French | 2,616 | 3.8% |
| French American Indian | 10 | 0.0% |
| French Canadian | 892 | 1.3% |
| German | 17,132 | 25.2% |
| Greek | 385 | 0.6% |
| Guatemalan | 25 | 0.0% |
| Hungarian | 682 | 1.0% |
| Indian (Asian) | 71 | 0.1% |
| Indonesian | 25 | 0.0% |
| Iranian | 34 | 0.1% |
| Irish | 9,727 | 14.3% |
| Iroquois | 141 | 0.2% |
| Italian | 1,650 | 2.4% |
| Jamaican | 18 | 0.0% |
| Japanese | 1 | 0.0% |
| Jordanian | 64 | 0.1% |
| Korean | 100 | 0.2% |
| Latvian | 10 | 0.0% |
| Lebanese | 59 | 0.1% |
| Lithuanian | 75 | 0.1% |
| Lumbee | 7 | 0.0% |
| Maltese | 53 | 0.1% |
| Mexican | 1,475 | 2.2% |
| Native Hawaiian | 29 | 0.0% |
| Nigerian | 17 | 0.0% |
| Northern European | 60 | 0.1% |
| Norwegian | 834 | 1.2% |
| Ottawa | 94 | 0.1% |
| Pakistani | 4 | 0.0% |
| Panamanian | 15 | 0.0% |
| Pennsylvania German | 15 | 0.0% |
| Peruvian | 5 | 0.0% |
| Polish | 3,170 | 4.6% |
| Portuguese | 37 | 0.1% |
| Potawatomi | 9 | 0.0% |
| Puerto Rican | 126 | 0.2% |
| Romanian | 77 | 0.1% |
| Russian | 192 | 0.3% |
| Scandinavian | 126 | 0.2% |
| Scotch-Irish | 424 | 0.6% |
| Scottish | 1,502 | 2.2% |
| Serbian | 17 | 0.0% |
| Shoshone | 8 | 0.0% |
| Slavic | 15 | 0.0% |
| Slovak | 248 | 0.4% |
| Slovene | 6 | 0.0% |
| South American | 107 | 0.2% |
| South American Indian | 15 | 0.0% |
| Spaniard | 18 | 0.0% |
| Spanish | 16 | 0.0% |
| Sri Lankan | 38 | 0.1% |
| Subsaharan African | 116 | 0.2% |
| Swedish | 785 | 1.1% |
| Swiss | 162 | 0.2% |
| Syrian | 15 | 0.0% |
| Thai | 3 | 0.0% |
| Turkish | 34 | 0.1% |
| Ukrainian | 110 | 0.2% |
| Welsh | 281 | 0.4% |
| Yugoslavian | 3 | 0.0% | View All 93 Rows |
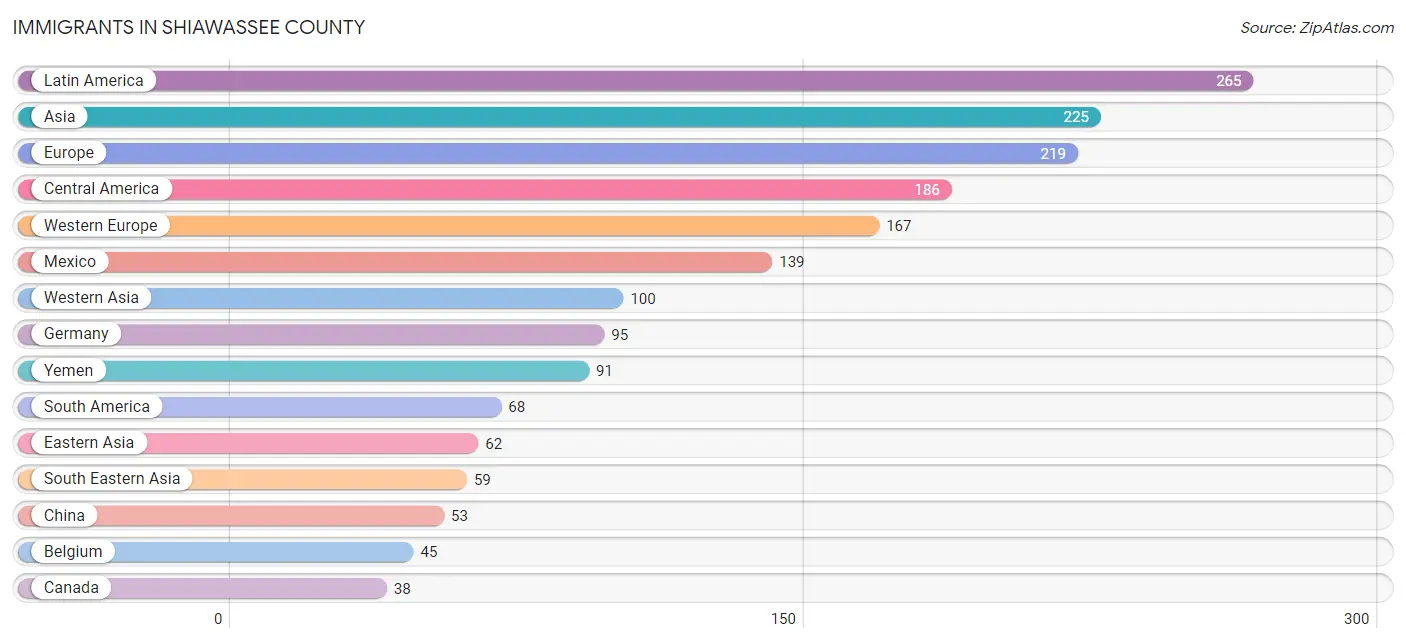
Immigrants in Shiawassee County
The most numerous immigrant groups reported in Shiawassee County came from Latin America (265 | 0.4%), Asia (225 | 0.3%), Europe (219 | 0.3%), Central America (186 | 0.3%), and Western Europe (167 | 0.3%), together accounting for 1.6% of all Shiawassee County residents.
| Immigration Origin | # Population | % Population |
| Africa | 17 | 0.0% |
| Asia | 225 | 0.3% |
| Azores | 2 | 0.0% |
| Belgium | 45 | 0.1% |
| Cambodia | 1 | 0.0% |
| Canada | 38 | 0.1% |
| Caribbean | 11 | 0.0% |
| Central America | 186 | 0.3% |
| Chile | 20 | 0.0% |
| China | 53 | 0.1% |
| Colombia | 29 | 0.0% |
| Costa Rica | 29 | 0.0% |
| Cuba | 11 | 0.0% |
| Eastern Asia | 62 | 0.1% |
| Eastern Europe | 32 | 0.1% |
| England | 7 | 0.0% |
| Europe | 219 | 0.3% |
| France | 4 | 0.0% |
| Germany | 95 | 0.1% |
| Guatemala | 10 | 0.0% |
| Hong Kong | 7 | 0.0% |
| Hungary | 5 | 0.0% |
| Japan | 1 | 0.0% |
| Jordan | 9 | 0.0% |
| Korea | 8 | 0.0% |
| Latin America | 265 | 0.4% |
| Mexico | 139 | 0.2% |
| Netherlands | 14 | 0.0% |
| Northern Europe | 14 | 0.0% |
| Pakistan | 4 | 0.0% |
| Panama | 8 | 0.0% |
| Peru | 5 | 0.0% |
| Philippines | 33 | 0.1% |
| Portugal | 2 | 0.0% |
| Romania | 2 | 0.0% |
| Russia | 23 | 0.0% |
| Scotland | 7 | 0.0% |
| South America | 68 | 0.1% |
| South Central Asia | 4 | 0.0% |
| South Eastern Asia | 59 | 0.1% |
| Southern Europe | 6 | 0.0% |
| Spain | 4 | 0.0% |
| Switzerland | 9 | 0.0% |
| Thailand | 4 | 0.0% |
| Uruguay | 14 | 0.0% |
| Vietnam | 21 | 0.0% |
| Western Africa | 17 | 0.0% |
| Western Asia | 100 | 0.2% |
| Western Europe | 167 | 0.3% |
| Yemen | 91 | 0.1% | View All 50 Rows |
Sex and Age in Shiawassee County
Sex and Age in Shiawassee County
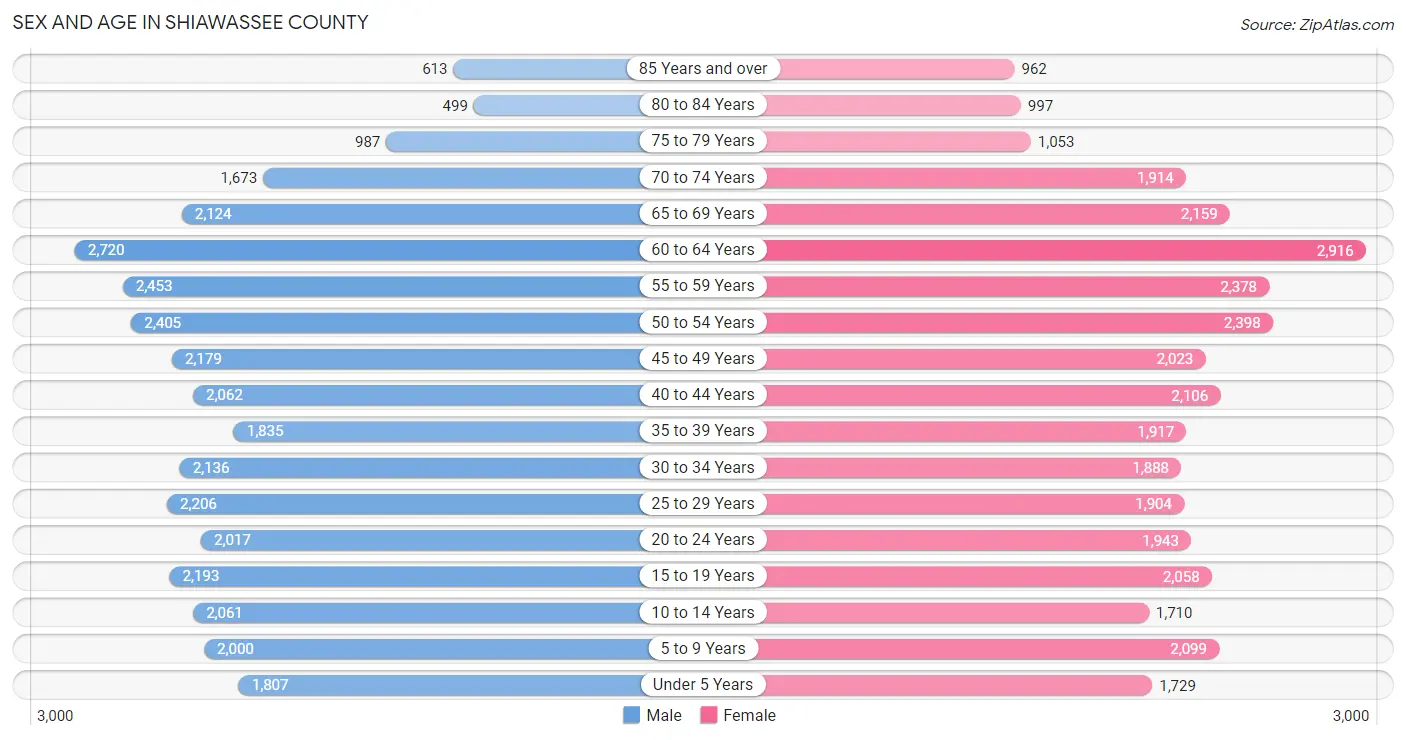
The most populous age groups in Shiawassee County are 60 to 64 Years (2,720 | 8.0%) for men and 60 to 64 Years (2,916 | 8.5%) for women.
| Age Bracket | Male | Female |
| Under 5 Years | 1,807 (5.3%) | 1,729 (5.1%) |
| 5 to 9 Years | 2,000 (5.9%) | 2,099 (6.1%) |
| 10 to 14 Years | 2,061 (6.1%) | 1,710 (5.0%) |
| 15 to 19 Years | 2,193 (6.5%) | 2,058 (6.0%) |
| 20 to 24 Years | 2,017 (5.9%) | 1,943 (5.7%) |
| 25 to 29 Years | 2,206 (6.5%) | 1,904 (5.6%) |
| 30 to 34 Years | 2,136 (6.3%) | 1,888 (5.5%) |
| 35 to 39 Years | 1,835 (5.4%) | 1,917 (5.6%) |
| 40 to 44 Years | 2,062 (6.1%) | 2,106 (6.2%) |
| 45 to 49 Years | 2,179 (6.4%) | 2,023 (5.9%) |
| 50 to 54 Years | 2,405 (7.1%) | 2,398 (7.0%) |
| 55 to 59 Years | 2,453 (7.2%) | 2,378 (7.0%) |
| 60 to 64 Years | 2,720 (8.0%) | 2,916 (8.5%) |
| 65 to 69 Years | 2,124 (6.2%) | 2,159 (6.3%) |
| 70 to 74 Years | 1,673 (4.9%) | 1,914 (5.6%) |
| 75 to 79 Years | 987 (2.9%) | 1,053 (3.1%) |
| 80 to 84 Years | 499 (1.5%) | 997 (2.9%) |
| 85 Years and over | 613 (1.8%) | 962 (2.8%) |
| Total | 33,970 (100.0%) | 34,154 (100.0%) |
Families and Households in Shiawassee County
Median Family Size in Shiawassee County
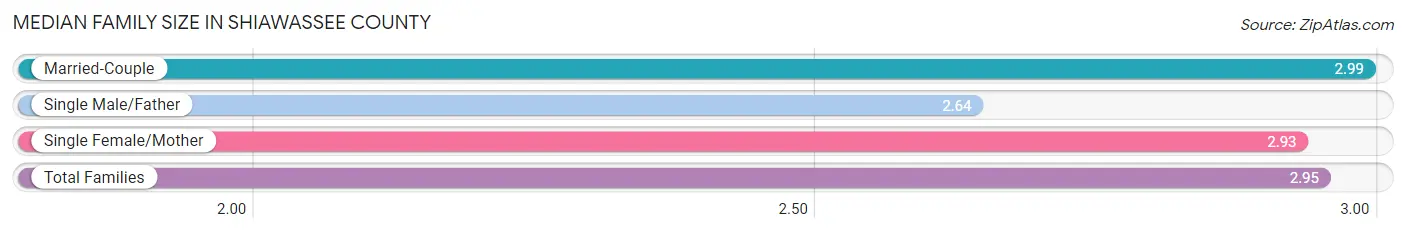
The median family size in Shiawassee County is 2.95 persons per family, with married-couple families (13,979 | 76.2%) accounting for the largest median family size of 2.99 persons per family. On the other hand, single male/father families (1,615 | 8.8%) represent the smallest median family size with 2.64 persons per family.
| Family Type | # Families | Family Size |
| Married-Couple | 13,979 (76.2%) | 2.99 |
| Single Male/Father | 1,615 (8.8%) | 2.64 |
| Single Female/Mother | 2,748 (15.0%) | 2.93 |
| Total Families | 18,342 (100.0%) | 2.95 |
Median Household Size in Shiawassee County
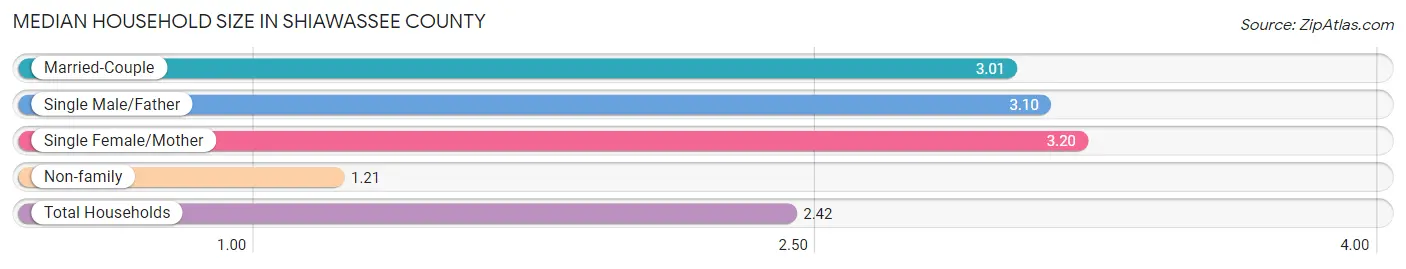
The median household size in Shiawassee County is 2.42 persons per household, with single female/mother households (2,748 | 9.8%) accounting for the largest median household size of 3.2 persons per household. non-family households (9,583 | 34.3%) represent the smallest median household size with 1.21 persons per household.
| Household Type | # Households | Household Size |
| Married-Couple | 13,979 (50.1%) | 3.01 |
| Single Male/Father | 1,615 (5.8%) | 3.10 |
| Single Female/Mother | 2,748 (9.8%) | 3.20 |
| Non-family | 9,583 (34.3%) | 1.21 |
| Total Households | 27,925 (100.0%) | 2.42 |
Household Size by Marriage Status in Shiawassee County
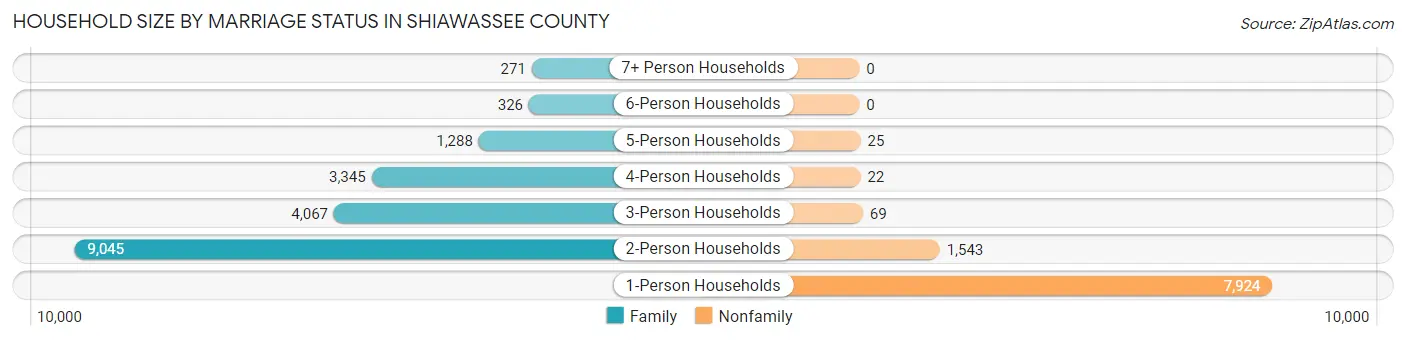
Out of a total of 27,925 households in Shiawassee County, 18,342 (65.7%) are family households, while 9,583 (34.3%) are nonfamily households. The most numerous type of family households are 2-person households, comprising 9,045, and the most common type of nonfamily households are 1-person households, comprising 7,924.
| Household Size | Family Households | Nonfamily Households |
| 1-Person Households | - | 7,924 (28.4%) |
| 2-Person Households | 9,045 (32.4%) | 1,543 (5.5%) |
| 3-Person Households | 4,067 (14.6%) | 69 (0.3%) |
| 4-Person Households | 3,345 (12.0%) | 22 (0.1%) |
| 5-Person Households | 1,288 (4.6%) | 25 (0.1%) |
| 6-Person Households | 326 (1.2%) | 0 (0.0%) |
| 7+ Person Households | 271 (1.0%) | 0 (0.0%) |
| Total | 18,342 (65.7%) | 9,583 (34.3%) |
Female Fertility in Shiawassee County
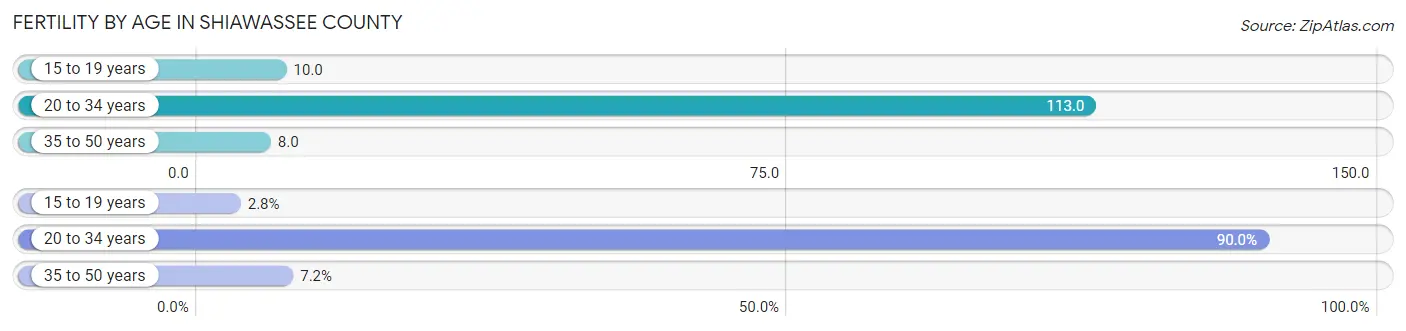
Fertility by Age in Shiawassee County
Average fertility rate in Shiawassee County is 51.0 births per 1,000 women. Women in the age bracket of 20 to 34 years have the highest fertility rate with 113.0 births per 1,000 women. Women in the age bracket of 20 to 34 years acount for 90.0% of all women with births.
| Age Bracket | Women with Births | Births / 1,000 Women |
| 15 to 19 years | 20 (2.8%) | 10.0 |
| 20 to 34 years | 647 (90.0%) | 113.0 |
| 35 to 50 years | 52 (7.2%) | 8.0 |
| Total | 719 (100.0%) | 51.0 |
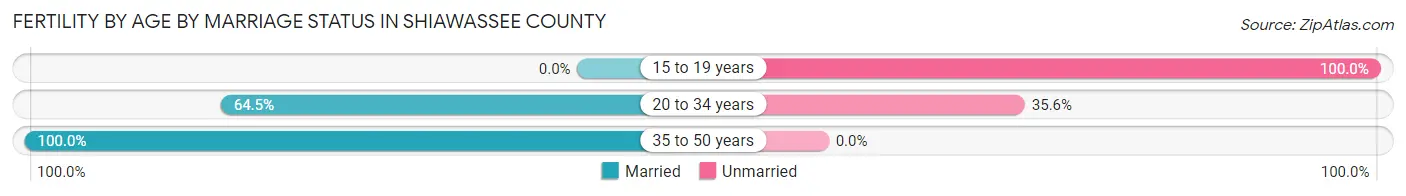
Fertility by Age by Marriage Status in Shiawassee County
65.2% of women with births (719) in Shiawassee County are married. The highest percentage of unmarried women with births falls into 15 to 19 years age bracket with 100.0% of them unmarried at the time of birth, while the lowest percentage of unmarried women with births belong to 35 to 50 years age bracket with 0.0% of them unmarried.
| Age Bracket | Married | Unmarried |
| 15 to 19 years | 0 (0.0%) | 20 (100.0%) |
| 20 to 34 years | 417 (64.4%) | 230 (35.5%) |
| 35 to 50 years | 52 (100.0%) | 0 (0.0%) |
| Total | 469 (65.2%) | 250 (34.8%) |
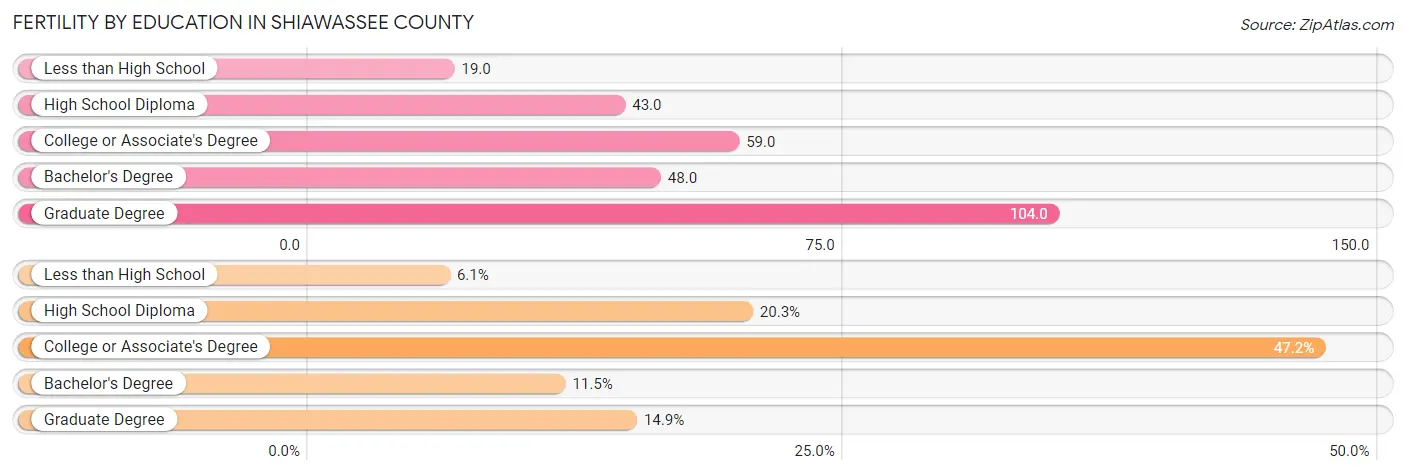
Fertility by Education in Shiawassee County
Average fertility rate in Shiawassee County is 51.0 births per 1,000 women. Women with the education attainment of graduate degree have the highest fertility rate of 104.0 births per 1,000 women, while women with the education attainment of less than high school have the lowest fertility at 19.0 births per 1,000 women. Women with the education attainment of college or associate's degree represent 47.1% of all women with births.
| Educational Attainment | Women with Births | Births / 1,000 Women |
| Less than High School | 44 (6.1%) | 19.0 |
| High School Diploma | 146 (20.3%) | 43.0 |
| College or Associate's Degree | 339 (47.1%) | 59.0 |
| Bachelor's Degree | 83 (11.5%) | 48.0 |
| Graduate Degree | 107 (14.9%) | 104.0 |
| Total | 719 (100.0%) | 51.0 |
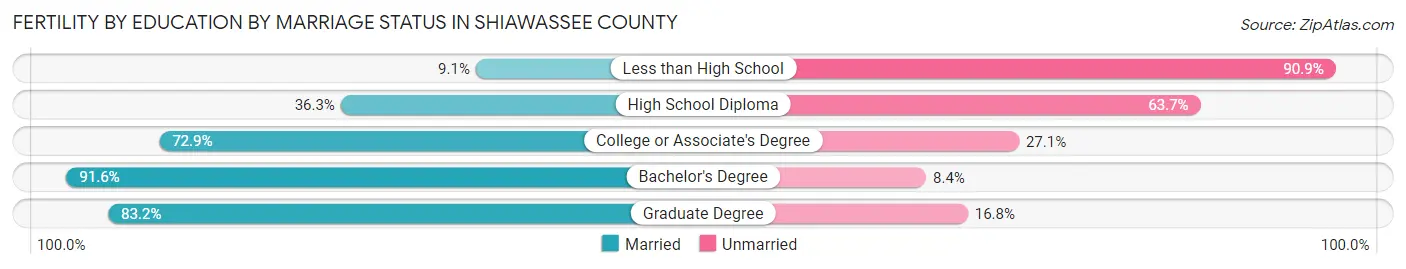
Fertility by Education by Marriage Status in Shiawassee County
34.8% of women with births in Shiawassee County are unmarried. Women with the educational attainment of bachelor's degree are most likely to be married with 91.6% of them married at childbirth, while women with the educational attainment of less than high school are least likely to be married with 90.9% of them unmarried at childbirth.
| Educational Attainment | Married | Unmarried |
| Less than High School | 4 (9.1%) | 40 (90.9%) |
| High School Diploma | 53 (36.3%) | 93 (63.7%) |
| College or Associate's Degree | 247 (72.9%) | 92 (27.1%) |
| Bachelor's Degree | 76 (91.6%) | 7 (8.4%) |
| Graduate Degree | 89 (83.2%) | 18 (16.8%) |
| Total | 469 (65.2%) | 250 (34.8%) |
Income in Shiawassee County
Income Overview in Shiawassee County
Per Capita Income in Shiawassee County is $33,328, while median incomes of families and households are $78,144 and $62,498 respectively.
| Characteristic | Number | Measure |
| Per Capita Income | 68,124 | $33,328 |
| Median Family Income | 18,342 | $78,144 |
| Mean Family Income | 18,342 | $94,942 |
| Median Household Income | 27,925 | $62,498 |
| Mean Household Income | 27,925 | $79,801 |
| Income Deficit | 18,342 | $10,777 |
| Wage / Income Gap (%) | 68,124 | 31.06% |
| Wage / Income Gap ($) | 68,124 | 68.94¢ per $1 |
| Gini / Inequality Index | 68,124 | 0.41 |
Earnings by Sex in Shiawassee County
Average Earnings in Shiawassee County are $38,080, $45,872 for men and $31,625 for women, a difference of 31.1%.
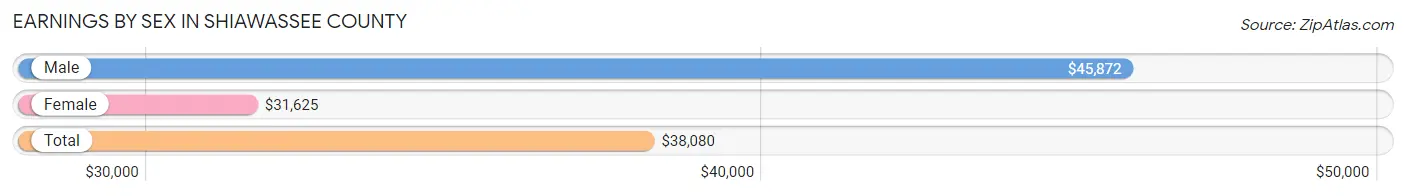
| Sex | Number | Average Earnings |
| Male | 18,003 (52.1%) | $45,872 |
| Female | 16,566 (47.9%) | $31,625 |
| Total | 34,569 (100.0%) | $38,080 |
Earnings by Sex by Income Bracket in Shiawassee County
The most common earnings brackets in Shiawassee County are $75,000 to $99,999 for men (2,121 | 11.8%) and $25,000 to $29,999 for women (1,349 | 8.1%).
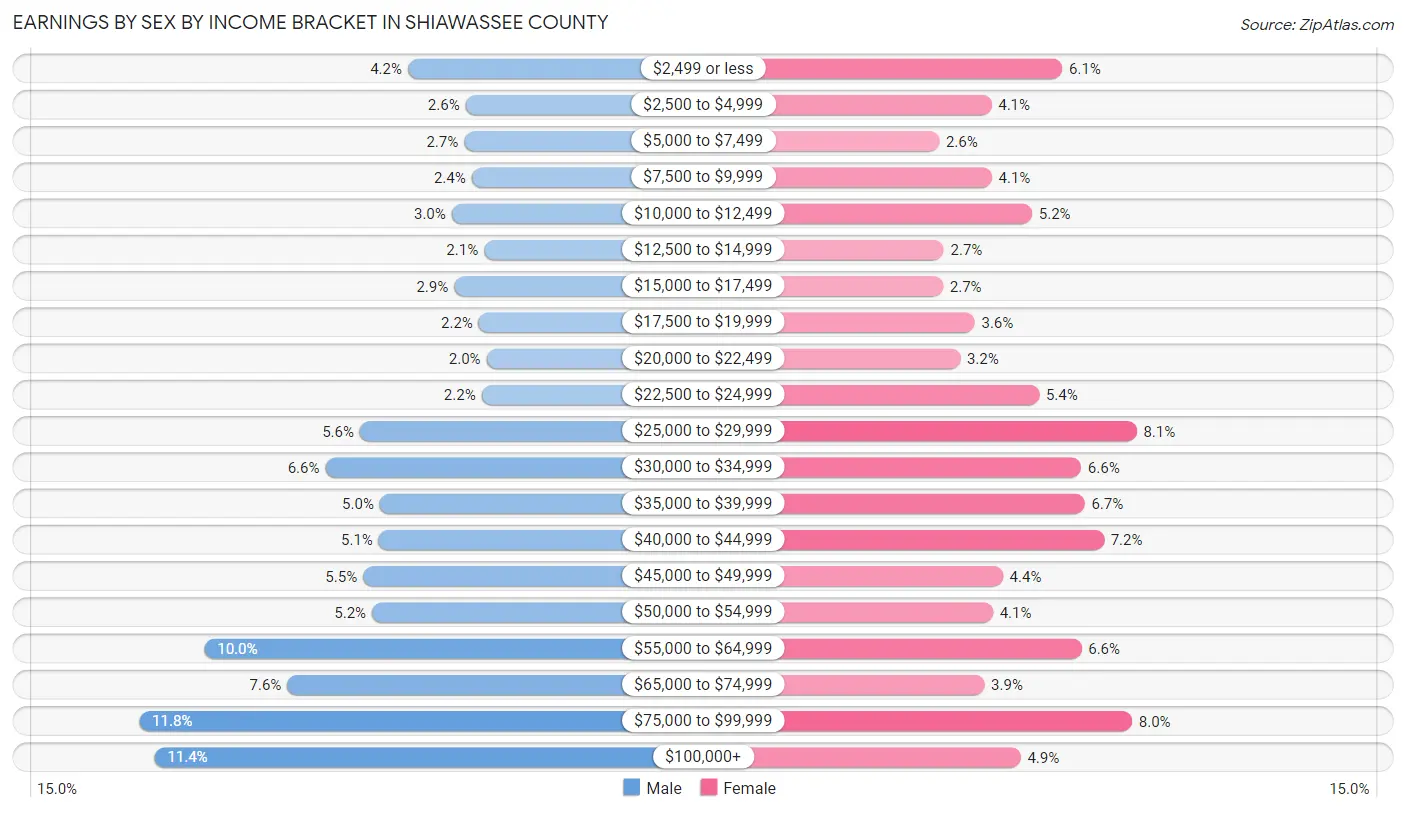
| Income | Male | Female |
| $2,499 or less | 761 (4.2%) | 1,003 (6.0%) |
| $2,500 to $4,999 | 470 (2.6%) | 673 (4.1%) |
| $5,000 to $7,499 | 477 (2.6%) | 429 (2.6%) |
| $7,500 to $9,999 | 440 (2.4%) | 674 (4.1%) |
| $10,000 to $12,499 | 540 (3.0%) | 862 (5.2%) |
| $12,500 to $14,999 | 377 (2.1%) | 450 (2.7%) |
| $15,000 to $17,499 | 527 (2.9%) | 448 (2.7%) |
| $17,500 to $19,999 | 403 (2.2%) | 595 (3.6%) |
| $20,000 to $22,499 | 364 (2.0%) | 526 (3.2%) |
| $22,500 to $24,999 | 388 (2.2%) | 895 (5.4%) |
| $25,000 to $29,999 | 1,004 (5.6%) | 1,349 (8.1%) |
| $30,000 to $34,999 | 1,180 (6.6%) | 1,090 (6.6%) |
| $35,000 to $39,999 | 904 (5.0%) | 1,106 (6.7%) |
| $40,000 to $44,999 | 909 (5.1%) | 1,196 (7.2%) |
| $45,000 to $49,999 | 988 (5.5%) | 725 (4.4%) |
| $50,000 to $54,999 | 943 (5.2%) | 679 (4.1%) |
| $55,000 to $64,999 | 1,792 (10.0%) | 1,092 (6.6%) |
| $65,000 to $74,999 | 1,371 (7.6%) | 639 (3.9%) |
| $75,000 to $99,999 | 2,121 (11.8%) | 1,327 (8.0%) |
| $100,000+ | 2,044 (11.4%) | 808 (4.9%) |
| Total | 18,003 (100.0%) | 16,566 (100.0%) |
Earnings by Sex by Educational Attainment in Shiawassee County
Average earnings in Shiawassee County are $51,659 for men and $36,900 for women, a difference of 28.6%. Men with an educational attainment of graduate degree enjoy the highest average annual earnings of $90,938, while those with less than high school education earn the least with $35,450. Women with an educational attainment of graduate degree earn the most with the average annual earnings of $63,778, while those with less than high school education have the smallest earnings of $26,579.
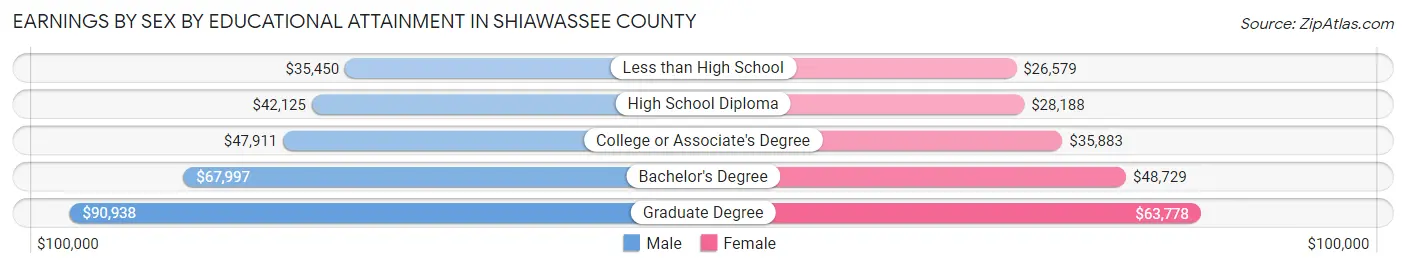
| Educational Attainment | Male Income | Female Income |
| Less than High School | $35,450 | $26,579 |
| High School Diploma | $42,125 | $28,188 |
| College or Associate's Degree | $47,911 | $35,883 |
| Bachelor's Degree | $67,997 | $48,729 |
| Graduate Degree | $90,938 | $63,778 |
| Total | $51,659 | $36,900 |
Family Income in Shiawassee County
Family Income Brackets in Shiawassee County
According to the Shiawassee County family income data, there are 3,907 families falling into the $50,000 to $74,999 income range, which is the most common income bracket and makes up 21.3% of all families. Conversely, the $10,000 to $14,999 income bracket is the least frequent group with only 220 families (1.2%) belonging to this category.
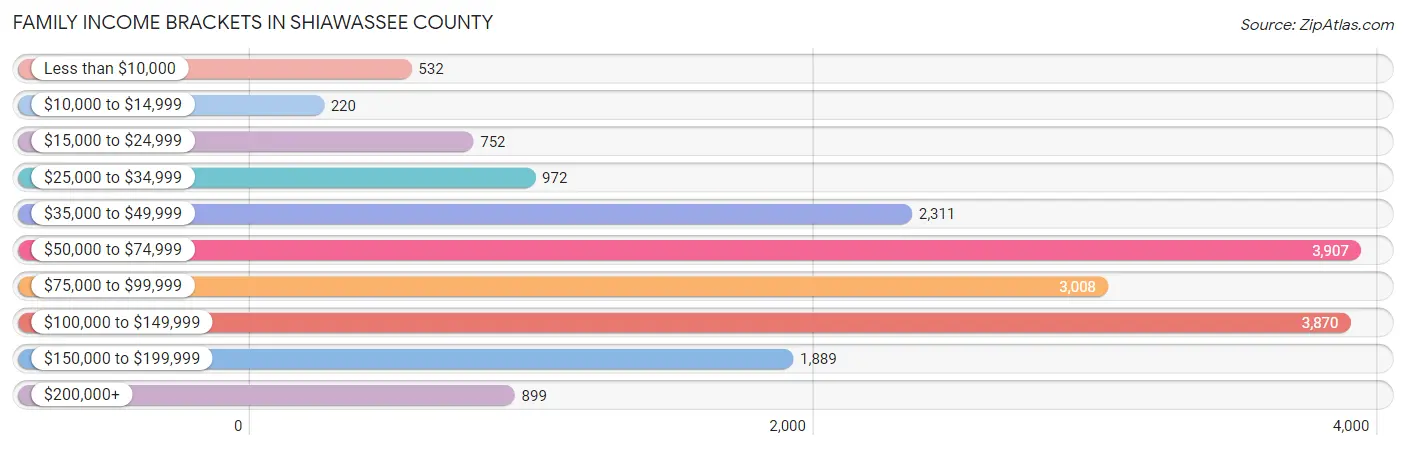
| Income Bracket | # Families | % Families |
| Less than $10,000 | 532 | 2.9% |
| $10,000 to $14,999 | 220 | 1.2% |
| $15,000 to $24,999 | 752 | 4.1% |
| $25,000 to $34,999 | 972 | 5.3% |
| $35,000 to $49,999 | 2,311 | 12.6% |
| $50,000 to $74,999 | 3,907 | 21.3% |
| $75,000 to $99,999 | 3,008 | 16.4% |
| $100,000 to $149,999 | 3,870 | 21.1% |
| $150,000 to $199,999 | 1,889 | 10.3% |
| $200,000+ | 899 | 4.9% |
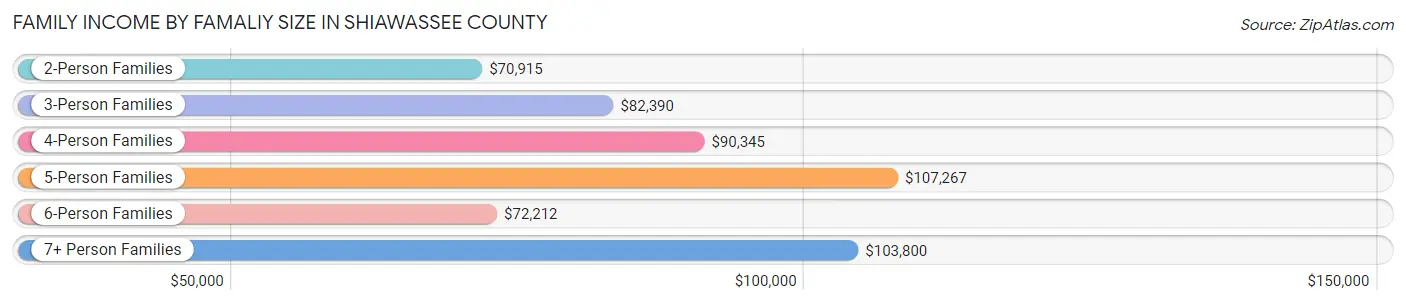
Family Income by Famaliy Size in Shiawassee County
5-person families (1,136 | 6.2%) account for the highest median family income in Shiawassee County with $107,267 per family, while 2-person families (9,690 | 52.8%) have the highest median income of $35,458 per family member.
| Income Bracket | # Families | Median Income |
| 2-Person Families | 9,690 (52.8%) | $70,915 |
| 3-Person Families | 4,123 (22.5%) | $82,390 |
| 4-Person Families | 2,856 (15.6%) | $90,345 |
| 5-Person Families | 1,136 (6.2%) | $107,267 |
| 6-Person Families | 303 (1.7%) | $72,212 |
| 7+ Person Families | 234 (1.3%) | $103,800 |
| Total | 18,342 (100.0%) | $78,144 |
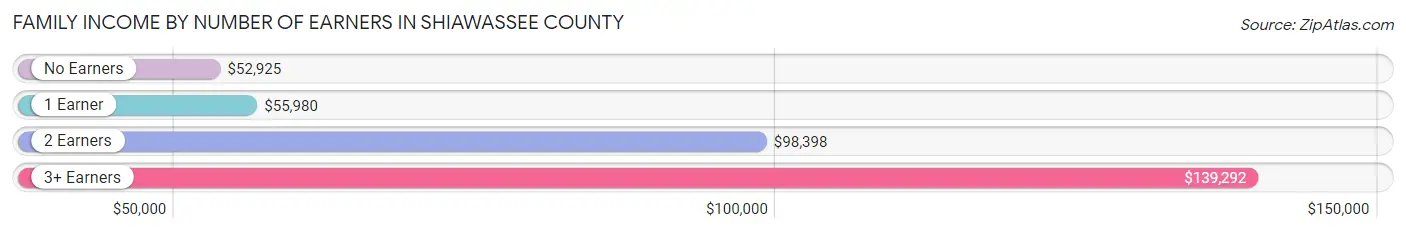
Family Income by Number of Earners in Shiawassee County
The median family income in Shiawassee County is $78,144, with families comprising 3+ earners (1,800) having the highest median family income of $139,292, while families with no earners (3,622) have the lowest median family income of $52,925, accounting for 9.8% and 19.8% of families, respectively.
| Number of Earners | # Families | Median Income |
| No Earners | 3,622 (19.8%) | $52,925 |
| 1 Earner | 5,289 (28.8%) | $55,980 |
| 2 Earners | 7,631 (41.6%) | $98,398 |
| 3+ Earners | 1,800 (9.8%) | $139,292 |
| Total | 18,342 (100.0%) | $78,144 |
Household Income in Shiawassee County
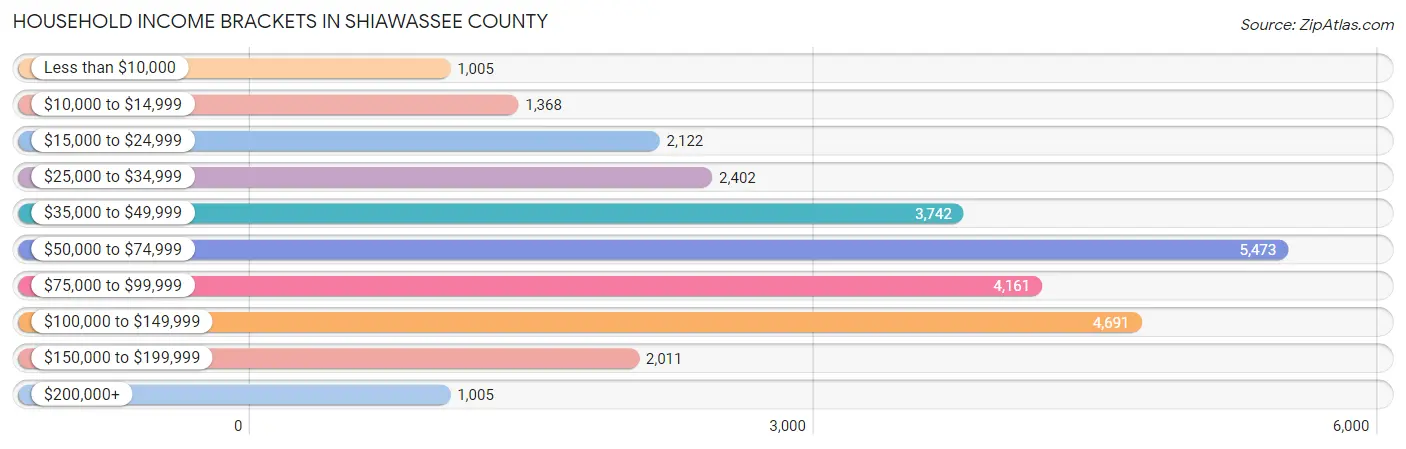
Household Income Brackets in Shiawassee County
With 5,473 households falling in the category, the $50,000 to $74,999 income range is the most frequent in Shiawassee County, accounting for 19.6% of all households. In contrast, only 1,005 households (3.6%) fall into the less than $10,000 income bracket, making it the least populous group.
| Income Bracket | # Households | % Households |
| Less than $10,000 | 1,005 | 3.6% |
| $10,000 to $14,999 | 1,368 | 4.9% |
| $15,000 to $24,999 | 2,122 | 7.6% |
| $25,000 to $34,999 | 2,402 | 8.6% |
| $35,000 to $49,999 | 3,742 | 13.4% |
| $50,000 to $74,999 | 5,473 | 19.6% |
| $75,000 to $99,999 | 4,161 | 14.9% |
| $100,000 to $149,999 | 4,691 | 16.8% |
| $150,000 to $199,999 | 2,011 | 7.2% |
| $200,000+ | 1,005 | 3.6% |
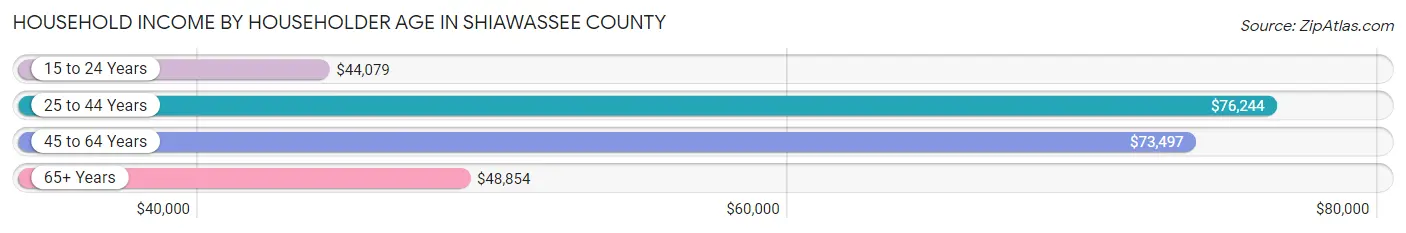
Household Income by Householder Age in Shiawassee County
The median household income in Shiawassee County is $62,498, with the highest median household income of $76,244 found in the 25 to 44 years age bracket for the primary householder. A total of 7,984 households (28.6%) fall into this category. Meanwhile, the 15 to 24 years age bracket for the primary householder has the lowest median household income of $44,079, with 694 households (2.5%) in this group.
| Income Bracket | # Households | Median Income |
| 15 to 24 Years | 694 (2.5%) | $44,079 |
| 25 to 44 Years | 7,984 (28.6%) | $76,244 |
| 45 to 64 Years | 11,083 (39.7%) | $73,497 |
| 65+ Years | 8,164 (29.2%) | $48,854 |
| Total | 27,925 (100.0%) | $62,498 |
Poverty in Shiawassee County
Income Below Poverty by Sex and Age in Shiawassee County
With 10.4% poverty level for males and 11.6% for females among the residents of Shiawassee County, under 5 year old males and 6 to 11 year old females are the most vulnerable to poverty, with 426 males (23.7%) and 387 females (16.2%) in their respective age groups living below the poverty level.
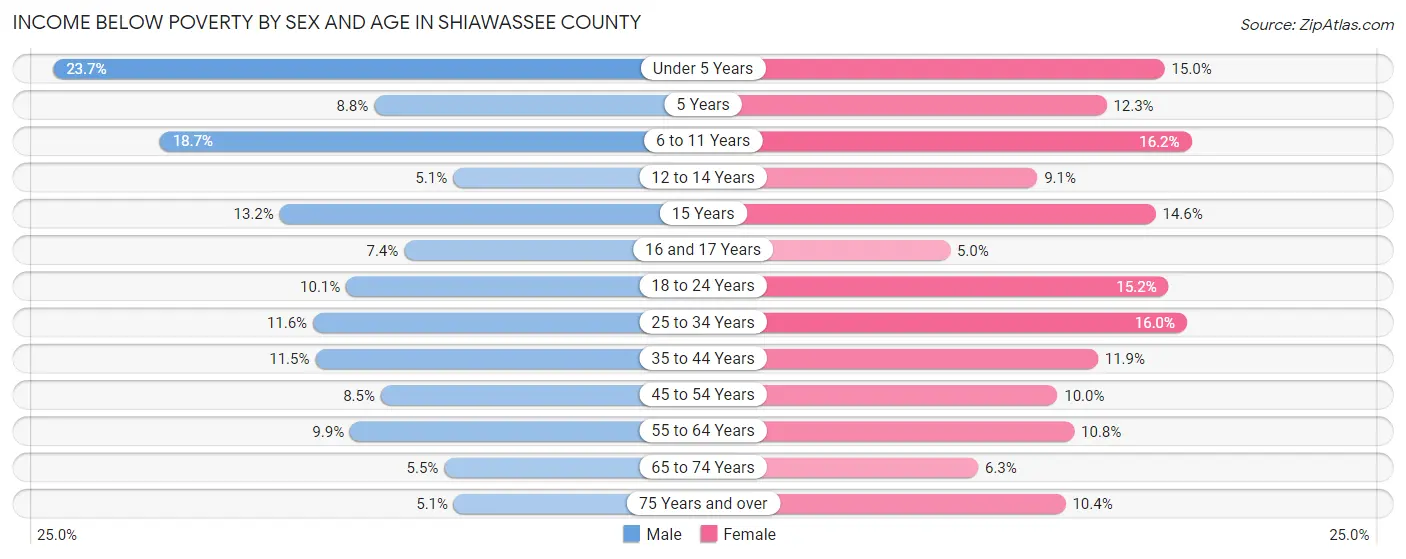
| Age Bracket | Male | Female |
| Under 5 Years | 426 (23.7%) | 256 (15.0%) |
| 5 Years | 38 (8.8%) | 41 (12.3%) |
| 6 to 11 Years | 415 (18.7%) | 387 (16.2%) |
| 12 to 14 Years | 65 (5.1%) | 87 (9.1%) |
| 15 Years | 44 (13.2%) | 54 (14.6%) |
| 16 and 17 Years | 82 (7.4%) | 49 (5.0%) |
| 18 to 24 Years | 266 (10.1%) | 392 (15.2%) |
| 25 to 34 Years | 498 (11.6%) | 607 (16.0%) |
| 35 to 44 Years | 446 (11.5%) | 478 (11.9%) |
| 45 to 54 Years | 387 (8.5%) | 442 (10.0%) |
| 55 to 64 Years | 511 (9.9%) | 569 (10.8%) |
| 65 to 74 Years | 208 (5.5%) | 256 (6.3%) |
| 75 Years and over | 105 (5.1%) | 293 (10.4%) |
| Total | 3,491 (10.4%) | 3,911 (11.6%) |
Income Above Poverty by Sex and Age in Shiawassee County
According to the poverty statistics in Shiawassee County, males aged 75 years and over and females aged 16 and 17 years are the age groups that are most secure financially, with 94.9% of males and 95.0% of females in these age groups living above the poverty line.
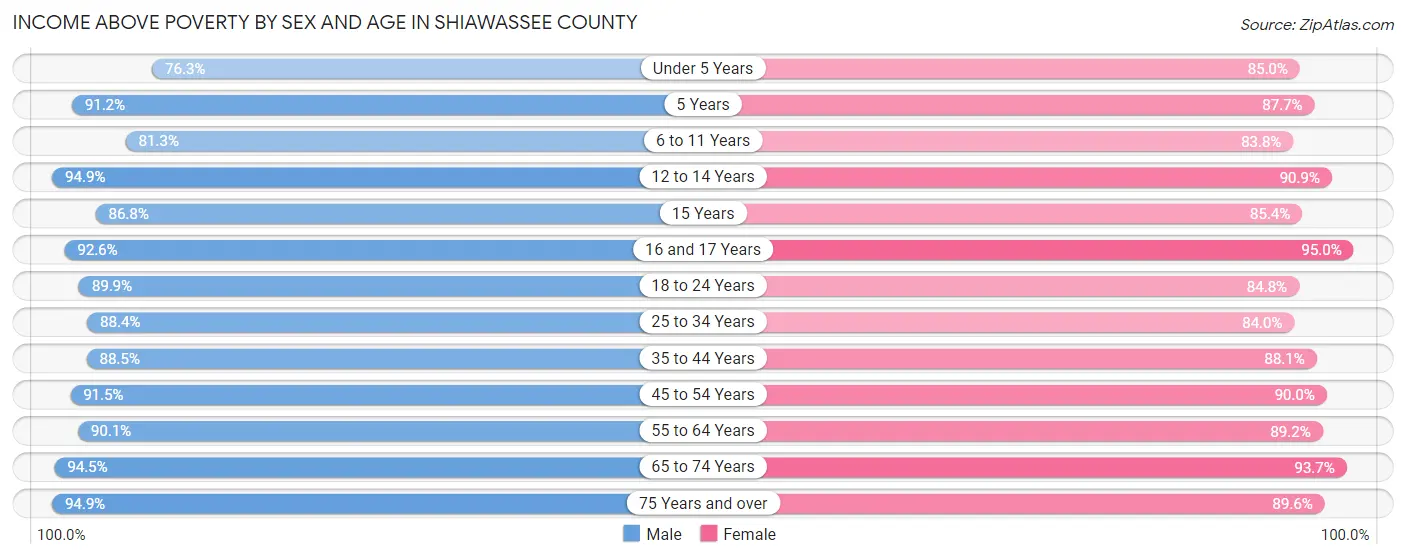
| Age Bracket | Male | Female |
| Under 5 Years | 1,374 (76.3%) | 1,453 (85.0%) |
| 5 Years | 395 (91.2%) | 293 (87.7%) |
| 6 to 11 Years | 1,801 (81.3%) | 1,999 (83.8%) |
| 12 to 14 Years | 1,204 (94.9%) | 872 (90.9%) |
| 15 Years | 290 (86.8%) | 317 (85.4%) |
| 16 and 17 Years | 1,027 (92.6%) | 927 (95.0%) |
| 18 to 24 Years | 2,372 (89.9%) | 2,194 (84.8%) |
| 25 to 34 Years | 3,786 (88.4%) | 3,185 (84.0%) |
| 35 to 44 Years | 3,429 (88.5%) | 3,545 (88.1%) |
| 45 to 54 Years | 4,181 (91.5%) | 3,979 (90.0%) |
| 55 to 64 Years | 4,652 (90.1%) | 4,711 (89.2%) |
| 65 to 74 Years | 3,556 (94.5%) | 3,797 (93.7%) |
| 75 Years and over | 1,961 (94.9%) | 2,531 (89.6%) |
| Total | 30,028 (89.6%) | 29,803 (88.4%) |
Income Below Poverty Among Married-Couple Families in Shiawassee County
The poverty statistics for married-couple families in Shiawassee County show that 3.8% or 532 of the total 13,979 families live below the poverty line. Families with 5 or more children have the highest poverty rate of 16.7%, comprising of 22 families. On the other hand, families with 1 or 2 children have the lowest poverty rate of 2.5%, which includes 99 families.
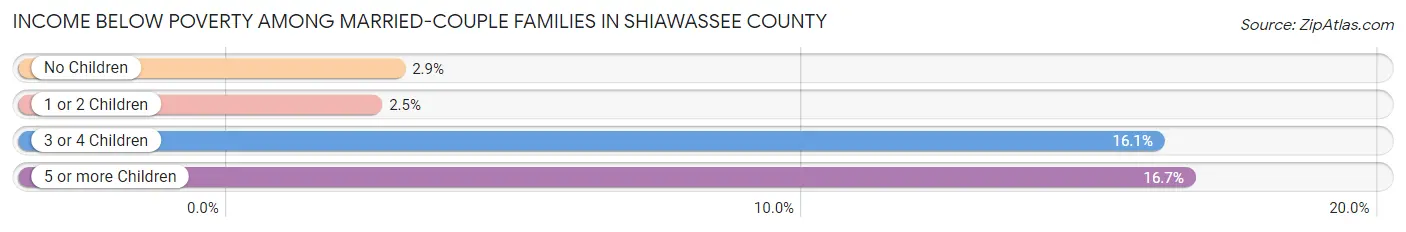
| Children | Above Poverty | Below Poverty |
| No Children | 8,712 (97.1%) | 261 (2.9%) |
| 1 or 2 Children | 3,845 (97.5%) | 99 (2.5%) |
| 3 or 4 Children | 780 (83.9%) | 150 (16.1%) |
| 5 or more Children | 110 (83.3%) | 22 (16.7%) |
| Total | 13,447 (96.2%) | 532 (3.8%) |
Income Below Poverty Among Single-Parent Households in Shiawassee County
According to the poverty data in Shiawassee County, 19.5% or 315 single-father households and 16.5% or 454 single-mother households are living below the poverty line. Among single-father households, those with 3 or 4 children have the highest poverty rate, with 20 households (35.1%) experiencing poverty. Likewise, among single-mother households, those with 5 or more children have the highest poverty rate, with 21 households (50.0%) falling below the poverty line.
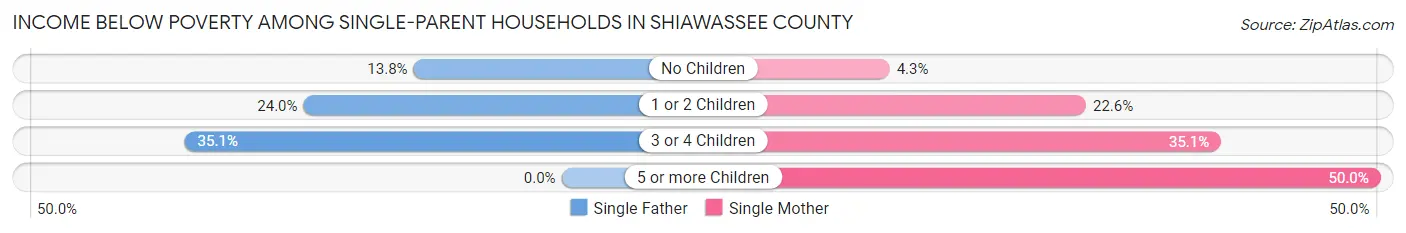
| Children | Single Father | Single Mother |
| No Children | 107 (13.8%) | 45 (4.3%) |
| 1 or 2 Children | 188 (24.0%) | 349 (22.6%) |
| 3 or 4 Children | 20 (35.1%) | 39 (35.1%) |
| 5 or more Children | 0 (0.0%) | 21 (50.0%) |
| Total | 315 (19.5%) | 454 (16.5%) |
Income Below Poverty Among Married-Couple vs Single-Parent Households in Shiawassee County
The poverty data for Shiawassee County shows that 532 of the married-couple family households (3.8%) and 769 of the single-parent households (17.6%) are living below the poverty level. Within the married-couple family households, those with 5 or more children have the highest poverty rate, with 22 households (16.7%) falling below the poverty line. Among the single-parent households, those with 5 or more children have the highest poverty rate, with 21 household (50.0%) living below poverty.
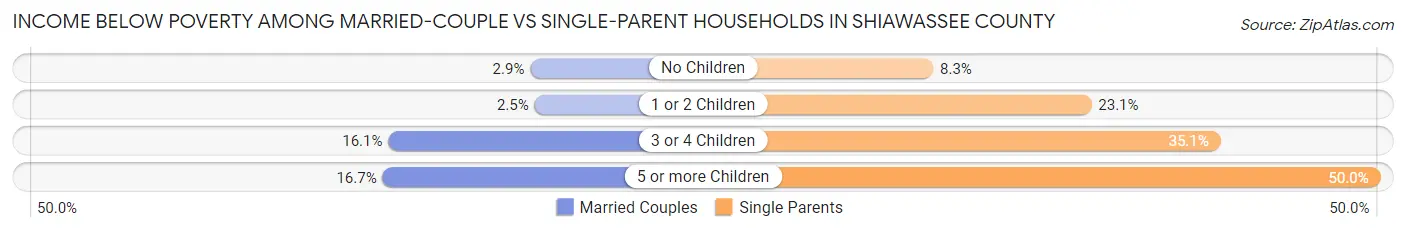
| Children | Married-Couple Families | Single-Parent Households |
| No Children | 261 (2.9%) | 152 (8.3%) |
| 1 or 2 Children | 99 (2.5%) | 537 (23.1%) |
| 3 or 4 Children | 150 (16.1%) | 59 (35.1%) |
| 5 or more Children | 22 (16.7%) | 21 (50.0%) |
| Total | 532 (3.8%) | 769 (17.6%) |
Employment Characteristics in Shiawassee County
Employment by Class of Employer in Shiawassee County
Among the 31,454 employed individuals in Shiawassee County, private company employees (22,160 | 70.5%), not-for-profit organizations (2,804 | 8.9%), and self-employed (not incorporated) (1,833 | 5.8%) make up the most common classes of employment.
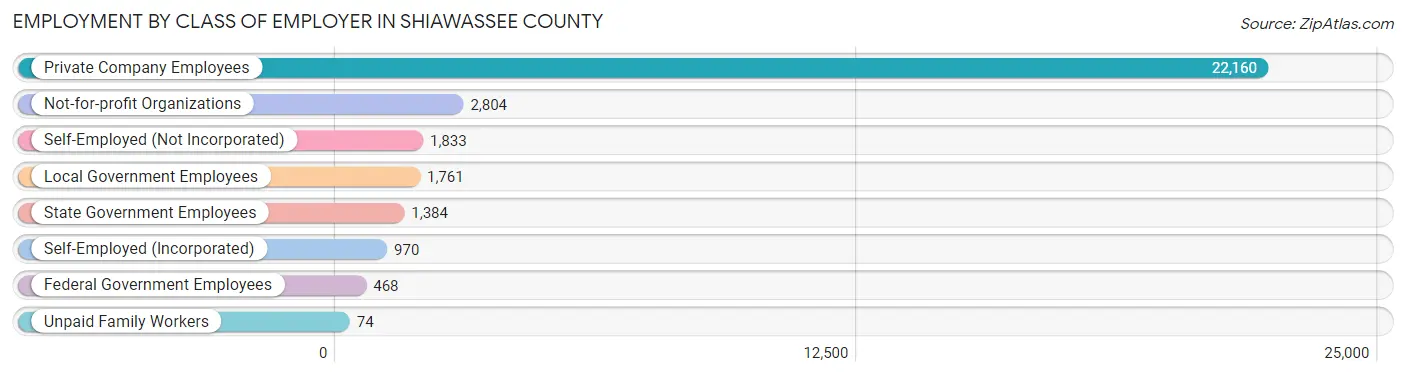
| Employer Class | # Employees | % Employees |
| Private Company Employees | 22,160 | 70.5% |
| Self-Employed (Incorporated) | 970 | 3.1% |
| Self-Employed (Not Incorporated) | 1,833 | 5.8% |
| Not-for-profit Organizations | 2,804 | 8.9% |
| Local Government Employees | 1,761 | 5.6% |
| State Government Employees | 1,384 | 4.4% |
| Federal Government Employees | 468 | 1.5% |
| Unpaid Family Workers | 74 | 0.2% |
| Total | 31,454 | 100.0% |
Employment Status by Age in Shiawassee County
According to the labor force statistics for Shiawassee County, out of the total population over 16 years of age (56,013), 59.6% or 33,384 individuals are in the labor force, with 4.1% or 1,369 of them unemployed. The age group with the highest labor force participation rate is 35 to 44 years, with 86.7% or 6,867 individuals in the labor force. Within the labor force, the 16 to 19 years age range has the highest percentage of unemployed individuals, with 15.4% or 222 of them being unemployed.
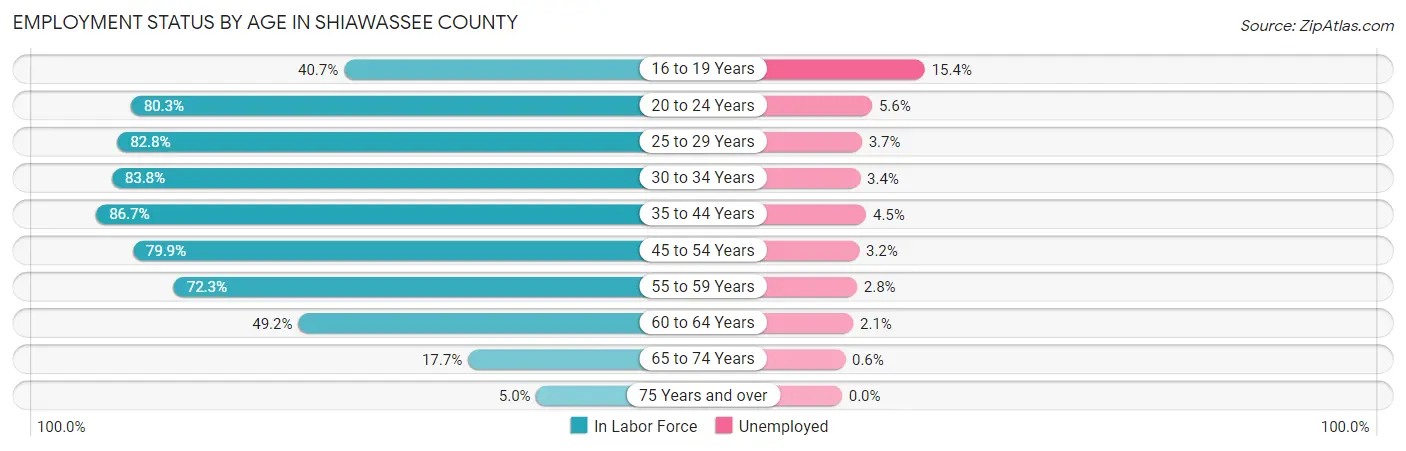
| Age Bracket | In Labor Force | Unemployed |
| 16 to 19 Years | 1,443 (40.7%) | 222 (15.4%) |
| 20 to 24 Years | 3,180 (80.3%) | 178 (5.6%) |
| 25 to 29 Years | 3,403 (82.8%) | 126 (3.7%) |
| 30 to 34 Years | 3,372 (83.8%) | 115 (3.4%) |
| 35 to 44 Years | 6,867 (86.7%) | 309 (4.5%) |
| 45 to 54 Years | 7,195 (79.9%) | 230 (3.2%) |
| 55 to 59 Years | 3,493 (72.3%) | 98 (2.8%) |
| 60 to 64 Years | 2,773 (49.2%) | 58 (2.1%) |
| 65 to 74 Years | 1,393 (17.7%) | 8 (0.6%) |
| 75 Years and over | 256 (5.0%) | 0 (0.0%) |
| Total | 33,384 (59.6%) | 1,369 (4.1%) |
Employment Status by Educational Attainment in Shiawassee County
According to labor force statistics for Shiawassee County, 76.3% of individuals (27,106) out of the total population between 25 and 64 years of age (35,526) are in the labor force, with 3.5% or 949 of them being unemployed. The group with the highest labor force participation rate are those with the educational attainment of bachelor's degree or higher, with 86.4% or 6,222 individuals in the labor force. Within the labor force, individuals with less than high school education have the highest percentage of unemployment, with 12.5% or 170 of them being unemployed.
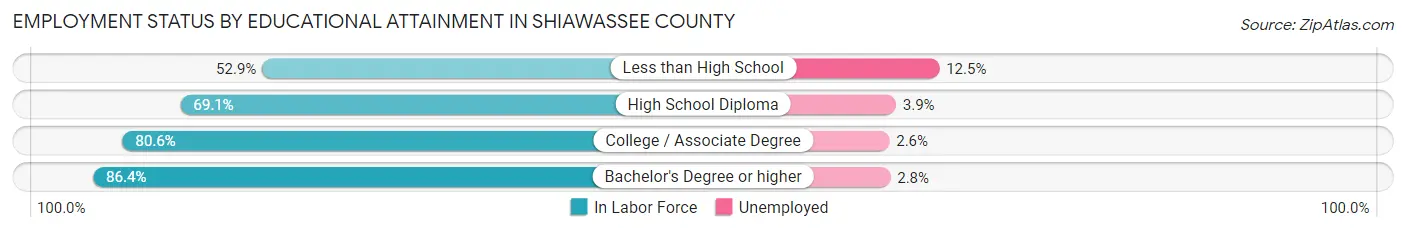
| Educational Attainment | In Labor Force | Unemployed |
| Less than High School | 1,356 (52.9%) | 320 (12.5%) |
| High School Diploma | 7,513 (69.1%) | 424 (3.9%) |
| College / Associate Degree | 12,001 (80.6%) | 387 (2.6%) |
| Bachelor's Degree or higher | 6,222 (86.4%) | 202 (2.8%) |
| Total | 27,106 (76.3%) | 1,243 (3.5%) |
Employment Occupations by Sex in Shiawassee County
Management, Business, Science and Arts Occupations
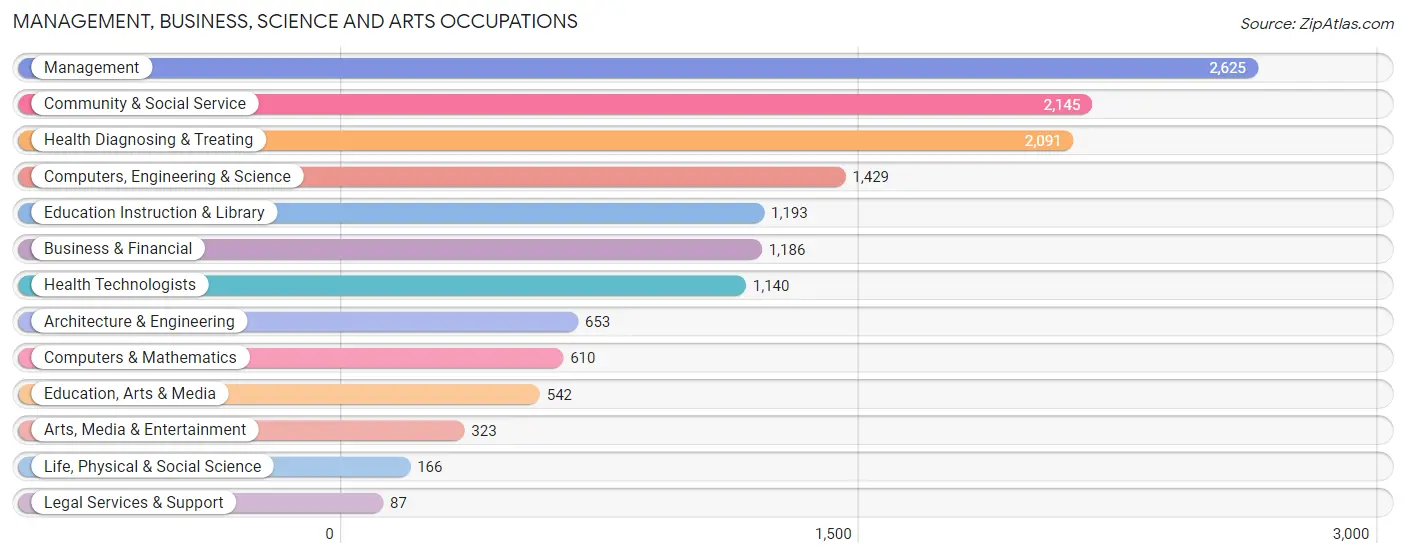
The most common Management, Business, Science and Arts occupations in Shiawassee County are Management (2,625 | 8.2%), Community & Social Service (2,145 | 6.7%), Health Diagnosing & Treating (2,091 | 6.6%), Computers, Engineering & Science (1,429 | 4.5%), and Education Instruction & Library (1,193 | 3.7%).
Management, Business, Science and Arts Occupations by Sex
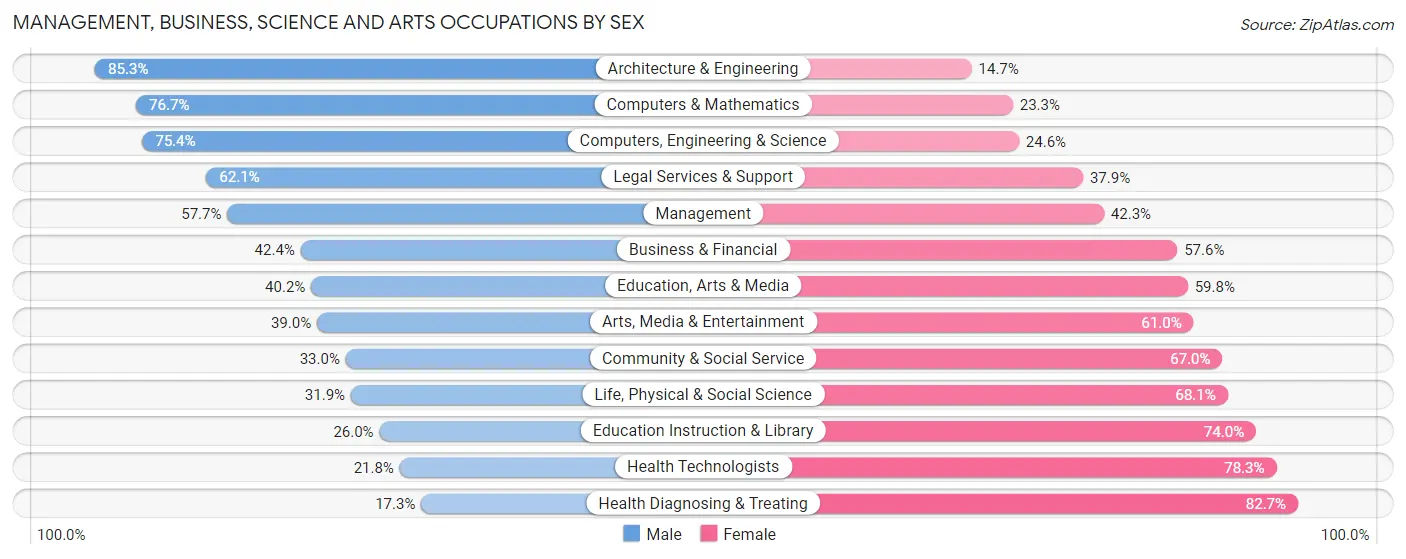
Within the Management, Business, Science and Arts occupations in Shiawassee County, the most male-oriented occupations are Architecture & Engineering (85.3%), Computers & Mathematics (76.7%), and Computers, Engineering & Science (75.4%), while the most female-oriented occupations are Health Diagnosing & Treating (82.7%), Health Technologists (78.2%), and Education Instruction & Library (74.0%).
| Occupation | Male | Female |
| Management | 1,515 (57.7%) | 1,110 (42.3%) |
| Business & Financial | 503 (42.4%) | 683 (57.6%) |
| Computers, Engineering & Science | 1,078 (75.4%) | 351 (24.6%) |
| Computers & Mathematics | 468 (76.7%) | 142 (23.3%) |
| Architecture & Engineering | 557 (85.3%) | 96 (14.7%) |
| Life, Physical & Social Science | 53 (31.9%) | 113 (68.1%) |
| Community & Social Service | 708 (33.0%) | 1,437 (67.0%) |
| Education, Arts & Media | 218 (40.2%) | 324 (59.8%) |
| Legal Services & Support | 54 (62.1%) | 33 (37.9%) |
| Education Instruction & Library | 310 (26.0%) | 883 (74.0%) |
| Arts, Media & Entertainment | 126 (39.0%) | 197 (61.0%) |
| Health Diagnosing & Treating | 361 (17.3%) | 1,730 (82.7%) |
| Health Technologists | 248 (21.7%) | 892 (78.2%) |
| Total (Category) | 4,165 (44.0%) | 5,311 (56.0%) |
| Total (Overall) | 16,580 (51.9%) | 15,352 (48.1%) |
Services Occupations
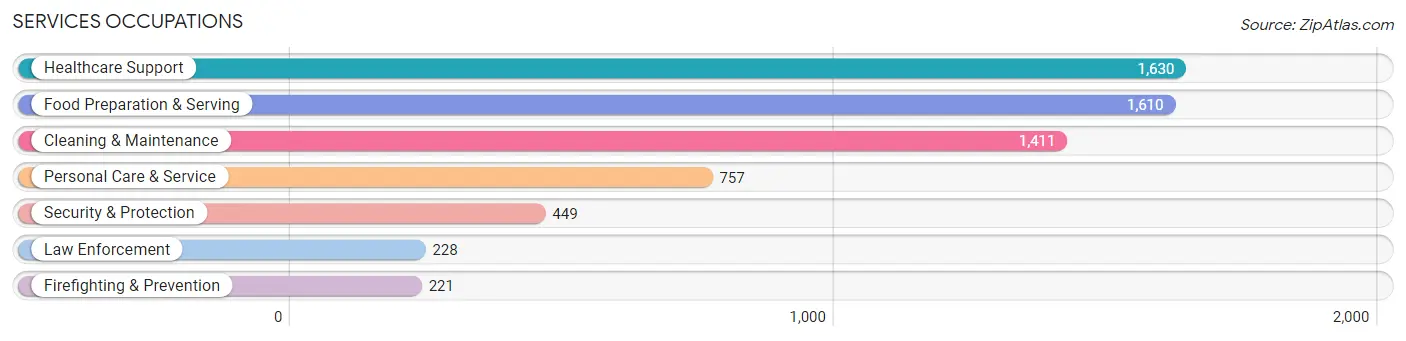
The most common Services occupations in Shiawassee County are Healthcare Support (1,630 | 5.1%), Food Preparation & Serving (1,610 | 5.0%), Cleaning & Maintenance (1,411 | 4.4%), Personal Care & Service (757 | 2.4%), and Security & Protection (449 | 1.4%).
Services Occupations by Sex
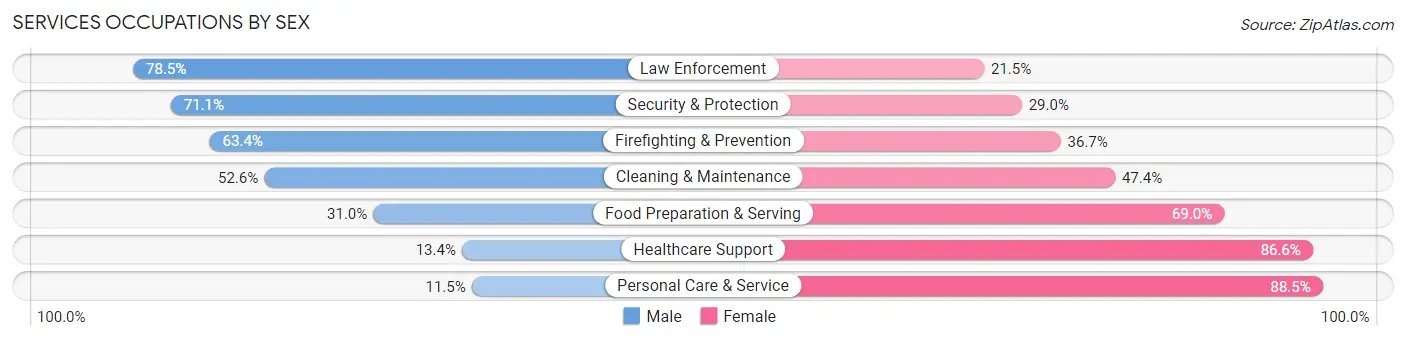
Within the Services occupations in Shiawassee County, the most male-oriented occupations are Law Enforcement (78.5%), Security & Protection (71.1%), and Firefighting & Prevention (63.3%), while the most female-oriented occupations are Personal Care & Service (88.5%), Healthcare Support (86.6%), and Food Preparation & Serving (69.0%).
| Occupation | Male | Female |
| Healthcare Support | 219 (13.4%) | 1,411 (86.6%) |
| Security & Protection | 319 (71.1%) | 130 (28.9%) |
| Firefighting & Prevention | 140 (63.3%) | 81 (36.6%) |
| Law Enforcement | 179 (78.5%) | 49 (21.5%) |
| Food Preparation & Serving | 499 (31.0%) | 1,111 (69.0%) |
| Cleaning & Maintenance | 742 (52.6%) | 669 (47.4%) |
| Personal Care & Service | 87 (11.5%) | 670 (88.5%) |
| Total (Category) | 1,866 (31.9%) | 3,991 (68.1%) |
| Total (Overall) | 16,580 (51.9%) | 15,352 (48.1%) |
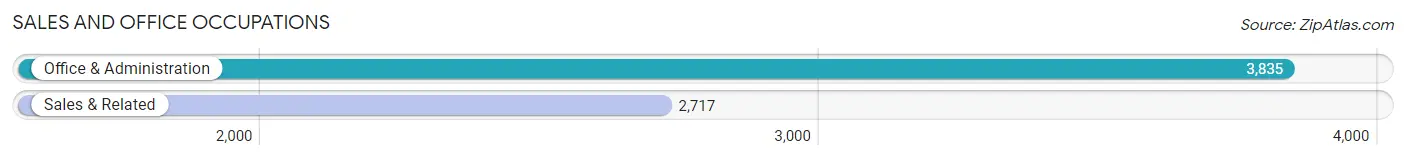
Sales and Office Occupations
The most common Sales and Office occupations in Shiawassee County are Office & Administration (3,835 | 12.0%), and Sales & Related (2,717 | 8.5%).
Sales and Office Occupations by Sex
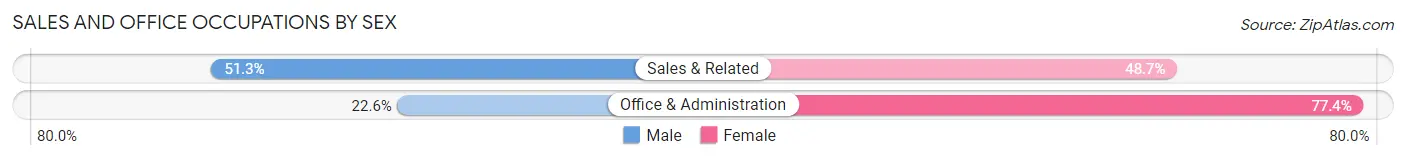
| Occupation | Male | Female |
| Sales & Related | 1,393 (51.3%) | 1,324 (48.7%) |
| Office & Administration | 867 (22.6%) | 2,968 (77.4%) |
| Total (Category) | 2,260 (34.5%) | 4,292 (65.5%) |
| Total (Overall) | 16,580 (51.9%) | 15,352 (48.1%) |
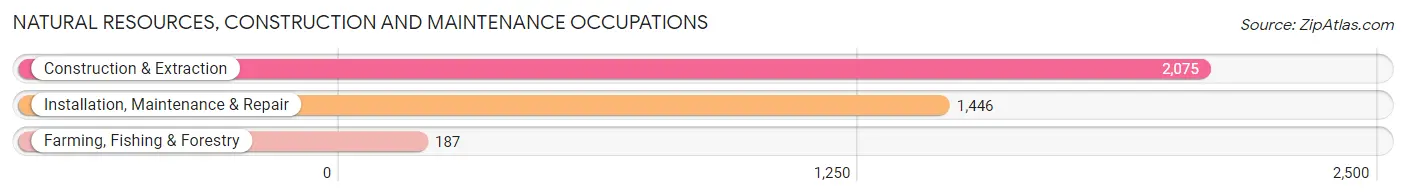
Natural Resources, Construction and Maintenance Occupations
The most common Natural Resources, Construction and Maintenance occupations in Shiawassee County are Construction & Extraction (2,075 | 6.5%), Installation, Maintenance & Repair (1,446 | 4.5%), and Farming, Fishing & Forestry (187 | 0.6%).
Natural Resources, Construction and Maintenance Occupations by Sex
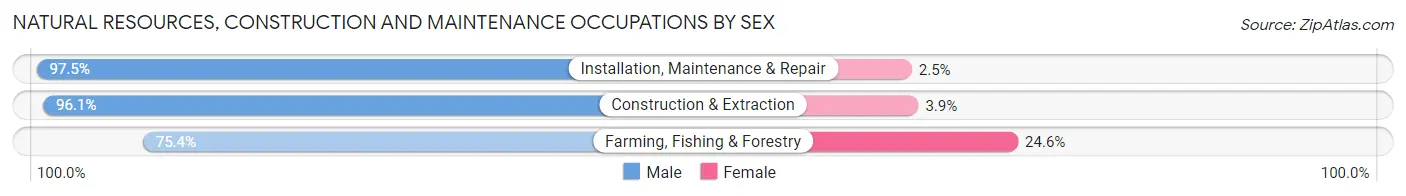
| Occupation | Male | Female |
| Farming, Fishing & Forestry | 141 (75.4%) | 46 (24.6%) |
| Construction & Extraction | 1,995 (96.1%) | 80 (3.9%) |
| Installation, Maintenance & Repair | 1,410 (97.5%) | 36 (2.5%) |
| Total (Category) | 3,546 (95.6%) | 162 (4.4%) |
| Total (Overall) | 16,580 (51.9%) | 15,352 (48.1%) |
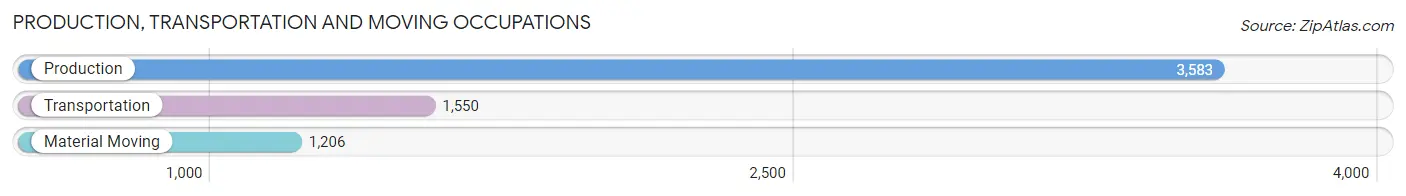
Production, Transportation and Moving Occupations
The most common Production, Transportation and Moving occupations in Shiawassee County are Production (3,583 | 11.2%), Transportation (1,550 | 4.9%), and Material Moving (1,206 | 3.8%).
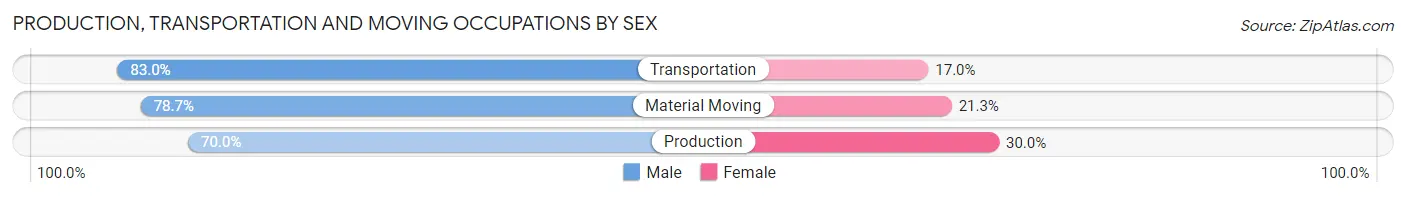
Production, Transportation and Moving Occupations by Sex
| Occupation | Male | Female |
| Production | 2,508 (70.0%) | 1,075 (30.0%) |
| Transportation | 1,286 (83.0%) | 264 (17.0%) |
| Material Moving | 949 (78.7%) | 257 (21.3%) |
| Total (Category) | 4,743 (74.8%) | 1,596 (25.2%) |
| Total (Overall) | 16,580 (51.9%) | 15,352 (48.1%) |
Employment Industries by Sex in Shiawassee County
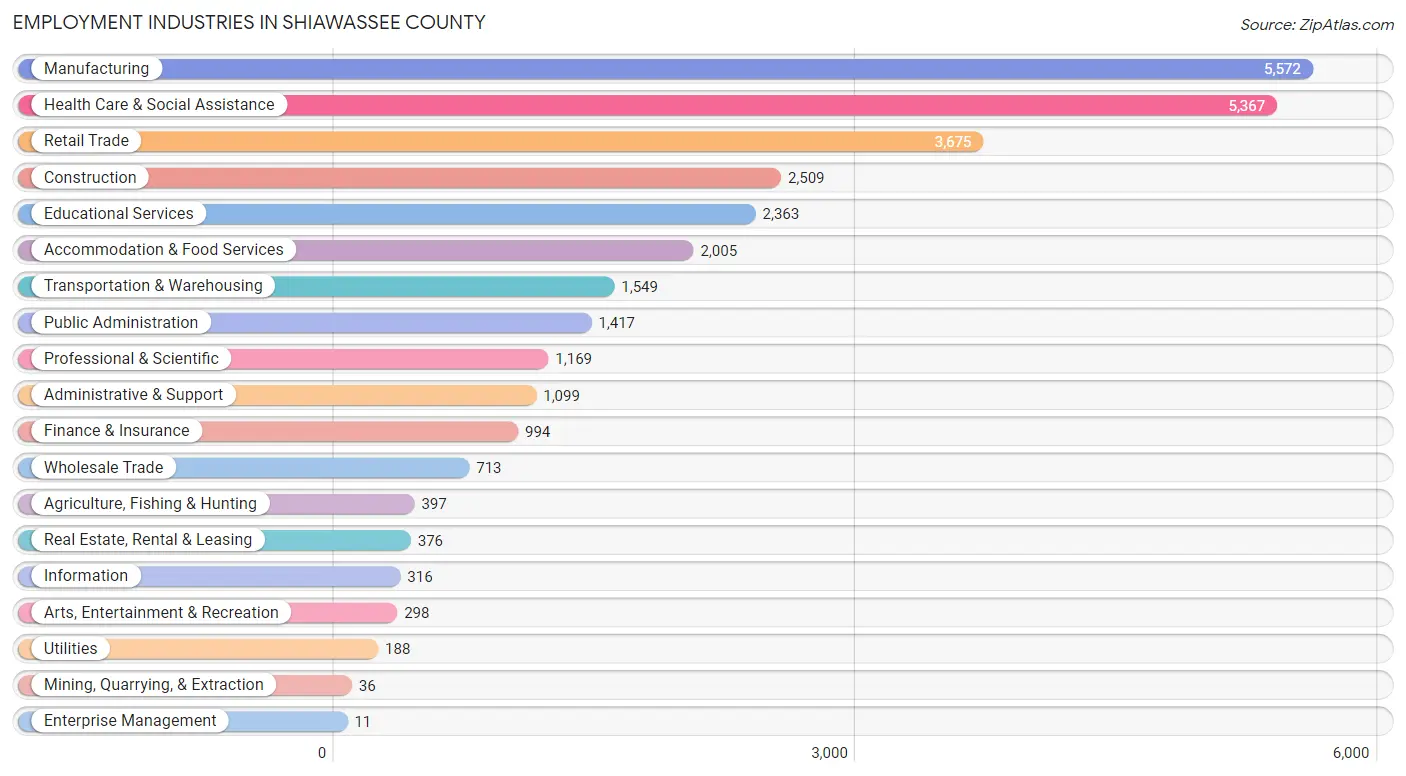
Employment Industries in Shiawassee County
The major employment industries in Shiawassee County include Manufacturing (5,572 | 17.4%), Health Care & Social Assistance (5,367 | 16.8%), Retail Trade (3,675 | 11.5%), Construction (2,509 | 7.9%), and Educational Services (2,363 | 7.4%).
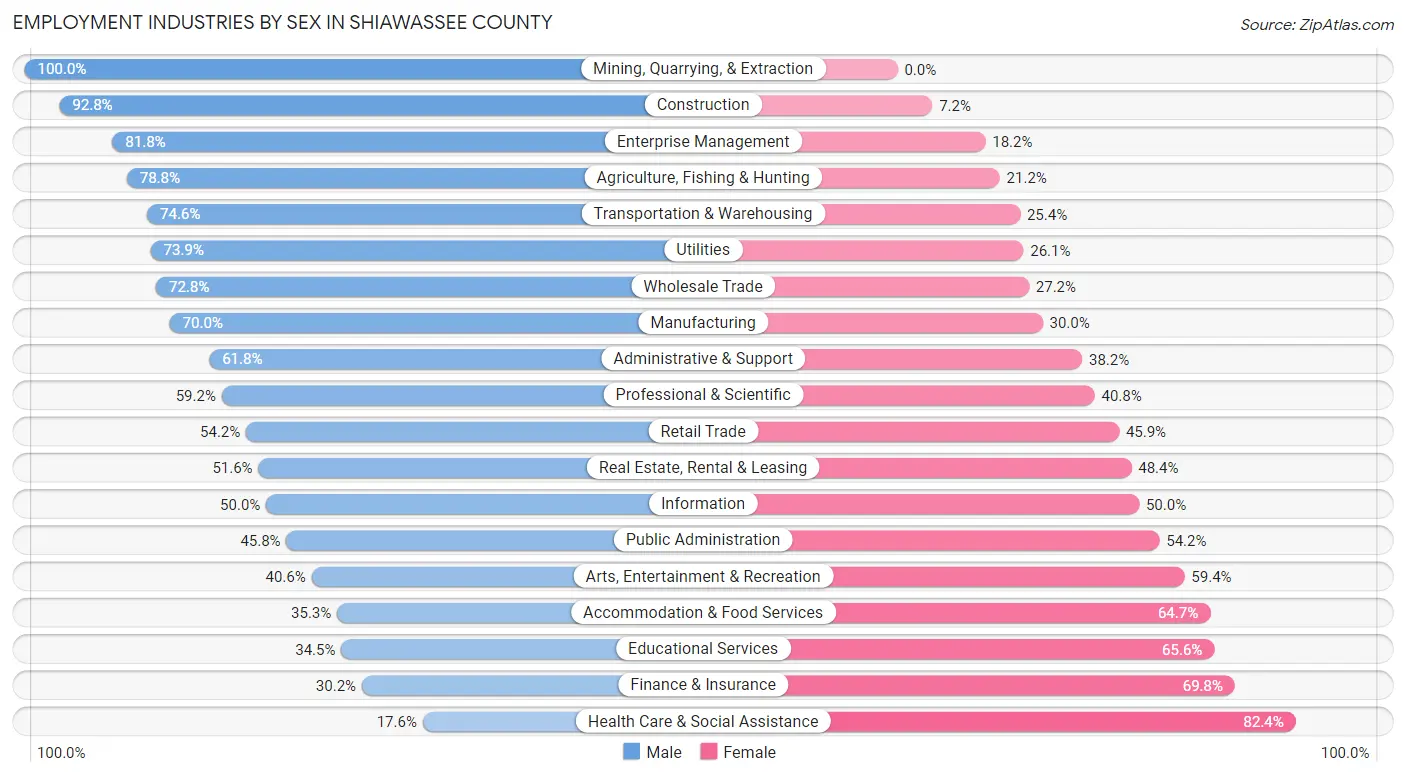
Employment Industries by Sex in Shiawassee County
The Shiawassee County industries that see more men than women are Mining, Quarrying, & Extraction (100.0%), Construction (92.8%), and Enterprise Management (81.8%), whereas the industries that tend to have a higher number of women are Health Care & Social Assistance (82.4%), Finance & Insurance (69.8%), and Educational Services (65.5%).
| Industry | Male | Female |
| Agriculture, Fishing & Hunting | 313 (78.8%) | 84 (21.2%) |
| Mining, Quarrying, & Extraction | 36 (100.0%) | 0 (0.0%) |
| Construction | 2,328 (92.8%) | 181 (7.2%) |
| Manufacturing | 3,899 (70.0%) | 1,673 (30.0%) |
| Wholesale Trade | 519 (72.8%) | 194 (27.2%) |
| Retail Trade | 1,990 (54.1%) | 1,685 (45.9%) |
| Transportation & Warehousing | 1,156 (74.6%) | 393 (25.4%) |
| Utilities | 139 (73.9%) | 49 (26.1%) |
| Information | 158 (50.0%) | 158 (50.0%) |
| Finance & Insurance | 300 (30.2%) | 694 (69.8%) |
| Real Estate, Rental & Leasing | 194 (51.6%) | 182 (48.4%) |
| Professional & Scientific | 692 (59.2%) | 477 (40.8%) |
| Enterprise Management | 9 (81.8%) | 2 (18.2%) |
| Administrative & Support | 679 (61.8%) | 420 (38.2%) |
| Educational Services | 814 (34.4%) | 1,549 (65.5%) |
| Health Care & Social Assistance | 944 (17.6%) | 4,423 (82.4%) |
| Arts, Entertainment & Recreation | 121 (40.6%) | 177 (59.4%) |
| Accommodation & Food Services | 708 (35.3%) | 1,297 (64.7%) |
| Public Administration | 649 (45.8%) | 768 (54.2%) |
| Total | 16,580 (51.9%) | 15,352 (48.1%) |
Education in Shiawassee County
School Enrollment in Shiawassee County
The most common levels of schooling among the 13,854 students in Shiawassee County are high school (3,553 | 25.7%), elementary school (3,216 | 23.2%), and middle school (2,912 | 21.0%).
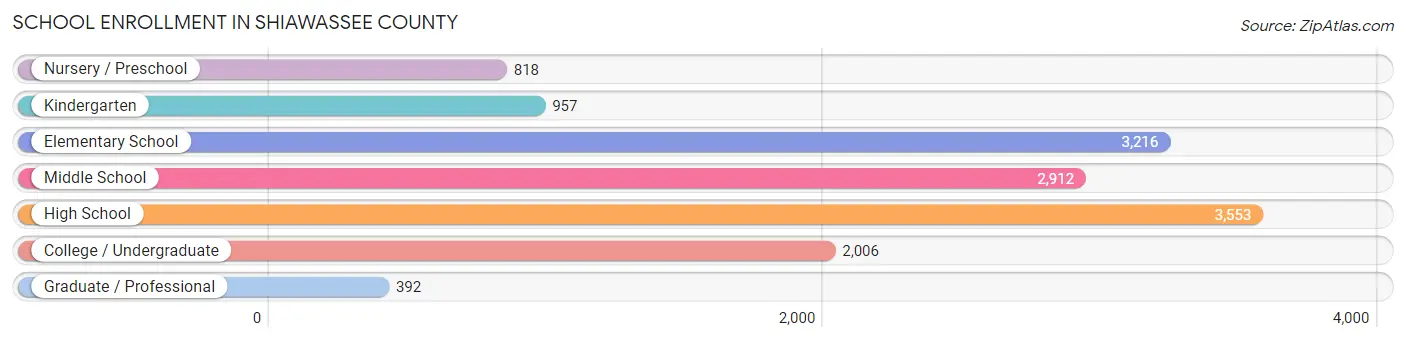
| School Level | # Students | % Students |
| Nursery / Preschool | 818 | 5.9% |
| Kindergarten | 957 | 6.9% |
| Elementary School | 3,216 | 23.2% |
| Middle School | 2,912 | 21.0% |
| High School | 3,553 | 25.7% |
| College / Undergraduate | 2,006 | 14.5% |
| Graduate / Professional | 392 | 2.8% |
| Total | 13,854 | 100.0% |
School Enrollment by Age by Funding Source in Shiawassee County
Out of a total of 13,854 students who are enrolled in schools in Shiawassee County, 1,427 (10.3%) attend a private institution, while the remaining 12,427 (89.7%) are enrolled in public schools. The age group of 3 to 4 year olds has the highest likelihood of being enrolled in private schools, with 159 (22.8% in the age bracket) enrolled. Conversely, the age group of 15 to 17 year olds has the lowest likelihood of being enrolled in a private school, with 2,509 (93.8% in the age bracket) attending a public institution.
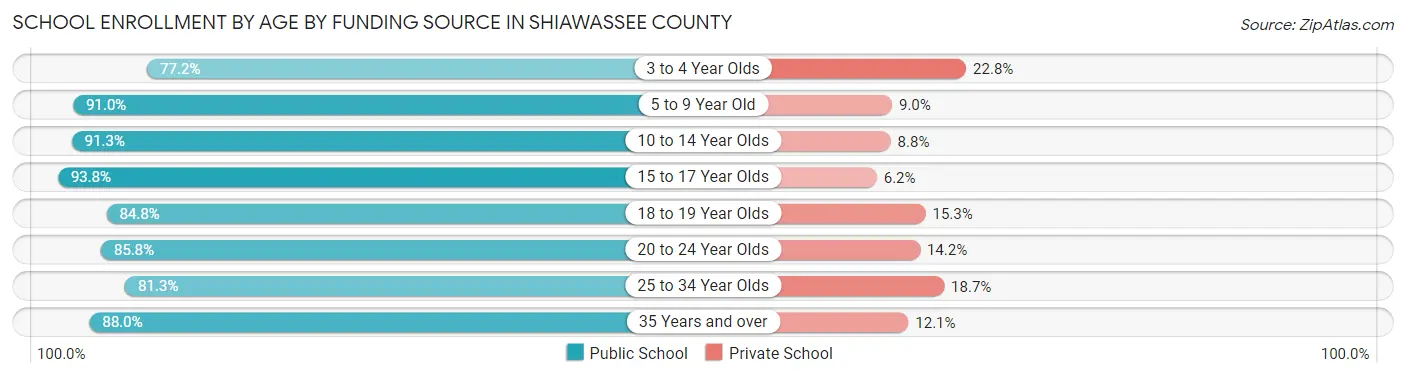
| Age Bracket | Public School | Private School |
| 3 to 4 Year Olds | 538 (77.2%) | 159 (22.8%) |
| 5 to 9 Year Old | 3,566 (91.0%) | 353 (9.0%) |
| 10 to 14 Year Olds | 3,337 (91.2%) | 320 (8.7%) |
| 15 to 17 Year Olds | 2,509 (93.8%) | 165 (6.2%) |
| 18 to 19 Year Olds | 756 (84.8%) | 136 (15.2%) |
| 20 to 24 Year Olds | 827 (85.8%) | 137 (14.2%) |
| 25 to 34 Year Olds | 382 (81.3%) | 88 (18.7%) |
| 35 Years and over | 511 (87.9%) | 70 (12.0%) |
| Total | 12,427 (89.7%) | 1,427 (10.3%) |
Educational Attainment by Field of Study in Shiawassee County
Business (2,369 | 24.0%), education (1,517 | 15.4%), science & technology (1,487 | 15.1%), arts & humanities (825 | 8.4%), and bio, nature & agricultural (645 | 6.5%) are the most common fields of study among 9,875 individuals in Shiawassee County who have obtained a bachelor's degree or higher.
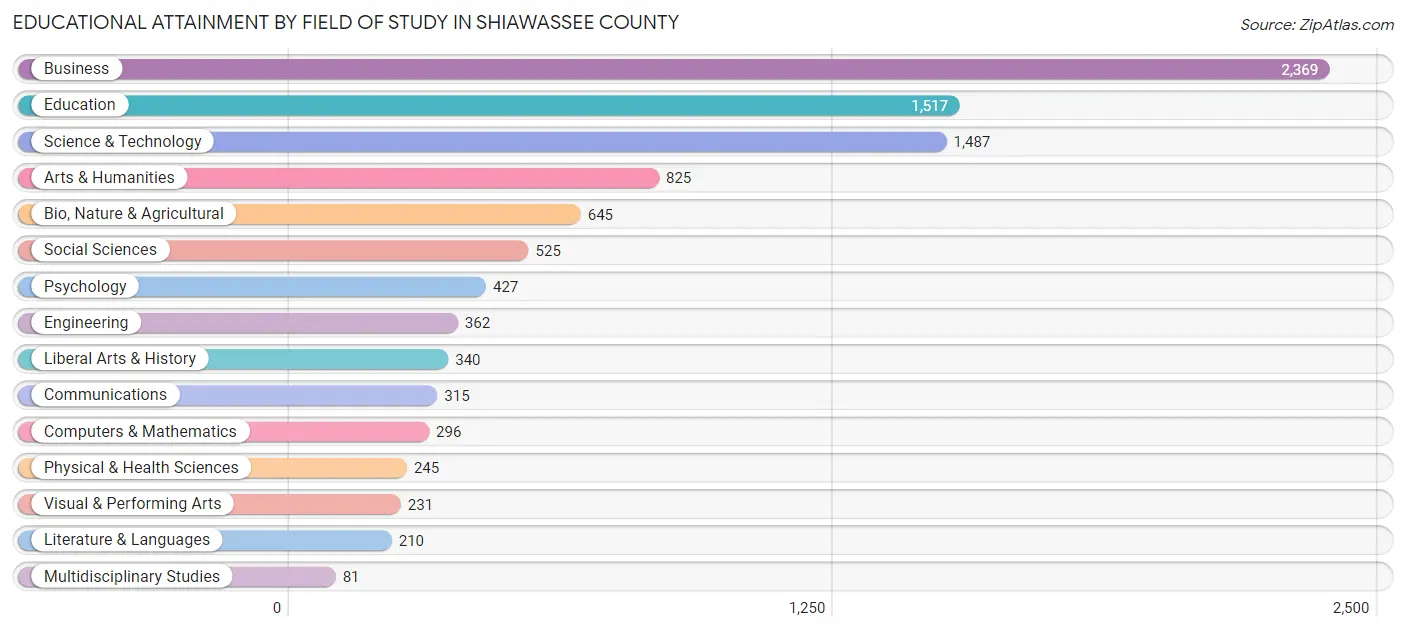
| Field of Study | # Graduates | % Graduates |
| Computers & Mathematics | 296 | 3.0% |
| Bio, Nature & Agricultural | 645 | 6.5% |
| Physical & Health Sciences | 245 | 2.5% |
| Psychology | 427 | 4.3% |
| Social Sciences | 525 | 5.3% |
| Engineering | 362 | 3.7% |
| Multidisciplinary Studies | 81 | 0.8% |
| Science & Technology | 1,487 | 15.1% |
| Business | 2,369 | 24.0% |
| Education | 1,517 | 15.4% |
| Literature & Languages | 210 | 2.1% |
| Liberal Arts & History | 340 | 3.4% |
| Visual & Performing Arts | 231 | 2.3% |
| Communications | 315 | 3.2% |
| Arts & Humanities | 825 | 8.4% |
| Total | 9,875 | 100.0% |
Transportation & Commute in Shiawassee County
Vehicle Availability by Sex in Shiawassee County
The most prevalent vehicle ownership categories in Shiawassee County are males with 2 vehicles (6,484, accounting for 39.6%) and females with 2 vehicles (5,741, making up 43.1%).
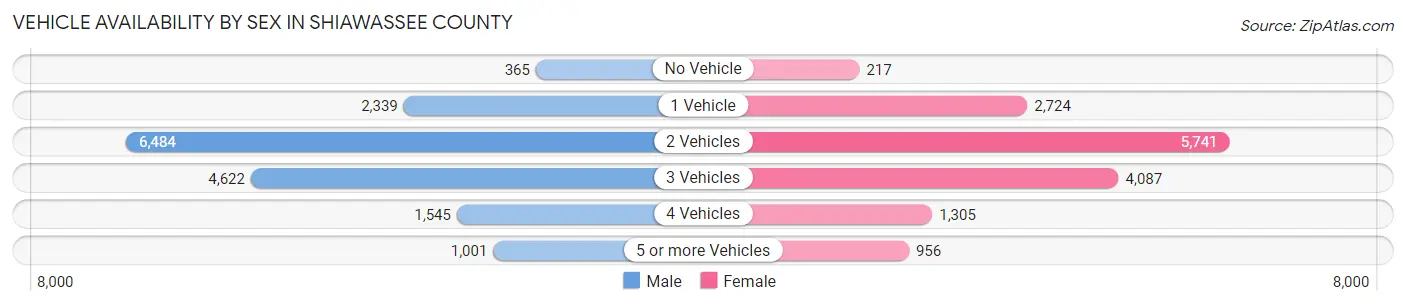
| Vehicles Available | Male | Female |
| No Vehicle | 365 (2.2%) | 217 (1.4%) |
| 1 Vehicle | 2,339 (14.3%) | 2,724 (18.1%) |
| 2 Vehicles | 6,484 (39.6%) | 5,741 (38.2%) |
| 3 Vehicles | 4,622 (28.3%) | 4,087 (27.2%) |
| 4 Vehicles | 1,545 (9.5%) | 1,305 (8.7%) |
| 5 or more Vehicles | 1,001 (6.1%) | 956 (6.4%) |
| Total | 16,356 (100.0%) | 15,030 (100.0%) |
Commute Time in Shiawassee County
The most frequently occuring commute durations in Shiawassee County are 5 to 9 minutes (3,993 commuters, 13.6%), 30 to 34 minutes (3,608 commuters, 12.3%), and 10 to 14 minutes (3,476 commuters, 11.8%).
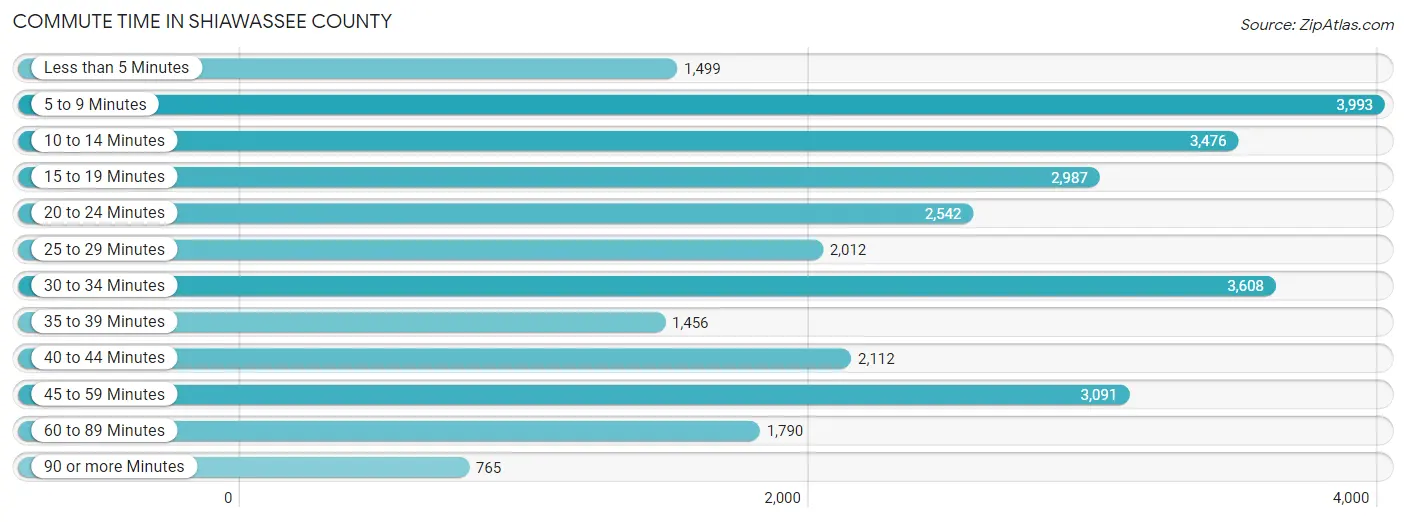
| Commute Time | # Commuters | % Commuters |
| Less than 5 Minutes | 1,499 | 5.1% |
| 5 to 9 Minutes | 3,993 | 13.6% |
| 10 to 14 Minutes | 3,476 | 11.8% |
| 15 to 19 Minutes | 2,987 | 10.2% |
| 20 to 24 Minutes | 2,542 | 8.7% |
| 25 to 29 Minutes | 2,012 | 6.9% |
| 30 to 34 Minutes | 3,608 | 12.3% |
| 35 to 39 Minutes | 1,456 | 5.0% |
| 40 to 44 Minutes | 2,112 | 7.2% |
| 45 to 59 Minutes | 3,091 | 10.5% |
| 60 to 89 Minutes | 1,790 | 6.1% |
| 90 or more Minutes | 765 | 2.6% |
Commute Time by Sex in Shiawassee County
The most common commute times in Shiawassee County are 30 to 34 minutes (1,879 commuters, 12.2%) for males and 5 to 9 minutes (2,212 commuters, 15.8%) for females.
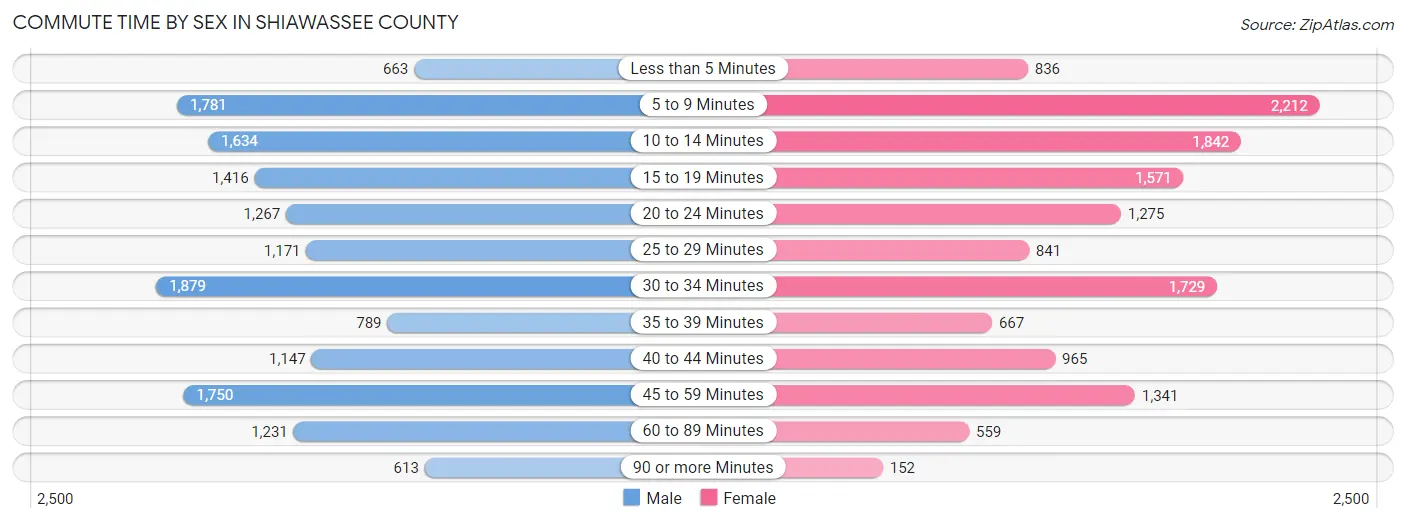
| Commute Time | Male | Female |
| Less than 5 Minutes | 663 (4.3%) | 836 (6.0%) |
| 5 to 9 Minutes | 1,781 (11.6%) | 2,212 (15.8%) |
| 10 to 14 Minutes | 1,634 (10.6%) | 1,842 (13.2%) |
| 15 to 19 Minutes | 1,416 (9.2%) | 1,571 (11.2%) |
| 20 to 24 Minutes | 1,267 (8.3%) | 1,275 (9.1%) |
| 25 to 29 Minutes | 1,171 (7.6%) | 841 (6.0%) |
| 30 to 34 Minutes | 1,879 (12.2%) | 1,729 (12.4%) |
| 35 to 39 Minutes | 789 (5.1%) | 667 (4.8%) |
| 40 to 44 Minutes | 1,147 (7.5%) | 965 (6.9%) |
| 45 to 59 Minutes | 1,750 (11.4%) | 1,341 (9.6%) |
| 60 to 89 Minutes | 1,231 (8.0%) | 559 (4.0%) |
| 90 or more Minutes | 613 (4.0%) | 152 (1.1%) |
Time of Departure to Work by Sex in Shiawassee County
The most frequent times of departure to work in Shiawassee County are 7:00 AM to 7:29 AM (2,067, 13.5%) for males and 7:00 AM to 7:29 AM (2,440, 17.4%) for females.
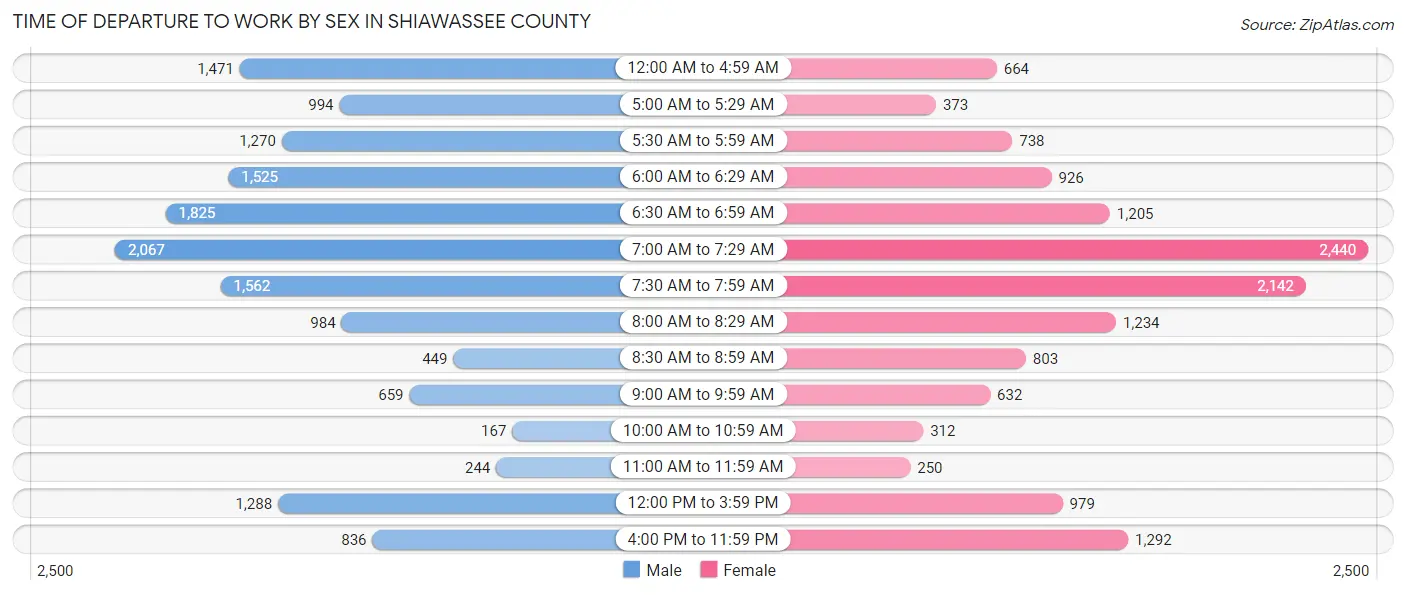
| Time of Departure | Male | Female |
| 12:00 AM to 4:59 AM | 1,471 (9.6%) | 664 (4.8%) |
| 5:00 AM to 5:29 AM | 994 (6.5%) | 373 (2.7%) |
| 5:30 AM to 5:59 AM | 1,270 (8.3%) | 738 (5.3%) |
| 6:00 AM to 6:29 AM | 1,525 (9.9%) | 926 (6.6%) |
| 6:30 AM to 6:59 AM | 1,825 (11.9%) | 1,205 (8.6%) |
| 7:00 AM to 7:29 AM | 2,067 (13.5%) | 2,440 (17.4%) |
| 7:30 AM to 7:59 AM | 1,562 (10.2%) | 2,142 (15.3%) |
| 8:00 AM to 8:29 AM | 984 (6.4%) | 1,234 (8.8%) |
| 8:30 AM to 8:59 AM | 449 (2.9%) | 803 (5.7%) |
| 9:00 AM to 9:59 AM | 659 (4.3%) | 632 (4.5%) |
| 10:00 AM to 10:59 AM | 167 (1.1%) | 312 (2.2%) |
| 11:00 AM to 11:59 AM | 244 (1.6%) | 250 (1.8%) |
| 12:00 PM to 3:59 PM | 1,288 (8.4%) | 979 (7.0%) |
| 4:00 PM to 11:59 PM | 836 (5.4%) | 1,292 (9.2%) |
| Total | 15,341 (100.0%) | 13,990 (100.0%) |
Housing Occupancy in Shiawassee County
Occupancy by Ownership in Shiawassee County
Of the total 27,925 dwellings in Shiawassee County, owner-occupied units account for 21,756 (77.9%), while renter-occupied units make up 6,169 (22.1%).
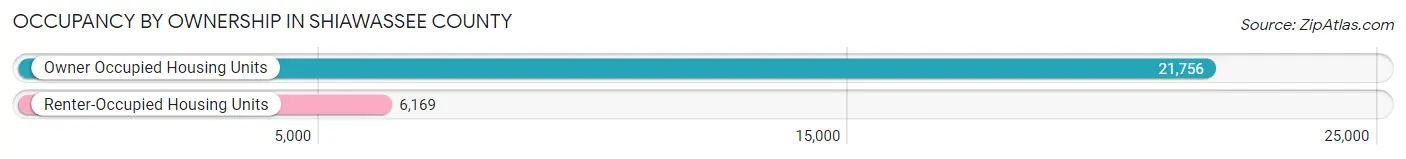
| Occupancy | # Housing Units | % Housing Units |
| Owner Occupied Housing Units | 21,756 | 77.9% |
| Renter-Occupied Housing Units | 6,169 | 22.1% |
| Total Occupied Housing Units | 27,925 | 100.0% |
Occupancy by Household Size in Shiawassee County
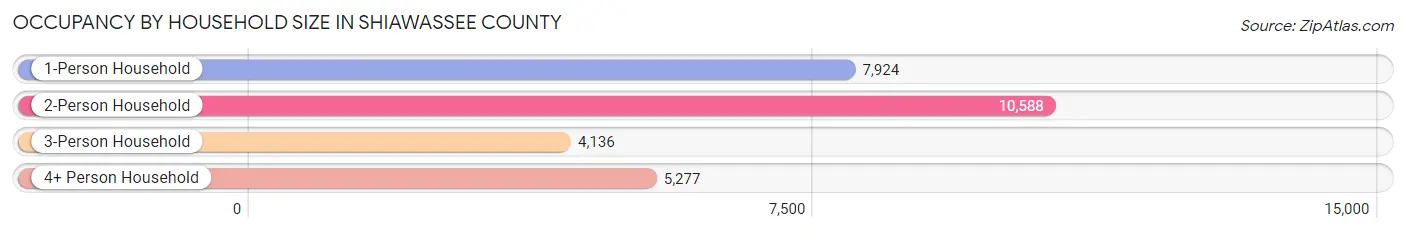
| Household Size | # Housing Units | % Housing Units |
| 1-Person Household | 7,924 | 28.4% |
| 2-Person Household | 10,588 | 37.9% |
| 3-Person Household | 4,136 | 14.8% |
| 4+ Person Household | 5,277 | 18.9% |
| Total Housing Units | 27,925 | 100.0% |
Occupancy by Ownership by Household Size in Shiawassee County
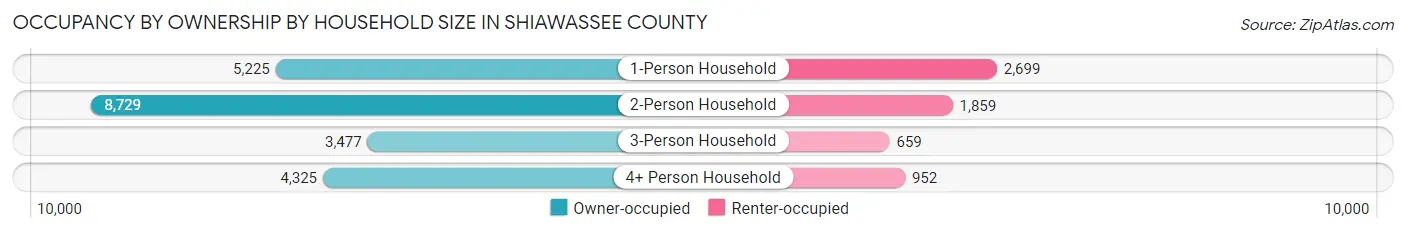
| Household Size | Owner-occupied | Renter-occupied |
| 1-Person Household | 5,225 (65.9%) | 2,699 (34.1%) |
| 2-Person Household | 8,729 (82.4%) | 1,859 (17.6%) |
| 3-Person Household | 3,477 (84.1%) | 659 (15.9%) |
| 4+ Person Household | 4,325 (82.0%) | 952 (18.0%) |
| Total Housing Units | 21,756 (77.9%) | 6,169 (22.1%) |
Occupancy by Educational Attainment in Shiawassee County
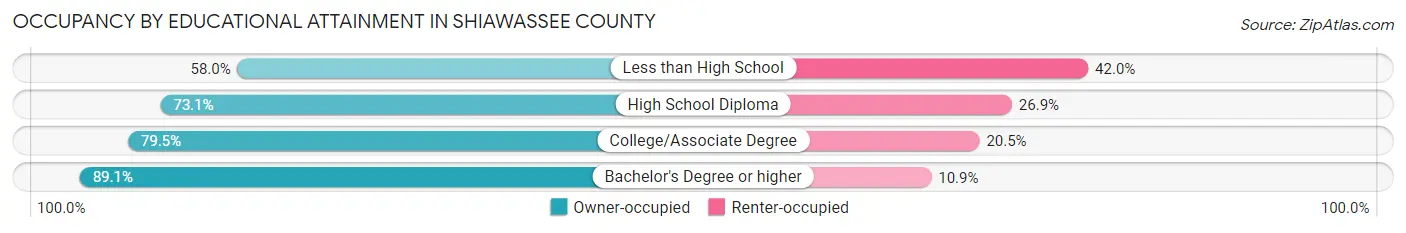
| Household Size | Owner-occupied | Renter-occupied |
| Less than High School | 1,069 (58.0%) | 775 (42.0%) |
| High School Diploma | 6,635 (73.1%) | 2,443 (26.9%) |
| College/Associate Degree | 9,091 (79.5%) | 2,342 (20.5%) |
| Bachelor's Degree or higher | 4,961 (89.1%) | 609 (10.9%) |
Occupancy by Age of Householder in Shiawassee County
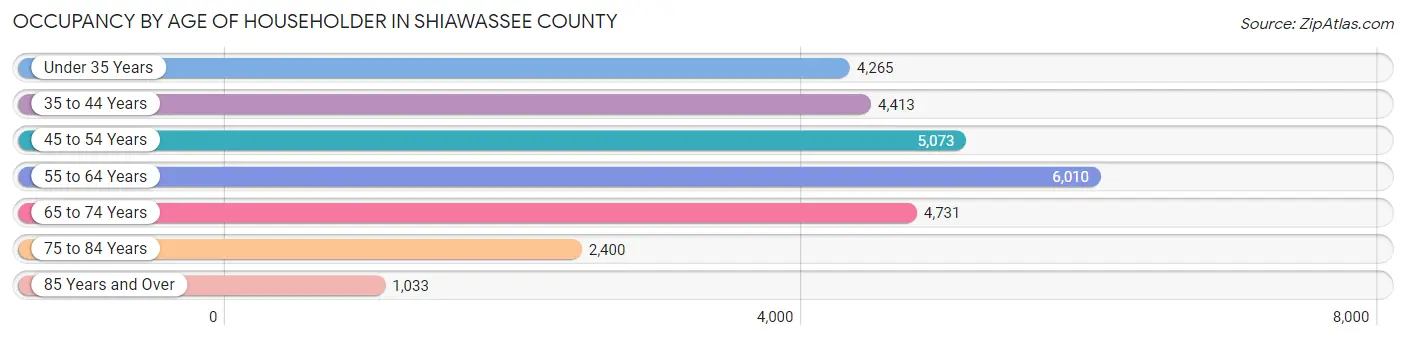
| Age Bracket | # Households | % Households |
| Under 35 Years | 4,265 | 15.3% |
| 35 to 44 Years | 4,413 | 15.8% |
| 45 to 54 Years | 5,073 | 18.2% |
| 55 to 64 Years | 6,010 | 21.5% |
| 65 to 74 Years | 4,731 | 16.9% |
| 75 to 84 Years | 2,400 | 8.6% |
| 85 Years and Over | 1,033 | 3.7% |
| Total | 27,925 | 100.0% |
Housing Finances in Shiawassee County
Median Income by Occupancy in Shiawassee County
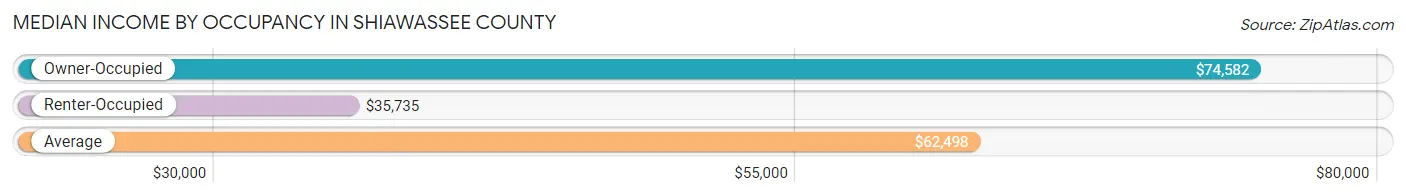
| Occupancy Type | # Households | Median Income |
| Owner-Occupied | 21,756 (77.9%) | $74,582 |
| Renter-Occupied | 6,169 (22.1%) | $35,735 |
| Average | 27,925 (100.0%) | $62,498 |
Occupancy by Householder Income Bracket in Shiawassee County
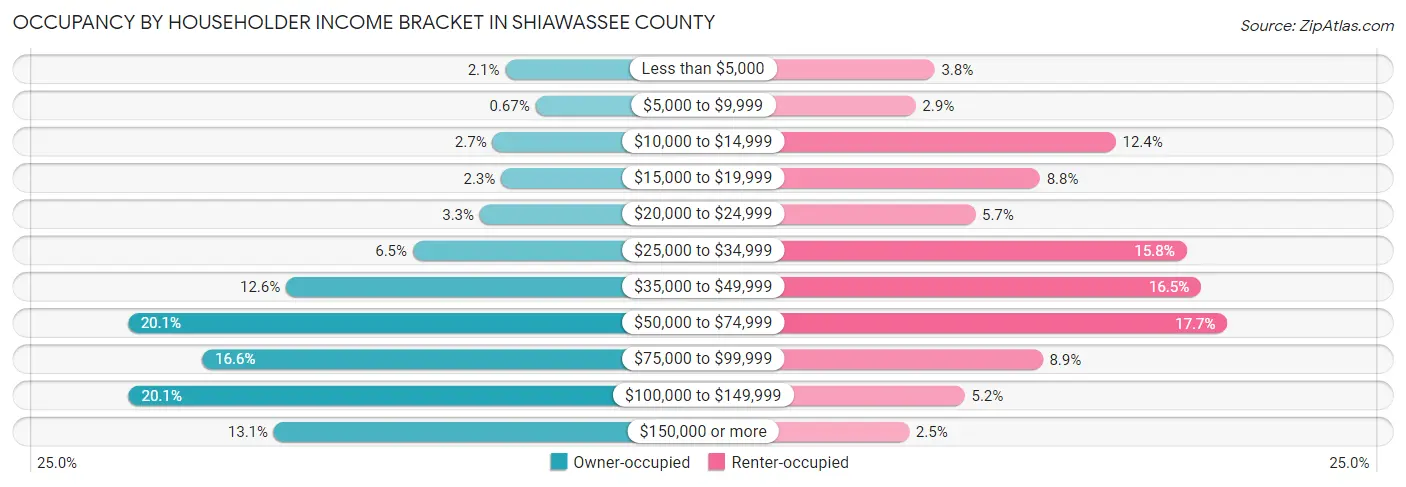
| Income Bracket | Owner-occupied | Renter-occupied |
| Less than $5,000 | 458 (2.1%) | 232 (3.8%) |
| $5,000 to $9,999 | 145 (0.7%) | 176 (2.9%) |
| $10,000 to $14,999 | 591 (2.7%) | 764 (12.4%) |
| $15,000 to $19,999 | 502 (2.3%) | 541 (8.8%) |
| $20,000 to $24,999 | 723 (3.3%) | 351 (5.7%) |
| $25,000 to $34,999 | 1,417 (6.5%) | 972 (15.8%) |
| $35,000 to $49,999 | 2,731 (12.6%) | 1,015 (16.5%) |
| $50,000 to $74,999 | 4,370 (20.1%) | 1,092 (17.7%) |
| $75,000 to $99,999 | 3,600 (16.6%) | 549 (8.9%) |
| $100,000 to $149,999 | 4,363 (20.1%) | 320 (5.2%) |
| $150,000 or more | 2,856 (13.1%) | 157 (2.5%) |
| Total | 21,756 (100.0%) | 6,169 (100.0%) |
Monthly Housing Cost Tiers in Shiawassee County
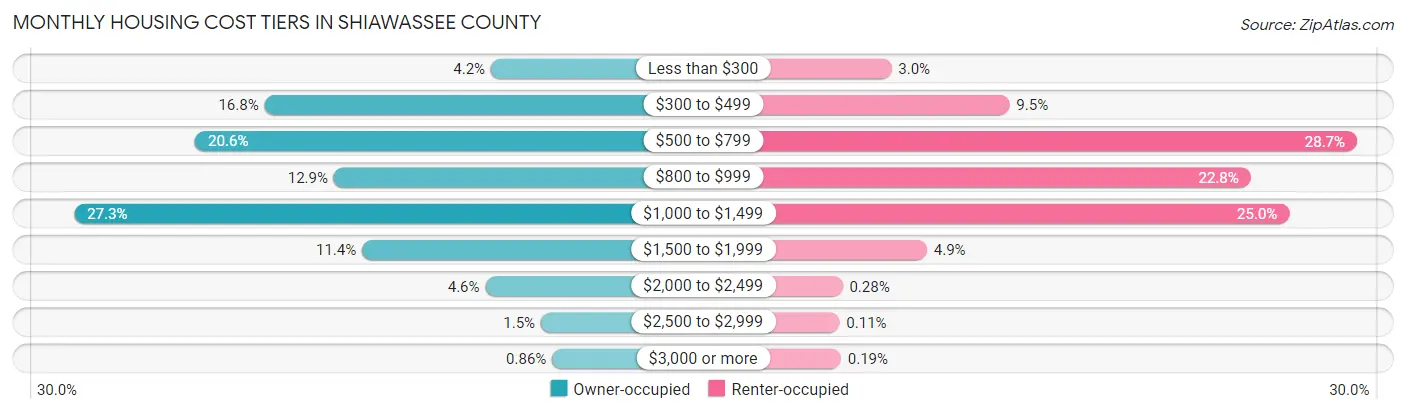
| Monthly Cost | Owner-occupied | Renter-occupied |
| Less than $300 | 922 (4.2%) | 184 (3.0%) |
| $300 to $499 | 3,645 (16.8%) | 586 (9.5%) |
| $500 to $799 | 4,477 (20.6%) | 1,770 (28.7%) |
| $800 to $999 | 2,810 (12.9%) | 1,408 (22.8%) |
| $1,000 to $1,499 | 5,931 (27.3%) | 1,539 (24.9%) |
| $1,500 to $1,999 | 2,472 (11.4%) | 305 (4.9%) |
| $2,000 to $2,499 | 989 (4.5%) | 17 (0.3%) |
| $2,500 to $2,999 | 322 (1.5%) | 7 (0.1%) |
| $3,000 or more | 188 (0.9%) | 12 (0.2%) |
| Total | 21,756 (100.0%) | 6,169 (100.0%) |
Physical Housing Characteristics in Shiawassee County
Housing Structures in Shiawassee County
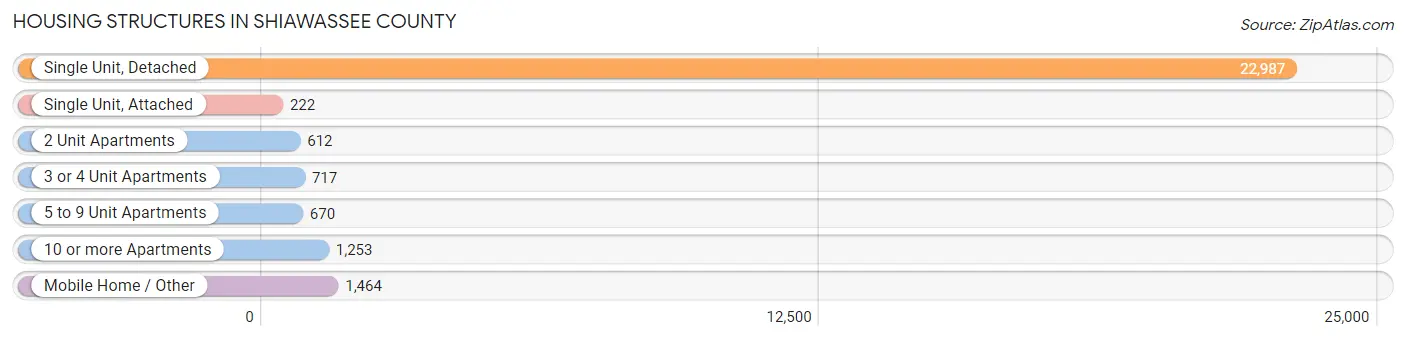
| Structure Type | # Housing Units | % Housing Units |
| Single Unit, Detached | 22,987 | 82.3% |
| Single Unit, Attached | 222 | 0.8% |
| 2 Unit Apartments | 612 | 2.2% |
| 3 or 4 Unit Apartments | 717 | 2.6% |
| 5 to 9 Unit Apartments | 670 | 2.4% |
| 10 or more Apartments | 1,253 | 4.5% |
| Mobile Home / Other | 1,464 | 5.2% |
| Total | 27,925 | 100.0% |
Housing Structures by Occupancy in Shiawassee County
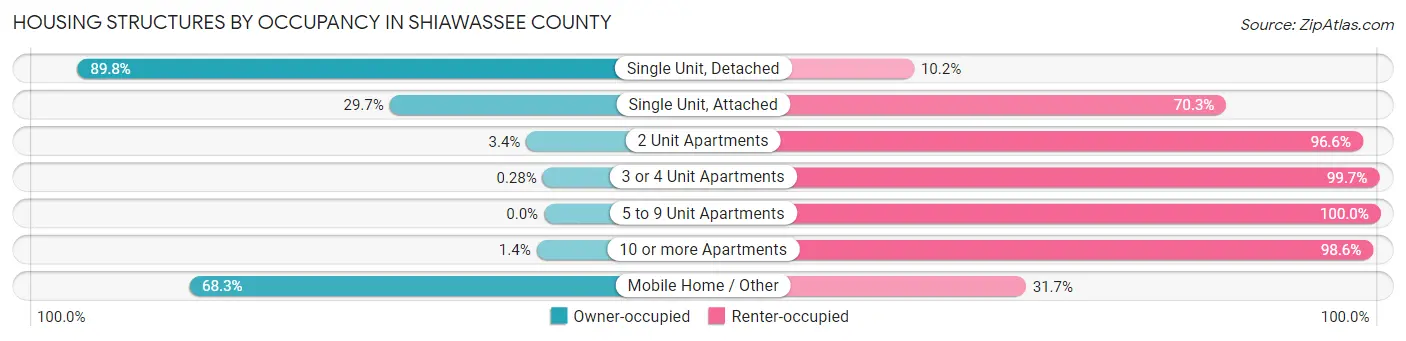
| Structure Type | Owner-occupied | Renter-occupied |
| Single Unit, Detached | 20,649 (89.8%) | 2,338 (10.2%) |
| Single Unit, Attached | 66 (29.7%) | 156 (70.3%) |
| 2 Unit Apartments | 21 (3.4%) | 591 (96.6%) |
| 3 or 4 Unit Apartments | 2 (0.3%) | 715 (99.7%) |
| 5 to 9 Unit Apartments | 0 (0.0%) | 670 (100.0%) |
| 10 or more Apartments | 18 (1.4%) | 1,235 (98.6%) |
| Mobile Home / Other | 1,000 (68.3%) | 464 (31.7%) |
| Total | 21,756 (77.9%) | 6,169 (22.1%) |
Housing Structures by Number of Rooms in Shiawassee County
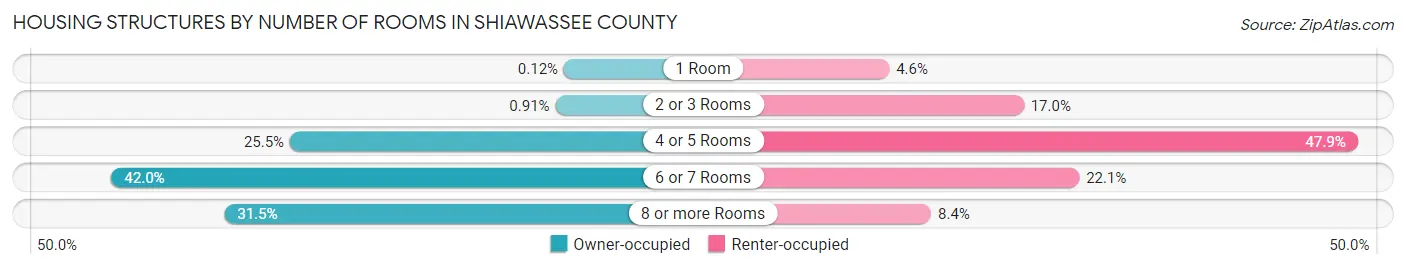
| Number of Rooms | Owner-occupied | Renter-occupied |
| 1 Room | 27 (0.1%) | 281 (4.6%) |
| 2 or 3 Rooms | 198 (0.9%) | 1,049 (17.0%) |
| 4 or 5 Rooms | 5,539 (25.5%) | 2,954 (47.9%) |
| 6 or 7 Rooms | 9,132 (42.0%) | 1,365 (22.1%) |
| 8 or more Rooms | 6,860 (31.5%) | 520 (8.4%) |
| Total | 21,756 (100.0%) | 6,169 (100.0%) |
Housing Structure by Heating Type in Shiawassee County
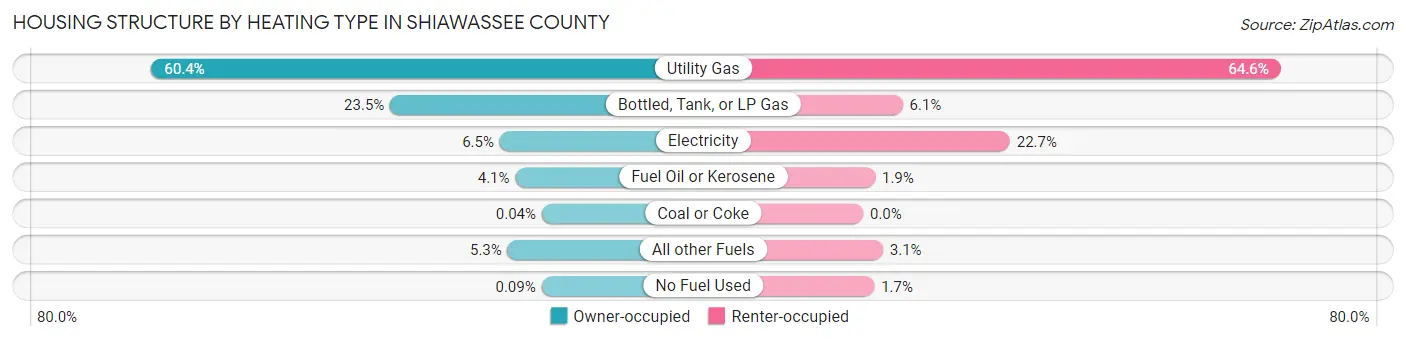
| Heating Type | Owner-occupied | Renter-occupied |
| Utility Gas | 13,138 (60.4%) | 3,982 (64.5%) |
| Bottled, Tank, or LP Gas | 5,111 (23.5%) | 377 (6.1%) |
| Electricity | 1,422 (6.5%) | 1,400 (22.7%) |
| Fuel Oil or Kerosene | 898 (4.1%) | 114 (1.8%) |
| Coal or Coke | 8 (0.0%) | 0 (0.0%) |
| All other Fuels | 1,159 (5.3%) | 189 (3.1%) |
| No Fuel Used | 20 (0.1%) | 107 (1.7%) |
| Total | 21,756 (100.0%) | 6,169 (100.0%) |
Household Vehicle Usage in Shiawassee County
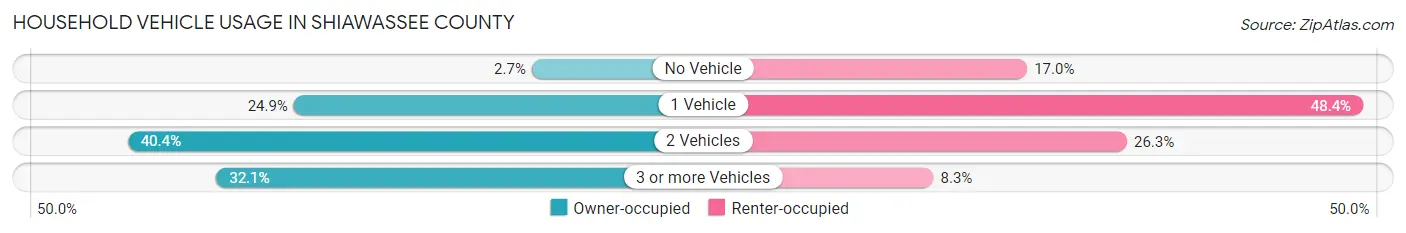
| Vehicles per Household | Owner-occupied | Renter-occupied |
| No Vehicle | 578 (2.7%) | 1,050 (17.0%) |
| 1 Vehicle | 5,412 (24.9%) | 2,983 (48.3%) |
| 2 Vehicles | 8,782 (40.4%) | 1,625 (26.3%) |
| 3 or more Vehicles | 6,984 (32.1%) | 511 (8.3%) |
| Total | 21,756 (100.0%) | 6,169 (100.0%) |
Real Estate & Mortgages in Shiawassee County
Real Estate and Mortgage Overview in Shiawassee County
| Characteristic | Without Mortgage | With Mortgage |
| Housing Units | 8,972 | 12,784 |
| Median Property Value | $149,200 | $153,800 |
| Median Household Income | $56,702 | $2,111 |
| Monthly Housing Costs | $503 | $186 |
| Real Estate Taxes | $2,103 | $448 |
Property Value by Mortgage Status in Shiawassee County
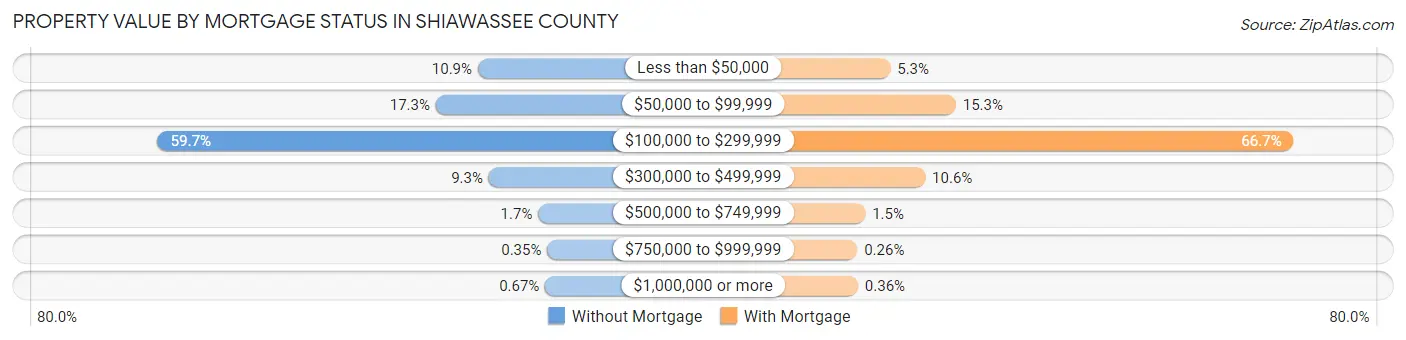
| Property Value | Without Mortgage | With Mortgage |
| Less than $50,000 | 981 (10.9%) | 676 (5.3%) |
| $50,000 to $99,999 | 1,556 (17.3%) | 1,954 (15.3%) |
| $100,000 to $299,999 | 5,358 (59.7%) | 8,531 (66.7%) |
| $300,000 to $499,999 | 831 (9.3%) | 1,356 (10.6%) |
| $500,000 to $749,999 | 155 (1.7%) | 188 (1.5%) |
| $750,000 to $999,999 | 31 (0.4%) | 33 (0.3%) |
| $1,000,000 or more | 60 (0.7%) | 46 (0.4%) |
| Total | 8,972 (100.0%) | 12,784 (100.0%) |
Household Income by Mortgage Status in Shiawassee County
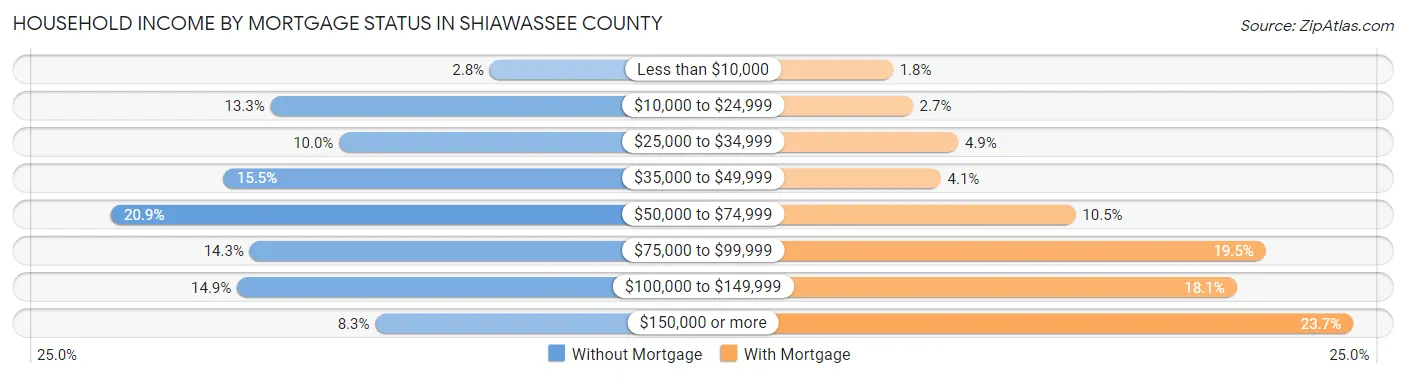
| Household Income | Without Mortgage | With Mortgage |
| Less than $10,000 | 255 (2.8%) | 226 (1.8%) |
| $10,000 to $24,999 | 1,192 (13.3%) | 348 (2.7%) |
| $25,000 to $34,999 | 899 (10.0%) | 624 (4.9%) |
| $35,000 to $49,999 | 1,392 (15.5%) | 518 (4.1%) |
| $50,000 to $74,999 | 1,873 (20.9%) | 1,339 (10.5%) |
| $75,000 to $99,999 | 1,281 (14.3%) | 2,497 (19.5%) |
| $100,000 to $149,999 | 1,335 (14.9%) | 2,319 (18.1%) |
| $150,000 or more | 745 (8.3%) | 3,028 (23.7%) |
| Total | 8,972 (100.0%) | 12,784 (100.0%) |
Property Value to Household Income Ratio in Shiawassee County
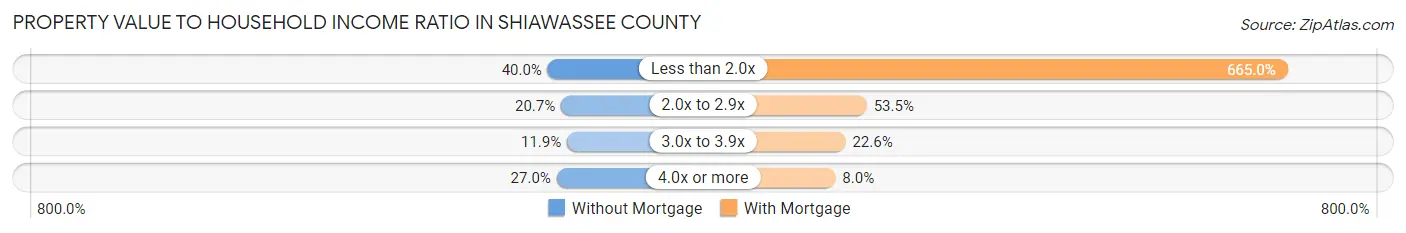
| Value-to-Income Ratio | Without Mortgage | With Mortgage |
| Less than 2.0x | 3,589 (40.0%) | 85,010 (665.0%) |
| 2.0x to 2.9x | 1,853 (20.6%) | 6,835 (53.5%) |
| 3.0x to 3.9x | 1,068 (11.9%) | 2,894 (22.6%) |
| 4.0x or more | 2,422 (27.0%) | 1,016 (8.0%) |
| Total | 8,972 (100.0%) | 12,784 (100.0%) |
Real Estate Taxes by Mortgage Status in Shiawassee County
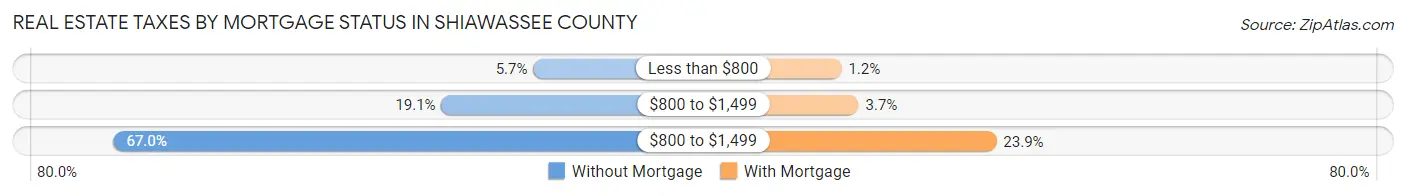
| Property Taxes | Without Mortgage | With Mortgage |
| Less than $800 | 509 (5.7%) | 157 (1.2%) |
| $800 to $1,499 | 1,713 (19.1%) | 477 (3.7%) |
| $800 to $1,499 | 6,011 (67.0%) | 3,051 (23.9%) |
| Total | 8,972 (100.0%) | 12,784 (100.0%) |
Health & Disability in Shiawassee County
Health Insurance Coverage by Age in Shiawassee County
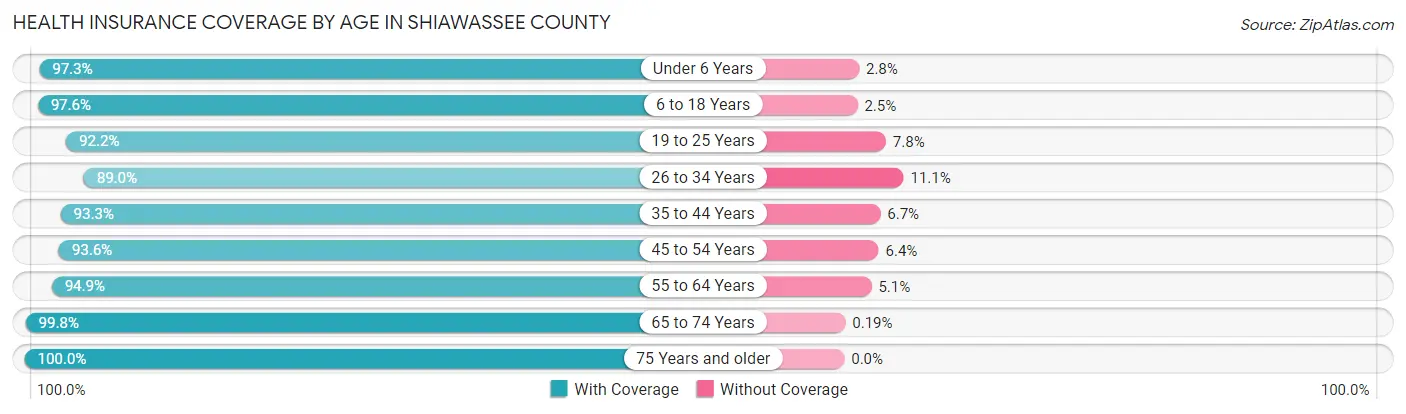
| Age Bracket | With Coverage | Without Coverage |
| Under 6 Years | 4,204 (97.3%) | 119 (2.8%) |
| 6 to 18 Years | 10,397 (97.6%) | 261 (2.5%) |
| 19 to 25 Years | 4,935 (92.2%) | 415 (7.8%) |
| 26 to 34 Years | 6,434 (88.9%) | 799 (11.1%) |
| 35 to 44 Years | 7,367 (93.3%) | 531 (6.7%) |
| 45 to 54 Years | 8,414 (93.6%) | 575 (6.4%) |
| 55 to 64 Years | 9,915 (94.9%) | 528 (5.1%) |
| 65 to 74 Years | 7,802 (99.8%) | 15 (0.2%) |
| 75 Years and older | 4,890 (100.0%) | 0 (0.0%) |
| Total | 64,358 (95.2%) | 3,243 (4.8%) |
Health Insurance Coverage by Citizenship Status in Shiawassee County
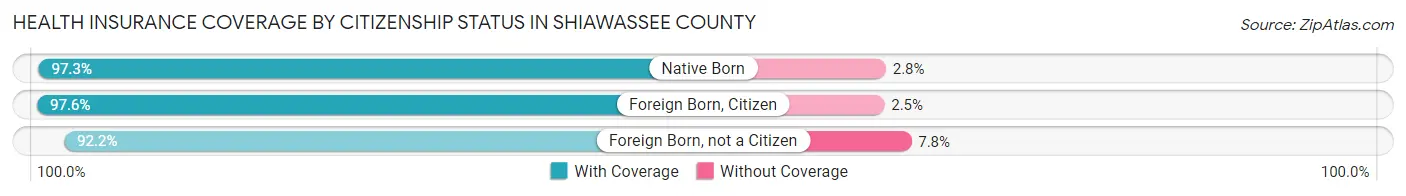
| Citizenship Status | With Coverage | Without Coverage |
| Native Born | 4,204 (97.3%) | 119 (2.8%) |
| Foreign Born, Citizen | 10,397 (97.6%) | 261 (2.5%) |
| Foreign Born, not a Citizen | 4,935 (92.2%) | 415 (7.8%) |
Health Insurance Coverage by Household Income in Shiawassee County
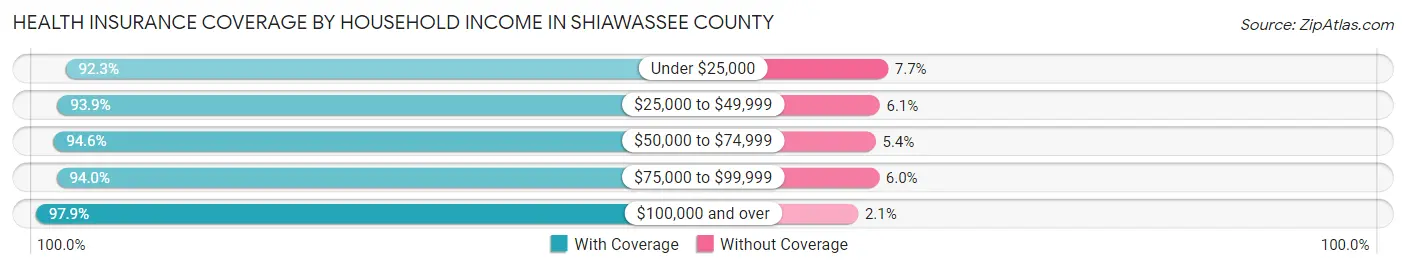
| Household Income | With Coverage | Without Coverage |
| Under $25,000 | 6,564 (92.3%) | 547 (7.7%) |
| $25,000 to $49,999 | 11,466 (93.9%) | 750 (6.1%) |
| $50,000 to $74,999 | 12,753 (94.6%) | 725 (5.4%) |
| $75,000 to $99,999 | 10,499 (94.0%) | 670 (6.0%) |
| $100,000 and over | 22,908 (97.9%) | 492 (2.1%) |
Public vs Private Health Insurance Coverage by Age in Shiawassee County
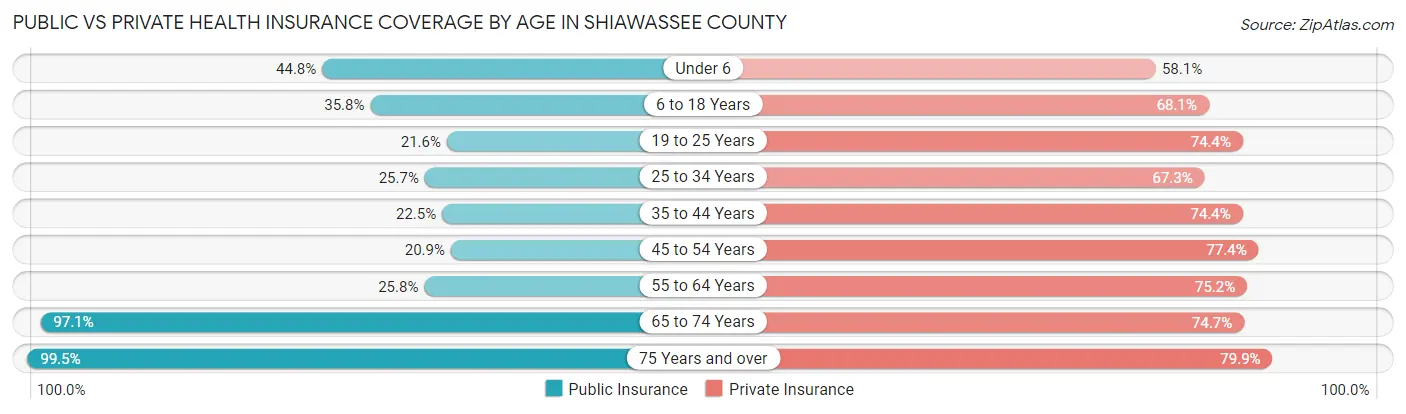
| Age Bracket | Public Insurance | Private Insurance |
| Under 6 | 1,936 (44.8%) | 2,513 (58.1%) |
| 6 to 18 Years | 3,819 (35.8%) | 7,258 (68.1%) |
| 19 to 25 Years | 1,157 (21.6%) | 3,982 (74.4%) |
| 25 to 34 Years | 1,861 (25.7%) | 4,869 (67.3%) |
| 35 to 44 Years | 1,779 (22.5%) | 5,875 (74.4%) |
| 45 to 54 Years | 1,878 (20.9%) | 6,954 (77.4%) |
| 55 to 64 Years | 2,696 (25.8%) | 7,855 (75.2%) |
| 65 to 74 Years | 7,588 (97.1%) | 5,837 (74.7%) |
| 75 Years and over | 4,865 (99.5%) | 3,908 (79.9%) |
| Total | 27,579 (40.8%) | 49,051 (72.6%) |
Disability Status by Sex by Age in Shiawassee County
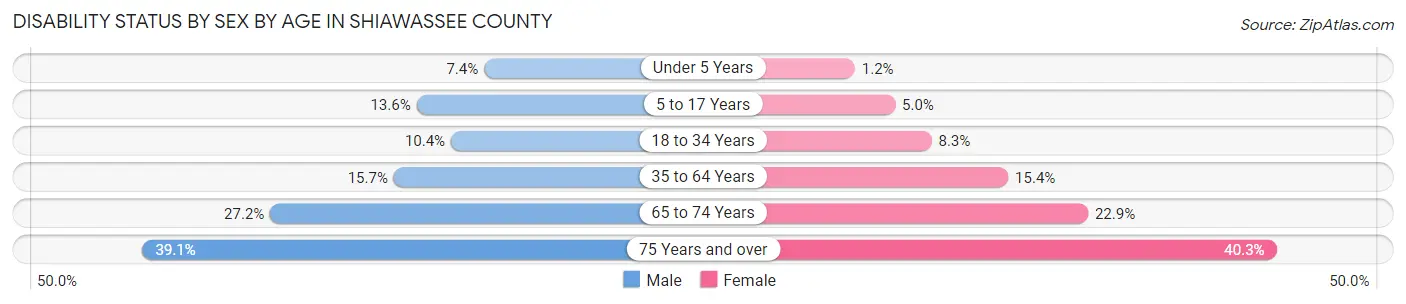
| Age Bracket | Male | Female |
| Under 5 Years | 133 (7.4%) | 21 (1.2%) |
| 5 to 17 Years | 750 (13.6%) | 255 (5.0%) |
| 18 to 34 Years | 724 (10.4%) | 535 (8.3%) |
| 35 to 64 Years | 2,142 (15.7%) | 2,119 (15.4%) |
| 65 to 74 Years | 1,024 (27.2%) | 926 (22.9%) |
| 75 Years and over | 807 (39.1%) | 1,139 (40.3%) |
Disability Class by Sex by Age in Shiawassee County
Disability Class: Hearing Difficulty
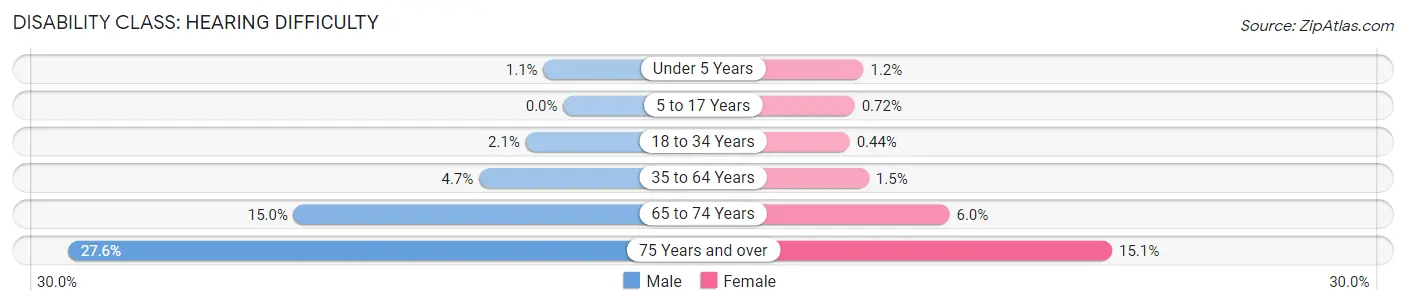
| Age Bracket | Male | Female |
| Under 5 Years | 20 (1.1%) | 21 (1.2%) |
| 5 to 17 Years | 0 (0.0%) | 37 (0.7%) |
| 18 to 34 Years | 146 (2.1%) | 28 (0.4%) |
| 35 to 64 Years | 638 (4.7%) | 207 (1.5%) |
| 65 to 74 Years | 565 (15.0%) | 243 (6.0%) |
| 75 Years and over | 570 (27.6%) | 425 (15.0%) |
Disability Class: Vision Difficulty
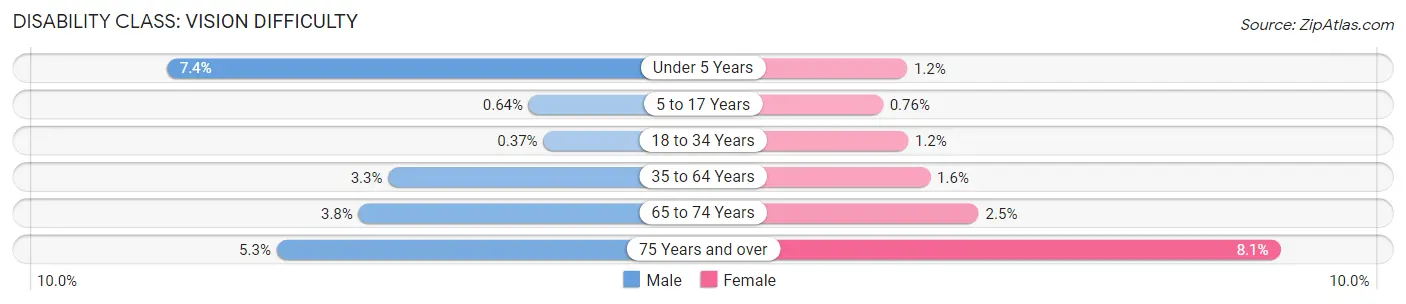
| Age Bracket | Male | Female |
| Under 5 Years | 133 (7.4%) | 21 (1.2%) |
| 5 to 17 Years | 35 (0.6%) | 39 (0.8%) |
| 18 to 34 Years | 26 (0.4%) | 79 (1.2%) |
| 35 to 64 Years | 442 (3.3%) | 225 (1.6%) |
| 65 to 74 Years | 143 (3.8%) | 103 (2.5%) |
| 75 Years and over | 110 (5.3%) | 230 (8.1%) |
Disability Class: Cognitive Difficulty
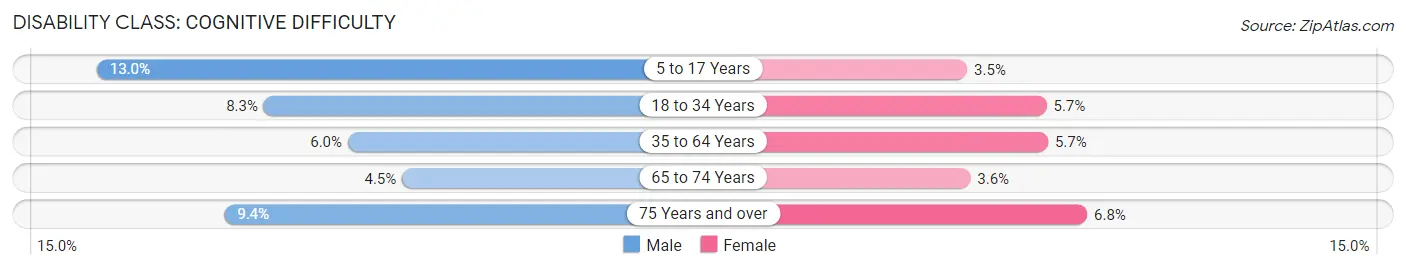
| Age Bracket | Male | Female |
| 5 to 17 Years | 715 (13.0%) | 180 (3.5%) |
| 18 to 34 Years | 579 (8.3%) | 366 (5.7%) |
| 35 to 64 Years | 817 (6.0%) | 788 (5.7%) |
| 65 to 74 Years | 169 (4.5%) | 145 (3.6%) |
| 75 Years and over | 195 (9.4%) | 193 (6.8%) |
Disability Class: Ambulatory Difficulty
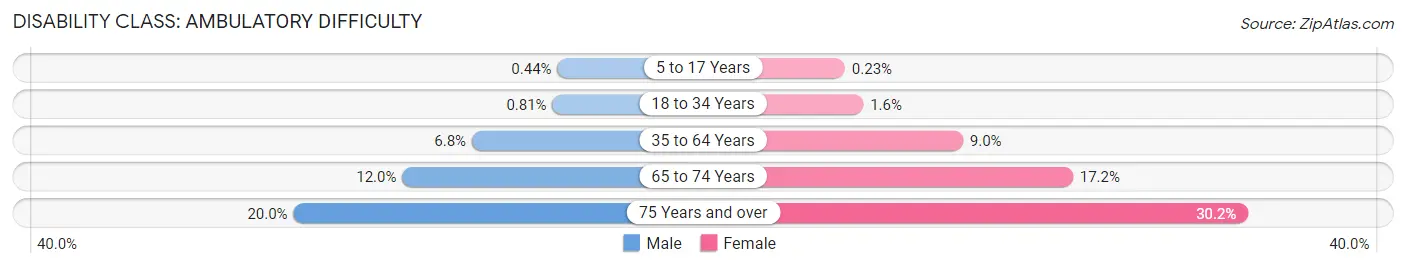
| Age Bracket | Male | Female |
| 5 to 17 Years | 24 (0.4%) | 12 (0.2%) |
| 18 to 34 Years | 56 (0.8%) | 102 (1.6%) |
| 35 to 64 Years | 924 (6.8%) | 1,234 (9.0%) |
| 65 to 74 Years | 450 (12.0%) | 695 (17.2%) |
| 75 Years and over | 414 (20.0%) | 852 (30.2%) |
Disability Class: Self-Care Difficulty
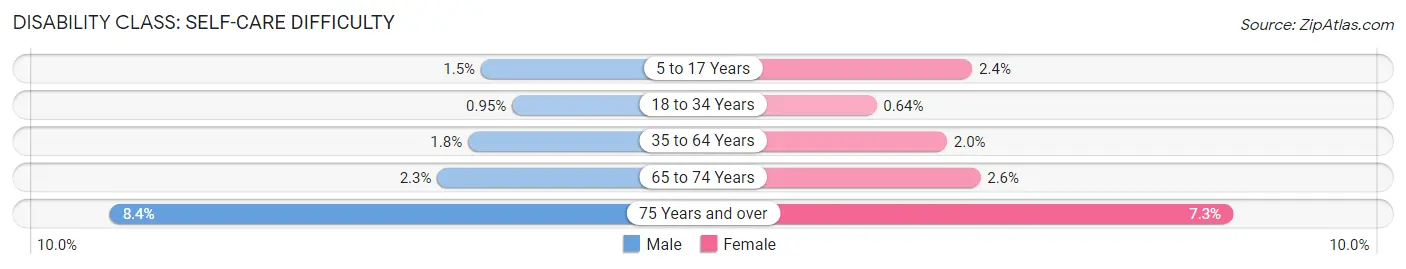
| Age Bracket | Male | Female |
| 5 to 17 Years | 84 (1.5%) | 125 (2.4%) |
| 18 to 34 Years | 66 (0.9%) | 41 (0.6%) |
| 35 to 64 Years | 241 (1.8%) | 267 (1.9%) |
| 65 to 74 Years | 88 (2.3%) | 104 (2.6%) |
| 75 Years and over | 174 (8.4%) | 205 (7.3%) |
Technology Access in Shiawassee County
Computing Device Access in Shiawassee County
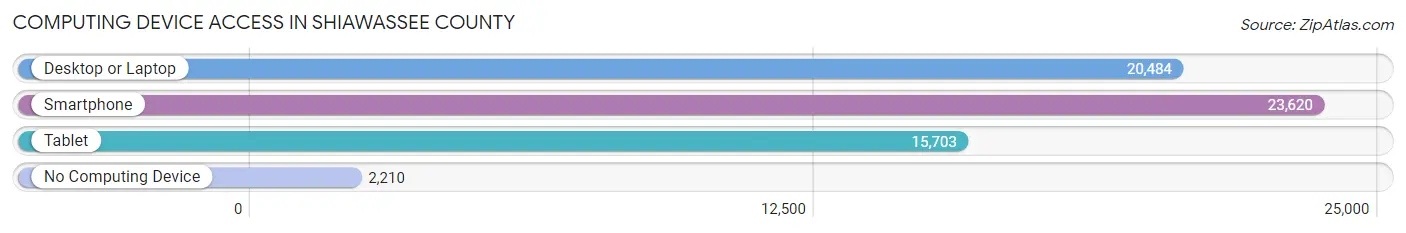
| Device Type | # Households | % Households |
| Desktop or Laptop | 20,484 | 73.4% |
| Smartphone | 23,620 | 84.6% |
| Tablet | 15,703 | 56.2% |
| No Computing Device | 2,210 | 7.9% |
| Total | 27,925 | 100.0% |
Internet Access in Shiawassee County
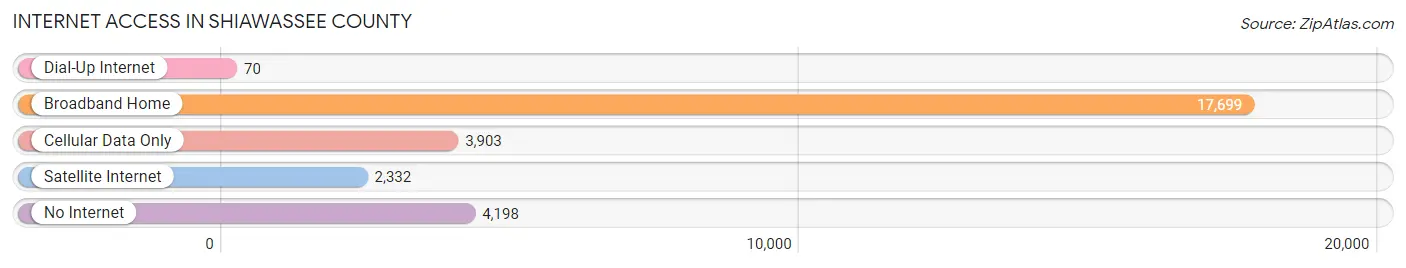
| Internet Type | # Households | % Households |
| Dial-Up Internet | 70 | 0.3% |
| Broadband Home | 17,699 | 63.4% |
| Cellular Data Only | 3,903 | 14.0% |
| Satellite Internet | 2,332 | 8.4% |
| No Internet | 4,198 | 15.0% |
| Total | 27,925 | 100.0% |
Shiawassee County Summary
Shiawassee County is located in the central region of Michigan’s Lower Peninsula. It is bordered by Saginaw County to the north, Genesee County to the east, Oakland County to the south, and Clinton County to the west. The county seat is Corunna, and the largest city is Owosso. The county was established in 1822 and named after the Shiawassee River, which runs through the county.
Geography
Shiawassee County covers an area of 576 square miles, making it the 33rd largest county in Michigan. The terrain is mostly flat, with some rolling hills in the northern and western parts of the county. The Shiawassee River runs through the county, and there are several small lakes and ponds scattered throughout. The highest point in the county is located in the northwest corner, at an elevation of 1,068 feet. The county is mostly rural, with some small towns and villages scattered throughout.
Climate
Shiawassee County has a humid continental climate, with cold winters and warm summers. The average annual temperature is around 45°F, and the average annual precipitation is around 33 inches.
Demographics
As of the 2010 census, there were 70,648 people living in Shiawassee County. The population density was 122 people per square mile. The racial makeup of the county was 94.3% White, 2.2% African American, 0.7% Native American, 0.6% Asian, 0.1% Pacific Islander, 0.7% from other races, and 1.4% from two or more races. Hispanic or Latino of any race were 2.3% of the population.
The median income for a household in the county was $45,845, and the median income for a family was $54,845. The per capita income for the county was $21,845. About 8.3% of families and 11.2% of the population were below the poverty line, including 15.2% of those under age 18 and 8.2% of those age 65 or over.
Economy
Shiawassee County’s economy is largely based on agriculture and manufacturing. The county is home to several large farms, and the main crops grown are corn, soybeans, and wheat. The county is also home to several manufacturing companies, including automotive parts suppliers, food processing plants, and metalworking companies. The county is also home to several small businesses, including restaurants, retail stores, and service providers.
The unemployment rate in Shiawassee County was 5.2% in 2019, slightly lower than the national average of 3.7%. The median household income in the county was $45,845 in 2019, slightly lower than the national median of $61,937.
Conclusion
Shiawassee County is located in the central region of Michigan’s Lower Peninsula. It is bordered by Saginaw County to the north, Genesee County to the east, Oakland County to the south, and Clinton County to the west. The county has a humid continental climate, with cold winters and warm summers. As of the 2010 census, there were 70,648 people living in Shiawassee County. The economy is largely based on agriculture and manufacturing, and the unemployment rate was 5.2% in 2019.
Common Questions
What is the Total Population of Shiawassee County?
Total Population of Shiawassee County is 68,124.
What is the Total Male Population of Shiawassee County?
Total Male Population of Shiawassee County is 33,970.
What is the Total Female Population of Shiawassee County?
Total Female Population of Shiawassee County is 34,154.
What is the Ratio of Males per 100 Females in Shiawassee County?
There are 99.46 Males per 100 Females in Shiawassee County.
What is the Ratio of Females per 100 Males in Shiawassee County?
There are 100.54 Females per 100 Males in Shiawassee County.
What is the Median Population Age in Shiawassee County?
Median Population Age in Shiawassee County is 43.2 Years.
What is the Average Family Size in Shiawassee County
Average Family Size in Shiawassee County is 3.0 People.
What is the Average Household Size in Shiawassee County
Average Household Size in Shiawassee County is 2.4 People.
What is Per Capita Income in Shiawassee County?
Per Capita income in Shiawassee County is $33,328.
What is the Median Family Income in Shiawassee County?
Median Family Income in Shiawassee County is $78,144.
What is the Median Household income in Shiawassee County?
Median Household Income in Shiawassee County is $62,498.
What is Income or Wage Gap in Shiawassee County?
Income or Wage Gap in Shiawassee County is 31.1%.
Women in Shiawassee County earn 68.9 cents for every dollar earned by a man.
What is Family Income Deficit in Shiawassee County?
Family Income Deficit in Shiawassee County is $10,777.
Families that are below poverty line in Shiawassee County earn $10,777 less on average than the poverty threshold level.
What is Inequality or Gini Index in Shiawassee County?
Inequality or Gini Index in Shiawassee County is 0.41.
How Large is the Labor Force in Shiawassee County?
There are 33,384 People in the Labor Forcein in Shiawassee County.
What is the Percentage of People in the Labor Force in Shiawassee County?
59.6% of People are in the Labor Force in Shiawassee County.
What is the Unemployment Rate in Shiawassee County?
Unemployment Rate in Shiawassee County is 4.1%.