Schoolcraft County, MI
Schoolcraft County Map
Schoolcraft County Overview
8,062
TOTAL POPULATION
4,044
MALE POPULATION
4,018
FEMALE POPULATION
100.65
MALES / 100 FEMALES
99.36
FEMALES / 100 MALES
51.8
MEDIAN AGE
2.6
AVG FAMILY SIZE
2.1
AVG HOUSEHOLD SIZE
$33,805
PER CAPITA INCOME
$71,250
AVG FAMILY INCOME
$55,071
AVG HOUSEHOLD INCOME
44.4%
WAGE / INCOME GAP [ % ]
55.6¢/ $1
WAGE / INCOME GAP [ $ ]
$9,903
FAMILY INCOME DEFICIT
0.46
INEQUALITY / GINI INDEX
3,462
LABOR FORCE [ PEOPLE ]
50.7%
PERCENT IN LABOR FORCE
7.9%
UNEMPLOYMENT RATE
Schoolcraft County Area Codes
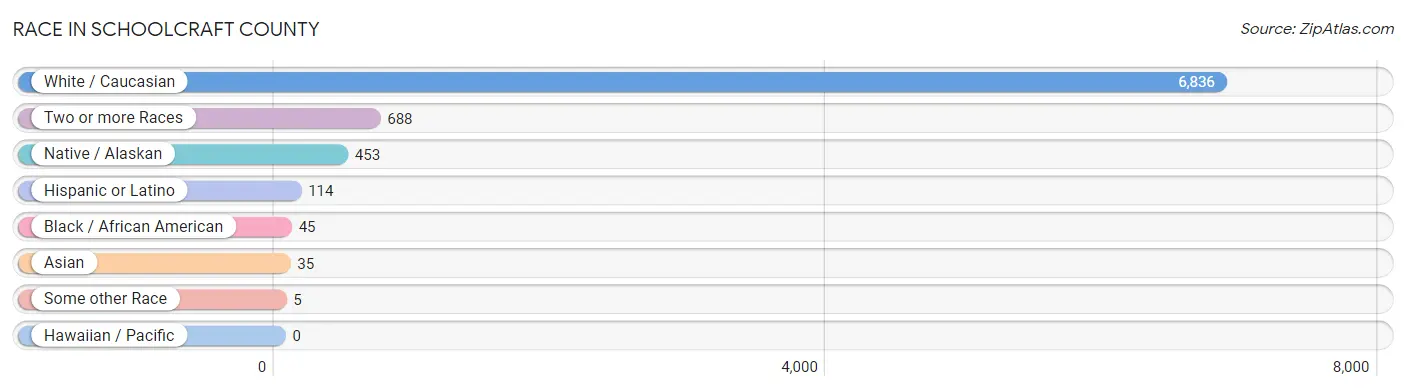
Race in Schoolcraft County
The most populous races in Schoolcraft County are White / Caucasian (6,836 | 84.8%), Two or more Races (688 | 8.5%), and Native / Alaskan (453 | 5.6%).
| Race | # Population | % Population |
| Asian | 35 | 0.4% |
| Black / African American | 45 | 0.6% |
| Hawaiian / Pacific | 0 | 0.0% |
| Hispanic or Latino | 114 | 1.4% |
| Native / Alaskan | 453 | 5.6% |
| White / Caucasian | 6,836 | 84.8% |
| Two or more Races | 688 | 8.5% |
| Some other Race | 5 | 0.1% |
| Total | 8,062 | 100.0% |
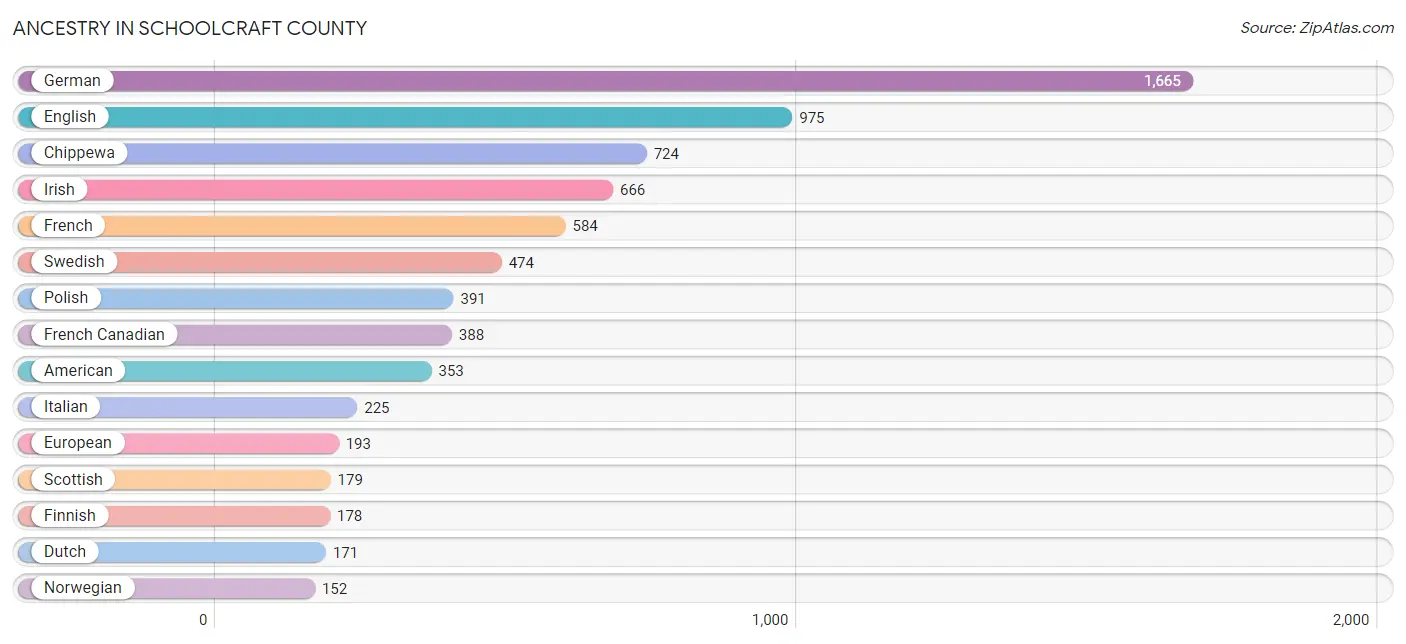
Ancestry in Schoolcraft County
The most populous ancestries reported in Schoolcraft County are German (1,665 | 20.6%), English (975 | 12.1%), Chippewa (724 | 9.0%), Irish (666 | 8.3%), and French (584 | 7.2%), together accounting for 57.2% of all Schoolcraft County residents.
| Ancestry | # Population | % Population |
| American | 353 | 4.4% |
| Arab | 4 | 0.1% |
| Austrian | 9 | 0.1% |
| Belgian | 72 | 0.9% |
| Bhutanese | 2 | 0.0% |
| British | 21 | 0.3% |
| Canadian | 25 | 0.3% |
| Celtic | 3 | 0.0% |
| Central American | 6 | 0.1% |
| Cherokee | 2 | 0.0% |
| Chippewa | 724 | 9.0% |
| Cree | 5 | 0.1% |
| Croatian | 28 | 0.4% |
| Czech | 55 | 0.7% |
| Czechoslovakian | 16 | 0.2% |
| Danish | 37 | 0.5% |
| Dutch | 171 | 2.1% |
| Eastern European | 4 | 0.1% |
| English | 975 | 12.1% |
| European | 193 | 2.4% |
| Finnish | 178 | 2.2% |
| French | 584 | 7.2% |
| French American Indian | 13 | 0.2% |
| French Canadian | 388 | 4.8% |
| German | 1,665 | 20.6% |
| Greek | 22 | 0.3% |
| Guatemalan | 1 | 0.0% |
| Hungarian | 28 | 0.4% |
| Indian (Asian) | 4 | 0.1% |
| Iranian | 3 | 0.0% |
| Irish | 666 | 8.3% |
| Iroquois | 41 | 0.5% |
| Italian | 225 | 2.8% |
| Korean | 10 | 0.1% |
| Latvian | 5 | 0.1% |
| Lebanese | 4 | 0.1% |
| Lithuanian | 20 | 0.3% |
| Lumbee | 1 | 0.0% |
| Mexican | 71 | 0.9% |
| Northern European | 10 | 0.1% |
| Norwegian | 152 | 1.9% |
| Ottawa | 23 | 0.3% |
| Pennsylvania German | 18 | 0.2% |
| Polish | 391 | 4.9% |
| Portuguese | 14 | 0.2% |
| Potawatomi | 15 | 0.2% |
| Puerto Rican | 23 | 0.3% |
| Romanian | 16 | 0.2% |
| Russian | 13 | 0.2% |
| Salvadoran | 5 | 0.1% |
| Scandinavian | 42 | 0.5% |
| Scotch-Irish | 51 | 0.6% |
| Scottish | 179 | 2.2% |
| Serbian | 3 | 0.0% |
| Sioux | 3 | 0.0% |
| Slavic | 10 | 0.1% |
| Slovak | 30 | 0.4% |
| Slovene | 3 | 0.0% |
| Spaniard | 3 | 0.0% |
| Spanish | 9 | 0.1% |
| Sri Lankan | 6 | 0.1% |
| Swedish | 474 | 5.9% |
| Swiss | 9 | 0.1% |
| Thai | 23 | 0.3% |
| Ukrainian | 3 | 0.0% |
| Welsh | 31 | 0.4% |
| Yugoslavian | 32 | 0.4% | View All 67 Rows |
Immigrants in Schoolcraft County
The most numerous immigrant groups reported in Schoolcraft County came from Asia (38 | 0.5%), Bangladesh (21 | 0.3%), South Central Asia (21 | 0.3%), Canada (15 | 0.2%), and Europe (14 | 0.2%), together accounting for 1.3% of all Schoolcraft County residents.

| Immigration Origin | # Population | % Population |
| Asia | 38 | 0.5% |
| Bangladesh | 21 | 0.3% |
| Canada | 15 | 0.2% |
| Central America | 7 | 0.1% |
| Eastern Asia | 10 | 0.1% |
| Eastern Europe | 4 | 0.1% |
| Europe | 14 | 0.2% |
| Germany | 8 | 0.1% |
| Hungary | 2 | 0.0% |
| Korea | 10 | 0.1% |
| Latin America | 7 | 0.1% |
| Mexico | 7 | 0.1% |
| Netherlands | 1 | 0.0% |
| Northern Europe | 1 | 0.0% |
| Philippines | 5 | 0.1% |
| Romania | 2 | 0.0% |
| South Central Asia | 21 | 0.3% |
| South Eastern Asia | 7 | 0.1% |
| Vietnam | 2 | 0.0% |
| Western Europe | 9 | 0.1% | View All 20 Rows |
Sex and Age in Schoolcraft County
Sex and Age in Schoolcraft County
The most populous age groups in Schoolcraft County are 65 to 69 Years (486 | 12.0%) for men and 60 to 64 Years (446 | 11.1%) for women.

| Age Bracket | Male | Female |
| Under 5 Years | 151 (3.7%) | 195 (4.9%) |
| 5 to 9 Years | 200 (5.0%) | 142 (3.5%) |
| 10 to 14 Years | 211 (5.2%) | 252 (6.3%) |
| 15 to 19 Years | 171 (4.2%) | 153 (3.8%) |
| 20 to 24 Years | 230 (5.7%) | 164 (4.1%) |
| 25 to 29 Years | 188 (4.6%) | 188 (4.7%) |
| 30 to 34 Years | 146 (3.6%) | 141 (3.5%) |
| 35 to 39 Years | 271 (6.7%) | 157 (3.9%) |
| 40 to 44 Years | 164 (4.1%) | 207 (5.1%) |
| 45 to 49 Years | 207 (5.1%) | 224 (5.6%) |
| 50 to 54 Years | 260 (6.4%) | 287 (7.1%) |
| 55 to 59 Years | 375 (9.3%) | 355 (8.8%) |
| 60 to 64 Years | 363 (9.0%) | 446 (11.1%) |
| 65 to 69 Years | 486 (12.0%) | 315 (7.8%) |
| 70 to 74 Years | 230 (5.7%) | 329 (8.2%) |
| 75 to 79 Years | 221 (5.5%) | 228 (5.7%) |
| 80 to 84 Years | 83 (2.1%) | 83 (2.1%) |
| 85 Years and over | 87 (2.1%) | 152 (3.8%) |
| Total | 4,044 (100.0%) | 4,018 (100.0%) |
Families and Households in Schoolcraft County
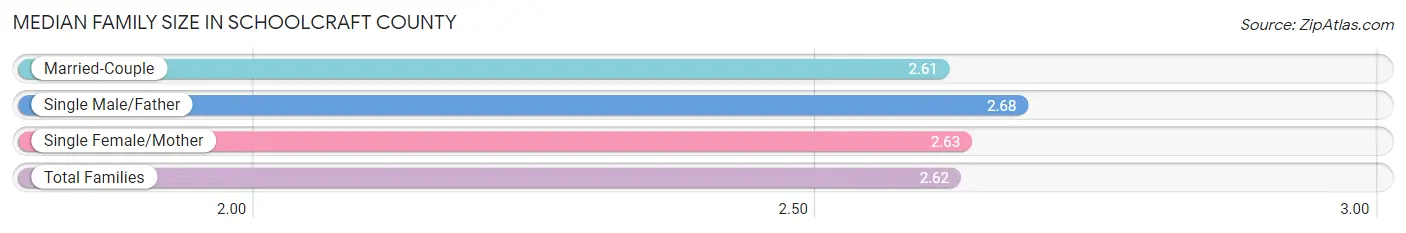
Median Family Size in Schoolcraft County
The median family size in Schoolcraft County is 2.62 persons per family, with single male/father families (223 | 9.9%) accounting for the largest median family size of 2.68 persons per family. On the other hand, married-couple families (1,813 | 80.8%) represent the smallest median family size with 2.61 persons per family.
| Family Type | # Families | Family Size |
| Married-Couple | 1,813 (80.8%) | 2.61 |
| Single Male/Father | 223 (9.9%) | 2.68 |
| Single Female/Mother | 208 (9.3%) | 2.63 |
| Total Families | 2,244 (100.0%) | 2.62 |
Median Household Size in Schoolcraft County
The median household size in Schoolcraft County is 2.09 persons per household, with single male/father households (223 | 5.9%) accounting for the largest median household size of 3.13 persons per household. non-family households (1,541 | 40.7%) represent the smallest median household size with 1.21 persons per household.
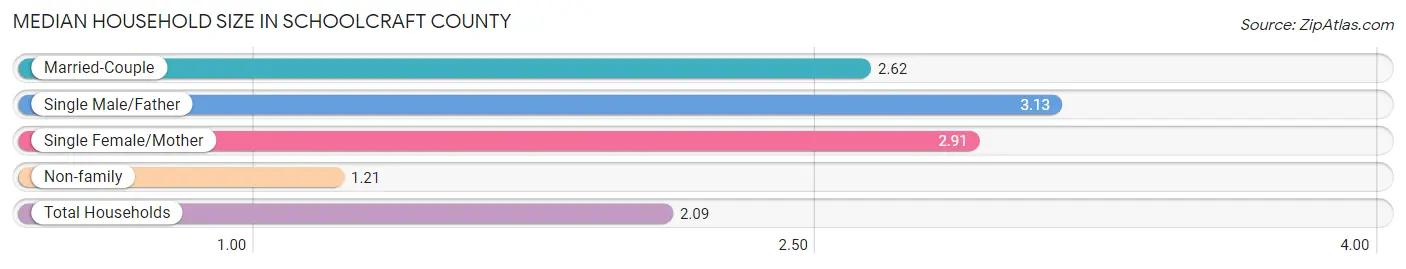
| Household Type | # Households | Household Size |
| Married-Couple | 1,813 (47.9%) | 2.62 |
| Single Male/Father | 223 (5.9%) | 3.13 |
| Single Female/Mother | 208 (5.5%) | 2.91 |
| Non-family | 1,541 (40.7%) | 1.21 |
| Total Households | 3,785 (100.0%) | 2.09 |
Household Size by Marriage Status in Schoolcraft County
Out of a total of 3,785 households in Schoolcraft County, 2,244 (59.3%) are family households, while 1,541 (40.7%) are nonfamily households. The most numerous type of family households are 2-person households, comprising 1,382, and the most common type of nonfamily households are 1-person households, comprising 1,245.
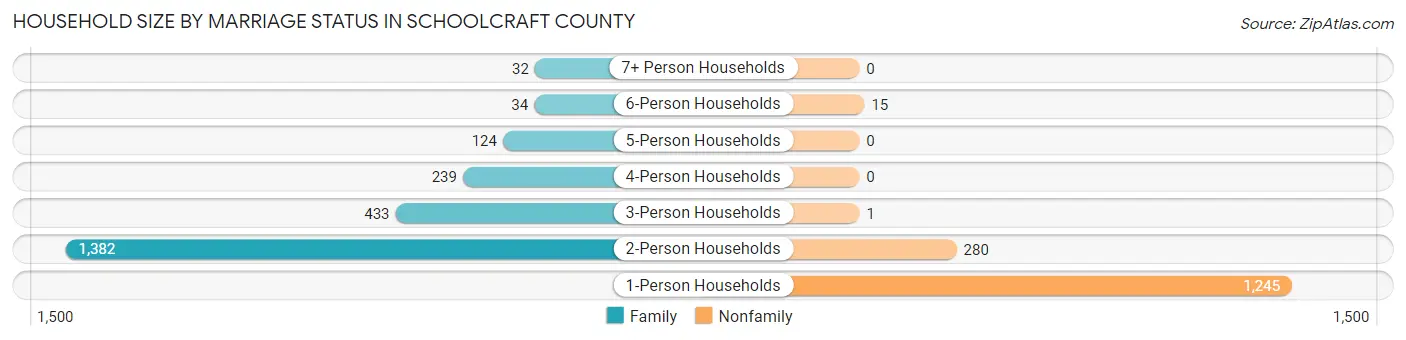
| Household Size | Family Households | Nonfamily Households |
| 1-Person Households | - | 1,245 (32.9%) |
| 2-Person Households | 1,382 (36.5%) | 280 (7.4%) |
| 3-Person Households | 433 (11.4%) | 1 (0.0%) |
| 4-Person Households | 239 (6.3%) | 0 (0.0%) |
| 5-Person Households | 124 (3.3%) | 0 (0.0%) |
| 6-Person Households | 34 (0.9%) | 15 (0.4%) |
| 7+ Person Households | 32 (0.9%) | 0 (0.0%) |
| Total | 2,244 (59.3%) | 1,541 (40.7%) |
Female Fertility in Schoolcraft County
Fertility by Age in Schoolcraft County
Average fertility rate in Schoolcraft County is 62.0 births per 1,000 women. Women in the age bracket of 20 to 34 years have the highest fertility rate with 124.0 births per 1,000 women. Women in the age bracket of 20 to 34 years acount for 75.3% of all women with births.

| Age Bracket | Women with Births | Births / 1,000 Women |
| 15 to 19 years | 16 (19.8%) | 105.0 |
| 20 to 34 years | 61 (75.3%) | 124.0 |
| 35 to 50 years | 4 (4.9%) | 6.0 |
| Total | 81 (100.0%) | 62.0 |
Fertility by Age by Marriage Status in Schoolcraft County
24.7% of women with births (81) in Schoolcraft County are married. The highest percentage of unmarried women with births falls into 15 to 19 years age bracket with 100.0% of them unmarried at the time of birth, while the lowest percentage of unmarried women with births belong to 35 to 50 years age bracket with 0.0% of them unmarried.
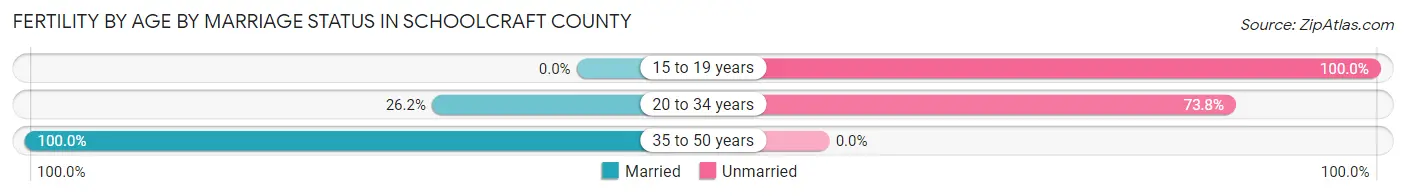
| Age Bracket | Married | Unmarried |
| 15 to 19 years | 0 (0.0%) | 16 (100.0%) |
| 20 to 34 years | 16 (26.2%) | 45 (73.8%) |
| 35 to 50 years | 4 (100.0%) | 0 (0.0%) |
| Total | 20 (24.7%) | 61 (75.3%) |
Fertility by Education in Schoolcraft County
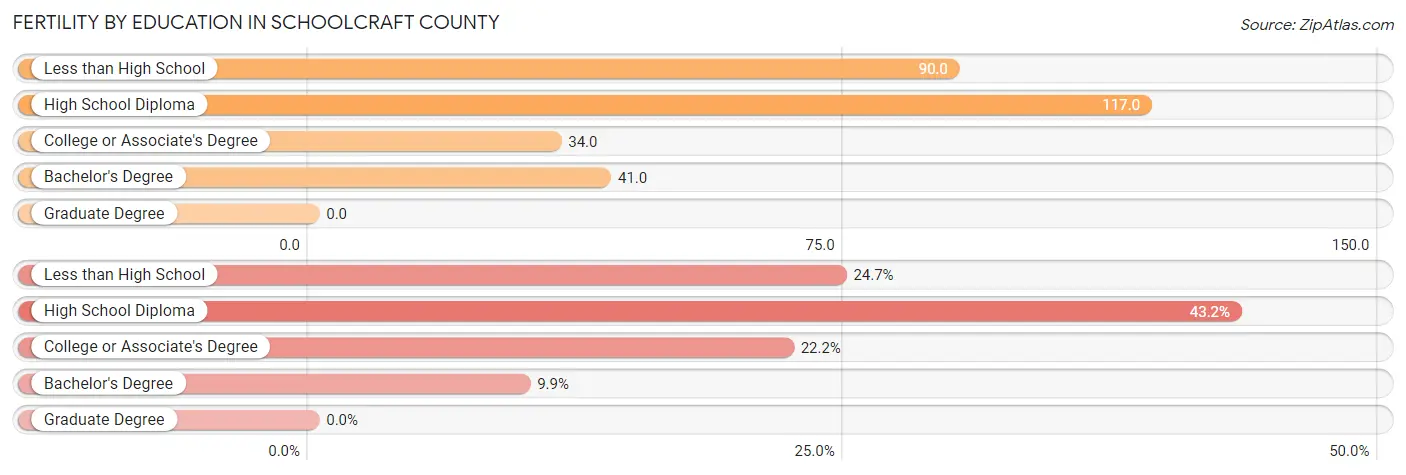
| Educational Attainment | Women with Births | Births / 1,000 Women |
| Less than High School | 20 (24.7%) | 90.0 |
| High School Diploma | 35 (43.2%) | 117.0 |
| College or Associate's Degree | 18 (22.2%) | 34.0 |
| Bachelor's Degree | 8 (9.9%) | 41.0 |
| Graduate Degree | 0 (0.0%) | 0.0 |
| Total | 81 (100.0%) | 62.0 |
Fertility by Education by Marriage Status in Schoolcraft County
75.3% of women with births in Schoolcraft County are unmarried. Women with the educational attainment of bachelor's degree are most likely to be married with 100.0% of them married at childbirth, while women with the educational attainment of high school diploma are least likely to be married with 91.4% of them unmarried at childbirth.
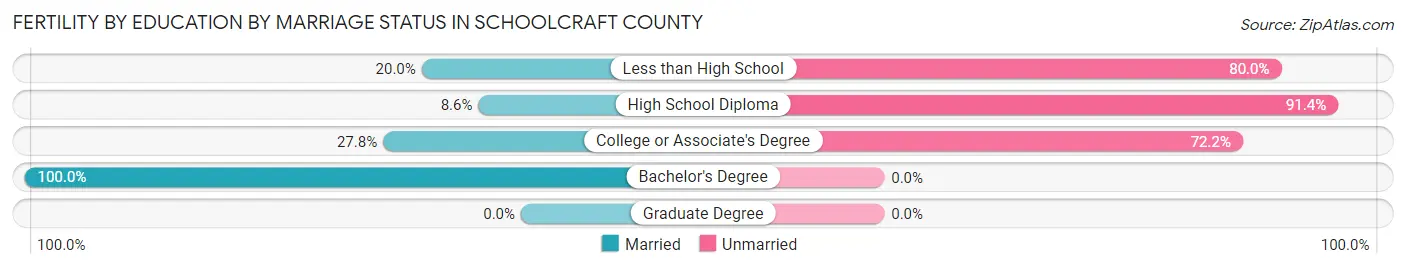
| Educational Attainment | Married | Unmarried |
| Less than High School | 4 (20.0%) | 16 (80.0%) |
| High School Diploma | 3 (8.6%) | 32 (91.4%) |
| College or Associate's Degree | 5 (27.8%) | 13 (72.2%) |
| Bachelor's Degree | 8 (100.0%) | 0 (0.0%) |
| Graduate Degree | 0 (0.0%) | 0 (0.0%) |
| Total | 20 (24.7%) | 61 (75.3%) |
Income in Schoolcraft County
Income Overview in Schoolcraft County
Per Capita Income in Schoolcraft County is $33,805, while median incomes of families and households are $71,250 and $55,071 respectively.
| Characteristic | Number | Measure |
| Per Capita Income | 8,062 | $33,805 |
| Median Family Income | 2,244 | $71,250 |
| Mean Family Income | 2,244 | $93,182 |
| Median Household Income | 3,785 | $55,071 |
| Mean Household Income | 3,785 | $72,108 |
| Income Deficit | 2,244 | $9,903 |
| Wage / Income Gap (%) | 8,062 | 44.38% |
| Wage / Income Gap ($) | 8,062 | 55.62¢ per $1 |
| Gini / Inequality Index | 8,062 | 0.46 |
Earnings by Sex in Schoolcraft County
Average Earnings in Schoolcraft County are $32,901, $43,924 for men and $24,429 for women, a difference of 44.4%.
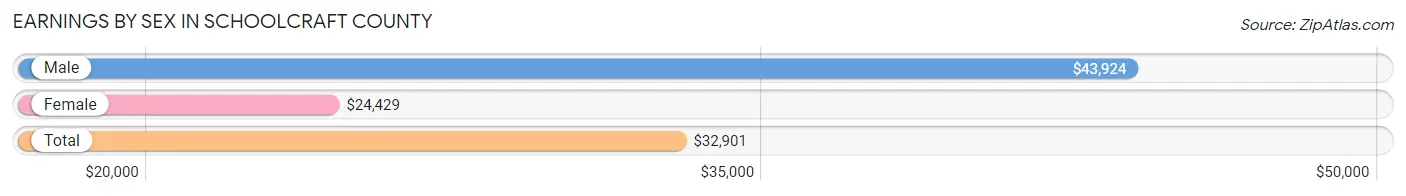
| Sex | Number | Average Earnings |
| Male | 1,903 (53.9%) | $43,924 |
| Female | 1,628 (46.1%) | $24,429 |
| Total | 3,531 (100.0%) | $32,901 |
Earnings by Sex by Income Bracket in Schoolcraft County
The most common earnings brackets in Schoolcraft County are $75,000 to $99,999 for men (271 | 14.2%) and $55,000 to $64,999 for women (144 | 8.8%).

| Income | Male | Female |
| $2,499 or less | 102 (5.4%) | 104 (6.4%) |
| $2,500 to $4,999 | 26 (1.4%) | 62 (3.8%) |
| $5,000 to $7,499 | 47 (2.5%) | 47 (2.9%) |
| $7,500 to $9,999 | 111 (5.8%) | 75 (4.6%) |
| $10,000 to $12,499 | 95 (5.0%) | 81 (5.0%) |
| $12,500 to $14,999 | 76 (4.0%) | 107 (6.6%) |
| $15,000 to $17,499 | 54 (2.8%) | 55 (3.4%) |
| $17,500 to $19,999 | 33 (1.7%) | 128 (7.9%) |
| $20,000 to $22,499 | 36 (1.9%) | 74 (4.5%) |
| $22,500 to $24,999 | 55 (2.9%) | 105 (6.5%) |
| $25,000 to $29,999 | 58 (3.0%) | 138 (8.5%) |
| $30,000 to $34,999 | 110 (5.8%) | 78 (4.8%) |
| $35,000 to $39,999 | 81 (4.3%) | 79 (4.9%) |
| $40,000 to $44,999 | 83 (4.4%) | 42 (2.6%) |
| $45,000 to $49,999 | 85 (4.5%) | 71 (4.4%) |
| $50,000 to $54,999 | 78 (4.1%) | 57 (3.5%) |
| $55,000 to $64,999 | 120 (6.3%) | 144 (8.8%) |
| $65,000 to $74,999 | 204 (10.7%) | 57 (3.5%) |
| $75,000 to $99,999 | 271 (14.2%) | 98 (6.0%) |
| $100,000+ | 178 (9.3%) | 26 (1.6%) |
| Total | 1,903 (100.0%) | 1,628 (100.0%) |
Earnings by Sex by Educational Attainment in Schoolcraft County
Average earnings in Schoolcraft County are $50,179 for men and $26,038 for women, a difference of 48.1%. Men with an educational attainment of graduate degree enjoy the highest average annual earnings of $87,054, while those with high school diploma education earn the least with $33,860. Women with an educational attainment of graduate degree earn the most with the average annual earnings of $51,250, while those with college or associate's degree education have the smallest earnings of $22,159.
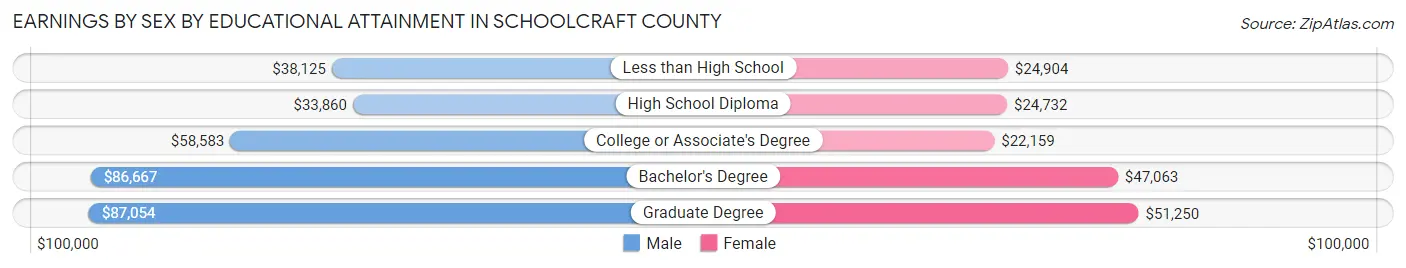
| Educational Attainment | Male Income | Female Income |
| Less than High School | $38,125 | $24,904 |
| High School Diploma | $33,860 | $24,732 |
| College or Associate's Degree | $58,583 | $22,159 |
| Bachelor's Degree | $86,667 | $47,063 |
| Graduate Degree | $87,054 | $51,250 |
| Total | $50,179 | $26,038 |
Family Income in Schoolcraft County
Family Income Brackets in Schoolcraft County
According to the Schoolcraft County family income data, there are 550 families falling into the $50,000 to $74,999 income range, which is the most common income bracket and makes up 24.5% of all families. Conversely, the less than $10,000 income bracket is the least frequent group with only 56 families (2.5%) belonging to this category.
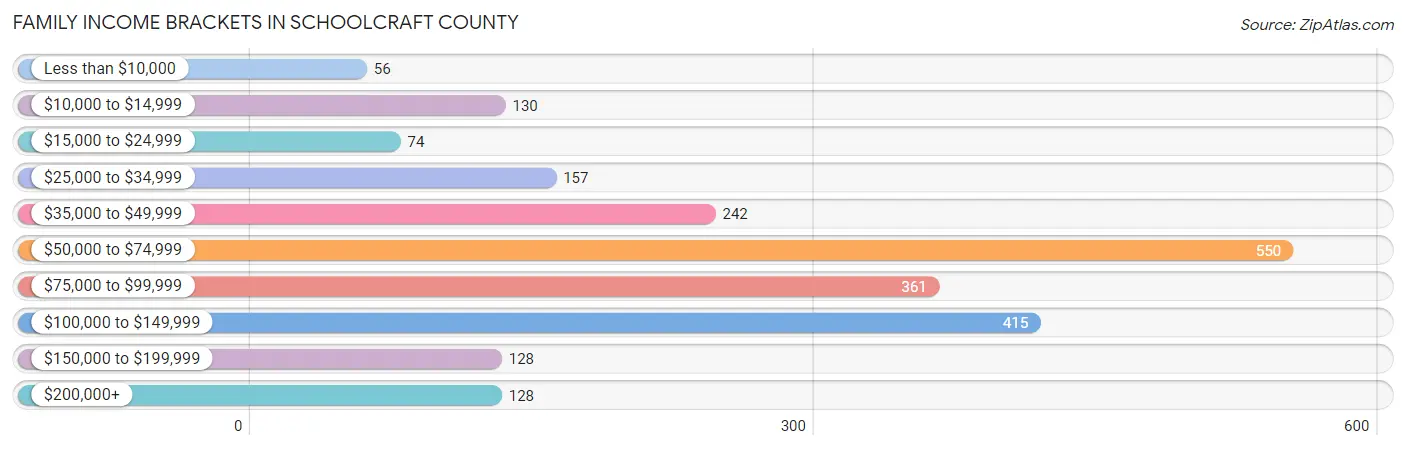
| Income Bracket | # Families | % Families |
| Less than $10,000 | 56 | 2.5% |
| $10,000 to $14,999 | 130 | 5.8% |
| $15,000 to $24,999 | 74 | 3.3% |
| $25,000 to $34,999 | 157 | 7.0% |
| $35,000 to $49,999 | 242 | 10.8% |
| $50,000 to $74,999 | 550 | 24.5% |
| $75,000 to $99,999 | 361 | 16.1% |
| $100,000 to $149,999 | 415 | 18.5% |
| $150,000 to $199,999 | 128 | 5.7% |
| $200,000+ | 128 | 5.7% |
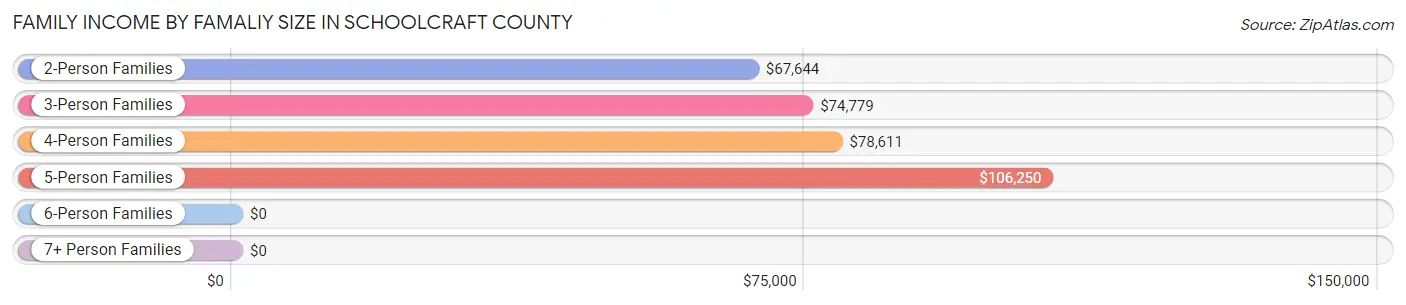
Family Income by Famaliy Size in Schoolcraft County
5-person families (105 | 4.7%) account for the highest median family income in Schoolcraft County with $106,250 per family, while 2-person families (1,433 | 63.9%) have the highest median income of $33,822 per family member.
| Income Bracket | # Families | Median Income |
| 2-Person Families | 1,433 (63.9%) | $67,644 |
| 3-Person Families | 425 (18.9%) | $74,779 |
| 4-Person Families | 226 (10.1%) | $78,611 |
| 5-Person Families | 105 (4.7%) | $106,250 |
| 6-Person Families | 23 (1.0%) | $0 |
| 7+ Person Families | 32 (1.4%) | $0 |
| Total | 2,244 (100.0%) | $71,250 |
Family Income by Number of Earners in Schoolcraft County
The median family income in Schoolcraft County is $71,250, with families comprising 3+ earners (161) having the highest median family income of $118,516, while families with no earners (683) have the lowest median family income of $50,231, accounting for 7.2% and 30.4% of families, respectively.

| Number of Earners | # Families | Median Income |
| No Earners | 683 (30.4%) | $50,231 |
| 1 Earner | 737 (32.8%) | $64,112 |
| 2 Earners | 663 (29.5%) | $102,656 |
| 3+ Earners | 161 (7.2%) | $118,516 |
| Total | 2,244 (100.0%) | $71,250 |
Household Income in Schoolcraft County
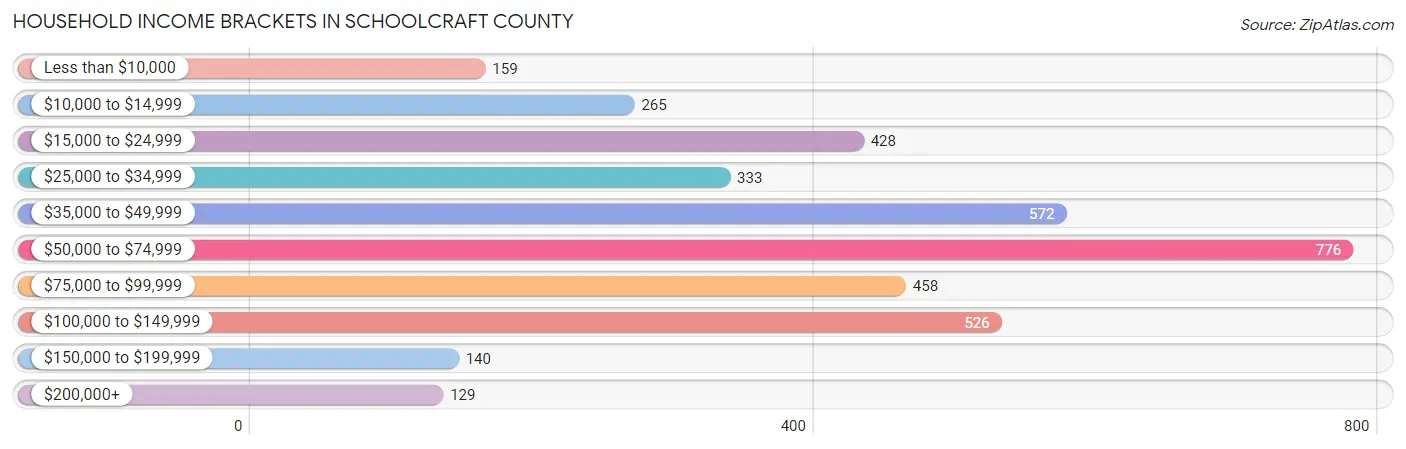
Household Income Brackets in Schoolcraft County
With 776 households falling in the category, the $50,000 to $74,999 income range is the most frequent in Schoolcraft County, accounting for 20.5% of all households. In contrast, only 129 households (3.4%) fall into the $200,000+ income bracket, making it the least populous group.
| Income Bracket | # Households | % Households |
| Less than $10,000 | 159 | 4.2% |
| $10,000 to $14,999 | 265 | 7.0% |
| $15,000 to $24,999 | 428 | 11.3% |
| $25,000 to $34,999 | 333 | 8.8% |
| $35,000 to $49,999 | 572 | 15.1% |
| $50,000 to $74,999 | 776 | 20.5% |
| $75,000 to $99,999 | 458 | 12.1% |
| $100,000 to $149,999 | 526 | 13.9% |
| $150,000 to $199,999 | 140 | 3.7% |
| $200,000+ | 129 | 3.4% |
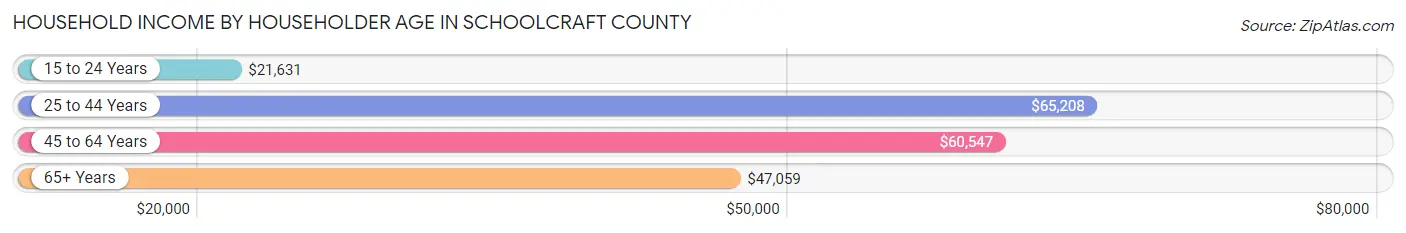
Household Income by Householder Age in Schoolcraft County
The median household income in Schoolcraft County is $55,071, with the highest median household income of $65,208 found in the 25 to 44 years age bracket for the primary householder. A total of 713 households (18.8%) fall into this category. Meanwhile, the 15 to 24 years age bracket for the primary householder has the lowest median household income of $21,631, with 137 households (3.6%) in this group.
| Income Bracket | # Households | Median Income |
| 15 to 24 Years | 137 (3.6%) | $21,631 |
| 25 to 44 Years | 713 (18.8%) | $65,208 |
| 45 to 64 Years | 1,505 (39.8%) | $60,547 |
| 65+ Years | 1,430 (37.8%) | $47,059 |
| Total | 3,785 (100.0%) | $55,071 |
Poverty in Schoolcraft County
Income Below Poverty by Sex and Age in Schoolcraft County
With 14.4% poverty level for males and 17.6% for females among the residents of Schoolcraft County, 5 year old males and 6 to 11 year old females are the most vulnerable to poverty, with 16 males (66.7%) and 63 females (35.4%) in their respective age groups living below the poverty level.

| Age Bracket | Male | Female |
| Under 5 Years | 63 (43.1%) | 36 (18.5%) |
| 5 Years | 16 (66.7%) | 14 (29.2%) |
| 6 to 11 Years | 59 (24.1%) | 63 (35.4%) |
| 12 to 14 Years | 34 (23.9%) | 18 (11.6%) |
| 15 Years | 3 (7.0%) | 11 (27.5%) |
| 16 and 17 Years | 15 (13.8%) | 2 (3.5%) |
| 18 to 24 Years | 60 (24.1%) | 75 (34.3%) |
| 25 to 34 Years | 107 (32.9%) | 86 (26.1%) |
| 35 to 44 Years | 25 (5.9%) | 87 (23.9%) |
| 45 to 54 Years | 51 (11.0%) | 51 (10.0%) |
| 55 to 64 Years | 81 (11.1%) | 71 (8.9%) |
| 65 to 74 Years | 36 (5.0%) | 141 (21.9%) |
| 75 Years and over | 27 (7.1%) | 40 (9.5%) |
| Total | 577 (14.4%) | 695 (17.6%) |
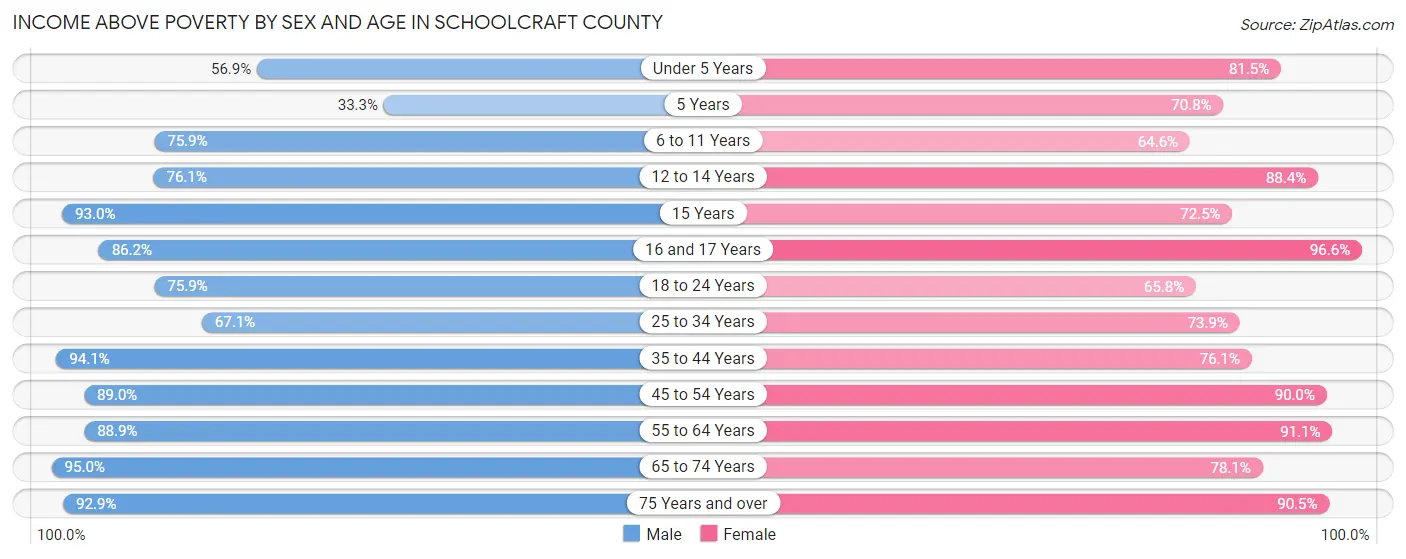
Income Above Poverty by Sex and Age in Schoolcraft County
According to the poverty statistics in Schoolcraft County, males aged 65 to 74 years and females aged 16 and 17 years are the age groups that are most secure financially, with 95.0% of males and 96.6% of females in these age groups living above the poverty line.
| Age Bracket | Male | Female |
| Under 5 Years | 83 (56.9%) | 159 (81.5%) |
| 5 Years | 8 (33.3%) | 34 (70.8%) |
| 6 to 11 Years | 186 (75.9%) | 115 (64.6%) |
| 12 to 14 Years | 108 (76.1%) | 137 (88.4%) |
| 15 Years | 40 (93.0%) | 29 (72.5%) |
| 16 and 17 Years | 94 (86.2%) | 56 (96.6%) |
| 18 to 24 Years | 189 (75.9%) | 144 (65.7%) |
| 25 to 34 Years | 218 (67.1%) | 243 (73.9%) |
| 35 to 44 Years | 398 (94.1%) | 277 (76.1%) |
| 45 to 54 Years | 412 (89.0%) | 460 (90.0%) |
| 55 to 64 Years | 651 (88.9%) | 722 (91.0%) |
| 65 to 74 Years | 680 (95.0%) | 503 (78.1%) |
| 75 Years and over | 351 (92.9%) | 380 (90.5%) |
| Total | 3,418 (85.6%) | 3,259 (82.4%) |
Income Below Poverty Among Married-Couple Families in Schoolcraft County
The poverty statistics for married-couple families in Schoolcraft County show that 7.0% or 127 of the total 1,813 families live below the poverty line. Families with 5 or more children have the highest poverty rate of 31.6%, comprising of 6 families. On the other hand, families with 3 or 4 children have the lowest poverty rate of 6.4%, which includes 7 families.

| Children | Above Poverty | Below Poverty |
| No Children | 1,325 (93.5%) | 92 (6.5%) |
| 1 or 2 Children | 246 (91.8%) | 22 (8.2%) |
| 3 or 4 Children | 102 (93.6%) | 7 (6.4%) |
| 5 or more Children | 13 (68.4%) | 6 (31.6%) |
| Total | 1,686 (93.0%) | 127 (7.0%) |
Income Below Poverty Among Single-Parent Households in Schoolcraft County
According to the poverty data in Schoolcraft County, 14.8% or 33 single-father households and 41.3% or 86 single-mother households are living below the poverty line. Among single-father households, those with 5 or more children have the highest poverty rate, with 3 households (100.0%) experiencing poverty. Likewise, among single-mother households, those with 5 or more children have the highest poverty rate, with 7 households (87.5%) falling below the poverty line.
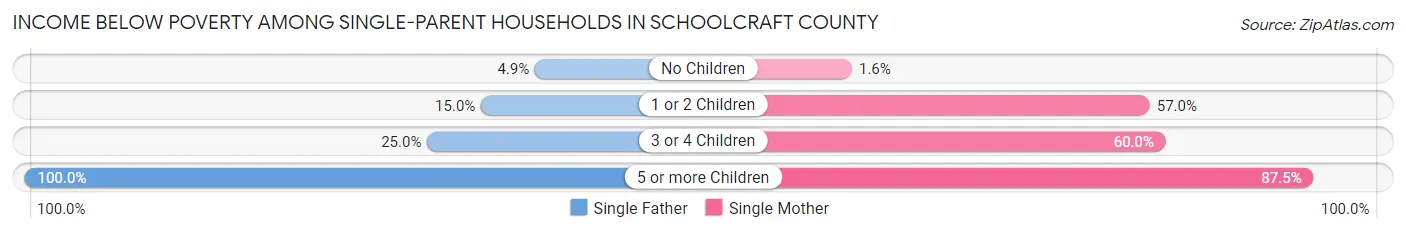
| Children | Single Father | Single Mother |
| No Children | 3 (4.9%) | 1 (1.6%) |
| 1 or 2 Children | 19 (15.0%) | 69 (57.0%) |
| 3 or 4 Children | 8 (25.0%) | 9 (60.0%) |
| 5 or more Children | 3 (100.0%) | 7 (87.5%) |
| Total | 33 (14.8%) | 86 (41.3%) |
Income Below Poverty Among Married-Couple vs Single-Parent Households in Schoolcraft County
The poverty data for Schoolcraft County shows that 127 of the married-couple family households (7.0%) and 119 of the single-parent households (27.6%) are living below the poverty level. Within the married-couple family households, those with 5 or more children have the highest poverty rate, with 6 households (31.6%) falling below the poverty line. Among the single-parent households, those with 5 or more children have the highest poverty rate, with 10 household (90.9%) living below poverty.
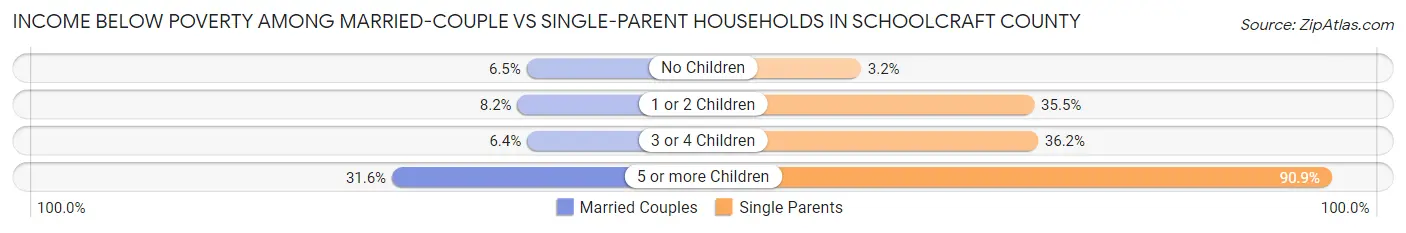
| Children | Married-Couple Families | Single-Parent Households |
| No Children | 92 (6.5%) | 4 (3.2%) |
| 1 or 2 Children | 22 (8.2%) | 88 (35.5%) |
| 3 or 4 Children | 7 (6.4%) | 17 (36.2%) |
| 5 or more Children | 6 (31.6%) | 10 (90.9%) |
| Total | 127 (7.0%) | 119 (27.6%) |
Employment Characteristics in Schoolcraft County
Employment by Class of Employer in Schoolcraft County
Among the 3,155 employed individuals in Schoolcraft County, private company employees (1,906 | 60.4%), local government employees (353 | 11.2%), and not-for-profit organizations (234 | 7.4%) make up the most common classes of employment.
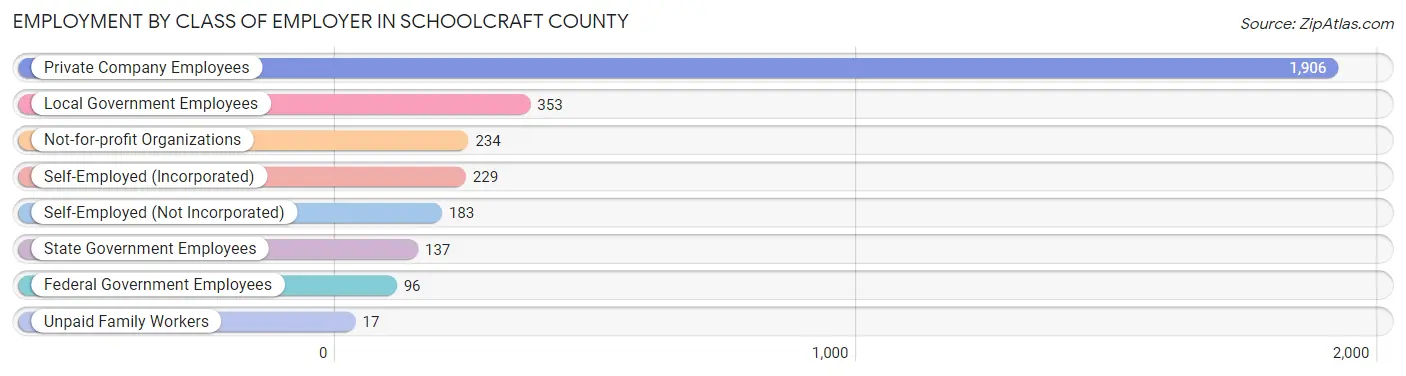
| Employer Class | # Employees | % Employees |
| Private Company Employees | 1,906 | 60.4% |
| Self-Employed (Incorporated) | 229 | 7.3% |
| Self-Employed (Not Incorporated) | 183 | 5.8% |
| Not-for-profit Organizations | 234 | 7.4% |
| Local Government Employees | 353 | 11.2% |
| State Government Employees | 137 | 4.3% |
| Federal Government Employees | 96 | 3.0% |
| Unpaid Family Workers | 17 | 0.5% |
| Total | 3,155 | 100.0% |
Employment Status by Age in Schoolcraft County
According to the labor force statistics for Schoolcraft County, out of the total population over 16 years of age (6,828), 50.7% or 3,462 individuals are in the labor force, with 7.9% or 273 of them unemployed. The age group with the highest labor force participation rate is 45 to 54 years, with 82.7% or 809 individuals in the labor force. Within the labor force, the 75 years and over age range has the highest percentage of unemployed individuals, with 18.8% or 6 of them being unemployed.

| Age Bracket | In Labor Force | Unemployed |
| 16 to 19 Years | 109 (45.2%) | 17 (15.6%) |
| 20 to 24 Years | 313 (79.4%) | 15 (4.8%) |
| 25 to 29 Years | 299 (79.5%) | 45 (15.1%) |
| 30 to 34 Years | 224 (78.0%) | 32 (14.3%) |
| 35 to 44 Years | 608 (76.1%) | 65 (10.7%) |
| 45 to 54 Years | 809 (82.7%) | 43 (5.3%) |
| 55 to 59 Years | 492 (67.4%) | 19 (3.9%) |
| 60 to 64 Years | 314 (38.8%) | 20 (6.4%) |
| 65 to 74 Years | 260 (19.1%) | 12 (4.6%) |
| 75 Years and over | 32 (3.7%) | 6 (18.8%) |
| Total | 3,462 (50.7%) | 273 (7.9%) |
Employment Status by Educational Attainment in Schoolcraft County
According to labor force statistics for Schoolcraft County, 69.0% of individuals (2,746) out of the total population between 25 and 64 years of age (3,979) are in the labor force, with 8.2% or 225 of them being unemployed. The group with the highest labor force participation rate are those with the educational attainment of college / associate degree, with 80.6% or 1,076 individuals in the labor force. Within the labor force, individuals with less than high school education have the highest percentage of unemployment, with 24.2% or 39 of them being unemployed.
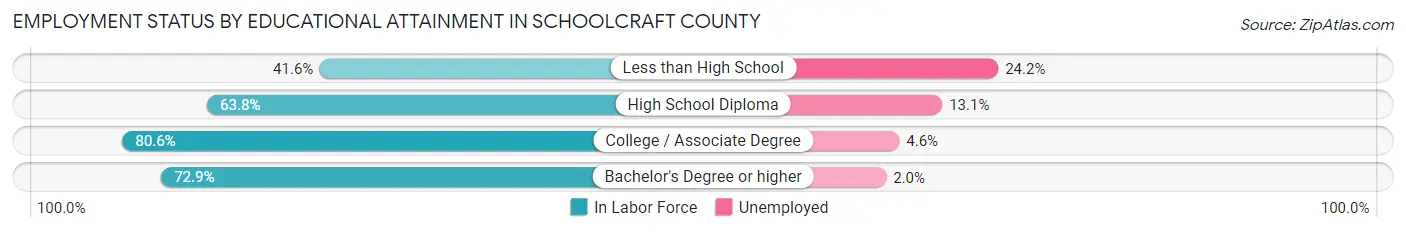
| Educational Attainment | In Labor Force | Unemployed |
| Less than High School | 161 (41.6%) | 94 (24.2%) |
| High School Diploma | 951 (63.8%) | 195 (13.1%) |
| College / Associate Degree | 1,076 (80.6%) | 61 (4.6%) |
| Bachelor's Degree or higher | 559 (72.9%) | 15 (2.0%) |
| Total | 2,746 (69.0%) | 326 (8.2%) |
Employment Occupations by Sex in Schoolcraft County
Management, Business, Science and Arts Occupations
The most common Management, Business, Science and Arts occupations in Schoolcraft County are Community & Social Service (281 | 8.8%), Management (279 | 8.8%), Health Diagnosing & Treating (233 | 7.3%), Health Technologists (169 | 5.3%), and Education Instruction & Library (159 | 5.0%).

Management, Business, Science and Arts Occupations by Sex
Within the Management, Business, Science and Arts occupations in Schoolcraft County, the most male-oriented occupations are Architecture & Engineering (100.0%), Computers & Mathematics (94.4%), and Computers, Engineering & Science (91.5%), while the most female-oriented occupations are Education Instruction & Library (98.1%), Community & Social Service (89.7%), and Legal Services & Support (87.5%).

| Occupation | Male | Female |
| Management | 153 (54.8%) | 126 (45.2%) |
| Business & Financial | 18 (32.1%) | 38 (67.9%) |
| Computers, Engineering & Science | 75 (91.5%) | 7 (8.5%) |
| Computers & Mathematics | 51 (94.4%) | 3 (5.6%) |
| Architecture & Engineering | 10 (100.0%) | 0 (0.0%) |
| Life, Physical & Social Science | 14 (77.8%) | 4 (22.2%) |
| Community & Social Service | 29 (10.3%) | 252 (89.7%) |
| Education, Arts & Media | 18 (20.4%) | 70 (79.5%) |
| Legal Services & Support | 2 (12.5%) | 14 (87.5%) |
| Education Instruction & Library | 3 (1.9%) | 156 (98.1%) |
| Arts, Media & Entertainment | 6 (33.3%) | 12 (66.7%) |
| Health Diagnosing & Treating | 74 (31.8%) | 159 (68.2%) |
| Health Technologists | 64 (37.9%) | 105 (62.1%) |
| Total (Category) | 349 (37.5%) | 582 (62.5%) |
| Total (Overall) | 1,727 (54.2%) | 1,459 (45.8%) |
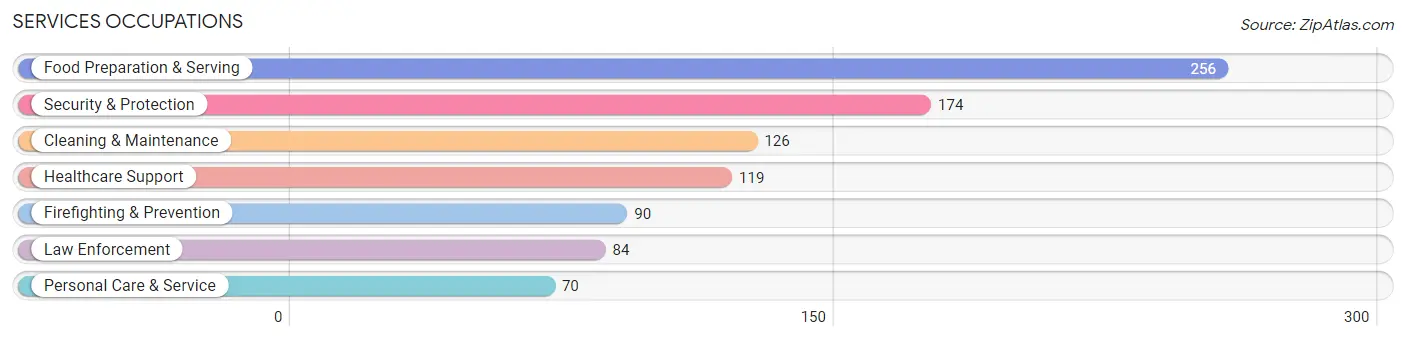
Services Occupations
The most common Services occupations in Schoolcraft County are Food Preparation & Serving (256 | 8.0%), Security & Protection (174 | 5.5%), Cleaning & Maintenance (126 | 4.0%), Healthcare Support (119 | 3.7%), and Firefighting & Prevention (90 | 2.8%).
Services Occupations by Sex
Within the Services occupations in Schoolcraft County, the most male-oriented occupations are Firefighting & Prevention (100.0%), Security & Protection (94.8%), and Law Enforcement (89.3%), while the most female-oriented occupations are Healthcare Support (98.3%), Personal Care & Service (87.1%), and Food Preparation & Serving (54.7%).

| Occupation | Male | Female |
| Healthcare Support | 2 (1.7%) | 117 (98.3%) |
| Security & Protection | 165 (94.8%) | 9 (5.2%) |
| Firefighting & Prevention | 90 (100.0%) | 0 (0.0%) |
| Law Enforcement | 75 (89.3%) | 9 (10.7%) |
| Food Preparation & Serving | 116 (45.3%) | 140 (54.7%) |
| Cleaning & Maintenance | 77 (61.1%) | 49 (38.9%) |
| Personal Care & Service | 9 (12.9%) | 61 (87.1%) |
| Total (Category) | 369 (49.5%) | 376 (50.5%) |
| Total (Overall) | 1,727 (54.2%) | 1,459 (45.8%) |
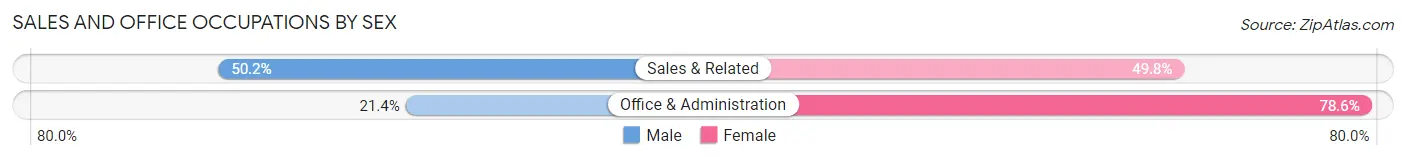
Sales and Office Occupations
The most common Sales and Office occupations in Schoolcraft County are Office & Administration (346 | 10.9%), and Sales & Related (267 | 8.4%).

Sales and Office Occupations by Sex
| Occupation | Male | Female |
| Sales & Related | 134 (50.2%) | 133 (49.8%) |
| Office & Administration | 74 (21.4%) | 272 (78.6%) |
| Total (Category) | 208 (33.9%) | 405 (66.1%) |
| Total (Overall) | 1,727 (54.2%) | 1,459 (45.8%) |
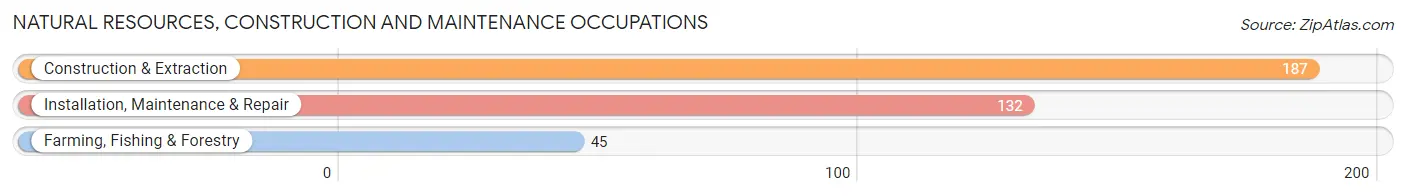
Natural Resources, Construction and Maintenance Occupations
The most common Natural Resources, Construction and Maintenance occupations in Schoolcraft County are Construction & Extraction (187 | 5.9%), Installation, Maintenance & Repair (132 | 4.1%), and Farming, Fishing & Forestry (45 | 1.4%).
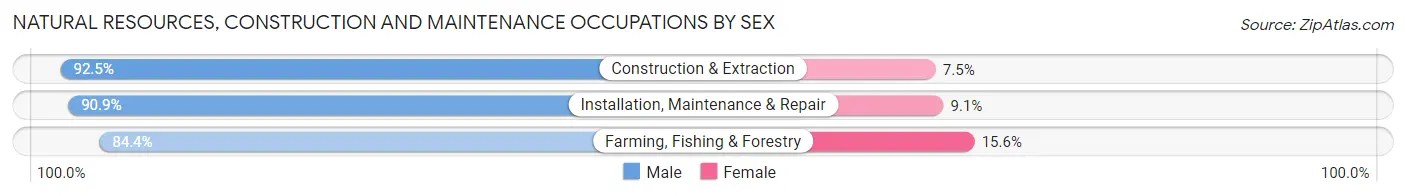
Natural Resources, Construction and Maintenance Occupations by Sex
| Occupation | Male | Female |
| Farming, Fishing & Forestry | 38 (84.4%) | 7 (15.6%) |
| Construction & Extraction | 173 (92.5%) | 14 (7.5%) |
| Installation, Maintenance & Repair | 120 (90.9%) | 12 (9.1%) |
| Total (Category) | 331 (90.9%) | 33 (9.1%) |
| Total (Overall) | 1,727 (54.2%) | 1,459 (45.8%) |
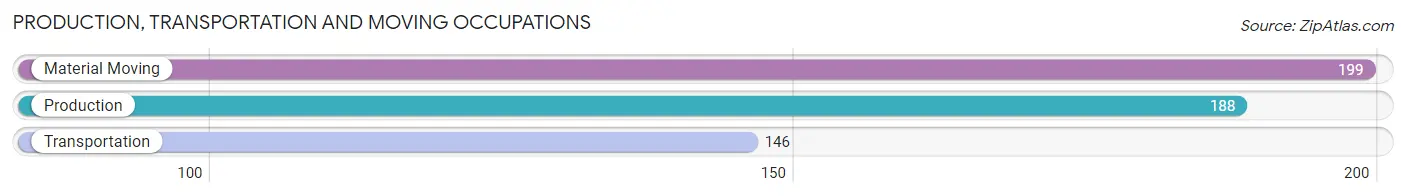
Production, Transportation and Moving Occupations
The most common Production, Transportation and Moving occupations in Schoolcraft County are Material Moving (199 | 6.2%), Production (188 | 5.9%), and Transportation (146 | 4.6%).
Production, Transportation and Moving Occupations by Sex
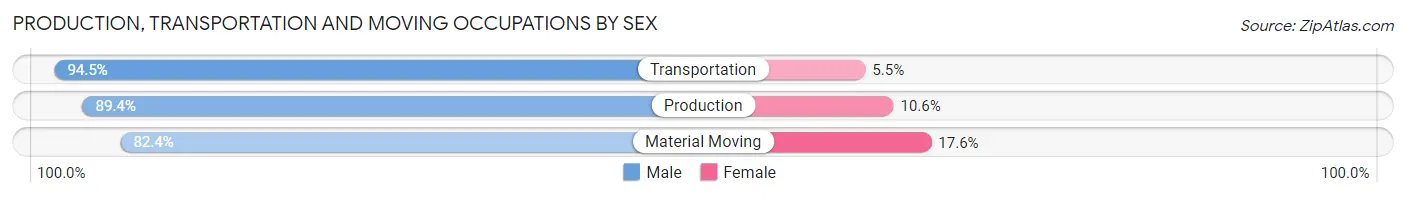
| Occupation | Male | Female |
| Production | 168 (89.4%) | 20 (10.6%) |
| Transportation | 138 (94.5%) | 8 (5.5%) |
| Material Moving | 164 (82.4%) | 35 (17.6%) |
| Total (Category) | 470 (88.2%) | 63 (11.8%) |
| Total (Overall) | 1,727 (54.2%) | 1,459 (45.8%) |
Employment Industries by Sex in Schoolcraft County
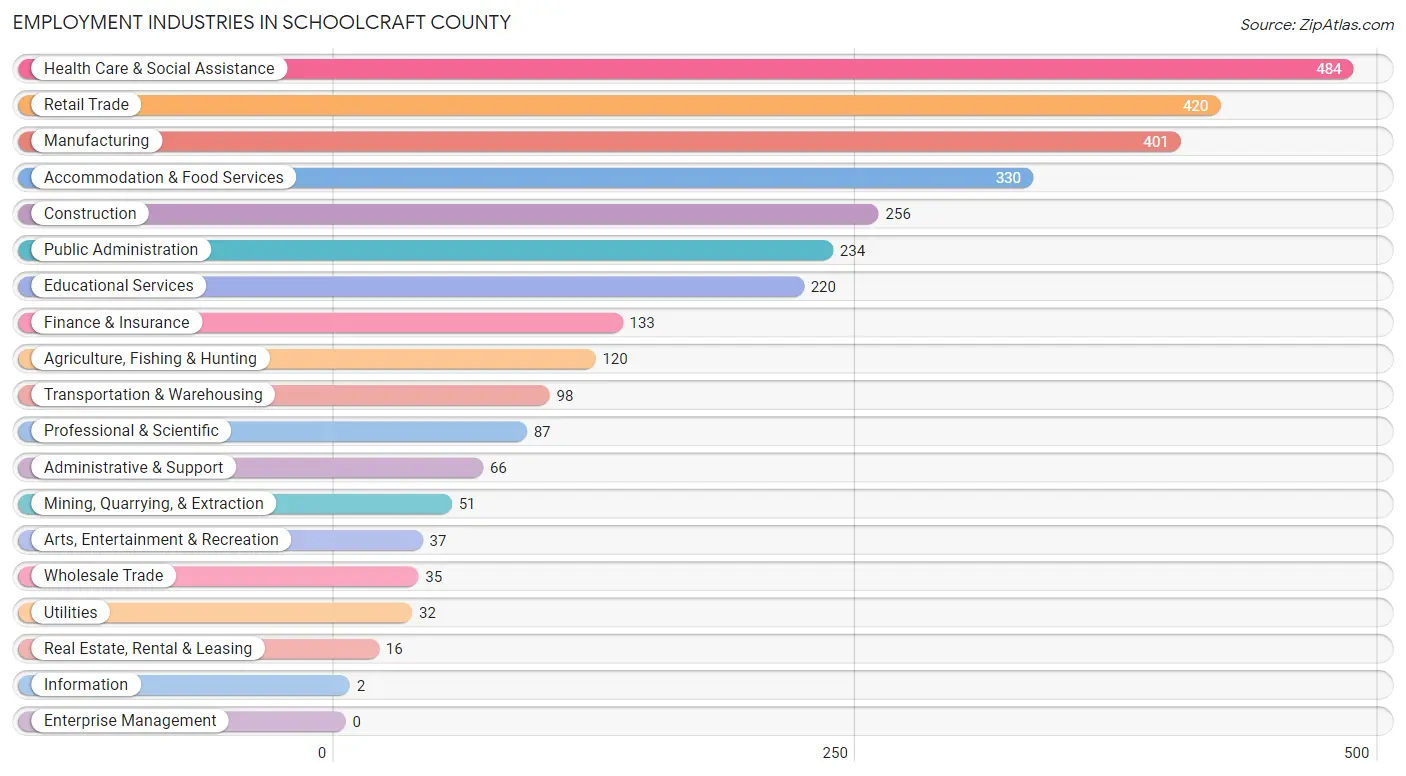
Employment Industries in Schoolcraft County
The major employment industries in Schoolcraft County include Health Care & Social Assistance (484 | 15.2%), Retail Trade (420 | 13.2%), Manufacturing (401 | 12.6%), Accommodation & Food Services (330 | 10.4%), and Construction (256 | 8.0%).
Employment Industries by Sex in Schoolcraft County
The Schoolcraft County industries that see more men than women are Mining, Quarrying, & Extraction (100.0%), Wholesale Trade (100.0%), and Information (100.0%), whereas the industries that tend to have a higher number of women are Health Care & Social Assistance (86.0%), Educational Services (82.3%), and Real Estate, Rental & Leasing (81.2%).

| Industry | Male | Female |
| Agriculture, Fishing & Hunting | 107 (89.2%) | 13 (10.8%) |
| Mining, Quarrying, & Extraction | 51 (100.0%) | 0 (0.0%) |
| Construction | 229 (89.4%) | 27 (10.5%) |
| Manufacturing | 325 (81.0%) | 76 (19.0%) |
| Wholesale Trade | 35 (100.0%) | 0 (0.0%) |
| Retail Trade | 240 (57.1%) | 180 (42.9%) |
| Transportation & Warehousing | 77 (78.6%) | 21 (21.4%) |
| Utilities | 31 (96.9%) | 1 (3.1%) |
| Information | 2 (100.0%) | 0 (0.0%) |
| Finance & Insurance | 63 (47.4%) | 70 (52.6%) |
| Real Estate, Rental & Leasing | 3 (18.8%) | 13 (81.2%) |
| Professional & Scientific | 39 (44.8%) | 48 (55.2%) |
| Enterprise Management | 0 (0.0%) | 0 (0.0%) |
| Administrative & Support | 54 (81.8%) | 12 (18.2%) |
| Educational Services | 39 (17.7%) | 181 (82.3%) |
| Health Care & Social Assistance | 68 (14.1%) | 416 (86.0%) |
| Arts, Entertainment & Recreation | 24 (64.9%) | 13 (35.1%) |
| Accommodation & Food Services | 142 (43.0%) | 188 (57.0%) |
| Public Administration | 145 (62.0%) | 89 (38.0%) |
| Total | 1,727 (54.2%) | 1,459 (45.8%) |
Education in Schoolcraft County
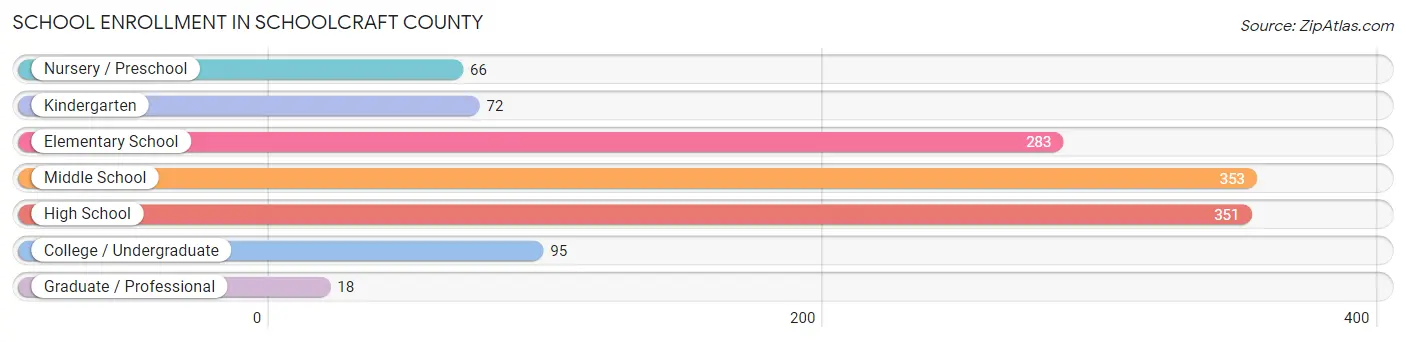
School Enrollment in Schoolcraft County
The most common levels of schooling among the 1,238 students in Schoolcraft County are middle school (353 | 28.5%), high school (351 | 28.3%), and elementary school (283 | 22.9%).
| School Level | # Students | % Students |
| Nursery / Preschool | 66 | 5.3% |
| Kindergarten | 72 | 5.8% |
| Elementary School | 283 | 22.9% |
| Middle School | 353 | 28.5% |
| High School | 351 | 28.3% |
| College / Undergraduate | 95 | 7.7% |
| Graduate / Professional | 18 | 1.5% |
| Total | 1,238 | 100.0% |
School Enrollment by Age by Funding Source in Schoolcraft County
Out of a total of 1,238 students who are enrolled in schools in Schoolcraft County, 251 (20.3%) attend a private institution, while the remaining 987 (79.7%) are enrolled in public schools. The age group of 3 to 4 year olds has the highest likelihood of being enrolled in private schools, with 15 (32.6% in the age bracket) enrolled. Conversely, the age group of 25 to 34 year olds has the lowest likelihood of being enrolled in a private school, with 7 (100.0% in the age bracket) attending a public institution.
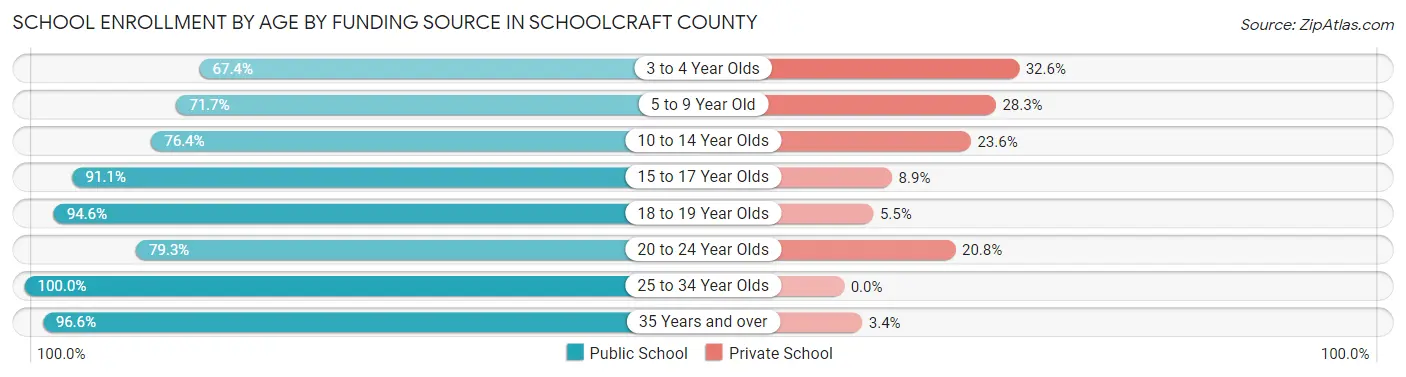
| Age Bracket | Public School | Private School |
| 3 to 4 Year Olds | 31 (67.4%) | 15 (32.6%) |
| 5 to 9 Year Old | 241 (71.7%) | 95 (28.3%) |
| 10 to 14 Year Olds | 333 (76.4%) | 103 (23.6%) |
| 15 to 17 Year Olds | 224 (91.1%) | 22 (8.9%) |
| 18 to 19 Year Olds | 52 (94.6%) | 3 (5.4%) |
| 20 to 24 Year Olds | 42 (79.2%) | 11 (20.7%) |
| 25 to 34 Year Olds | 7 (100.0%) | 0 (0.0%) |
| 35 Years and over | 57 (96.6%) | 2 (3.4%) |
| Total | 987 (79.7%) | 251 (20.3%) |
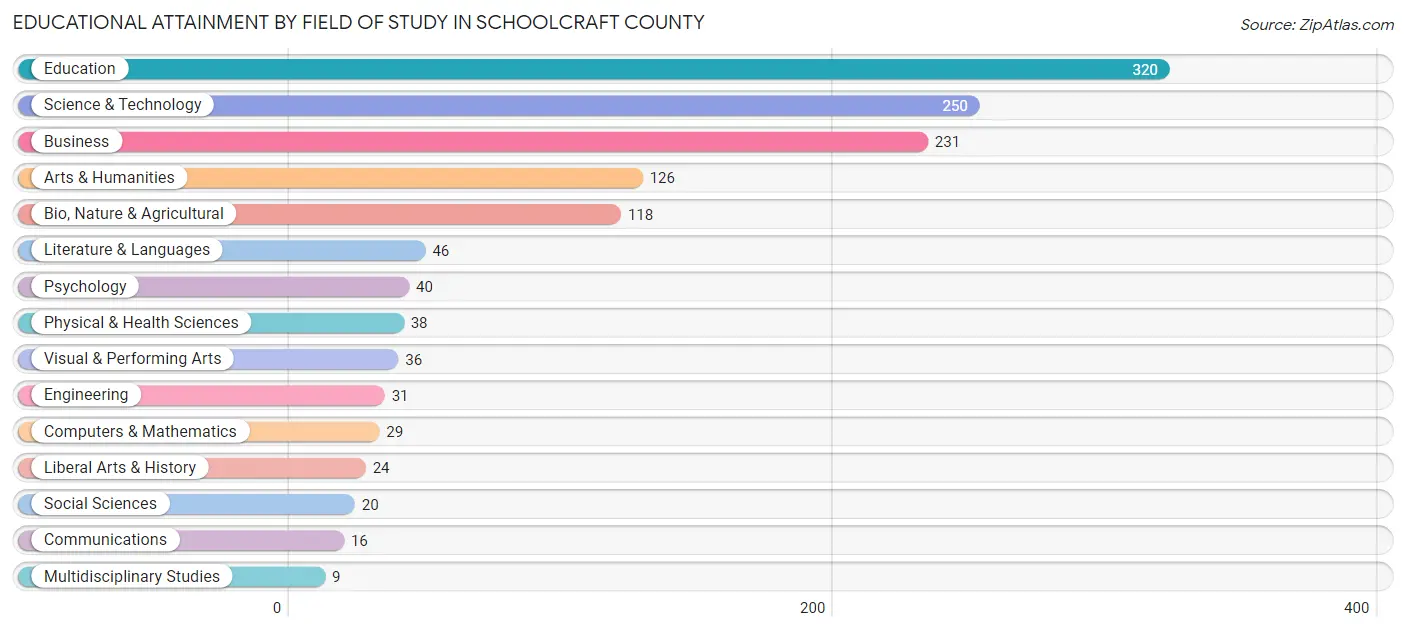
Educational Attainment by Field of Study in Schoolcraft County
Education (320 | 24.0%), science & technology (250 | 18.7%), business (231 | 17.3%), arts & humanities (126 | 9.5%), and bio, nature & agricultural (118 | 8.8%) are the most common fields of study among 1,334 individuals in Schoolcraft County who have obtained a bachelor's degree or higher.
| Field of Study | # Graduates | % Graduates |
| Computers & Mathematics | 29 | 2.2% |
| Bio, Nature & Agricultural | 118 | 8.8% |
| Physical & Health Sciences | 38 | 2.9% |
| Psychology | 40 | 3.0% |
| Social Sciences | 20 | 1.5% |
| Engineering | 31 | 2.3% |
| Multidisciplinary Studies | 9 | 0.7% |
| Science & Technology | 250 | 18.7% |
| Business | 231 | 17.3% |
| Education | 320 | 24.0% |
| Literature & Languages | 46 | 3.5% |
| Liberal Arts & History | 24 | 1.8% |
| Visual & Performing Arts | 36 | 2.7% |
| Communications | 16 | 1.2% |
| Arts & Humanities | 126 | 9.5% |
| Total | 1,334 | 100.0% |
Transportation & Commute in Schoolcraft County
Vehicle Availability by Sex in Schoolcraft County
The most prevalent vehicle ownership categories in Schoolcraft County are males with 2 vehicles (803, accounting for 47.2%) and females with 2 vehicles (622, making up 55.3%).
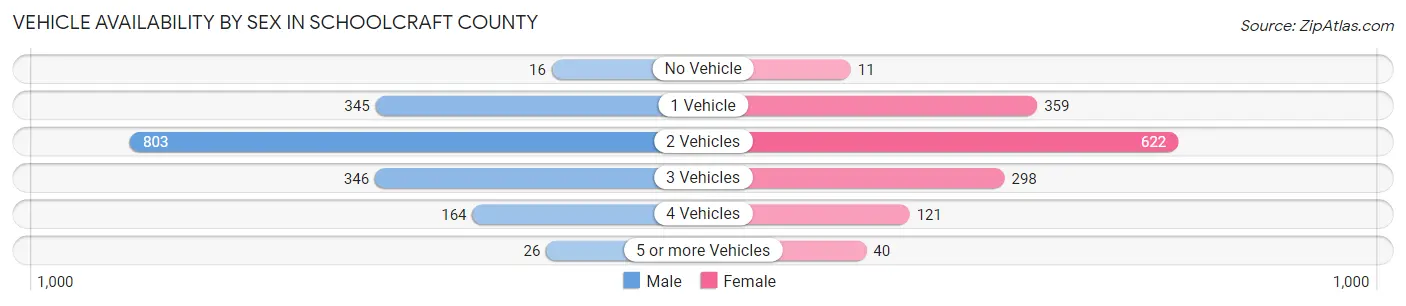
| Vehicles Available | Male | Female |
| No Vehicle | 16 (0.9%) | 11 (0.8%) |
| 1 Vehicle | 345 (20.3%) | 359 (24.7%) |
| 2 Vehicles | 803 (47.2%) | 622 (42.9%) |
| 3 Vehicles | 346 (20.3%) | 298 (20.5%) |
| 4 Vehicles | 164 (9.7%) | 121 (8.3%) |
| 5 or more Vehicles | 26 (1.5%) | 40 (2.8%) |
| Total | 1,700 (100.0%) | 1,451 (100.0%) |
Commute Time in Schoolcraft County
The most frequently occuring commute durations in Schoolcraft County are 5 to 9 minutes (796 commuters, 26.1%), 15 to 19 minutes (479 commuters, 15.7%), and less than 5 minutes (408 commuters, 13.4%).

| Commute Time | # Commuters | % Commuters |
| Less than 5 Minutes | 408 | 13.4% |
| 5 to 9 Minutes | 796 | 26.1% |
| 10 to 14 Minutes | 392 | 12.9% |
| 15 to 19 Minutes | 479 | 15.7% |
| 20 to 24 Minutes | 226 | 7.4% |
| 25 to 29 Minutes | 90 | 2.9% |
| 30 to 34 Minutes | 73 | 2.4% |
| 35 to 39 Minutes | 105 | 3.5% |
| 40 to 44 Minutes | 79 | 2.6% |
| 45 to 59 Minutes | 174 | 5.7% |
| 60 to 89 Minutes | 182 | 6.0% |
| 90 or more Minutes | 42 | 1.4% |
Commute Time by Sex in Schoolcraft County
The most common commute times in Schoolcraft County are 5 to 9 minutes (430 commuters, 25.7%) for males and 5 to 9 minutes (366 commuters, 26.6%) for females.
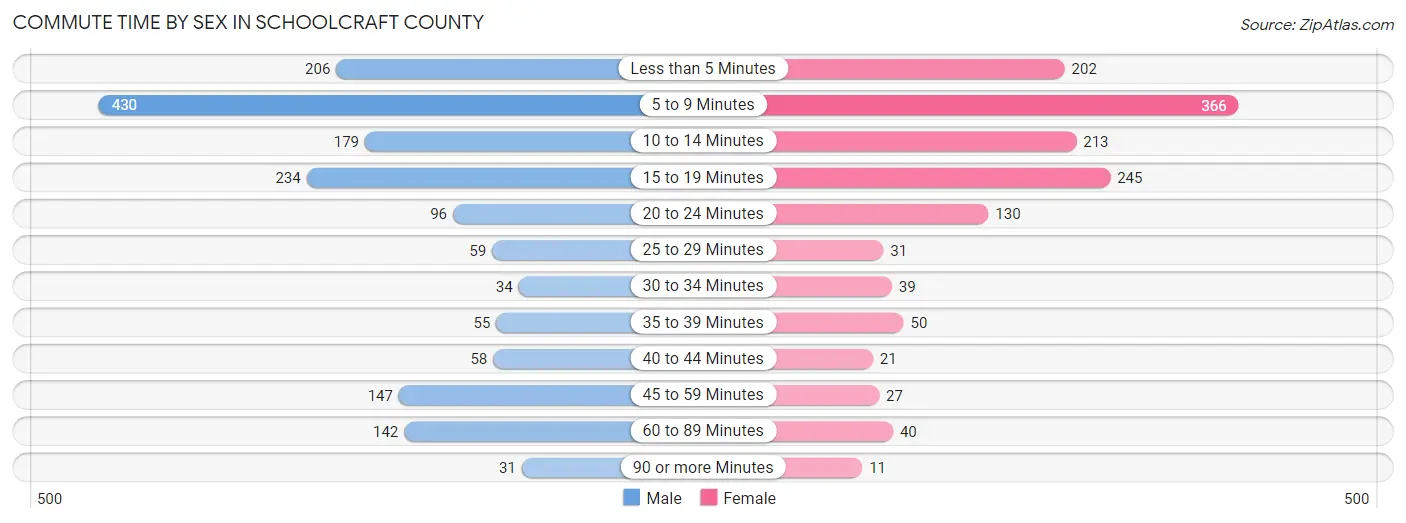
| Commute Time | Male | Female |
| Less than 5 Minutes | 206 (12.3%) | 202 (14.7%) |
| 5 to 9 Minutes | 430 (25.7%) | 366 (26.6%) |
| 10 to 14 Minutes | 179 (10.7%) | 213 (15.5%) |
| 15 to 19 Minutes | 234 (14.0%) | 245 (17.8%) |
| 20 to 24 Minutes | 96 (5.8%) | 130 (9.5%) |
| 25 to 29 Minutes | 59 (3.5%) | 31 (2.2%) |
| 30 to 34 Minutes | 34 (2.0%) | 39 (2.8%) |
| 35 to 39 Minutes | 55 (3.3%) | 50 (3.6%) |
| 40 to 44 Minutes | 58 (3.5%) | 21 (1.5%) |
| 45 to 59 Minutes | 147 (8.8%) | 27 (2.0%) |
| 60 to 89 Minutes | 142 (8.5%) | 40 (2.9%) |
| 90 or more Minutes | 31 (1.9%) | 11 (0.8%) |
Time of Departure to Work by Sex in Schoolcraft County
The most frequent times of departure to work in Schoolcraft County are 6:00 AM to 6:29 AM (283, 16.9%) for males and 7:30 AM to 7:59 AM (398, 28.9%) for females.
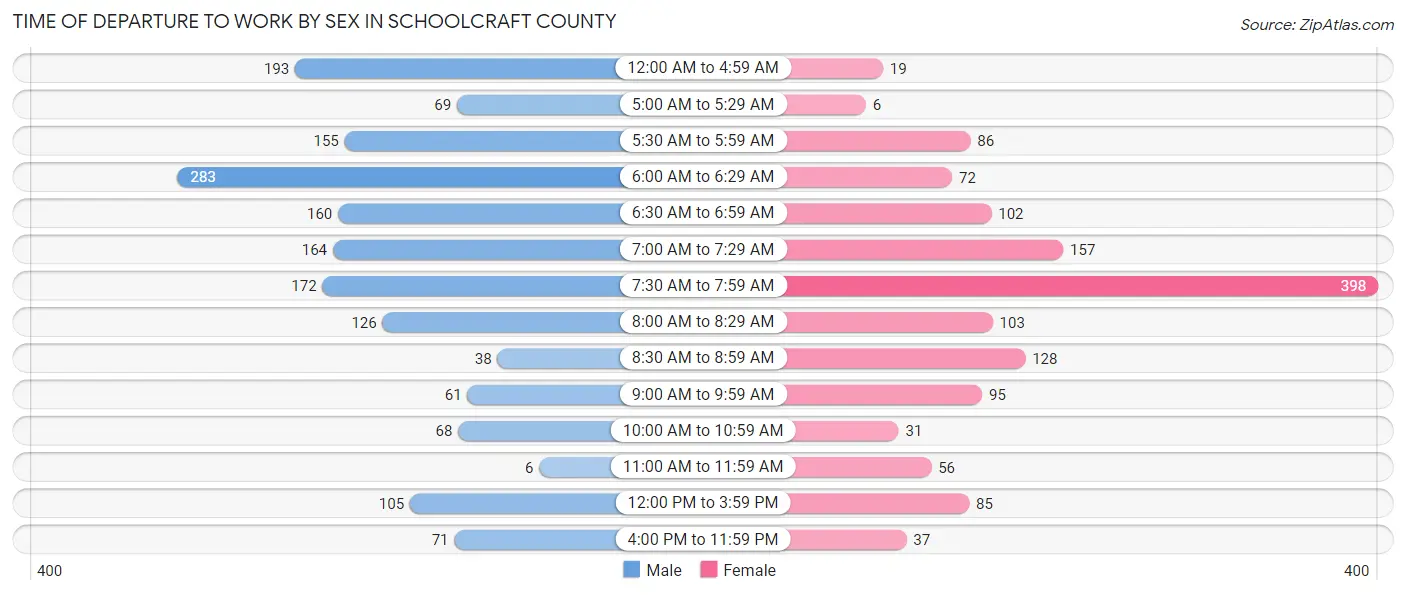
| Time of Departure | Male | Female |
| 12:00 AM to 4:59 AM | 193 (11.6%) | 19 (1.4%) |
| 5:00 AM to 5:29 AM | 69 (4.1%) | 6 (0.4%) |
| 5:30 AM to 5:59 AM | 155 (9.3%) | 86 (6.2%) |
| 6:00 AM to 6:29 AM | 283 (16.9%) | 72 (5.2%) |
| 6:30 AM to 6:59 AM | 160 (9.6%) | 102 (7.4%) |
| 7:00 AM to 7:29 AM | 164 (9.8%) | 157 (11.4%) |
| 7:30 AM to 7:59 AM | 172 (10.3%) | 398 (28.9%) |
| 8:00 AM to 8:29 AM | 126 (7.5%) | 103 (7.5%) |
| 8:30 AM to 8:59 AM | 38 (2.3%) | 128 (9.3%) |
| 9:00 AM to 9:59 AM | 61 (3.6%) | 95 (6.9%) |
| 10:00 AM to 10:59 AM | 68 (4.1%) | 31 (2.2%) |
| 11:00 AM to 11:59 AM | 6 (0.4%) | 56 (4.1%) |
| 12:00 PM to 3:59 PM | 105 (6.3%) | 85 (6.2%) |
| 4:00 PM to 11:59 PM | 71 (4.3%) | 37 (2.7%) |
| Total | 1,671 (100.0%) | 1,375 (100.0%) |
Housing Occupancy in Schoolcraft County
Occupancy by Ownership in Schoolcraft County
Of the total 3,785 dwellings in Schoolcraft County, owner-occupied units account for 3,190 (84.3%), while renter-occupied units make up 595 (15.7%).

| Occupancy | # Housing Units | % Housing Units |
| Owner Occupied Housing Units | 3,190 | 84.3% |
| Renter-Occupied Housing Units | 595 | 15.7% |
| Total Occupied Housing Units | 3,785 | 100.0% |
Occupancy by Household Size in Schoolcraft County

| Household Size | # Housing Units | % Housing Units |
| 1-Person Household | 1,245 | 32.9% |
| 2-Person Household | 1,662 | 43.9% |
| 3-Person Household | 434 | 11.5% |
| 4+ Person Household | 444 | 11.7% |
| Total Housing Units | 3,785 | 100.0% |
Occupancy by Ownership by Household Size in Schoolcraft County
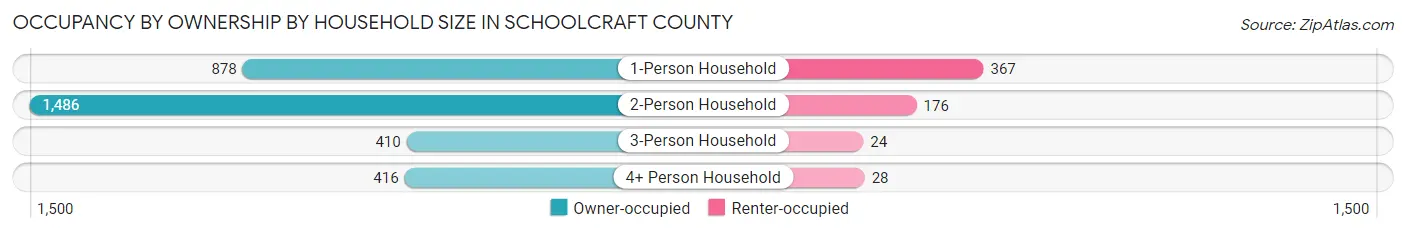
| Household Size | Owner-occupied | Renter-occupied |
| 1-Person Household | 878 (70.5%) | 367 (29.5%) |
| 2-Person Household | 1,486 (89.4%) | 176 (10.6%) |
| 3-Person Household | 410 (94.5%) | 24 (5.5%) |
| 4+ Person Household | 416 (93.7%) | 28 (6.3%) |
| Total Housing Units | 3,190 (84.3%) | 595 (15.7%) |
Occupancy by Educational Attainment in Schoolcraft County
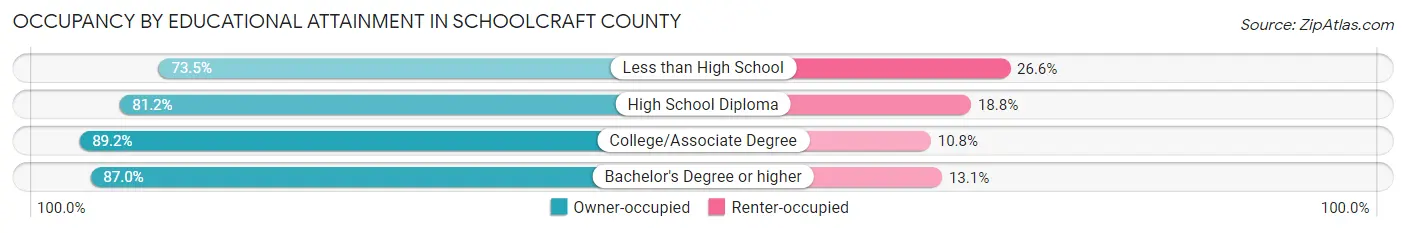
| Household Size | Owner-occupied | Renter-occupied |
| Less than High School | 285 (73.5%) | 103 (26.6%) |
| High School Diploma | 1,084 (81.2%) | 251 (18.8%) |
| College/Associate Degree | 1,128 (89.2%) | 137 (10.8%) |
| Bachelor's Degree or higher | 693 (87.0%) | 104 (13.1%) |
Occupancy by Age of Householder in Schoolcraft County
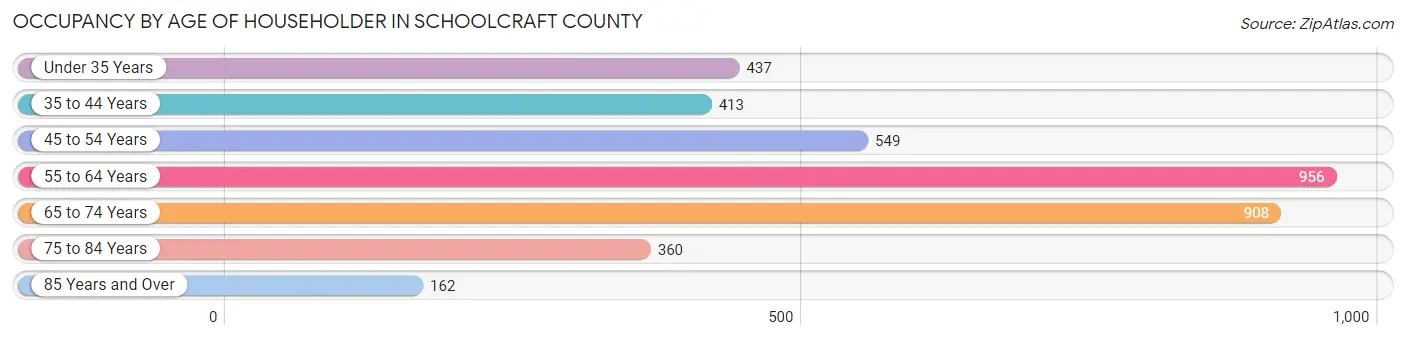
| Age Bracket | # Households | % Households |
| Under 35 Years | 437 | 11.6% |
| 35 to 44 Years | 413 | 10.9% |
| 45 to 54 Years | 549 | 14.5% |
| 55 to 64 Years | 956 | 25.3% |
| 65 to 74 Years | 908 | 24.0% |
| 75 to 84 Years | 360 | 9.5% |
| 85 Years and Over | 162 | 4.3% |
| Total | 3,785 | 100.0% |
Housing Finances in Schoolcraft County
Median Income by Occupancy in Schoolcraft County
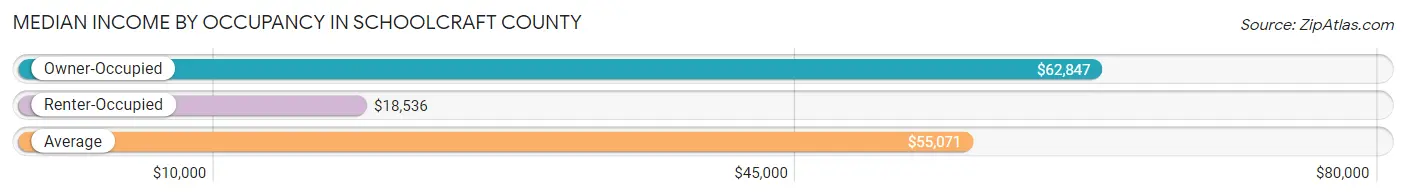
| Occupancy Type | # Households | Median Income |
| Owner-Occupied | 3,190 (84.3%) | $62,847 |
| Renter-Occupied | 595 (15.7%) | $18,536 |
| Average | 3,785 (100.0%) | $55,071 |
Occupancy by Householder Income Bracket in Schoolcraft County

| Income Bracket | Owner-occupied | Renter-occupied |
| Less than $5,000 | 70 (2.2%) | 17 (2.9%) |
| $5,000 to $9,999 | 52 (1.6%) | 21 (3.5%) |
| $10,000 to $14,999 | 81 (2.5%) | 185 (31.1%) |
| $15,000 to $19,999 | 142 (4.4%) | 95 (16.0%) |
| $20,000 to $24,999 | 137 (4.3%) | 53 (8.9%) |
| $25,000 to $34,999 | 254 (8.0%) | 78 (13.1%) |
| $35,000 to $49,999 | 504 (15.8%) | 69 (11.6%) |
| $50,000 to $74,999 | 737 (23.1%) | 38 (6.4%) |
| $75,000 to $99,999 | 437 (13.7%) | 21 (3.5%) |
| $100,000 to $149,999 | 507 (15.9%) | 18 (3.0%) |
| $150,000 or more | 269 (8.4%) | 0 (0.0%) |
| Total | 3,190 (100.0%) | 595 (100.0%) |
Monthly Housing Cost Tiers in Schoolcraft County
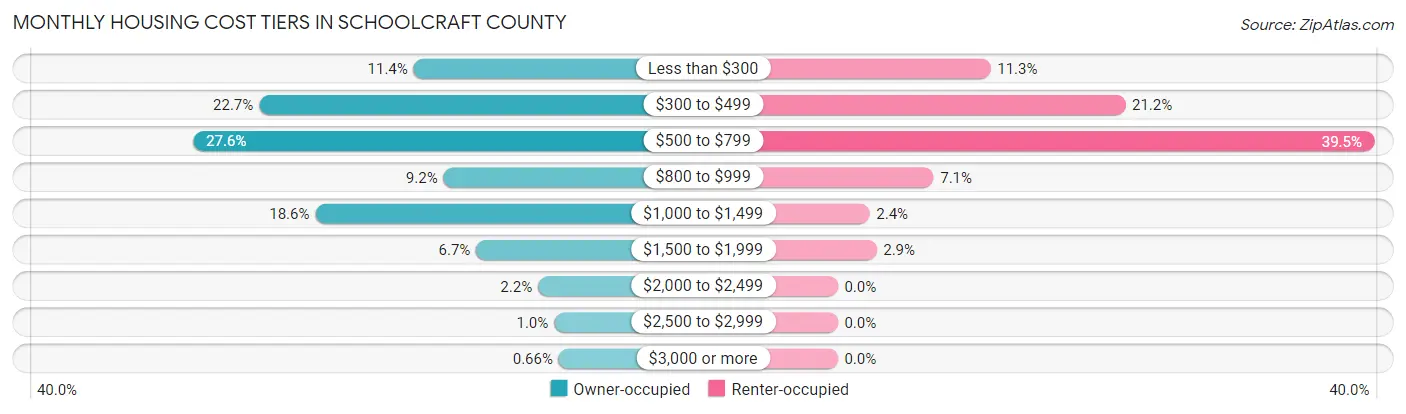
| Monthly Cost | Owner-occupied | Renter-occupied |
| Less than $300 | 362 (11.4%) | 67 (11.3%) |
| $300 to $499 | 725 (22.7%) | 126 (21.2%) |
| $500 to $799 | 880 (27.6%) | 235 (39.5%) |
| $800 to $999 | 292 (9.1%) | 42 (7.1%) |
| $1,000 to $1,499 | 593 (18.6%) | 14 (2.4%) |
| $1,500 to $1,999 | 215 (6.7%) | 17 (2.9%) |
| $2,000 to $2,499 | 70 (2.2%) | 0 (0.0%) |
| $2,500 to $2,999 | 32 (1.0%) | 0 (0.0%) |
| $3,000 or more | 21 (0.7%) | 0 (0.0%) |
| Total | 3,190 (100.0%) | 595 (100.0%) |
Physical Housing Characteristics in Schoolcraft County
Housing Structures in Schoolcraft County

| Structure Type | # Housing Units | % Housing Units |
| Single Unit, Detached | 3,260 | 86.1% |
| Single Unit, Attached | 28 | 0.7% |
| 2 Unit Apartments | 56 | 1.5% |
| 3 or 4 Unit Apartments | 69 | 1.8% |
| 5 to 9 Unit Apartments | 72 | 1.9% |
| 10 or more Apartments | 132 | 3.5% |
| Mobile Home / Other | 168 | 4.4% |
| Total | 3,785 | 100.0% |
Housing Structures by Occupancy in Schoolcraft County
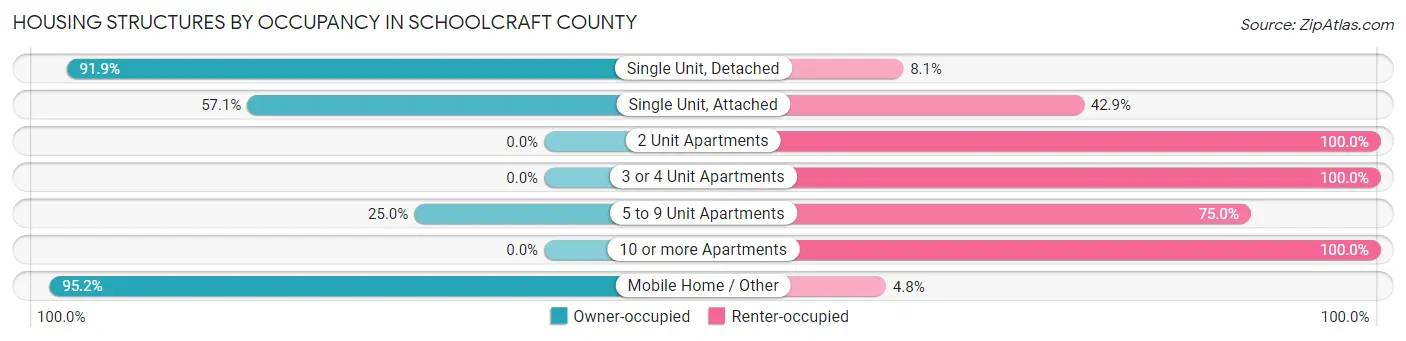
| Structure Type | Owner-occupied | Renter-occupied |
| Single Unit, Detached | 2,996 (91.9%) | 264 (8.1%) |
| Single Unit, Attached | 16 (57.1%) | 12 (42.9%) |
| 2 Unit Apartments | 0 (0.0%) | 56 (100.0%) |
| 3 or 4 Unit Apartments | 0 (0.0%) | 69 (100.0%) |
| 5 to 9 Unit Apartments | 18 (25.0%) | 54 (75.0%) |
| 10 or more Apartments | 0 (0.0%) | 132 (100.0%) |
| Mobile Home / Other | 160 (95.2%) | 8 (4.8%) |
| Total | 3,190 (84.3%) | 595 (15.7%) |
Housing Structures by Number of Rooms in Schoolcraft County

| Number of Rooms | Owner-occupied | Renter-occupied |
| 1 Room | 1 (0.0%) | 11 (1.8%) |
| 2 or 3 Rooms | 139 (4.4%) | 152 (25.6%) |
| 4 or 5 Rooms | 909 (28.5%) | 228 (38.3%) |
| 6 or 7 Rooms | 1,212 (38.0%) | 128 (21.5%) |
| 8 or more Rooms | 929 (29.1%) | 76 (12.8%) |
| Total | 3,190 (100.0%) | 595 (100.0%) |
Housing Structure by Heating Type in Schoolcraft County

| Heating Type | Owner-occupied | Renter-occupied |
| Utility Gas | 1,248 (39.1%) | 274 (46.1%) |
| Bottled, Tank, or LP Gas | 1,048 (32.9%) | 43 (7.2%) |
| Electricity | 390 (12.2%) | 223 (37.5%) |
| Fuel Oil or Kerosene | 58 (1.8%) | 15 (2.5%) |
| Coal or Coke | 0 (0.0%) | 0 (0.0%) |
| All other Fuels | 445 (14.0%) | 31 (5.2%) |
| No Fuel Used | 1 (0.0%) | 9 (1.5%) |
| Total | 3,190 (100.0%) | 595 (100.0%) |
Household Vehicle Usage in Schoolcraft County

| Vehicles per Household | Owner-occupied | Renter-occupied |
| No Vehicle | 90 (2.8%) | 189 (31.8%) |
| 1 Vehicle | 969 (30.4%) | 298 (50.1%) |
| 2 Vehicles | 1,440 (45.1%) | 95 (16.0%) |
| 3 or more Vehicles | 691 (21.7%) | 13 (2.2%) |
| Total | 3,190 (100.0%) | 595 (100.0%) |
Real Estate & Mortgages in Schoolcraft County
Real Estate and Mortgage Overview in Schoolcraft County
| Characteristic | Without Mortgage | With Mortgage |
| Housing Units | 1,694 | 1,496 |
| Median Property Value | $121,300 | $134,400 |
| Median Household Income | $50,833 | $140 |
| Monthly Housing Costs | $430 | $20 |
| Real Estate Taxes | $1,244 | $35 |
Property Value by Mortgage Status in Schoolcraft County

| Property Value | Without Mortgage | With Mortgage |
| Less than $50,000 | 313 (18.5%) | 141 (9.4%) |
| $50,000 to $99,999 | 390 (23.0%) | 410 (27.4%) |
| $100,000 to $299,999 | 748 (44.2%) | 806 (53.9%) |
| $300,000 to $499,999 | 185 (10.9%) | 97 (6.5%) |
| $500,000 to $749,999 | 51 (3.0%) | 29 (1.9%) |
| $750,000 to $999,999 | 5 (0.3%) | 11 (0.7%) |
| $1,000,000 or more | 2 (0.1%) | 2 (0.1%) |
| Total | 1,694 (100.0%) | 1,496 (100.0%) |
Household Income by Mortgage Status in Schoolcraft County
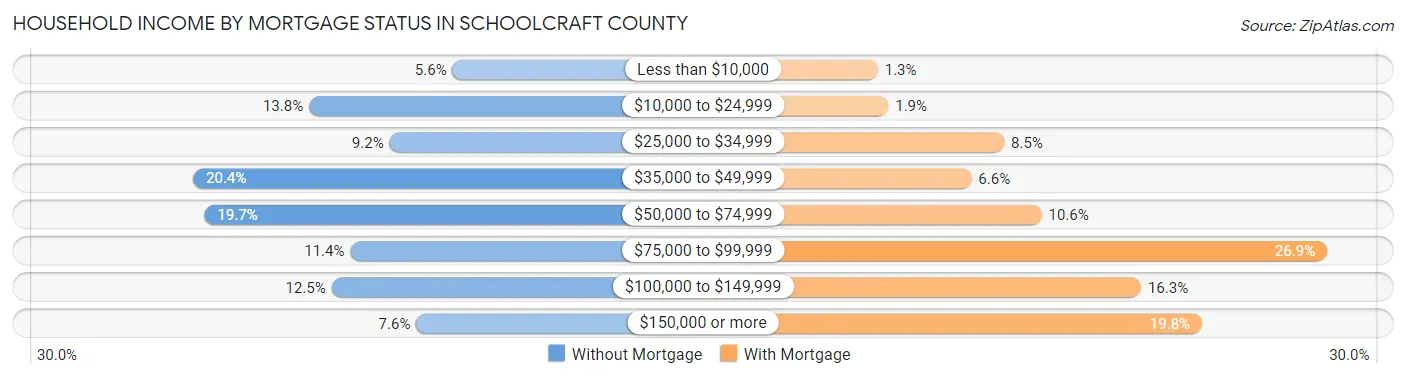
| Household Income | Without Mortgage | With Mortgage |
| Less than $10,000 | 94 (5.6%) | 19 (1.3%) |
| $10,000 to $24,999 | 233 (13.8%) | 28 (1.9%) |
| $25,000 to $34,999 | 155 (9.1%) | 127 (8.5%) |
| $35,000 to $49,999 | 345 (20.4%) | 99 (6.6%) |
| $50,000 to $74,999 | 334 (19.7%) | 159 (10.6%) |
| $75,000 to $99,999 | 193 (11.4%) | 403 (26.9%) |
| $100,000 to $149,999 | 211 (12.5%) | 244 (16.3%) |
| $150,000 or more | 129 (7.6%) | 296 (19.8%) |
| Total | 1,694 (100.0%) | 1,496 (100.0%) |
Property Value to Household Income Ratio in Schoolcraft County
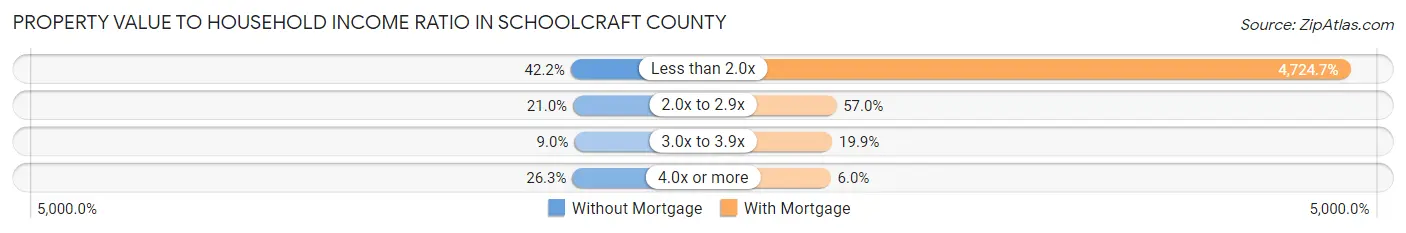
| Value-to-Income Ratio | Without Mortgage | With Mortgage |
| Less than 2.0x | 714 (42.1%) | 70,682 (4,724.7%) |
| 2.0x to 2.9x | 356 (21.0%) | 852 (57.0%) |
| 3.0x to 3.9x | 153 (9.0%) | 297 (19.9%) |
| 4.0x or more | 445 (26.3%) | 89 (5.9%) |
| Total | 1,694 (100.0%) | 1,496 (100.0%) |
Real Estate Taxes by Mortgage Status in Schoolcraft County

| Property Taxes | Without Mortgage | With Mortgage |
| Less than $800 | 439 (25.9%) | 16 (1.1%) |
| $800 to $1,499 | 605 (35.7%) | 210 (14.0%) |
| $800 to $1,499 | 621 (36.7%) | 663 (44.3%) |
| Total | 1,694 (100.0%) | 1,496 (100.0%) |
Health & Disability in Schoolcraft County
Health Insurance Coverage by Age in Schoolcraft County
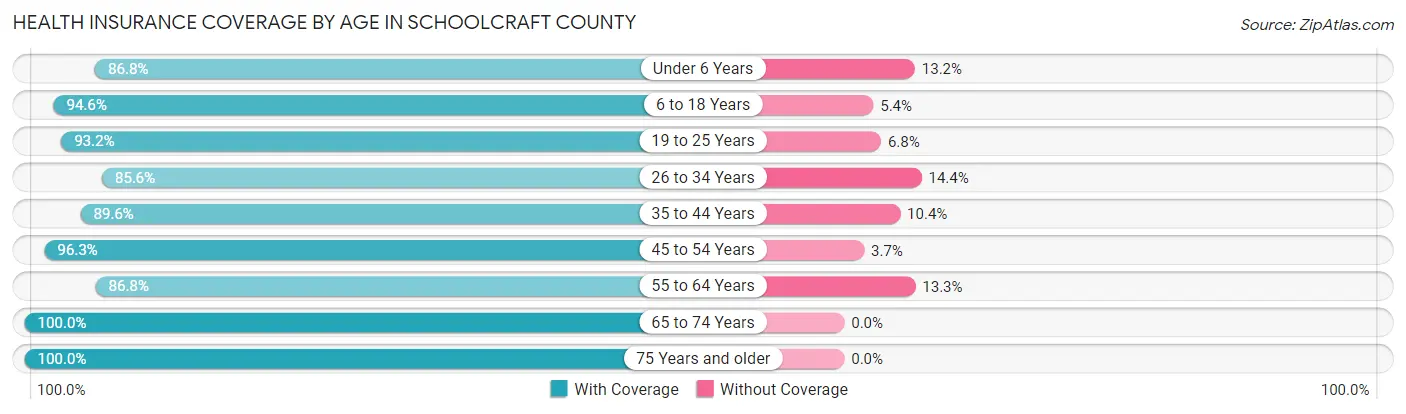
| Age Bracket | With Coverage | Without Coverage |
| Under 6 Years | 363 (86.8%) | 55 (13.2%) |
| 6 to 18 Years | 962 (94.6%) | 55 (5.4%) |
| 19 to 25 Years | 490 (93.2%) | 36 (6.8%) |
| 26 to 34 Years | 481 (85.6%) | 81 (14.4%) |
| 35 to 44 Years | 705 (89.6%) | 82 (10.4%) |
| 45 to 54 Years | 938 (96.3%) | 36 (3.7%) |
| 55 to 64 Years | 1,323 (86.8%) | 202 (13.3%) |
| 65 to 74 Years | 1,360 (100.0%) | 0 (0.0%) |
| 75 Years and older | 798 (100.0%) | 0 (0.0%) |
| Total | 7,420 (93.1%) | 547 (6.9%) |
Health Insurance Coverage by Citizenship Status in Schoolcraft County
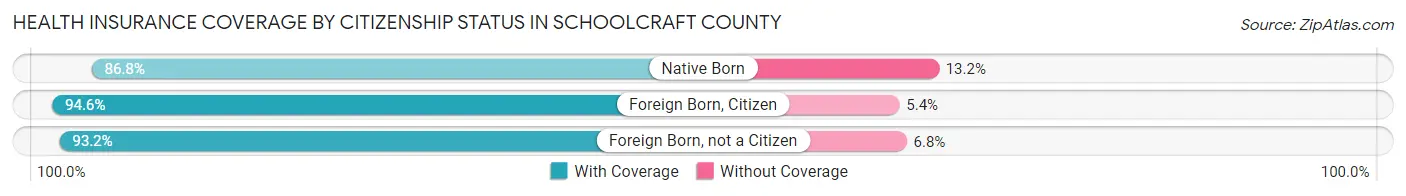
| Citizenship Status | With Coverage | Without Coverage |
| Native Born | 363 (86.8%) | 55 (13.2%) |
| Foreign Born, Citizen | 962 (94.6%) | 55 (5.4%) |
| Foreign Born, not a Citizen | 490 (93.2%) | 36 (6.8%) |
Health Insurance Coverage by Household Income in Schoolcraft County
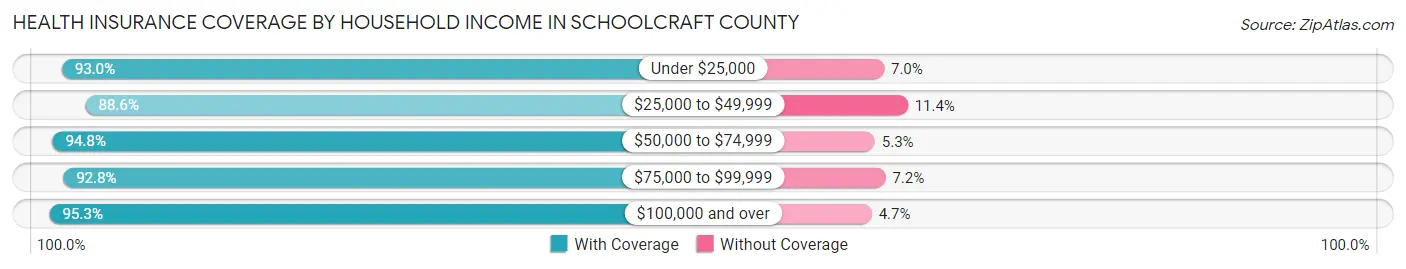
| Household Income | With Coverage | Without Coverage |
| Under $25,000 | 1,266 (93.0%) | 95 (7.0%) |
| $25,000 to $49,999 | 1,366 (88.6%) | 176 (11.4%) |
| $50,000 to $74,999 | 1,642 (94.8%) | 91 (5.2%) |
| $75,000 to $99,999 | 961 (92.8%) | 75 (7.2%) |
| $100,000 and over | 2,142 (95.3%) | 105 (4.7%) |
Public vs Private Health Insurance Coverage by Age in Schoolcraft County

| Age Bracket | Public Insurance | Private Insurance |
| Under 6 | 247 (59.1%) | 221 (52.9%) |
| 6 to 18 Years | 449 (44.2%) | 602 (59.2%) |
| 19 to 25 Years | 266 (50.6%) | 280 (53.2%) |
| 25 to 34 Years | 264 (47.0%) | 269 (47.9%) |
| 35 to 44 Years | 353 (44.9%) | 378 (48.0%) |
| 45 to 54 Years | 221 (22.7%) | 747 (76.7%) |
| 55 to 64 Years | 459 (30.1%) | 956 (62.7%) |
| 65 to 74 Years | 1,342 (98.7%) | 929 (68.3%) |
| 75 Years and over | 793 (99.4%) | 637 (79.8%) |
| Total | 4,394 (55.1%) | 5,019 (63.0%) |
Disability Status by Sex by Age in Schoolcraft County
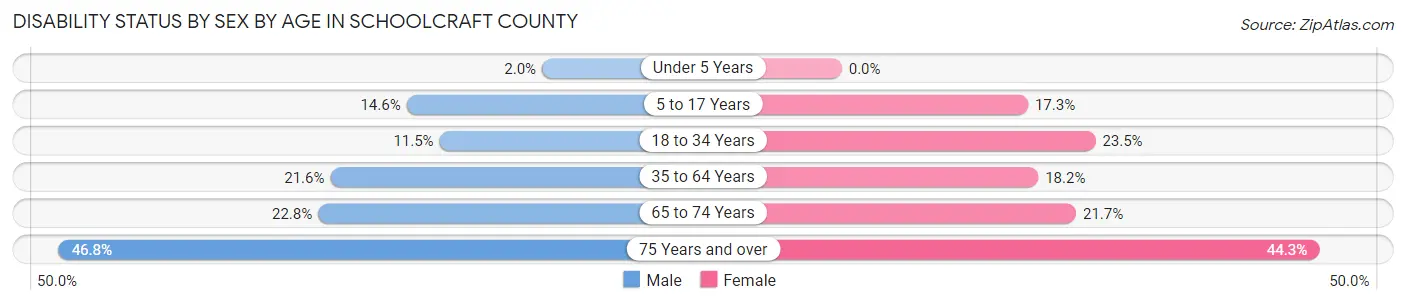
| Age Bracket | Male | Female |
| Under 5 Years | 3 (2.0%) | 0 (0.0%) |
| 5 to 17 Years | 82 (14.6%) | 85 (17.3%) |
| 18 to 34 Years | 66 (11.5%) | 129 (23.5%) |
| 35 to 64 Years | 350 (21.6%) | 304 (18.2%) |
| 65 to 74 Years | 163 (22.8%) | 140 (21.7%) |
| 75 Years and over | 177 (46.8%) | 186 (44.3%) |
Disability Class by Sex by Age in Schoolcraft County
Disability Class: Hearing Difficulty
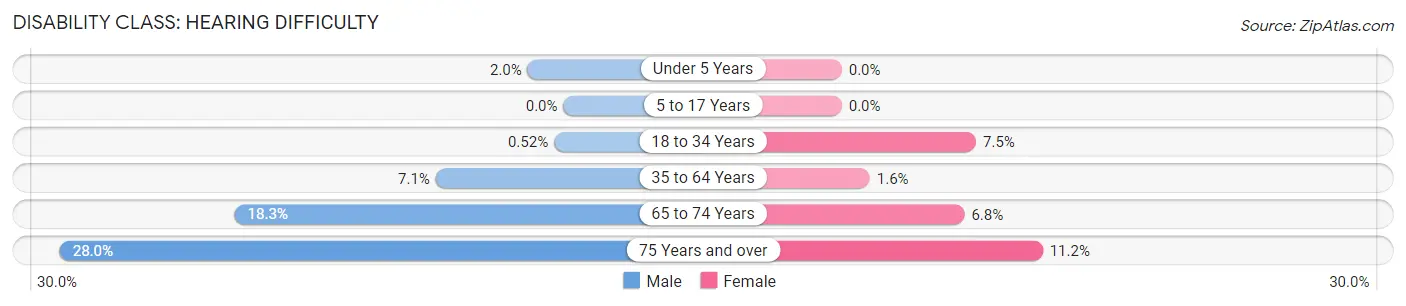
| Age Bracket | Male | Female |
| Under 5 Years | 3 (2.0%) | 0 (0.0%) |
| 5 to 17 Years | 0 (0.0%) | 0 (0.0%) |
| 18 to 34 Years | 3 (0.5%) | 41 (7.5%) |
| 35 to 64 Years | 115 (7.1%) | 26 (1.6%) |
| 65 to 74 Years | 131 (18.3%) | 44 (6.8%) |
| 75 Years and over | 106 (28.0%) | 47 (11.2%) |
Disability Class: Vision Difficulty
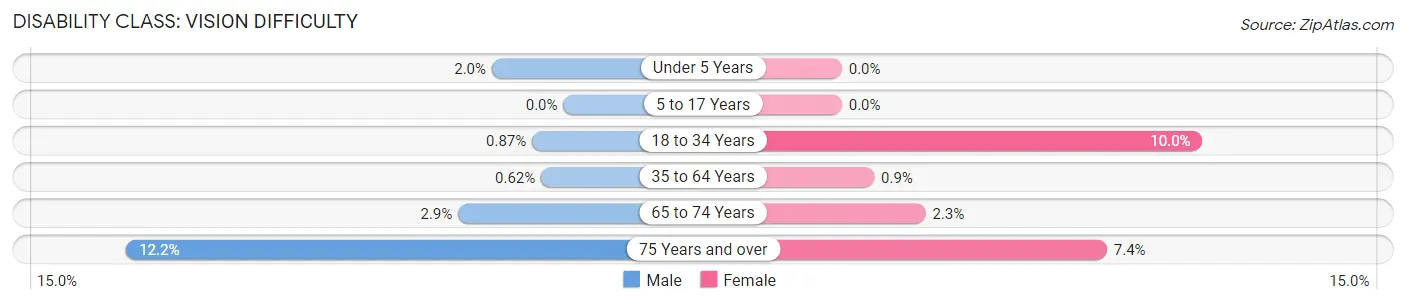
| Age Bracket | Male | Female |
| Under 5 Years | 3 (2.0%) | 0 (0.0%) |
| 5 to 17 Years | 0 (0.0%) | 0 (0.0%) |
| 18 to 34 Years | 5 (0.9%) | 55 (10.0%) |
| 35 to 64 Years | 10 (0.6%) | 15 (0.9%) |
| 65 to 74 Years | 21 (2.9%) | 15 (2.3%) |
| 75 Years and over | 46 (12.2%) | 31 (7.4%) |
Disability Class: Cognitive Difficulty
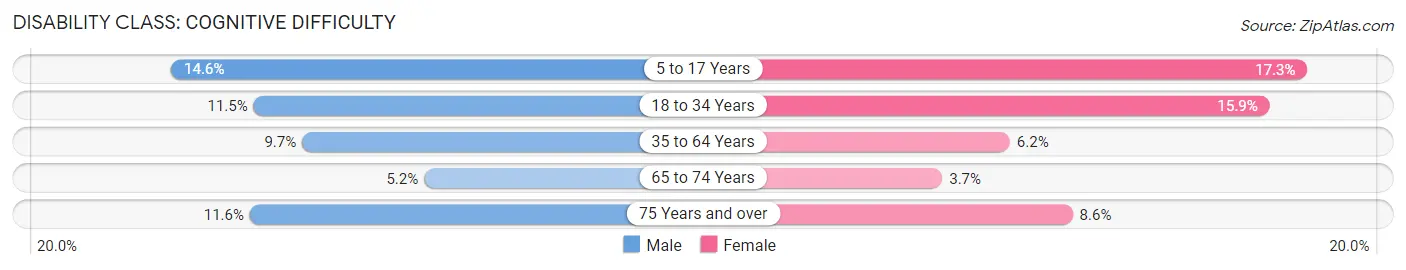
| Age Bracket | Male | Female |
| 5 to 17 Years | 82 (14.6%) | 85 (17.3%) |
| 18 to 34 Years | 66 (11.5%) | 87 (15.9%) |
| 35 to 64 Years | 157 (9.7%) | 104 (6.2%) |
| 65 to 74 Years | 37 (5.2%) | 24 (3.7%) |
| 75 Years and over | 44 (11.6%) | 36 (8.6%) |
Disability Class: Ambulatory Difficulty
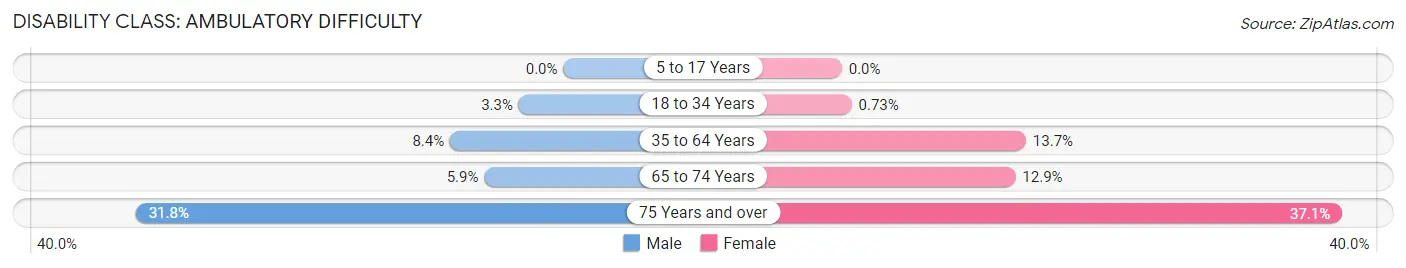
| Age Bracket | Male | Female |
| 5 to 17 Years | 0 (0.0%) | 0 (0.0%) |
| 18 to 34 Years | 19 (3.3%) | 4 (0.7%) |
| 35 to 64 Years | 136 (8.4%) | 228 (13.7%) |
| 65 to 74 Years | 42 (5.9%) | 83 (12.9%) |
| 75 Years and over | 120 (31.8%) | 156 (37.1%) |
Disability Class: Self-Care Difficulty
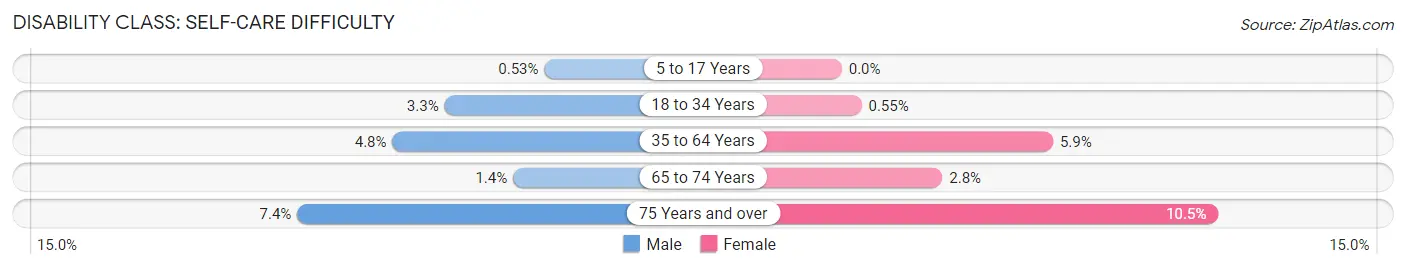
| Age Bracket | Male | Female |
| 5 to 17 Years | 3 (0.5%) | 0 (0.0%) |
| 18 to 34 Years | 19 (3.3%) | 3 (0.5%) |
| 35 to 64 Years | 77 (4.8%) | 98 (5.9%) |
| 65 to 74 Years | 10 (1.4%) | 18 (2.8%) |
| 75 Years and over | 28 (7.4%) | 44 (10.5%) |
Technology Access in Schoolcraft County
Computing Device Access in Schoolcraft County
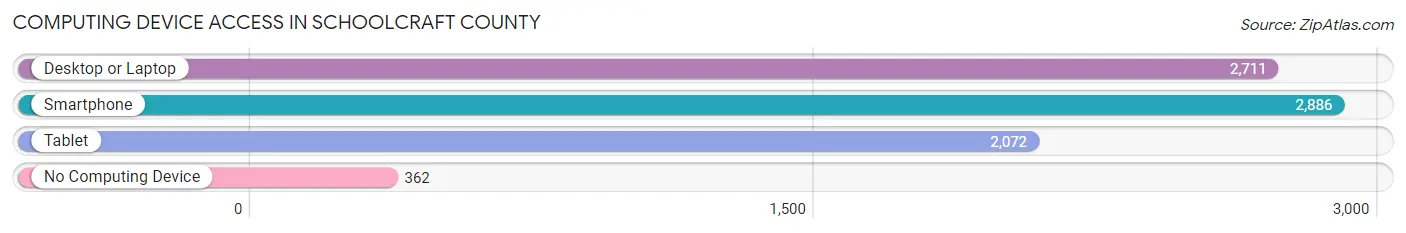
| Device Type | # Households | % Households |
| Desktop or Laptop | 2,711 | 71.6% |
| Smartphone | 2,886 | 76.2% |
| Tablet | 2,072 | 54.7% |
| No Computing Device | 362 | 9.6% |
| Total | 3,785 | 100.0% |
Internet Access in Schoolcraft County
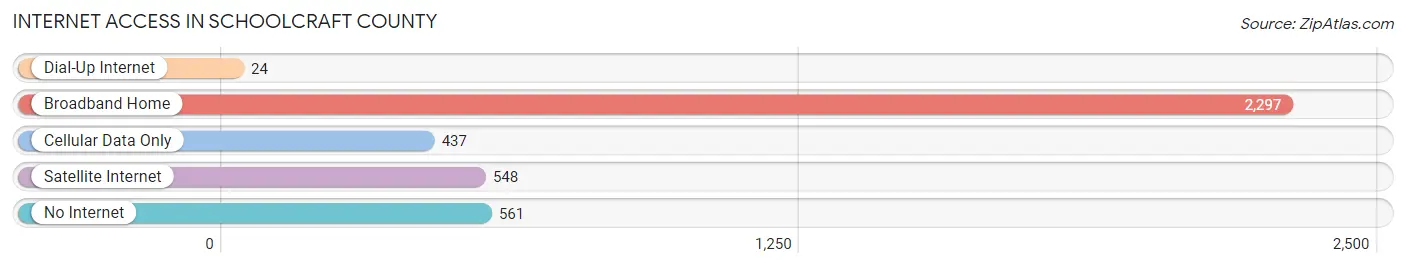
| Internet Type | # Households | % Households |
| Dial-Up Internet | 24 | 0.6% |
| Broadband Home | 2,297 | 60.7% |
| Cellular Data Only | 437 | 11.6% |
| Satellite Internet | 548 | 14.5% |
| No Internet | 561 | 14.8% |
| Total | 3,785 | 100.0% |
Schoolcraft County Summary
History
Located in the Upper Peninsula of Michigan, Schoolcraft County was established in 1843 and named after Henry Schoolcraft, an explorer and geographer who was instrumental in the development of the area. The county was originally part of Mackinac County, but was split off in 1843. The county seat is Manistique, which was founded in 1871.
The area was first inhabited by the Ojibwe people, who were the original inhabitants of the Upper Peninsula. The Ojibwe were a nomadic people who lived off the land, hunting and fishing. They were also known for their beadwork and basketry.
The first European settlers arrived in the area in the early 1800s. These settlers were mostly French-Canadian fur traders and trappers. They were followed by lumberjacks and miners, who came to the area to take advantage of the abundant natural resources.
The county was officially organized in 1843 and the first county seat was located in Seney. In 1871, the county seat was moved to Manistique.
Geography
Schoolcraft County is located in the Upper Peninsula of Michigan. It is bordered by Mackinac County to the north, Delta County to the east, Alger County to the south, and Marquette County to the west. The county covers an area of 1,845 square miles and is the second largest county in Michigan.
The terrain of the county is mostly flat, with some rolling hills. The highest point in the county is located in the northwest corner, at an elevation of 1,845 feet. The county is home to several rivers, including the Manistique River, the Escanaba River, and the Fox River.
The county is home to several state parks, including Hiawatha National Forest, Seney National Wildlife Refuge, and Pictured Rocks National Lakeshore.
Economy
Schoolcraft County has a diverse economy, with a mix of industries including manufacturing, tourism, agriculture, and forestry.
Manufacturing is the largest sector of the economy, accounting for about 25% of the county’s total employment. The largest employers in the county are Manistique Papers, Inc., a paper mill, and Manistique Foundry, a metal fabrication plant.
Tourism is also an important part of the economy, with visitors coming to the area to enjoy the natural beauty of the county. The county is home to several state parks, including Hiawatha National Forest, Seney National Wildlife Refuge, and Pictured Rocks National Lakeshore.
Agriculture is also an important part of the economy, with the county’s main crops being potatoes, corn, and hay. The county is also home to several dairy farms.
Finally, forestry is an important part of the economy, with the county’s forests providing timber for the lumber industry.
Demographics
As of the 2010 census, the population of Schoolcraft County was 8,485. The population has remained relatively stable over the past decade, with a slight decrease of 0.3% since 2000.
The racial makeup of the county is 97.2% White, 0.7% Native American, 0.3% Asian, 0.2% Black or African American, 0.1% Pacific Islander, and 1.5% from two or more races. The median age of the population is 44.7 years.
The median household income in the county is $41,945, and the median family income is $50,945. The per capita income is $21,945. The poverty rate is 13.2%.
Common Questions
What is the Total Population of Schoolcraft County?
Total Population of Schoolcraft County is 8,062.
What is the Total Male Population of Schoolcraft County?
Total Male Population of Schoolcraft County is 4,044.
What is the Total Female Population of Schoolcraft County?
Total Female Population of Schoolcraft County is 4,018.
What is the Ratio of Males per 100 Females in Schoolcraft County?
There are 100.65 Males per 100 Females in Schoolcraft County.
What is the Ratio of Females per 100 Males in Schoolcraft County?
There are 99.36 Females per 100 Males in Schoolcraft County.
What is the Median Population Age in Schoolcraft County?
Median Population Age in Schoolcraft County is 51.8 Years.
What is the Average Family Size in Schoolcraft County
Average Family Size in Schoolcraft County is 2.6 People.
What is the Average Household Size in Schoolcraft County
Average Household Size in Schoolcraft County is 2.1 People.
What is Per Capita Income in Schoolcraft County?
Per Capita income in Schoolcraft County is $33,805.
What is the Median Family Income in Schoolcraft County?
Median Family Income in Schoolcraft County is $71,250.
What is the Median Household income in Schoolcraft County?
Median Household Income in Schoolcraft County is $55,071.
What is Income or Wage Gap in Schoolcraft County?
Income or Wage Gap in Schoolcraft County is 44.4%.
Women in Schoolcraft County earn 55.6 cents for every dollar earned by a man.
What is Family Income Deficit in Schoolcraft County?
Family Income Deficit in Schoolcraft County is $9,903.
Families that are below poverty line in Schoolcraft County earn $9,903 less on average than the poverty threshold level.
What is Inequality or Gini Index in Schoolcraft County?
Inequality or Gini Index in Schoolcraft County is 0.46.
How Large is the Labor Force in Schoolcraft County?
There are 3,462 People in the Labor Forcein in Schoolcraft County.
What is the Percentage of People in the Labor Force in Schoolcraft County?
50.7% of People are in the Labor Force in Schoolcraft County.
What is the Unemployment Rate in Schoolcraft County?
Unemployment Rate in Schoolcraft County is 7.9%.