Saginaw County, MI
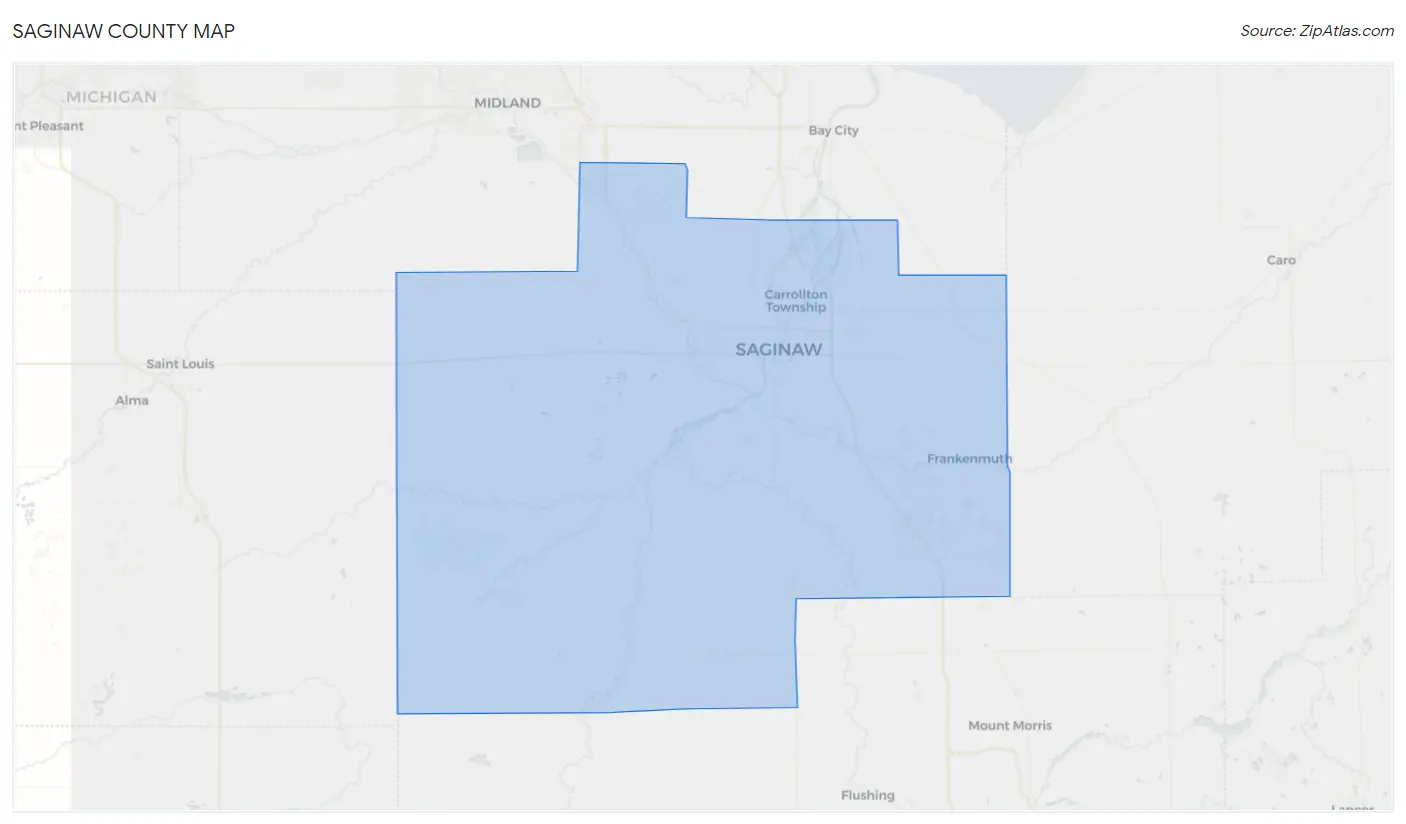
Saginaw County Map
Saginaw County Overview
189,821
TOTAL POPULATION
92,665
MALE POPULATION
97,156
FEMALE POPULATION
95.38
MALES / 100 FEMALES
104.85
FEMALES / 100 MALES
41.0
MEDIAN AGE
2.9
AVG FAMILY SIZE
2.4
AVG HOUSEHOLD SIZE
$32,839
PER CAPITA INCOME
$71,728
AVG FAMILY INCOME
$56,579
AVG HOUSEHOLD INCOME
31.0%
WAGE / INCOME GAP [ % ]
69.0¢/ $1
WAGE / INCOME GAP [ $ ]
$11,648
FAMILY INCOME DEFICIT
0.47
INEQUALITY / GINI INDEX
87,356
LABOR FORCE [ PEOPLE ]
56.6%
PERCENT IN LABOR FORCE
6.6%
UNEMPLOYMENT RATE
Saginaw County Area Codes
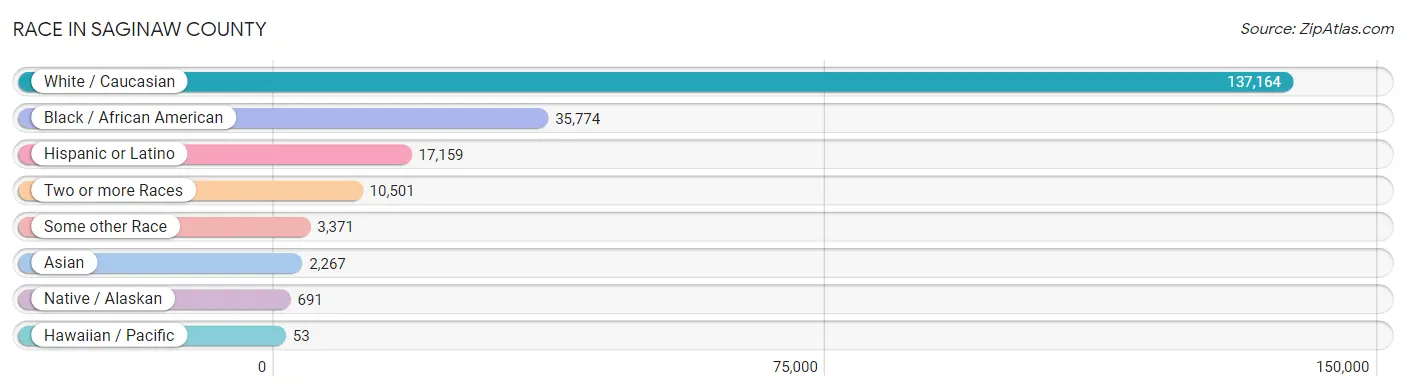
Race in Saginaw County
The most populous races in Saginaw County are White / Caucasian (137,164 | 72.3%), Black / African American (35,774 | 18.9%), and Hispanic or Latino (17,159 | 9.0%).
| Race | # Population | % Population |
| Asian | 2,267 | 1.2% |
| Black / African American | 35,774 | 18.9% |
| Hawaiian / Pacific | 53 | 0.0% |
| Hispanic or Latino | 17,159 | 9.0% |
| Native / Alaskan | 691 | 0.4% |
| White / Caucasian | 137,164 | 72.3% |
| Two or more Races | 10,501 | 5.5% |
| Some other Race | 3,371 | 1.8% |
| Total | 189,821 | 100.0% |
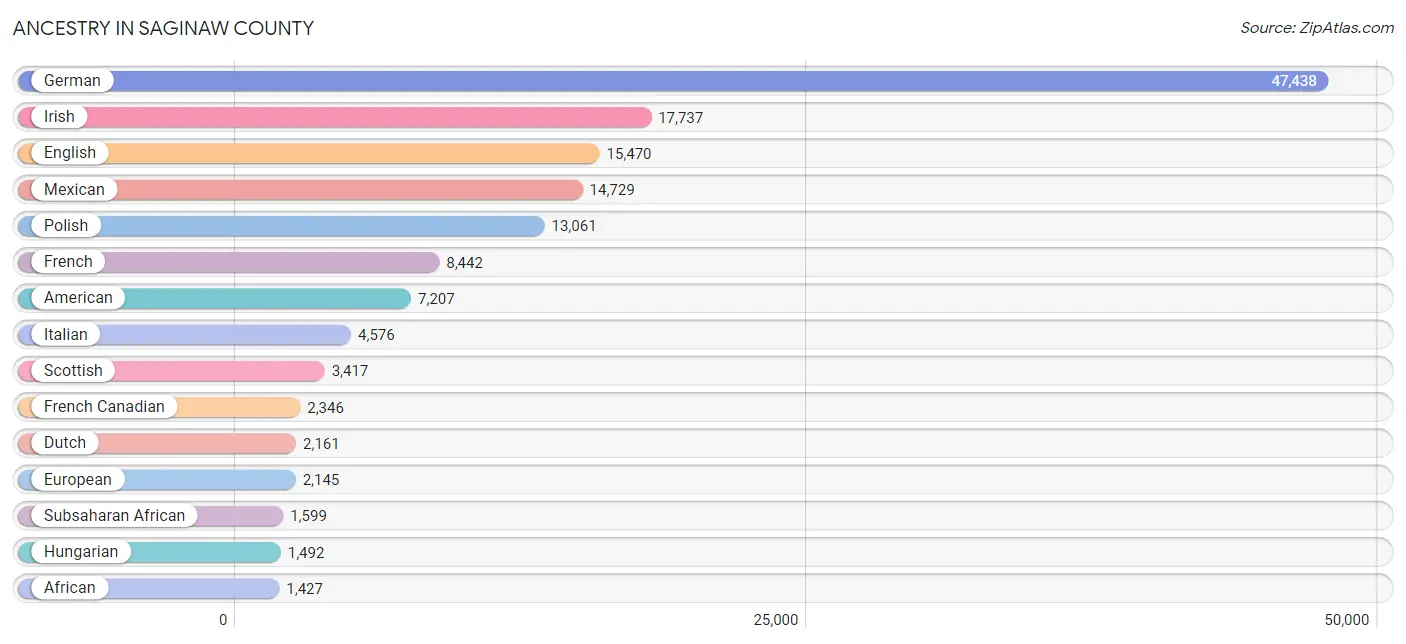
Ancestry in Saginaw County
The most populous ancestries reported in Saginaw County are German (47,438 | 25.0%), Irish (17,737 | 9.3%), English (15,470 | 8.2%), Mexican (14,729 | 7.8%), and Polish (13,061 | 6.9%), together accounting for 57.1% of all Saginaw County residents.
| Ancestry | # Population | % Population |
| African | 1,427 | 0.7% |
| Albanian | 15 | 0.0% |
| American | 7,207 | 3.8% |
| Apache | 10 | 0.0% |
| Arab | 1,371 | 0.7% |
| Armenian | 88 | 0.1% |
| Assyrian / Chaldean / Syriac | 23 | 0.0% |
| Australian | 82 | 0.0% |
| Austrian | 211 | 0.1% |
| Bangladeshi | 30 | 0.0% |
| Basque | 61 | 0.0% |
| Belgian | 442 | 0.2% |
| Bhutanese | 179 | 0.1% |
| Blackfeet | 172 | 0.1% |
| Brazilian | 47 | 0.0% |
| British | 506 | 0.3% |
| British West Indian | 34 | 0.0% |
| Burmese | 166 | 0.1% |
| Cajun | 37 | 0.0% |
| Canadian | 330 | 0.2% |
| Cape Verdean | 37 | 0.0% |
| Carpatho Rusyn | 18 | 0.0% |
| Celtic | 107 | 0.1% |
| Central American | 96 | 0.1% |
| Central American Indian | 56 | 0.0% |
| Cherokee | 322 | 0.2% |
| Chilean | 35 | 0.0% |
| Chippewa | 437 | 0.2% |
| Choctaw | 4 | 0.0% |
| Colombian | 158 | 0.1% |
| Comanche | 2 | 0.0% |
| Creek | 3 | 0.0% |
| Croatian | 170 | 0.1% |
| Cuban | 238 | 0.1% |
| Czech | 1,240 | 0.6% |
| Czechoslovakian | 346 | 0.2% |
| Danish | 294 | 0.2% |
| Dominican | 109 | 0.1% |
| Dutch | 2,161 | 1.1% |
| Eastern European | 277 | 0.2% |
| Egyptian | 15 | 0.0% |
| English | 15,470 | 8.2% |
| Estonian | 13 | 0.0% |
| Ethiopian | 5 | 0.0% |
| European | 2,145 | 1.1% |
| Filipino | 5 | 0.0% |
| Finnish | 493 | 0.3% |
| French | 8,442 | 4.4% |
| French American Indian | 159 | 0.1% |
| French Canadian | 2,346 | 1.2% |
| German | 47,438 | 25.0% |
| German Russian | 2 | 0.0% |
| Greek | 527 | 0.3% |
| Guamanian / Chamorro | 18 | 0.0% |
| Guatemalan | 64 | 0.0% |
| Guyanese | 40 | 0.0% |
| Haitian | 26 | 0.0% |
| Honduran | 5 | 0.0% |
| Hungarian | 1,492 | 0.8% |
| Indian (Asian) | 353 | 0.2% |
| Iranian | 161 | 0.1% |
| Iraqi | 76 | 0.0% |
| Irish | 17,737 | 9.3% |
| Iroquois | 2 | 0.0% |
| Israeli | 27 | 0.0% |
| Italian | 4,576 | 2.4% |
| Japanese | 1 | 0.0% |
| Jordanian | 22 | 0.0% |
| Kenyan | 35 | 0.0% |
| Kiowa | 6 | 0.0% |
| Korean | 541 | 0.3% |
| Latvian | 53 | 0.0% |
| Lebanese | 372 | 0.2% |
| Lithuanian | 385 | 0.2% |
| Lumbee | 31 | 0.0% |
| Luxembourger | 5 | 0.0% |
| Macedonian | 4 | 0.0% |
| Malaysian | 11 | 0.0% |
| Maltese | 28 | 0.0% |
| Mexican | 14,729 | 7.8% |
| Mexican American Indian | 65 | 0.0% |
| Mongolian | 12 | 0.0% |
| Moroccan | 27 | 0.0% |
| Native Hawaiian | 33 | 0.0% |
| Navajo | 11 | 0.0% |
| Nigerian | 48 | 0.0% |
| Northern European | 216 | 0.1% |
| Norwegian | 893 | 0.5% |
| Ottawa | 107 | 0.1% |
| Pakistani | 13 | 0.0% |
| Palestinian | 35 | 0.0% |
| Panamanian | 7 | 0.0% |
| Paraguayan | 10 | 0.0% |
| Pennsylvania German | 34 | 0.0% |
| Peruvian | 141 | 0.1% |
| Polish | 13,061 | 6.9% |
| Portuguese | 46 | 0.0% |
| Potawatomi | 27 | 0.0% |
| Puerto Rican | 668 | 0.4% |
| Romanian | 84 | 0.0% |
| Russian | 1,044 | 0.5% |
| Salvadoran | 20 | 0.0% |
| Scandinavian | 459 | 0.2% |
| Scotch-Irish | 1,212 | 0.6% |
| Scottish | 3,417 | 1.8% |
| Senegalese | 18 | 0.0% |
| Serbian | 37 | 0.0% |
| Sioux | 16 | 0.0% |
| Slavic | 49 | 0.0% |
| Slovak | 389 | 0.2% |
| Slovene | 58 | 0.0% |
| South African | 6 | 0.0% |
| South American | 371 | 0.2% |
| South American Indian | 1 | 0.0% |
| Spaniard | 253 | 0.1% |
| Spanish | 130 | 0.1% |
| Sri Lankan | 412 | 0.2% |
| Subsaharan African | 1,599 | 0.8% |
| Sudanese | 4 | 0.0% |
| Swedish | 836 | 0.4% |
| Swiss | 442 | 0.2% |
| Syrian | 106 | 0.1% |
| Thai | 915 | 0.5% |
| Ukrainian | 215 | 0.1% |
| Venezuelan | 27 | 0.0% |
| Welsh | 1,099 | 0.6% |
| West Indian | 207 | 0.1% |
| Yaqui | 6 | 0.0% |
| Yugoslavian | 64 | 0.0% | View All 129 Rows |
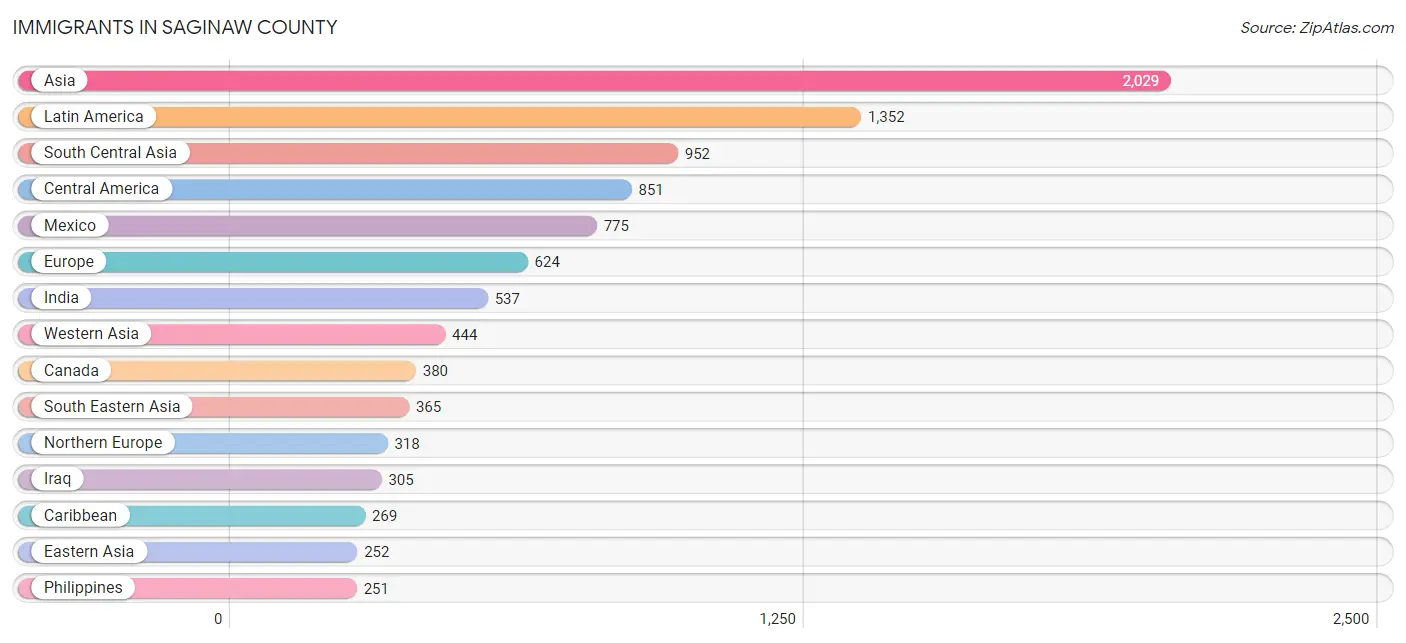
Immigrants in Saginaw County
The most numerous immigrant groups reported in Saginaw County came from Asia (2,029 | 1.1%), Latin America (1,352 | 0.7%), South Central Asia (952 | 0.5%), Central America (851 | 0.4%), and Mexico (775 | 0.4%), together accounting for 3.1% of all Saginaw County residents.
| Immigration Origin | # Population | % Population |
| Africa | 96 | 0.1% |
| Asia | 2,029 | 1.1% |
| Australia | 28 | 0.0% |
| Bangladesh | 12 | 0.0% |
| Brazil | 53 | 0.0% |
| Bulgaria | 15 | 0.0% |
| Cambodia | 1 | 0.0% |
| Canada | 380 | 0.2% |
| Caribbean | 269 | 0.1% |
| Central America | 851 | 0.4% |
| Chile | 4 | 0.0% |
| China | 140 | 0.1% |
| Colombia | 60 | 0.0% |
| Cuba | 222 | 0.1% |
| Eastern Africa | 58 | 0.0% |
| Eastern Asia | 252 | 0.1% |
| Eastern Europe | 148 | 0.1% |
| El Salvador | 7 | 0.0% |
| England | 211 | 0.1% |
| Europe | 624 | 0.3% |
| France | 10 | 0.0% |
| Germany | 121 | 0.1% |
| Greece | 10 | 0.0% |
| Guatemala | 64 | 0.0% |
| Guyana | 66 | 0.0% |
| Honduras | 5 | 0.0% |
| India | 537 | 0.3% |
| Iran | 210 | 0.1% |
| Iraq | 305 | 0.2% |
| Israel | 3 | 0.0% |
| Italy | 8 | 0.0% |
| Jamaica | 13 | 0.0% |
| Japan | 4 | 0.0% |
| Kazakhstan | 6 | 0.0% |
| Kenya | 58 | 0.0% |
| Korea | 108 | 0.1% |
| Kuwait | 36 | 0.0% |
| Laos | 11 | 0.0% |
| Latin America | 1,352 | 0.7% |
| Latvia | 38 | 0.0% |
| Lebanon | 29 | 0.0% |
| Malaysia | 32 | 0.0% |
| Mexico | 775 | 0.4% |
| Nigeria | 21 | 0.0% |
| Northern Europe | 318 | 0.2% |
| Oceania | 28 | 0.0% |
| Pakistan | 187 | 0.1% |
| Peru | 2 | 0.0% |
| Philippines | 251 | 0.1% |
| Poland | 9 | 0.0% |
| Romania | 19 | 0.0% |
| Russia | 48 | 0.0% |
| Saudi Arabia | 66 | 0.0% |
| Senegal | 10 | 0.0% |
| South Africa | 7 | 0.0% |
| South America | 232 | 0.1% |
| South Central Asia | 952 | 0.5% |
| South Eastern Asia | 365 | 0.2% |
| Southern Europe | 18 | 0.0% |
| St. Vincent and the Grenadines | 15 | 0.0% |
| Sweden | 81 | 0.0% |
| Switzerland | 9 | 0.0% |
| Syria | 5 | 0.0% |
| Taiwan | 5 | 0.0% |
| Thailand | 15 | 0.0% |
| Ukraine | 13 | 0.0% |
| Venezuela | 23 | 0.0% |
| Vietnam | 55 | 0.0% |
| Western Africa | 31 | 0.0% |
| Western Asia | 444 | 0.2% |
| Western Europe | 140 | 0.1% | View All 71 Rows |
Sex and Age in Saginaw County
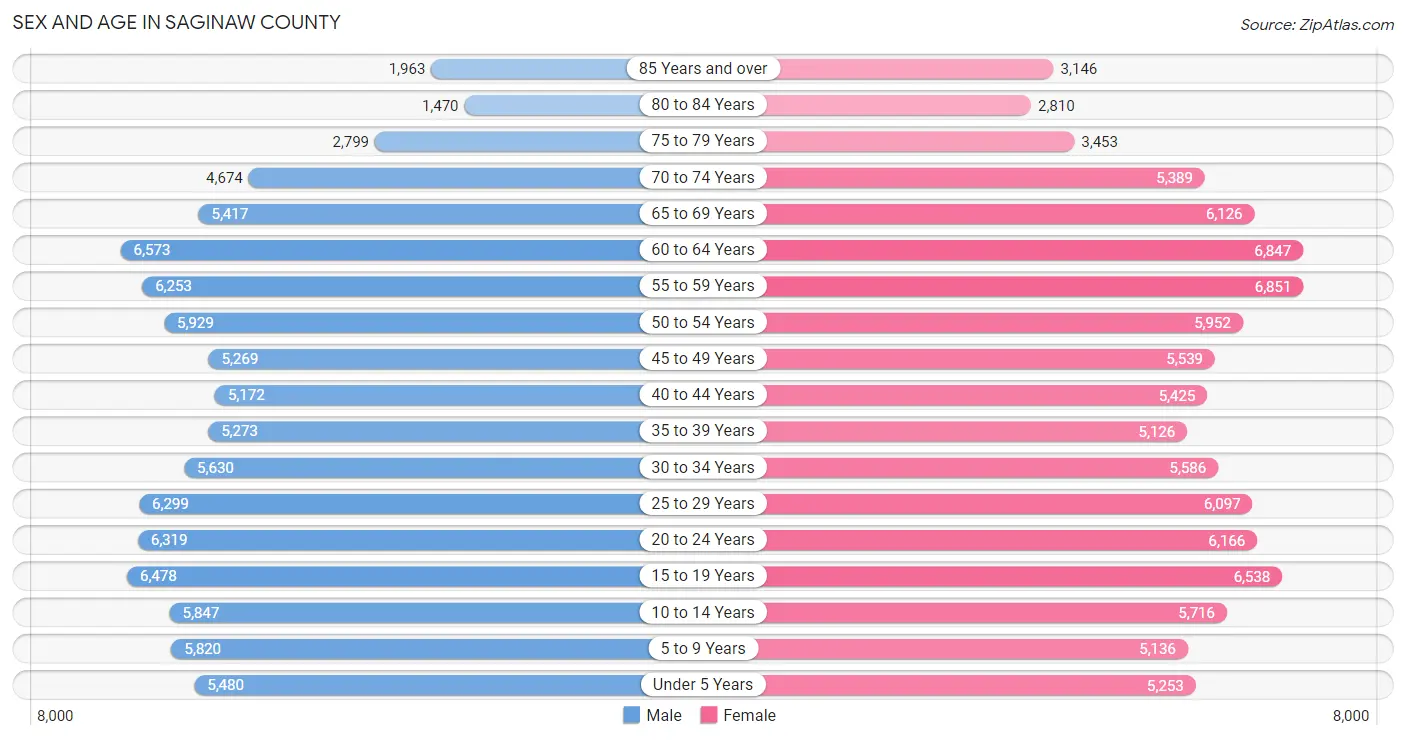
Sex and Age in Saginaw County
The most populous age groups in Saginaw County are 60 to 64 Years (6,573 | 7.1%) for men and 55 to 59 Years (6,851 | 7.0%) for women.
| Age Bracket | Male | Female |
| Under 5 Years | 5,480 (5.9%) | 5,253 (5.4%) |
| 5 to 9 Years | 5,820 (6.3%) | 5,136 (5.3%) |
| 10 to 14 Years | 5,847 (6.3%) | 5,716 (5.9%) |
| 15 to 19 Years | 6,478 (7.0%) | 6,538 (6.7%) |
| 20 to 24 Years | 6,319 (6.8%) | 6,166 (6.4%) |
| 25 to 29 Years | 6,299 (6.8%) | 6,097 (6.3%) |
| 30 to 34 Years | 5,630 (6.1%) | 5,586 (5.8%) |
| 35 to 39 Years | 5,273 (5.7%) | 5,126 (5.3%) |
| 40 to 44 Years | 5,172 (5.6%) | 5,425 (5.6%) |
| 45 to 49 Years | 5,269 (5.7%) | 5,539 (5.7%) |
| 50 to 54 Years | 5,929 (6.4%) | 5,952 (6.1%) |
| 55 to 59 Years | 6,253 (6.8%) | 6,851 (7.0%) |
| 60 to 64 Years | 6,573 (7.1%) | 6,847 (7.0%) |
| 65 to 69 Years | 5,417 (5.9%) | 6,126 (6.3%) |
| 70 to 74 Years | 4,674 (5.0%) | 5,389 (5.6%) |
| 75 to 79 Years | 2,799 (3.0%) | 3,453 (3.5%) |
| 80 to 84 Years | 1,470 (1.6%) | 2,810 (2.9%) |
| 85 Years and over | 1,963 (2.1%) | 3,146 (3.2%) |
| Total | 92,665 (100.0%) | 97,156 (100.0%) |
Families and Households in Saginaw County
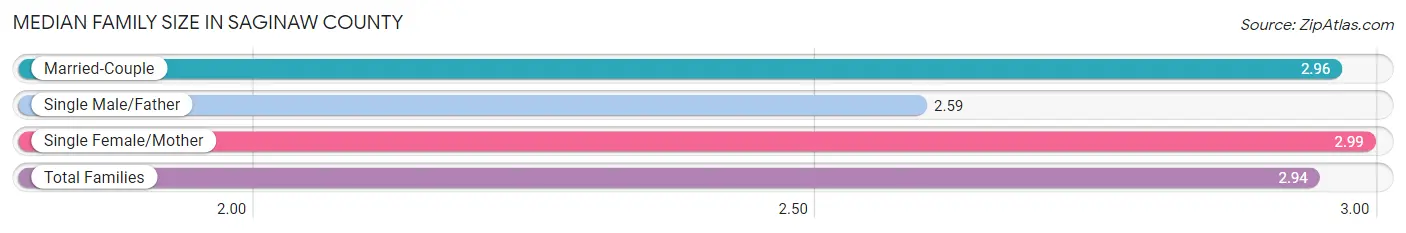
Median Family Size in Saginaw County
The median family size in Saginaw County is 2.94 persons per family, with single female/mother families (11,546 | 23.9%) accounting for the largest median family size of 2.99 persons per family. On the other hand, single male/father families (3,495 | 7.2%) represent the smallest median family size with 2.59 persons per family.
| Family Type | # Families | Family Size |
| Married-Couple | 33,323 (68.9%) | 2.96 |
| Single Male/Father | 3,495 (7.2%) | 2.59 |
| Single Female/Mother | 11,546 (23.9%) | 2.99 |
| Total Families | 48,364 (100.0%) | 2.94 |
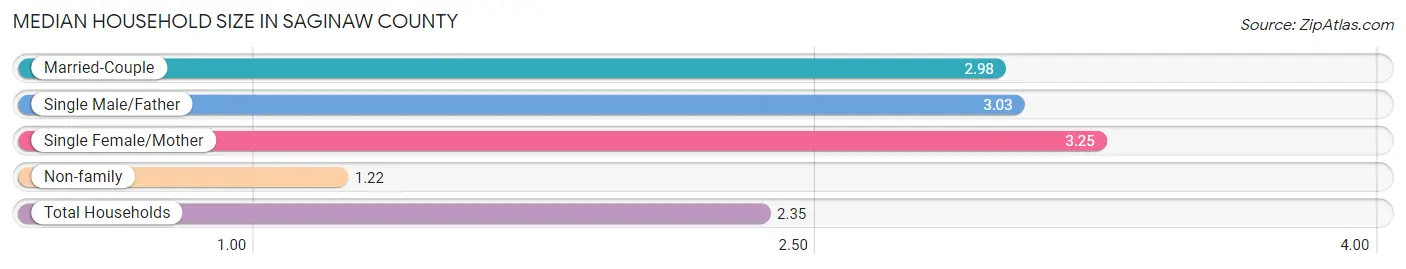
Median Household Size in Saginaw County
The median household size in Saginaw County is 2.35 persons per household, with single female/mother households (11,546 | 14.8%) accounting for the largest median household size of 3.25 persons per household. non-family households (29,636 | 38.0%) represent the smallest median household size with 1.22 persons per household.
| Household Type | # Households | Household Size |
| Married-Couple | 33,323 (42.7%) | 2.98 |
| Single Male/Father | 3,495 (4.5%) | 3.03 |
| Single Female/Mother | 11,546 (14.8%) | 3.25 |
| Non-family | 29,636 (38.0%) | 1.22 |
| Total Households | 78,000 (100.0%) | 2.35 |
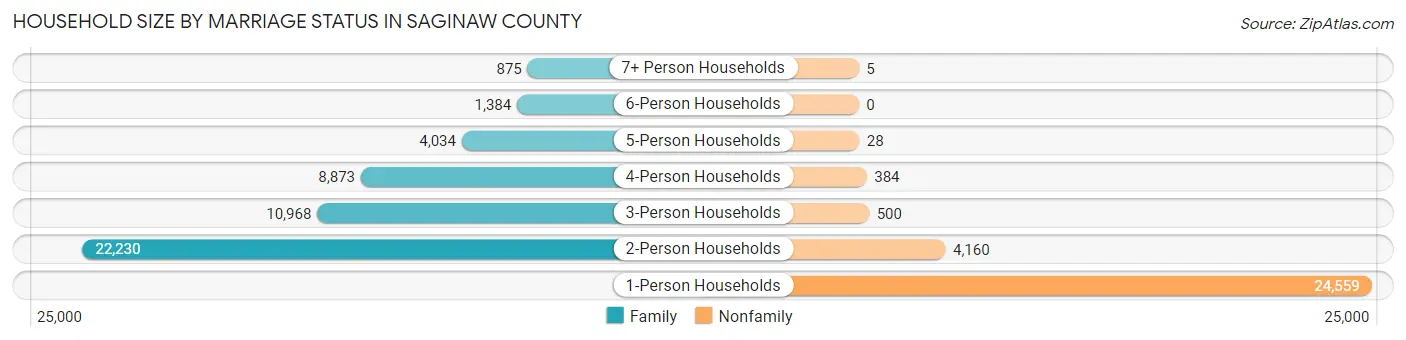
Household Size by Marriage Status in Saginaw County
Out of a total of 78,000 households in Saginaw County, 48,364 (62.0%) are family households, while 29,636 (38.0%) are nonfamily households. The most numerous type of family households are 2-person households, comprising 22,230, and the most common type of nonfamily households are 1-person households, comprising 24,559.
| Household Size | Family Households | Nonfamily Households |
| 1-Person Households | - | 24,559 (31.5%) |
| 2-Person Households | 22,230 (28.5%) | 4,160 (5.3%) |
| 3-Person Households | 10,968 (14.1%) | 500 (0.6%) |
| 4-Person Households | 8,873 (11.4%) | 384 (0.5%) |
| 5-Person Households | 4,034 (5.2%) | 28 (0.0%) |
| 6-Person Households | 1,384 (1.8%) | 0 (0.0%) |
| 7+ Person Households | 875 (1.1%) | 5 (0.0%) |
| Total | 48,364 (62.0%) | 29,636 (38.0%) |
Female Fertility in Saginaw County
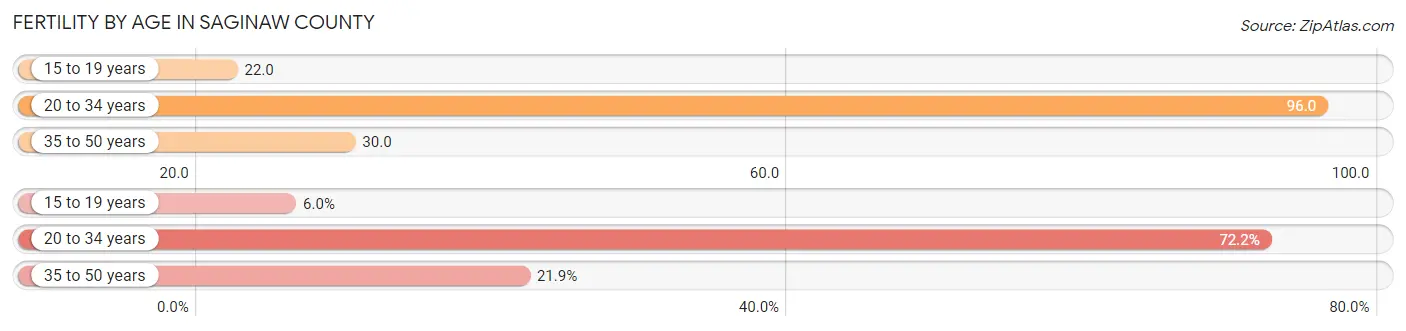
Fertility by Age in Saginaw County
Average fertility rate in Saginaw County is 57.0 births per 1,000 women. Women in the age bracket of 20 to 34 years have the highest fertility rate with 96.0 births per 1,000 women. Women in the age bracket of 20 to 34 years acount for 72.2% of all women with births.
| Age Bracket | Women with Births | Births / 1,000 Women |
| 15 to 19 years | 142 (6.0%) | 22.0 |
| 20 to 34 years | 1,714 (72.2%) | 96.0 |
| 35 to 50 years | 519 (21.8%) | 30.0 |
| Total | 2,375 (100.0%) | 57.0 |
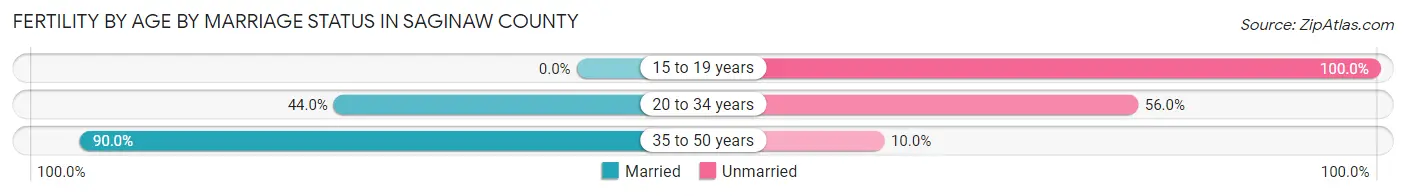
Fertility by Age by Marriage Status in Saginaw County
51.5% of women with births (2,375) in Saginaw County are married. The highest percentage of unmarried women with births falls into 15 to 19 years age bracket with 100.0% of them unmarried at the time of birth, while the lowest percentage of unmarried women with births belong to 35 to 50 years age bracket with 10.0% of them unmarried.
| Age Bracket | Married | Unmarried |
| 15 to 19 years | 0 (0.0%) | 142 (100.0%) |
| 20 to 34 years | 754 (44.0%) | 960 (56.0%) |
| 35 to 50 years | 467 (90.0%) | 52 (10.0%) |
| Total | 1,223 (51.5%) | 1,152 (48.5%) |
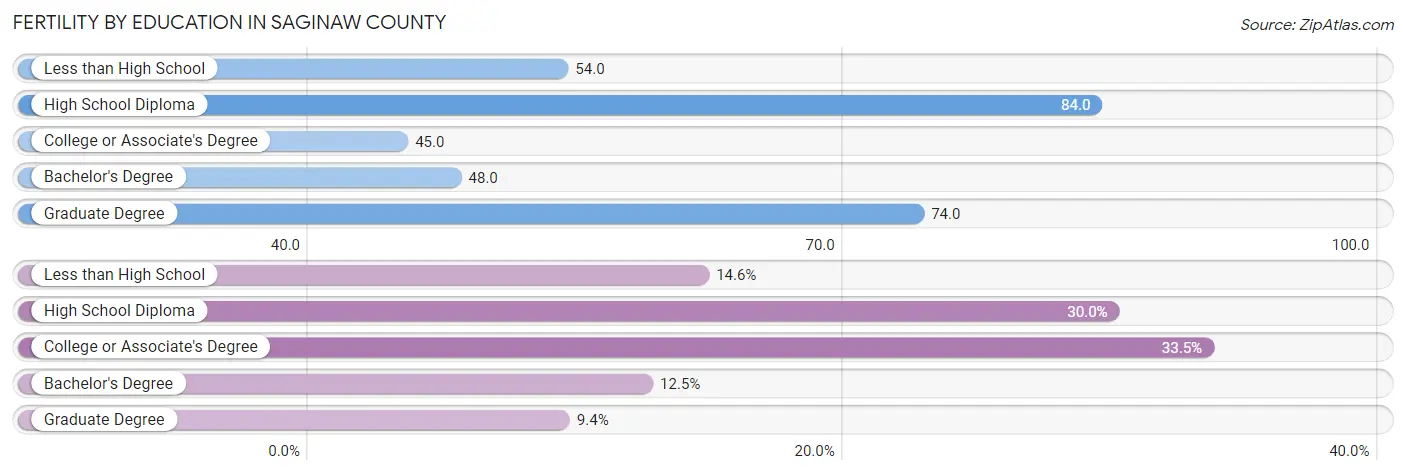
Fertility by Education in Saginaw County
Average fertility rate in Saginaw County is 57.0 births per 1,000 women. Women with the education attainment of high school diploma have the highest fertility rate of 84.0 births per 1,000 women, while women with the education attainment of college or associate's degree have the lowest fertility at 45.0 births per 1,000 women. Women with the education attainment of college or associate's degree represent 33.5% of all women with births.
| Educational Attainment | Women with Births | Births / 1,000 Women |
| Less than High School | 347 (14.6%) | 54.0 |
| High School Diploma | 712 (30.0%) | 84.0 |
| College or Associate's Degree | 796 (33.5%) | 45.0 |
| Bachelor's Degree | 297 (12.5%) | 48.0 |
| Graduate Degree | 223 (9.4%) | 74.0 |
| Total | 2,375 (100.0%) | 57.0 |
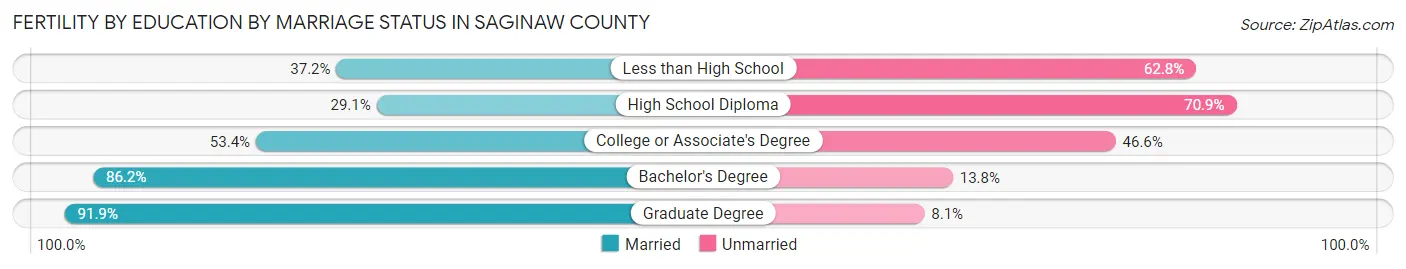
Fertility by Education by Marriage Status in Saginaw County
48.5% of women with births in Saginaw County are unmarried. Women with the educational attainment of graduate degree are most likely to be married with 91.9% of them married at childbirth, while women with the educational attainment of high school diploma are least likely to be married with 70.9% of them unmarried at childbirth.
| Educational Attainment | Married | Unmarried |
| Less than High School | 129 (37.2%) | 218 (62.8%) |
| High School Diploma | 207 (29.1%) | 505 (70.9%) |
| College or Associate's Degree | 425 (53.4%) | 371 (46.6%) |
| Bachelor's Degree | 256 (86.2%) | 41 (13.8%) |
| Graduate Degree | 205 (91.9%) | 18 (8.1%) |
| Total | 1,223 (51.5%) | 1,152 (48.5%) |
Income in Saginaw County
Income Overview in Saginaw County
Per Capita Income in Saginaw County is $32,839, while median incomes of families and households are $71,728 and $56,579 respectively.
| Characteristic | Number | Measure |
| Per Capita Income | 189,821 | $32,839 |
| Median Family Income | 48,364 | $71,728 |
| Mean Family Income | 48,364 | $95,397 |
| Median Household Income | 78,000 | $56,579 |
| Mean Household Income | 78,000 | $79,210 |
| Income Deficit | 48,364 | $11,648 |
| Wage / Income Gap (%) | 189,821 | 30.96% |
| Wage / Income Gap ($) | 189,821 | 69.04¢ per $1 |
| Gini / Inequality Index | 189,821 | 0.47 |
Earnings by Sex in Saginaw County
Average Earnings in Saginaw County are $35,019, $42,182 for men and $29,122 for women, a difference of 31.0%.

| Sex | Number | Average Earnings |
| Male | 45,745 (50.6%) | $42,182 |
| Female | 44,569 (49.3%) | $29,122 |
| Total | 90,314 (100.0%) | $35,019 |
Earnings by Sex by Income Bracket in Saginaw County
The most common earnings brackets in Saginaw County are $100,000+ for men (6,121 | 13.4%) and $25,000 to $29,999 for women (3,040 | 6.8%).
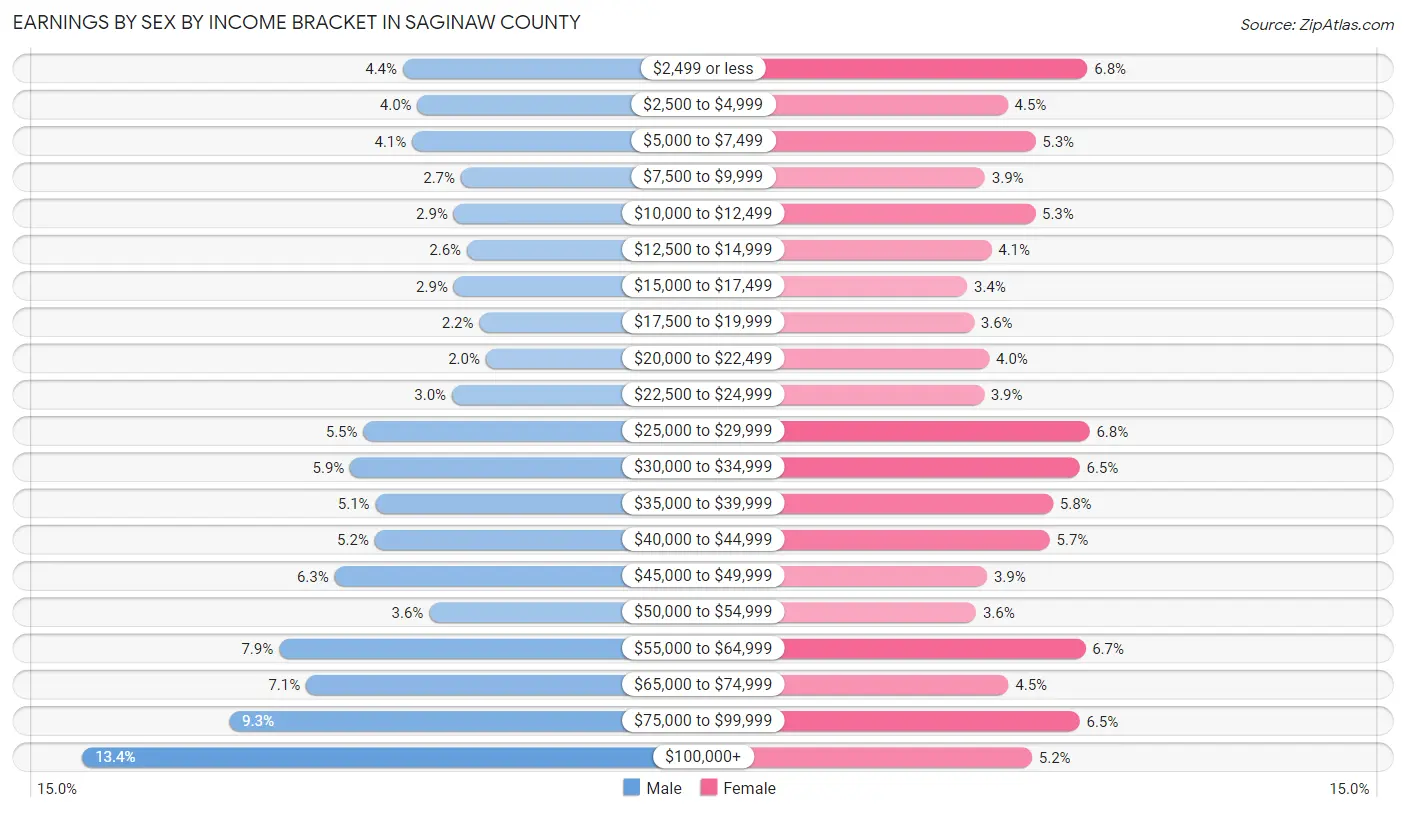
| Income | Male | Female |
| $2,499 or less | 2,000 (4.4%) | 3,014 (6.8%) |
| $2,500 to $4,999 | 1,811 (4.0%) | 2,013 (4.5%) |
| $5,000 to $7,499 | 1,882 (4.1%) | 2,363 (5.3%) |
| $7,500 to $9,999 | 1,255 (2.7%) | 1,731 (3.9%) |
| $10,000 to $12,499 | 1,344 (2.9%) | 2,359 (5.3%) |
| $12,500 to $14,999 | 1,174 (2.6%) | 1,808 (4.1%) |
| $15,000 to $17,499 | 1,343 (2.9%) | 1,506 (3.4%) |
| $17,500 to $19,999 | 1,016 (2.2%) | 1,589 (3.6%) |
| $20,000 to $22,499 | 933 (2.0%) | 1,781 (4.0%) |
| $22,500 to $24,999 | 1,366 (3.0%) | 1,714 (3.8%) |
| $25,000 to $29,999 | 2,507 (5.5%) | 3,040 (6.8%) |
| $30,000 to $34,999 | 2,675 (5.9%) | 2,915 (6.5%) |
| $35,000 to $39,999 | 2,350 (5.1%) | 2,581 (5.8%) |
| $40,000 to $44,999 | 2,362 (5.2%) | 2,540 (5.7%) |
| $45,000 to $49,999 | 2,878 (6.3%) | 1,756 (3.9%) |
| $50,000 to $54,999 | 1,662 (3.6%) | 1,618 (3.6%) |
| $55,000 to $64,999 | 3,589 (7.9%) | 2,984 (6.7%) |
| $65,000 to $74,999 | 3,245 (7.1%) | 2,023 (4.5%) |
| $75,000 to $99,999 | 4,232 (9.2%) | 2,915 (6.5%) |
| $100,000+ | 6,121 (13.4%) | 2,319 (5.2%) |
| Total | 45,745 (100.0%) | 44,569 (100.0%) |
Earnings by Sex by Educational Attainment in Saginaw County
Average earnings in Saginaw County are $48,113 for men and $34,993 for women, a difference of 27.3%. Men with an educational attainment of graduate degree enjoy the highest average annual earnings of $96,490, while those with less than high school education earn the least with $27,649. Women with an educational attainment of graduate degree earn the most with the average annual earnings of $69,010, while those with less than high school education have the smallest earnings of $16,765.
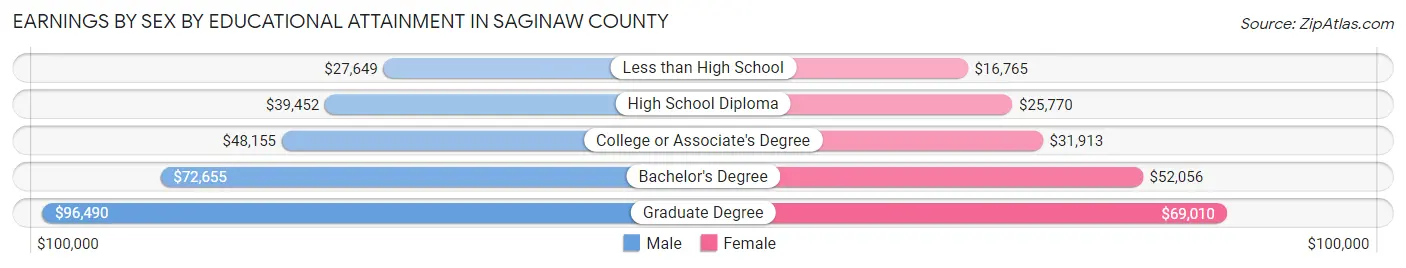
| Educational Attainment | Male Income | Female Income |
| Less than High School | $27,649 | $16,765 |
| High School Diploma | $39,452 | $25,770 |
| College or Associate's Degree | $48,155 | $31,913 |
| Bachelor's Degree | $72,655 | $52,056 |
| Graduate Degree | $96,490 | $69,010 |
| Total | $48,113 | $34,993 |
Family Income in Saginaw County
Family Income Brackets in Saginaw County
According to the Saginaw County family income data, there are 9,673 families falling into the $50,000 to $74,999 income range, which is the most common income bracket and makes up 20.0% of all families. Conversely, the $10,000 to $14,999 income bracket is the least frequent group with only 1,306 families (2.7%) belonging to this category.
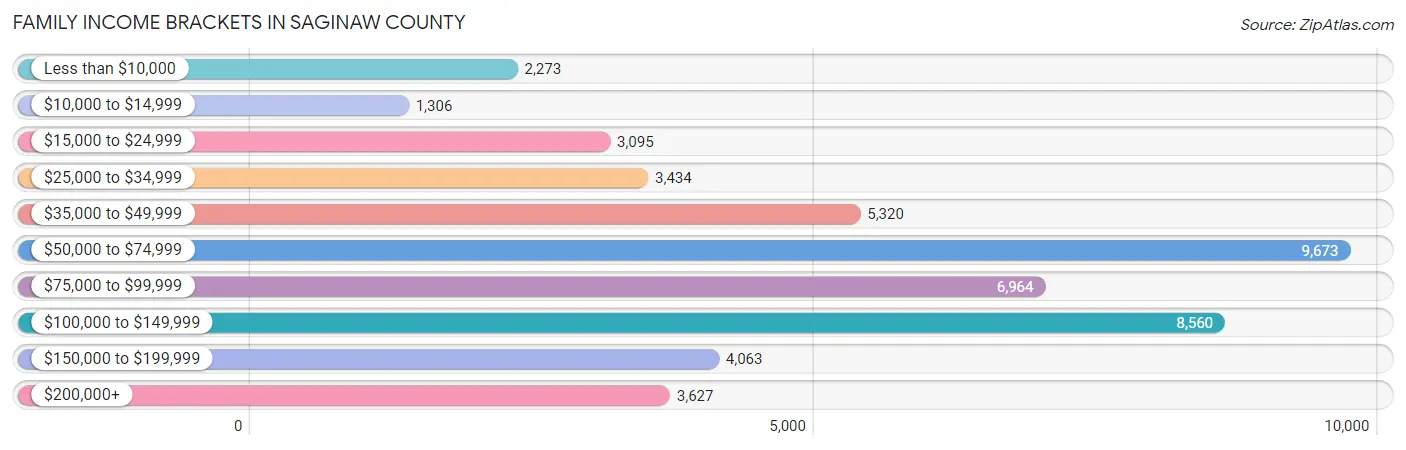
| Income Bracket | # Families | % Families |
| Less than $10,000 | 2,273 | 4.7% |
| $10,000 to $14,999 | 1,306 | 2.7% |
| $15,000 to $24,999 | 3,095 | 6.4% |
| $25,000 to $34,999 | 3,434 | 7.1% |
| $35,000 to $49,999 | 5,320 | 11.0% |
| $50,000 to $74,999 | 9,673 | 20.0% |
| $75,000 to $99,999 | 6,964 | 14.4% |
| $100,000 to $149,999 | 8,560 | 17.7% |
| $150,000 to $199,999 | 4,063 | 8.4% |
| $200,000+ | 3,627 | 7.5% |
Family Income by Famaliy Size in Saginaw County
4-person families (8,342 | 17.2%) account for the highest median family income in Saginaw County with $92,227 per family, while 2-person families (24,205 | 50.0%) have the highest median income of $32,852 per family member.
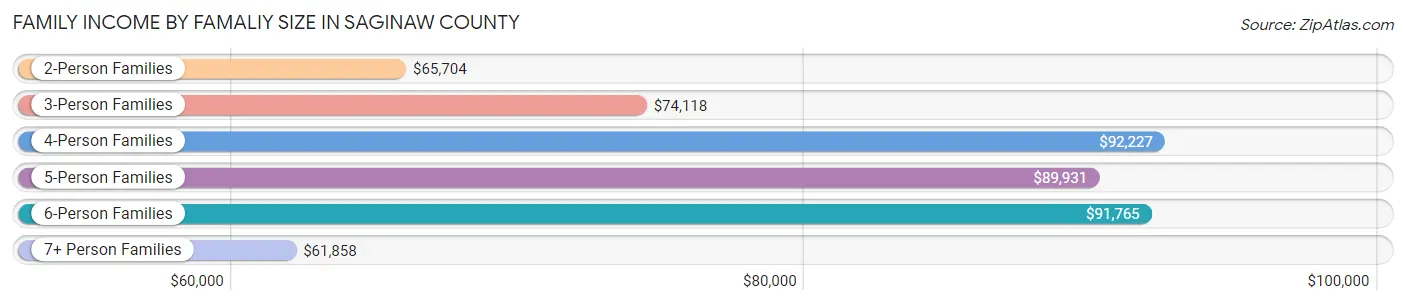
| Income Bracket | # Families | Median Income |
| 2-Person Families | 24,205 (50.0%) | $65,704 |
| 3-Person Families | 10,466 (21.6%) | $74,118 |
| 4-Person Families | 8,342 (17.2%) | $92,227 |
| 5-Person Families | 3,351 (6.9%) | $89,931 |
| 6-Person Families | 1,394 (2.9%) | $91,765 |
| 7+ Person Families | 606 (1.3%) | $61,858 |
| Total | 48,364 (100.0%) | $71,728 |
Family Income by Number of Earners in Saginaw County
The median family income in Saginaw County is $71,728, with families comprising 3+ earners (4,992) having the highest median family income of $135,516, while families with no earners (10,374) have the lowest median family income of $48,660, accounting for 10.3% and 21.4% of families, respectively.
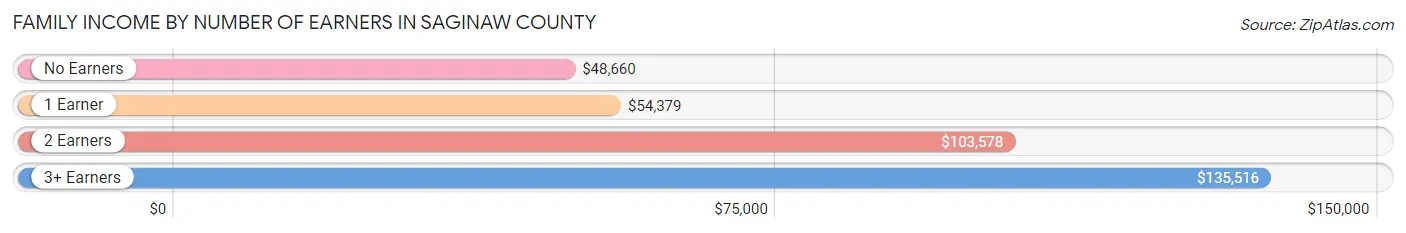
| Number of Earners | # Families | Median Income |
| No Earners | 10,374 (21.4%) | $48,660 |
| 1 Earner | 16,698 (34.5%) | $54,379 |
| 2 Earners | 16,300 (33.7%) | $103,578 |
| 3+ Earners | 4,992 (10.3%) | $135,516 |
| Total | 48,364 (100.0%) | $71,728 |
Household Income in Saginaw County
Household Income Brackets in Saginaw County
With 14,664 households falling in the category, the $50,000 to $74,999 income range is the most frequent in Saginaw County, accounting for 18.8% of all households. In contrast, only 4,290 households (5.5%) fall into the $200,000+ income bracket, making it the least populous group.
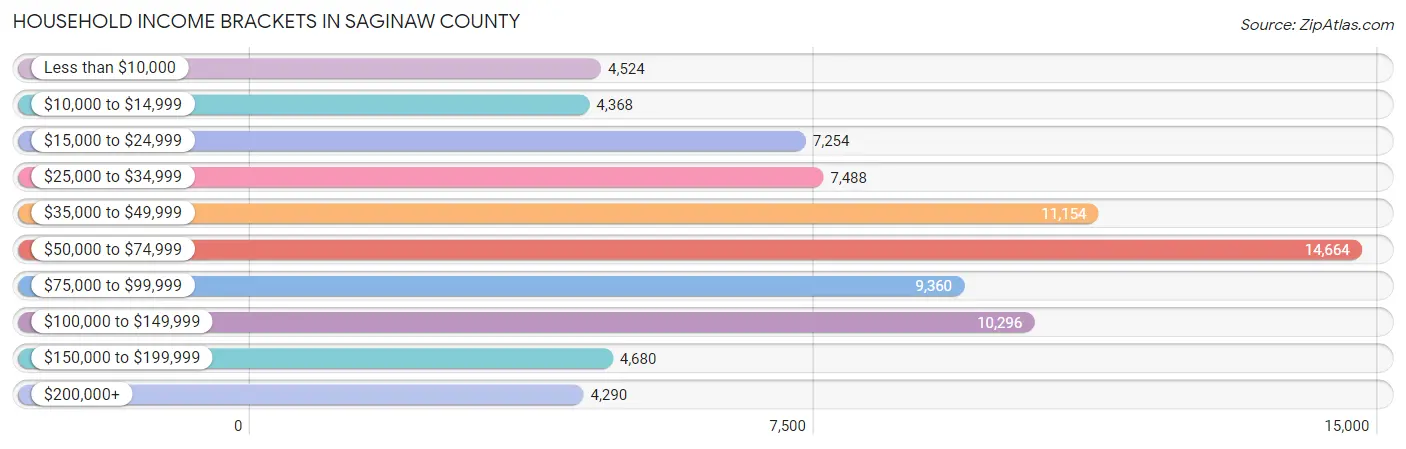
| Income Bracket | # Households | % Households |
| Less than $10,000 | 4,524 | 5.8% |
| $10,000 to $14,999 | 4,368 | 5.6% |
| $15,000 to $24,999 | 7,254 | 9.3% |
| $25,000 to $34,999 | 7,488 | 9.6% |
| $35,000 to $49,999 | 11,154 | 14.3% |
| $50,000 to $74,999 | 14,664 | 18.8% |
| $75,000 to $99,999 | 9,360 | 12.0% |
| $100,000 to $149,999 | 10,296 | 13.2% |
| $150,000 to $199,999 | 4,680 | 6.0% |
| $200,000+ | 4,290 | 5.5% |
Household Income by Householder Age in Saginaw County
The median household income in Saginaw County is $56,579, with the highest median household income of $68,864 found in the 45 to 64 years age bracket for the primary householder. A total of 28,025 households (35.9%) fall into this category. Meanwhile, the 15 to 24 years age bracket for the primary householder has the lowest median household income of $39,478, with 2,812 households (3.6%) in this group.
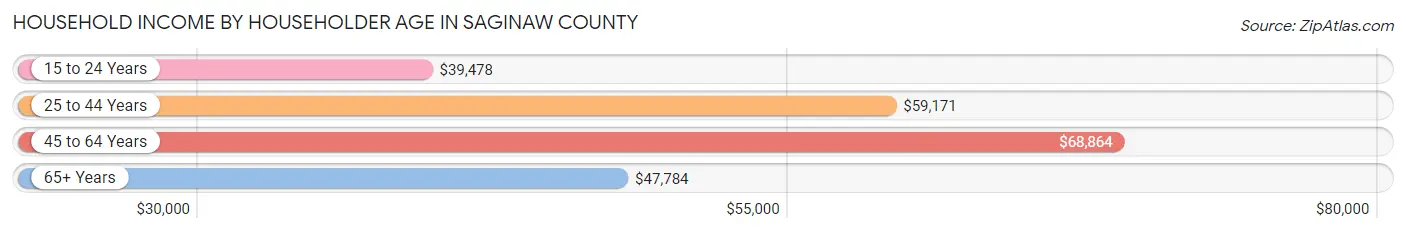
| Income Bracket | # Households | Median Income |
| 15 to 24 Years | 2,812 (3.6%) | $39,478 |
| 25 to 44 Years | 22,684 (29.1%) | $59,171 |
| 45 to 64 Years | 28,025 (35.9%) | $68,864 |
| 65+ Years | 24,479 (31.4%) | $47,784 |
| Total | 78,000 (100.0%) | $56,579 |
Poverty in Saginaw County
Income Below Poverty by Sex and Age in Saginaw County
With 16.2% poverty level for males and 20.1% for females among the residents of Saginaw County, 5 year old males and 5 year old females are the most vulnerable to poverty, with 505 males (47.7%) and 422 females (42.4%) in their respective age groups living below the poverty level.
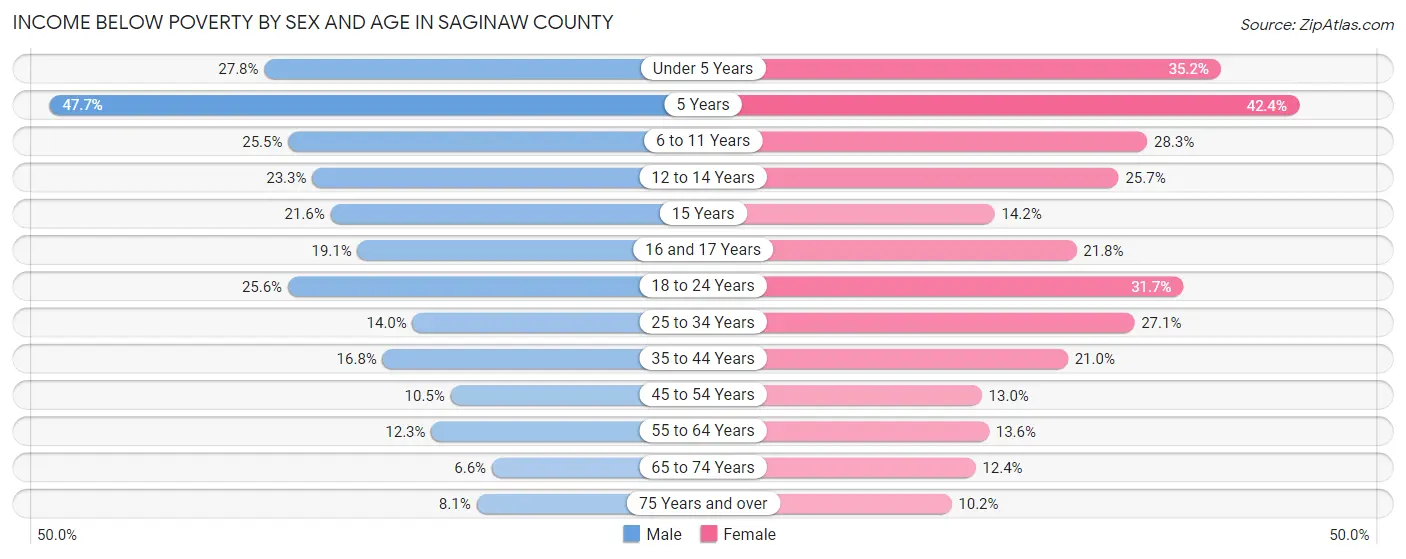
| Age Bracket | Male | Female |
| Under 5 Years | 1,503 (27.8%) | 1,786 (35.2%) |
| 5 Years | 505 (47.7%) | 422 (42.4%) |
| 6 to 11 Years | 1,640 (25.5%) | 1,744 (28.3%) |
| 12 to 14 Years | 916 (23.3%) | 917 (25.7%) |
| 15 Years | 284 (21.6%) | 129 (14.2%) |
| 16 and 17 Years | 449 (19.1%) | 580 (21.8%) |
| 18 to 24 Years | 2,083 (25.6%) | 2,420 (31.7%) |
| 25 to 34 Years | 1,568 (14.0%) | 3,163 (27.1%) |
| 35 to 44 Years | 1,673 (16.8%) | 2,208 (21.0%) |
| 45 to 54 Years | 1,135 (10.5%) | 1,490 (13.0%) |
| 55 to 64 Years | 1,542 (12.2%) | 1,862 (13.6%) |
| 65 to 74 Years | 658 (6.6%) | 1,397 (12.4%) |
| 75 Years and over | 485 (8.1%) | 910 (10.2%) |
| Total | 14,441 (16.2%) | 19,028 (20.1%) |
Income Above Poverty by Sex and Age in Saginaw County
According to the poverty statistics in Saginaw County, males aged 65 to 74 years and females aged 75 years and over are the age groups that are most secure financially, with 93.4% of males and 89.8% of females in these age groups living above the poverty line.

| Age Bracket | Male | Female |
| Under 5 Years | 3,913 (72.3%) | 3,293 (64.8%) |
| 5 Years | 554 (52.3%) | 573 (57.6%) |
| 6 to 11 Years | 4,785 (74.5%) | 4,413 (71.7%) |
| 12 to 14 Years | 3,015 (76.7%) | 2,654 (74.3%) |
| 15 Years | 1,030 (78.4%) | 781 (85.8%) |
| 16 and 17 Years | 1,902 (80.9%) | 2,084 (78.2%) |
| 18 to 24 Years | 6,066 (74.4%) | 5,220 (68.3%) |
| 25 to 34 Years | 9,641 (86.0%) | 8,492 (72.9%) |
| 35 to 44 Years | 8,301 (83.2%) | 8,320 (79.0%) |
| 45 to 54 Years | 9,718 (89.5%) | 9,985 (87.0%) |
| 55 to 64 Years | 11,043 (87.7%) | 11,794 (86.4%) |
| 65 to 74 Years | 9,274 (93.4%) | 9,866 (87.6%) |
| 75 Years and over | 5,530 (91.9%) | 8,041 (89.8%) |
| Total | 74,772 (83.8%) | 75,516 (79.9%) |
Income Below Poverty Among Married-Couple Families in Saginaw County
The poverty statistics for married-couple families in Saginaw County show that 4.8% or 1,582 of the total 33,323 families live below the poverty line. Families with 5 or more children have the highest poverty rate of 36.2%, comprising of 89 families. On the other hand, families with no children have the lowest poverty rate of 2.5%, which includes 540 families.
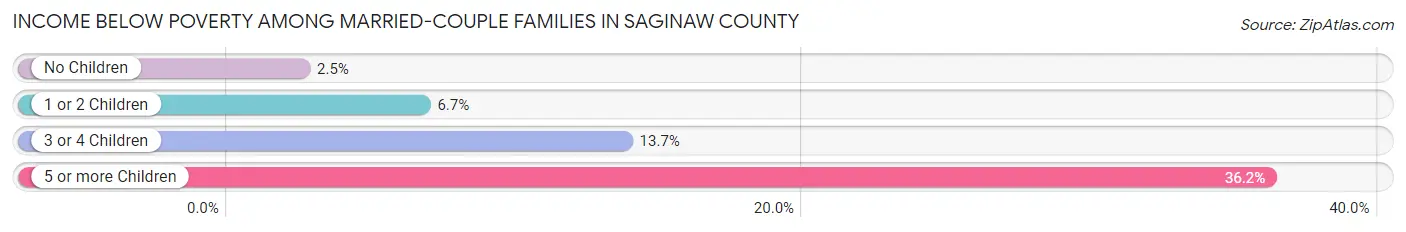
| Children | Above Poverty | Below Poverty |
| No Children | 20,933 (97.5%) | 540 (2.5%) |
| 1 or 2 Children | 8,497 (93.3%) | 610 (6.7%) |
| 3 or 4 Children | 2,154 (86.3%) | 343 (13.7%) |
| 5 or more Children | 157 (63.8%) | 89 (36.2%) |
| Total | 31,741 (95.3%) | 1,582 (4.8%) |
Income Below Poverty Among Single-Parent Households in Saginaw County
According to the poverty data in Saginaw County, 19.4% or 679 single-father households and 34.6% or 3,996 single-mother households are living below the poverty line. Among single-father households, those with 3 or 4 children have the highest poverty rate, with 121 households (48.0%) experiencing poverty. Likewise, among single-mother households, those with 5 or more children have the highest poverty rate, with 254 households (95.1%) falling below the poverty line.
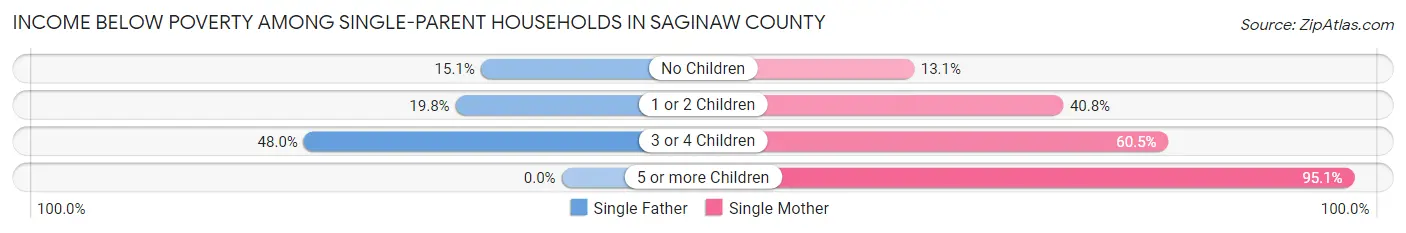
| Children | Single Father | Single Mother |
| No Children | 249 (15.1%) | 571 (13.1%) |
| 1 or 2 Children | 309 (19.8%) | 2,092 (40.8%) |
| 3 or 4 Children | 121 (48.0%) | 1,079 (60.5%) |
| 5 or more Children | 0 (0.0%) | 254 (95.1%) |
| Total | 679 (19.4%) | 3,996 (34.6%) |
Income Below Poverty Among Married-Couple vs Single-Parent Households in Saginaw County
The poverty data for Saginaw County shows that 1,582 of the married-couple family households (4.8%) and 4,675 of the single-parent households (31.1%) are living below the poverty level. Within the married-couple family households, those with 5 or more children have the highest poverty rate, with 89 households (36.2%) falling below the poverty line. Among the single-parent households, those with 5 or more children have the highest poverty rate, with 254 household (86.7%) living below poverty.
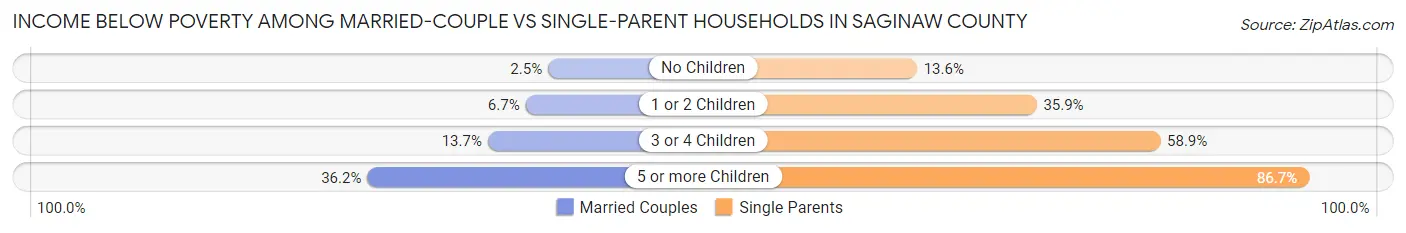
| Children | Married-Couple Families | Single-Parent Households |
| No Children | 540 (2.5%) | 820 (13.6%) |
| 1 or 2 Children | 610 (6.7%) | 2,401 (35.9%) |
| 3 or 4 Children | 343 (13.7%) | 1,200 (58.9%) |
| 5 or more Children | 89 (36.2%) | 254 (86.7%) |
| Total | 1,582 (4.8%) | 4,675 (31.1%) |
Employment Characteristics in Saginaw County
Employment by Class of Employer in Saginaw County
Among the 79,772 employed individuals in Saginaw County, private company employees (57,159 | 71.7%), not-for-profit organizations (8,269 | 10.4%), and local government employees (4,825 | 6.0%) make up the most common classes of employment.
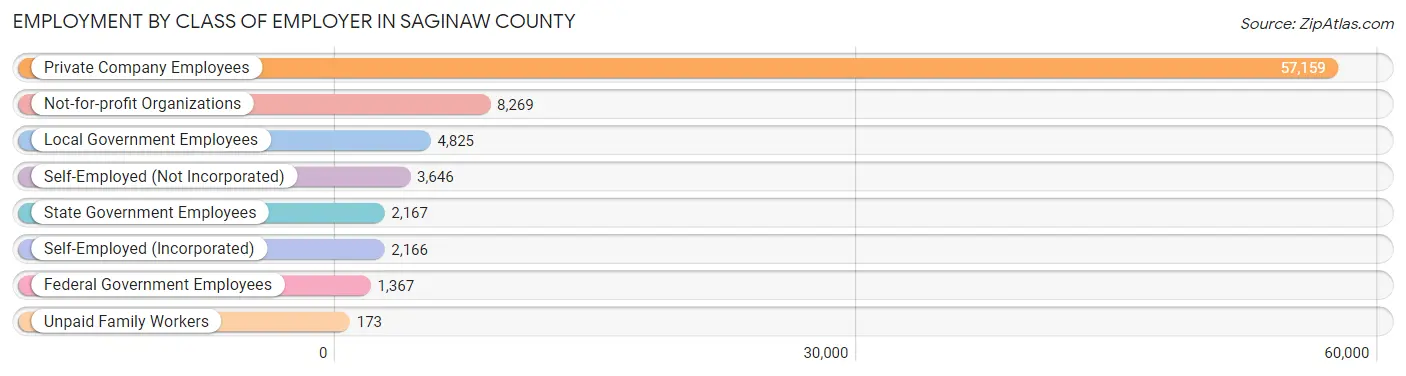
| Employer Class | # Employees | % Employees |
| Private Company Employees | 57,159 | 71.7% |
| Self-Employed (Incorporated) | 2,166 | 2.7% |
| Self-Employed (Not Incorporated) | 3,646 | 4.6% |
| Not-for-profit Organizations | 8,269 | 10.4% |
| Local Government Employees | 4,825 | 6.0% |
| State Government Employees | 2,167 | 2.7% |
| Federal Government Employees | 1,367 | 1.7% |
| Unpaid Family Workers | 173 | 0.2% |
| Total | 79,772 | 100.0% |
Employment Status by Age in Saginaw County
According to the labor force statistics for Saginaw County, out of the total population over 16 years of age (154,339), 56.6% or 87,356 individuals are in the labor force, with 6.6% or 5,765 of them unemployed. The age group with the highest labor force participation rate is 30 to 34 years, with 81.6% or 9,152 individuals in the labor force. Within the labor force, the 16 to 19 years age range has the highest percentage of unemployed individuals, with 15.8% or 711 of them being unemployed.

| Age Bracket | In Labor Force | Unemployed |
| 16 to 19 Years | 4,498 (41.7%) | 711 (15.8%) |
| 20 to 24 Years | 9,414 (75.4%) | 866 (9.2%) |
| 25 to 29 Years | 9,855 (79.5%) | 788 (8.0%) |
| 30 to 34 Years | 9,152 (81.6%) | 879 (9.6%) |
| 35 to 44 Years | 16,944 (80.7%) | 864 (5.1%) |
| 45 to 54 Years | 17,902 (78.9%) | 913 (5.1%) |
| 55 to 59 Years | 8,924 (68.1%) | 312 (3.5%) |
| 60 to 64 Years | 6,240 (46.5%) | 200 (3.2%) |
| 65 to 74 Years | 3,781 (17.5%) | 234 (6.2%) |
| 75 Years and over | 688 (4.4%) | 24 (3.5%) |
| Total | 87,356 (56.6%) | 5,765 (6.6%) |
Employment Status by Educational Attainment in Saginaw County
According to labor force statistics for Saginaw County, 73.6% of individuals (69,052) out of the total population between 25 and 64 years of age (93,821) are in the labor force, with 5.7% or 3,936 of them being unemployed. The group with the highest labor force participation rate are those with the educational attainment of bachelor's degree or higher, with 88.6% or 20,778 individuals in the labor force. Within the labor force, individuals with less than high school education have the highest percentage of unemployment, with 18.8% or 791 of them being unemployed.
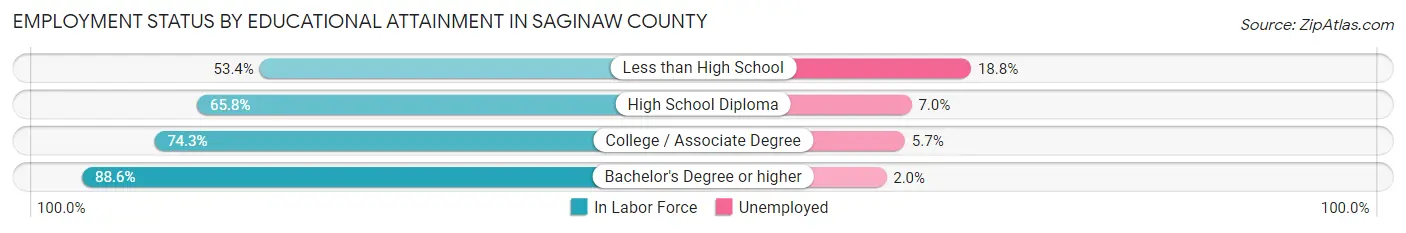
| Educational Attainment | In Labor Force | Unemployed |
| Less than High School | 4,207 (53.4%) | 1,481 (18.8%) |
| High School Diploma | 18,383 (65.8%) | 1,956 (7.0%) |
| College / Associate Degree | 25,673 (74.3%) | 1,970 (5.7%) |
| Bachelor's Degree or higher | 20,778 (88.6%) | 469 (2.0%) |
| Total | 69,052 (73.6%) | 5,348 (5.7%) |
Employment Occupations by Sex in Saginaw County
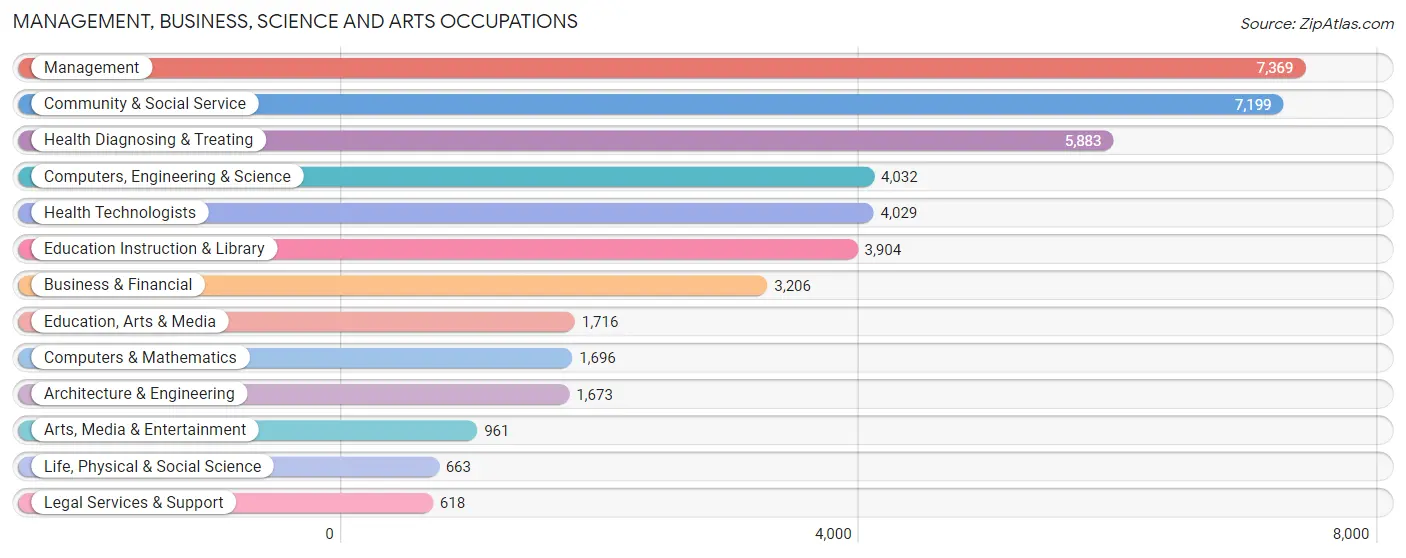
Management, Business, Science and Arts Occupations
The most common Management, Business, Science and Arts occupations in Saginaw County are Management (7,369 | 9.0%), Community & Social Service (7,199 | 8.8%), Health Diagnosing & Treating (5,883 | 7.2%), Computers, Engineering & Science (4,032 | 5.0%), and Health Technologists (4,029 | 4.9%).
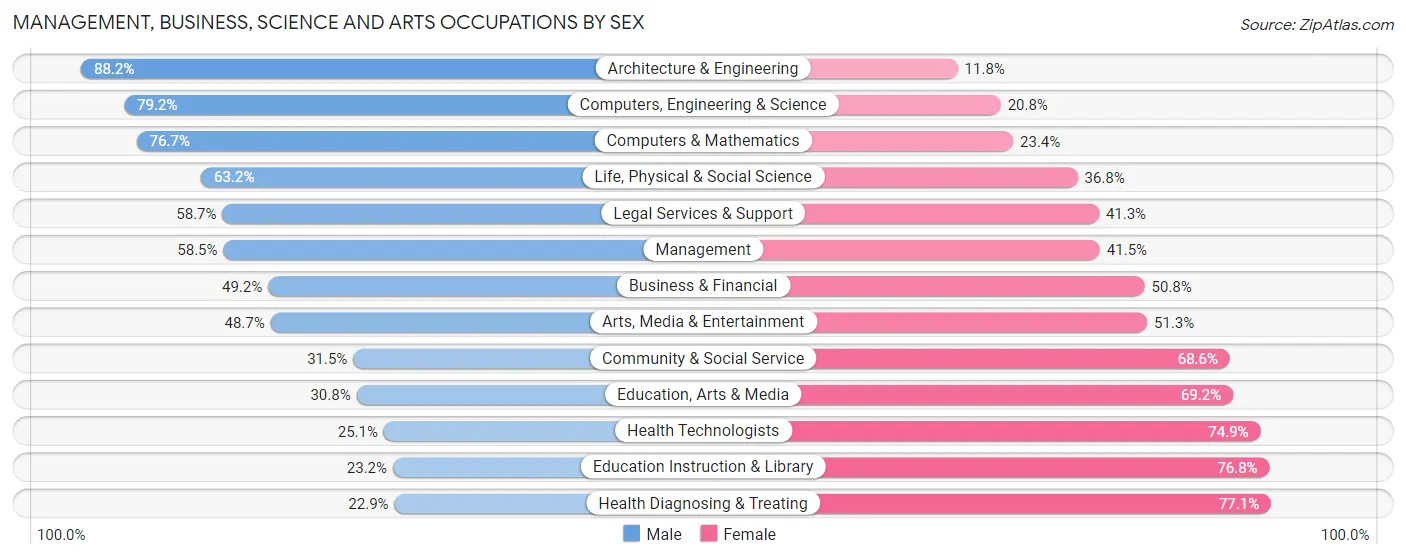
Management, Business, Science and Arts Occupations by Sex
Within the Management, Business, Science and Arts occupations in Saginaw County, the most male-oriented occupations are Architecture & Engineering (88.2%), Computers, Engineering & Science (79.2%), and Computers & Mathematics (76.6%), while the most female-oriented occupations are Health Diagnosing & Treating (77.1%), Education Instruction & Library (76.8%), and Health Technologists (74.9%).
| Occupation | Male | Female |
| Management | 4,314 (58.5%) | 3,055 (41.5%) |
| Business & Financial | 1,578 (49.2%) | 1,628 (50.8%) |
| Computers, Engineering & Science | 3,195 (79.2%) | 837 (20.8%) |
| Computers & Mathematics | 1,300 (76.6%) | 396 (23.4%) |
| Architecture & Engineering | 1,476 (88.2%) | 197 (11.8%) |
| Life, Physical & Social Science | 419 (63.2%) | 244 (36.8%) |
| Community & Social Service | 2,264 (31.5%) | 4,935 (68.5%) |
| Education, Arts & Media | 528 (30.8%) | 1,188 (69.2%) |
| Legal Services & Support | 363 (58.7%) | 255 (41.3%) |
| Education Instruction & Library | 905 (23.2%) | 2,999 (76.8%) |
| Arts, Media & Entertainment | 468 (48.7%) | 493 (51.3%) |
| Health Diagnosing & Treating | 1,345 (22.9%) | 4,538 (77.1%) |
| Health Technologists | 1,010 (25.1%) | 3,019 (74.9%) |
| Total (Category) | 12,696 (45.9%) | 14,993 (54.1%) |
| Total (Overall) | 41,058 (50.4%) | 40,465 (49.6%) |
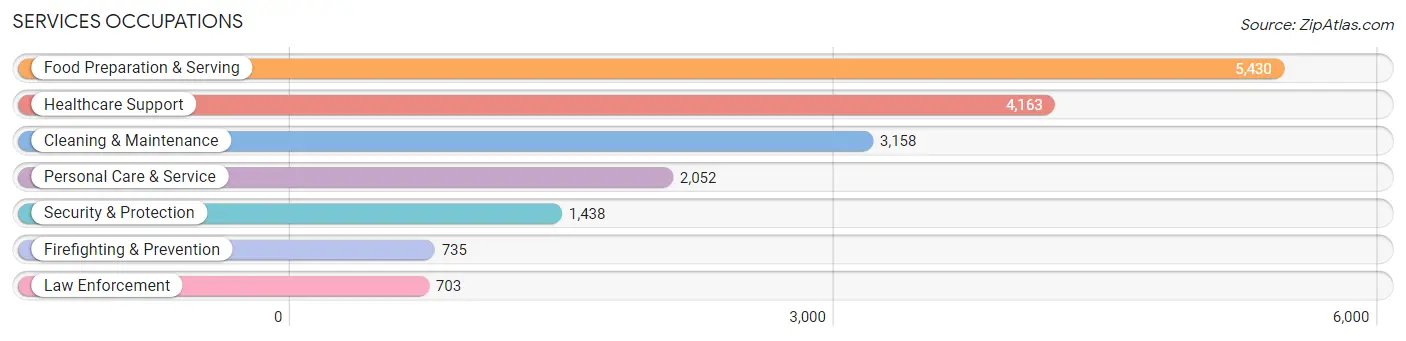
Services Occupations
The most common Services occupations in Saginaw County are Food Preparation & Serving (5,430 | 6.7%), Healthcare Support (4,163 | 5.1%), Cleaning & Maintenance (3,158 | 3.9%), Personal Care & Service (2,052 | 2.5%), and Security & Protection (1,438 | 1.8%).
Services Occupations by Sex
Within the Services occupations in Saginaw County, the most male-oriented occupations are Firefighting & Prevention (75.8%), Security & Protection (73.3%), and Law Enforcement (70.7%), while the most female-oriented occupations are Healthcare Support (90.7%), Personal Care & Service (83.2%), and Food Preparation & Serving (54.4%).
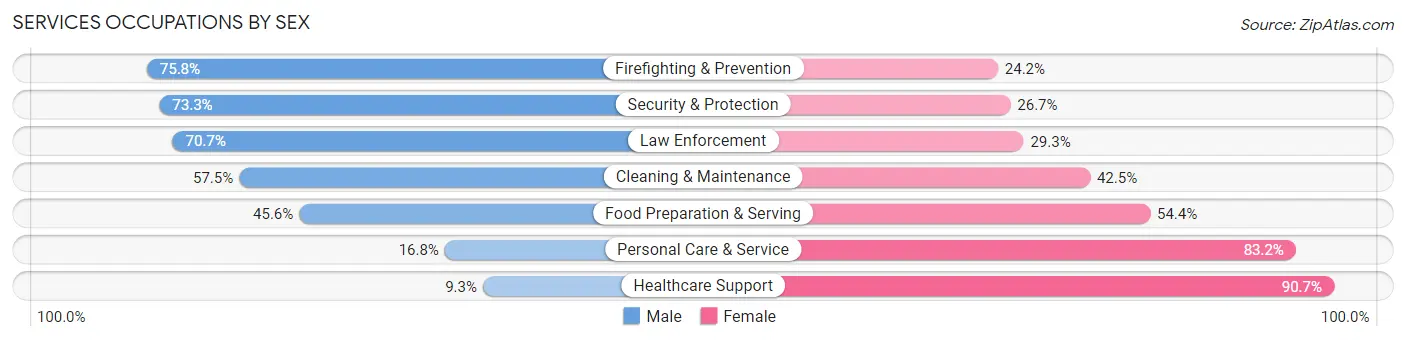
| Occupation | Male | Female |
| Healthcare Support | 386 (9.3%) | 3,777 (90.7%) |
| Security & Protection | 1,054 (73.3%) | 384 (26.7%) |
| Firefighting & Prevention | 557 (75.8%) | 178 (24.2%) |
| Law Enforcement | 497 (70.7%) | 206 (29.3%) |
| Food Preparation & Serving | 2,478 (45.6%) | 2,952 (54.4%) |
| Cleaning & Maintenance | 1,817 (57.5%) | 1,341 (42.5%) |
| Personal Care & Service | 345 (16.8%) | 1,707 (83.2%) |
| Total (Category) | 6,080 (37.4%) | 10,161 (62.6%) |
| Total (Overall) | 41,058 (50.4%) | 40,465 (49.6%) |
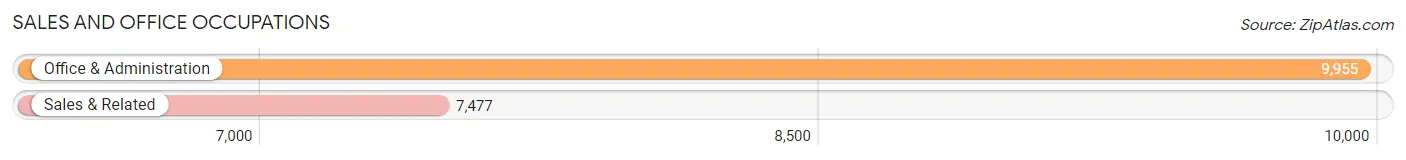
Sales and Office Occupations
The most common Sales and Office occupations in Saginaw County are Office & Administration (9,955 | 12.2%), and Sales & Related (7,477 | 9.2%).
Sales and Office Occupations by Sex
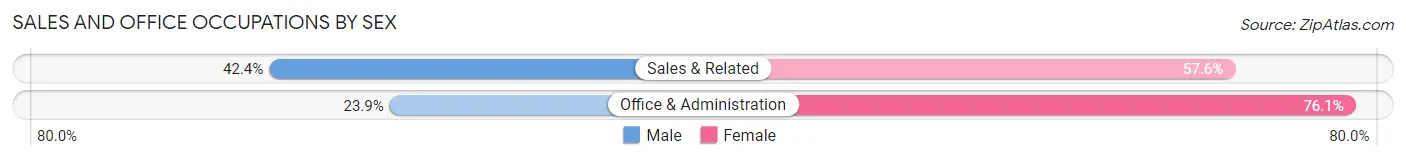
| Occupation | Male | Female |
| Sales & Related | 3,169 (42.4%) | 4,308 (57.6%) |
| Office & Administration | 2,375 (23.9%) | 7,580 (76.1%) |
| Total (Category) | 5,544 (31.8%) | 11,888 (68.2%) |
| Total (Overall) | 41,058 (50.4%) | 40,465 (49.6%) |
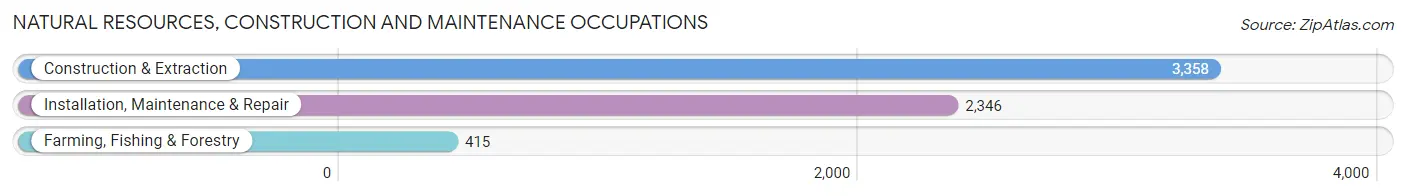
Natural Resources, Construction and Maintenance Occupations
The most common Natural Resources, Construction and Maintenance occupations in Saginaw County are Construction & Extraction (3,358 | 4.1%), Installation, Maintenance & Repair (2,346 | 2.9%), and Farming, Fishing & Forestry (415 | 0.5%).
Natural Resources, Construction and Maintenance Occupations by Sex
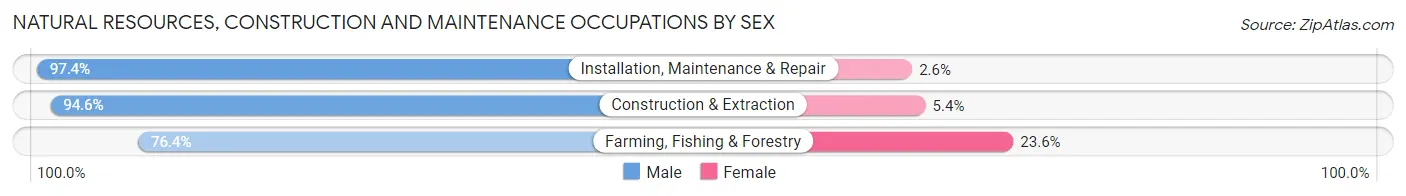
| Occupation | Male | Female |
| Farming, Fishing & Forestry | 317 (76.4%) | 98 (23.6%) |
| Construction & Extraction | 3,178 (94.6%) | 180 (5.4%) |
| Installation, Maintenance & Repair | 2,286 (97.4%) | 60 (2.6%) |
| Total (Category) | 5,781 (94.5%) | 338 (5.5%) |
| Total (Overall) | 41,058 (50.4%) | 40,465 (49.6%) |
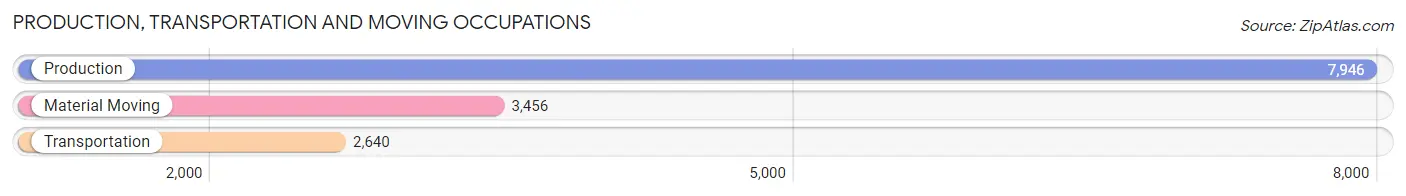
Production, Transportation and Moving Occupations
The most common Production, Transportation and Moving occupations in Saginaw County are Production (7,946 | 9.8%), Material Moving (3,456 | 4.2%), and Transportation (2,640 | 3.2%).
Production, Transportation and Moving Occupations by Sex
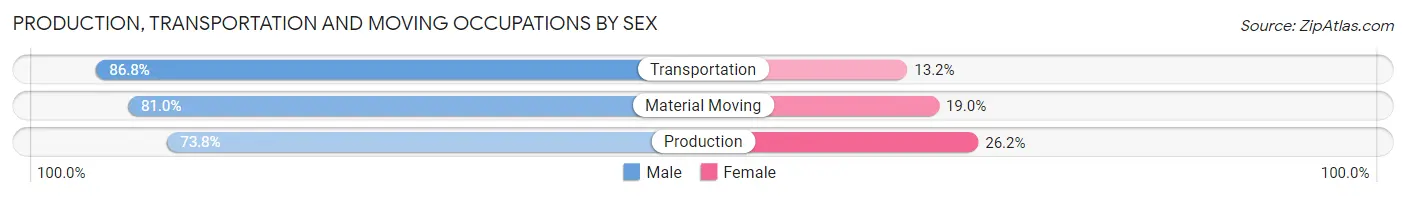
| Occupation | Male | Female |
| Production | 5,865 (73.8%) | 2,081 (26.2%) |
| Transportation | 2,292 (86.8%) | 348 (13.2%) |
| Material Moving | 2,800 (81.0%) | 656 (19.0%) |
| Total (Category) | 10,957 (78.0%) | 3,085 (22.0%) |
| Total (Overall) | 41,058 (50.4%) | 40,465 (49.6%) |
Employment Industries by Sex in Saginaw County
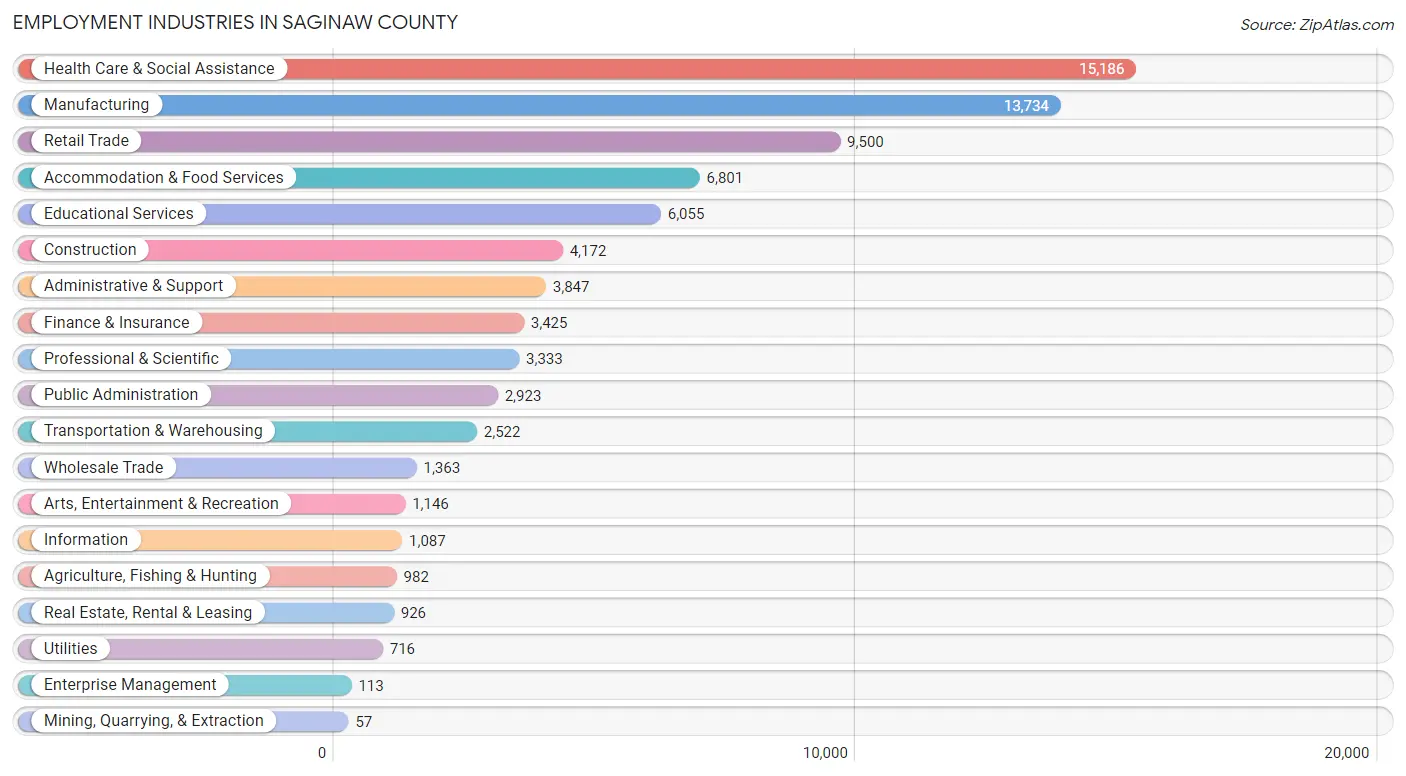
Employment Industries in Saginaw County
The major employment industries in Saginaw County include Health Care & Social Assistance (15,186 | 18.6%), Manufacturing (13,734 | 16.9%), Retail Trade (9,500 | 11.7%), Accommodation & Food Services (6,801 | 8.3%), and Educational Services (6,055 | 7.4%).
Employment Industries by Sex in Saginaw County
The Saginaw County industries that see more men than women are Mining, Quarrying, & Extraction (96.5%), Construction (91.0%), and Wholesale Trade (76.6%), whereas the industries that tend to have a higher number of women are Enterprise Management (95.6%), Health Care & Social Assistance (82.3%), and Educational Services (66.3%).
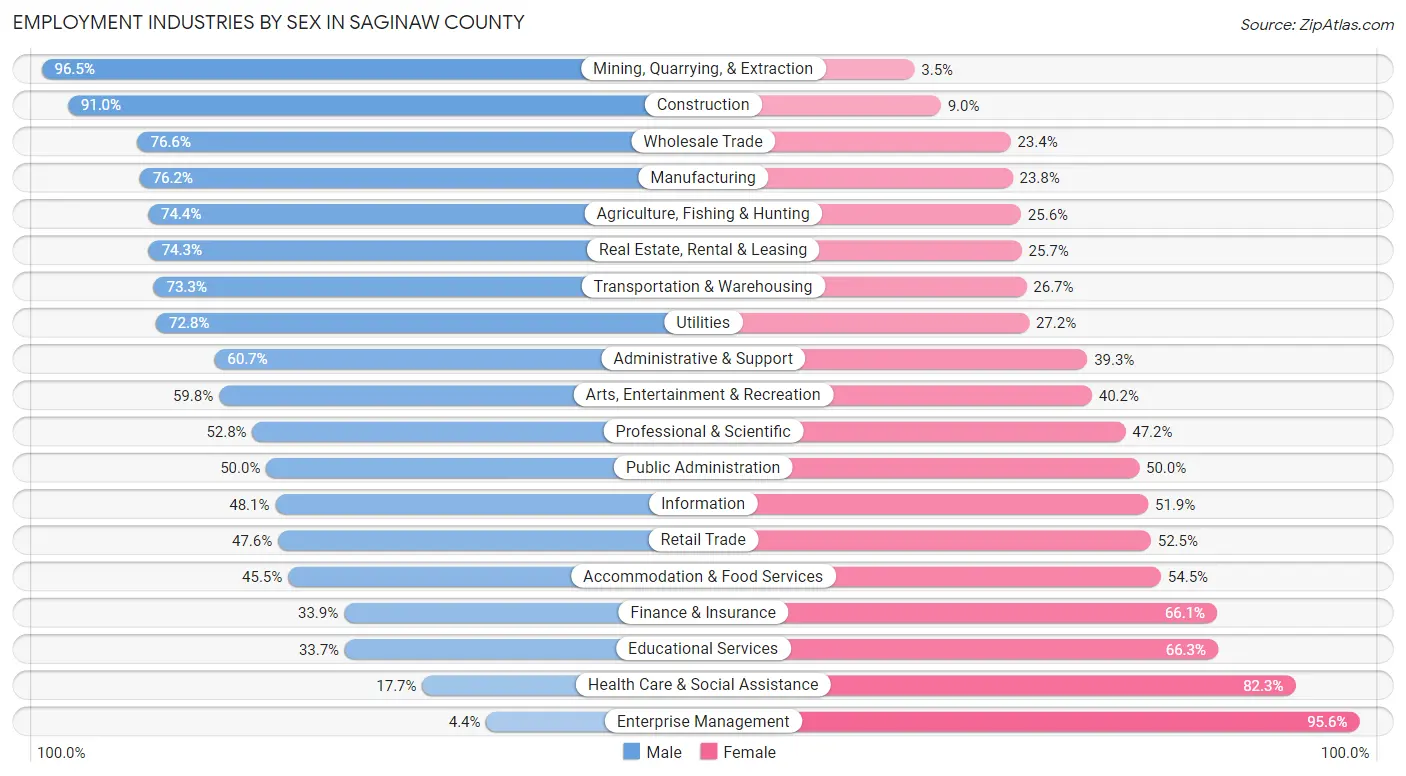
| Industry | Male | Female |
| Agriculture, Fishing & Hunting | 731 (74.4%) | 251 (25.6%) |
| Mining, Quarrying, & Extraction | 55 (96.5%) | 2 (3.5%) |
| Construction | 3,798 (91.0%) | 374 (9.0%) |
| Manufacturing | 10,461 (76.2%) | 3,273 (23.8%) |
| Wholesale Trade | 1,044 (76.6%) | 319 (23.4%) |
| Retail Trade | 4,517 (47.5%) | 4,983 (52.4%) |
| Transportation & Warehousing | 1,849 (73.3%) | 673 (26.7%) |
| Utilities | 521 (72.8%) | 195 (27.2%) |
| Information | 523 (48.1%) | 564 (51.9%) |
| Finance & Insurance | 1,160 (33.9%) | 2,265 (66.1%) |
| Real Estate, Rental & Leasing | 688 (74.3%) | 238 (25.7%) |
| Professional & Scientific | 1,761 (52.8%) | 1,572 (47.2%) |
| Enterprise Management | 5 (4.4%) | 108 (95.6%) |
| Administrative & Support | 2,336 (60.7%) | 1,511 (39.3%) |
| Educational Services | 2,040 (33.7%) | 4,015 (66.3%) |
| Health Care & Social Assistance | 2,684 (17.7%) | 12,502 (82.3%) |
| Arts, Entertainment & Recreation | 685 (59.8%) | 461 (40.2%) |
| Accommodation & Food Services | 3,092 (45.5%) | 3,709 (54.5%) |
| Public Administration | 1,461 (50.0%) | 1,462 (50.0%) |
| Total | 41,058 (50.4%) | 40,465 (49.6%) |
Education in Saginaw County
School Enrollment in Saginaw County
The most common levels of schooling among the 44,257 students in Saginaw County are college / undergraduate (10,604 | 24.0%), high school (10,599 | 23.9%), and elementary school (8,734 | 19.7%).
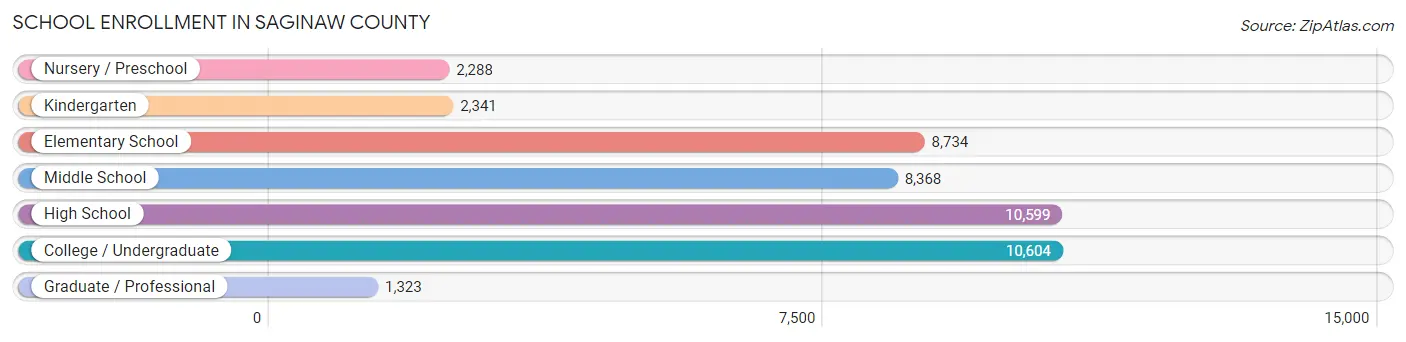
| School Level | # Students | % Students |
| Nursery / Preschool | 2,288 | 5.2% |
| Kindergarten | 2,341 | 5.3% |
| Elementary School | 8,734 | 19.7% |
| Middle School | 8,368 | 18.9% |
| High School | 10,599 | 23.9% |
| College / Undergraduate | 10,604 | 24.0% |
| Graduate / Professional | 1,323 | 3.0% |
| Total | 44,257 | 100.0% |
School Enrollment by Age by Funding Source in Saginaw County
Out of a total of 44,257 students who are enrolled in schools in Saginaw County, 5,842 (13.2%) attend a private institution, while the remaining 38,415 (86.8%) are enrolled in public schools. The age group of 3 to 4 year olds has the highest likelihood of being enrolled in private schools, with 801 (40.6% in the age bracket) enrolled. Conversely, the age group of 35 years and over has the lowest likelihood of being enrolled in a private school, with 1,608 (92.9% in the age bracket) attending a public institution.
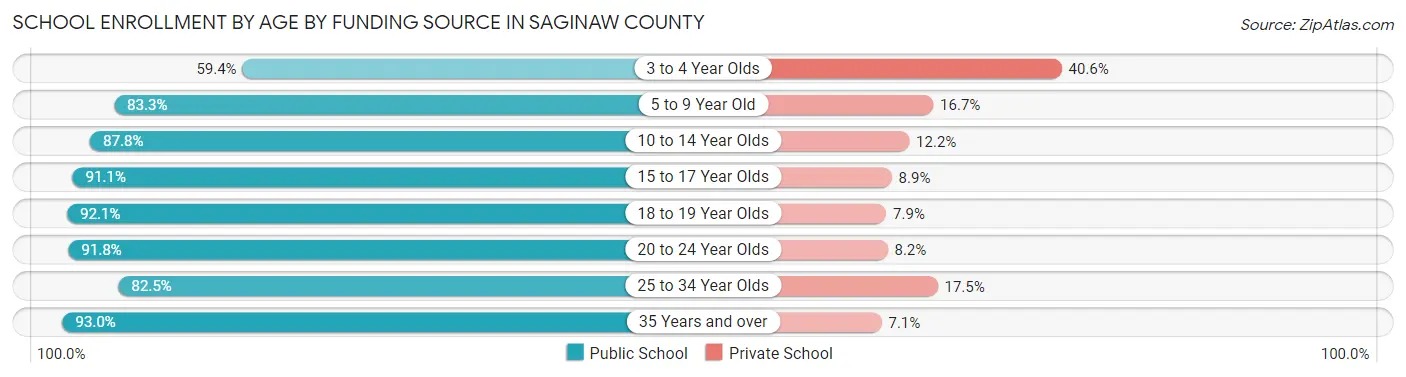
| Age Bracket | Public School | Private School |
| 3 to 4 Year Olds | 1,173 (59.4%) | 801 (40.6%) |
| 5 to 9 Year Old | 8,636 (83.3%) | 1,728 (16.7%) |
| 10 to 14 Year Olds | 9,776 (87.8%) | 1,358 (12.2%) |
| 15 to 17 Year Olds | 6,600 (91.1%) | 648 (8.9%) |
| 18 to 19 Year Olds | 3,911 (92.1%) | 336 (7.9%) |
| 20 to 24 Year Olds | 4,867 (91.8%) | 433 (8.2%) |
| 25 to 34 Year Olds | 1,865 (82.5%) | 395 (17.5%) |
| 35 Years and over | 1,608 (92.9%) | 122 (7.0%) |
| Total | 38,415 (86.8%) | 5,842 (13.2%) |
Educational Attainment by Field of Study in Saginaw County
Business (7,200 | 22.6%), education (5,567 | 17.5%), science & technology (3,847 | 12.1%), arts & humanities (3,196 | 10.0%), and engineering (2,269 | 7.1%) are the most common fields of study among 31,840 individuals in Saginaw County who have obtained a bachelor's degree or higher.
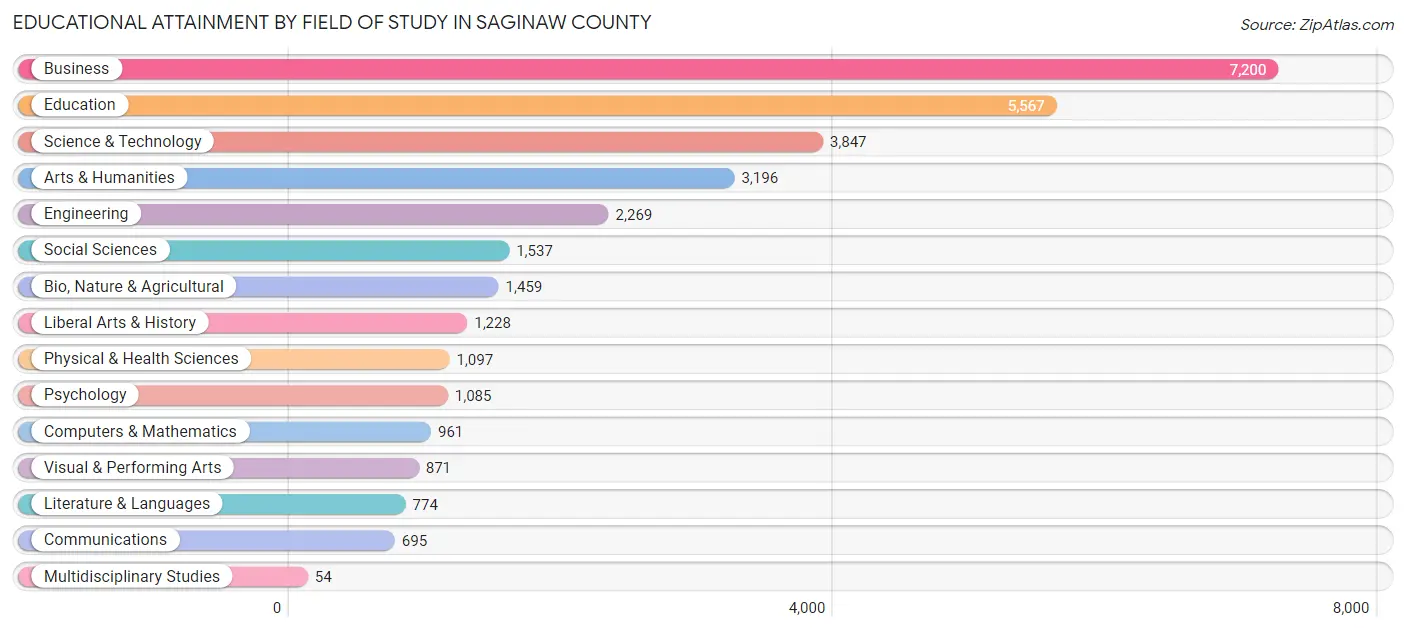
| Field of Study | # Graduates | % Graduates |
| Computers & Mathematics | 961 | 3.0% |
| Bio, Nature & Agricultural | 1,459 | 4.6% |
| Physical & Health Sciences | 1,097 | 3.5% |
| Psychology | 1,085 | 3.4% |
| Social Sciences | 1,537 | 4.8% |
| Engineering | 2,269 | 7.1% |
| Multidisciplinary Studies | 54 | 0.2% |
| Science & Technology | 3,847 | 12.1% |
| Business | 7,200 | 22.6% |
| Education | 5,567 | 17.5% |
| Literature & Languages | 774 | 2.4% |
| Liberal Arts & History | 1,228 | 3.9% |
| Visual & Performing Arts | 871 | 2.7% |
| Communications | 695 | 2.2% |
| Arts & Humanities | 3,196 | 10.0% |
| Total | 31,840 | 100.0% |
Transportation & Commute in Saginaw County
Vehicle Availability by Sex in Saginaw County
The most prevalent vehicle ownership categories in Saginaw County are males with 2 vehicles (17,217, accounting for 43.1%) and females with 2 vehicles (15,545, making up 44.5%).
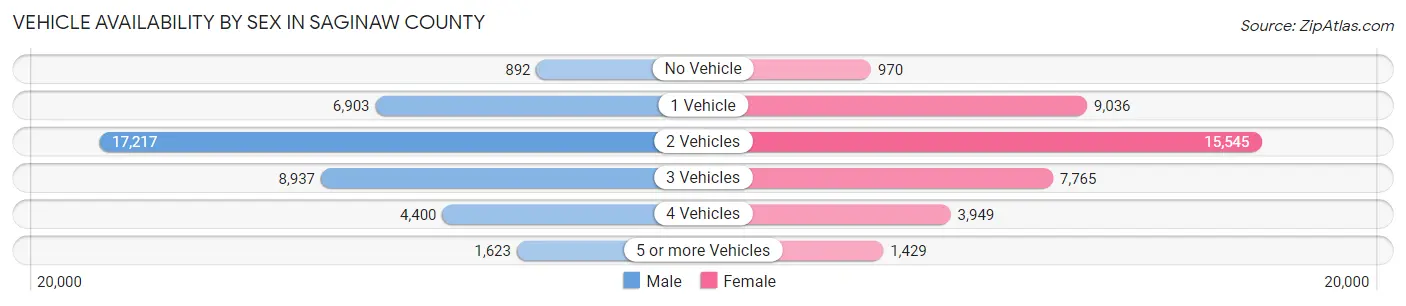
| Vehicles Available | Male | Female |
| No Vehicle | 892 (2.2%) | 970 (2.5%) |
| 1 Vehicle | 6,903 (17.3%) | 9,036 (23.4%) |
| 2 Vehicles | 17,217 (43.1%) | 15,545 (40.2%) |
| 3 Vehicles | 8,937 (22.4%) | 7,765 (20.1%) |
| 4 Vehicles | 4,400 (11.0%) | 3,949 (10.2%) |
| 5 or more Vehicles | 1,623 (4.1%) | 1,429 (3.7%) |
| Total | 39,972 (100.0%) | 38,694 (100.0%) |
Commute Time in Saginaw County
The most frequently occuring commute durations in Saginaw County are 15 to 19 minutes (13,755 commuters, 18.5%), 10 to 14 minutes (13,684 commuters, 18.4%), and 20 to 24 minutes (10,423 commuters, 14.1%).
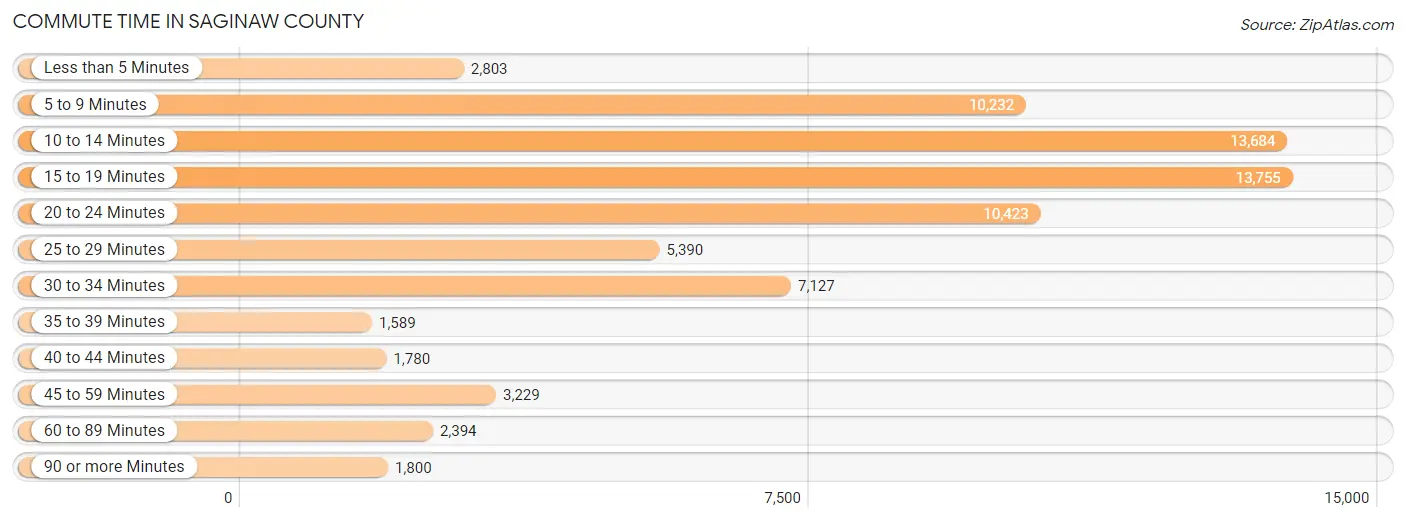
| Commute Time | # Commuters | % Commuters |
| Less than 5 Minutes | 2,803 | 3.8% |
| 5 to 9 Minutes | 10,232 | 13.8% |
| 10 to 14 Minutes | 13,684 | 18.4% |
| 15 to 19 Minutes | 13,755 | 18.5% |
| 20 to 24 Minutes | 10,423 | 14.1% |
| 25 to 29 Minutes | 5,390 | 7.3% |
| 30 to 34 Minutes | 7,127 | 9.6% |
| 35 to 39 Minutes | 1,589 | 2.1% |
| 40 to 44 Minutes | 1,780 | 2.4% |
| 45 to 59 Minutes | 3,229 | 4.3% |
| 60 to 89 Minutes | 2,394 | 3.2% |
| 90 or more Minutes | 1,800 | 2.4% |
Commute Time by Sex in Saginaw County
The most common commute times in Saginaw County are 15 to 19 minutes (6,849 commuters, 18.4%) for males and 10 to 14 minutes (7,662 commuters, 20.8%) for females.
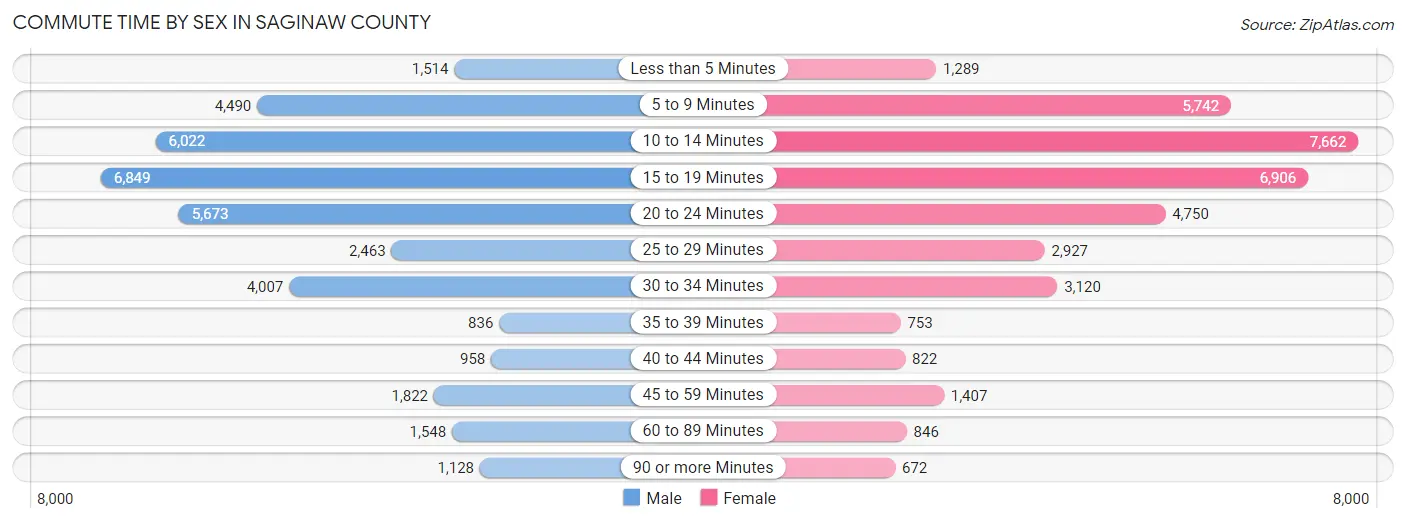
| Commute Time | Male | Female |
| Less than 5 Minutes | 1,514 (4.1%) | 1,289 (3.5%) |
| 5 to 9 Minutes | 4,490 (12.0%) | 5,742 (15.6%) |
| 10 to 14 Minutes | 6,022 (16.1%) | 7,662 (20.8%) |
| 15 to 19 Minutes | 6,849 (18.4%) | 6,906 (18.7%) |
| 20 to 24 Minutes | 5,673 (15.2%) | 4,750 (12.9%) |
| 25 to 29 Minutes | 2,463 (6.6%) | 2,927 (7.9%) |
| 30 to 34 Minutes | 4,007 (10.7%) | 3,120 (8.5%) |
| 35 to 39 Minutes | 836 (2.2%) | 753 (2.0%) |
| 40 to 44 Minutes | 958 (2.6%) | 822 (2.2%) |
| 45 to 59 Minutes | 1,822 (4.9%) | 1,407 (3.8%) |
| 60 to 89 Minutes | 1,548 (4.2%) | 846 (2.3%) |
| 90 or more Minutes | 1,128 (3.0%) | 672 (1.8%) |
Time of Departure to Work by Sex in Saginaw County
The most frequent times of departure to work in Saginaw County are 7:00 AM to 7:29 AM (4,931, 13.2%) for males and 7:30 AM to 7:59 AM (5,668, 15.4%) for females.
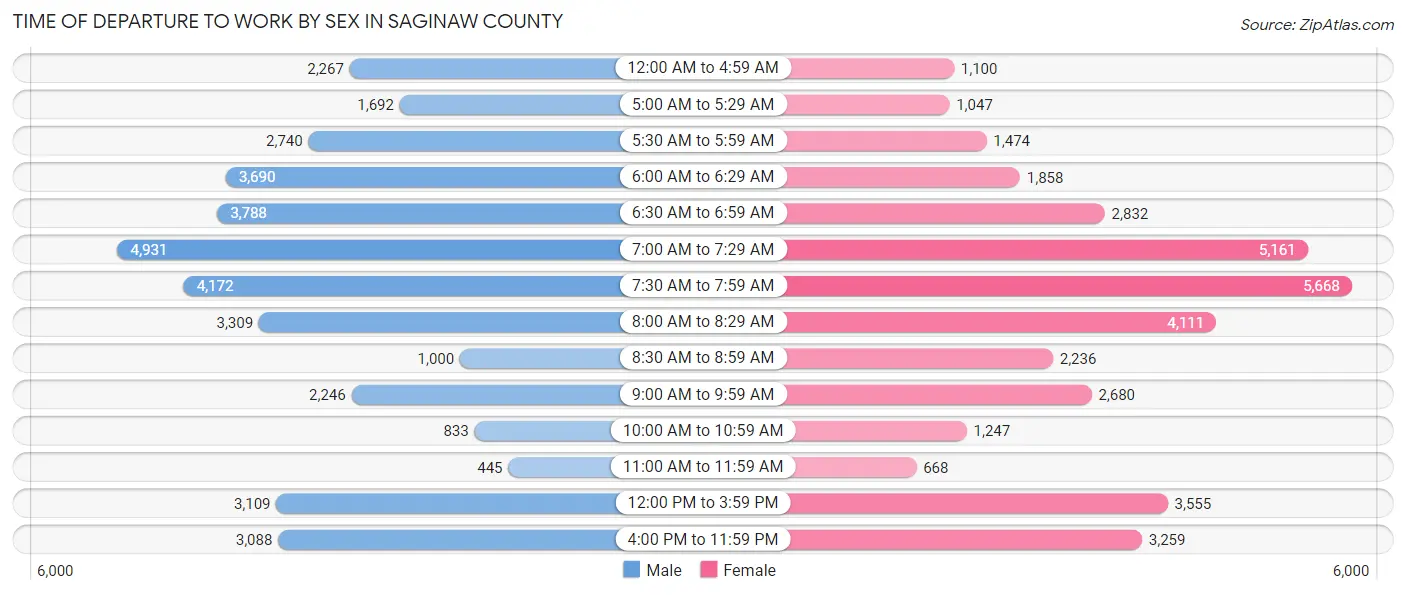
| Time of Departure | Male | Female |
| 12:00 AM to 4:59 AM | 2,267 (6.1%) | 1,100 (3.0%) |
| 5:00 AM to 5:29 AM | 1,692 (4.5%) | 1,047 (2.8%) |
| 5:30 AM to 5:59 AM | 2,740 (7.3%) | 1,474 (4.0%) |
| 6:00 AM to 6:29 AM | 3,690 (9.9%) | 1,858 (5.0%) |
| 6:30 AM to 6:59 AM | 3,788 (10.2%) | 2,832 (7.7%) |
| 7:00 AM to 7:29 AM | 4,931 (13.2%) | 5,161 (14.0%) |
| 7:30 AM to 7:59 AM | 4,172 (11.2%) | 5,668 (15.4%) |
| 8:00 AM to 8:29 AM | 3,309 (8.9%) | 4,111 (11.1%) |
| 8:30 AM to 8:59 AM | 1,000 (2.7%) | 2,236 (6.1%) |
| 9:00 AM to 9:59 AM | 2,246 (6.0%) | 2,680 (7.3%) |
| 10:00 AM to 10:59 AM | 833 (2.2%) | 1,247 (3.4%) |
| 11:00 AM to 11:59 AM | 445 (1.2%) | 668 (1.8%) |
| 12:00 PM to 3:59 PM | 3,109 (8.3%) | 3,555 (9.6%) |
| 4:00 PM to 11:59 PM | 3,088 (8.3%) | 3,259 (8.8%) |
| Total | 37,310 (100.0%) | 36,896 (100.0%) |
Housing Occupancy in Saginaw County
Occupancy by Ownership in Saginaw County
Of the total 78,000 dwellings in Saginaw County, owner-occupied units account for 56,740 (72.7%), while renter-occupied units make up 21,260 (27.3%).
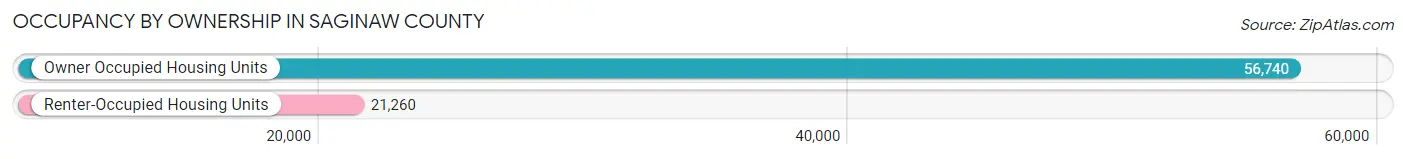
| Occupancy | # Housing Units | % Housing Units |
| Owner Occupied Housing Units | 56,740 | 72.7% |
| Renter-Occupied Housing Units | 21,260 | 27.3% |
| Total Occupied Housing Units | 78,000 | 100.0% |
Occupancy by Household Size in Saginaw County
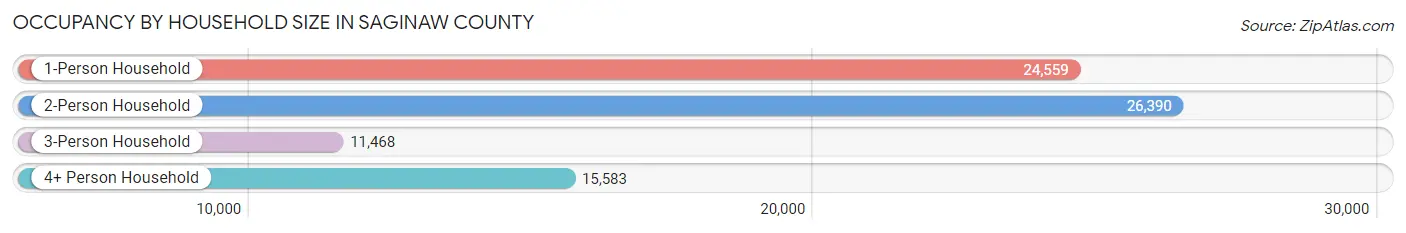
| Household Size | # Housing Units | % Housing Units |
| 1-Person Household | 24,559 | 31.5% |
| 2-Person Household | 26,390 | 33.8% |
| 3-Person Household | 11,468 | 14.7% |
| 4+ Person Household | 15,583 | 20.0% |
| Total Housing Units | 78,000 | 100.0% |
Occupancy by Ownership by Household Size in Saginaw County
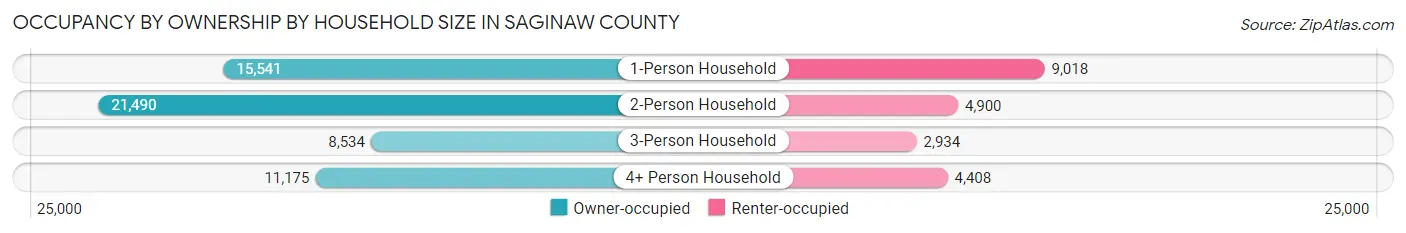
| Household Size | Owner-occupied | Renter-occupied |
| 1-Person Household | 15,541 (63.3%) | 9,018 (36.7%) |
| 2-Person Household | 21,490 (81.4%) | 4,900 (18.6%) |
| 3-Person Household | 8,534 (74.4%) | 2,934 (25.6%) |
| 4+ Person Household | 11,175 (71.7%) | 4,408 (28.3%) |
| Total Housing Units | 56,740 (72.7%) | 21,260 (27.3%) |
Occupancy by Educational Attainment in Saginaw County
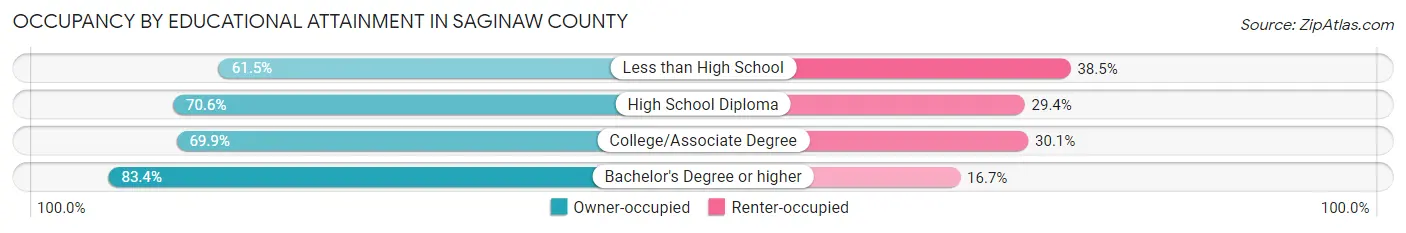
| Household Size | Owner-occupied | Renter-occupied |
| Less than High School | 3,763 (61.5%) | 2,359 (38.5%) |
| High School Diploma | 16,175 (70.6%) | 6,746 (29.4%) |
| College/Associate Degree | 20,761 (69.9%) | 8,950 (30.1%) |
| Bachelor's Degree or higher | 16,041 (83.4%) | 3,205 (16.7%) |
Occupancy by Age of Householder in Saginaw County
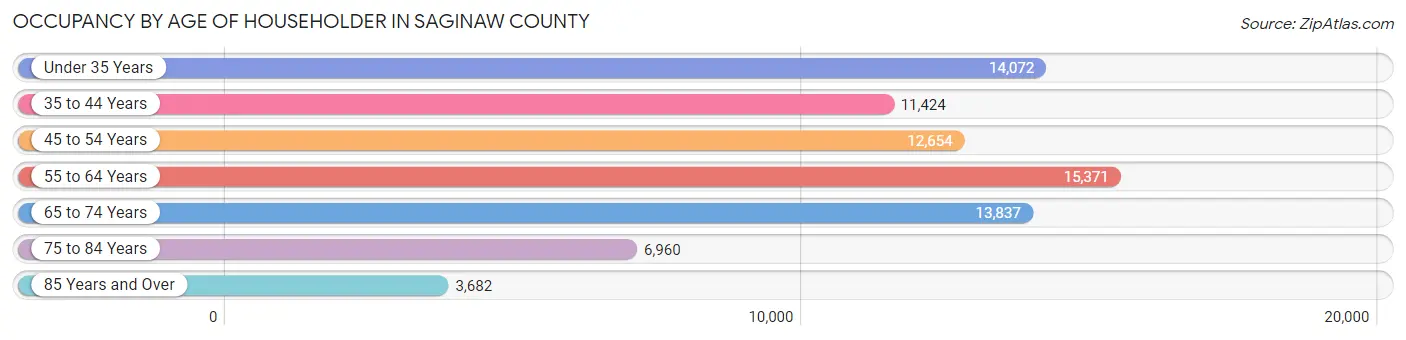
| Age Bracket | # Households | % Households |
| Under 35 Years | 14,072 | 18.0% |
| 35 to 44 Years | 11,424 | 14.6% |
| 45 to 54 Years | 12,654 | 16.2% |
| 55 to 64 Years | 15,371 | 19.7% |
| 65 to 74 Years | 13,837 | 17.7% |
| 75 to 84 Years | 6,960 | 8.9% |
| 85 Years and Over | 3,682 | 4.7% |
| Total | 78,000 | 100.0% |
Housing Finances in Saginaw County
Median Income by Occupancy in Saginaw County
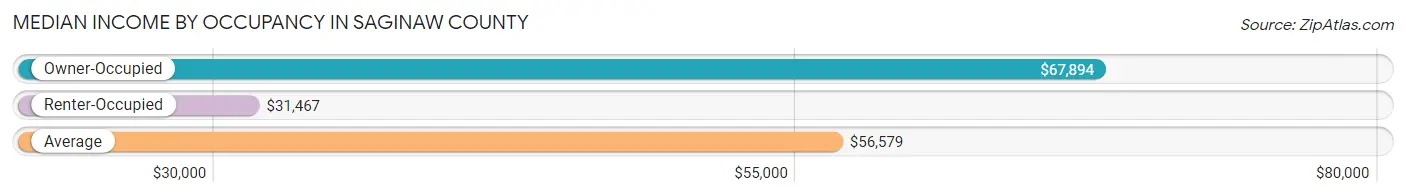
| Occupancy Type | # Households | Median Income |
| Owner-Occupied | 56,740 (72.7%) | $67,894 |
| Renter-Occupied | 21,260 (27.3%) | $31,467 |
| Average | 78,000 (100.0%) | $56,579 |
Occupancy by Householder Income Bracket in Saginaw County
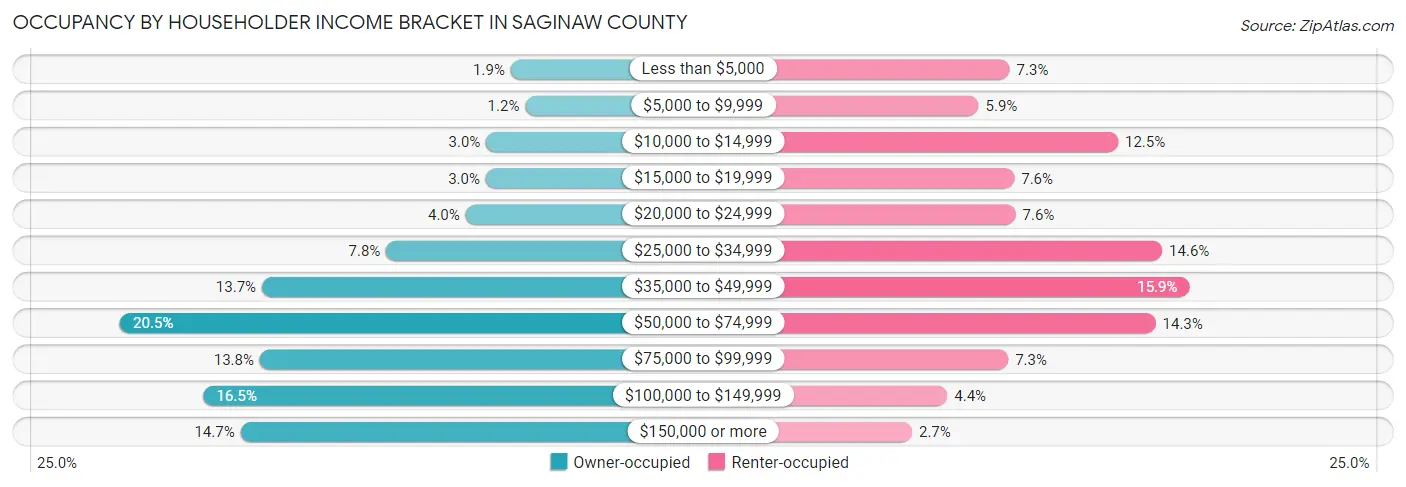
| Income Bracket | Owner-occupied | Renter-occupied |
| Less than $5,000 | 1,050 (1.8%) | 1,561 (7.3%) |
| $5,000 to $9,999 | 660 (1.2%) | 1,246 (5.9%) |
| $10,000 to $14,999 | 1,715 (3.0%) | 2,658 (12.5%) |
| $15,000 to $19,999 | 1,724 (3.0%) | 1,608 (7.6%) |
| $20,000 to $24,999 | 2,267 (4.0%) | 1,621 (7.6%) |
| $25,000 to $34,999 | 4,417 (7.8%) | 3,104 (14.6%) |
| $35,000 to $49,999 | 7,773 (13.7%) | 3,378 (15.9%) |
| $50,000 to $74,999 | 11,605 (20.4%) | 3,037 (14.3%) |
| $75,000 to $99,999 | 7,828 (13.8%) | 1,546 (7.3%) |
| $100,000 to $149,999 | 9,351 (16.5%) | 929 (4.4%) |
| $150,000 or more | 8,350 (14.7%) | 572 (2.7%) |
| Total | 56,740 (100.0%) | 21,260 (100.0%) |
Monthly Housing Cost Tiers in Saginaw County
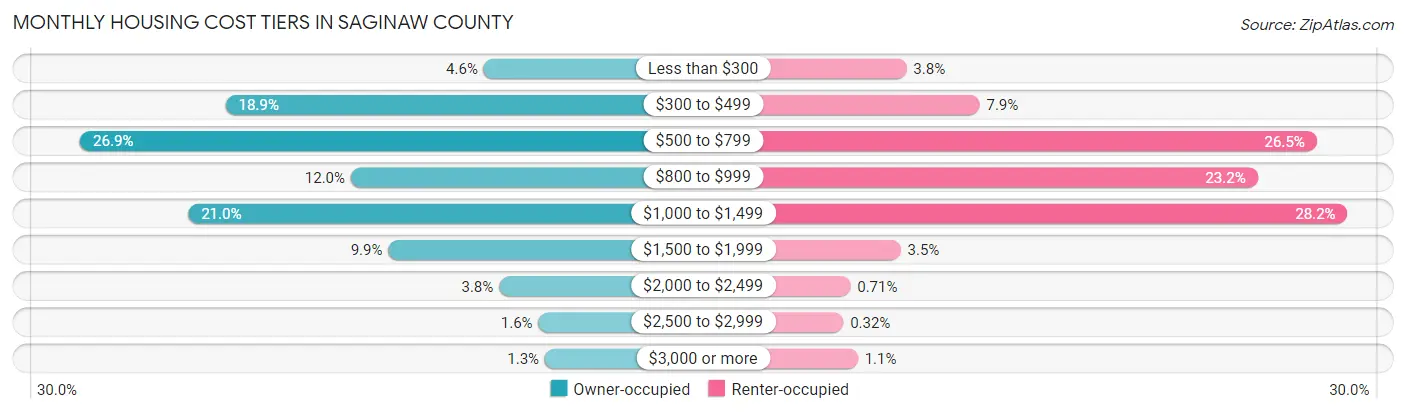
| Monthly Cost | Owner-occupied | Renter-occupied |
| Less than $300 | 2,633 (4.6%) | 811 (3.8%) |
| $300 to $499 | 10,726 (18.9%) | 1,668 (7.9%) |
| $500 to $799 | 15,279 (26.9%) | 5,627 (26.5%) |
| $800 to $999 | 6,796 (12.0%) | 4,932 (23.2%) |
| $1,000 to $1,499 | 11,894 (21.0%) | 5,990 (28.2%) |
| $1,500 to $1,999 | 5,625 (9.9%) | 741 (3.5%) |
| $2,000 to $2,499 | 2,150 (3.8%) | 150 (0.7%) |
| $2,500 to $2,999 | 921 (1.6%) | 67 (0.3%) |
| $3,000 or more | 716 (1.3%) | 238 (1.1%) |
| Total | 56,740 (100.0%) | 21,260 (100.0%) |
Physical Housing Characteristics in Saginaw County
Housing Structures in Saginaw County
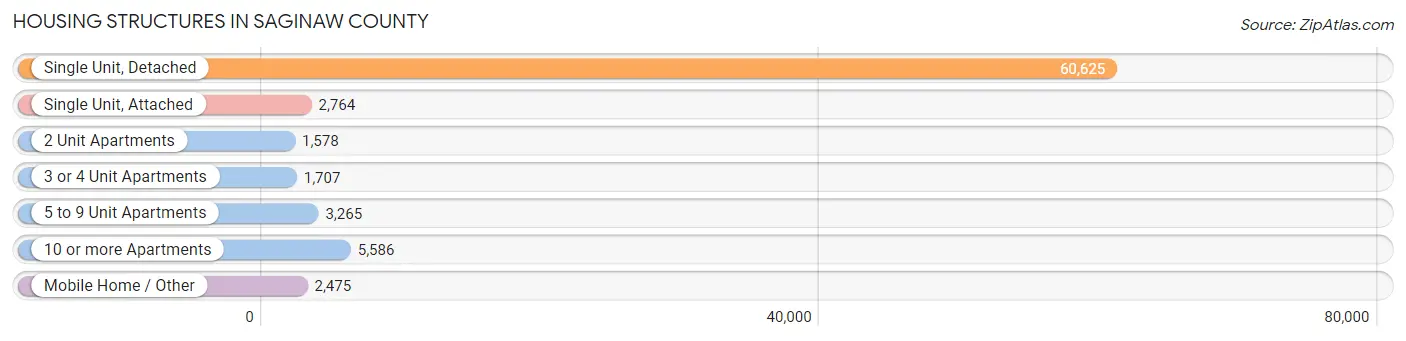
| Structure Type | # Housing Units | % Housing Units |
| Single Unit, Detached | 60,625 | 77.7% |
| Single Unit, Attached | 2,764 | 3.5% |
| 2 Unit Apartments | 1,578 | 2.0% |
| 3 or 4 Unit Apartments | 1,707 | 2.2% |
| 5 to 9 Unit Apartments | 3,265 | 4.2% |
| 10 or more Apartments | 5,586 | 7.2% |
| Mobile Home / Other | 2,475 | 3.2% |
| Total | 78,000 | 100.0% |
Housing Structures by Occupancy in Saginaw County
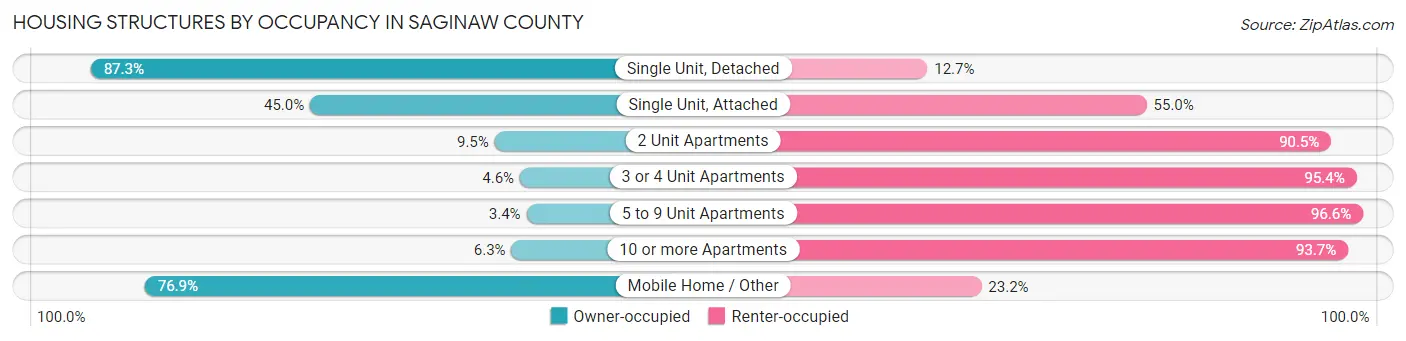
| Structure Type | Owner-occupied | Renter-occupied |
| Single Unit, Detached | 52,904 (87.3%) | 7,721 (12.7%) |
| Single Unit, Attached | 1,245 (45.0%) | 1,519 (55.0%) |
| 2 Unit Apartments | 150 (9.5%) | 1,428 (90.5%) |
| 3 or 4 Unit Apartments | 79 (4.6%) | 1,628 (95.4%) |
| 5 to 9 Unit Apartments | 110 (3.4%) | 3,155 (96.6%) |
| 10 or more Apartments | 350 (6.3%) | 5,236 (93.7%) |
| Mobile Home / Other | 1,902 (76.8%) | 573 (23.2%) |
| Total | 56,740 (72.7%) | 21,260 (27.3%) |
Housing Structures by Number of Rooms in Saginaw County
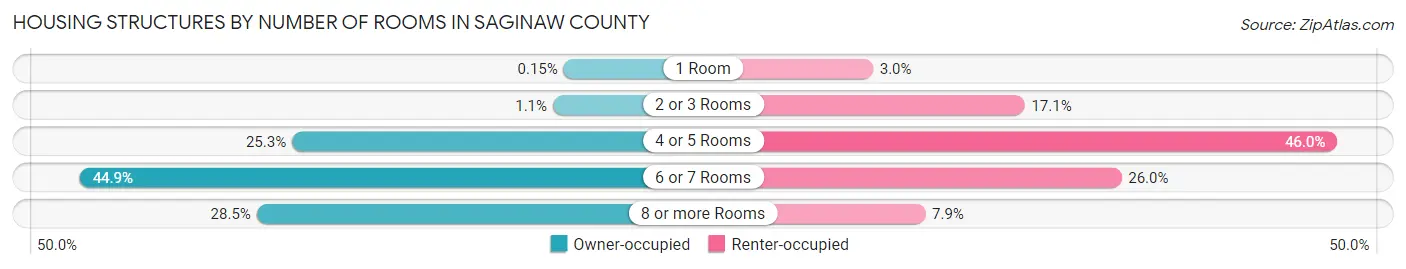
| Number of Rooms | Owner-occupied | Renter-occupied |
| 1 Room | 83 (0.2%) | 646 (3.0%) |
| 2 or 3 Rooms | 648 (1.1%) | 3,630 (17.1%) |
| 4 or 5 Rooms | 14,341 (25.3%) | 9,778 (46.0%) |
| 6 or 7 Rooms | 25,474 (44.9%) | 5,531 (26.0%) |
| 8 or more Rooms | 16,194 (28.5%) | 1,675 (7.9%) |
| Total | 56,740 (100.0%) | 21,260 (100.0%) |
Housing Structure by Heating Type in Saginaw County
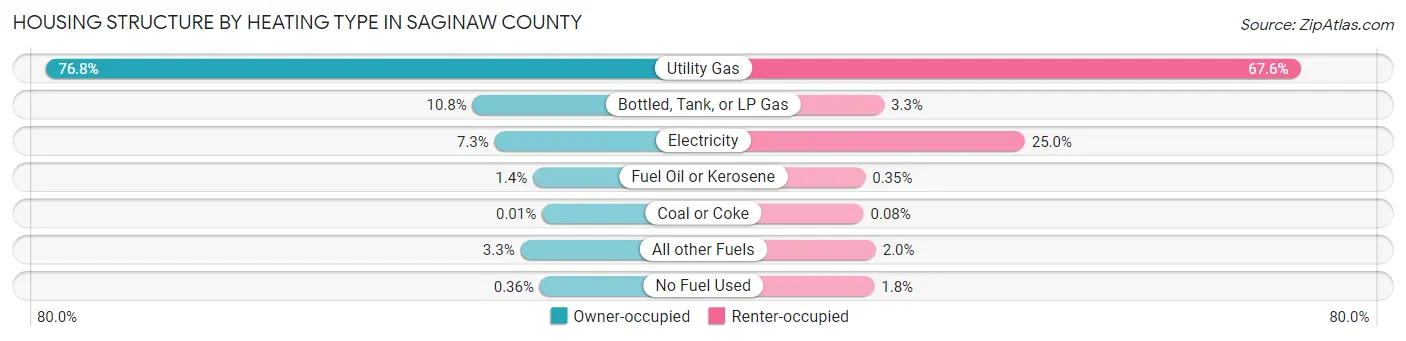
| Heating Type | Owner-occupied | Renter-occupied |
| Utility Gas | 43,575 (76.8%) | 14,369 (67.6%) |
| Bottled, Tank, or LP Gas | 6,100 (10.7%) | 692 (3.3%) |
| Electricity | 4,163 (7.3%) | 5,316 (25.0%) |
| Fuel Oil or Kerosene | 799 (1.4%) | 75 (0.4%) |
| Coal or Coke | 6 (0.0%) | 18 (0.1%) |
| All other Fuels | 1,895 (3.3%) | 418 (2.0%) |
| No Fuel Used | 202 (0.4%) | 372 (1.8%) |
| Total | 56,740 (100.0%) | 21,260 (100.0%) |
Household Vehicle Usage in Saginaw County
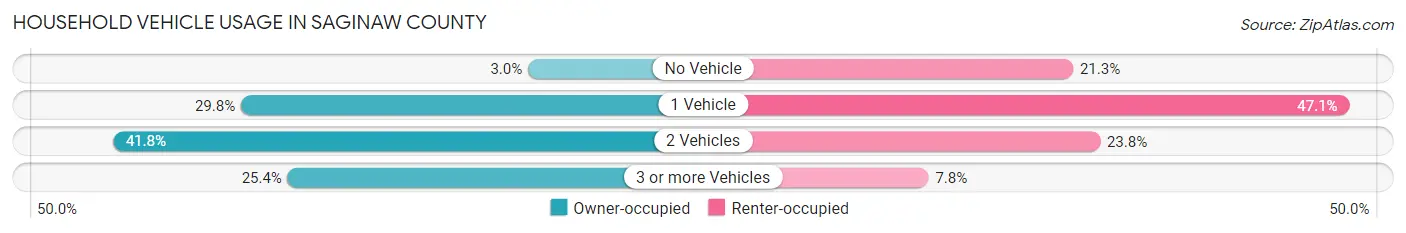
| Vehicles per Household | Owner-occupied | Renter-occupied |
| No Vehicle | 1,701 (3.0%) | 4,527 (21.3%) |
| 1 Vehicle | 16,908 (29.8%) | 10,012 (47.1%) |
| 2 Vehicles | 23,699 (41.8%) | 5,062 (23.8%) |
| 3 or more Vehicles | 14,432 (25.4%) | 1,659 (7.8%) |
| Total | 56,740 (100.0%) | 21,260 (100.0%) |
Real Estate & Mortgages in Saginaw County
Real Estate and Mortgage Overview in Saginaw County
| Characteristic | Without Mortgage | With Mortgage |
| Housing Units | 27,286 | 29,454 |
| Median Property Value | $113,000 | $145,700 |
| Median Household Income | $54,650 | $5,456 |
| Monthly Housing Costs | $513 | $695 |
| Real Estate Taxes | $1,904 | $1,205 |
Property Value by Mortgage Status in Saginaw County
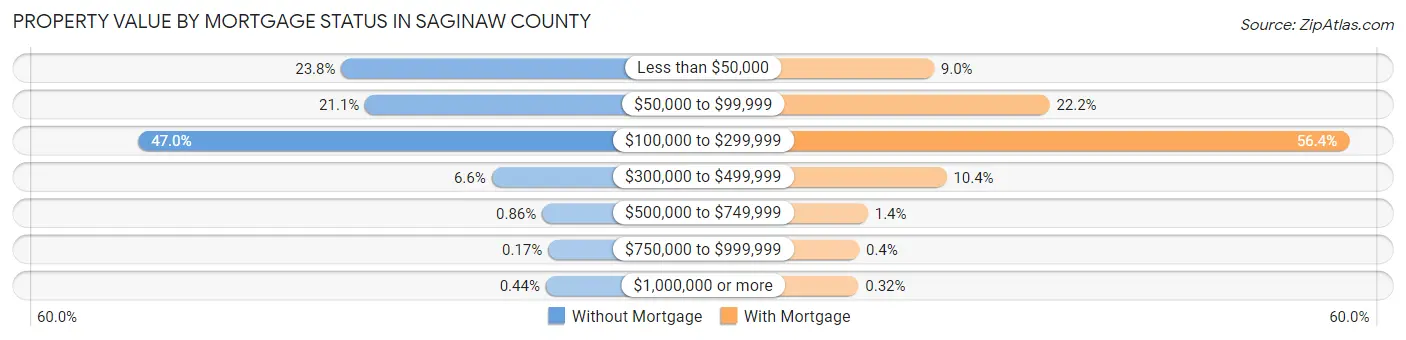
| Property Value | Without Mortgage | With Mortgage |
| Less than $50,000 | 6,497 (23.8%) | 2,635 (8.9%) |
| $50,000 to $99,999 | 5,751 (21.1%) | 6,526 (22.2%) |
| $100,000 to $299,999 | 12,828 (47.0%) | 16,609 (56.4%) |
| $300,000 to $499,999 | 1,808 (6.6%) | 3,060 (10.4%) |
| $500,000 to $749,999 | 235 (0.9%) | 413 (1.4%) |
| $750,000 to $999,999 | 47 (0.2%) | 117 (0.4%) |
| $1,000,000 or more | 120 (0.4%) | 94 (0.3%) |
| Total | 27,286 (100.0%) | 29,454 (100.0%) |
Household Income by Mortgage Status in Saginaw County
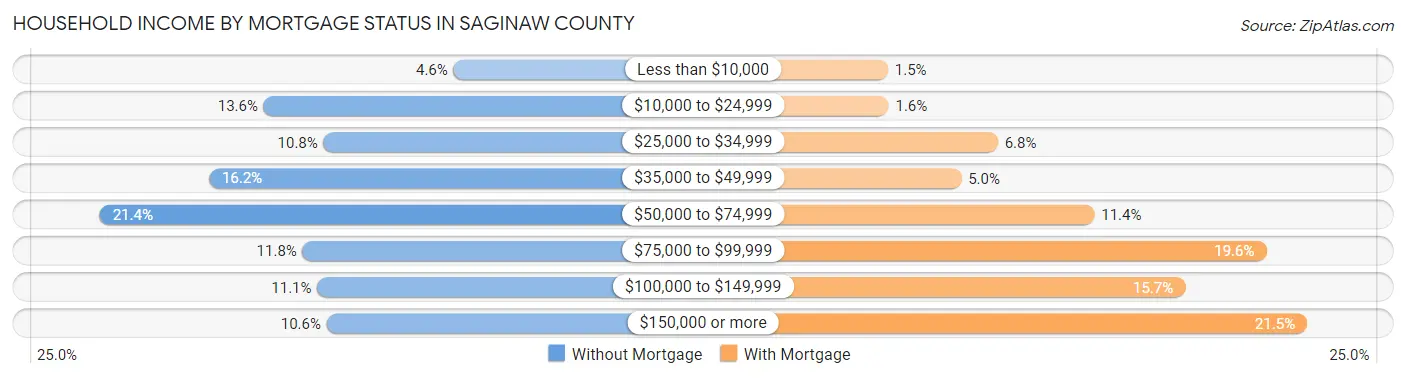
| Household Income | Without Mortgage | With Mortgage |
| Less than $10,000 | 1,248 (4.6%) | 455 (1.5%) |
| $10,000 to $24,999 | 3,713 (13.6%) | 462 (1.6%) |
| $25,000 to $34,999 | 2,935 (10.8%) | 1,993 (6.8%) |
| $35,000 to $49,999 | 4,425 (16.2%) | 1,482 (5.0%) |
| $50,000 to $74,999 | 5,844 (21.4%) | 3,348 (11.4%) |
| $75,000 to $99,999 | 3,208 (11.8%) | 5,761 (19.6%) |
| $100,000 to $149,999 | 3,019 (11.1%) | 4,620 (15.7%) |
| $150,000 or more | 2,894 (10.6%) | 6,332 (21.5%) |
| Total | 27,286 (100.0%) | 29,454 (100.0%) |
Property Value to Household Income Ratio in Saginaw County
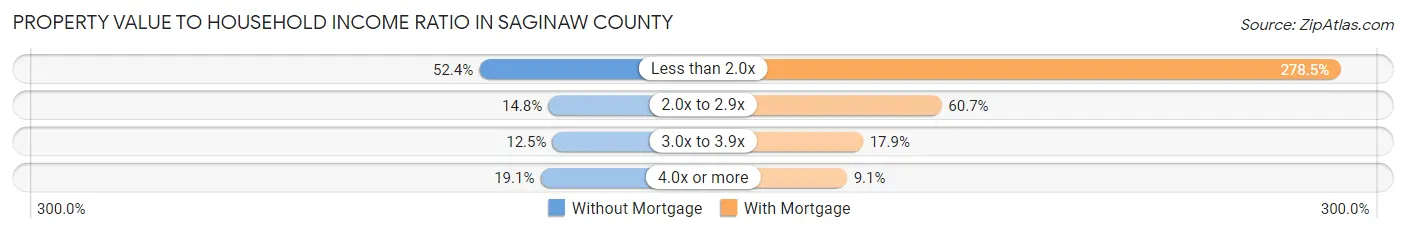
| Value-to-Income Ratio | Without Mortgage | With Mortgage |
| Less than 2.0x | 14,296 (52.4%) | 82,028 (278.5%) |
| 2.0x to 2.9x | 4,039 (14.8%) | 17,886 (60.7%) |
| 3.0x to 3.9x | 3,405 (12.5%) | 5,264 (17.9%) |
| 4.0x or more | 5,199 (19.1%) | 2,693 (9.1%) |
| Total | 27,286 (100.0%) | 29,454 (100.0%) |
Real Estate Taxes by Mortgage Status in Saginaw County
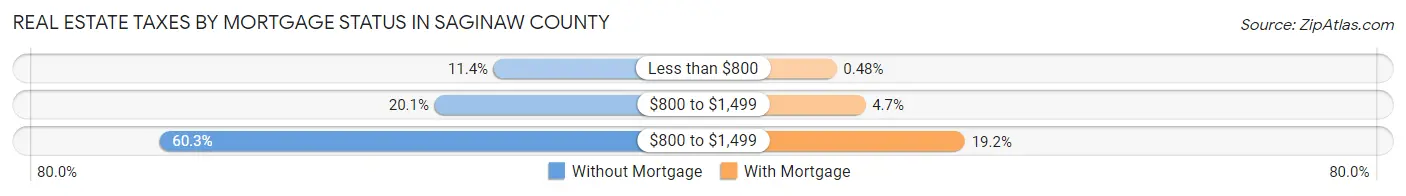
| Property Taxes | Without Mortgage | With Mortgage |
| Less than $800 | 3,116 (11.4%) | 141 (0.5%) |
| $800 to $1,499 | 5,473 (20.1%) | 1,385 (4.7%) |
| $800 to $1,499 | 16,455 (60.3%) | 5,666 (19.2%) |
| Total | 27,286 (100.0%) | 29,454 (100.0%) |
Health & Disability in Saginaw County
Health Insurance Coverage by Age in Saginaw County
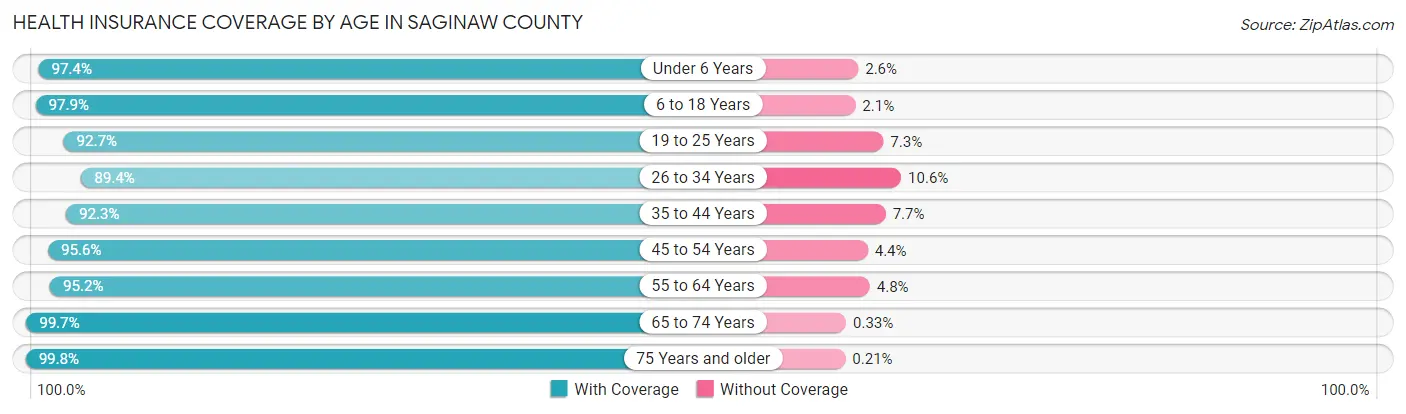
| Age Bracket | With Coverage | Without Coverage |
| Under 6 Years | 12,479 (97.4%) | 335 (2.6%) |
| 6 to 18 Years | 29,691 (97.9%) | 629 (2.1%) |
| 19 to 25 Years | 16,326 (92.7%) | 1,284 (7.3%) |
| 26 to 34 Years | 18,345 (89.4%) | 2,176 (10.6%) |
| 35 to 44 Years | 18,918 (92.3%) | 1,584 (7.7%) |
| 45 to 54 Years | 21,334 (95.6%) | 978 (4.4%) |
| 55 to 64 Years | 24,937 (95.2%) | 1,249 (4.8%) |
| 65 to 74 Years | 21,125 (99.7%) | 70 (0.3%) |
| 75 Years and older | 14,935 (99.8%) | 31 (0.2%) |
| Total | 178,090 (95.5%) | 8,336 (4.5%) |
Health Insurance Coverage by Citizenship Status in Saginaw County
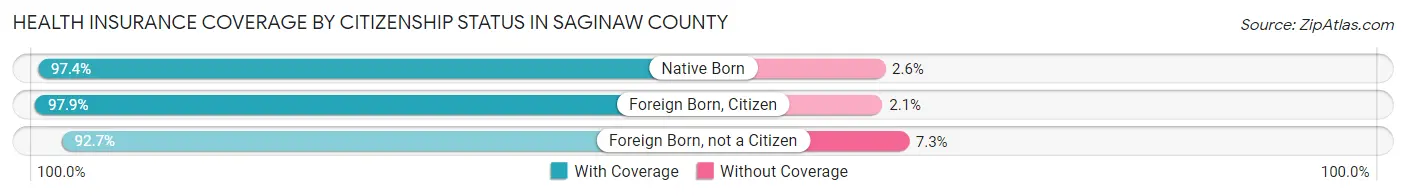
| Citizenship Status | With Coverage | Without Coverage |
| Native Born | 12,479 (97.4%) | 335 (2.6%) |
| Foreign Born, Citizen | 29,691 (97.9%) | 629 (2.1%) |
| Foreign Born, not a Citizen | 16,326 (92.7%) | 1,284 (7.3%) |
Health Insurance Coverage by Household Income in Saginaw County
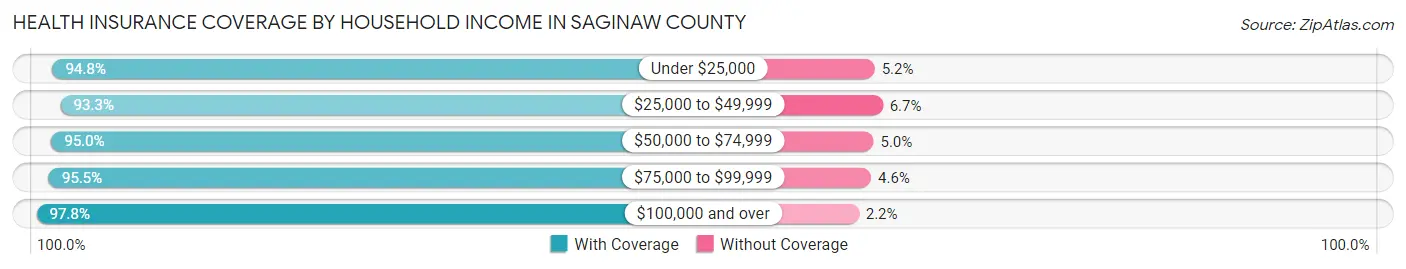
| Household Income | With Coverage | Without Coverage |
| Under $25,000 | 28,280 (94.8%) | 1,561 (5.2%) |
| $25,000 to $49,999 | 35,287 (93.3%) | 2,545 (6.7%) |
| $50,000 to $74,999 | 31,612 (95.0%) | 1,667 (5.0%) |
| $75,000 to $99,999 | 23,682 (95.5%) | 1,129 (4.5%) |
| $100,000 and over | 56,329 (97.8%) | 1,291 (2.2%) |
Public vs Private Health Insurance Coverage by Age in Saginaw County
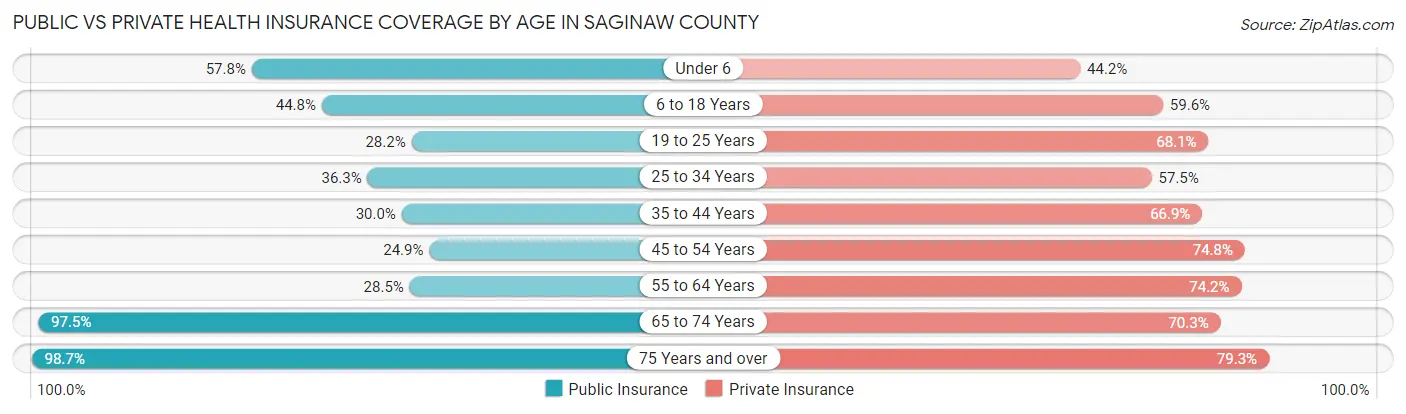
| Age Bracket | Public Insurance | Private Insurance |
| Under 6 | 7,412 (57.8%) | 5,668 (44.2%) |
| 6 to 18 Years | 13,594 (44.8%) | 18,071 (59.6%) |
| 19 to 25 Years | 4,964 (28.2%) | 11,984 (68.0%) |
| 25 to 34 Years | 7,458 (36.3%) | 11,801 (57.5%) |
| 35 to 44 Years | 6,153 (30.0%) | 13,713 (66.9%) |
| 45 to 54 Years | 5,553 (24.9%) | 16,689 (74.8%) |
| 55 to 64 Years | 7,472 (28.5%) | 19,419 (74.2%) |
| 65 to 74 Years | 20,663 (97.5%) | 14,895 (70.3%) |
| 75 Years and over | 14,773 (98.7%) | 11,863 (79.3%) |
| Total | 88,042 (47.2%) | 124,103 (66.6%) |
Disability Status by Sex by Age in Saginaw County
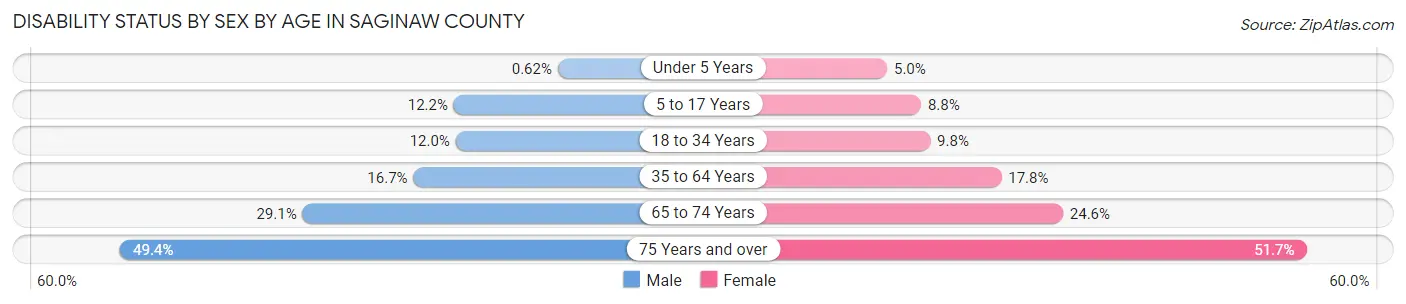
| Age Bracket | Male | Female |
| Under 5 Years | 34 (0.6%) | 265 (5.0%) |
| 5 to 17 Years | 1,872 (12.2%) | 1,274 (8.8%) |
| 18 to 34 Years | 2,400 (12.0%) | 2,041 (9.8%) |
| 35 to 64 Years | 5,568 (16.7%) | 6,333 (17.8%) |
| 65 to 74 Years | 2,885 (29.0%) | 2,773 (24.6%) |
| 75 Years and over | 2,969 (49.4%) | 4,630 (51.7%) |
Disability Class by Sex by Age in Saginaw County
Disability Class: Hearing Difficulty
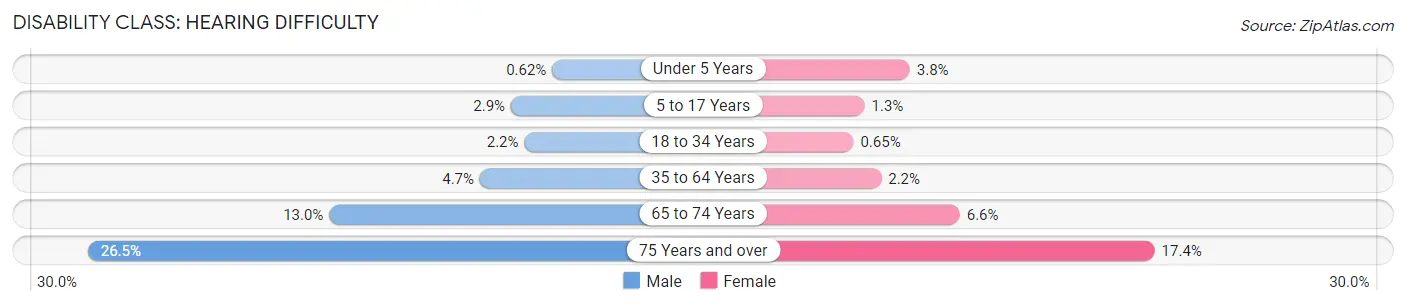
| Age Bracket | Male | Female |
| Under 5 Years | 34 (0.6%) | 199 (3.8%) |
| 5 to 17 Years | 448 (2.9%) | 183 (1.3%) |
| 18 to 34 Years | 435 (2.2%) | 135 (0.6%) |
| 35 to 64 Years | 1,552 (4.6%) | 785 (2.2%) |
| 65 to 74 Years | 1,295 (13.0%) | 740 (6.6%) |
| 75 Years and over | 1,593 (26.5%) | 1,559 (17.4%) |
Disability Class: Vision Difficulty

| Age Bracket | Male | Female |
| Under 5 Years | 0 (0.0%) | 159 (3.0%) |
| 5 to 17 Years | 127 (0.8%) | 296 (2.1%) |
| 18 to 34 Years | 439 (2.2%) | 170 (0.8%) |
| 35 to 64 Years | 725 (2.2%) | 918 (2.6%) |
| 65 to 74 Years | 266 (2.7%) | 446 (4.0%) |
| 75 Years and over | 633 (10.5%) | 993 (11.1%) |
Disability Class: Cognitive Difficulty

| Age Bracket | Male | Female |
| 5 to 17 Years | 1,384 (9.0%) | 810 (5.6%) |
| 18 to 34 Years | 1,572 (7.9%) | 1,291 (6.2%) |
| 35 to 64 Years | 1,980 (5.9%) | 2,800 (7.9%) |
| 65 to 74 Years | 468 (4.7%) | 503 (4.5%) |
| 75 Years and over | 645 (10.7%) | 1,093 (12.2%) |
Disability Class: Ambulatory Difficulty
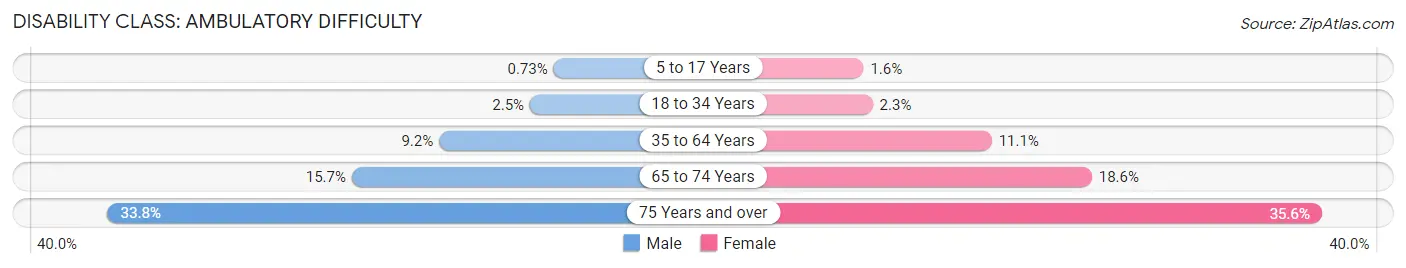
| Age Bracket | Male | Female |
| 5 to 17 Years | 112 (0.7%) | 233 (1.6%) |
| 18 to 34 Years | 496 (2.5%) | 474 (2.3%) |
| 35 to 64 Years | 3,078 (9.2%) | 3,968 (11.1%) |
| 65 to 74 Years | 1,560 (15.7%) | 2,090 (18.6%) |
| 75 Years and over | 2,035 (33.8%) | 3,189 (35.6%) |
Disability Class: Self-Care Difficulty
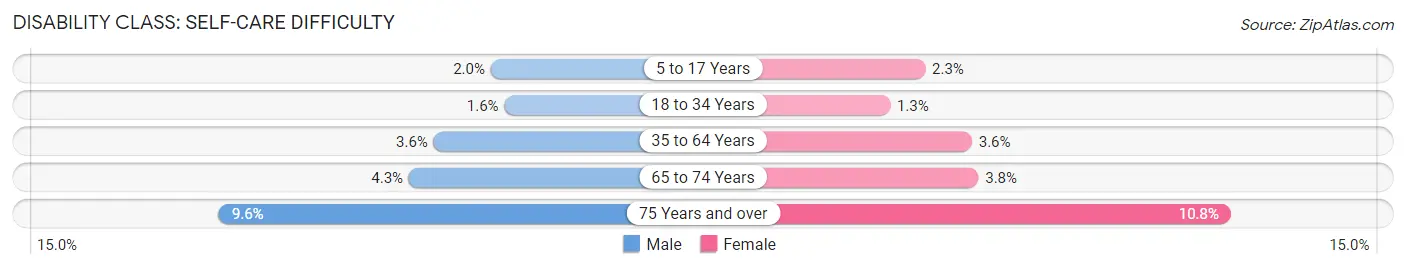
| Age Bracket | Male | Female |
| 5 to 17 Years | 310 (2.0%) | 335 (2.3%) |
| 18 to 34 Years | 329 (1.6%) | 277 (1.3%) |
| 35 to 64 Years | 1,202 (3.6%) | 1,290 (3.6%) |
| 65 to 74 Years | 427 (4.3%) | 428 (3.8%) |
| 75 Years and over | 577 (9.6%) | 969 (10.8%) |
Technology Access in Saginaw County
Computing Device Access in Saginaw County
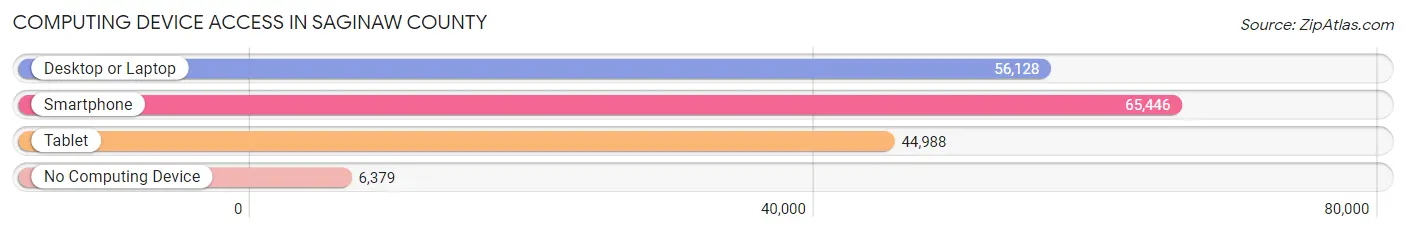
| Device Type | # Households | % Households |
| Desktop or Laptop | 56,128 | 72.0% |
| Smartphone | 65,446 | 83.9% |
| Tablet | 44,988 | 57.7% |
| No Computing Device | 6,379 | 8.2% |
| Total | 78,000 | 100.0% |
Internet Access in Saginaw County
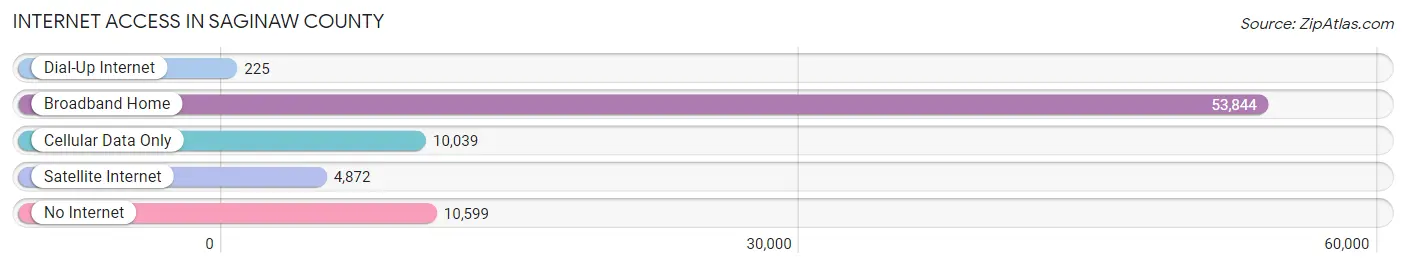
| Internet Type | # Households | % Households |
| Dial-Up Internet | 225 | 0.3% |
| Broadband Home | 53,844 | 69.0% |
| Cellular Data Only | 10,039 | 12.9% |
| Satellite Internet | 4,872 | 6.2% |
| No Internet | 10,599 | 13.6% |
| Total | 78,000 | 100.0% |
Saginaw County Summary
Saginaw County is located in the east-central region of Michigan, and is part of the Great Lakes Bay Region. It is bordered by Bay County to the north, Midland County to the west, Tuscola County to the south, and Genesee County to the east. The county seat is Saginaw, and the county has a total area of 583 square miles, with a population of 200,169 as of the 2010 census.
History
Saginaw County was established in 1822, and was named after the Saginaw River, which was named by the Ojibwe people. The county was originally part of the larger Midland County, but was split off in 1822. The county was initially populated by Native Americans, primarily the Ojibwe, who had lived in the area for centuries. The first European settlers arrived in the area in the early 19th century, and the county was officially organized in 1835.
The county experienced rapid growth in the late 19th and early 20th centuries, due to the lumber industry. The county was home to several large sawmills, and the population grew rapidly as people moved to the area to work in the mills. The county also experienced a large influx of immigrants from Germany, Poland, and other European countries.
The county was also home to several large automotive factories, which provided jobs for many of the county’s residents. The automotive industry was a major part of the county’s economy until the late 20th century, when many of the factories closed due to outsourcing and other economic factors.
Geography
Saginaw County is located in the east-central region of Michigan, and is part of the Great Lakes Bay Region. It is bordered by Bay County to the north, Midland County to the west, Tuscola County to the south, and Genesee County to the east. The county has a total area of 583 square miles, with a population of 200,169 as of the 2010 census.
The county is mostly flat, with some rolling hills in the northern and western parts of the county. The Saginaw River runs through the county, and there are several lakes and streams in the area. The county is home to several state parks, including Shiawassee National Wildlife Refuge, Bay City State Recreation Area, and Saginaw Bay State Park.
Economy
Saginaw County’s economy is largely based on manufacturing, healthcare, and retail. The county is home to several large automotive factories, including General Motors, Delphi, and Dow Chemical. The county is also home to several healthcare facilities, including Covenant HealthCare, St. Mary’s of Michigan, and McLaren Health Care.
Retail is also an important part of the county’s economy, with several large shopping malls and retail centers. The county is also home to several large employers, including Dow Corning, Dow Chemical, and Nexteer Automotive.
Demographics
As of the 2010 census, the population of Saginaw County was 200,169. The racial makeup of the county was 79.2% White, 14.3% African American, 0.7% Native American, 1.3% Asian, 0.1% Pacific Islander, 1.7% from other races, and 2.9% from two or more races. Hispanic or Latino of any race were 4.3% of the population.
The median income for a household in the county was $41,945, and the median income for a family was $51,945. The per capita income for the county was $20,945. About 15.2% of the population was below the poverty line.
Saginaw County is a diverse and vibrant county, with a rich history and a strong economy. The county is home to several large employers, and is a popular destination for tourists and outdoor enthusiasts. The county is also home to several state parks, and is a great place to live, work, and play.
Common Questions
What is the Total Population of Saginaw County?
Total Population of Saginaw County is 189,821.
What is the Total Male Population of Saginaw County?
Total Male Population of Saginaw County is 92,665.
What is the Total Female Population of Saginaw County?
Total Female Population of Saginaw County is 97,156.
What is the Ratio of Males per 100 Females in Saginaw County?
There are 95.38 Males per 100 Females in Saginaw County.
What is the Ratio of Females per 100 Males in Saginaw County?
There are 104.85 Females per 100 Males in Saginaw County.
What is the Median Population Age in Saginaw County?
Median Population Age in Saginaw County is 41.0 Years.
What is the Average Family Size in Saginaw County
Average Family Size in Saginaw County is 2.9 People.
What is the Average Household Size in Saginaw County
Average Household Size in Saginaw County is 2.4 People.
What is Per Capita Income in Saginaw County?
Per Capita income in Saginaw County is $32,839.
What is the Median Family Income in Saginaw County?
Median Family Income in Saginaw County is $71,728.
What is the Median Household income in Saginaw County?
Median Household Income in Saginaw County is $56,579.
What is Income or Wage Gap in Saginaw County?
Income or Wage Gap in Saginaw County is 31.0%.
Women in Saginaw County earn 69.0 cents for every dollar earned by a man.
What is Family Income Deficit in Saginaw County?
Family Income Deficit in Saginaw County is $11,648.
Families that are below poverty line in Saginaw County earn $11,648 less on average than the poverty threshold level.
What is Inequality or Gini Index in Saginaw County?
Inequality or Gini Index in Saginaw County is 0.47.
How Large is the Labor Force in Saginaw County?
There are 87,356 People in the Labor Forcein in Saginaw County.
What is the Percentage of People in the Labor Force in Saginaw County?
56.6% of People are in the Labor Force in Saginaw County.
What is the Unemployment Rate in Saginaw County?
Unemployment Rate in Saginaw County is 6.6%.