Roscommon County, MI
Roscommon County Map

Roscommon County Overview
23,556
TOTAL POPULATION
11,891
MALE POPULATION
11,665
FEMALE POPULATION
101.94
MALES / 100 FEMALES
98.10
FEMALES / 100 MALES
57.0
MEDIAN AGE
2.6
AVG FAMILY SIZE
2.0
AVG HOUSEHOLD SIZE
$34,587
PER CAPITA INCOME
$63,425
AVG FAMILY INCOME
$49,898
AVG HOUSEHOLD INCOME
35.7%
WAGE / INCOME GAP [ % ]
64.3¢/ $1
WAGE / INCOME GAP [ $ ]
$10,863
FAMILY INCOME DEFICIT
0.47
INEQUALITY / GINI INDEX
8,623
LABOR FORCE [ PEOPLE ]
41.9%
PERCENT IN LABOR FORCE
5.7%
UNEMPLOYMENT RATE
Roscommon County Area Codes
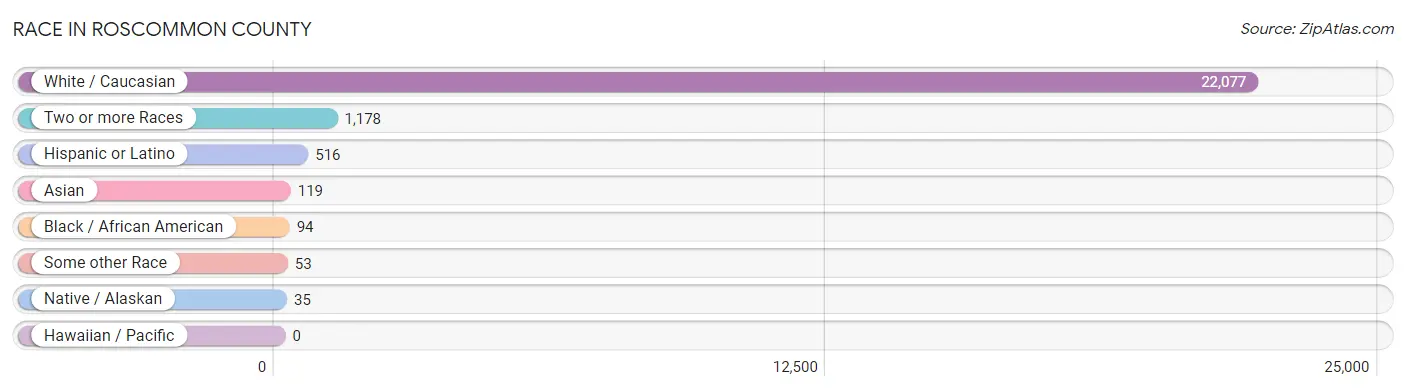
Race in Roscommon County
The most populous races in Roscommon County are White / Caucasian (22,077 | 93.7%), Two or more Races (1,178 | 5.0%), and Hispanic or Latino (516 | 2.2%).
| Race | # Population | % Population |
| Asian | 119 | 0.5% |
| Black / African American | 94 | 0.4% |
| Hawaiian / Pacific | 0 | 0.0% |
| Hispanic or Latino | 516 | 2.2% |
| Native / Alaskan | 35 | 0.2% |
| White / Caucasian | 22,077 | 93.7% |
| Two or more Races | 1,178 | 5.0% |
| Some other Race | 53 | 0.2% |
| Total | 23,556 | 100.0% |
Ancestry in Roscommon County
The most populous ancestries reported in Roscommon County are German (5,914 | 25.1%), English (3,498 | 14.8%), Irish (2,876 | 12.2%), Polish (2,155 | 9.1%), and French (1,419 | 6.0%), together accounting for 67.3% of all Roscommon County residents.

| Ancestry | # Population | % Population |
| African | 3 | 0.0% |
| American | 1,274 | 5.4% |
| Apache | 2 | 0.0% |
| Arab | 113 | 0.5% |
| Armenian | 10 | 0.0% |
| Austrian | 68 | 0.3% |
| Belgian | 74 | 0.3% |
| Bhutanese | 25 | 0.1% |
| Blackfeet | 41 | 0.2% |
| British | 71 | 0.3% |
| Bulgarian | 6 | 0.0% |
| Burmese | 112 | 0.5% |
| Canadian | 103 | 0.4% |
| Central American | 36 | 0.2% |
| Cherokee | 111 | 0.5% |
| Chippewa | 23 | 0.1% |
| Choctaw | 1 | 0.0% |
| Colombian | 8 | 0.0% |
| Croatian | 62 | 0.3% |
| Cuban | 56 | 0.2% |
| Czech | 99 | 0.4% |
| Czechoslovakian | 137 | 0.6% |
| Danish | 150 | 0.6% |
| Dutch | 647 | 2.8% |
| Eastern European | 42 | 0.2% |
| English | 3,498 | 14.8% |
| European | 236 | 1.0% |
| Finnish | 201 | 0.9% |
| French | 1,419 | 6.0% |
| French American Indian | 55 | 0.2% |
| French Canadian | 970 | 4.1% |
| German | 5,914 | 25.1% |
| German Russian | 16 | 0.1% |
| Greek | 26 | 0.1% |
| Guatemalan | 7 | 0.0% |
| Honduran | 1 | 0.0% |
| Hungarian | 256 | 1.1% |
| Indian (Asian) | 43 | 0.2% |
| Irish | 2,876 | 12.2% |
| Iroquois | 1 | 0.0% |
| Italian | 851 | 3.6% |
| Jamaican | 2 | 0.0% |
| Korean | 31 | 0.1% |
| Lebanese | 91 | 0.4% |
| Lithuanian | 85 | 0.4% |
| Macedonian | 4 | 0.0% |
| Maltese | 39 | 0.2% |
| Mexican | 289 | 1.2% |
| Northern European | 7 | 0.0% |
| Norwegian | 87 | 0.4% |
| Ottawa | 2 | 0.0% |
| Pennsylvania German | 31 | 0.1% |
| Peruvian | 6 | 0.0% |
| Polish | 2,155 | 9.1% |
| Portuguese | 9 | 0.0% |
| Potawatomi | 6 | 0.0% |
| Puerto Rican | 65 | 0.3% |
| Romanian | 22 | 0.1% |
| Russian | 83 | 0.4% |
| Salvadoran | 28 | 0.1% |
| Scandinavian | 75 | 0.3% |
| Scotch-Irish | 333 | 1.4% |
| Scottish | 741 | 3.2% |
| Seminole | 25 | 0.1% |
| Serbian | 5 | 0.0% |
| Slovak | 52 | 0.2% |
| Slovene | 11 | 0.1% |
| South American | 14 | 0.1% |
| Spaniard | 23 | 0.1% |
| Sri Lankan | 23 | 0.1% |
| Subsaharan African | 3 | 0.0% |
| Swedish | 268 | 1.1% |
| Swiss | 44 | 0.2% |
| Syrian | 8 | 0.0% |
| Thai | 21 | 0.1% |
| Ukrainian | 121 | 0.5% |
| Welsh | 90 | 0.4% |
| Yugoslavian | 41 | 0.2% | View All 78 Rows |
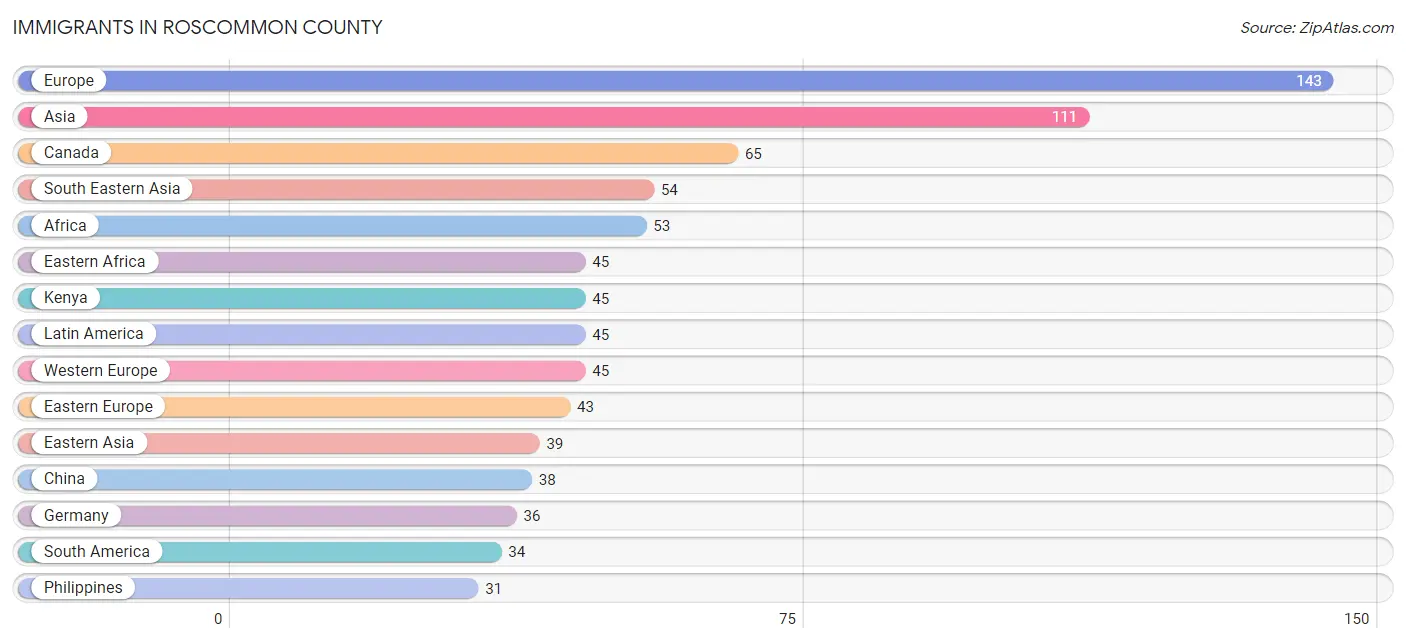
Immigrants in Roscommon County
The most numerous immigrant groups reported in Roscommon County came from Europe (143 | 0.6%), Asia (111 | 0.5%), Canada (65 | 0.3%), South Eastern Asia (54 | 0.2%), and Africa (53 | 0.2%), together accounting for 1.8% of all Roscommon County residents.
| Immigration Origin | # Population | % Population |
| Africa | 53 | 0.2% |
| Asia | 111 | 0.5% |
| Canada | 65 | 0.3% |
| Caribbean | 5 | 0.0% |
| Central America | 6 | 0.0% |
| China | 38 | 0.2% |
| Colombia | 28 | 0.1% |
| Cuba | 5 | 0.0% |
| Eastern Africa | 45 | 0.2% |
| Eastern Asia | 39 | 0.2% |
| Eastern Europe | 43 | 0.2% |
| England | 22 | 0.1% |
| Europe | 143 | 0.6% |
| France | 9 | 0.0% |
| Germany | 36 | 0.2% |
| Greece | 2 | 0.0% |
| Honduras | 1 | 0.0% |
| India | 18 | 0.1% |
| Italy | 18 | 0.1% |
| Kenya | 45 | 0.2% |
| Korea | 1 | 0.0% |
| Latin America | 45 | 0.2% |
| Mexico | 5 | 0.0% |
| North Macedonia | 4 | 0.0% |
| Northern Europe | 30 | 0.1% |
| Peru | 6 | 0.0% |
| Philippines | 31 | 0.1% |
| Poland | 26 | 0.1% |
| Russia | 1 | 0.0% |
| Scotland | 5 | 0.0% |
| South Africa | 8 | 0.0% |
| South America | 34 | 0.1% |
| South Central Asia | 18 | 0.1% |
| South Eastern Asia | 54 | 0.2% |
| Southern Europe | 25 | 0.1% |
| Ukraine | 7 | 0.0% |
| Vietnam | 23 | 0.1% |
| Western Europe | 45 | 0.2% | View All 38 Rows |
Sex and Age in Roscommon County
Sex and Age in Roscommon County
The most populous age groups in Roscommon County are 65 to 69 Years (1,464 | 12.3%) for men and 60 to 64 Years (1,312 | 11.3%) for women.

| Age Bracket | Male | Female |
| Under 5 Years | 411 (3.5%) | 436 (3.7%) |
| 5 to 9 Years | 501 (4.2%) | 513 (4.4%) |
| 10 to 14 Years | 493 (4.2%) | 423 (3.6%) |
| 15 to 19 Years | 518 (4.4%) | 453 (3.9%) |
| 20 to 24 Years | 505 (4.3%) | 395 (3.4%) |
| 25 to 29 Years | 459 (3.9%) | 485 (4.2%) |
| 30 to 34 Years | 445 (3.7%) | 509 (4.4%) |
| 35 to 39 Years | 436 (3.7%) | 390 (3.3%) |
| 40 to 44 Years | 641 (5.4%) | 547 (4.7%) |
| 45 to 49 Years | 591 (5.0%) | 596 (5.1%) |
| 50 to 54 Years | 704 (5.9%) | 728 (6.2%) |
| 55 to 59 Years | 967 (8.1%) | 1,024 (8.8%) |
| 60 to 64 Years | 1,273 (10.7%) | 1,312 (11.3%) |
| 65 to 69 Years | 1,464 (12.3%) | 1,232 (10.6%) |
| 70 to 74 Years | 1,025 (8.6%) | 1,064 (9.1%) |
| 75 to 79 Years | 682 (5.7%) | 617 (5.3%) |
| 80 to 84 Years | 442 (3.7%) | 592 (5.1%) |
| 85 Years and over | 334 (2.8%) | 349 (3.0%) |
| Total | 11,891 (100.0%) | 11,665 (100.0%) |
Families and Households in Roscommon County
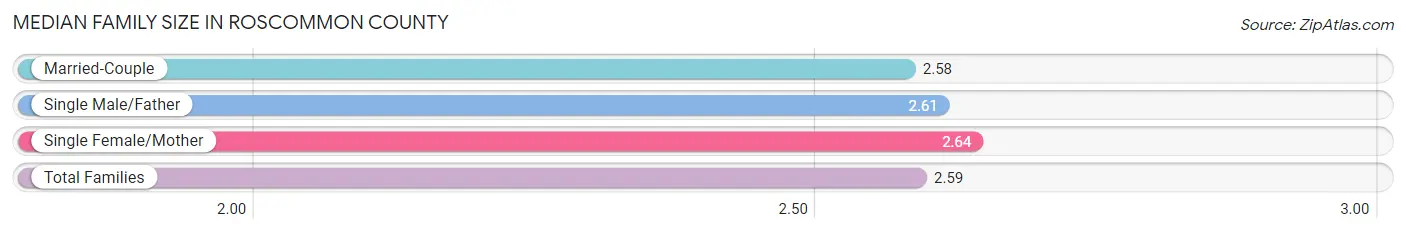
Median Family Size in Roscommon County
The median family size in Roscommon County is 2.59 persons per family, with single female/mother families (878 | 13.2%) accounting for the largest median family size of 2.64 persons per family. On the other hand, married-couple families (5,298 | 79.8%) represent the smallest median family size with 2.58 persons per family.
| Family Type | # Families | Family Size |
| Married-Couple | 5,298 (79.8%) | 2.58 |
| Single Male/Father | 459 (6.9%) | 2.61 |
| Single Female/Mother | 878 (13.2%) | 2.64 |
| Total Families | 6,635 (100.0%) | 2.59 |
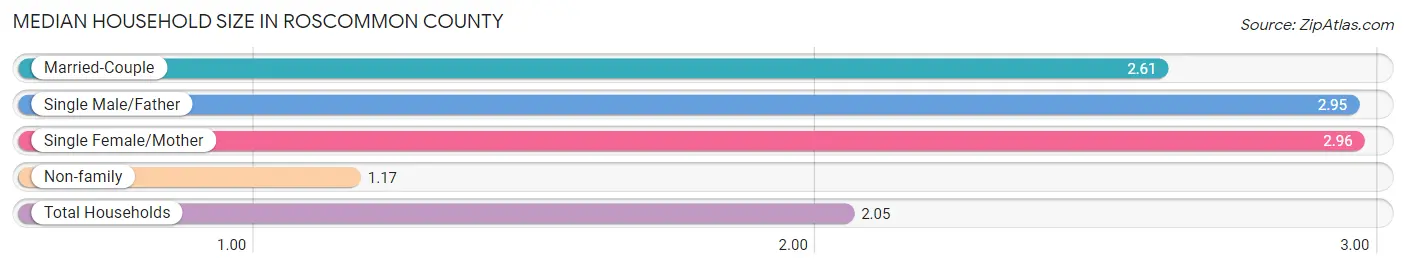
Median Household Size in Roscommon County
The median household size in Roscommon County is 2.05 persons per household, with single female/mother households (878 | 7.7%) accounting for the largest median household size of 2.96 persons per household. non-family households (4,723 | 41.6%) represent the smallest median household size with 1.17 persons per household.
| Household Type | # Households | Household Size |
| Married-Couple | 5,298 (46.7%) | 2.61 |
| Single Male/Father | 459 (4.0%) | 2.95 |
| Single Female/Mother | 878 (7.7%) | 2.96 |
| Non-family | 4,723 (41.6%) | 1.17 |
| Total Households | 11,358 (100.0%) | 2.05 |
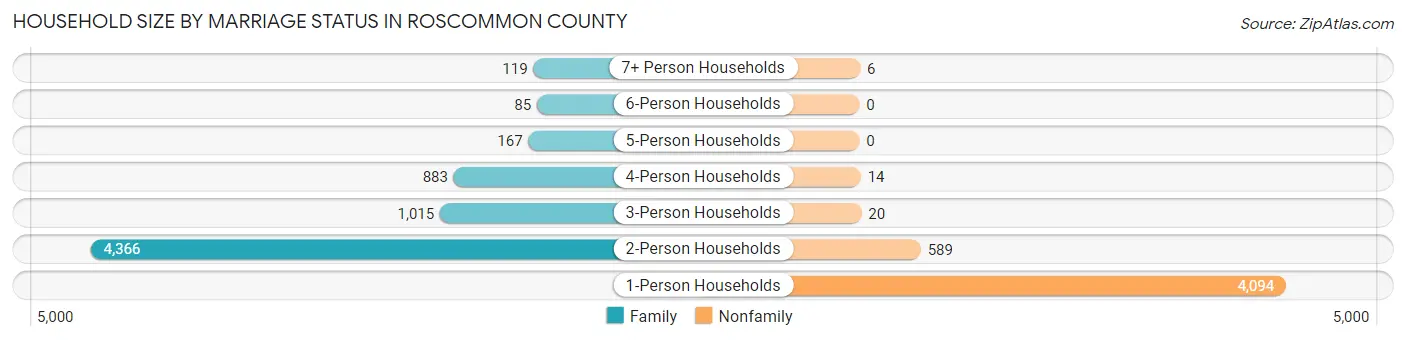
Household Size by Marriage Status in Roscommon County
Out of a total of 11,358 households in Roscommon County, 6,635 (58.4%) are family households, while 4,723 (41.6%) are nonfamily households. The most numerous type of family households are 2-person households, comprising 4,366, and the most common type of nonfamily households are 1-person households, comprising 4,094.
| Household Size | Family Households | Nonfamily Households |
| 1-Person Households | - | 4,094 (36.0%) |
| 2-Person Households | 4,366 (38.4%) | 589 (5.2%) |
| 3-Person Households | 1,015 (8.9%) | 20 (0.2%) |
| 4-Person Households | 883 (7.8%) | 14 (0.1%) |
| 5-Person Households | 167 (1.5%) | 0 (0.0%) |
| 6-Person Households | 85 (0.7%) | 0 (0.0%) |
| 7+ Person Households | 119 (1.1%) | 6 (0.1%) |
| Total | 6,635 (58.4%) | 4,723 (41.6%) |
Female Fertility in Roscommon County
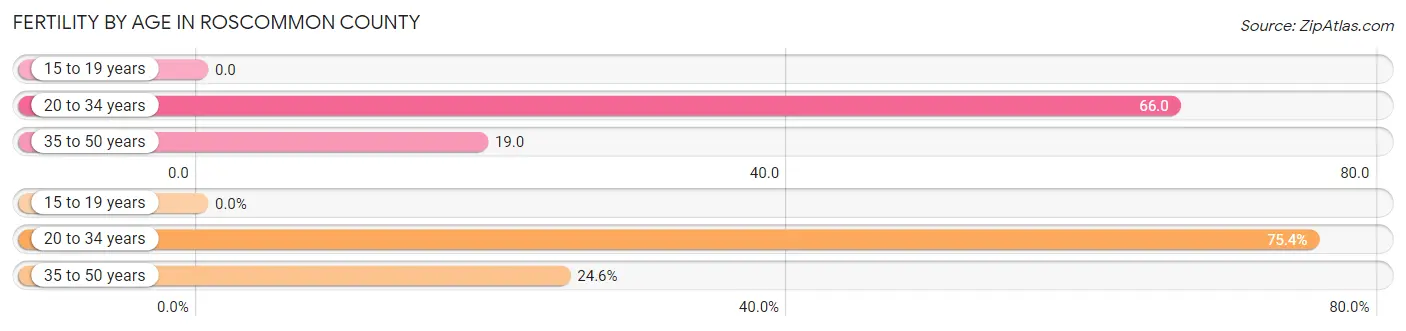
Fertility by Age in Roscommon County
Average fertility rate in Roscommon County is 35.0 births per 1,000 women. Women in the age bracket of 20 to 34 years have the highest fertility rate with 66.0 births per 1,000 women. Women in the age bracket of 20 to 34 years acount for 75.4% of all women with births.
| Age Bracket | Women with Births | Births / 1,000 Women |
| 15 to 19 years | 0 (0.0%) | 0.0 |
| 20 to 34 years | 92 (75.4%) | 66.0 |
| 35 to 50 years | 30 (24.6%) | 19.0 |
| Total | 122 (100.0%) | 35.0 |
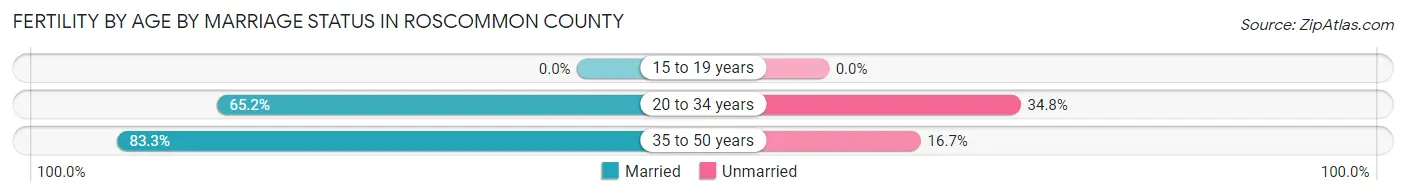
Fertility by Age by Marriage Status in Roscommon County
69.7% of women with births (122) in Roscommon County are married. The highest percentage of unmarried women with births falls into 20 to 34 years age bracket with 34.8% of them unmarried at the time of birth, while the lowest percentage of unmarried women with births belong to 35 to 50 years age bracket with 16.7% of them unmarried.
| Age Bracket | Married | Unmarried |
| 15 to 19 years | 0 (0.0%) | 0 (0.0%) |
| 20 to 34 years | 60 (65.2%) | 32 (34.8%) |
| 35 to 50 years | 25 (83.3%) | 5 (16.7%) |
| Total | 85 (69.7%) | 37 (30.3%) |
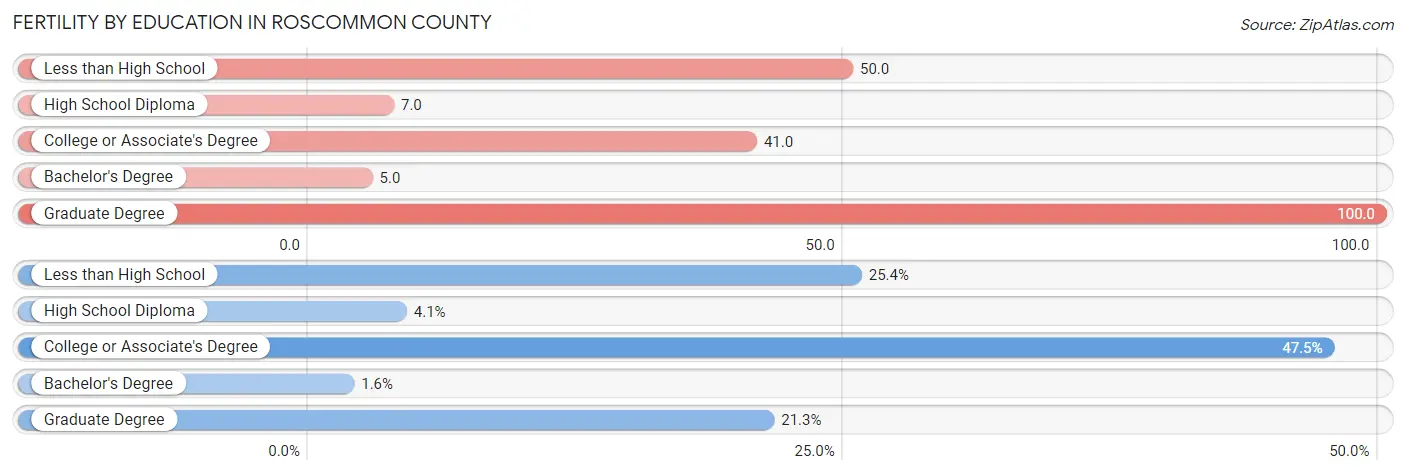
Fertility by Education in Roscommon County
Average fertility rate in Roscommon County is 35.0 births per 1,000 women. Women with the education attainment of graduate degree have the highest fertility rate of 100.0 births per 1,000 women, while women with the education attainment of bachelor's degree have the lowest fertility at 5.0 births per 1,000 women. Women with the education attainment of college or associate's degree represent 47.5% of all women with births.
| Educational Attainment | Women with Births | Births / 1,000 Women |
| Less than High School | 31 (25.4%) | 50.0 |
| High School Diploma | 5 (4.1%) | 7.0 |
| College or Associate's Degree | 58 (47.5%) | 41.0 |
| Bachelor's Degree | 2 (1.6%) | 5.0 |
| Graduate Degree | 26 (21.3%) | 100.0 |
| Total | 122 (100.0%) | 35.0 |
Fertility by Education by Marriage Status in Roscommon County
30.3% of women with births in Roscommon County are unmarried. Women with the educational attainment of bachelor's degree are most likely to be married with 100.0% of them married at childbirth, while women with the educational attainment of less than high school are least likely to be married with 100.0% of them unmarried at childbirth.
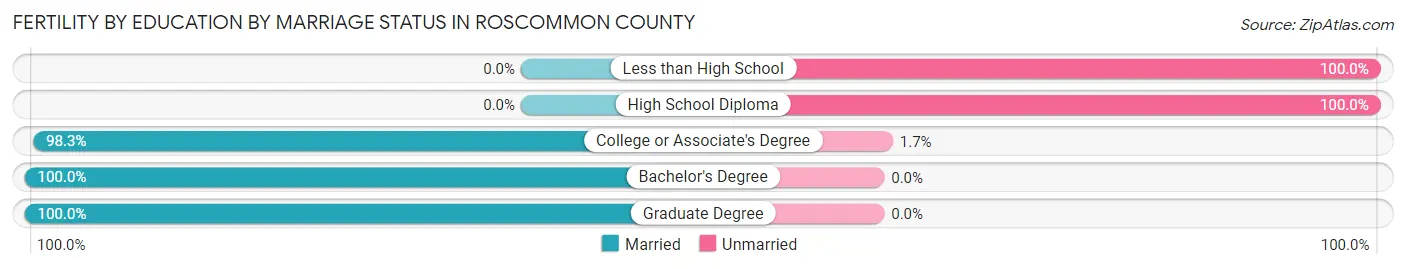
| Educational Attainment | Married | Unmarried |
| Less than High School | 0 (0.0%) | 31 (100.0%) |
| High School Diploma | 0 (0.0%) | 5 (100.0%) |
| College or Associate's Degree | 57 (98.3%) | 1 (1.7%) |
| Bachelor's Degree | 2 (100.0%) | 0 (0.0%) |
| Graduate Degree | 26 (100.0%) | 0 (0.0%) |
| Total | 85 (69.7%) | 37 (30.3%) |
Income in Roscommon County
Income Overview in Roscommon County
Per Capita Income in Roscommon County is $34,587, while median incomes of families and households are $63,425 and $49,898 respectively.
| Characteristic | Number | Measure |
| Per Capita Income | 23,556 | $34,587 |
| Median Family Income | 6,635 | $63,425 |
| Mean Family Income | 6,635 | $84,180 |
| Median Household Income | 11,358 | $49,898 |
| Mean Household Income | 11,358 | $70,516 |
| Income Deficit | 6,635 | $10,863 |
| Wage / Income Gap (%) | 23,556 | 35.72% |
| Wage / Income Gap ($) | 23,556 | 64.28¢ per $1 |
| Gini / Inequality Index | 23,556 | 0.47 |
Earnings by Sex in Roscommon County
Average Earnings in Roscommon County are $32,781, $39,158 for men and $25,172 for women, a difference of 35.7%.
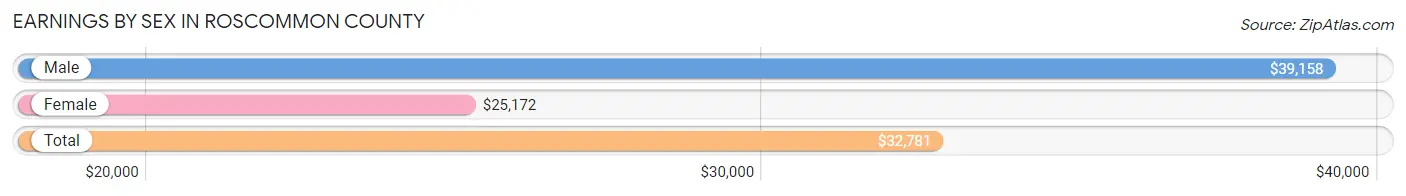
| Sex | Number | Average Earnings |
| Male | 4,877 (52.6%) | $39,158 |
| Female | 4,388 (47.4%) | $25,172 |
| Total | 9,265 (100.0%) | $32,781 |
Earnings by Sex by Income Bracket in Roscommon County
The most common earnings brackets in Roscommon County are $100,000+ for men (677 | 13.9%) and $2,499 or less for women (420 | 9.6%).
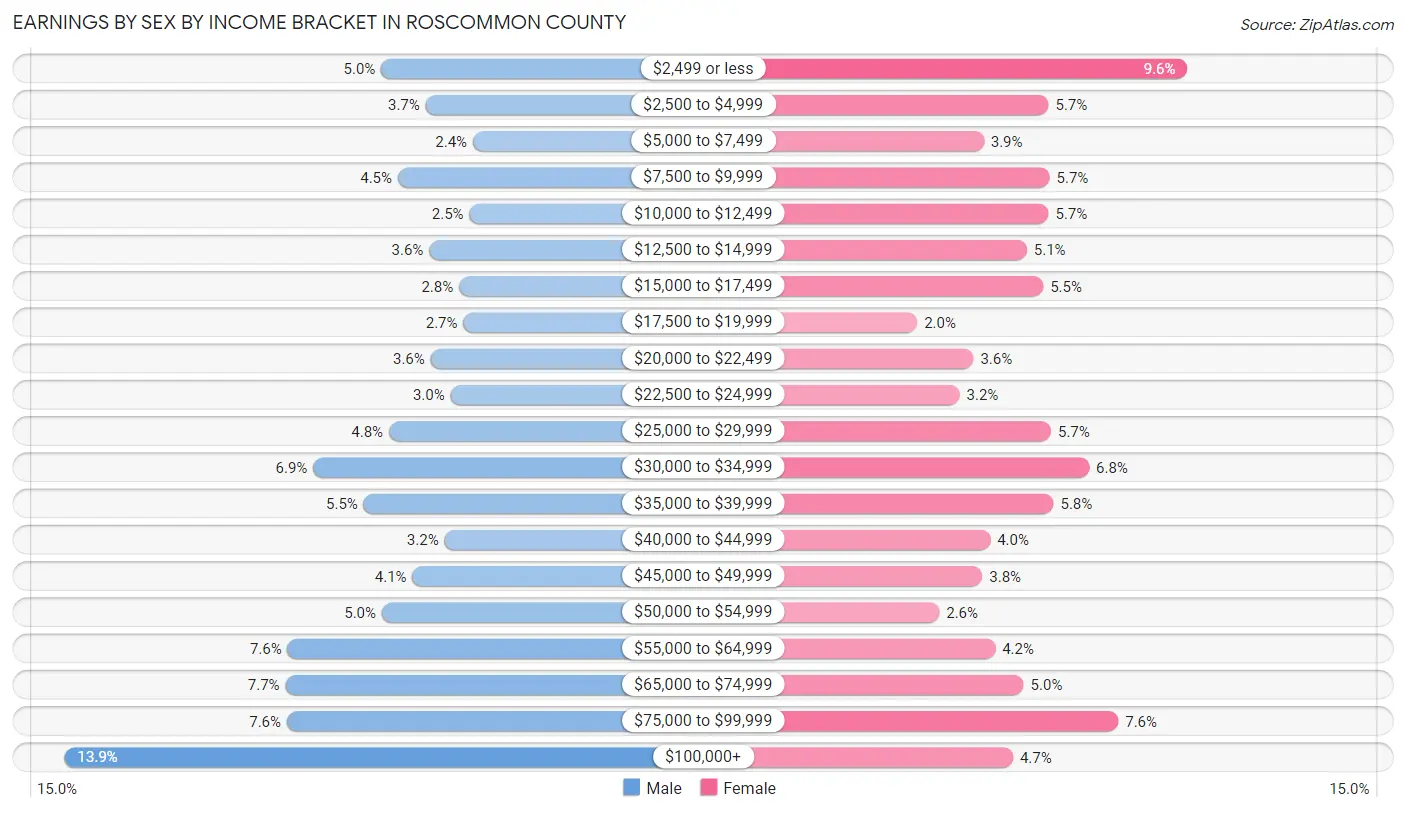
| Income | Male | Female |
| $2,499 or less | 243 (5.0%) | 420 (9.6%) |
| $2,500 to $4,999 | 182 (3.7%) | 249 (5.7%) |
| $5,000 to $7,499 | 117 (2.4%) | 169 (3.8%) |
| $7,500 to $9,999 | 220 (4.5%) | 250 (5.7%) |
| $10,000 to $12,499 | 122 (2.5%) | 249 (5.7%) |
| $12,500 to $14,999 | 177 (3.6%) | 222 (5.1%) |
| $15,000 to $17,499 | 136 (2.8%) | 242 (5.5%) |
| $17,500 to $19,999 | 130 (2.7%) | 87 (2.0%) |
| $20,000 to $22,499 | 175 (3.6%) | 156 (3.6%) |
| $22,500 to $24,999 | 148 (3.0%) | 139 (3.2%) |
| $25,000 to $29,999 | 232 (4.8%) | 252 (5.7%) |
| $30,000 to $34,999 | 336 (6.9%) | 299 (6.8%) |
| $35,000 to $39,999 | 267 (5.5%) | 255 (5.8%) |
| $40,000 to $44,999 | 156 (3.2%) | 177 (4.0%) |
| $45,000 to $49,999 | 200 (4.1%) | 167 (3.8%) |
| $50,000 to $54,999 | 242 (5.0%) | 114 (2.6%) |
| $55,000 to $64,999 | 371 (7.6%) | 183 (4.2%) |
| $65,000 to $74,999 | 374 (7.7%) | 218 (5.0%) |
| $75,000 to $99,999 | 372 (7.6%) | 335 (7.6%) |
| $100,000+ | 677 (13.9%) | 205 (4.7%) |
| Total | 4,877 (100.0%) | 4,388 (100.0%) |
Earnings by Sex by Educational Attainment in Roscommon County
Average earnings in Roscommon County are $45,100 for men and $29,565 for women, a difference of 34.4%. Men with an educational attainment of graduate degree enjoy the highest average annual earnings of $79,518, while those with high school diploma education earn the least with $35,074. Women with an educational attainment of graduate degree earn the most with the average annual earnings of $70,114, while those with less than high school education have the smallest earnings of $12,614.
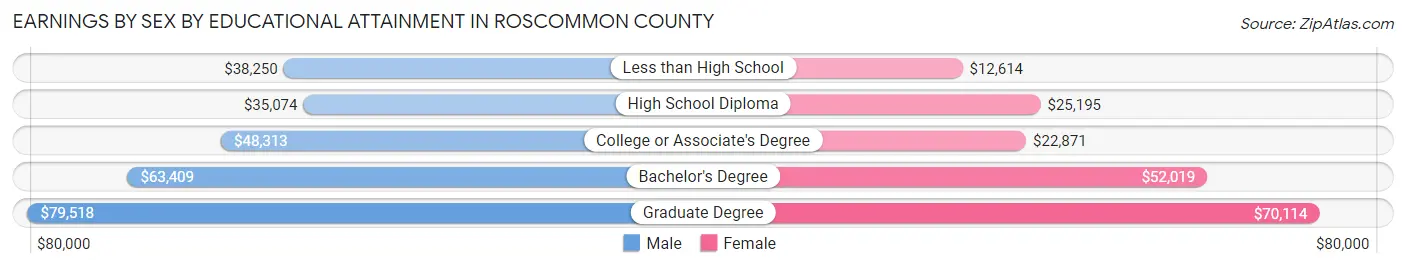
| Educational Attainment | Male Income | Female Income |
| Less than High School | $38,250 | $12,614 |
| High School Diploma | $35,074 | $25,195 |
| College or Associate's Degree | $48,313 | $22,871 |
| Bachelor's Degree | $63,409 | $52,019 |
| Graduate Degree | $79,518 | $70,114 |
| Total | $45,100 | $29,565 |
Family Income in Roscommon County
Family Income Brackets in Roscommon County
According to the Roscommon County family income data, there are 1,612 families falling into the $50,000 to $74,999 income range, which is the most common income bracket and makes up 24.3% of all families. Conversely, the $10,000 to $14,999 income bracket is the least frequent group with only 146 families (2.2%) belonging to this category.

| Income Bracket | # Families | % Families |
| Less than $10,000 | 259 | 3.9% |
| $10,000 to $14,999 | 146 | 2.2% |
| $15,000 to $24,999 | 484 | 7.3% |
| $25,000 to $34,999 | 511 | 7.7% |
| $35,000 to $49,999 | 1,075 | 16.2% |
| $50,000 to $74,999 | 1,612 | 24.3% |
| $75,000 to $99,999 | 856 | 12.9% |
| $100,000 to $149,999 | 1,015 | 15.3% |
| $150,000 to $199,999 | 372 | 5.6% |
| $200,000+ | 299 | 4.5% |
Family Income by Famaliy Size in Roscommon County
3-person families (1,100 | 16.6%) account for the highest median family income in Roscommon County with $74,118 per family, while 2-person families (4,512 | 68.0%) have the highest median income of $30,400 per family member.
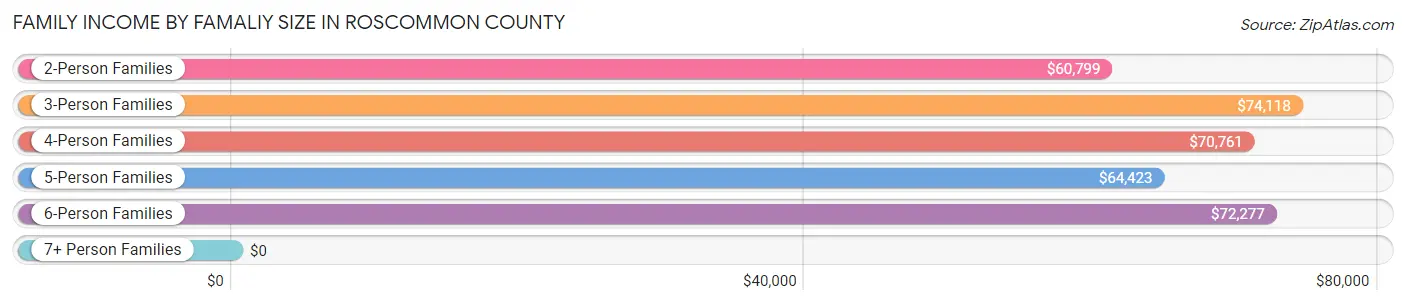
| Income Bracket | # Families | Median Income |
| 2-Person Families | 4,512 (68.0%) | $60,799 |
| 3-Person Families | 1,100 (16.6%) | $74,118 |
| 4-Person Families | 774 (11.7%) | $70,761 |
| 5-Person Families | 82 (1.2%) | $64,423 |
| 6-Person Families | 67 (1.0%) | $72,277 |
| 7+ Person Families | 100 (1.5%) | $0 |
| Total | 6,635 (100.0%) | $63,425 |
Family Income by Number of Earners in Roscommon County
The median family income in Roscommon County is $63,425, with families comprising 3+ earners (218) having the highest median family income of $139,844, while families with 1 earner (2,075) have the lowest median family income of $55,399, accounting for 3.3% and 31.3% of families, respectively.
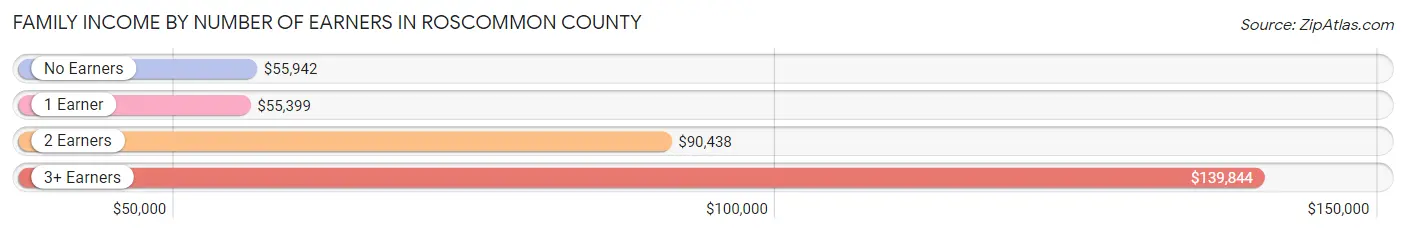
| Number of Earners | # Families | Median Income |
| No Earners | 2,510 (37.8%) | $55,942 |
| 1 Earner | 2,075 (31.3%) | $55,399 |
| 2 Earners | 1,832 (27.6%) | $90,438 |
| 3+ Earners | 218 (3.3%) | $139,844 |
| Total | 6,635 (100.0%) | $63,425 |
Household Income in Roscommon County
Household Income Brackets in Roscommon County
With 2,294 households falling in the category, the $50,000 to $74,999 income range is the most frequent in Roscommon County, accounting for 20.2% of all households. In contrast, only 432 households (3.8%) fall into the $200,000+ income bracket, making it the least populous group.

| Income Bracket | # Households | % Households |
| Less than $10,000 | 545 | 4.8% |
| $10,000 to $14,999 | 704 | 6.2% |
| $15,000 to $24,999 | 1,249 | 11.0% |
| $25,000 to $34,999 | 1,283 | 11.3% |
| $35,000 to $49,999 | 1,908 | 16.8% |
| $50,000 to $74,999 | 2,294 | 20.2% |
| $75,000 to $99,999 | 1,215 | 10.7% |
| $100,000 to $149,999 | 1,261 | 11.1% |
| $150,000 to $199,999 | 466 | 4.1% |
| $200,000+ | 432 | 3.8% |
Household Income by Householder Age in Roscommon County
The median household income in Roscommon County is $49,898, with the highest median household income of $55,303 found in the 25 to 44 years age bracket for the primary householder. A total of 1,953 households (17.2%) fall into this category. Meanwhile, the 65+ years age bracket for the primary householder has the lowest median household income of $47,089, with 4,971 households (43.8%) in this group.

| Income Bracket | # Households | Median Income |
| 15 to 24 Years | 264 (2.3%) | $53,571 |
| 25 to 44 Years | 1,953 (17.2%) | $55,303 |
| 45 to 64 Years | 4,170 (36.7%) | $52,460 |
| 65+ Years | 4,971 (43.8%) | $47,089 |
| Total | 11,358 (100.0%) | $49,898 |
Poverty in Roscommon County
Income Below Poverty by Sex and Age in Roscommon County
With 14.5% poverty level for males and 17.9% for females among the residents of Roscommon County, 5 year old males and 5 year old females are the most vulnerable to poverty, with 15 males (68.2%) and 55 females (54.5%) in their respective age groups living below the poverty level.
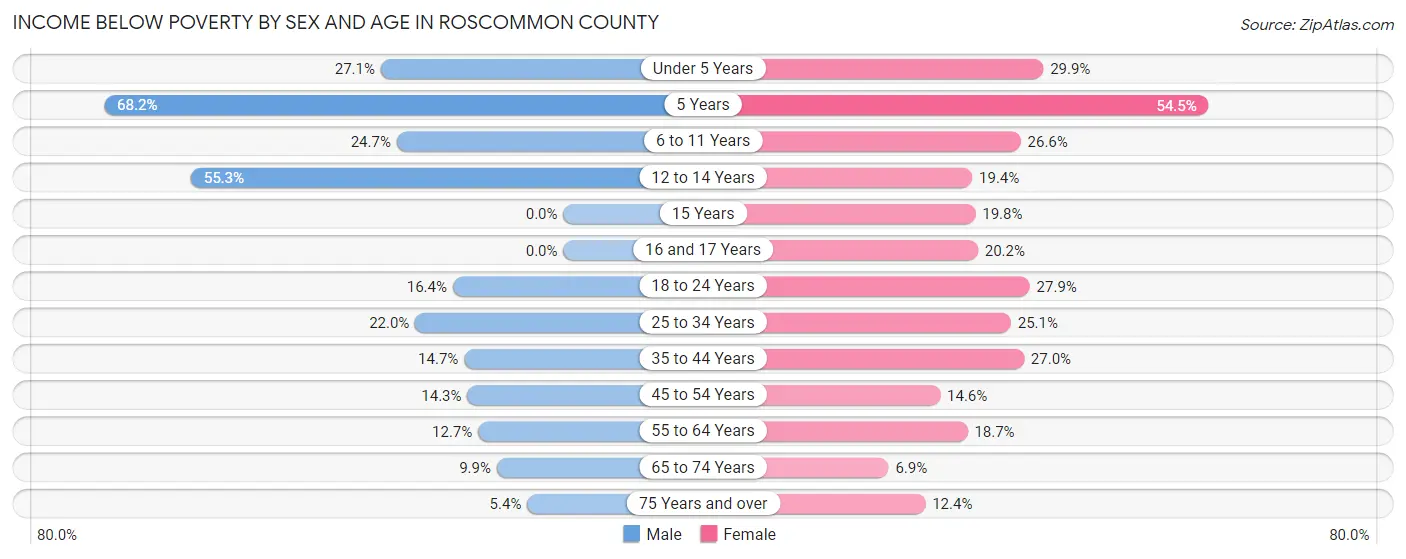
| Age Bracket | Male | Female |
| Under 5 Years | 106 (27.1%) | 128 (29.9%) |
| 5 Years | 15 (68.2%) | 55 (54.5%) |
| 6 to 11 Years | 144 (24.7%) | 154 (26.6%) |
| 12 to 14 Years | 182 (55.3%) | 42 (19.4%) |
| 15 Years | 0 (0.0%) | 22 (19.8%) |
| 16 and 17 Years | 0 (0.0%) | 40 (20.2%) |
| 18 to 24 Years | 112 (16.4%) | 149 (27.9%) |
| 25 to 34 Years | 194 (22.0%) | 248 (25.1%) |
| 35 to 44 Years | 157 (14.7%) | 252 (27.0%) |
| 45 to 54 Years | 183 (14.2%) | 192 (14.6%) |
| 55 to 64 Years | 283 (12.7%) | 436 (18.7%) |
| 65 to 74 Years | 245 (9.9%) | 159 (6.9%) |
| 75 Years and over | 78 (5.4%) | 182 (12.4%) |
| Total | 1,699 (14.5%) | 2,059 (17.9%) |
Income Above Poverty by Sex and Age in Roscommon County
According to the poverty statistics in Roscommon County, males aged 15 years and females aged 65 to 74 years are the age groups that are most secure financially, with 100.0% of males and 93.1% of females in these age groups living above the poverty line.

| Age Bracket | Male | Female |
| Under 5 Years | 285 (72.9%) | 300 (70.1%) |
| 5 Years | 7 (31.8%) | 46 (45.5%) |
| 6 to 11 Years | 438 (75.3%) | 426 (73.5%) |
| 12 to 14 Years | 147 (44.7%) | 175 (80.6%) |
| 15 Years | 84 (100.0%) | 89 (80.2%) |
| 16 and 17 Years | 246 (100.0%) | 158 (79.8%) |
| 18 to 24 Years | 570 (83.6%) | 385 (72.1%) |
| 25 to 34 Years | 688 (78.0%) | 740 (74.9%) |
| 35 to 44 Years | 909 (85.3%) | 680 (73.0%) |
| 45 to 54 Years | 1,101 (85.8%) | 1,123 (85.4%) |
| 55 to 64 Years | 1,952 (87.3%) | 1,900 (81.3%) |
| 65 to 74 Years | 2,236 (90.1%) | 2,134 (93.1%) |
| 75 Years and over | 1,376 (94.6%) | 1,287 (87.6%) |
| Total | 10,039 (85.5%) | 9,443 (82.1%) |
Income Below Poverty Among Married-Couple Families in Roscommon County
The poverty statistics for married-couple families in Roscommon County show that 6.9% or 366 of the total 5,298 families live below the poverty line. Families with 5 or more children have the highest poverty rate of 69.4%, comprising of 50 families. On the other hand, families with no children have the lowest poverty rate of 5.6%, which includes 238 families.
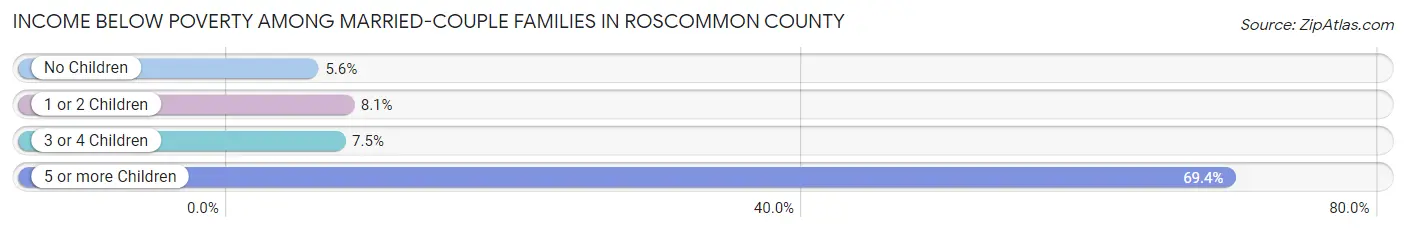
| Children | Above Poverty | Below Poverty |
| No Children | 4,010 (94.4%) | 238 (5.6%) |
| 1 or 2 Children | 776 (91.9%) | 68 (8.1%) |
| 3 or 4 Children | 124 (92.5%) | 10 (7.5%) |
| 5 or more Children | 22 (30.6%) | 50 (69.4%) |
| Total | 4,932 (93.1%) | 366 (6.9%) |
Income Below Poverty Among Single-Parent Households in Roscommon County
According to the poverty data in Roscommon County, 19.4% or 89 single-father households and 29.4% or 258 single-mother households are living below the poverty line. Among single-father households, those with no children have the highest poverty rate, with 52 households (24.6%) experiencing poverty. Likewise, among single-mother households, those with 5 or more children have the highest poverty rate, with 12 households (100.0%) falling below the poverty line.
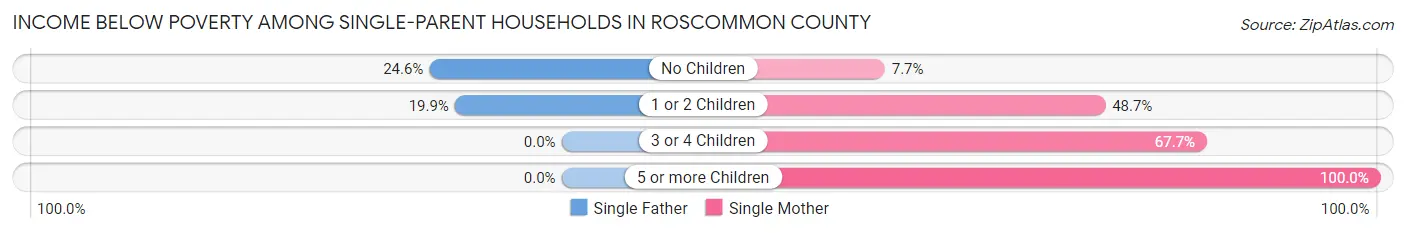
| Children | Single Father | Single Mother |
| No Children | 52 (24.6%) | 34 (7.7%) |
| 1 or 2 Children | 37 (19.9%) | 189 (48.7%) |
| 3 or 4 Children | 0 (0.0%) | 23 (67.6%) |
| 5 or more Children | 0 (0.0%) | 12 (100.0%) |
| Total | 89 (19.4%) | 258 (29.4%) |
Income Below Poverty Among Married-Couple vs Single-Parent Households in Roscommon County
The poverty data for Roscommon County shows that 366 of the married-couple family households (6.9%) and 347 of the single-parent households (26.0%) are living below the poverty level. Within the married-couple family households, those with 5 or more children have the highest poverty rate, with 50 households (69.4%) falling below the poverty line. Among the single-parent households, those with 5 or more children have the highest poverty rate, with 12 household (100.0%) living below poverty.
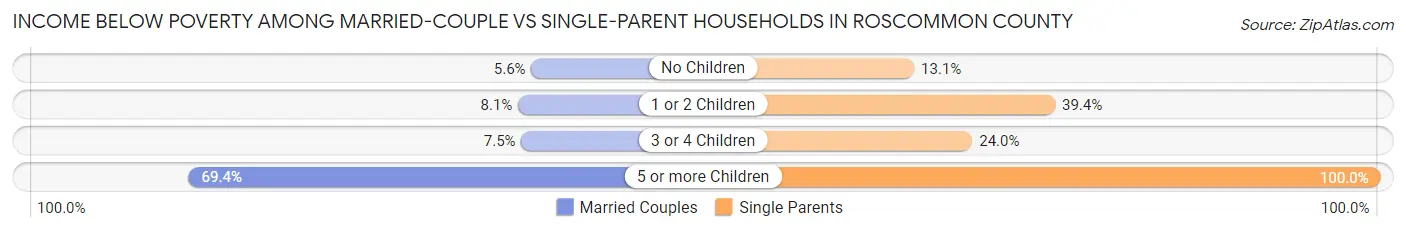
| Children | Married-Couple Families | Single-Parent Households |
| No Children | 238 (5.6%) | 86 (13.1%) |
| 1 or 2 Children | 68 (8.1%) | 226 (39.4%) |
| 3 or 4 Children | 10 (7.5%) | 23 (24.0%) |
| 5 or more Children | 50 (69.4%) | 12 (100.0%) |
| Total | 366 (6.9%) | 347 (26.0%) |
Employment Characteristics in Roscommon County
Employment by Class of Employer in Roscommon County
Among the 7,879 employed individuals in Roscommon County, private company employees (4,861 | 61.7%), self-employed (not incorporated) (720 | 9.1%), and not-for-profit organizations (702 | 8.9%) make up the most common classes of employment.
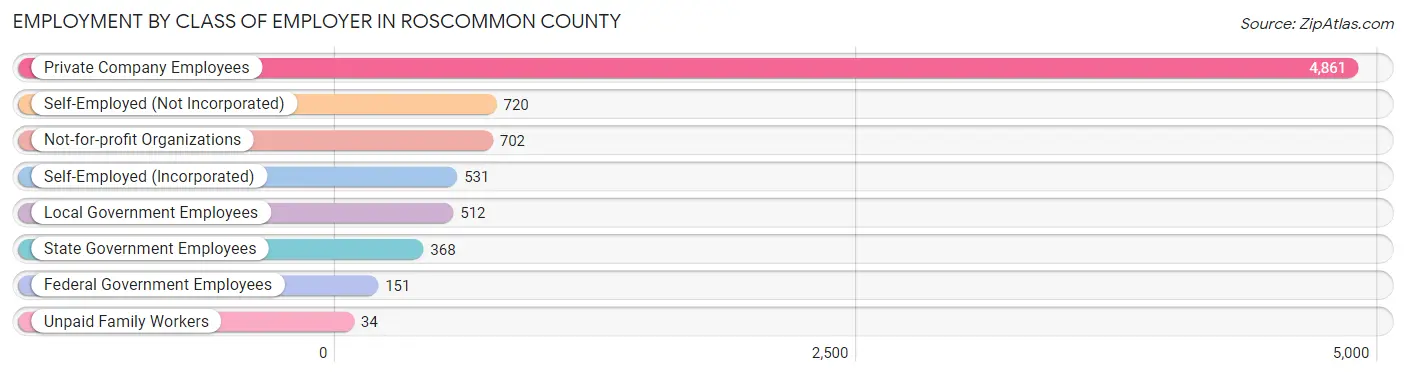
| Employer Class | # Employees | % Employees |
| Private Company Employees | 4,861 | 61.7% |
| Self-Employed (Incorporated) | 531 | 6.7% |
| Self-Employed (Not Incorporated) | 720 | 9.1% |
| Not-for-profit Organizations | 702 | 8.9% |
| Local Government Employees | 512 | 6.5% |
| State Government Employees | 368 | 4.7% |
| Federal Government Employees | 151 | 1.9% |
| Unpaid Family Workers | 34 | 0.4% |
| Total | 7,879 | 100.0% |
Employment Status by Age in Roscommon County
According to the labor force statistics for Roscommon County, out of the total population over 16 years of age (20,581), 41.9% or 8,623 individuals are in the labor force, with 5.7% or 492 of them unemployed. The age group with the highest labor force participation rate is 25 to 29 years, with 83.4% or 787 individuals in the labor force. Within the labor force, the 30 to 34 years age range has the highest percentage of unemployed individuals, with 10.3% or 73 of them being unemployed.
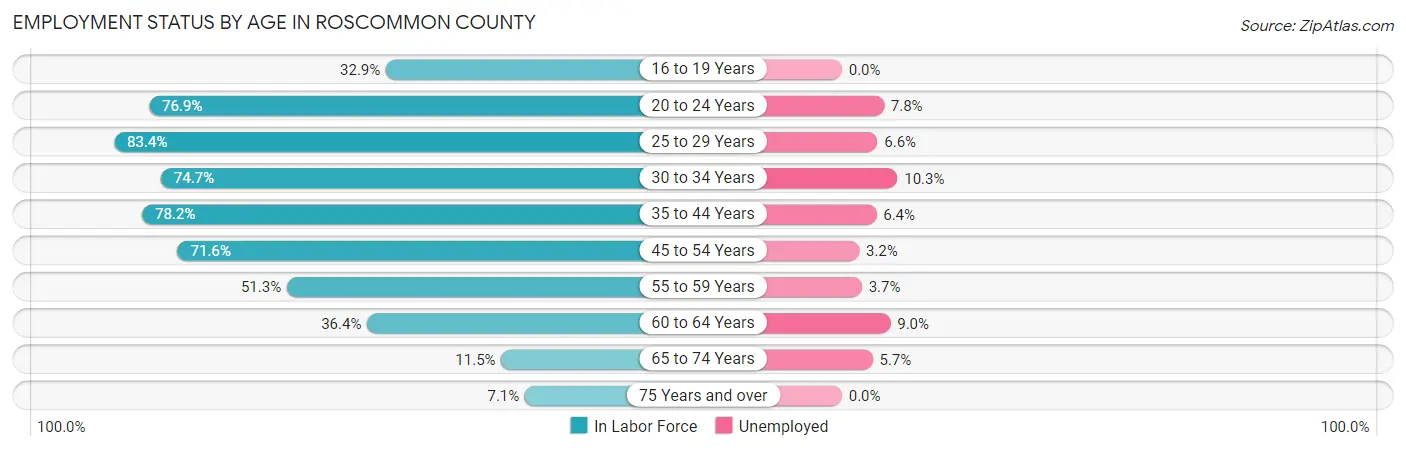
| Age Bracket | In Labor Force | Unemployed |
| 16 to 19 Years | 254 (32.9%) | 0 (0.0%) |
| 20 to 24 Years | 692 (76.9%) | 54 (7.8%) |
| 25 to 29 Years | 787 (83.4%) | 52 (6.6%) |
| 30 to 34 Years | 713 (74.7%) | 73 (10.3%) |
| 35 to 44 Years | 1,575 (78.2%) | 101 (6.4%) |
| 45 to 54 Years | 1,875 (71.6%) | 60 (3.2%) |
| 55 to 59 Years | 1,021 (51.3%) | 38 (3.7%) |
| 60 to 64 Years | 941 (36.4%) | 85 (9.0%) |
| 65 to 74 Years | 550 (11.5%) | 31 (5.7%) |
| 75 Years and over | 214 (7.1%) | 0 (0.0%) |
| Total | 8,623 (41.9%) | 492 (5.7%) |
Employment Status by Educational Attainment in Roscommon County
According to labor force statistics for Roscommon County, 62.2% of individuals (6,909) out of the total population between 25 and 64 years of age (11,107) are in the labor force, with 5.9% or 408 of them being unemployed. The group with the highest labor force participation rate are those with the educational attainment of bachelor's degree or higher, with 76.3% or 1,624 individuals in the labor force. Within the labor force, individuals with less than high school education have the highest percentage of unemployment, with 12.6% or 51 of them being unemployed.
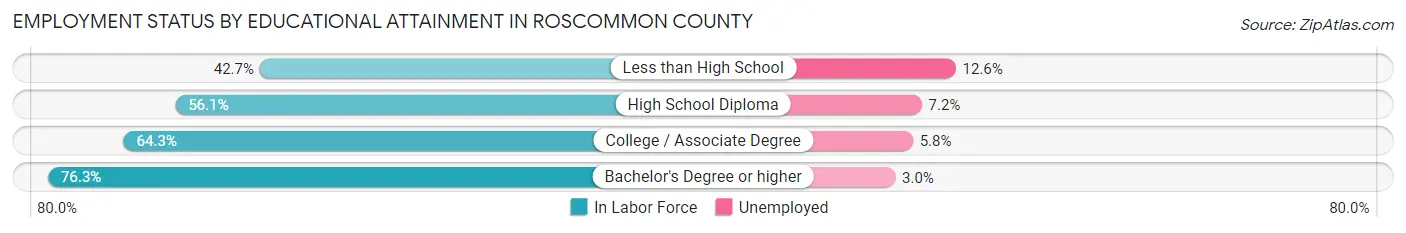
| Educational Attainment | In Labor Force | Unemployed |
| Less than High School | 405 (42.7%) | 120 (12.6%) |
| High School Diploma | 1,951 (56.1%) | 250 (7.2%) |
| College / Associate Degree | 2,926 (64.3%) | 264 (5.8%) |
| Bachelor's Degree or higher | 1,624 (76.3%) | 64 (3.0%) |
| Total | 6,909 (62.2%) | 655 (5.9%) |
Employment Occupations by Sex in Roscommon County
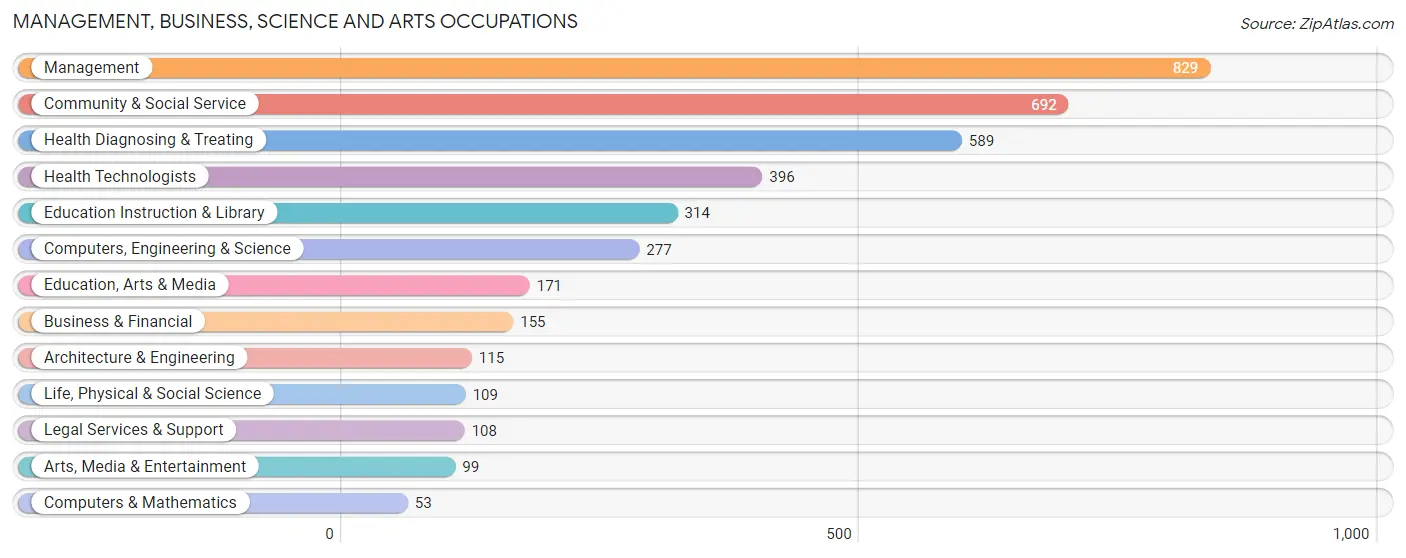
Management, Business, Science and Arts Occupations
The most common Management, Business, Science and Arts occupations in Roscommon County are Management (829 | 10.2%), Community & Social Service (692 | 8.5%), Health Diagnosing & Treating (589 | 7.2%), Health Technologists (396 | 4.9%), and Education Instruction & Library (314 | 3.9%).
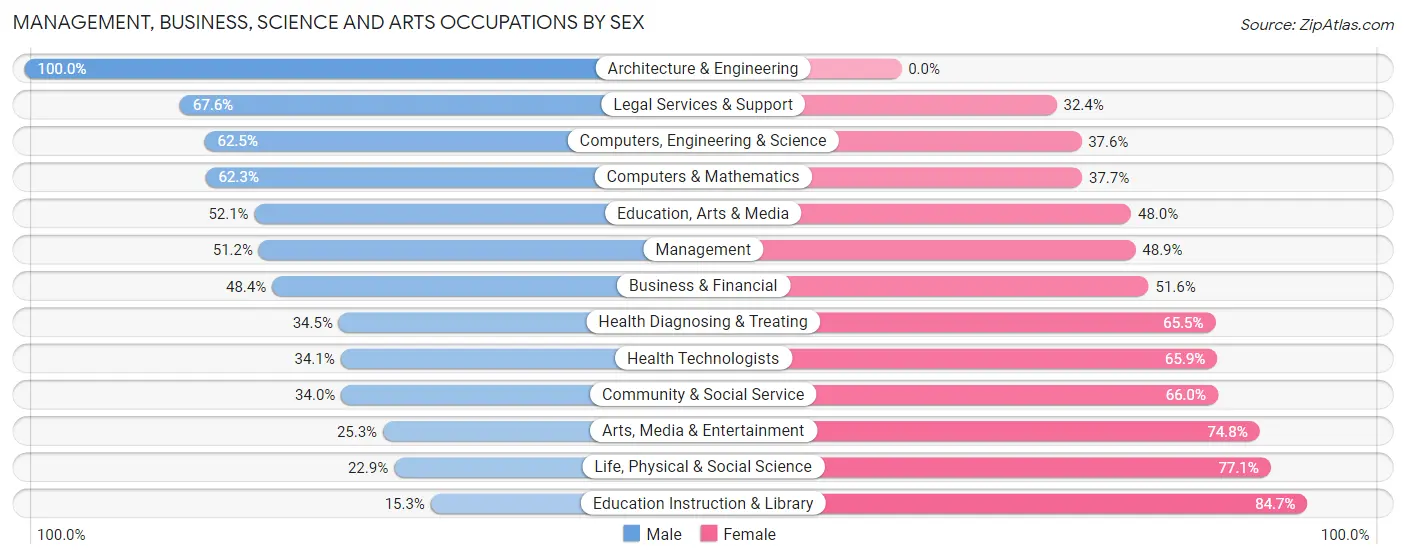
Management, Business, Science and Arts Occupations by Sex
Within the Management, Business, Science and Arts occupations in Roscommon County, the most male-oriented occupations are Architecture & Engineering (100.0%), Legal Services & Support (67.6%), and Computers, Engineering & Science (62.5%), while the most female-oriented occupations are Education Instruction & Library (84.7%), Life, Physical & Social Science (77.1%), and Arts, Media & Entertainment (74.8%).
| Occupation | Male | Female |
| Management | 424 (51.1%) | 405 (48.8%) |
| Business & Financial | 75 (48.4%) | 80 (51.6%) |
| Computers, Engineering & Science | 173 (62.5%) | 104 (37.6%) |
| Computers & Mathematics | 33 (62.3%) | 20 (37.7%) |
| Architecture & Engineering | 115 (100.0%) | 0 (0.0%) |
| Life, Physical & Social Science | 25 (22.9%) | 84 (77.1%) |
| Community & Social Service | 235 (34.0%) | 457 (66.0%) |
| Education, Arts & Media | 89 (52.0%) | 82 (47.9%) |
| Legal Services & Support | 73 (67.6%) | 35 (32.4%) |
| Education Instruction & Library | 48 (15.3%) | 266 (84.7%) |
| Arts, Media & Entertainment | 25 (25.3%) | 74 (74.8%) |
| Health Diagnosing & Treating | 203 (34.5%) | 386 (65.5%) |
| Health Technologists | 135 (34.1%) | 261 (65.9%) |
| Total (Category) | 1,110 (43.7%) | 1,432 (56.3%) |
| Total (Overall) | 4,256 (52.4%) | 3,864 (47.6%) |
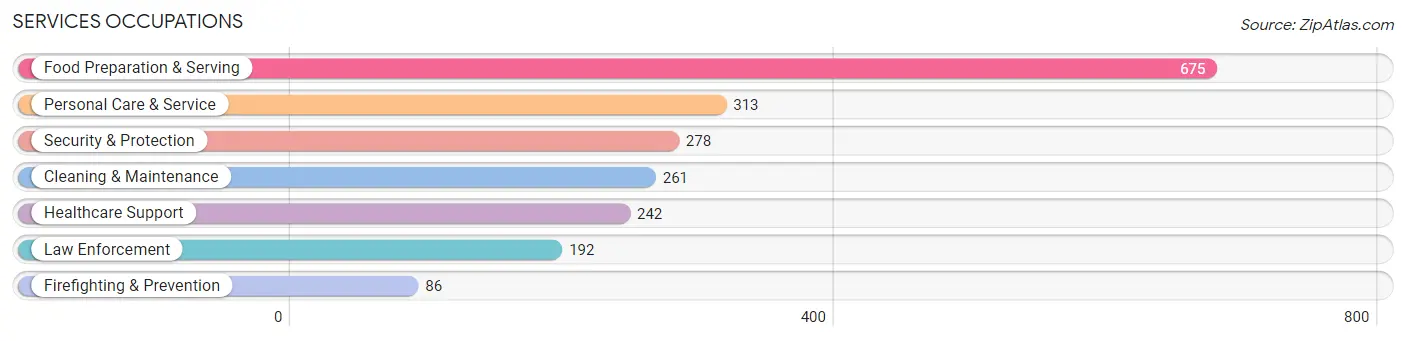
Services Occupations
The most common Services occupations in Roscommon County are Food Preparation & Serving (675 | 8.3%), Personal Care & Service (313 | 3.8%), Security & Protection (278 | 3.4%), Cleaning & Maintenance (261 | 3.2%), and Healthcare Support (242 | 3.0%).
Services Occupations by Sex
Within the Services occupations in Roscommon County, the most male-oriented occupations are Law Enforcement (84.9%), Security & Protection (81.3%), and Firefighting & Prevention (73.3%), while the most female-oriented occupations are Personal Care & Service (82.8%), Healthcare Support (81.8%), and Food Preparation & Serving (52.0%).
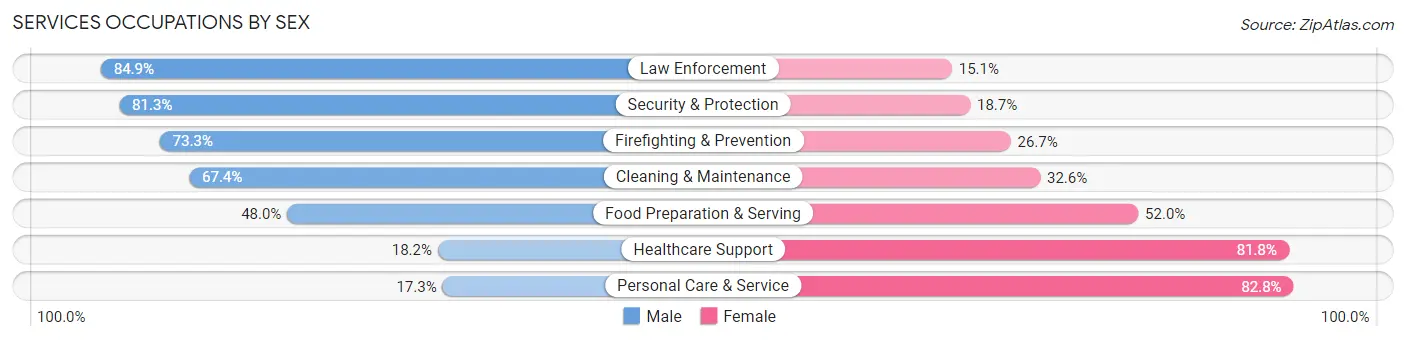
| Occupation | Male | Female |
| Healthcare Support | 44 (18.2%) | 198 (81.8%) |
| Security & Protection | 226 (81.3%) | 52 (18.7%) |
| Firefighting & Prevention | 63 (73.3%) | 23 (26.7%) |
| Law Enforcement | 163 (84.9%) | 29 (15.1%) |
| Food Preparation & Serving | 324 (48.0%) | 351 (52.0%) |
| Cleaning & Maintenance | 176 (67.4%) | 85 (32.6%) |
| Personal Care & Service | 54 (17.2%) | 259 (82.8%) |
| Total (Category) | 824 (46.6%) | 945 (53.4%) |
| Total (Overall) | 4,256 (52.4%) | 3,864 (47.6%) |
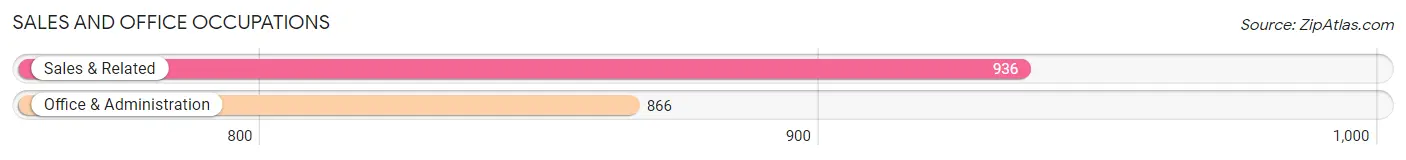
Sales and Office Occupations
The most common Sales and Office occupations in Roscommon County are Sales & Related (936 | 11.5%), and Office & Administration (866 | 10.7%).
Sales and Office Occupations by Sex
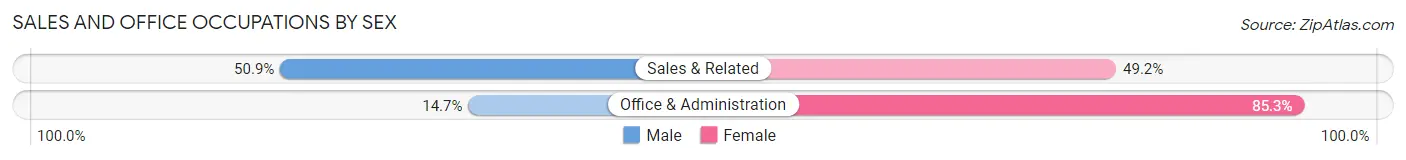
| Occupation | Male | Female |
| Sales & Related | 476 (50.8%) | 460 (49.1%) |
| Office & Administration | 127 (14.7%) | 739 (85.3%) |
| Total (Category) | 603 (33.5%) | 1,199 (66.5%) |
| Total (Overall) | 4,256 (52.4%) | 3,864 (47.6%) |
Natural Resources, Construction and Maintenance Occupations
The most common Natural Resources, Construction and Maintenance occupations in Roscommon County are Construction & Extraction (466 | 5.7%), Installation, Maintenance & Repair (334 | 4.1%), and Farming, Fishing & Forestry (69 | 0.9%).

Natural Resources, Construction and Maintenance Occupations by Sex

| Occupation | Male | Female |
| Farming, Fishing & Forestry | 69 (100.0%) | 0 (0.0%) |
| Construction & Extraction | 453 (97.2%) | 13 (2.8%) |
| Installation, Maintenance & Repair | 299 (89.5%) | 35 (10.5%) |
| Total (Category) | 821 (94.5%) | 48 (5.5%) |
| Total (Overall) | 4,256 (52.4%) | 3,864 (47.6%) |
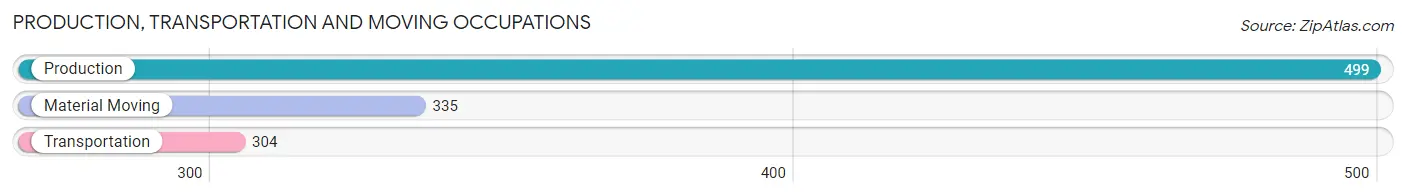
Production, Transportation and Moving Occupations
The most common Production, Transportation and Moving occupations in Roscommon County are Production (499 | 6.1%), Material Moving (335 | 4.1%), and Transportation (304 | 3.7%).
Production, Transportation and Moving Occupations by Sex
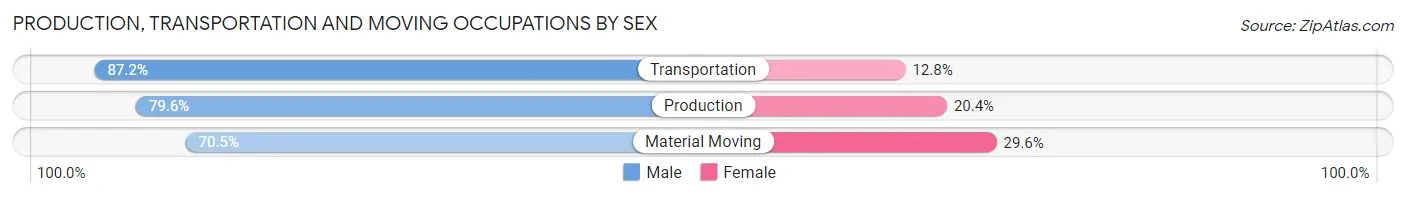
| Occupation | Male | Female |
| Production | 397 (79.6%) | 102 (20.4%) |
| Transportation | 265 (87.2%) | 39 (12.8%) |
| Material Moving | 236 (70.5%) | 99 (29.5%) |
| Total (Category) | 898 (78.9%) | 240 (21.1%) |
| Total (Overall) | 4,256 (52.4%) | 3,864 (47.6%) |
Employment Industries by Sex in Roscommon County
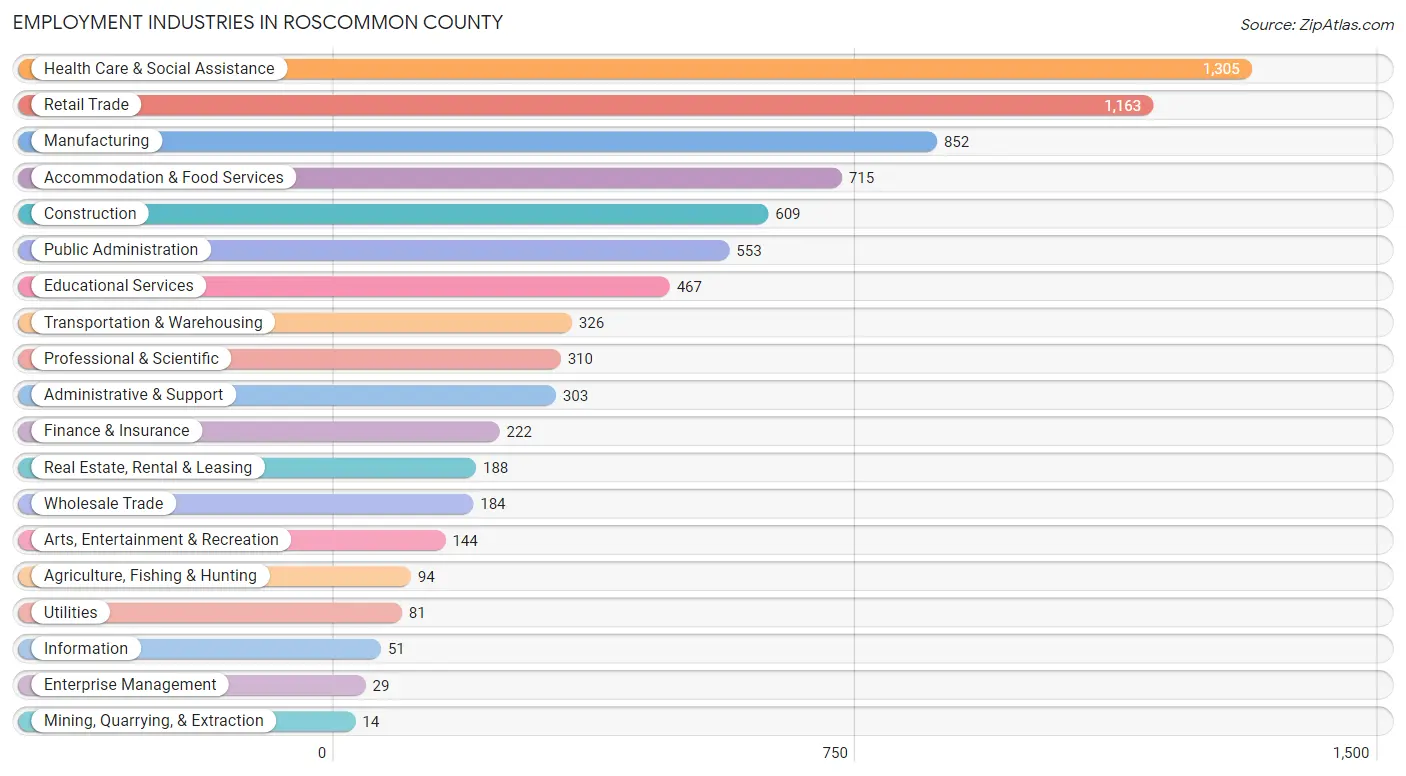
Employment Industries in Roscommon County
The major employment industries in Roscommon County include Health Care & Social Assistance (1,305 | 16.1%), Retail Trade (1,163 | 14.3%), Manufacturing (852 | 10.5%), Accommodation & Food Services (715 | 8.8%), and Construction (609 | 7.5%).
Employment Industries by Sex in Roscommon County
The Roscommon County industries that see more men than women are Mining, Quarrying, & Extraction (100.0%), Utilities (100.0%), and Construction (92.3%), whereas the industries that tend to have a higher number of women are Enterprise Management (100.0%), Health Care & Social Assistance (83.8%), and Finance & Insurance (73.9%).

| Industry | Male | Female |
| Agriculture, Fishing & Hunting | 83 (88.3%) | 11 (11.7%) |
| Mining, Quarrying, & Extraction | 14 (100.0%) | 0 (0.0%) |
| Construction | 562 (92.3%) | 47 (7.7%) |
| Manufacturing | 669 (78.5%) | 183 (21.5%) |
| Wholesale Trade | 156 (84.8%) | 28 (15.2%) |
| Retail Trade | 615 (52.9%) | 548 (47.1%) |
| Transportation & Warehousing | 242 (74.2%) | 84 (25.8%) |
| Utilities | 81 (100.0%) | 0 (0.0%) |
| Information | 17 (33.3%) | 34 (66.7%) |
| Finance & Insurance | 58 (26.1%) | 164 (73.9%) |
| Real Estate, Rental & Leasing | 51 (27.1%) | 137 (72.9%) |
| Professional & Scientific | 183 (59.0%) | 127 (41.0%) |
| Enterprise Management | 0 (0.0%) | 29 (100.0%) |
| Administrative & Support | 187 (61.7%) | 116 (38.3%) |
| Educational Services | 135 (28.9%) | 332 (71.1%) |
| Health Care & Social Assistance | 212 (16.3%) | 1,093 (83.8%) |
| Arts, Entertainment & Recreation | 51 (35.4%) | 93 (64.6%) |
| Accommodation & Food Services | 330 (46.2%) | 385 (53.8%) |
| Public Administration | 349 (63.1%) | 204 (36.9%) |
| Total | 4,256 (52.4%) | 3,864 (47.6%) |
Education in Roscommon County
School Enrollment in Roscommon County
The most common levels of schooling among the 3,457 students in Roscommon County are high school (835 | 24.1%), elementary school (775 | 22.4%), and middle school (718 | 20.8%).

| School Level | # Students | % Students |
| Nursery / Preschool | 234 | 6.8% |
| Kindergarten | 179 | 5.2% |
| Elementary School | 775 | 22.4% |
| Middle School | 718 | 20.8% |
| High School | 835 | 24.1% |
| College / Undergraduate | 606 | 17.5% |
| Graduate / Professional | 110 | 3.2% |
| Total | 3,457 | 100.0% |
School Enrollment by Age by Funding Source in Roscommon County
Out of a total of 3,457 students who are enrolled in schools in Roscommon County, 771 (22.3%) attend a private institution, while the remaining 2,686 (77.7%) are enrolled in public schools. The age group of 3 to 4 year olds has the highest likelihood of being enrolled in private schools, with 110 (67.9% in the age bracket) enrolled. Conversely, the age group of 20 to 24 year olds has the lowest likelihood of being enrolled in a private school, with 208 (92.4% in the age bracket) attending a public institution.
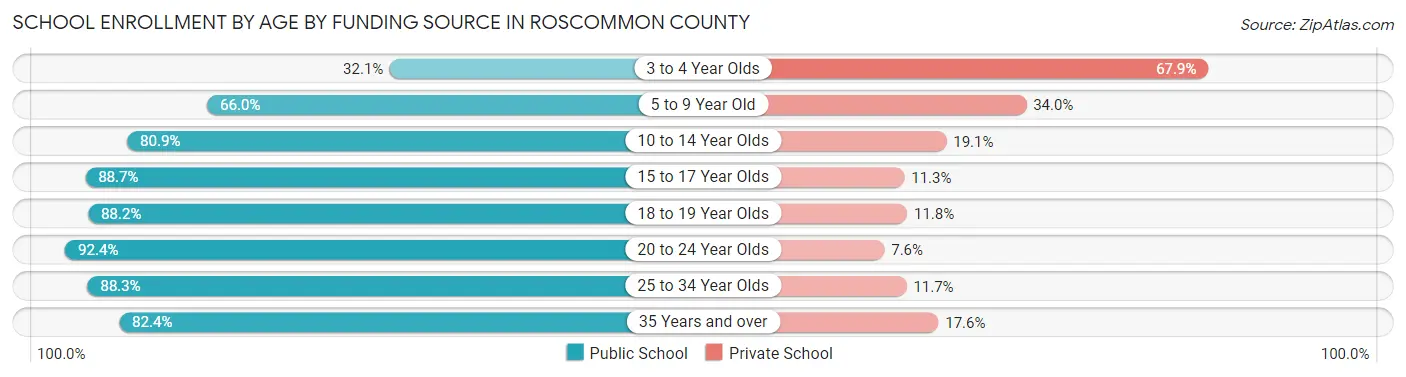
| Age Bracket | Public School | Private School |
| 3 to 4 Year Olds | 52 (32.1%) | 110 (67.9%) |
| 5 to 9 Year Old | 627 (66.0%) | 323 (34.0%) |
| 10 to 14 Year Olds | 694 (80.9%) | 164 (19.1%) |
| 15 to 17 Year Olds | 503 (88.7%) | 64 (11.3%) |
| 18 to 19 Year Olds | 209 (88.2%) | 28 (11.8%) |
| 20 to 24 Year Olds | 208 (92.4%) | 17 (7.6%) |
| 25 to 34 Year Olds | 219 (88.3%) | 29 (11.7%) |
| 35 Years and over | 173 (82.4%) | 37 (17.6%) |
| Total | 2,686 (77.7%) | 771 (22.3%) |
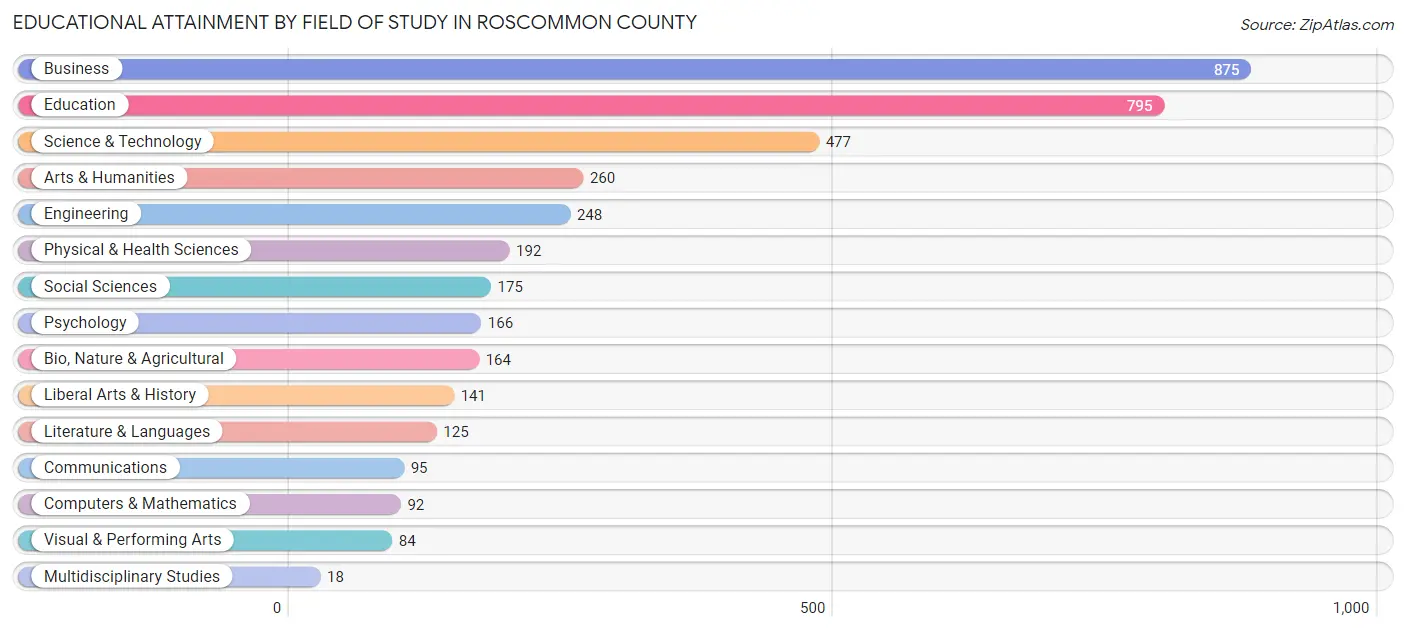
Educational Attainment by Field of Study in Roscommon County
Business (875 | 22.4%), education (795 | 20.3%), science & technology (477 | 12.2%), arts & humanities (260 | 6.7%), and engineering (248 | 6.4%) are the most common fields of study among 3,907 individuals in Roscommon County who have obtained a bachelor's degree or higher.
| Field of Study | # Graduates | % Graduates |
| Computers & Mathematics | 92 | 2.4% |
| Bio, Nature & Agricultural | 164 | 4.2% |
| Physical & Health Sciences | 192 | 4.9% |
| Psychology | 166 | 4.3% |
| Social Sciences | 175 | 4.5% |
| Engineering | 248 | 6.4% |
| Multidisciplinary Studies | 18 | 0.5% |
| Science & Technology | 477 | 12.2% |
| Business | 875 | 22.4% |
| Education | 795 | 20.3% |
| Literature & Languages | 125 | 3.2% |
| Liberal Arts & History | 141 | 3.6% |
| Visual & Performing Arts | 84 | 2.1% |
| Communications | 95 | 2.4% |
| Arts & Humanities | 260 | 6.7% |
| Total | 3,907 | 100.0% |
Transportation & Commute in Roscommon County
Vehicle Availability by Sex in Roscommon County
The most prevalent vehicle ownership categories in Roscommon County are males with 2 vehicles (1,893, accounting for 44.9%) and females with 2 vehicles (1,607, making up 51.6%).
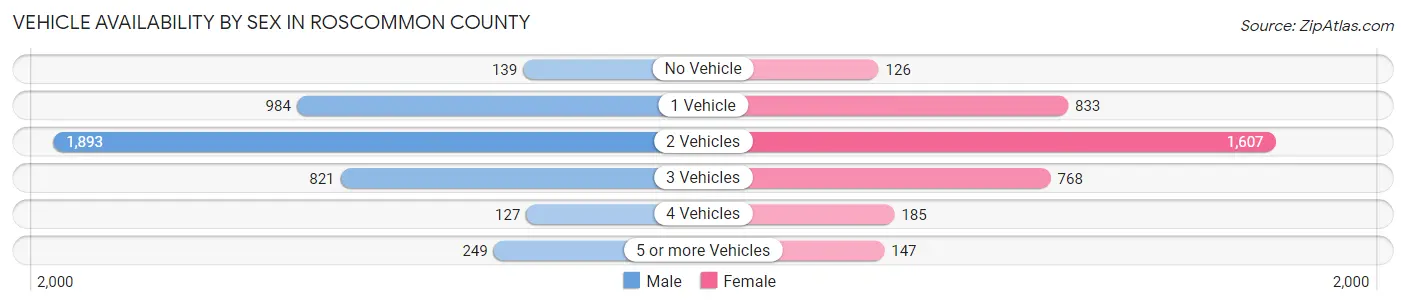
| Vehicles Available | Male | Female |
| No Vehicle | 139 (3.3%) | 126 (3.4%) |
| 1 Vehicle | 984 (23.4%) | 833 (22.7%) |
| 2 Vehicles | 1,893 (44.9%) | 1,607 (43.8%) |
| 3 Vehicles | 821 (19.5%) | 768 (20.9%) |
| 4 Vehicles | 127 (3.0%) | 185 (5.1%) |
| 5 or more Vehicles | 249 (5.9%) | 147 (4.0%) |
| Total | 4,213 (100.0%) | 3,666 (100.0%) |
Commute Time in Roscommon County
The most frequently occuring commute durations in Roscommon County are 5 to 9 minutes (1,176 commuters, 16.5%), 20 to 24 minutes (1,079 commuters, 15.1%), and 10 to 14 minutes (987 commuters, 13.8%).
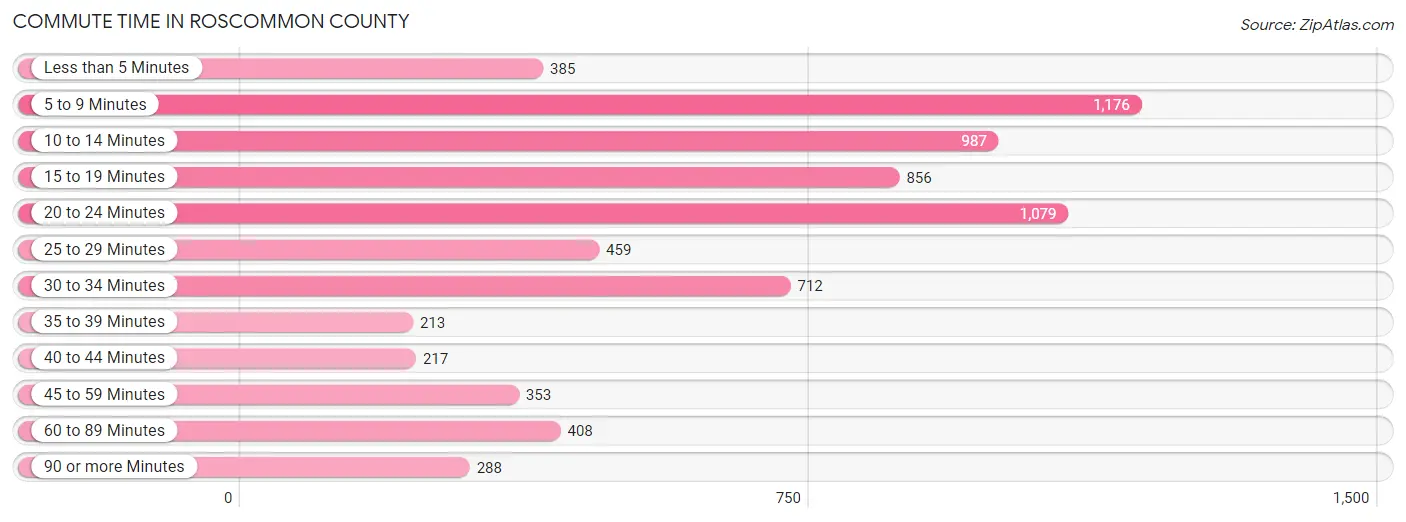
| Commute Time | # Commuters | % Commuters |
| Less than 5 Minutes | 385 | 5.4% |
| 5 to 9 Minutes | 1,176 | 16.5% |
| 10 to 14 Minutes | 987 | 13.8% |
| 15 to 19 Minutes | 856 | 12.0% |
| 20 to 24 Minutes | 1,079 | 15.1% |
| 25 to 29 Minutes | 459 | 6.4% |
| 30 to 34 Minutes | 712 | 10.0% |
| 35 to 39 Minutes | 213 | 3.0% |
| 40 to 44 Minutes | 217 | 3.0% |
| 45 to 59 Minutes | 353 | 5.0% |
| 60 to 89 Minutes | 408 | 5.7% |
| 90 or more Minutes | 288 | 4.0% |
Commute Time by Sex in Roscommon County
The most common commute times in Roscommon County are 5 to 9 minutes (673 commuters, 17.1%) for males and 10 to 14 minutes (562 commuters, 17.6%) for females.
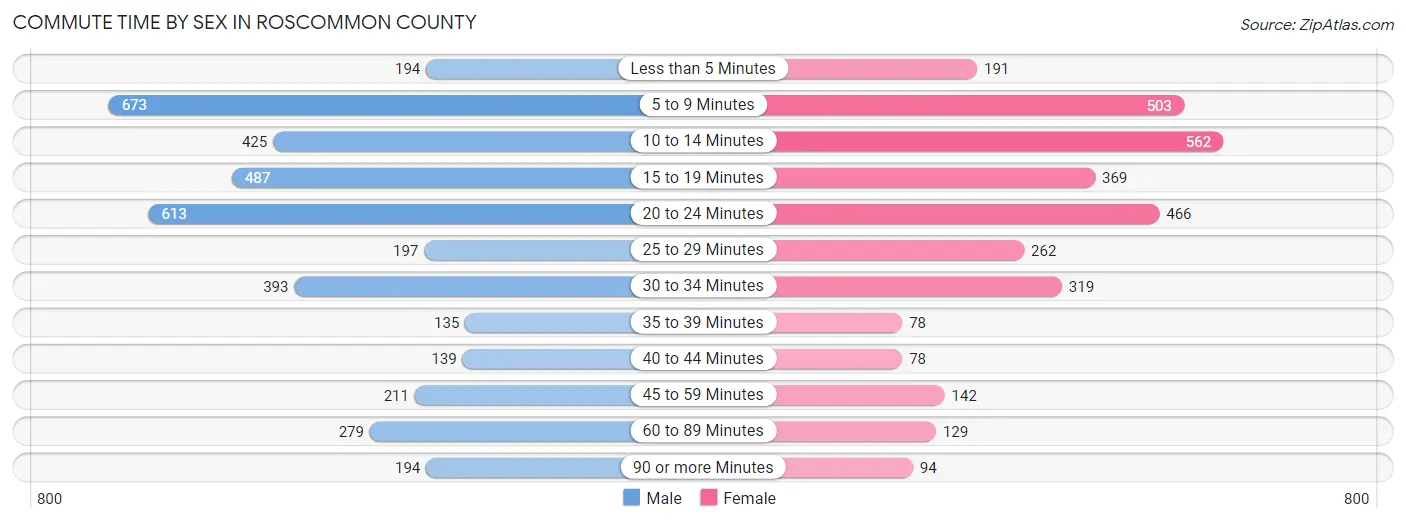
| Commute Time | Male | Female |
| Less than 5 Minutes | 194 (4.9%) | 191 (6.0%) |
| 5 to 9 Minutes | 673 (17.1%) | 503 (15.8%) |
| 10 to 14 Minutes | 425 (10.8%) | 562 (17.6%) |
| 15 to 19 Minutes | 487 (12.4%) | 369 (11.6%) |
| 20 to 24 Minutes | 613 (15.6%) | 466 (14.6%) |
| 25 to 29 Minutes | 197 (5.0%) | 262 (8.2%) |
| 30 to 34 Minutes | 393 (10.0%) | 319 (10.0%) |
| 35 to 39 Minutes | 135 (3.4%) | 78 (2.4%) |
| 40 to 44 Minutes | 139 (3.5%) | 78 (2.4%) |
| 45 to 59 Minutes | 211 (5.4%) | 142 (4.4%) |
| 60 to 89 Minutes | 279 (7.1%) | 129 (4.0%) |
| 90 or more Minutes | 194 (4.9%) | 94 (2.9%) |
Time of Departure to Work by Sex in Roscommon County
The most frequent times of departure to work in Roscommon County are 7:30 AM to 7:59 AM (677, 17.2%) for males and 7:30 AM to 7:59 AM (630, 19.7%) for females.
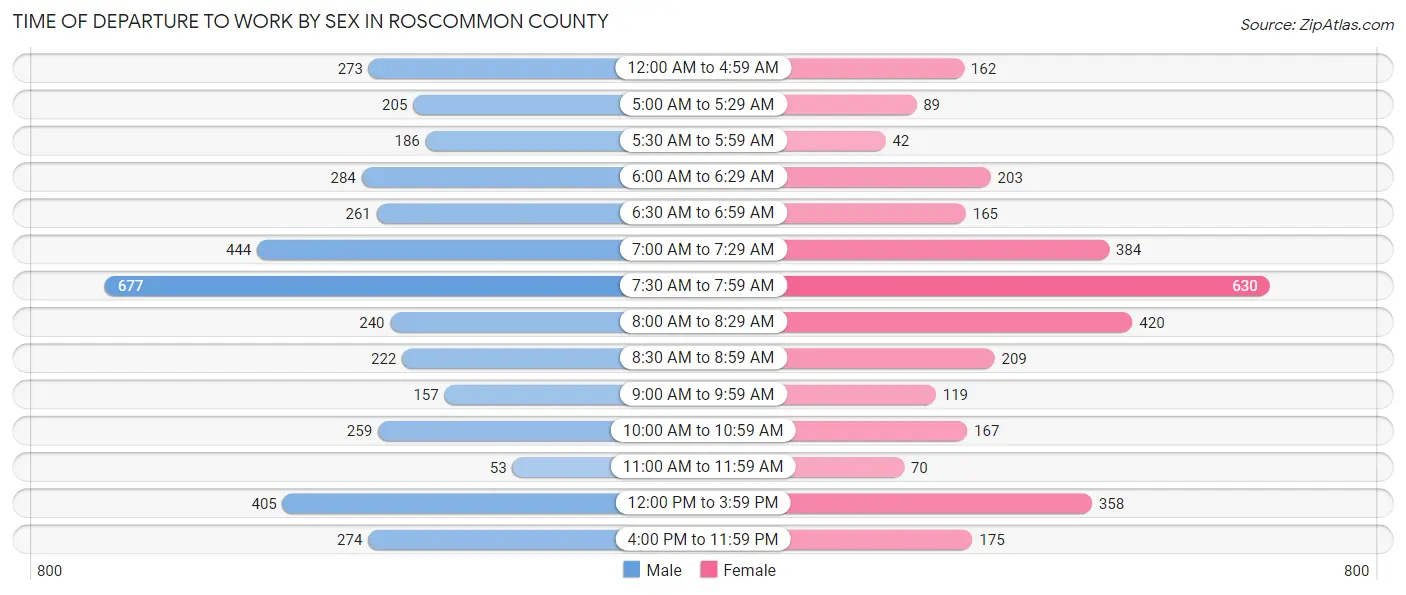
| Time of Departure | Male | Female |
| 12:00 AM to 4:59 AM | 273 (6.9%) | 162 (5.1%) |
| 5:00 AM to 5:29 AM | 205 (5.2%) | 89 (2.8%) |
| 5:30 AM to 5:59 AM | 186 (4.7%) | 42 (1.3%) |
| 6:00 AM to 6:29 AM | 284 (7.2%) | 203 (6.4%) |
| 6:30 AM to 6:59 AM | 261 (6.6%) | 165 (5.2%) |
| 7:00 AM to 7:29 AM | 444 (11.3%) | 384 (12.0%) |
| 7:30 AM to 7:59 AM | 677 (17.2%) | 630 (19.7%) |
| 8:00 AM to 8:29 AM | 240 (6.1%) | 420 (13.2%) |
| 8:30 AM to 8:59 AM | 222 (5.6%) | 209 (6.6%) |
| 9:00 AM to 9:59 AM | 157 (4.0%) | 119 (3.7%) |
| 10:00 AM to 10:59 AM | 259 (6.6%) | 167 (5.2%) |
| 11:00 AM to 11:59 AM | 53 (1.3%) | 70 (2.2%) |
| 12:00 PM to 3:59 PM | 405 (10.3%) | 358 (11.2%) |
| 4:00 PM to 11:59 PM | 274 (7.0%) | 175 (5.5%) |
| Total | 3,940 (100.0%) | 3,193 (100.0%) |
Housing Occupancy in Roscommon County
Occupancy by Ownership in Roscommon County
Of the total 11,358 dwellings in Roscommon County, owner-occupied units account for 9,440 (83.1%), while renter-occupied units make up 1,918 (16.9%).

| Occupancy | # Housing Units | % Housing Units |
| Owner Occupied Housing Units | 9,440 | 83.1% |
| Renter-Occupied Housing Units | 1,918 | 16.9% |
| Total Occupied Housing Units | 11,358 | 100.0% |
Occupancy by Household Size in Roscommon County
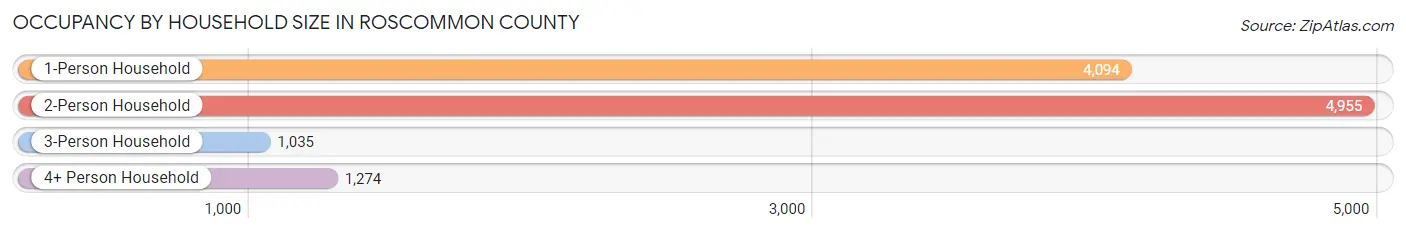
| Household Size | # Housing Units | % Housing Units |
| 1-Person Household | 4,094 | 36.0% |
| 2-Person Household | 4,955 | 43.6% |
| 3-Person Household | 1,035 | 9.1% |
| 4+ Person Household | 1,274 | 11.2% |
| Total Housing Units | 11,358 | 100.0% |
Occupancy by Ownership by Household Size in Roscommon County
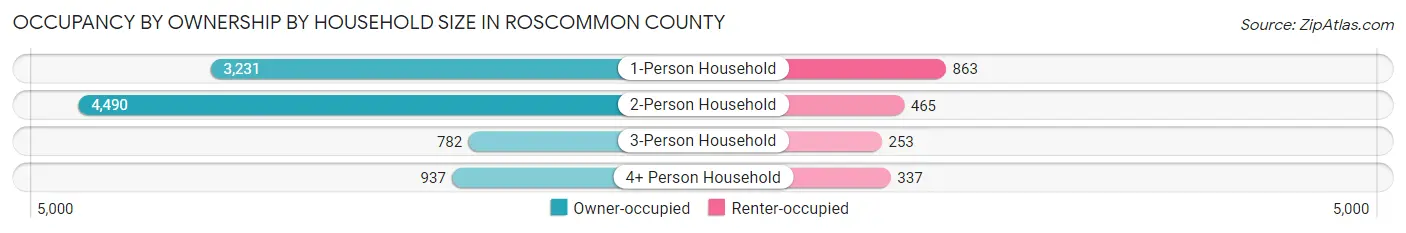
| Household Size | Owner-occupied | Renter-occupied |
| 1-Person Household | 3,231 (78.9%) | 863 (21.1%) |
| 2-Person Household | 4,490 (90.6%) | 465 (9.4%) |
| 3-Person Household | 782 (75.6%) | 253 (24.4%) |
| 4+ Person Household | 937 (73.6%) | 337 (26.5%) |
| Total Housing Units | 9,440 (83.1%) | 1,918 (16.9%) |
Occupancy by Educational Attainment in Roscommon County
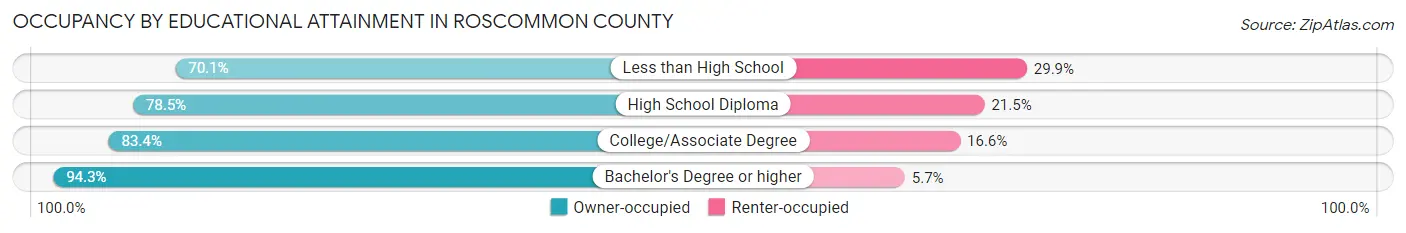
| Household Size | Owner-occupied | Renter-occupied |
| Less than High School | 603 (70.1%) | 257 (29.9%) |
| High School Diploma | 2,708 (78.5%) | 741 (21.5%) |
| College/Associate Degree | 3,952 (83.4%) | 789 (16.6%) |
| Bachelor's Degree or higher | 2,177 (94.3%) | 131 (5.7%) |
Occupancy by Age of Householder in Roscommon County
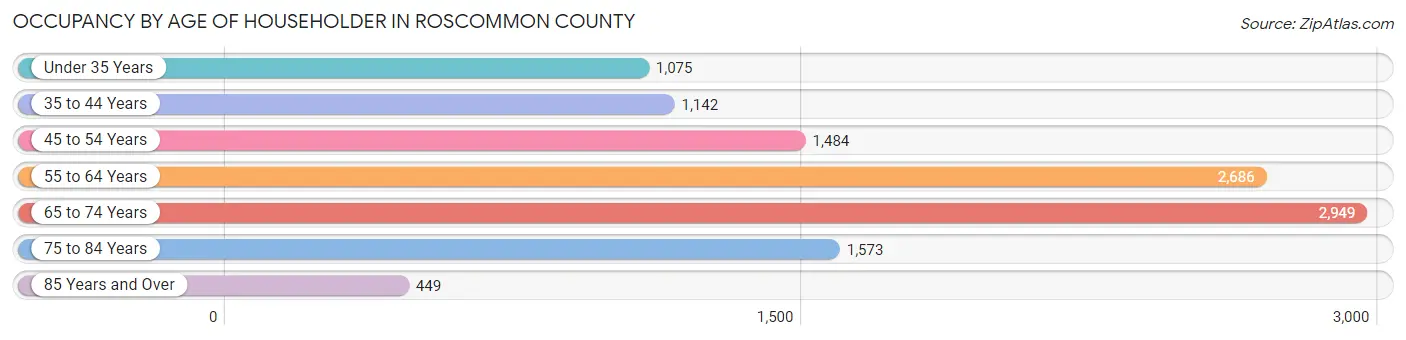
| Age Bracket | # Households | % Households |
| Under 35 Years | 1,075 | 9.5% |
| 35 to 44 Years | 1,142 | 10.1% |
| 45 to 54 Years | 1,484 | 13.1% |
| 55 to 64 Years | 2,686 | 23.6% |
| 65 to 74 Years | 2,949 | 26.0% |
| 75 to 84 Years | 1,573 | 13.9% |
| 85 Years and Over | 449 | 4.0% |
| Total | 11,358 | 100.0% |
Housing Finances in Roscommon County
Median Income by Occupancy in Roscommon County
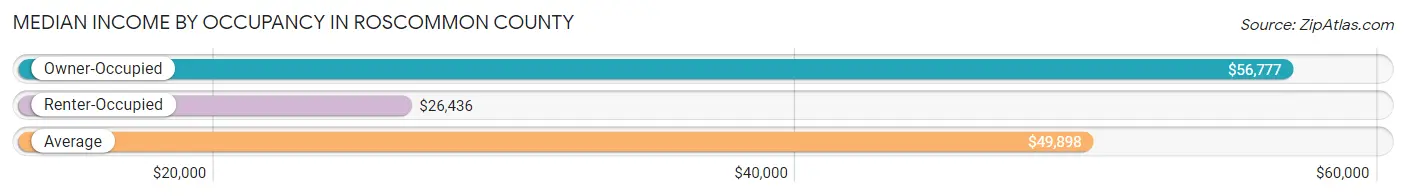
| Occupancy Type | # Households | Median Income |
| Owner-Occupied | 9,440 (83.1%) | $56,777 |
| Renter-Occupied | 1,918 (16.9%) | $26,436 |
| Average | 11,358 (100.0%) | $49,898 |
Occupancy by Householder Income Bracket in Roscommon County
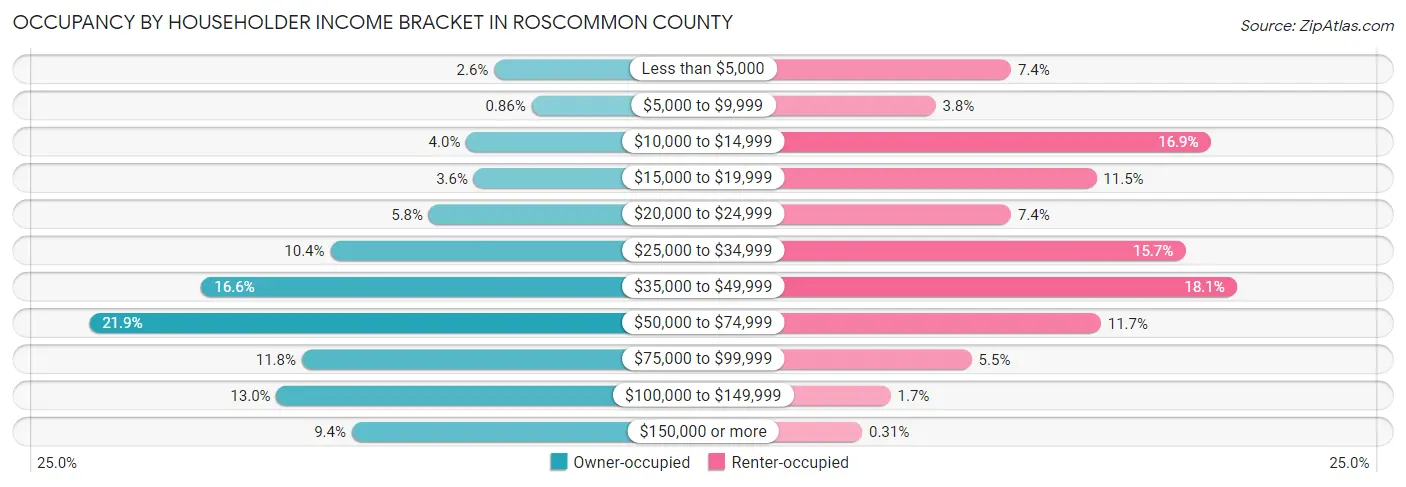
| Income Bracket | Owner-occupied | Renter-occupied |
| Less than $5,000 | 249 (2.6%) | 142 (7.4%) |
| $5,000 to $9,999 | 81 (0.9%) | 73 (3.8%) |
| $10,000 to $14,999 | 375 (4.0%) | 324 (16.9%) |
| $15,000 to $19,999 | 341 (3.6%) | 220 (11.5%) |
| $20,000 to $24,999 | 543 (5.8%) | 142 (7.4%) |
| $25,000 to $34,999 | 986 (10.4%) | 301 (15.7%) |
| $35,000 to $49,999 | 1,565 (16.6%) | 348 (18.1%) |
| $50,000 to $74,999 | 2,069 (21.9%) | 224 (11.7%) |
| $75,000 to $99,999 | 1,114 (11.8%) | 106 (5.5%) |
| $100,000 to $149,999 | 1,228 (13.0%) | 32 (1.7%) |
| $150,000 or more | 889 (9.4%) | 6 (0.3%) |
| Total | 9,440 (100.0%) | 1,918 (100.0%) |
Monthly Housing Cost Tiers in Roscommon County
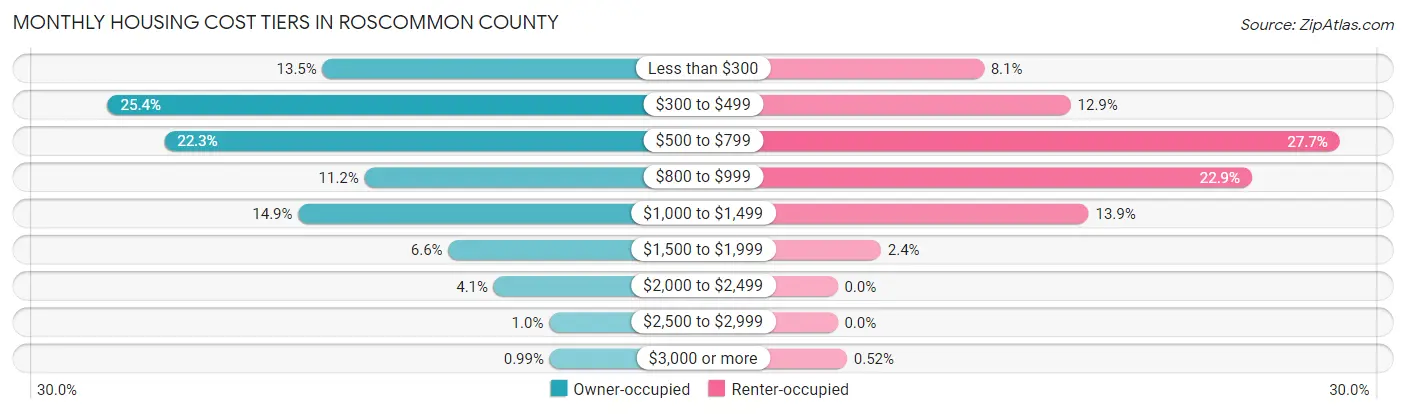
| Monthly Cost | Owner-occupied | Renter-occupied |
| Less than $300 | 1,278 (13.5%) | 155 (8.1%) |
| $300 to $499 | 2,399 (25.4%) | 247 (12.9%) |
| $500 to $799 | 2,103 (22.3%) | 532 (27.7%) |
| $800 to $999 | 1,059 (11.2%) | 439 (22.9%) |
| $1,000 to $1,499 | 1,405 (14.9%) | 266 (13.9%) |
| $1,500 to $1,999 | 622 (6.6%) | 46 (2.4%) |
| $2,000 to $2,499 | 385 (4.1%) | 0 (0.0%) |
| $2,500 to $2,999 | 96 (1.0%) | 0 (0.0%) |
| $3,000 or more | 93 (1.0%) | 10 (0.5%) |
| Total | 9,440 (100.0%) | 1,918 (100.0%) |
Physical Housing Characteristics in Roscommon County
Housing Structures in Roscommon County
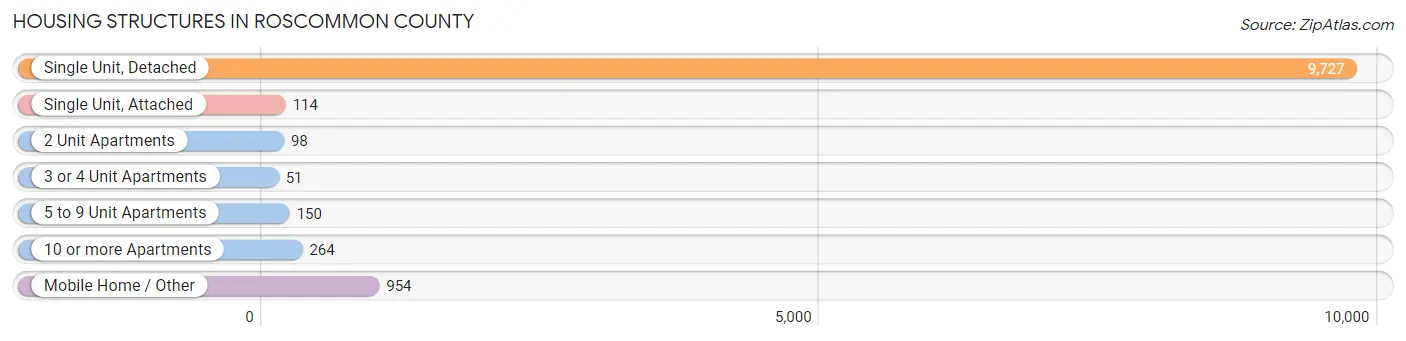
| Structure Type | # Housing Units | % Housing Units |
| Single Unit, Detached | 9,727 | 85.6% |
| Single Unit, Attached | 114 | 1.0% |
| 2 Unit Apartments | 98 | 0.9% |
| 3 or 4 Unit Apartments | 51 | 0.4% |
| 5 to 9 Unit Apartments | 150 | 1.3% |
| 10 or more Apartments | 264 | 2.3% |
| Mobile Home / Other | 954 | 8.4% |
| Total | 11,358 | 100.0% |
Housing Structures by Occupancy in Roscommon County
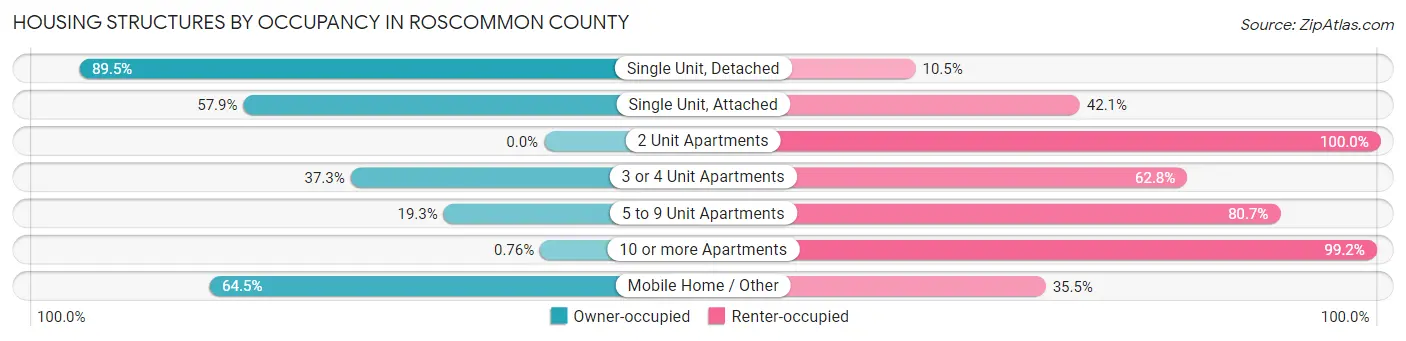
| Structure Type | Owner-occupied | Renter-occupied |
| Single Unit, Detached | 8,709 (89.5%) | 1,018 (10.5%) |
| Single Unit, Attached | 66 (57.9%) | 48 (42.1%) |
| 2 Unit Apartments | 0 (0.0%) | 98 (100.0%) |
| 3 or 4 Unit Apartments | 19 (37.2%) | 32 (62.7%) |
| 5 to 9 Unit Apartments | 29 (19.3%) | 121 (80.7%) |
| 10 or more Apartments | 2 (0.8%) | 262 (99.2%) |
| Mobile Home / Other | 615 (64.5%) | 339 (35.5%) |
| Total | 9,440 (83.1%) | 1,918 (16.9%) |
Housing Structures by Number of Rooms in Roscommon County
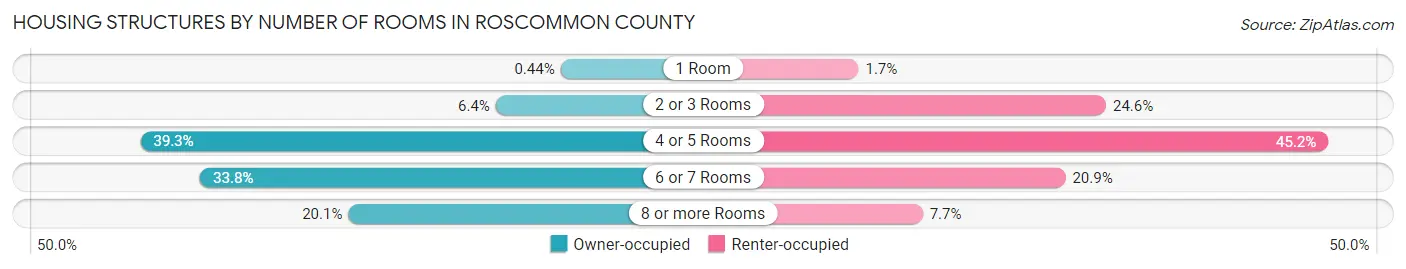
| Number of Rooms | Owner-occupied | Renter-occupied |
| 1 Room | 42 (0.4%) | 33 (1.7%) |
| 2 or 3 Rooms | 607 (6.4%) | 472 (24.6%) |
| 4 or 5 Rooms | 3,709 (39.3%) | 866 (45.2%) |
| 6 or 7 Rooms | 3,187 (33.8%) | 400 (20.9%) |
| 8 or more Rooms | 1,895 (20.1%) | 147 (7.7%) |
| Total | 9,440 (100.0%) | 1,918 (100.0%) |
Housing Structure by Heating Type in Roscommon County
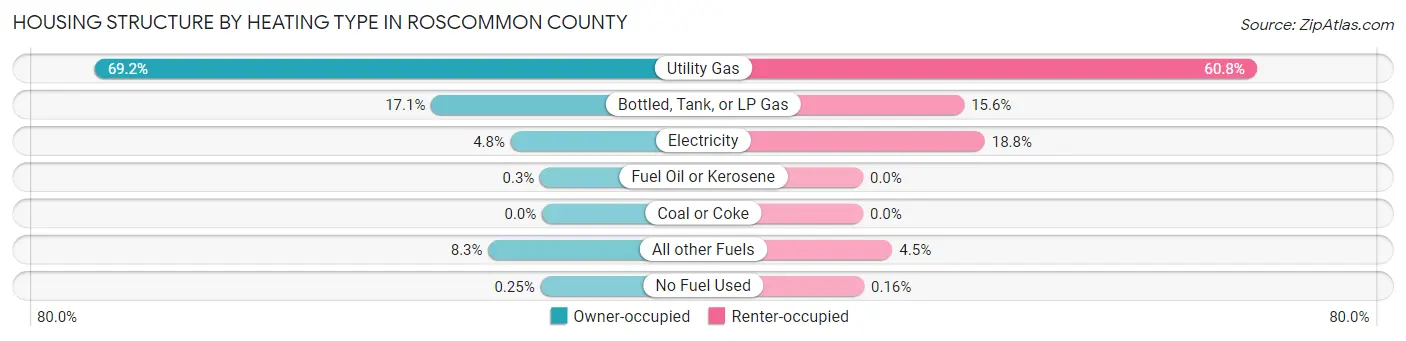
| Heating Type | Owner-occupied | Renter-occupied |
| Utility Gas | 6,529 (69.2%) | 1,167 (60.8%) |
| Bottled, Tank, or LP Gas | 1,618 (17.1%) | 300 (15.6%) |
| Electricity | 457 (4.8%) | 361 (18.8%) |
| Fuel Oil or Kerosene | 28 (0.3%) | 0 (0.0%) |
| Coal or Coke | 0 (0.0%) | 0 (0.0%) |
| All other Fuels | 784 (8.3%) | 87 (4.5%) |
| No Fuel Used | 24 (0.3%) | 3 (0.2%) |
| Total | 9,440 (100.0%) | 1,918 (100.0%) |
Household Vehicle Usage in Roscommon County
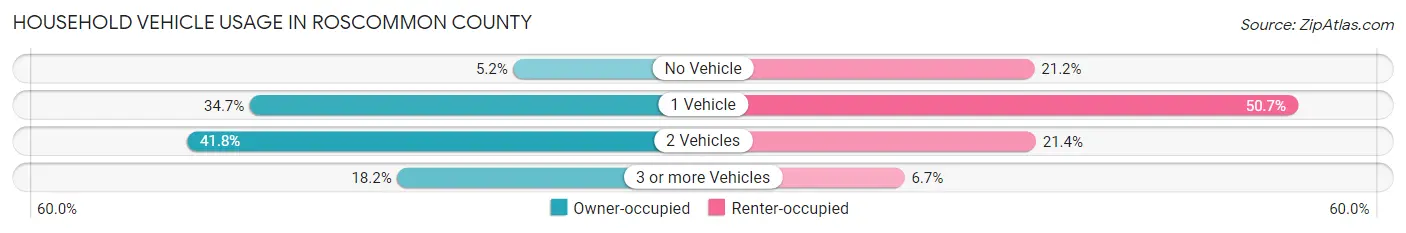
| Vehicles per Household | Owner-occupied | Renter-occupied |
| No Vehicle | 493 (5.2%) | 407 (21.2%) |
| 1 Vehicle | 3,279 (34.7%) | 973 (50.7%) |
| 2 Vehicles | 3,947 (41.8%) | 410 (21.4%) |
| 3 or more Vehicles | 1,721 (18.2%) | 128 (6.7%) |
| Total | 9,440 (100.0%) | 1,918 (100.0%) |
Real Estate & Mortgages in Roscommon County
Real Estate and Mortgage Overview in Roscommon County
| Characteristic | Without Mortgage | With Mortgage |
| Housing Units | 5,071 | 4,369 |
| Median Property Value | $126,400 | $144,300 |
| Median Household Income | $46,564 | $533 |
| Monthly Housing Costs | $401 | $71 |
| Real Estate Taxes | $1,386 | $105 |
Property Value by Mortgage Status in Roscommon County
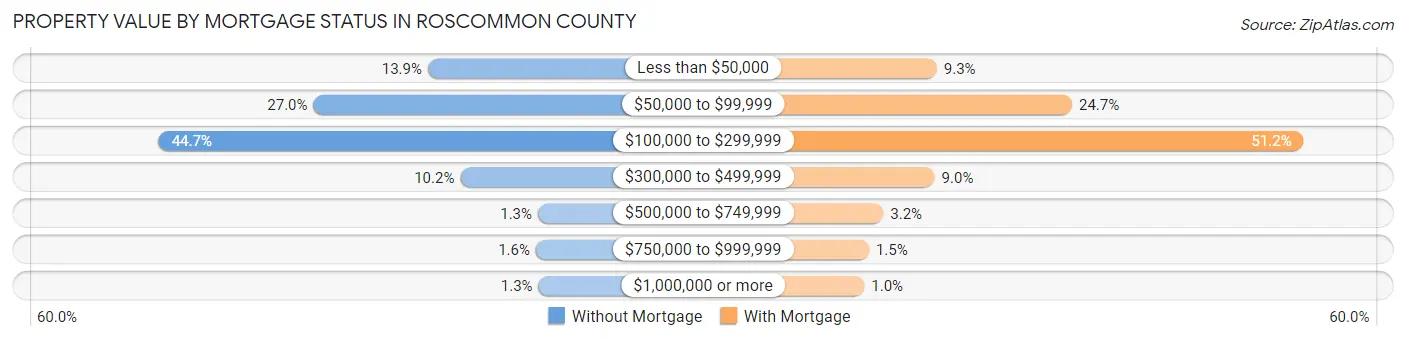
| Property Value | Without Mortgage | With Mortgage |
| Less than $50,000 | 706 (13.9%) | 406 (9.3%) |
| $50,000 to $99,999 | 1,369 (27.0%) | 1,081 (24.7%) |
| $100,000 to $299,999 | 2,265 (44.7%) | 2,237 (51.2%) |
| $300,000 to $499,999 | 518 (10.2%) | 395 (9.0%) |
| $500,000 to $749,999 | 68 (1.3%) | 139 (3.2%) |
| $750,000 to $999,999 | 80 (1.6%) | 67 (1.5%) |
| $1,000,000 or more | 65 (1.3%) | 44 (1.0%) |
| Total | 5,071 (100.0%) | 4,369 (100.0%) |
Household Income by Mortgage Status in Roscommon County
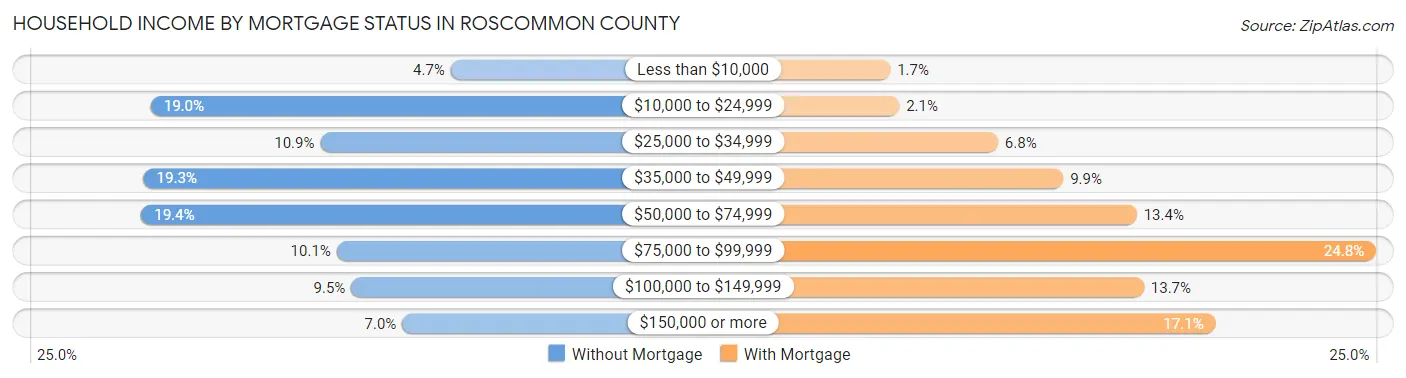
| Household Income | Without Mortgage | With Mortgage |
| Less than $10,000 | 239 (4.7%) | 72 (1.7%) |
| $10,000 to $24,999 | 963 (19.0%) | 91 (2.1%) |
| $25,000 to $34,999 | 554 (10.9%) | 296 (6.8%) |
| $35,000 to $49,999 | 980 (19.3%) | 432 (9.9%) |
| $50,000 to $74,999 | 986 (19.4%) | 585 (13.4%) |
| $75,000 to $99,999 | 514 (10.1%) | 1,083 (24.8%) |
| $100,000 to $149,999 | 479 (9.5%) | 600 (13.7%) |
| $150,000 or more | 356 (7.0%) | 749 (17.1%) |
| Total | 5,071 (100.0%) | 4,369 (100.0%) |
Property Value to Household Income Ratio in Roscommon County
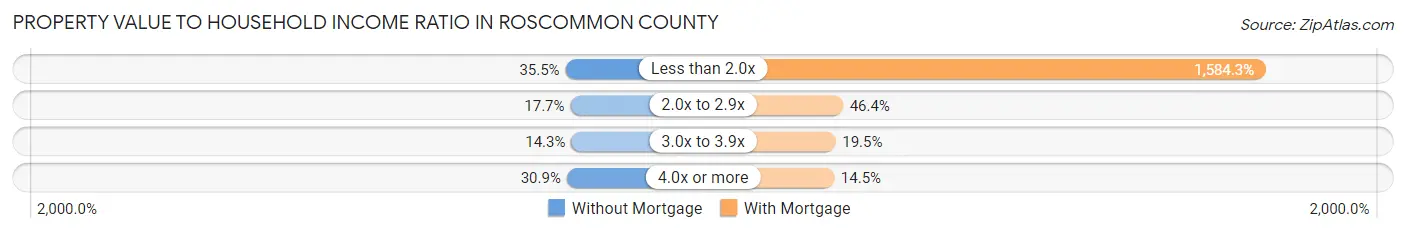
| Value-to-Income Ratio | Without Mortgage | With Mortgage |
| Less than 2.0x | 1,802 (35.5%) | 69,216 (1,584.2%) |
| 2.0x to 2.9x | 897 (17.7%) | 2,026 (46.4%) |
| 3.0x to 3.9x | 727 (14.3%) | 850 (19.5%) |
| 4.0x or more | 1,568 (30.9%) | 633 (14.5%) |
| Total | 5,071 (100.0%) | 4,369 (100.0%) |
Real Estate Taxes by Mortgage Status in Roscommon County

| Property Taxes | Without Mortgage | With Mortgage |
| Less than $800 | 1,072 (21.1%) | 4 (0.1%) |
| $800 to $1,499 | 1,624 (32.0%) | 491 (11.2%) |
| $800 to $1,499 | 2,175 (42.9%) | 1,553 (35.5%) |
| Total | 5,071 (100.0%) | 4,369 (100.0%) |
Health & Disability in Roscommon County
Health Insurance Coverage by Age in Roscommon County
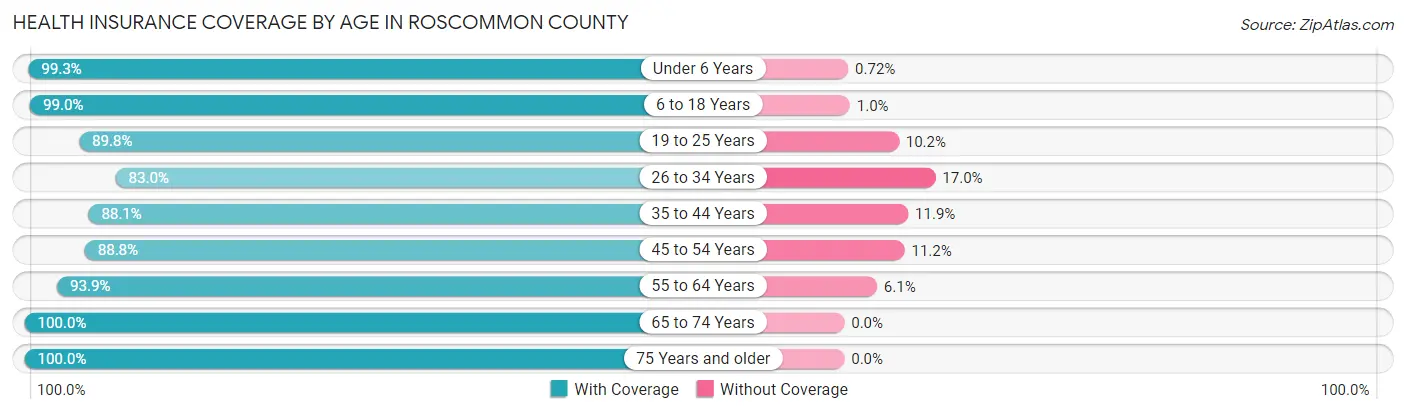
| Age Bracket | With Coverage | Without Coverage |
| Under 6 Years | 968 (99.3%) | 7 (0.7%) |
| 6 to 18 Years | 2,562 (99.0%) | 27 (1.0%) |
| 19 to 25 Years | 1,035 (89.8%) | 117 (10.2%) |
| 26 to 34 Years | 1,480 (83.0%) | 303 (17.0%) |
| 35 to 44 Years | 1,760 (88.1%) | 238 (11.9%) |
| 45 to 54 Years | 2,307 (88.8%) | 292 (11.2%) |
| 55 to 64 Years | 4,293 (93.9%) | 278 (6.1%) |
| 65 to 74 Years | 4,774 (100.0%) | 0 (0.0%) |
| 75 Years and older | 2,923 (100.0%) | 0 (0.0%) |
| Total | 22,102 (94.6%) | 1,262 (5.4%) |
Health Insurance Coverage by Citizenship Status in Roscommon County
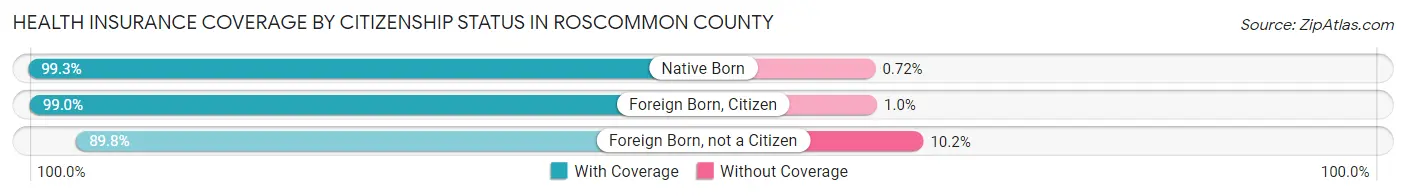
| Citizenship Status | With Coverage | Without Coverage |
| Native Born | 968 (99.3%) | 7 (0.7%) |
| Foreign Born, Citizen | 2,562 (99.0%) | 27 (1.0%) |
| Foreign Born, not a Citizen | 1,035 (89.8%) | 117 (10.2%) |
Health Insurance Coverage by Household Income in Roscommon County

| Household Income | With Coverage | Without Coverage |
| Under $25,000 | 3,699 (93.4%) | 262 (6.6%) |
| $25,000 to $49,999 | 5,585 (92.9%) | 425 (7.1%) |
| $50,000 to $74,999 | 4,659 (93.8%) | 307 (6.2%) |
| $75,000 to $99,999 | 2,612 (93.5%) | 180 (6.5%) |
| $100,000 and over | 5,508 (98.4%) | 88 (1.6%) |
Public vs Private Health Insurance Coverage by Age in Roscommon County
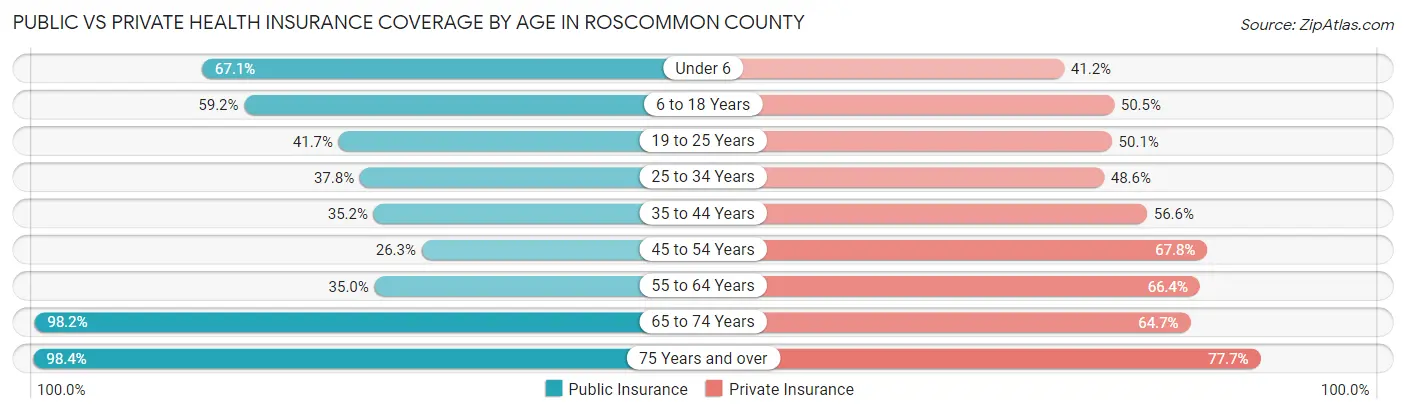
| Age Bracket | Public Insurance | Private Insurance |
| Under 6 | 654 (67.1%) | 402 (41.2%) |
| 6 to 18 Years | 1,533 (59.2%) | 1,307 (50.5%) |
| 19 to 25 Years | 480 (41.7%) | 577 (50.1%) |
| 25 to 34 Years | 673 (37.8%) | 867 (48.6%) |
| 35 to 44 Years | 703 (35.2%) | 1,131 (56.6%) |
| 45 to 54 Years | 683 (26.3%) | 1,763 (67.8%) |
| 55 to 64 Years | 1,601 (35.0%) | 3,037 (66.4%) |
| 65 to 74 Years | 4,688 (98.2%) | 3,089 (64.7%) |
| 75 Years and over | 2,875 (98.4%) | 2,271 (77.7%) |
| Total | 13,890 (59.5%) | 14,444 (61.8%) |
Disability Status by Sex by Age in Roscommon County
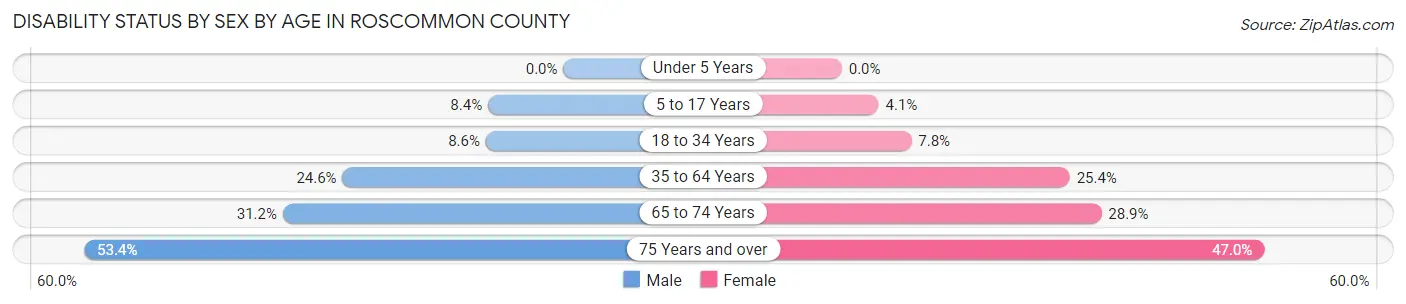
| Age Bracket | Male | Female |
| Under 5 Years | 0 (0.0%) | 0 (0.0%) |
| 5 to 17 Years | 111 (8.4%) | 51 (4.1%) |
| 18 to 34 Years | 135 (8.6%) | 118 (7.7%) |
| 35 to 64 Years | 1,128 (24.6%) | 1,163 (25.4%) |
| 65 to 74 Years | 775 (31.2%) | 663 (28.9%) |
| 75 Years and over | 776 (53.4%) | 691 (47.0%) |
Disability Class by Sex by Age in Roscommon County
Disability Class: Hearing Difficulty
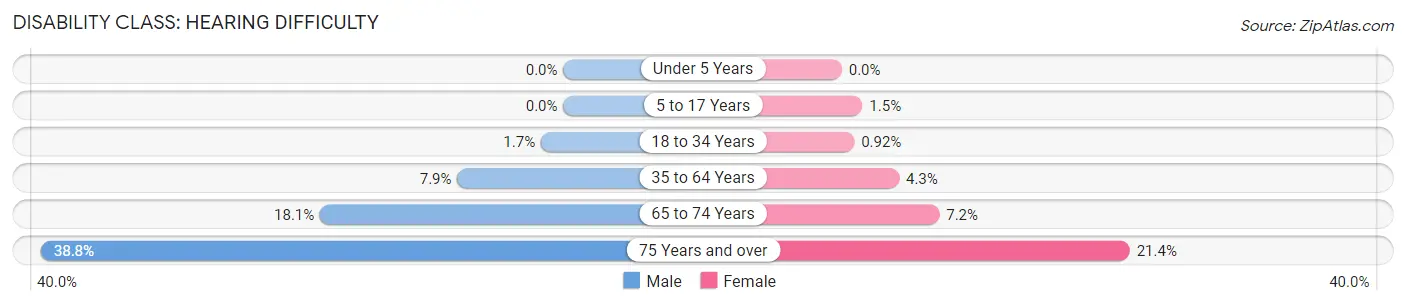
| Age Bracket | Male | Female |
| Under 5 Years | 0 (0.0%) | 0 (0.0%) |
| 5 to 17 Years | 0 (0.0%) | 19 (1.5%) |
| 18 to 34 Years | 26 (1.7%) | 14 (0.9%) |
| 35 to 64 Years | 361 (7.9%) | 195 (4.3%) |
| 65 to 74 Years | 448 (18.1%) | 166 (7.2%) |
| 75 Years and over | 564 (38.8%) | 314 (21.4%) |
Disability Class: Vision Difficulty
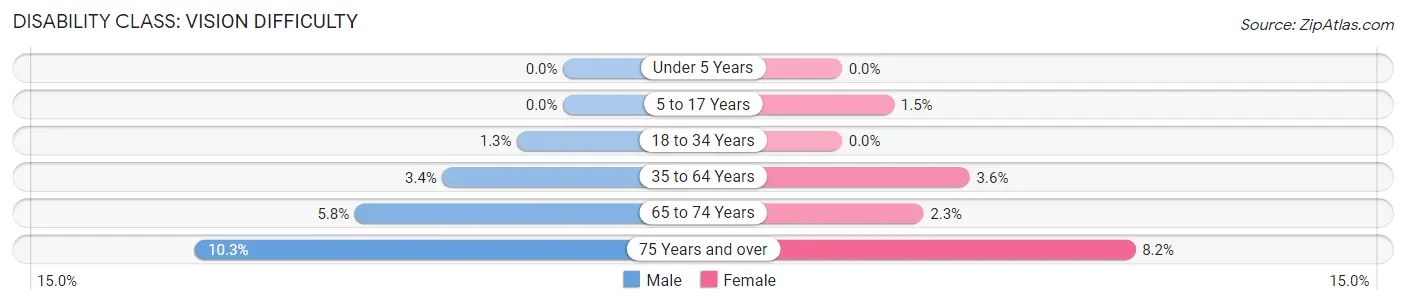
| Age Bracket | Male | Female |
| Under 5 Years | 0 (0.0%) | 0 (0.0%) |
| 5 to 17 Years | 0 (0.0%) | 18 (1.5%) |
| 18 to 34 Years | 20 (1.3%) | 0 (0.0%) |
| 35 to 64 Years | 154 (3.4%) | 163 (3.6%) |
| 65 to 74 Years | 144 (5.8%) | 52 (2.3%) |
| 75 Years and over | 149 (10.2%) | 120 (8.2%) |
Disability Class: Cognitive Difficulty
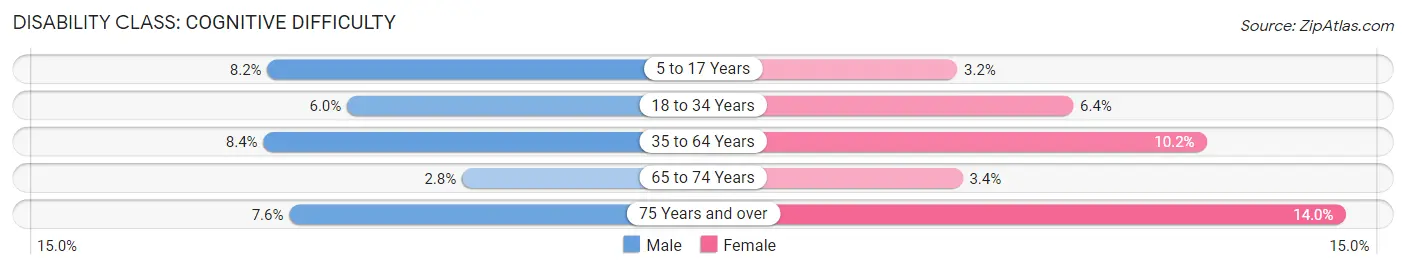
| Age Bracket | Male | Female |
| 5 to 17 Years | 109 (8.2%) | 40 (3.2%) |
| 18 to 34 Years | 94 (6.0%) | 98 (6.4%) |
| 35 to 64 Years | 383 (8.4%) | 465 (10.2%) |
| 65 to 74 Years | 70 (2.8%) | 77 (3.4%) |
| 75 Years and over | 111 (7.6%) | 206 (14.0%) |
Disability Class: Ambulatory Difficulty
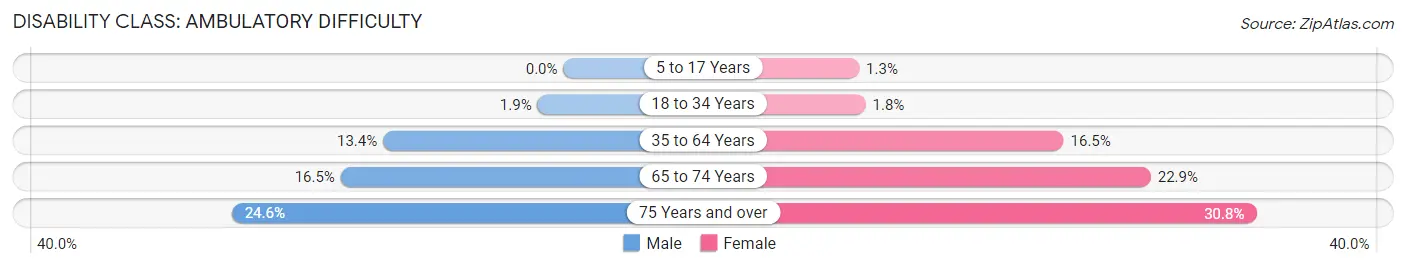
| Age Bracket | Male | Female |
| 5 to 17 Years | 0 (0.0%) | 16 (1.3%) |
| 18 to 34 Years | 30 (1.9%) | 27 (1.8%) |
| 35 to 64 Years | 614 (13.4%) | 755 (16.5%) |
| 65 to 74 Years | 410 (16.5%) | 526 (22.9%) |
| 75 Years and over | 358 (24.6%) | 452 (30.8%) |
Disability Class: Self-Care Difficulty
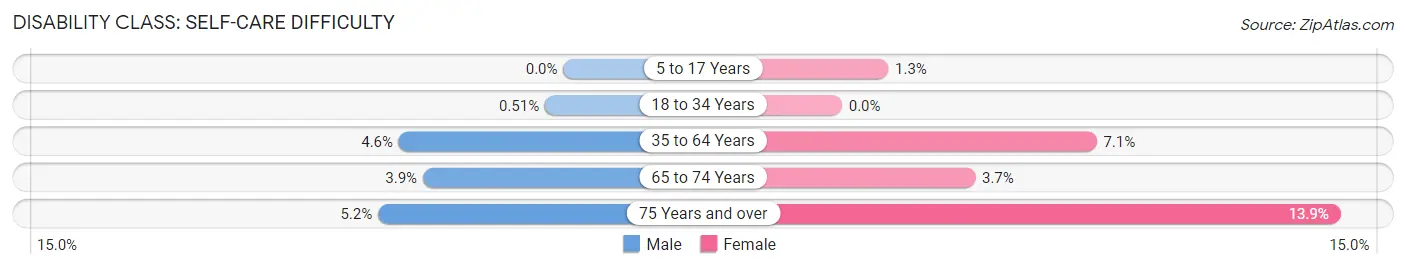
| Age Bracket | Male | Female |
| 5 to 17 Years | 0 (0.0%) | 16 (1.3%) |
| 18 to 34 Years | 8 (0.5%) | 0 (0.0%) |
| 35 to 64 Years | 210 (4.6%) | 325 (7.1%) |
| 65 to 74 Years | 97 (3.9%) | 85 (3.7%) |
| 75 Years and over | 75 (5.2%) | 204 (13.9%) |
Technology Access in Roscommon County
Computing Device Access in Roscommon County
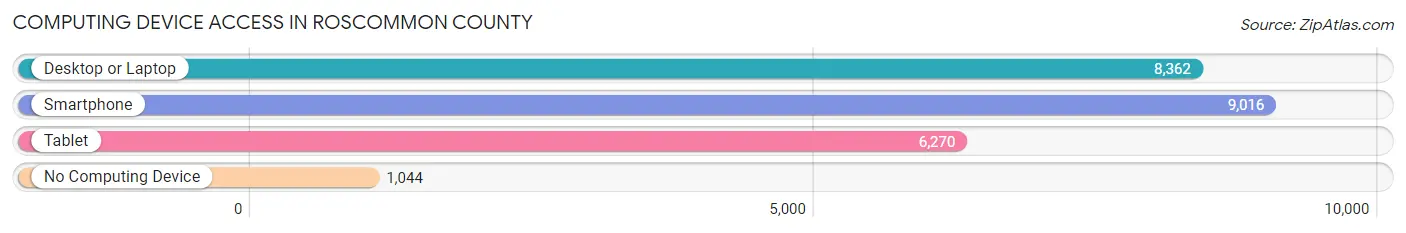
| Device Type | # Households | % Households |
| Desktop or Laptop | 8,362 | 73.6% |
| Smartphone | 9,016 | 79.4% |
| Tablet | 6,270 | 55.2% |
| No Computing Device | 1,044 | 9.2% |
| Total | 11,358 | 100.0% |
Internet Access in Roscommon County
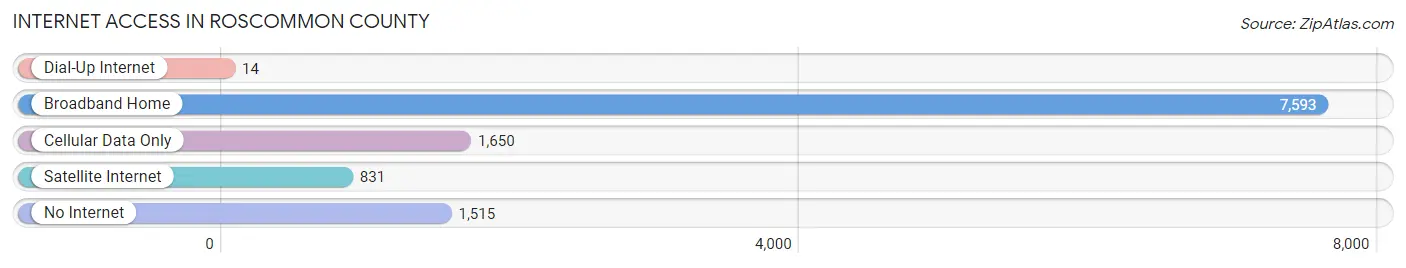
| Internet Type | # Households | % Households |
| Dial-Up Internet | 14 | 0.1% |
| Broadband Home | 7,593 | 66.8% |
| Cellular Data Only | 1,650 | 14.5% |
| Satellite Internet | 831 | 7.3% |
| No Internet | 1,515 | 13.3% |
| Total | 11,358 | 100.0% |
Roscommon County Summary
Roscommon County is located in the northern part of Michigan’s Lower Peninsula. It is bordered by Crawford County to the north, Ogemaw County to the east, Gladwin County to the south, and Missaukee County to the west. The county seat is Roscommon, and the county has a total area of 576 square miles.
History
The area that is now Roscommon County was originally inhabited by the Ojibwa people. The first European settlers arrived in the area in the early 1800s, and the county was officially organized in 1840. The county was named after Roscommon, Ireland, which was the hometown of an early settler.
In the late 1800s, the county experienced a period of rapid growth as logging and lumbering became the primary industries. The county also became a popular tourist destination, with many people coming to hunt, fish, and enjoy the natural beauty of the area.
In the early 1900s, the county’s economy shifted to agriculture, and the area became known for its production of potatoes, apples, and other crops. The county also became a popular destination for hunters and fishermen, and the area’s lakes and rivers became popular recreational spots.
Geography
Roscommon County is located in the northern part of Michigan’s Lower Peninsula. It is bordered by Crawford County to the north, Ogemaw County to the east, Gladwin County to the south, and Missaukee County to the west. The county has a total area of 576 square miles, and is home to numerous lakes, rivers, and streams.
The county is mostly covered in forests, with the majority of the land being used for logging and lumbering. The county is also home to several state parks, including Higgins Lake State Park, Hartwick Pines State Park, and North Higgins Lake State Park.
Economy
The economy of Roscommon County is largely based on agriculture, forestry, and tourism. The county is home to numerous farms, which produce potatoes, apples, and other crops. The county is also home to several logging and lumbering operations, which provide jobs for many of the county’s residents.
In addition, the county is a popular tourist destination, with many people coming to hunt, fish, and enjoy the natural beauty of the area. The county is also home to several state parks, which attract visitors from all over the state.
Demographics
As of the 2010 census, the population of Roscommon County was 24,449. The population is largely white (94.3%), with small percentages of African American (2.2%), Native American (1.2%), Asian (0.5%), and other races (1.8%). The median household income is $37,945, and the median age is 44.7 years.
Conclusion
Roscommon County is located in the northern part of Michigan’s Lower Peninsula. It is bordered by Crawford County to the north, Ogemaw County to the east, Gladwin County to the south, and Missaukee County to the west. The county has a total area of 576 square miles, and is home to numerous lakes, rivers, and streams. The economy of Roscommon County is largely based on agriculture, forestry, and tourism, and the population is largely white. The county is a popular tourist destination, with many people coming to hunt, fish, and enjoy the natural beauty of the area.
Common Questions
What is the Total Population of Roscommon County?
Total Population of Roscommon County is 23,556.
What is the Total Male Population of Roscommon County?
Total Male Population of Roscommon County is 11,891.
What is the Total Female Population of Roscommon County?
Total Female Population of Roscommon County is 11,665.
What is the Ratio of Males per 100 Females in Roscommon County?
There are 101.94 Males per 100 Females in Roscommon County.
What is the Ratio of Females per 100 Males in Roscommon County?
There are 98.10 Females per 100 Males in Roscommon County.
What is the Median Population Age in Roscommon County?
Median Population Age in Roscommon County is 57.0 Years.
What is the Average Family Size in Roscommon County
Average Family Size in Roscommon County is 2.6 People.
What is the Average Household Size in Roscommon County
Average Household Size in Roscommon County is 2.0 People.
What is Per Capita Income in Roscommon County?
Per Capita income in Roscommon County is $34,587.
What is the Median Family Income in Roscommon County?
Median Family Income in Roscommon County is $63,425.
What is the Median Household income in Roscommon County?
Median Household Income in Roscommon County is $49,898.
What is Income or Wage Gap in Roscommon County?
Income or Wage Gap in Roscommon County is 35.7%.
Women in Roscommon County earn 64.3 cents for every dollar earned by a man.
What is Family Income Deficit in Roscommon County?
Family Income Deficit in Roscommon County is $10,863.
Families that are below poverty line in Roscommon County earn $10,863 less on average than the poverty threshold level.
What is Inequality or Gini Index in Roscommon County?
Inequality or Gini Index in Roscommon County is 0.47.
How Large is the Labor Force in Roscommon County?
There are 8,623 People in the Labor Forcein in Roscommon County.
What is the Percentage of People in the Labor Force in Roscommon County?
41.9% of People are in the Labor Force in Roscommon County.
What is the Unemployment Rate in Roscommon County?
Unemployment Rate in Roscommon County is 5.7%.