Ottawa County, MI
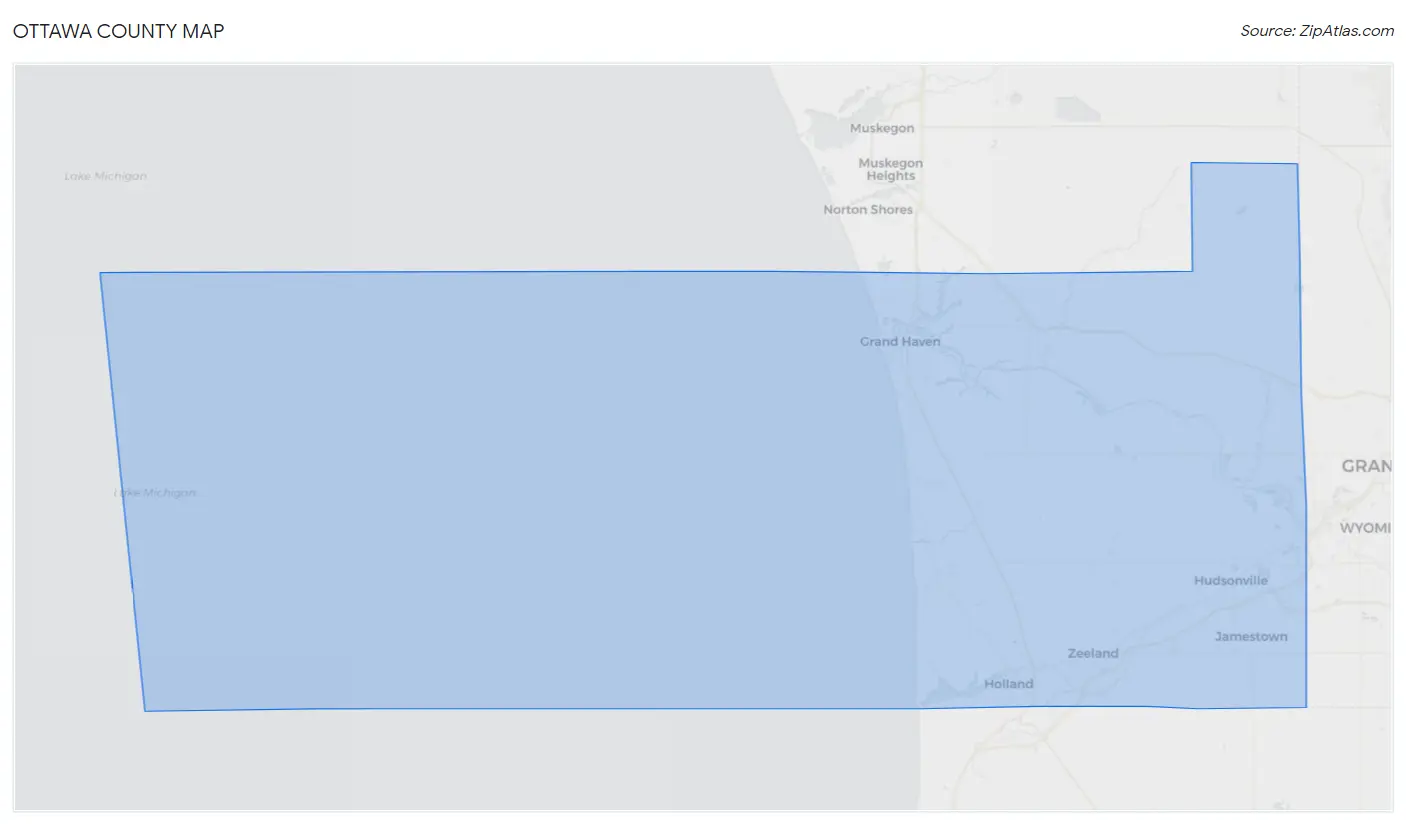
Ottawa County Map
Ottawa County Overview
296,183
TOTAL POPULATION
147,228
MALE POPULATION
148,955
FEMALE POPULATION
98.84
MALES / 100 FEMALES
101.17
FEMALES / 100 MALES
35.8
MEDIAN AGE
3.1
AVG FAMILY SIZE
2.6
AVG HOUSEHOLD SIZE
$39,116
PER CAPITA INCOME
$100,174
AVG FAMILY INCOME
$83,932
AVG HOUSEHOLD INCOME
42.8%
WAGE / INCOME GAP [ % ]
57.2¢/ $1
WAGE / INCOME GAP [ $ ]
$9,126
FAMILY INCOME DEFICIT
0.42
INEQUALITY / GINI INDEX
159,704
LABOR FORCE [ PEOPLE ]
67.8%
PERCENT IN LABOR FORCE
3.8%
UNEMPLOYMENT RATE
Ottawa County Area Codes
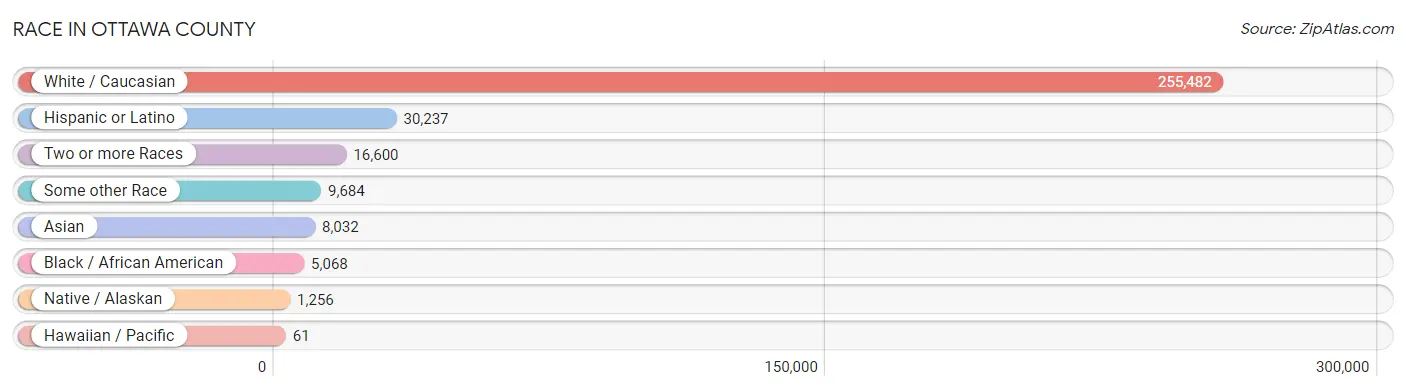
Race in Ottawa County
The most populous races in Ottawa County are White / Caucasian (255,482 | 86.3%), Hispanic or Latino (30,237 | 10.2%), and Two or more Races (16,600 | 5.6%).
| Race | # Population | % Population |
| Asian | 8,032 | 2.7% |
| Black / African American | 5,068 | 1.7% |
| Hawaiian / Pacific | 61 | 0.0% |
| Hispanic or Latino | 30,237 | 10.2% |
| Native / Alaskan | 1,256 | 0.4% |
| White / Caucasian | 255,482 | 86.3% |
| Two or more Races | 16,600 | 5.6% |
| Some other Race | 9,684 | 3.3% |
| Total | 296,183 | 100.0% |
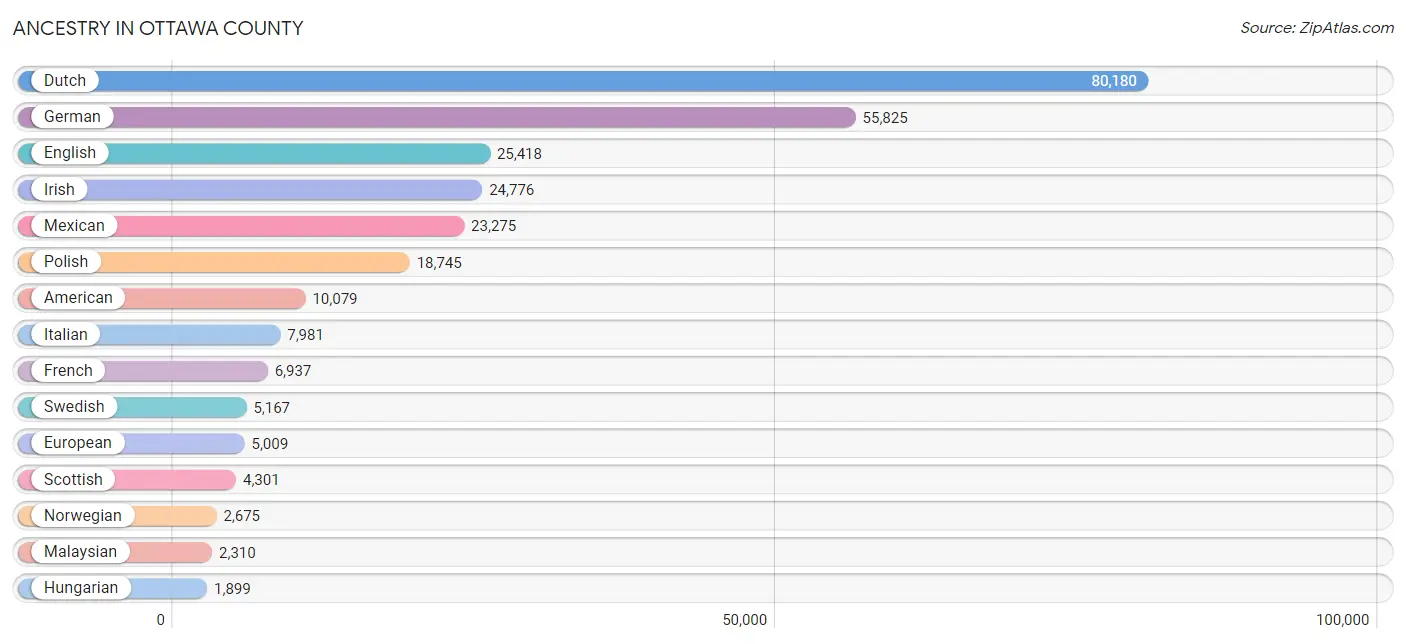
Ancestry in Ottawa County
The most populous ancestries reported in Ottawa County are Dutch (80,180 | 27.1%), German (55,825 | 18.9%), English (25,418 | 8.6%), Irish (24,776 | 8.4%), and Mexican (23,275 | 7.9%), together accounting for 70.7% of all Ottawa County residents.
| Ancestry | # Population | % Population |
| African | 561 | 0.2% |
| Albanian | 28 | 0.0% |
| American | 10,079 | 3.4% |
| Apache | 31 | 0.0% |
| Arab | 809 | 0.3% |
| Argentinean | 19 | 0.0% |
| Armenian | 98 | 0.0% |
| Assyrian / Chaldean / Syriac | 65 | 0.0% |
| Australian | 304 | 0.1% |
| Austrian | 672 | 0.2% |
| Bangladeshi | 7 | 0.0% |
| Belgian | 587 | 0.2% |
| Bhutanese | 263 | 0.1% |
| Blackfeet | 92 | 0.0% |
| Brazilian | 53 | 0.0% |
| British | 1,455 | 0.5% |
| Bulgarian | 128 | 0.0% |
| Burmese | 1,271 | 0.4% |
| Cajun | 17 | 0.0% |
| Cambodian | 11 | 0.0% |
| Canadian | 857 | 0.3% |
| Celtic | 79 | 0.0% |
| Central American | 1,369 | 0.5% |
| Central American Indian | 59 | 0.0% |
| Cherokee | 440 | 0.2% |
| Cheyenne | 3 | 0.0% |
| Chilean | 189 | 0.1% |
| Chippewa | 500 | 0.2% |
| Colombian | 72 | 0.0% |
| Costa Rican | 196 | 0.1% |
| Creek | 21 | 0.0% |
| Croatian | 280 | 0.1% |
| Crow | 9 | 0.0% |
| Cuban | 1,079 | 0.4% |
| Czech | 1,475 | 0.5% |
| Czechoslovakian | 445 | 0.2% |
| Danish | 1,498 | 0.5% |
| Delaware | 3 | 0.0% |
| Dominican | 187 | 0.1% |
| Dutch | 80,180 | 27.1% |
| Eastern European | 518 | 0.2% |
| Ecuadorian | 162 | 0.1% |
| Egyptian | 22 | 0.0% |
| English | 25,418 | 8.6% |
| Ethiopian | 112 | 0.0% |
| European | 5,009 | 1.7% |
| Filipino | 129 | 0.0% |
| Finnish | 1,759 | 0.6% |
| French | 6,937 | 2.3% |
| French American Indian | 36 | 0.0% |
| French Canadian | 1,863 | 0.6% |
| German | 55,825 | 18.9% |
| German Russian | 20 | 0.0% |
| Ghanaian | 18 | 0.0% |
| Greek | 811 | 0.3% |
| Guamanian / Chamorro | 113 | 0.0% |
| Guatemalan | 656 | 0.2% |
| Haitian | 25 | 0.0% |
| Honduran | 237 | 0.1% |
| Hungarian | 1,899 | 0.6% |
| Icelander | 6 | 0.0% |
| Indian (Asian) | 1,559 | 0.5% |
| Iranian | 86 | 0.0% |
| Iraqi | 67 | 0.0% |
| Irish | 24,776 | 8.4% |
| Iroquois | 50 | 0.0% |
| Israeli | 1 | 0.0% |
| Italian | 7,981 | 2.7% |
| Jamaican | 181 | 0.1% |
| Japanese | 1,615 | 0.5% |
| Jordanian | 34 | 0.0% |
| Kenyan | 19 | 0.0% |
| Korean | 1,034 | 0.4% |
| Laotian | 132 | 0.0% |
| Latvian | 168 | 0.1% |
| Lebanese | 403 | 0.1% |
| Lithuanian | 830 | 0.3% |
| Lumbee | 21 | 0.0% |
| Luxembourger | 17 | 0.0% |
| Macedonian | 50 | 0.0% |
| Malaysian | 2,310 | 0.8% |
| Maltese | 63 | 0.0% |
| Mexican | 23,275 | 7.9% |
| Mexican American Indian | 430 | 0.2% |
| Mongolian | 4 | 0.0% |
| Moroccan | 51 | 0.0% |
| Native Hawaiian | 134 | 0.1% |
| Nicaraguan | 132 | 0.0% |
| Nigerian | 120 | 0.0% |
| Northern European | 580 | 0.2% |
| Norwegian | 2,675 | 0.9% |
| Ottawa | 366 | 0.1% |
| Pakistani | 342 | 0.1% |
| Panamanian | 95 | 0.0% |
| Pennsylvania German | 76 | 0.0% |
| Peruvian | 261 | 0.1% |
| Pima | 2 | 0.0% |
| Polish | 18,745 | 6.3% |
| Portuguese | 89 | 0.0% |
| Potawatomi | 140 | 0.1% |
| Pueblo | 12 | 0.0% |
| Puerto Rican | 1,727 | 0.6% |
| Romanian | 213 | 0.1% |
| Russian | 754 | 0.3% |
| Salvadoran | 48 | 0.0% |
| Scandinavian | 955 | 0.3% |
| Scotch-Irish | 1,744 | 0.6% |
| Scottish | 4,301 | 1.5% |
| Serbian | 79 | 0.0% |
| Sioux | 23 | 0.0% |
| Slavic | 36 | 0.0% |
| Slovak | 483 | 0.2% |
| Slovene | 149 | 0.1% |
| South African | 70 | 0.0% |
| South American | 797 | 0.3% |
| South American Indian | 85 | 0.0% |
| Spaniard | 231 | 0.1% |
| Spanish | 332 | 0.1% |
| Sri Lankan | 1,198 | 0.4% |
| Subsaharan African | 931 | 0.3% |
| Swedish | 5,167 | 1.7% |
| Swiss | 432 | 0.2% |
| Syrian | 85 | 0.0% |
| Thai | 1,057 | 0.4% |
| Tsimshian | 11 | 0.0% |
| Turkish | 89 | 0.0% |
| Ugandan | 25 | 0.0% |
| Ukrainian | 513 | 0.2% |
| Venezuelan | 94 | 0.0% |
| Vietnamese | 83 | 0.0% |
| Welsh | 1,044 | 0.4% |
| Yugoslavian | 276 | 0.1% | View All 132 Rows |
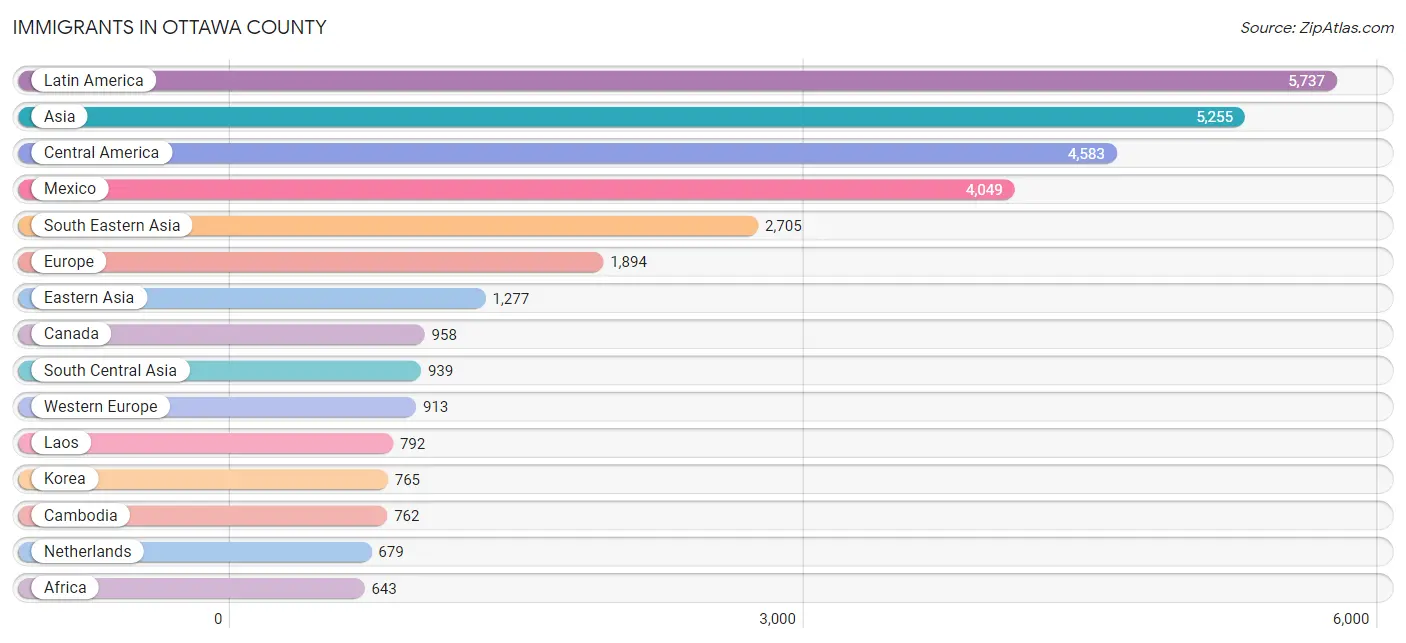
Immigrants in Ottawa County
The most numerous immigrant groups reported in Ottawa County came from Latin America (5,737 | 1.9%), Asia (5,255 | 1.8%), Central America (4,583 | 1.5%), Mexico (4,049 | 1.4%), and South Eastern Asia (2,705 | 0.9%), together accounting for 7.5% of all Ottawa County residents.
| Immigration Origin | # Population | % Population |
| Africa | 643 | 0.2% |
| Albania | 8 | 0.0% |
| Argentina | 90 | 0.0% |
| Asia | 5,255 | 1.8% |
| Australia | 50 | 0.0% |
| Austria | 28 | 0.0% |
| Bangladesh | 78 | 0.0% |
| Belarus | 15 | 0.0% |
| Bosnia and Herzegovina | 113 | 0.0% |
| Brazil | 60 | 0.0% |
| Cambodia | 762 | 0.3% |
| Canada | 958 | 0.3% |
| Caribbean | 531 | 0.2% |
| Central America | 4,583 | 1.5% |
| Chile | 189 | 0.1% |
| China | 471 | 0.2% |
| Colombia | 52 | 0.0% |
| Costa Rica | 13 | 0.0% |
| Croatia | 58 | 0.0% |
| Cuba | 381 | 0.1% |
| Denmark | 15 | 0.0% |
| Dominican Republic | 69 | 0.0% |
| Eastern Africa | 163 | 0.1% |
| Eastern Asia | 1,277 | 0.4% |
| Eastern Europe | 604 | 0.2% |
| Ecuador | 57 | 0.0% |
| El Salvador | 66 | 0.0% |
| England | 190 | 0.1% |
| Ethiopia | 112 | 0.0% |
| Europe | 1,894 | 0.6% |
| France | 36 | 0.0% |
| Germany | 160 | 0.1% |
| Ghana | 50 | 0.0% |
| Greece | 12 | 0.0% |
| Guatemala | 294 | 0.1% |
| Haiti | 25 | 0.0% |
| Honduras | 129 | 0.0% |
| Hong Kong | 17 | 0.0% |
| India | 553 | 0.2% |
| Indonesia | 75 | 0.0% |
| Iran | 107 | 0.0% |
| Iraq | 191 | 0.1% |
| Ireland | 35 | 0.0% |
| Israel | 104 | 0.0% |
| Italy | 10 | 0.0% |
| Jamaica | 56 | 0.0% |
| Japan | 41 | 0.0% |
| Jordan | 25 | 0.0% |
| Korea | 765 | 0.3% |
| Laos | 792 | 0.3% |
| Latin America | 5,737 | 1.9% |
| Latvia | 11 | 0.0% |
| Lebanon | 4 | 0.0% |
| Lithuania | 5 | 0.0% |
| Malaysia | 6 | 0.0% |
| Mexico | 4,049 | 1.4% |
| Morocco | 46 | 0.0% |
| Nepal | 87 | 0.0% |
| Netherlands | 679 | 0.2% |
| Nigeria | 15 | 0.0% |
| Northern Africa | 118 | 0.0% |
| Northern Europe | 355 | 0.1% |
| Oceania | 50 | 0.0% |
| Pakistan | 24 | 0.0% |
| Panama | 27 | 0.0% |
| Peru | 118 | 0.0% |
| Philippines | 209 | 0.1% |
| Poland | 59 | 0.0% |
| Romania | 103 | 0.0% |
| Russia | 76 | 0.0% |
| Scotland | 36 | 0.0% |
| Serbia | 29 | 0.0% |
| South Africa | 25 | 0.0% |
| South America | 623 | 0.2% |
| South Central Asia | 939 | 0.3% |
| South Eastern Asia | 2,705 | 0.9% |
| Southern Europe | 22 | 0.0% |
| Sweden | 11 | 0.0% |
| Switzerland | 10 | 0.0% |
| Taiwan | 60 | 0.0% |
| Thailand | 293 | 0.1% |
| Turkey | 10 | 0.0% |
| Uganda | 25 | 0.0% |
| Ukraine | 127 | 0.0% |
| Venezuela | 57 | 0.0% |
| Vietnam | 558 | 0.2% |
| Western Africa | 65 | 0.0% |
| Western Asia | 334 | 0.1% |
| Western Europe | 913 | 0.3% |
| Zimbabwe | 8 | 0.0% | View All 90 Rows |
Sex and Age in Ottawa County
Sex and Age in Ottawa County
The most populous age groups in Ottawa County are 20 to 24 Years (13,905 | 9.4%) for men and 20 to 24 Years (13,489 | 9.1%) for women.
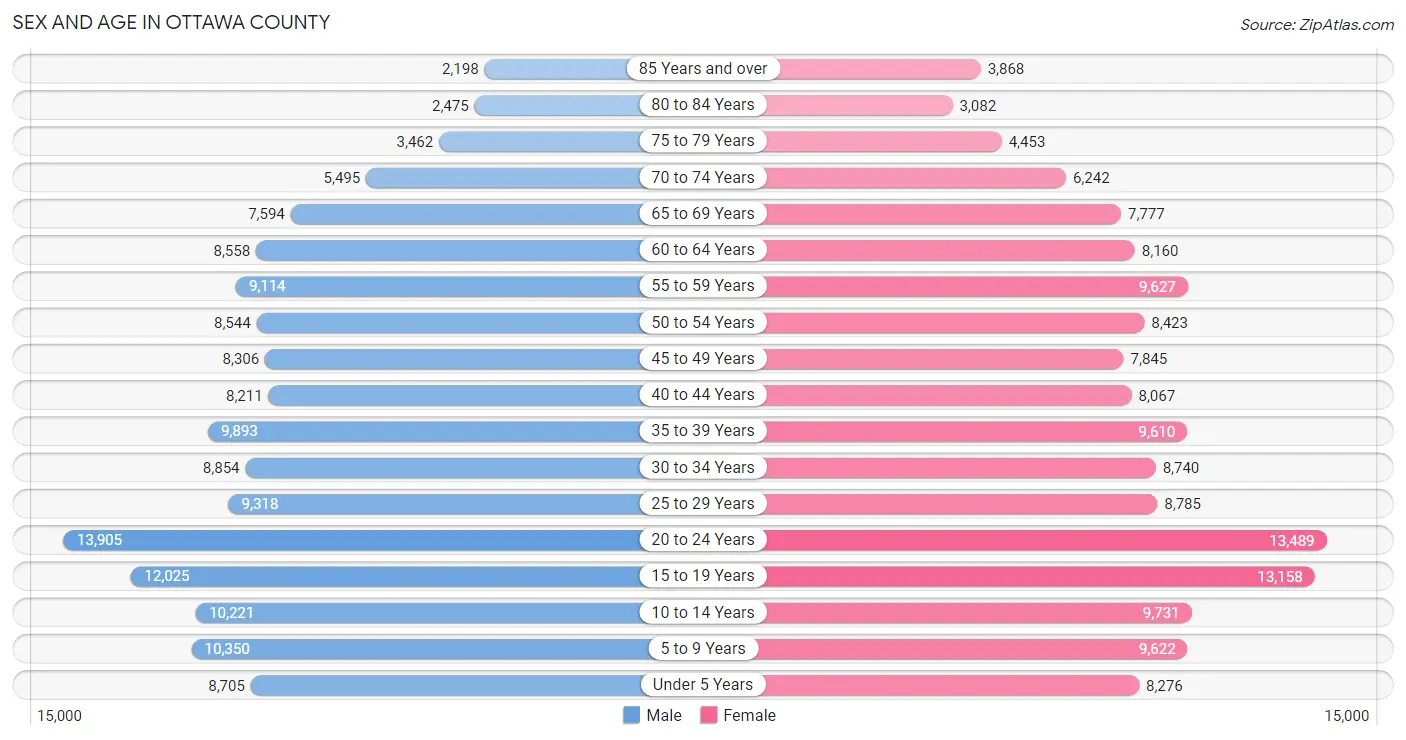
| Age Bracket | Male | Female |
| Under 5 Years | 8,705 (5.9%) | 8,276 (5.6%) |
| 5 to 9 Years | 10,350 (7.0%) | 9,622 (6.5%) |
| 10 to 14 Years | 10,221 (6.9%) | 9,731 (6.5%) |
| 15 to 19 Years | 12,025 (8.2%) | 13,158 (8.8%) |
| 20 to 24 Years | 13,905 (9.4%) | 13,489 (9.1%) |
| 25 to 29 Years | 9,318 (6.3%) | 8,785 (5.9%) |
| 30 to 34 Years | 8,854 (6.0%) | 8,740 (5.9%) |
| 35 to 39 Years | 9,893 (6.7%) | 9,610 (6.5%) |
| 40 to 44 Years | 8,211 (5.6%) | 8,067 (5.4%) |
| 45 to 49 Years | 8,306 (5.6%) | 7,845 (5.3%) |
| 50 to 54 Years | 8,544 (5.8%) | 8,423 (5.7%) |
| 55 to 59 Years | 9,114 (6.2%) | 9,627 (6.5%) |
| 60 to 64 Years | 8,558 (5.8%) | 8,160 (5.5%) |
| 65 to 69 Years | 7,594 (5.2%) | 7,777 (5.2%) |
| 70 to 74 Years | 5,495 (3.7%) | 6,242 (4.2%) |
| 75 to 79 Years | 3,462 (2.4%) | 4,453 (3.0%) |
| 80 to 84 Years | 2,475 (1.7%) | 3,082 (2.1%) |
| 85 Years and over | 2,198 (1.5%) | 3,868 (2.6%) |
| Total | 147,228 (100.0%) | 148,955 (100.0%) |
Families and Households in Ottawa County
Median Family Size in Ottawa County
The median family size in Ottawa County is 3.10 persons per family, with married-couple families (64,356 | 83.7%) accounting for the largest median family size of 3.15 persons per family. On the other hand, single male/father families (4,619 | 6.0%) represent the smallest median family size with 2.72 persons per family.
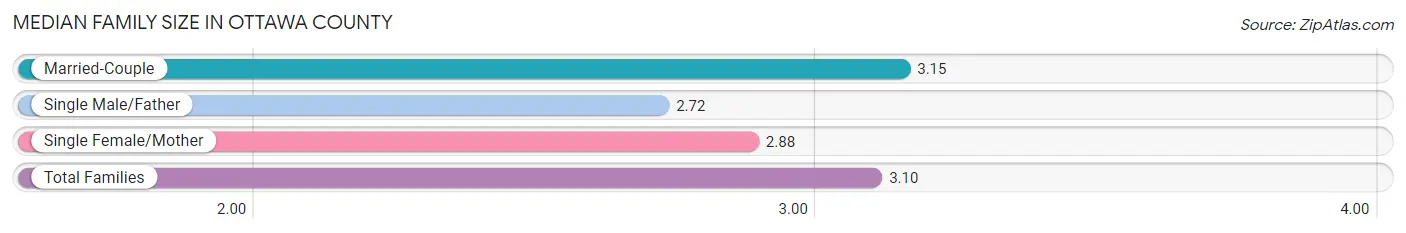
| Family Type | # Families | Family Size |
| Married-Couple | 64,356 (83.7%) | 3.15 |
| Single Male/Father | 4,619 (6.0%) | 2.72 |
| Single Female/Mother | 7,922 (10.3%) | 2.88 |
| Total Families | 76,897 (100.0%) | 3.10 |
Median Household Size in Ottawa County
The median household size in Ottawa County is 2.64 persons per household, with single male/father households (4,619 | 4.3%) accounting for the largest median household size of 3.23 persons per household. non-family households (31,465 | 29.0%) represent the smallest median household size with 1.37 persons per household.
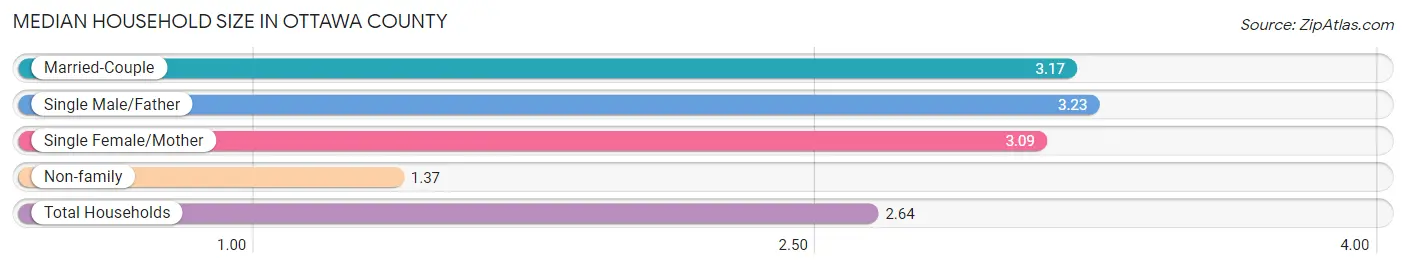
| Household Type | # Households | Household Size |
| Married-Couple | 64,356 (59.4%) | 3.17 |
| Single Male/Father | 4,619 (4.3%) | 3.23 |
| Single Female/Mother | 7,922 (7.3%) | 3.09 |
| Non-family | 31,465 (29.0%) | 1.37 |
| Total Households | 108,362 (100.0%) | 2.64 |
Household Size by Marriage Status in Ottawa County
Out of a total of 108,362 households in Ottawa County, 76,897 (71.0%) are family households, while 31,465 (29.0%) are nonfamily households. The most numerous type of family households are 2-person households, comprising 33,302, and the most common type of nonfamily households are 1-person households, comprising 23,687.
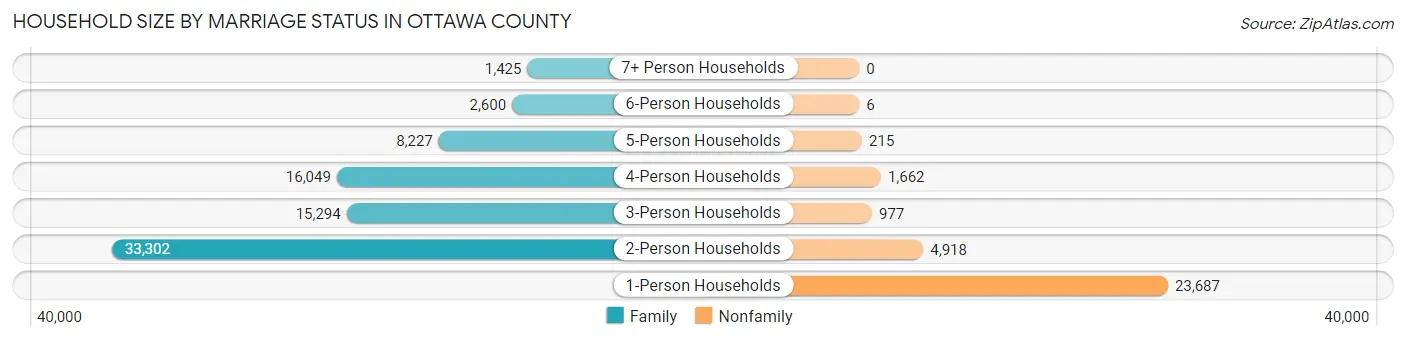
| Household Size | Family Households | Nonfamily Households |
| 1-Person Households | - | 23,687 (21.9%) |
| 2-Person Households | 33,302 (30.7%) | 4,918 (4.5%) |
| 3-Person Households | 15,294 (14.1%) | 977 (0.9%) |
| 4-Person Households | 16,049 (14.8%) | 1,662 (1.5%) |
| 5-Person Households | 8,227 (7.6%) | 215 (0.2%) |
| 6-Person Households | 2,600 (2.4%) | 6 (0.0%) |
| 7+ Person Households | 1,425 (1.3%) | 0 (0.0%) |
| Total | 76,897 (71.0%) | 31,465 (29.0%) |
Female Fertility in Ottawa County
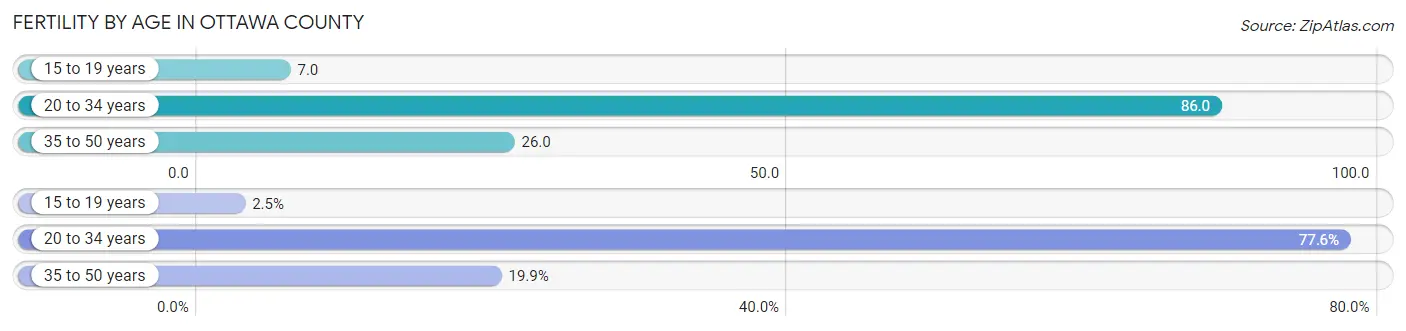
Fertility by Age in Ottawa County
Average fertility rate in Ottawa County is 49.0 births per 1,000 women. Women in the age bracket of 20 to 34 years have the highest fertility rate with 86.0 births per 1,000 women. Women in the age bracket of 20 to 34 years acount for 77.6% of all women with births.
| Age Bracket | Women with Births | Births / 1,000 Women |
| 15 to 19 years | 87 (2.5%) | 7.0 |
| 20 to 34 years | 2,675 (77.6%) | 86.0 |
| 35 to 50 years | 687 (19.9%) | 26.0 |
| Total | 3,449 (100.0%) | 49.0 |
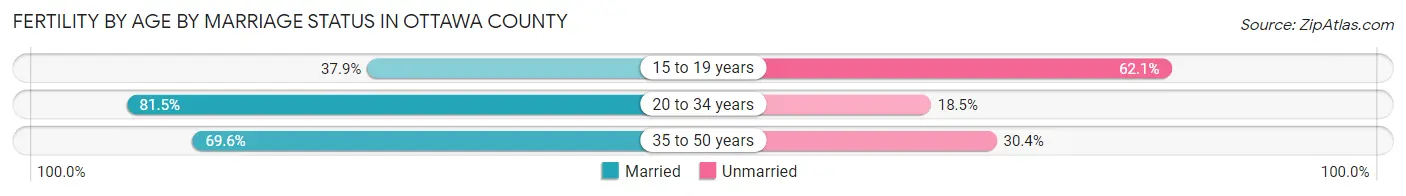
Fertility by Age by Marriage Status in Ottawa County
78.0% of women with births (3,449) in Ottawa County are married. The highest percentage of unmarried women with births falls into 15 to 19 years age bracket with 62.1% of them unmarried at the time of birth, while the lowest percentage of unmarried women with births belong to 20 to 34 years age bracket with 18.5% of them unmarried.
| Age Bracket | Married | Unmarried |
| 15 to 19 years | 33 (37.9%) | 54 (62.1%) |
| 20 to 34 years | 2,180 (81.5%) | 495 (18.5%) |
| 35 to 50 years | 478 (69.6%) | 209 (30.4%) |
| Total | 2,690 (78.0%) | 759 (22.0%) |
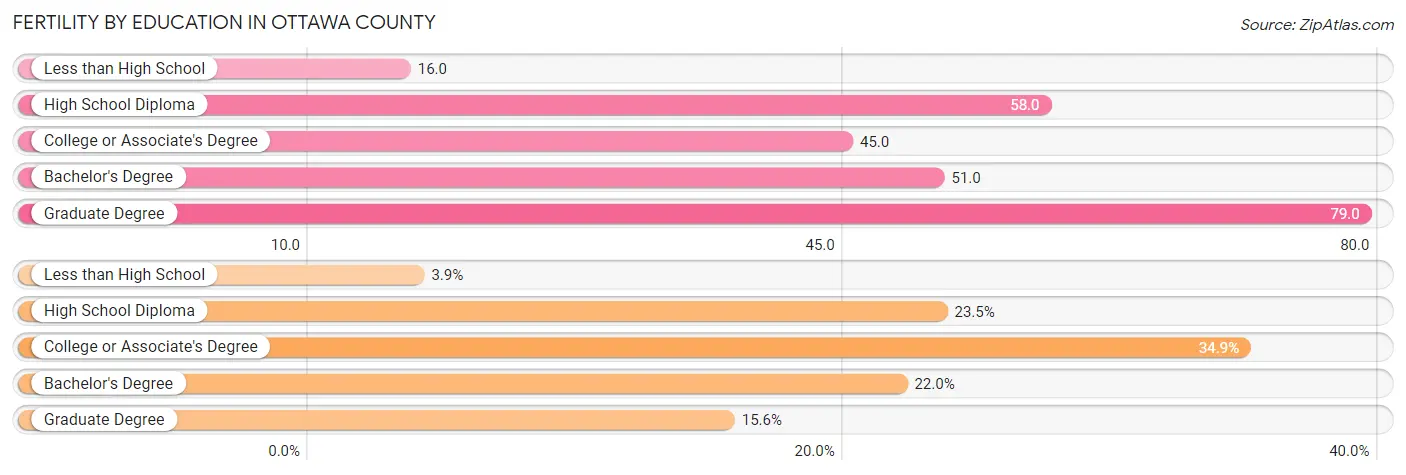
Fertility by Education in Ottawa County
Average fertility rate in Ottawa County is 49.0 births per 1,000 women. Women with the education attainment of graduate degree have the highest fertility rate of 79.0 births per 1,000 women, while women with the education attainment of less than high school have the lowest fertility at 16.0 births per 1,000 women. Women with the education attainment of college or associate's degree represent 34.9% of all women with births.
| Educational Attainment | Women with Births | Births / 1,000 Women |
| Less than High School | 136 (3.9%) | 16.0 |
| High School Diploma | 812 (23.5%) | 58.0 |
| College or Associate's Degree | 1,204 (34.9%) | 45.0 |
| Bachelor's Degree | 760 (22.0%) | 51.0 |
| Graduate Degree | 537 (15.6%) | 79.0 |
| Total | 3,449 (100.0%) | 49.0 |
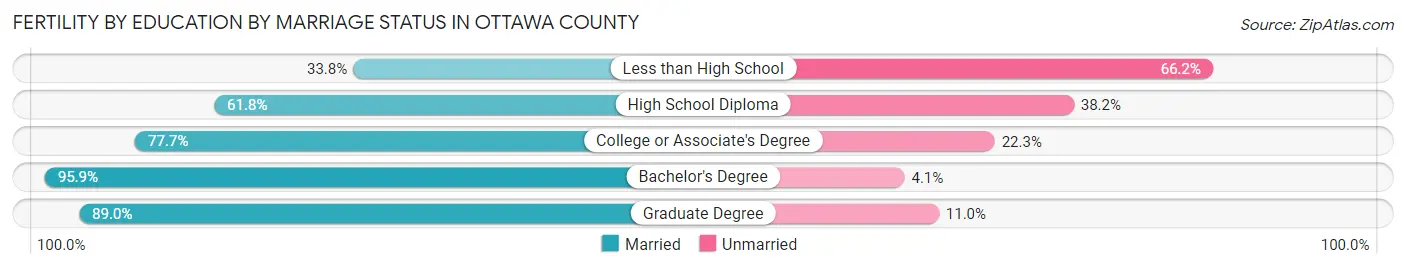
Fertility by Education by Marriage Status in Ottawa County
22.0% of women with births in Ottawa County are unmarried. Women with the educational attainment of bachelor's degree are most likely to be married with 95.9% of them married at childbirth, while women with the educational attainment of less than high school are least likely to be married with 66.2% of them unmarried at childbirth.
| Educational Attainment | Married | Unmarried |
| Less than High School | 46 (33.8%) | 90 (66.2%) |
| High School Diploma | 502 (61.8%) | 310 (38.2%) |
| College or Associate's Degree | 936 (77.7%) | 268 (22.3%) |
| Bachelor's Degree | 729 (95.9%) | 31 (4.1%) |
| Graduate Degree | 478 (89.0%) | 59 (11.0%) |
| Total | 2,690 (78.0%) | 759 (22.0%) |
Income in Ottawa County
Income Overview in Ottawa County
Per Capita Income in Ottawa County is $39,116, while median incomes of families and households are $100,174 and $83,932 respectively.
| Characteristic | Number | Measure |
| Per Capita Income | 296,183 | $39,116 |
| Median Family Income | 76,897 | $100,174 |
| Mean Family Income | 76,897 | $123,281 |
| Median Household Income | 108,362 | $83,932 |
| Mean Household Income | 108,362 | $106,239 |
| Income Deficit | 76,897 | $9,126 |
| Wage / Income Gap (%) | 296,183 | 42.77% |
| Wage / Income Gap ($) | 296,183 | 57.23¢ per $1 |
| Gini / Inequality Index | 296,183 | 0.42 |
Earnings by Sex in Ottawa County
Average Earnings in Ottawa County are $39,273, $51,376 for men and $29,400 for women, a difference of 42.8%.
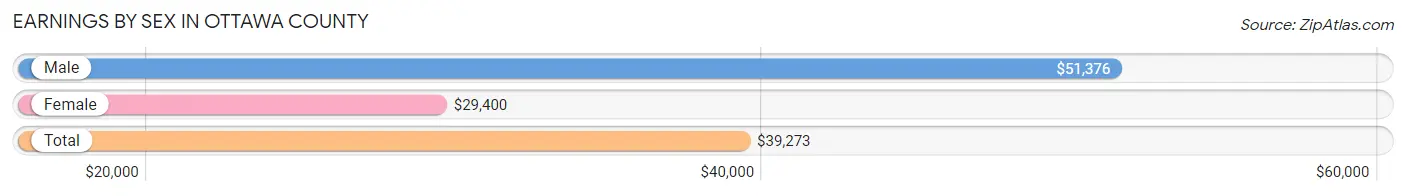
| Sex | Number | Average Earnings |
| Male | 91,540 (53.5%) | $51,376 |
| Female | 79,501 (46.5%) | $29,400 |
| Total | 171,041 (100.0%) | $39,273 |
Earnings by Sex by Income Bracket in Ottawa County
The most common earnings brackets in Ottawa County are $100,000+ for men (17,204 | 18.8%) and $2,499 or less for women (6,488 | 8.2%).
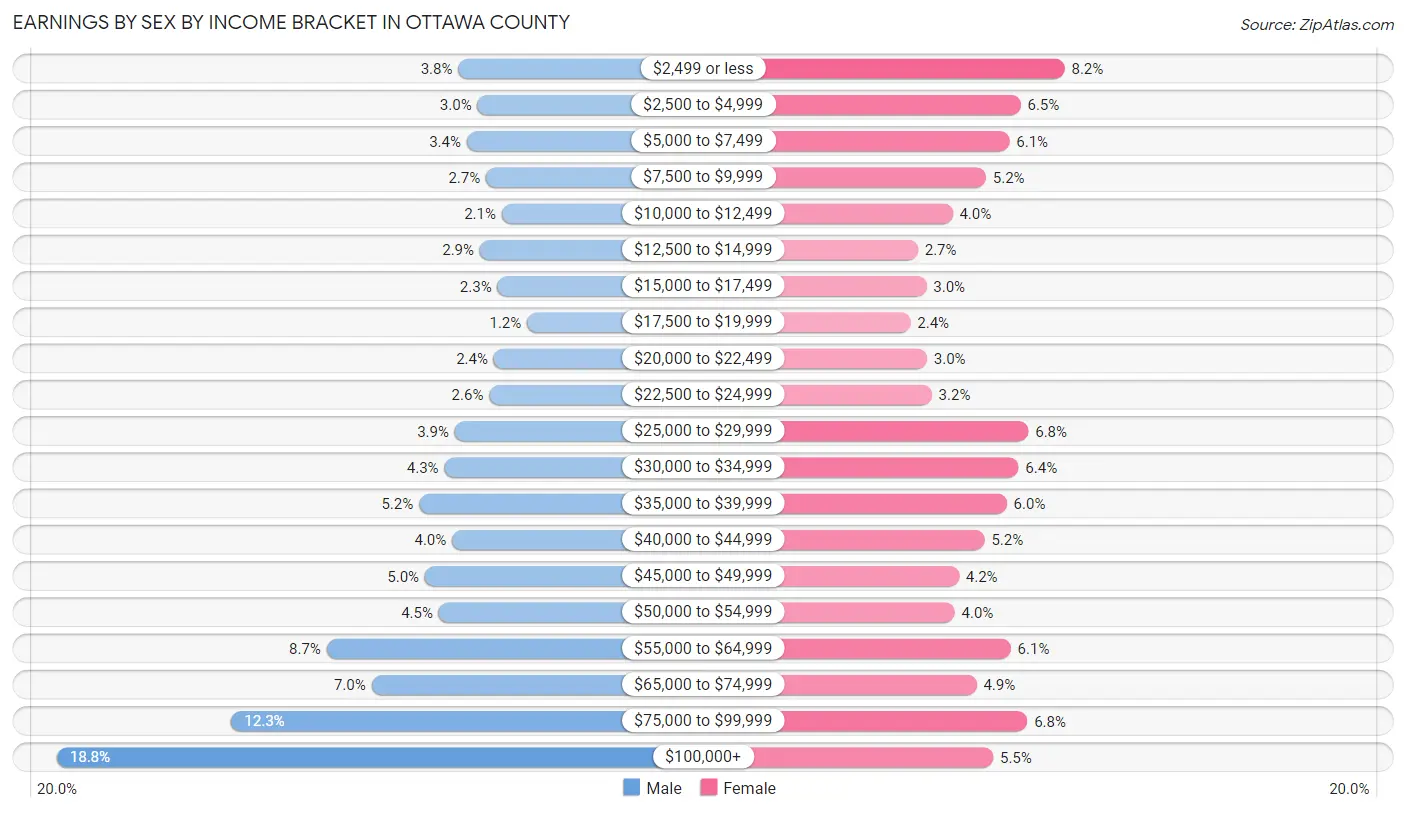
| Income | Male | Female |
| $2,499 or less | 3,429 (3.7%) | 6,488 (8.2%) |
| $2,500 to $4,999 | 2,777 (3.0%) | 5,178 (6.5%) |
| $5,000 to $7,499 | 3,141 (3.4%) | 4,839 (6.1%) |
| $7,500 to $9,999 | 2,485 (2.7%) | 4,140 (5.2%) |
| $10,000 to $12,499 | 1,937 (2.1%) | 3,150 (4.0%) |
| $12,500 to $14,999 | 2,694 (2.9%) | 2,118 (2.7%) |
| $15,000 to $17,499 | 2,091 (2.3%) | 2,368 (3.0%) |
| $17,500 to $19,999 | 1,069 (1.2%) | 1,895 (2.4%) |
| $20,000 to $22,499 | 2,211 (2.4%) | 2,382 (3.0%) |
| $22,500 to $24,999 | 2,374 (2.6%) | 2,525 (3.2%) |
| $25,000 to $29,999 | 3,553 (3.9%) | 5,405 (6.8%) |
| $30,000 to $34,999 | 3,907 (4.3%) | 5,115 (6.4%) |
| $35,000 to $39,999 | 4,777 (5.2%) | 4,765 (6.0%) |
| $40,000 to $44,999 | 3,643 (4.0%) | 4,103 (5.2%) |
| $45,000 to $49,999 | 4,578 (5.0%) | 3,339 (4.2%) |
| $50,000 to $54,999 | 4,103 (4.5%) | 3,211 (4.0%) |
| $55,000 to $64,999 | 7,947 (8.7%) | 4,884 (6.1%) |
| $65,000 to $74,999 | 6,405 (7.0%) | 3,860 (4.9%) |
| $75,000 to $99,999 | 11,215 (12.2%) | 5,378 (6.8%) |
| $100,000+ | 17,204 (18.8%) | 4,358 (5.5%) |
| Total | 91,540 (100.0%) | 79,501 (100.0%) |
Earnings by Sex by Educational Attainment in Ottawa County
Average earnings in Ottawa County are $61,840 for men and $37,855 for women, a difference of 38.8%. Men with an educational attainment of graduate degree enjoy the highest average annual earnings of $103,529, while those with less than high school education earn the least with $41,588. Women with an educational attainment of graduate degree earn the most with the average annual earnings of $67,536, while those with less than high school education have the smallest earnings of $25,747.
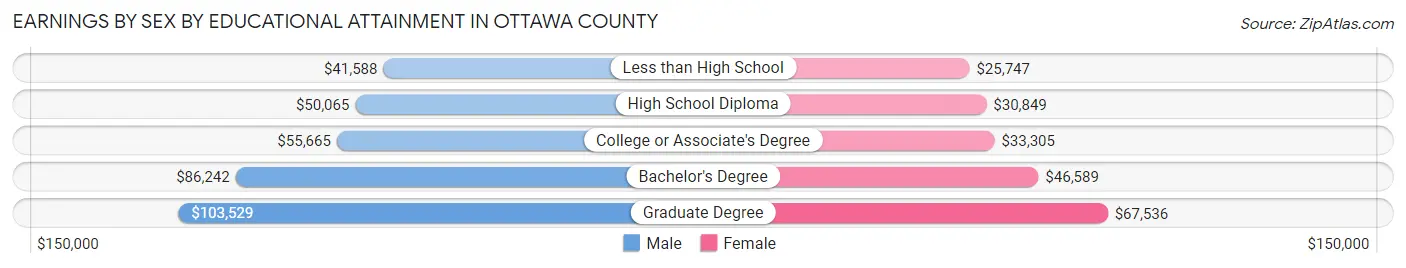
| Educational Attainment | Male Income | Female Income |
| Less than High School | $41,588 | $25,747 |
| High School Diploma | $50,065 | $30,849 |
| College or Associate's Degree | $55,665 | $33,305 |
| Bachelor's Degree | $86,242 | $46,589 |
| Graduate Degree | $103,529 | $67,536 |
| Total | $61,840 | $37,855 |
Family Income in Ottawa County
Family Income Brackets in Ottawa County
According to the Ottawa County family income data, there are 18,763 families falling into the $100,000 to $149,999 income range, which is the most common income bracket and makes up 24.4% of all families. Conversely, the $10,000 to $14,999 income bracket is the least frequent group with only 538 families (0.7%) belonging to this category.
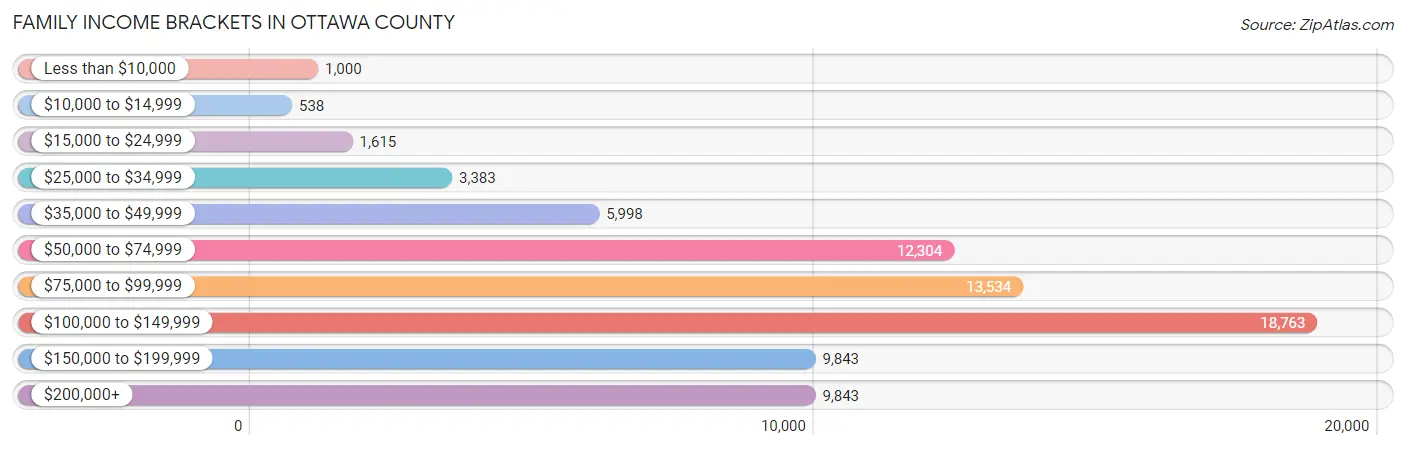
| Income Bracket | # Families | % Families |
| Less than $10,000 | 1,000 | 1.3% |
| $10,000 to $14,999 | 538 | 0.7% |
| $15,000 to $24,999 | 1,615 | 2.1% |
| $25,000 to $34,999 | 3,383 | 4.4% |
| $35,000 to $49,999 | 5,998 | 7.8% |
| $50,000 to $74,999 | 12,304 | 16.0% |
| $75,000 to $99,999 | 13,534 | 17.6% |
| $100,000 to $149,999 | 18,763 | 24.4% |
| $150,000 to $199,999 | 9,843 | 12.8% |
| $200,000+ | 9,843 | 12.8% |
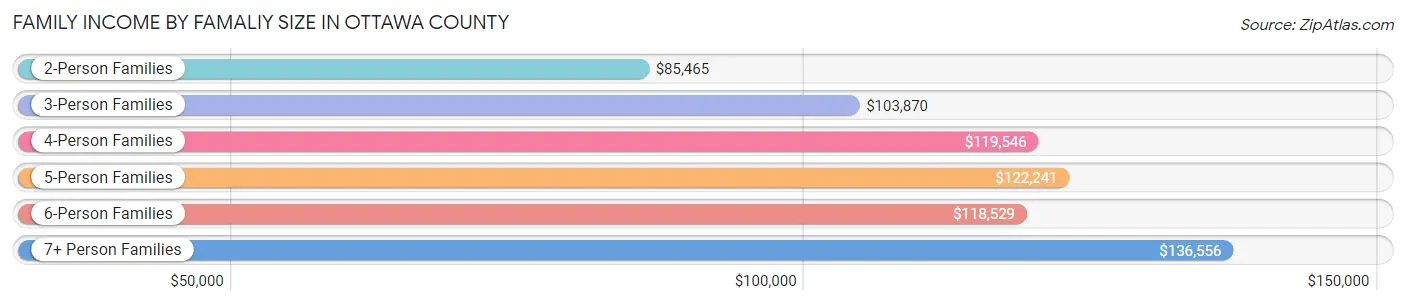
Family Income by Famaliy Size in Ottawa County
7+ person families (1,212 | 1.6%) account for the highest median family income in Ottawa County with $136,556 per family, while 2-person families (35,216 | 45.8%) have the highest median income of $42,732 per family member.
| Income Bracket | # Families | Median Income |
| 2-Person Families | 35,216 (45.8%) | $85,465 |
| 3-Person Families | 15,364 (20.0%) | $103,870 |
| 4-Person Families | 15,046 (19.6%) | $119,546 |
| 5-Person Families | 7,661 (10.0%) | $122,241 |
| 6-Person Families | 2,398 (3.1%) | $118,529 |
| 7+ Person Families | 1,212 (1.6%) | $136,556 |
| Total | 76,897 (100.0%) | $100,174 |
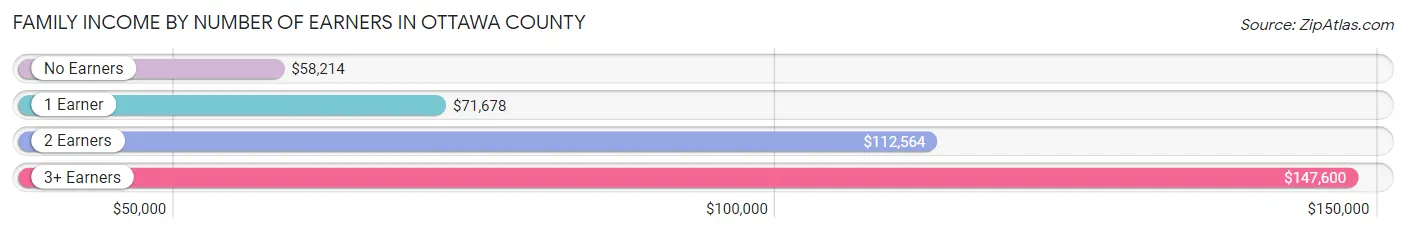
Family Income by Number of Earners in Ottawa County
The median family income in Ottawa County is $100,174, with families comprising 3+ earners (12,523) having the highest median family income of $147,600, while families with no earners (10,567) have the lowest median family income of $58,214, accounting for 16.3% and 13.7% of families, respectively.
| Number of Earners | # Families | Median Income |
| No Earners | 10,567 (13.7%) | $58,214 |
| 1 Earner | 18,838 (24.5%) | $71,678 |
| 2 Earners | 34,969 (45.5%) | $112,564 |
| 3+ Earners | 12,523 (16.3%) | $147,600 |
| Total | 76,897 (100.0%) | $100,174 |
Household Income in Ottawa County
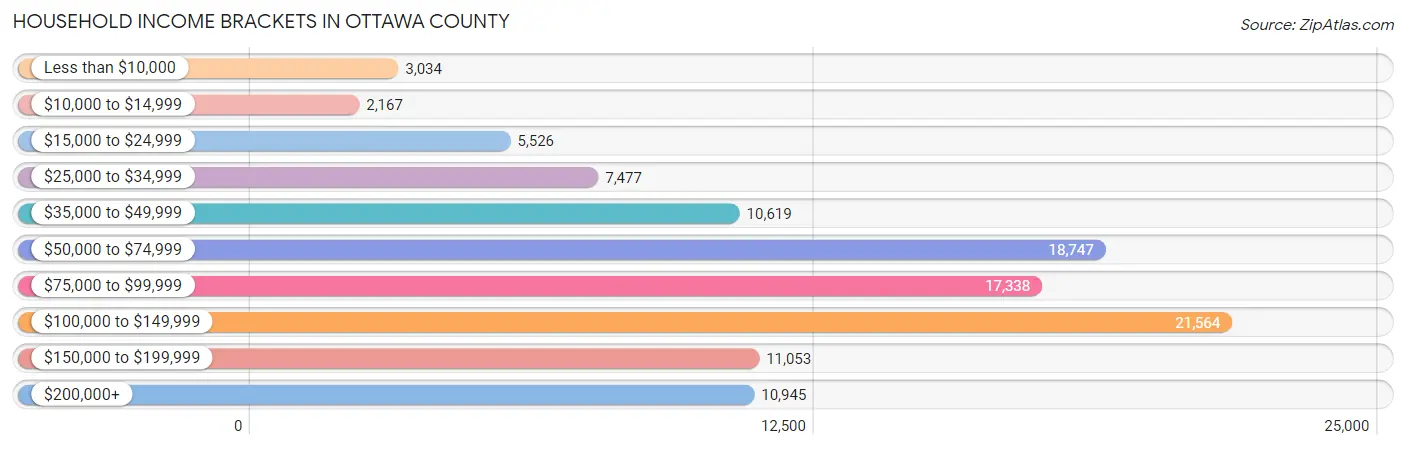
Household Income Brackets in Ottawa County
With 21,564 households falling in the category, the $100,000 to $149,999 income range is the most frequent in Ottawa County, accounting for 19.9% of all households. In contrast, only 2,167 households (2.0%) fall into the $10,000 to $14,999 income bracket, making it the least populous group.
| Income Bracket | # Households | % Households |
| Less than $10,000 | 3,034 | 2.8% |
| $10,000 to $14,999 | 2,167 | 2.0% |
| $15,000 to $24,999 | 5,526 | 5.1% |
| $25,000 to $34,999 | 7,477 | 6.9% |
| $35,000 to $49,999 | 10,619 | 9.8% |
| $50,000 to $74,999 | 18,747 | 17.3% |
| $75,000 to $99,999 | 17,338 | 16.0% |
| $100,000 to $149,999 | 21,564 | 19.9% |
| $150,000 to $199,999 | 11,053 | 10.2% |
| $200,000+ | 10,945 | 10.1% |
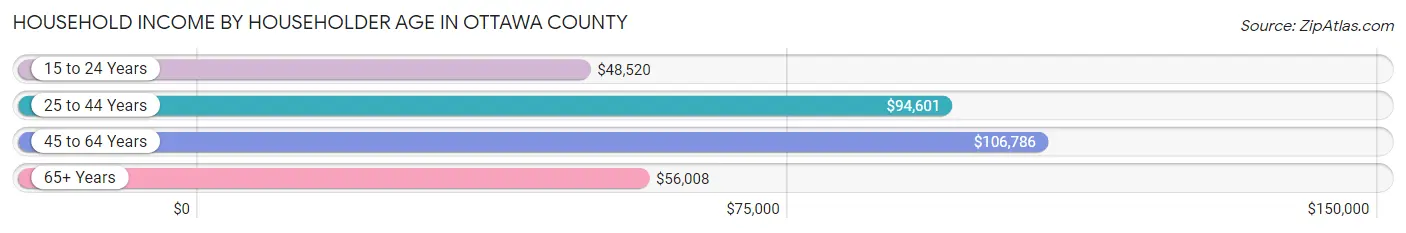
Household Income by Householder Age in Ottawa County
The median household income in Ottawa County is $83,932, with the highest median household income of $106,786 found in the 45 to 64 years age bracket for the primary householder. A total of 38,201 households (35.2%) fall into this category. Meanwhile, the 15 to 24 years age bracket for the primary householder has the lowest median household income of $48,520, with 6,686 households (6.2%) in this group.
| Income Bracket | # Households | Median Income |
| 15 to 24 Years | 6,686 (6.2%) | $48,520 |
| 25 to 44 Years | 34,941 (32.2%) | $94,601 |
| 45 to 64 Years | 38,201 (35.2%) | $106,786 |
| 65+ Years | 28,534 (26.3%) | $56,008 |
| Total | 108,362 (100.0%) | $83,932 |
Poverty in Ottawa County
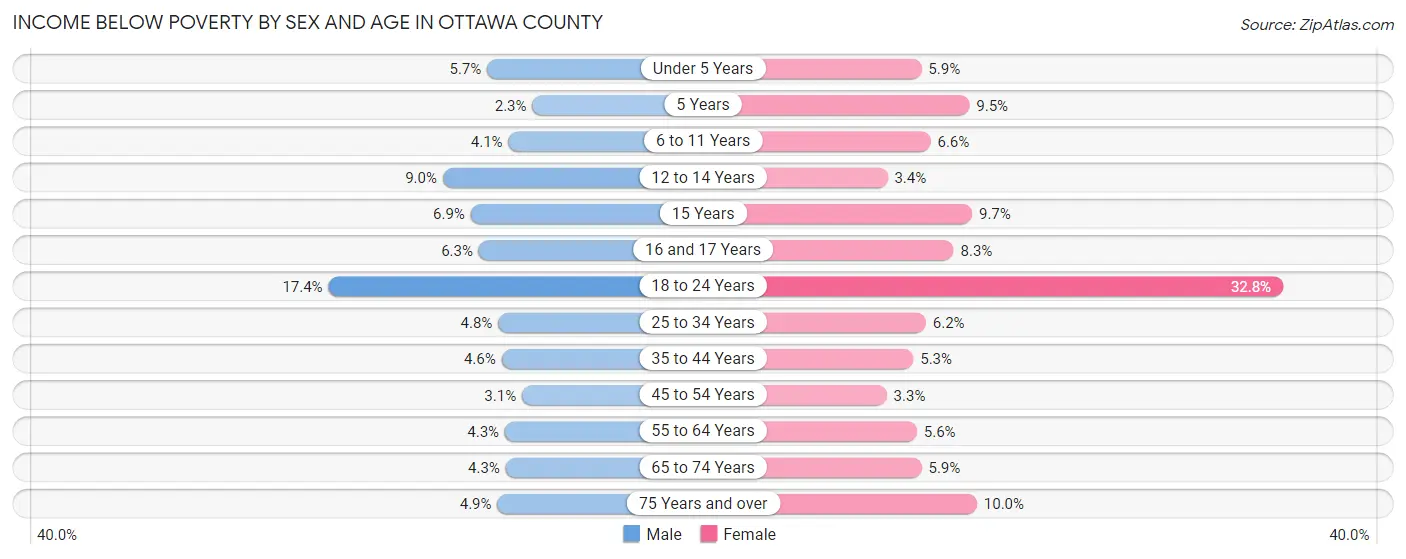
Income Below Poverty by Sex and Age in Ottawa County
With 6.2% poverty level for males and 8.9% for females among the residents of Ottawa County, 18 to 24 year old males and 18 to 24 year old females are the most vulnerable to poverty, with 3,001 males (17.4%) and 5,119 females (32.8%) in their respective age groups living below the poverty level.
| Age Bracket | Male | Female |
| Under 5 Years | 481 (5.7%) | 483 (5.9%) |
| 5 Years | 44 (2.3%) | 140 (9.5%) |
| 6 to 11 Years | 488 (4.1%) | 794 (6.6%) |
| 12 to 14 Years | 574 (8.9%) | 188 (3.4%) |
| 15 Years | 125 (6.9%) | 184 (9.7%) |
| 16 and 17 Years | 281 (6.3%) | 339 (8.3%) |
| 18 to 24 Years | 3,001 (17.4%) | 5,119 (32.8%) |
| 25 to 34 Years | 874 (4.8%) | 1,092 (6.2%) |
| 35 to 44 Years | 829 (4.6%) | 937 (5.3%) |
| 45 to 54 Years | 514 (3.1%) | 539 (3.3%) |
| 55 to 64 Years | 764 (4.3%) | 986 (5.6%) |
| 65 to 74 Years | 557 (4.3%) | 824 (5.9%) |
| 75 Years and over | 387 (4.9%) | 1,095 (10.0%) |
| Total | 8,919 (6.2%) | 12,720 (8.9%) |
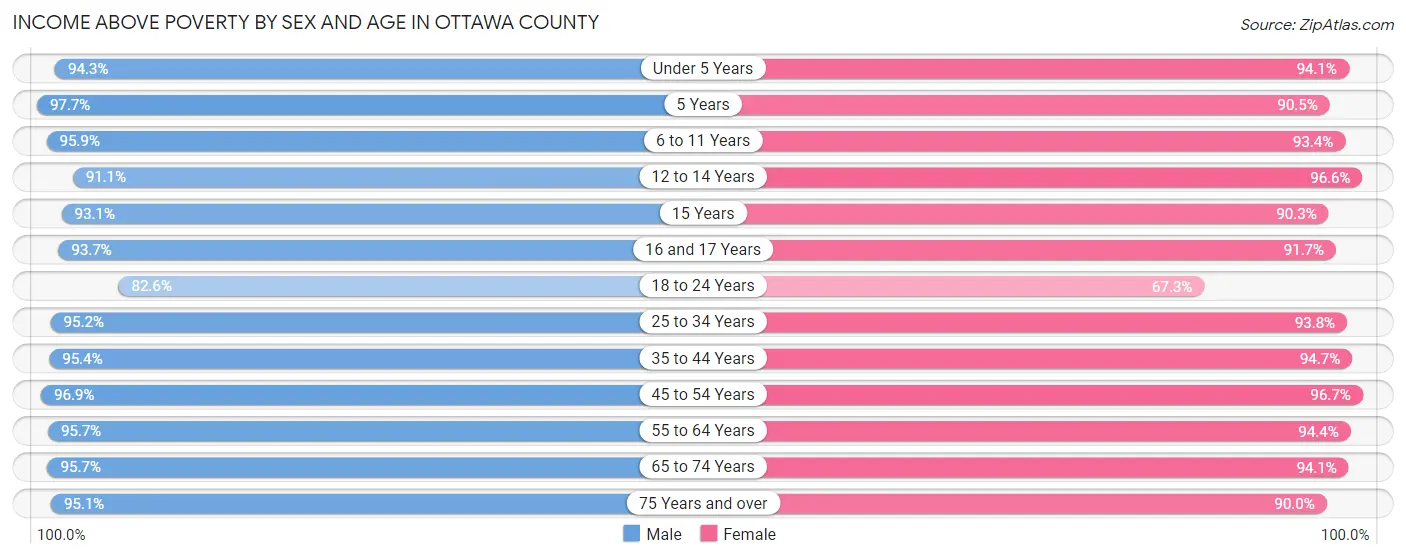
Income Above Poverty by Sex and Age in Ottawa County
According to the poverty statistics in Ottawa County, males aged 5 years and females aged 45 to 54 years are the age groups that are most secure financially, with 97.7% of males and 96.7% of females in these age groups living above the poverty line.
| Age Bracket | Male | Female |
| Under 5 Years | 8,011 (94.3%) | 7,687 (94.1%) |
| 5 Years | 1,865 (97.7%) | 1,338 (90.5%) |
| 6 to 11 Years | 11,462 (95.9%) | 11,246 (93.4%) |
| 12 to 14 Years | 5,841 (91.0%) | 5,350 (96.6%) |
| 15 Years | 1,692 (93.1%) | 1,718 (90.3%) |
| 16 and 17 Years | 4,195 (93.7%) | 3,746 (91.7%) |
| 18 to 24 Years | 14,207 (82.6%) | 10,510 (67.2%) |
| 25 to 34 Years | 17,201 (95.2%) | 16,406 (93.8%) |
| 35 to 44 Years | 17,248 (95.4%) | 16,721 (94.7%) |
| 45 to 54 Years | 16,230 (96.9%) | 15,660 (96.7%) |
| 55 to 64 Years | 16,836 (95.7%) | 16,701 (94.4%) |
| 65 to 74 Years | 12,454 (95.7%) | 13,096 (94.1%) |
| 75 Years and over | 7,511 (95.1%) | 9,827 (90.0%) |
| Total | 134,753 (93.8%) | 130,006 (91.1%) |
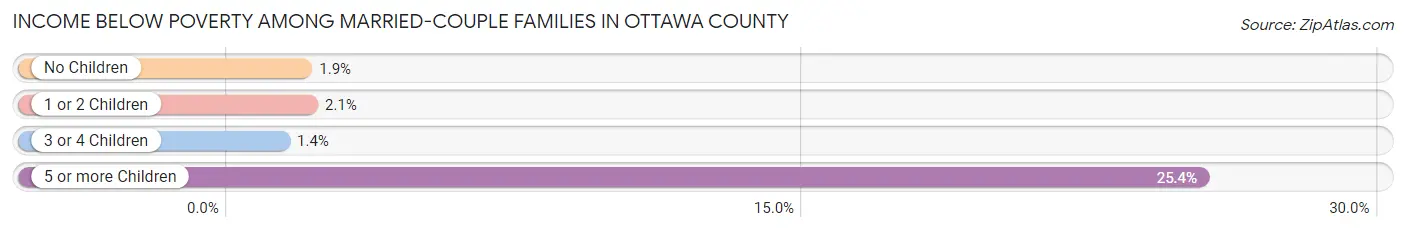
Income Below Poverty Among Married-Couple Families in Ottawa County
The poverty statistics for married-couple families in Ottawa County show that 2.1% or 1,358 of the total 64,356 families live below the poverty line. Families with 5 or more children have the highest poverty rate of 25.4%, comprising of 127 families. On the other hand, families with 3 or 4 children have the lowest poverty rate of 1.4%, which includes 88 families.
| Children | Above Poverty | Below Poverty |
| No Children | 36,169 (98.1%) | 714 (1.9%) |
| 1 or 2 Children | 20,054 (97.9%) | 429 (2.1%) |
| 3 or 4 Children | 6,401 (98.6%) | 88 (1.4%) |
| 5 or more Children | 374 (74.7%) | 127 (25.4%) |
| Total | 62,998 (97.9%) | 1,358 (2.1%) |
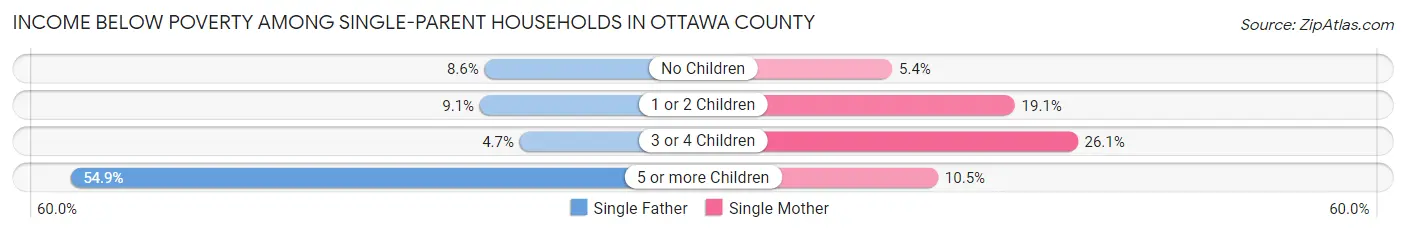
Income Below Poverty Among Single-Parent Households in Ottawa County
According to the poverty data in Ottawa County, 8.9% or 410 single-father households and 14.9% or 1,184 single-mother households are living below the poverty line. Among single-father households, those with 5 or more children have the highest poverty rate, with 28 households (54.9%) experiencing poverty. Likewise, among single-mother households, those with 3 or 4 children have the highest poverty rate, with 264 households (26.1%) falling below the poverty line.
| Children | Single Father | Single Mother |
| No Children | 173 (8.6%) | 157 (5.4%) |
| 1 or 2 Children | 184 (9.1%) | 759 (19.1%) |
| 3 or 4 Children | 25 (4.7%) | 264 (26.1%) |
| 5 or more Children | 28 (54.9%) | 4 (10.5%) |
| Total | 410 (8.9%) | 1,184 (14.9%) |
Income Below Poverty Among Married-Couple vs Single-Parent Households in Ottawa County
The poverty data for Ottawa County shows that 1,358 of the married-couple family households (2.1%) and 1,594 of the single-parent households (12.7%) are living below the poverty level. Within the married-couple family households, those with 5 or more children have the highest poverty rate, with 127 households (25.4%) falling below the poverty line. Among the single-parent households, those with 5 or more children have the highest poverty rate, with 32 household (36.0%) living below poverty.
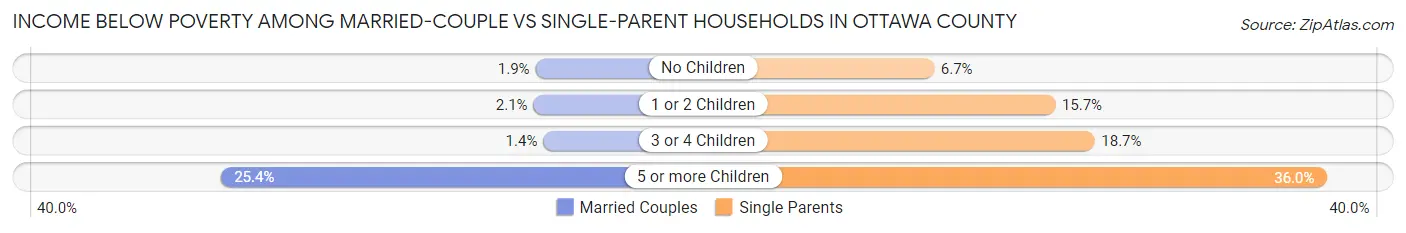
| Children | Married-Couple Families | Single-Parent Households |
| No Children | 714 (1.9%) | 330 (6.7%) |
| 1 or 2 Children | 429 (2.1%) | 943 (15.7%) |
| 3 or 4 Children | 88 (1.4%) | 289 (18.7%) |
| 5 or more Children | 127 (25.4%) | 32 (36.0%) |
| Total | 1,358 (2.1%) | 1,594 (12.7%) |
Employment Characteristics in Ottawa County
Employment by Class of Employer in Ottawa County
Among the 150,765 employed individuals in Ottawa County, private company employees (108,084 | 71.7%), not-for-profit organizations (17,033 | 11.3%), and local government employees (8,612 | 5.7%) make up the most common classes of employment.
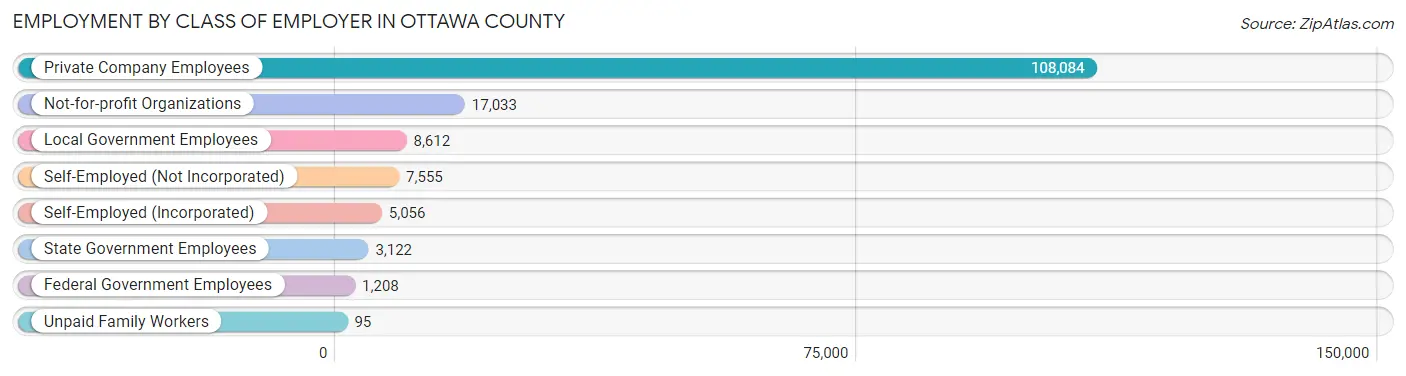
| Employer Class | # Employees | % Employees |
| Private Company Employees | 108,084 | 71.7% |
| Self-Employed (Incorporated) | 5,056 | 3.4% |
| Self-Employed (Not Incorporated) | 7,555 | 5.0% |
| Not-for-profit Organizations | 17,033 | 11.3% |
| Local Government Employees | 8,612 | 5.7% |
| State Government Employees | 3,122 | 2.1% |
| Federal Government Employees | 1,208 | 0.8% |
| Unpaid Family Workers | 95 | 0.1% |
| Total | 150,765 | 100.0% |
Employment Status by Age in Ottawa County
According to the labor force statistics for Ottawa County, out of the total population over 16 years of age (235,551), 67.8% or 159,704 individuals are in the labor force, with 3.8% or 6,069 of them unemployed. The age group with the highest labor force participation rate is 25 to 29 years, with 90.2% or 16,329 individuals in the labor force. Within the labor force, the 16 to 19 years age range has the highest percentage of unemployed individuals, with 13.4% or 1,544 of them being unemployed.
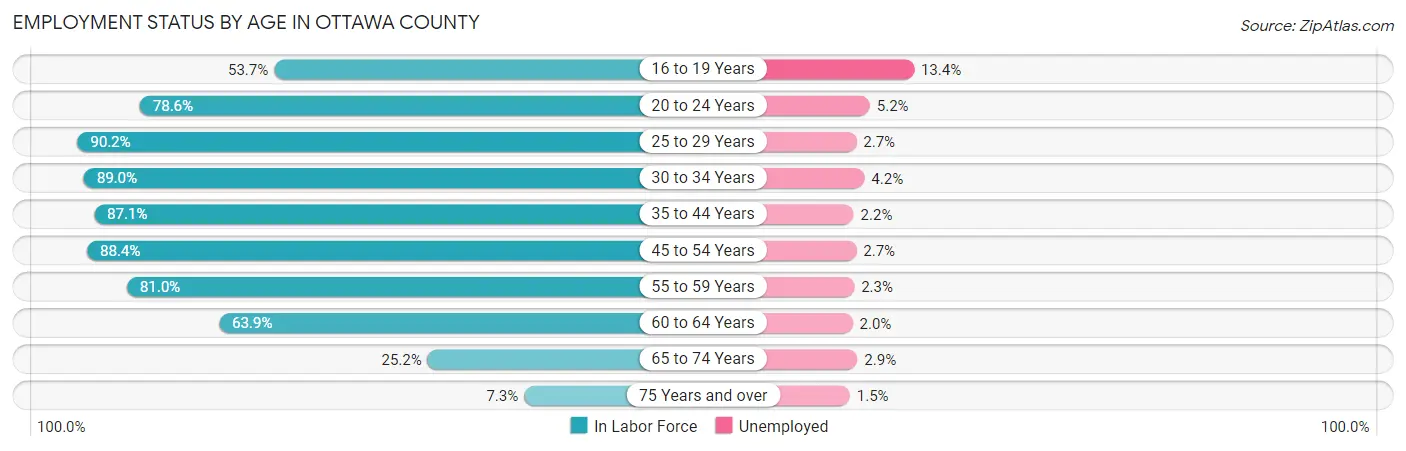
| Age Bracket | In Labor Force | Unemployed |
| 16 to 19 Years | 11,522 (53.7%) | 1,544 (13.4%) |
| 20 to 24 Years | 21,532 (78.6%) | 1,120 (5.2%) |
| 25 to 29 Years | 16,329 (90.2%) | 441 (2.7%) |
| 30 to 34 Years | 15,659 (89.0%) | 658 (4.2%) |
| 35 to 44 Years | 31,165 (87.1%) | 686 (2.2%) |
| 45 to 54 Years | 29,276 (88.4%) | 790 (2.7%) |
| 55 to 59 Years | 15,180 (81.0%) | 349 (2.3%) |
| 60 to 64 Years | 10,683 (63.9%) | 214 (2.0%) |
| 65 to 74 Years | 6,831 (25.2%) | 198 (2.9%) |
| 75 Years and over | 1,426 (7.3%) | 21 (1.5%) |
| Total | 159,704 (67.8%) | 6,069 (3.8%) |
Employment Status by Educational Attainment in Ottawa County
According to labor force statistics for Ottawa County, 84.5% of individuals (118,346) out of the total population between 25 and 64 years of age (140,055) are in the labor force, with 2.6% or 3,077 of them being unemployed. The group with the highest labor force participation rate are those with the educational attainment of bachelor's degree or higher, with 89.4% or 48,678 individuals in the labor force. Within the labor force, individuals with less than high school education have the highest percentage of unemployment, with 3.7% or 187 of them being unemployed.
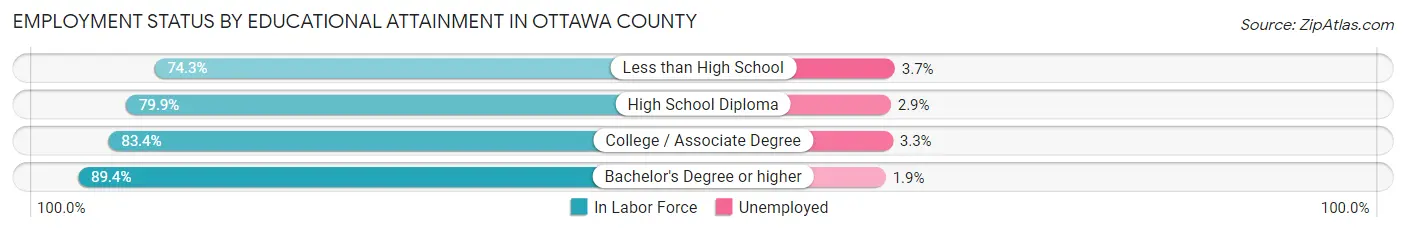
| Educational Attainment | In Labor Force | Unemployed |
| Less than High School | 5,041 (74.3%) | 251 (3.7%) |
| High School Diploma | 27,610 (79.9%) | 1,002 (2.9%) |
| College / Associate Degree | 36,917 (83.4%) | 1,461 (3.3%) |
| Bachelor's Degree or higher | 48,678 (89.4%) | 1,035 (1.9%) |
| Total | 118,346 (84.5%) | 3,641 (2.6%) |
Employment Occupations by Sex in Ottawa County
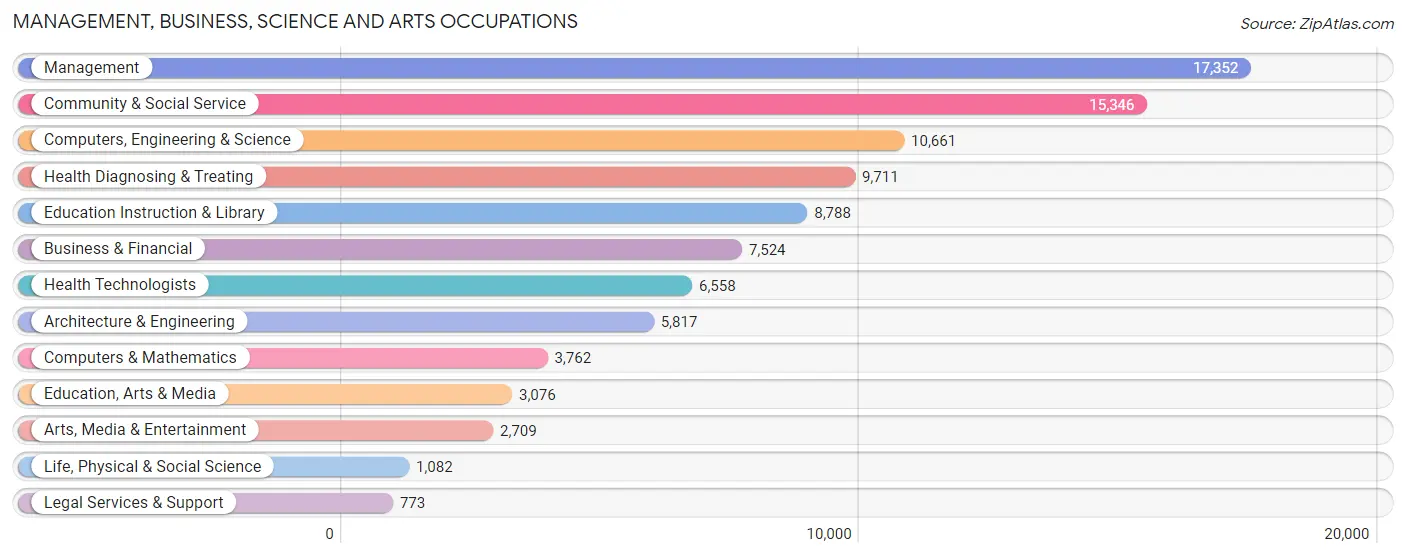
Management, Business, Science and Arts Occupations
The most common Management, Business, Science and Arts occupations in Ottawa County are Management (17,352 | 11.3%), Community & Social Service (15,346 | 10.0%), Computers, Engineering & Science (10,661 | 7.0%), Health Diagnosing & Treating (9,711 | 6.3%), and Education Instruction & Library (8,788 | 5.7%).
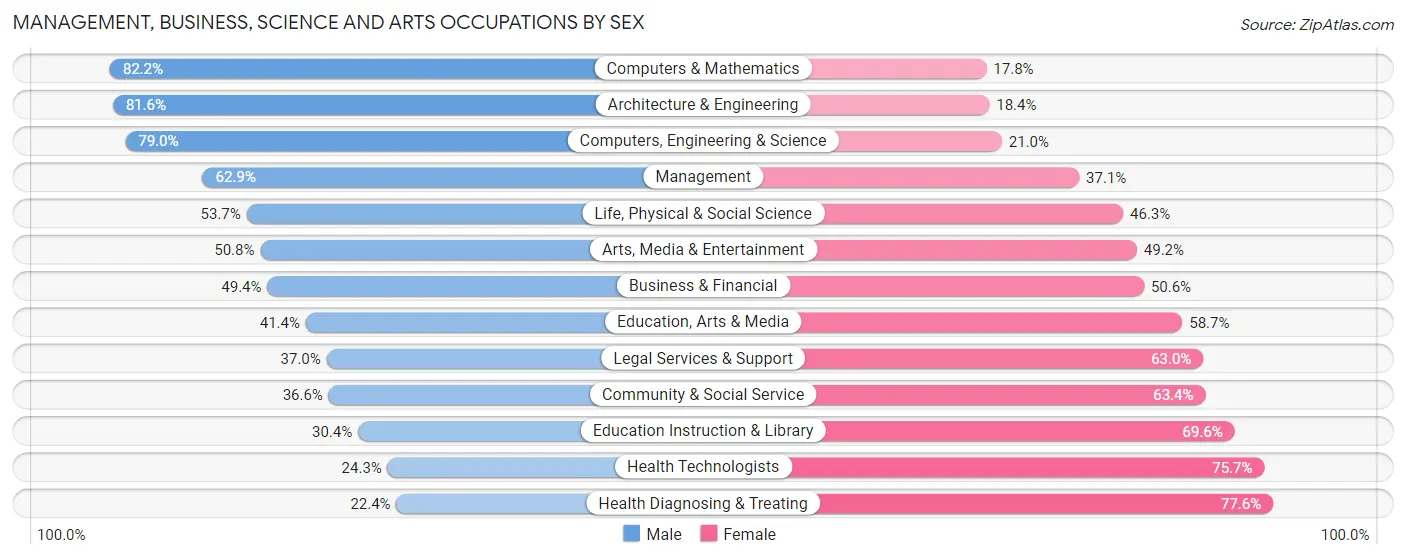
Management, Business, Science and Arts Occupations by Sex
Within the Management, Business, Science and Arts occupations in Ottawa County, the most male-oriented occupations are Computers & Mathematics (82.2%), Architecture & Engineering (81.6%), and Computers, Engineering & Science (79.0%), while the most female-oriented occupations are Health Diagnosing & Treating (77.6%), Health Technologists (75.7%), and Education Instruction & Library (69.6%).
| Occupation | Male | Female |
| Management | 10,910 (62.9%) | 6,442 (37.1%) |
| Business & Financial | 3,714 (49.4%) | 3,810 (50.6%) |
| Computers, Engineering & Science | 8,421 (79.0%) | 2,240 (21.0%) |
| Computers & Mathematics | 3,093 (82.2%) | 669 (17.8%) |
| Architecture & Engineering | 4,747 (81.6%) | 1,070 (18.4%) |
| Life, Physical & Social Science | 581 (53.7%) | 501 (46.3%) |
| Community & Social Service | 5,610 (36.6%) | 9,736 (63.4%) |
| Education, Arts & Media | 1,272 (41.3%) | 1,804 (58.7%) |
| Legal Services & Support | 286 (37.0%) | 487 (63.0%) |
| Education Instruction & Library | 2,675 (30.4%) | 6,113 (69.6%) |
| Arts, Media & Entertainment | 1,377 (50.8%) | 1,332 (49.2%) |
| Health Diagnosing & Treating | 2,178 (22.4%) | 7,533 (77.6%) |
| Health Technologists | 1,591 (24.3%) | 4,967 (75.7%) |
| Total (Category) | 30,833 (50.9%) | 29,761 (49.1%) |
| Total (Overall) | 83,374 (54.3%) | 70,094 (45.7%) |
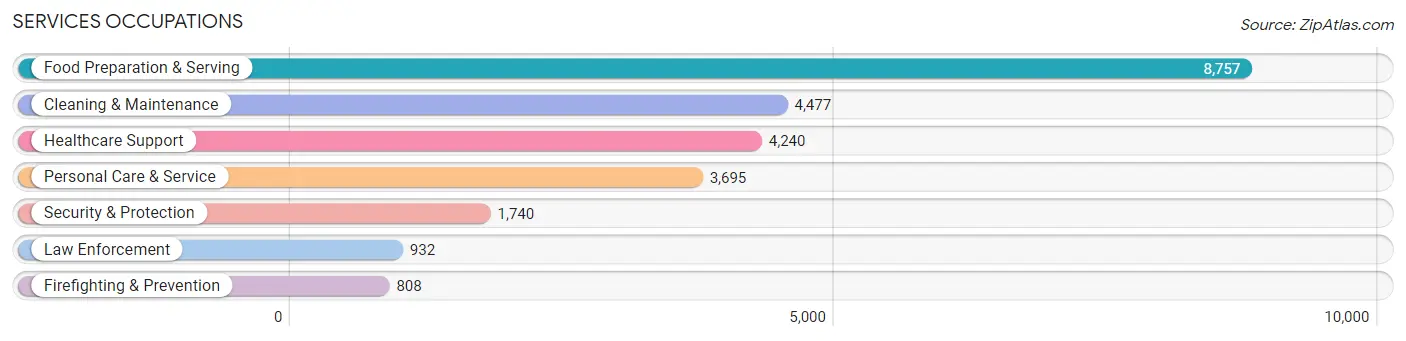
Services Occupations
The most common Services occupations in Ottawa County are Food Preparation & Serving (8,757 | 5.7%), Cleaning & Maintenance (4,477 | 2.9%), Healthcare Support (4,240 | 2.8%), Personal Care & Service (3,695 | 2.4%), and Security & Protection (1,740 | 1.1%).
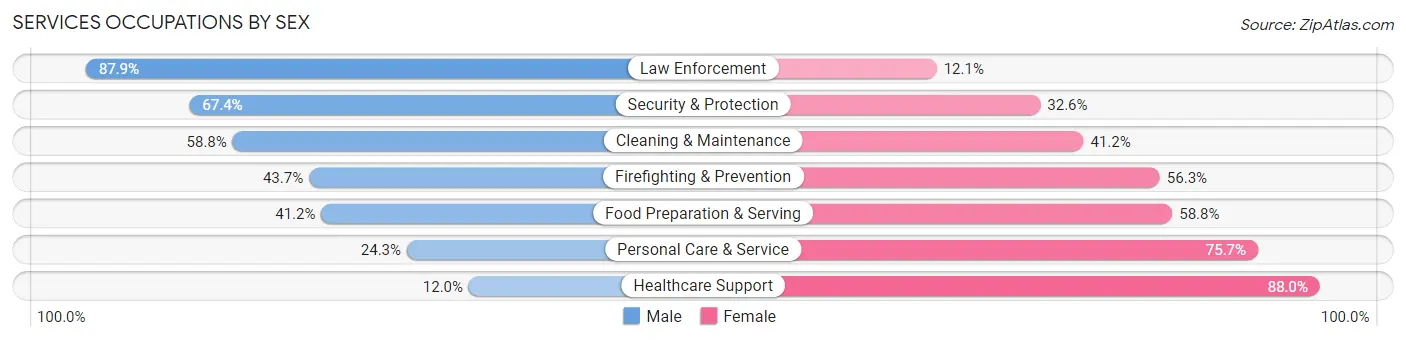
Services Occupations by Sex
Within the Services occupations in Ottawa County, the most male-oriented occupations are Law Enforcement (87.9%), Security & Protection (67.4%), and Cleaning & Maintenance (58.8%), while the most female-oriented occupations are Healthcare Support (88.0%), Personal Care & Service (75.7%), and Food Preparation & Serving (58.8%).
| Occupation | Male | Female |
| Healthcare Support | 510 (12.0%) | 3,730 (88.0%) |
| Security & Protection | 1,172 (67.4%) | 568 (32.6%) |
| Firefighting & Prevention | 353 (43.7%) | 455 (56.3%) |
| Law Enforcement | 819 (87.9%) | 113 (12.1%) |
| Food Preparation & Serving | 3,611 (41.2%) | 5,146 (58.8%) |
| Cleaning & Maintenance | 2,633 (58.8%) | 1,844 (41.2%) |
| Personal Care & Service | 898 (24.3%) | 2,797 (75.7%) |
| Total (Category) | 8,824 (38.5%) | 14,085 (61.5%) |
| Total (Overall) | 83,374 (54.3%) | 70,094 (45.7%) |
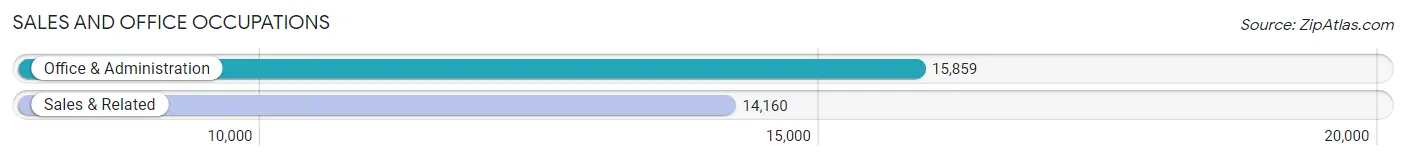
Sales and Office Occupations
The most common Sales and Office occupations in Ottawa County are Office & Administration (15,859 | 10.3%), and Sales & Related (14,160 | 9.2%).
Sales and Office Occupations by Sex
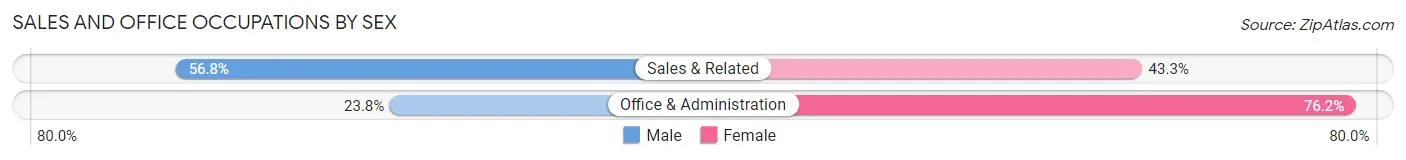
| Occupation | Male | Female |
| Sales & Related | 8,036 (56.8%) | 6,124 (43.2%) |
| Office & Administration | 3,770 (23.8%) | 12,089 (76.2%) |
| Total (Category) | 11,806 (39.3%) | 18,213 (60.7%) |
| Total (Overall) | 83,374 (54.3%) | 70,094 (45.7%) |
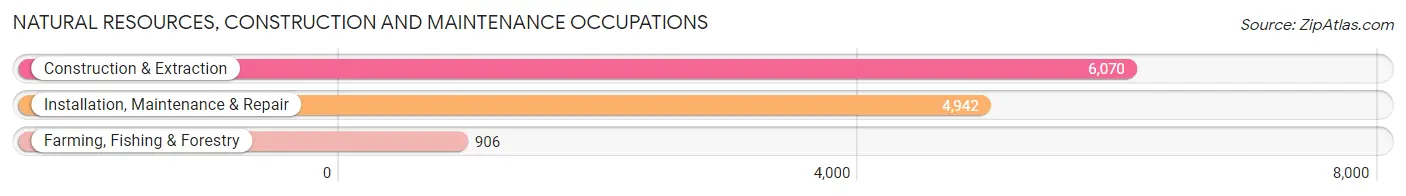
Natural Resources, Construction and Maintenance Occupations
The most common Natural Resources, Construction and Maintenance occupations in Ottawa County are Construction & Extraction (6,070 | 4.0%), Installation, Maintenance & Repair (4,942 | 3.2%), and Farming, Fishing & Forestry (906 | 0.6%).
Natural Resources, Construction and Maintenance Occupations by Sex
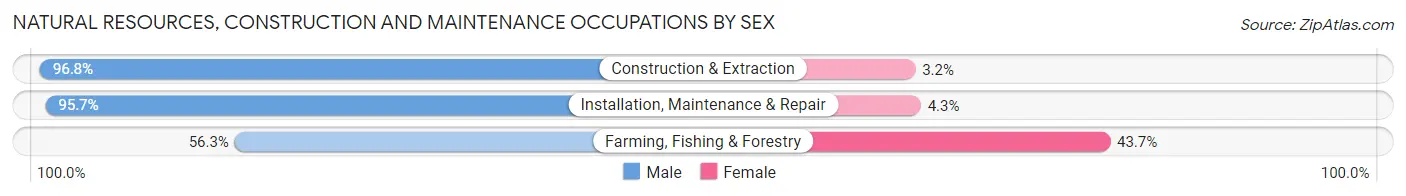
| Occupation | Male | Female |
| Farming, Fishing & Forestry | 510 (56.3%) | 396 (43.7%) |
| Construction & Extraction | 5,877 (96.8%) | 193 (3.2%) |
| Installation, Maintenance & Repair | 4,728 (95.7%) | 214 (4.3%) |
| Total (Category) | 11,115 (93.3%) | 803 (6.7%) |
| Total (Overall) | 83,374 (54.3%) | 70,094 (45.7%) |
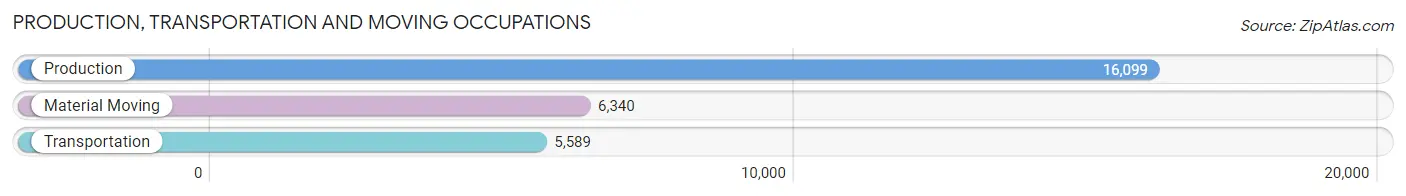
Production, Transportation and Moving Occupations
The most common Production, Transportation and Moving occupations in Ottawa County are Production (16,099 | 10.5%), Material Moving (6,340 | 4.1%), and Transportation (5,589 | 3.6%).
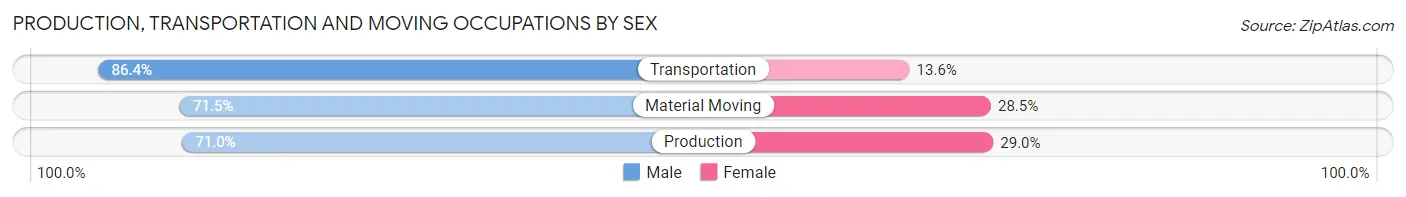
Production, Transportation and Moving Occupations by Sex
| Occupation | Male | Female |
| Production | 11,436 (71.0%) | 4,663 (29.0%) |
| Transportation | 4,829 (86.4%) | 760 (13.6%) |
| Material Moving | 4,531 (71.5%) | 1,809 (28.5%) |
| Total (Category) | 20,796 (74.2%) | 7,232 (25.8%) |
| Total (Overall) | 83,374 (54.3%) | 70,094 (45.7%) |
Employment Industries by Sex in Ottawa County
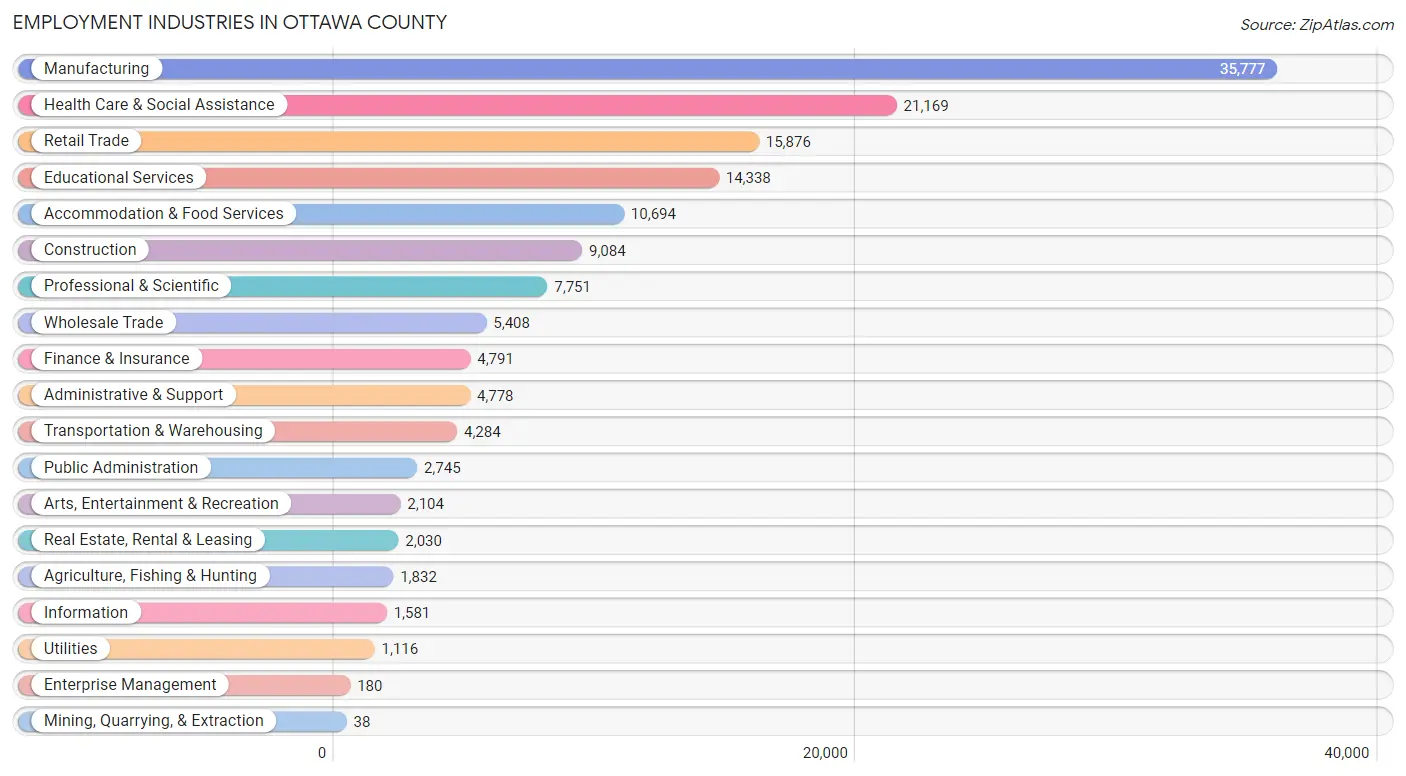
Employment Industries in Ottawa County
The major employment industries in Ottawa County include Manufacturing (35,777 | 23.3%), Health Care & Social Assistance (21,169 | 13.8%), Retail Trade (15,876 | 10.3%), Educational Services (14,338 | 9.3%), and Accommodation & Food Services (10,694 | 7.0%).
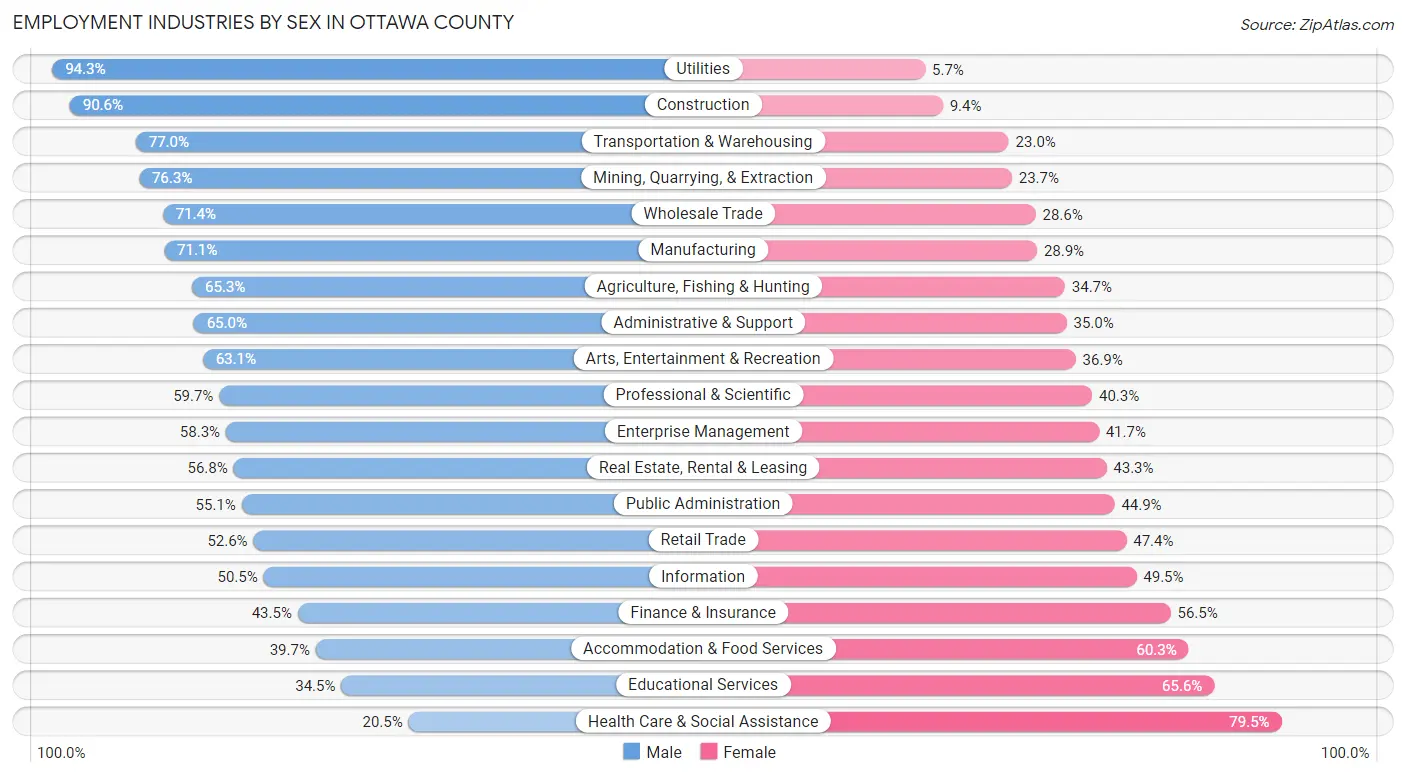
Employment Industries by Sex in Ottawa County
The Ottawa County industries that see more men than women are Utilities (94.3%), Construction (90.6%), and Transportation & Warehousing (77.0%), whereas the industries that tend to have a higher number of women are Health Care & Social Assistance (79.5%), Educational Services (65.5%), and Accommodation & Food Services (60.3%).
| Industry | Male | Female |
| Agriculture, Fishing & Hunting | 1,197 (65.3%) | 635 (34.7%) |
| Mining, Quarrying, & Extraction | 29 (76.3%) | 9 (23.7%) |
| Construction | 8,233 (90.6%) | 851 (9.4%) |
| Manufacturing | 25,445 (71.1%) | 10,332 (28.9%) |
| Wholesale Trade | 3,862 (71.4%) | 1,546 (28.6%) |
| Retail Trade | 8,355 (52.6%) | 7,521 (47.4%) |
| Transportation & Warehousing | 3,298 (77.0%) | 986 (23.0%) |
| Utilities | 1,052 (94.3%) | 64 (5.7%) |
| Information | 799 (50.5%) | 782 (49.5%) |
| Finance & Insurance | 2,082 (43.5%) | 2,709 (56.5%) |
| Real Estate, Rental & Leasing | 1,152 (56.8%) | 878 (43.2%) |
| Professional & Scientific | 4,629 (59.7%) | 3,122 (40.3%) |
| Enterprise Management | 105 (58.3%) | 75 (41.7%) |
| Administrative & Support | 3,105 (65.0%) | 1,673 (35.0%) |
| Educational Services | 4,939 (34.4%) | 9,399 (65.5%) |
| Health Care & Social Assistance | 4,347 (20.5%) | 16,822 (79.5%) |
| Arts, Entertainment & Recreation | 1,328 (63.1%) | 776 (36.9%) |
| Accommodation & Food Services | 4,250 (39.7%) | 6,444 (60.3%) |
| Public Administration | 1,512 (55.1%) | 1,233 (44.9%) |
| Total | 83,374 (54.3%) | 70,094 (45.7%) |
Education in Ottawa County
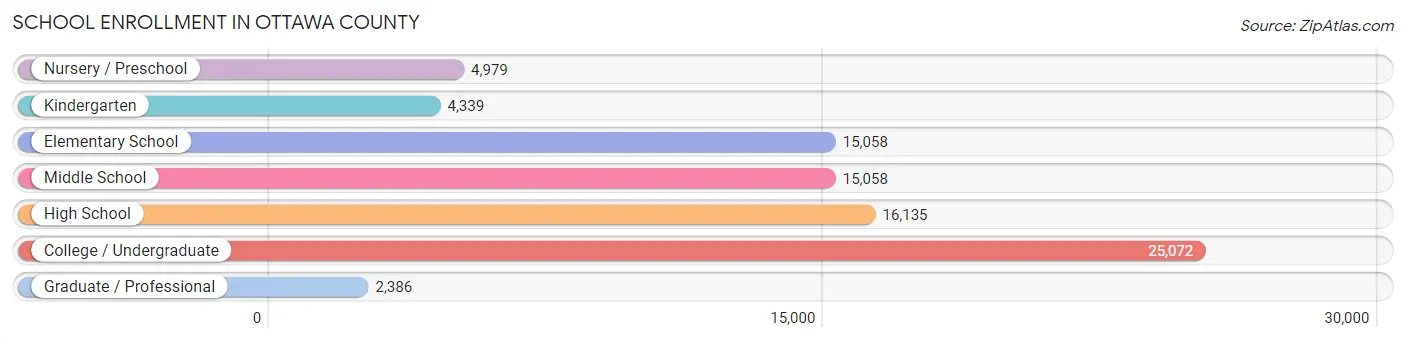
School Enrollment in Ottawa County
The most common levels of schooling among the 83,027 students in Ottawa County are college / undergraduate (25,072 | 30.2%), high school (16,135 | 19.4%), and elementary school (15,058 | 18.1%).
| School Level | # Students | % Students |
| Nursery / Preschool | 4,979 | 6.0% |
| Kindergarten | 4,339 | 5.2% |
| Elementary School | 15,058 | 18.1% |
| Middle School | 15,058 | 18.1% |
| High School | 16,135 | 19.4% |
| College / Undergraduate | 25,072 | 30.2% |
| Graduate / Professional | 2,386 | 2.9% |
| Total | 83,027 | 100.0% |
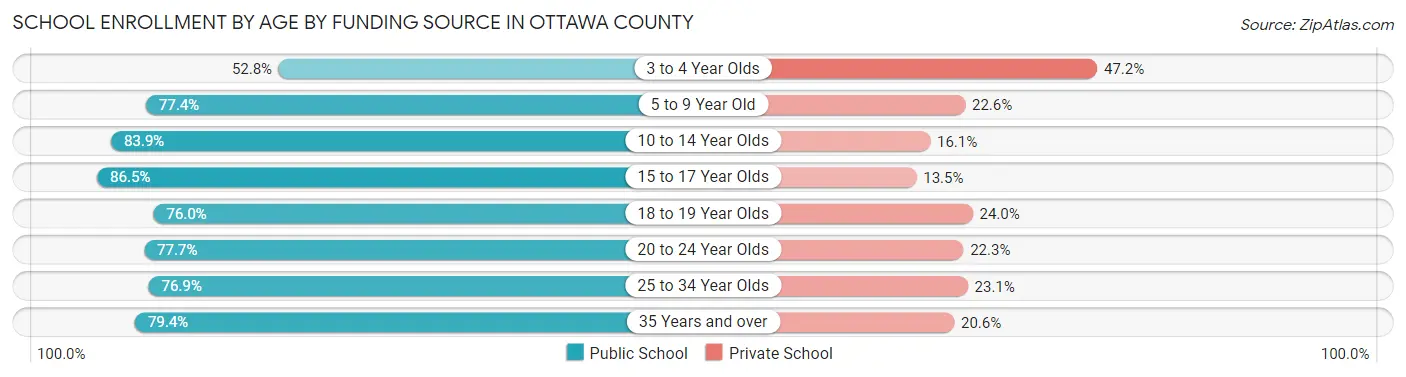
School Enrollment by Age by Funding Source in Ottawa County
Out of a total of 83,027 students who are enrolled in schools in Ottawa County, 17,436 (21.0%) attend a private institution, while the remaining 65,591 (79.0%) are enrolled in public schools. The age group of 3 to 4 year olds has the highest likelihood of being enrolled in private schools, with 1,671 (47.2% in the age bracket) enrolled. Conversely, the age group of 15 to 17 year olds has the lowest likelihood of being enrolled in a private school, with 10,227 (86.5% in the age bracket) attending a public institution.
| Age Bracket | Public School | Private School |
| 3 to 4 Year Olds | 1,870 (52.8%) | 1,671 (47.2%) |
| 5 to 9 Year Old | 14,561 (77.4%) | 4,252 (22.6%) |
| 10 to 14 Year Olds | 15,882 (83.9%) | 3,046 (16.1%) |
| 15 to 17 Year Olds | 10,227 (86.5%) | 1,599 (13.5%) |
| 18 to 19 Year Olds | 8,142 (76.0%) | 2,571 (24.0%) |
| 20 to 24 Year Olds | 10,967 (77.7%) | 3,142 (22.3%) |
| 25 to 34 Year Olds | 2,222 (76.9%) | 667 (23.1%) |
| 35 Years and over | 1,754 (79.4%) | 454 (20.6%) |
| Total | 65,591 (79.0%) | 17,436 (21.0%) |
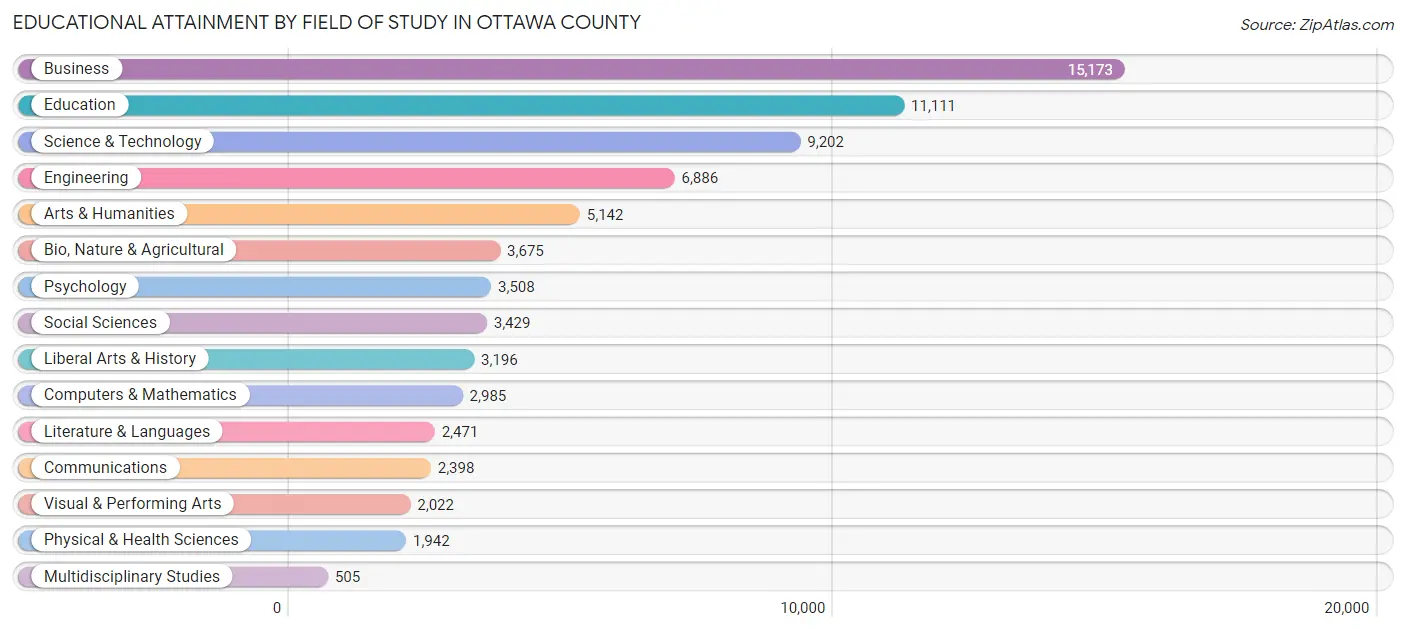
Educational Attainment by Field of Study in Ottawa County
Business (15,173 | 20.6%), education (11,111 | 15.1%), science & technology (9,202 | 12.5%), engineering (6,886 | 9.3%), and arts & humanities (5,142 | 7.0%) are the most common fields of study among 73,645 individuals in Ottawa County who have obtained a bachelor's degree or higher.
| Field of Study | # Graduates | % Graduates |
| Computers & Mathematics | 2,985 | 4.1% |
| Bio, Nature & Agricultural | 3,675 | 5.0% |
| Physical & Health Sciences | 1,942 | 2.6% |
| Psychology | 3,508 | 4.8% |
| Social Sciences | 3,429 | 4.7% |
| Engineering | 6,886 | 9.3% |
| Multidisciplinary Studies | 505 | 0.7% |
| Science & Technology | 9,202 | 12.5% |
| Business | 15,173 | 20.6% |
| Education | 11,111 | 15.1% |
| Literature & Languages | 2,471 | 3.4% |
| Liberal Arts & History | 3,196 | 4.3% |
| Visual & Performing Arts | 2,022 | 2.8% |
| Communications | 2,398 | 3.3% |
| Arts & Humanities | 5,142 | 7.0% |
| Total | 73,645 | 100.0% |
Transportation & Commute in Ottawa County
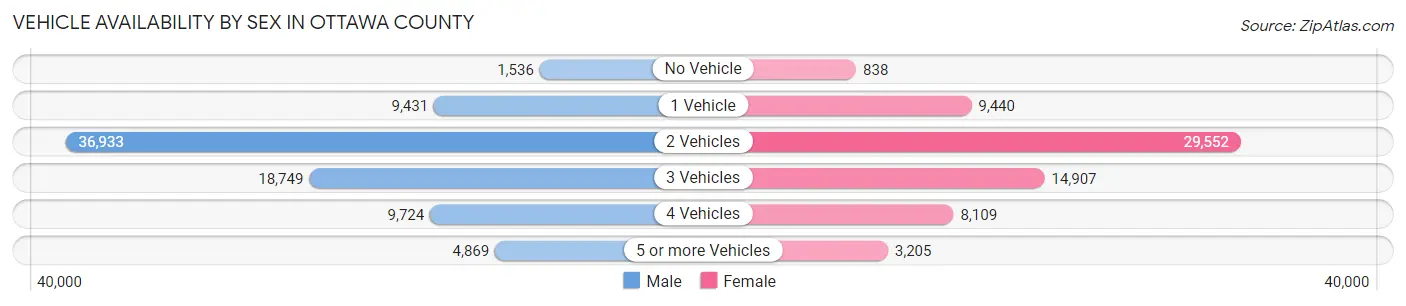
Vehicle Availability by Sex in Ottawa County
The most prevalent vehicle ownership categories in Ottawa County are males with 2 vehicles (36,933, accounting for 45.5%) and females with 2 vehicles (29,552, making up 55.9%).
| Vehicles Available | Male | Female |
| No Vehicle | 1,536 (1.9%) | 838 (1.3%) |
| 1 Vehicle | 9,431 (11.6%) | 9,440 (14.3%) |
| 2 Vehicles | 36,933 (45.5%) | 29,552 (44.7%) |
| 3 Vehicles | 18,749 (23.1%) | 14,907 (22.6%) |
| 4 Vehicles | 9,724 (12.0%) | 8,109 (12.3%) |
| 5 or more Vehicles | 4,869 (6.0%) | 3,205 (4.9%) |
| Total | 81,242 (100.0%) | 66,051 (100.0%) |
Commute Time in Ottawa County
The most frequently occuring commute durations in Ottawa County are 15 to 19 minutes (25,822 commuters, 18.6%), 10 to 14 minutes (24,647 commuters, 17.7%), and 20 to 24 minutes (19,812 commuters, 14.3%).
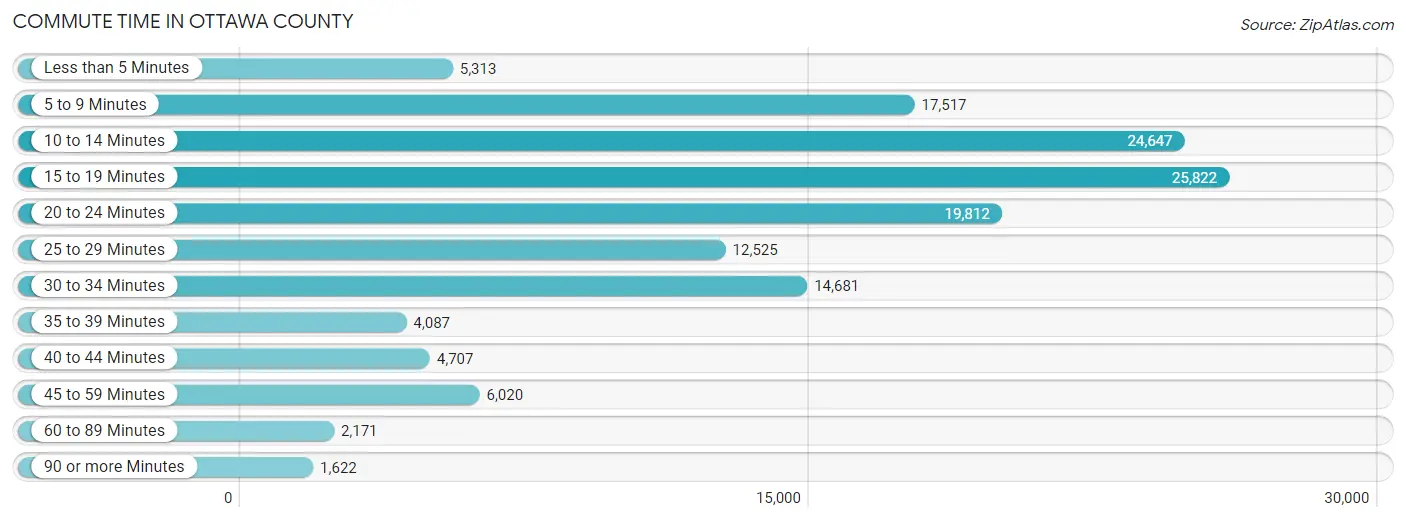
| Commute Time | # Commuters | % Commuters |
| Less than 5 Minutes | 5,313 | 3.8% |
| 5 to 9 Minutes | 17,517 | 12.6% |
| 10 to 14 Minutes | 24,647 | 17.7% |
| 15 to 19 Minutes | 25,822 | 18.6% |
| 20 to 24 Minutes | 19,812 | 14.3% |
| 25 to 29 Minutes | 12,525 | 9.0% |
| 30 to 34 Minutes | 14,681 | 10.6% |
| 35 to 39 Minutes | 4,087 | 2.9% |
| 40 to 44 Minutes | 4,707 | 3.4% |
| 45 to 59 Minutes | 6,020 | 4.3% |
| 60 to 89 Minutes | 2,171 | 1.6% |
| 90 or more Minutes | 1,622 | 1.2% |
Commute Time by Sex in Ottawa County
The most common commute times in Ottawa County are 15 to 19 minutes (13,867 commuters, 18.1%) for males and 15 to 19 minutes (11,955 commuters, 19.2%) for females.
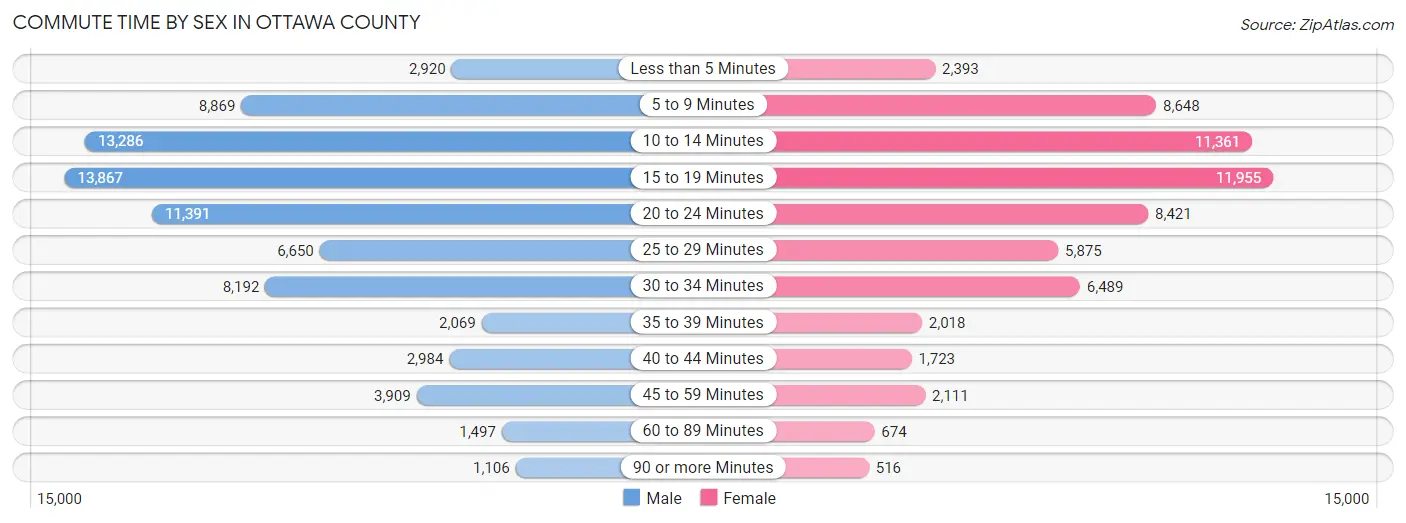
| Commute Time | Male | Female |
| Less than 5 Minutes | 2,920 (3.8%) | 2,393 (3.8%) |
| 5 to 9 Minutes | 8,869 (11.6%) | 8,648 (13.9%) |
| 10 to 14 Minutes | 13,286 (17.3%) | 11,361 (18.3%) |
| 15 to 19 Minutes | 13,867 (18.1%) | 11,955 (19.2%) |
| 20 to 24 Minutes | 11,391 (14.8%) | 8,421 (13.5%) |
| 25 to 29 Minutes | 6,650 (8.7%) | 5,875 (9.5%) |
| 30 to 34 Minutes | 8,192 (10.7%) | 6,489 (10.4%) |
| 35 to 39 Minutes | 2,069 (2.7%) | 2,018 (3.3%) |
| 40 to 44 Minutes | 2,984 (3.9%) | 1,723 (2.8%) |
| 45 to 59 Minutes | 3,909 (5.1%) | 2,111 (3.4%) |
| 60 to 89 Minutes | 1,497 (1.9%) | 674 (1.1%) |
| 90 or more Minutes | 1,106 (1.4%) | 516 (0.8%) |
Time of Departure to Work by Sex in Ottawa County
The most frequent times of departure to work in Ottawa County are 7:00 AM to 7:29 AM (12,168, 15.9%) for males and 7:00 AM to 7:29 AM (8,925, 14.3%) for females.
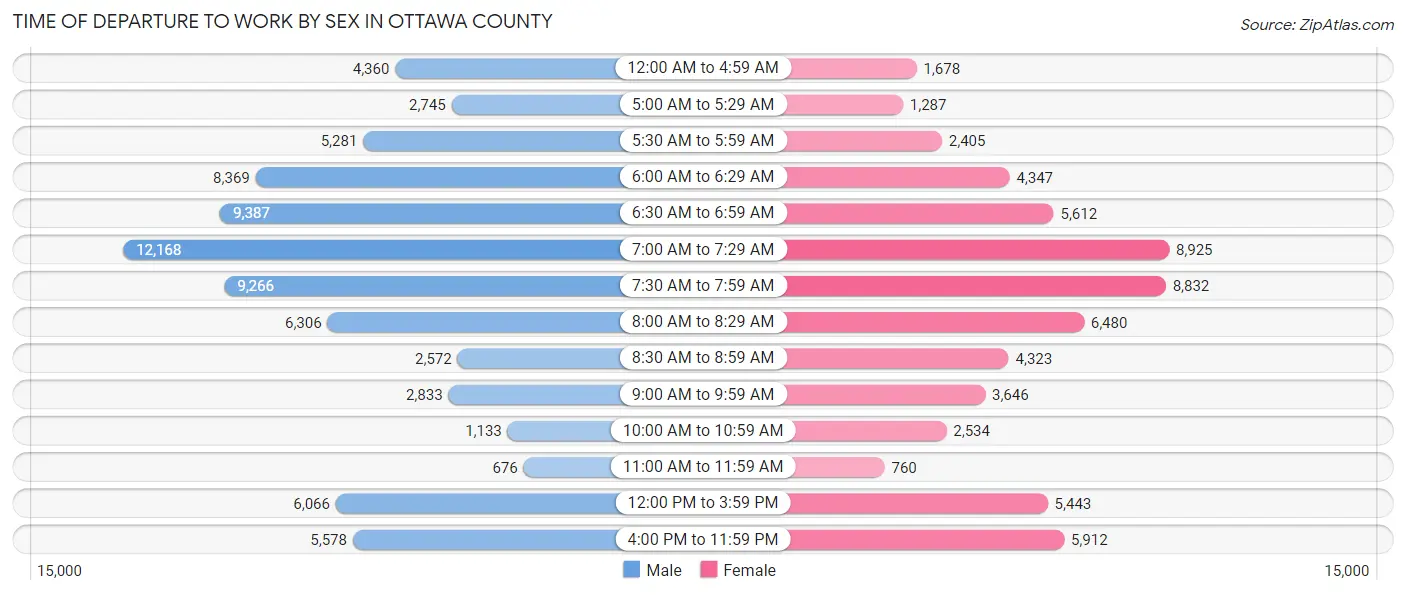
| Time of Departure | Male | Female |
| 12:00 AM to 4:59 AM | 4,360 (5.7%) | 1,678 (2.7%) |
| 5:00 AM to 5:29 AM | 2,745 (3.6%) | 1,287 (2.1%) |
| 5:30 AM to 5:59 AM | 5,281 (6.9%) | 2,405 (3.9%) |
| 6:00 AM to 6:29 AM | 8,369 (10.9%) | 4,347 (7.0%) |
| 6:30 AM to 6:59 AM | 9,387 (12.2%) | 5,612 (9.0%) |
| 7:00 AM to 7:29 AM | 12,168 (15.9%) | 8,925 (14.3%) |
| 7:30 AM to 7:59 AM | 9,266 (12.1%) | 8,832 (14.2%) |
| 8:00 AM to 8:29 AM | 6,306 (8.2%) | 6,480 (10.4%) |
| 8:30 AM to 8:59 AM | 2,572 (3.4%) | 4,323 (7.0%) |
| 9:00 AM to 9:59 AM | 2,833 (3.7%) | 3,646 (5.9%) |
| 10:00 AM to 10:59 AM | 1,133 (1.5%) | 2,534 (4.1%) |
| 11:00 AM to 11:59 AM | 676 (0.9%) | 760 (1.2%) |
| 12:00 PM to 3:59 PM | 6,066 (7.9%) | 5,443 (8.7%) |
| 4:00 PM to 11:59 PM | 5,578 (7.3%) | 5,912 (9.5%) |
| Total | 76,740 (100.0%) | 62,184 (100.0%) |
Housing Occupancy in Ottawa County
Occupancy by Ownership in Ottawa County
Of the total 108,362 dwellings in Ottawa County, owner-occupied units account for 84,698 (78.2%), while renter-occupied units make up 23,664 (21.8%).
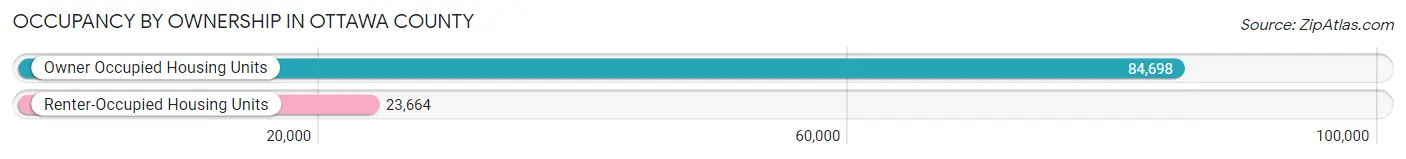
| Occupancy | # Housing Units | % Housing Units |
| Owner Occupied Housing Units | 84,698 | 78.2% |
| Renter-Occupied Housing Units | 23,664 | 21.8% |
| Total Occupied Housing Units | 108,362 | 100.0% |
Occupancy by Household Size in Ottawa County
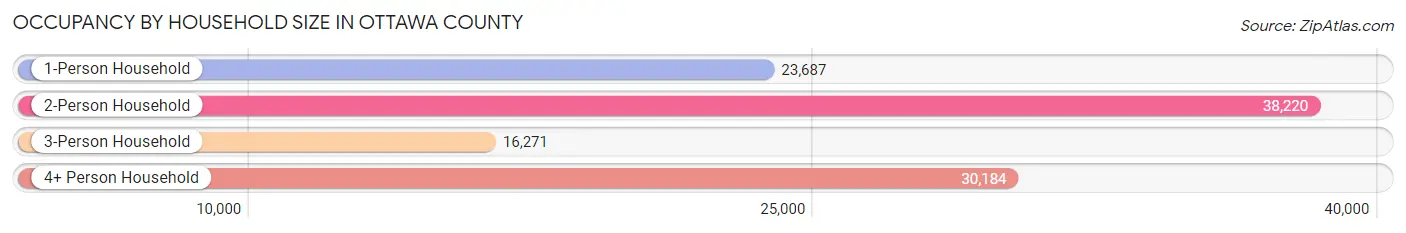
| Household Size | # Housing Units | % Housing Units |
| 1-Person Household | 23,687 | 21.9% |
| 2-Person Household | 38,220 | 35.3% |
| 3-Person Household | 16,271 | 15.0% |
| 4+ Person Household | 30,184 | 27.9% |
| Total Housing Units | 108,362 | 100.0% |
Occupancy by Ownership by Household Size in Ottawa County
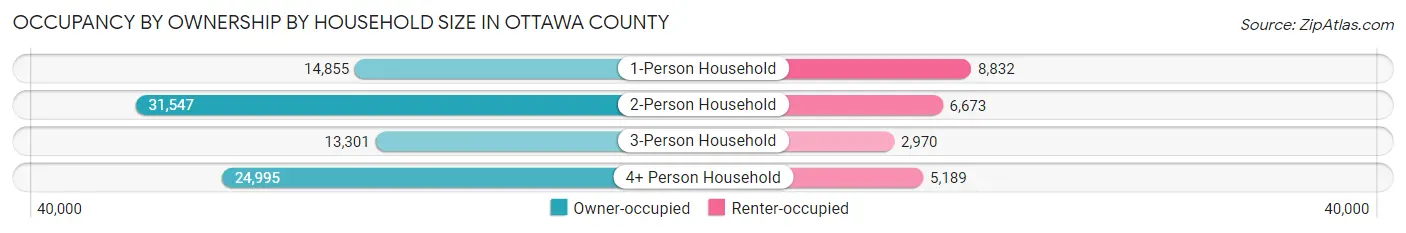
| Household Size | Owner-occupied | Renter-occupied |
| 1-Person Household | 14,855 (62.7%) | 8,832 (37.3%) |
| 2-Person Household | 31,547 (82.5%) | 6,673 (17.5%) |
| 3-Person Household | 13,301 (81.8%) | 2,970 (18.2%) |
| 4+ Person Household | 24,995 (82.8%) | 5,189 (17.2%) |
| Total Housing Units | 84,698 (78.2%) | 23,664 (21.8%) |
Occupancy by Educational Attainment in Ottawa County
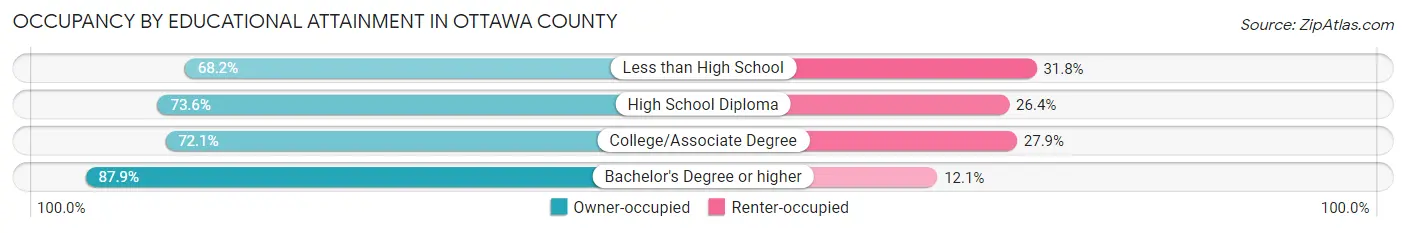
| Household Size | Owner-occupied | Renter-occupied |
| Less than High School | 3,819 (68.2%) | 1,779 (31.8%) |
| High School Diploma | 18,970 (73.6%) | 6,793 (26.4%) |
| College/Associate Degree | 26,374 (72.1%) | 10,199 (27.9%) |
| Bachelor's Degree or higher | 35,535 (87.9%) | 4,893 (12.1%) |
Occupancy by Age of Householder in Ottawa County
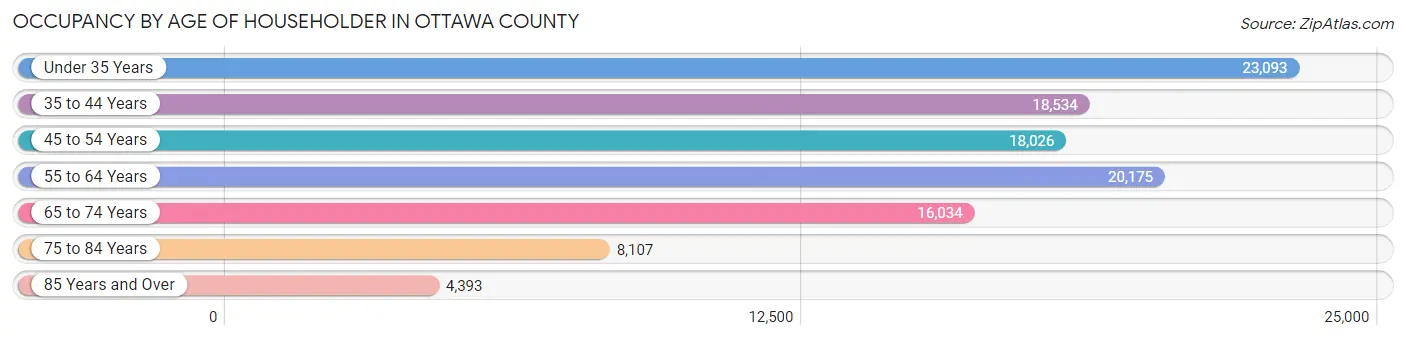
| Age Bracket | # Households | % Households |
| Under 35 Years | 23,093 | 21.3% |
| 35 to 44 Years | 18,534 | 17.1% |
| 45 to 54 Years | 18,026 | 16.6% |
| 55 to 64 Years | 20,175 | 18.6% |
| 65 to 74 Years | 16,034 | 14.8% |
| 75 to 84 Years | 8,107 | 7.5% |
| 85 Years and Over | 4,393 | 4.1% |
| Total | 108,362 | 100.0% |
Housing Finances in Ottawa County
Median Income by Occupancy in Ottawa County
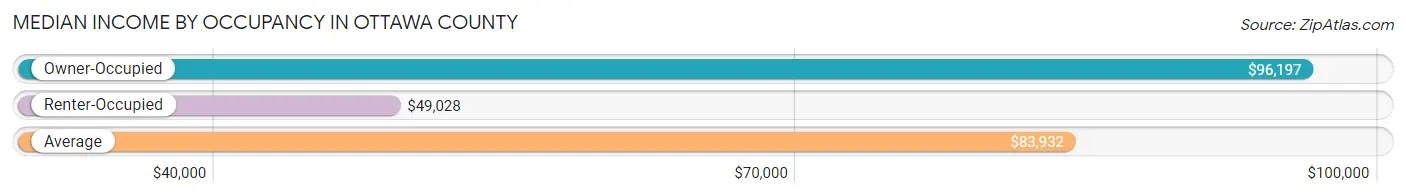
| Occupancy Type | # Households | Median Income |
| Owner-Occupied | 84,698 (78.2%) | $96,197 |
| Renter-Occupied | 23,664 (21.8%) | $49,028 |
| Average | 108,362 (100.0%) | $83,932 |
Occupancy by Householder Income Bracket in Ottawa County
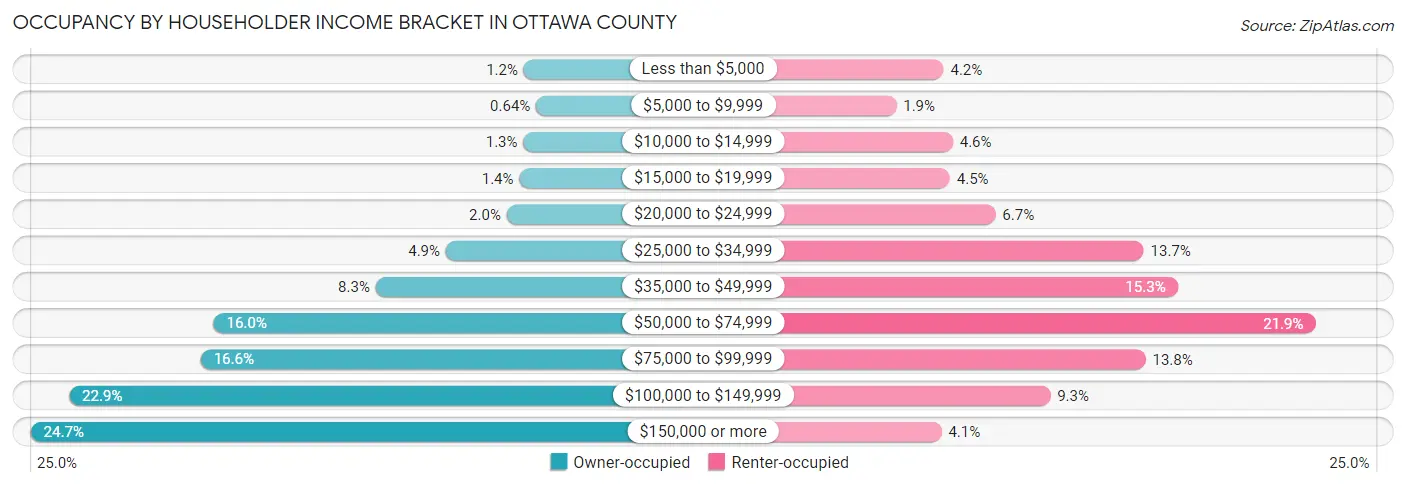
| Income Bracket | Owner-occupied | Renter-occupied |
| Less than $5,000 | 1,039 (1.2%) | 991 (4.2%) |
| $5,000 to $9,999 | 541 (0.6%) | 459 (1.9%) |
| $10,000 to $14,999 | 1,060 (1.3%) | 1,095 (4.6%) |
| $15,000 to $19,999 | 1,217 (1.4%) | 1,062 (4.5%) |
| $20,000 to $24,999 | 1,725 (2.0%) | 1,576 (6.7%) |
| $25,000 to $34,999 | 4,186 (4.9%) | 3,247 (13.7%) |
| $35,000 to $49,999 | 7,014 (8.3%) | 3,627 (15.3%) |
| $50,000 to $74,999 | 13,548 (16.0%) | 5,179 (21.9%) |
| $75,000 to $99,999 | 14,067 (16.6%) | 3,267 (13.8%) |
| $100,000 to $149,999 | 19,375 (22.9%) | 2,193 (9.3%) |
| $150,000 or more | 20,926 (24.7%) | 968 (4.1%) |
| Total | 84,698 (100.0%) | 23,664 (100.0%) |
Monthly Housing Cost Tiers in Ottawa County
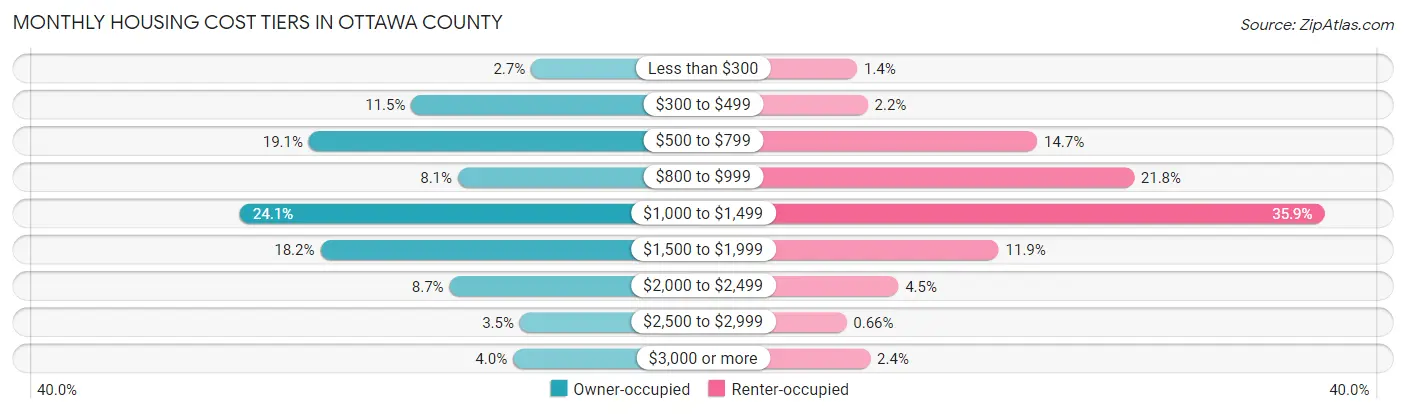
| Monthly Cost | Owner-occupied | Renter-occupied |
| Less than $300 | 2,289 (2.7%) | 340 (1.4%) |
| $300 to $499 | 9,754 (11.5%) | 525 (2.2%) |
| $500 to $799 | 16,152 (19.1%) | 3,479 (14.7%) |
| $800 to $999 | 6,848 (8.1%) | 5,165 (21.8%) |
| $1,000 to $1,499 | 20,448 (24.1%) | 8,486 (35.9%) |
| $1,500 to $1,999 | 15,428 (18.2%) | 2,809 (11.9%) |
| $2,000 to $2,499 | 7,379 (8.7%) | 1,061 (4.5%) |
| $2,500 to $2,999 | 2,990 (3.5%) | 157 (0.7%) |
| $3,000 or more | 3,410 (4.0%) | 570 (2.4%) |
| Total | 84,698 (100.0%) | 23,664 (100.0%) |
Physical Housing Characteristics in Ottawa County
Housing Structures in Ottawa County
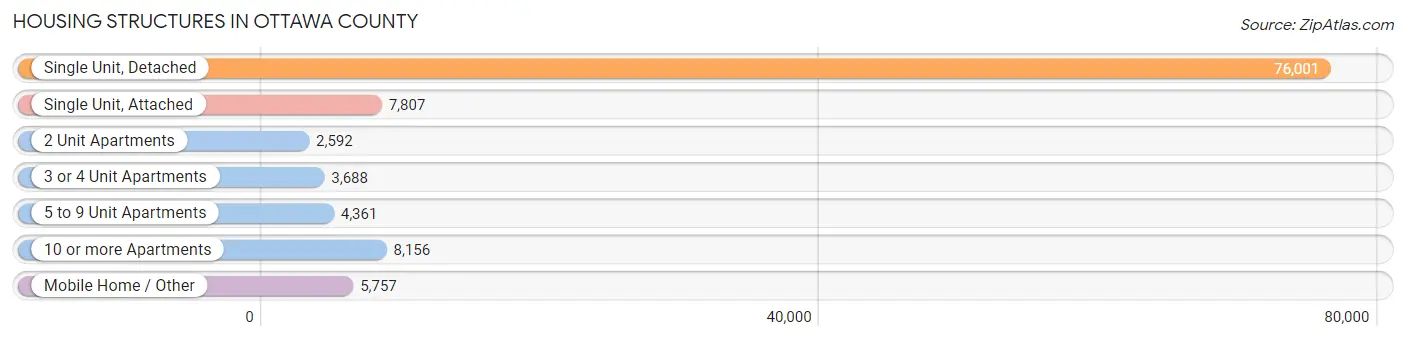
| Structure Type | # Housing Units | % Housing Units |
| Single Unit, Detached | 76,001 | 70.1% |
| Single Unit, Attached | 7,807 | 7.2% |
| 2 Unit Apartments | 2,592 | 2.4% |
| 3 or 4 Unit Apartments | 3,688 | 3.4% |
| 5 to 9 Unit Apartments | 4,361 | 4.0% |
| 10 or more Apartments | 8,156 | 7.5% |
| Mobile Home / Other | 5,757 | 5.3% |
| Total | 108,362 | 100.0% |
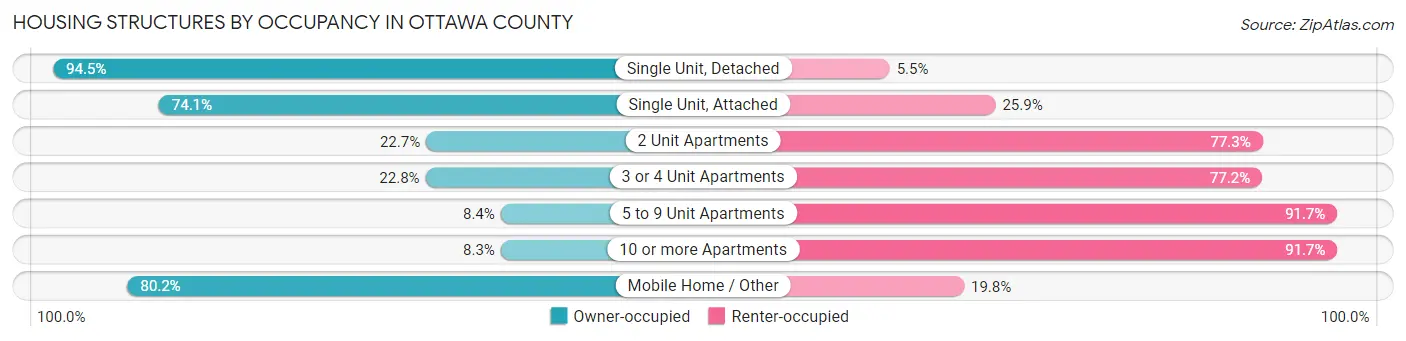
Housing Structures by Occupancy in Ottawa County
| Structure Type | Owner-occupied | Renter-occupied |
| Single Unit, Detached | 71,819 (94.5%) | 4,182 (5.5%) |
| Single Unit, Attached | 5,788 (74.1%) | 2,019 (25.9%) |
| 2 Unit Apartments | 589 (22.7%) | 2,003 (77.3%) |
| 3 or 4 Unit Apartments | 842 (22.8%) | 2,846 (77.2%) |
| 5 to 9 Unit Apartments | 364 (8.4%) | 3,997 (91.6%) |
| 10 or more Apartments | 679 (8.3%) | 7,477 (91.7%) |
| Mobile Home / Other | 4,617 (80.2%) | 1,140 (19.8%) |
| Total | 84,698 (78.2%) | 23,664 (21.8%) |
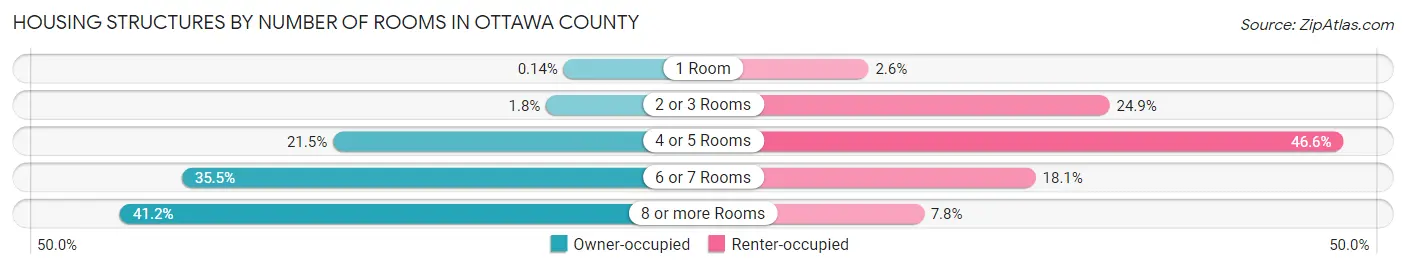
Housing Structures by Number of Rooms in Ottawa County
| Number of Rooms | Owner-occupied | Renter-occupied |
| 1 Room | 120 (0.1%) | 625 (2.6%) |
| 2 or 3 Rooms | 1,492 (1.8%) | 5,902 (24.9%) |
| 4 or 5 Rooms | 18,191 (21.5%) | 11,018 (46.6%) |
| 6 or 7 Rooms | 30,032 (35.5%) | 4,284 (18.1%) |
| 8 or more Rooms | 34,863 (41.2%) | 1,835 (7.7%) |
| Total | 84,698 (100.0%) | 23,664 (100.0%) |
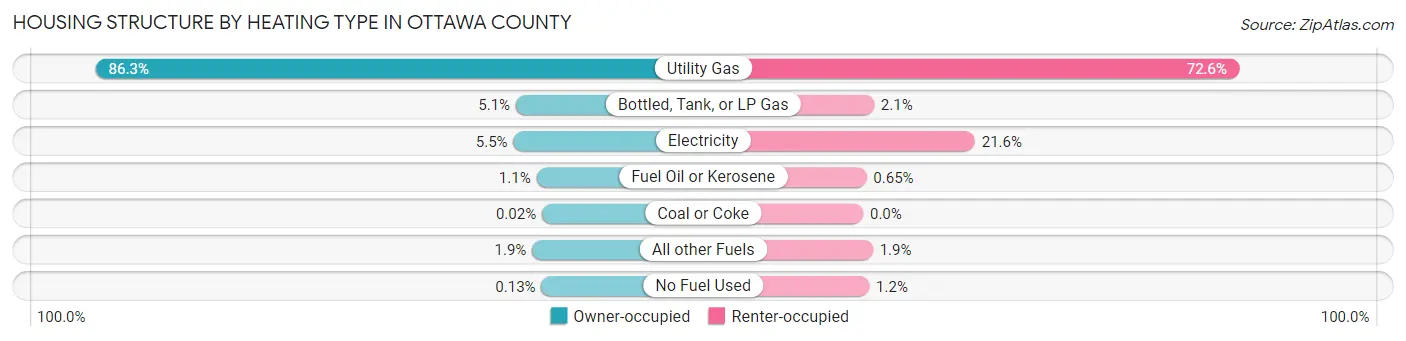
Housing Structure by Heating Type in Ottawa County
| Heating Type | Owner-occupied | Renter-occupied |
| Utility Gas | 73,068 (86.3%) | 17,181 (72.6%) |
| Bottled, Tank, or LP Gas | 4,284 (5.1%) | 497 (2.1%) |
| Electricity | 4,696 (5.5%) | 5,111 (21.6%) |
| Fuel Oil or Kerosene | 916 (1.1%) | 154 (0.6%) |
| Coal or Coke | 13 (0.0%) | 0 (0.0%) |
| All other Fuels | 1,614 (1.9%) | 442 (1.9%) |
| No Fuel Used | 107 (0.1%) | 279 (1.2%) |
| Total | 84,698 (100.0%) | 23,664 (100.0%) |
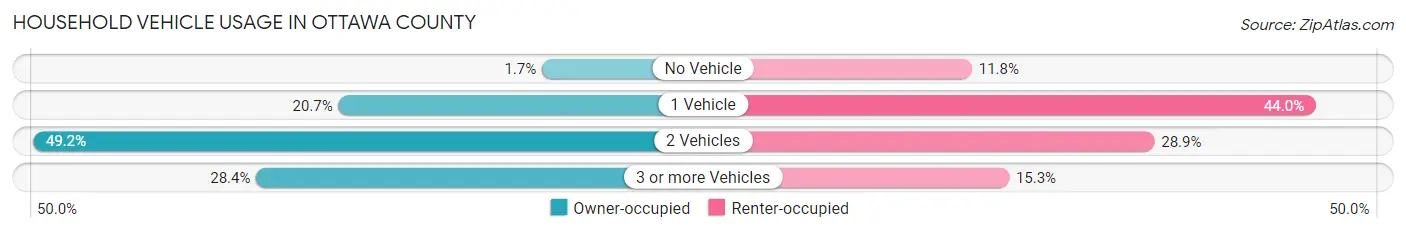
Household Vehicle Usage in Ottawa County
| Vehicles per Household | Owner-occupied | Renter-occupied |
| No Vehicle | 1,444 (1.7%) | 2,802 (11.8%) |
| 1 Vehicle | 17,528 (20.7%) | 10,405 (44.0%) |
| 2 Vehicles | 41,700 (49.2%) | 6,833 (28.9%) |
| 3 or more Vehicles | 24,026 (28.4%) | 3,624 (15.3%) |
| Total | 84,698 (100.0%) | 23,664 (100.0%) |
Real Estate & Mortgages in Ottawa County
Real Estate and Mortgage Overview in Ottawa County
| Characteristic | Without Mortgage | With Mortgage |
| Housing Units | 31,138 | 53,560 |
| Median Property Value | $249,500 | $277,700 |
| Median Household Income | $72,420 | $15,430 |
| Monthly Housing Costs | $566 | $3,192 |
| Real Estate Taxes | $2,806 | $2,194 |
Property Value by Mortgage Status in Ottawa County
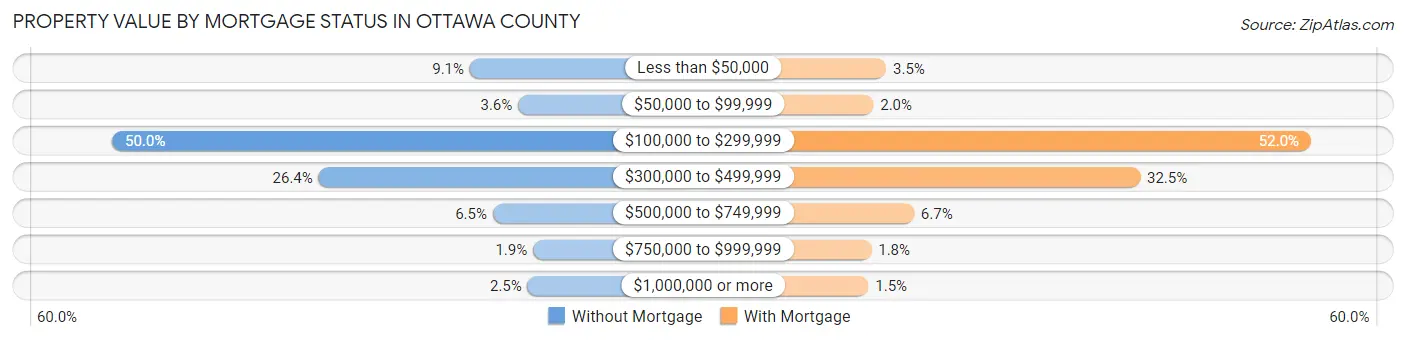
| Property Value | Without Mortgage | With Mortgage |
| Less than $50,000 | 2,837 (9.1%) | 1,867 (3.5%) |
| $50,000 to $99,999 | 1,120 (3.6%) | 1,085 (2.0%) |
| $100,000 to $299,999 | 15,568 (50.0%) | 27,872 (52.0%) |
| $300,000 to $499,999 | 8,221 (26.4%) | 17,414 (32.5%) |
| $500,000 to $749,999 | 2,022 (6.5%) | 3,574 (6.7%) |
| $750,000 to $999,999 | 587 (1.9%) | 966 (1.8%) |
| $1,000,000 or more | 783 (2.5%) | 782 (1.5%) |
| Total | 31,138 (100.0%) | 53,560 (100.0%) |
Household Income by Mortgage Status in Ottawa County
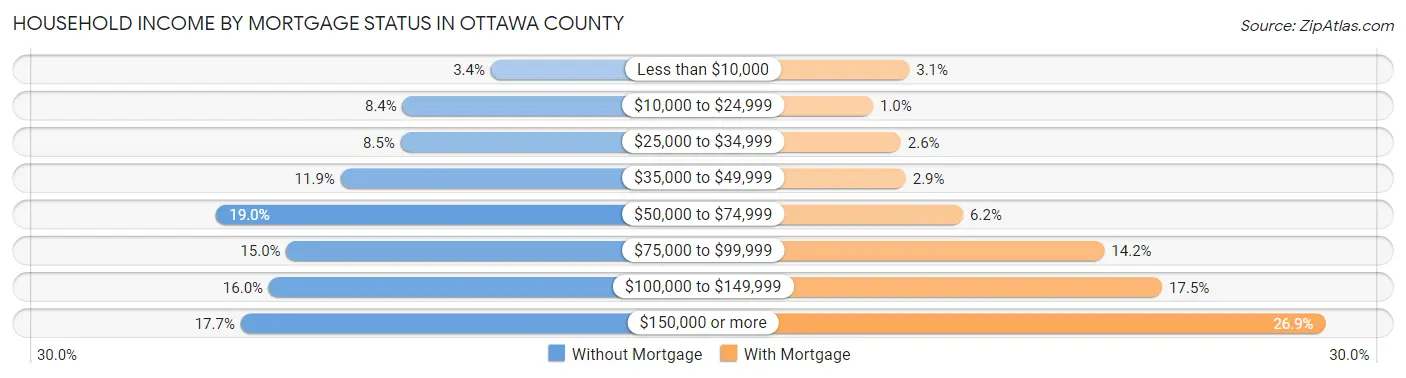
| Household Income | Without Mortgage | With Mortgage |
| Less than $10,000 | 1,047 (3.4%) | 1,644 (3.1%) |
| $10,000 to $24,999 | 2,616 (8.4%) | 533 (1.0%) |
| $25,000 to $34,999 | 2,651 (8.5%) | 1,386 (2.6%) |
| $35,000 to $49,999 | 3,719 (11.9%) | 1,535 (2.9%) |
| $50,000 to $74,999 | 5,930 (19.0%) | 3,295 (6.1%) |
| $75,000 to $99,999 | 4,683 (15.0%) | 7,618 (14.2%) |
| $100,000 to $149,999 | 4,996 (16.0%) | 9,384 (17.5%) |
| $150,000 or more | 5,496 (17.6%) | 14,379 (26.9%) |
| Total | 31,138 (100.0%) | 53,560 (100.0%) |
Property Value to Household Income Ratio in Ottawa County
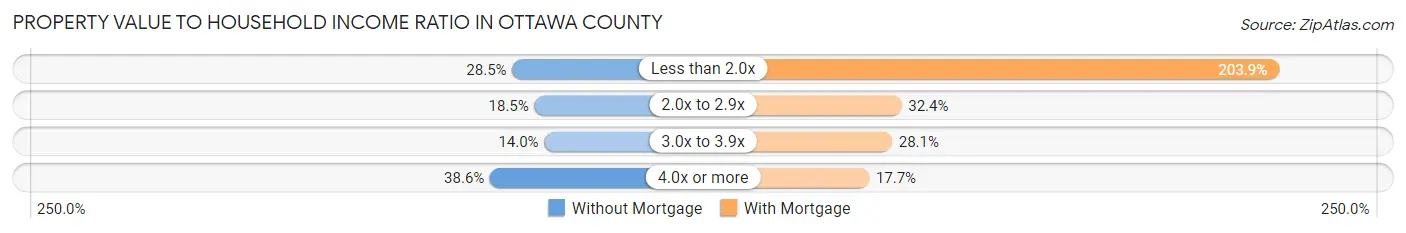
| Value-to-Income Ratio | Without Mortgage | With Mortgage |
| Less than 2.0x | 8,879 (28.5%) | 109,215 (203.9%) |
| 2.0x to 2.9x | 5,744 (18.4%) | 17,364 (32.4%) |
| 3.0x to 3.9x | 4,349 (14.0%) | 15,043 (28.1%) |
| 4.0x or more | 12,025 (38.6%) | 9,493 (17.7%) |
| Total | 31,138 (100.0%) | 53,560 (100.0%) |
Real Estate Taxes by Mortgage Status in Ottawa County
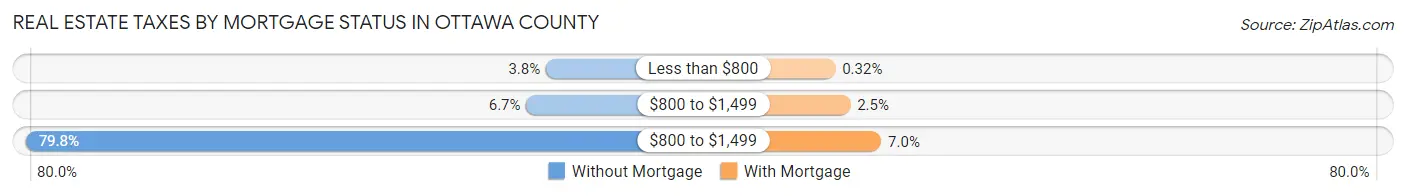
| Property Taxes | Without Mortgage | With Mortgage |
| Less than $800 | 1,186 (3.8%) | 173 (0.3%) |
| $800 to $1,499 | 2,081 (6.7%) | 1,342 (2.5%) |
| $800 to $1,499 | 24,858 (79.8%) | 3,766 (7.0%) |
| Total | 31,138 (100.0%) | 53,560 (100.0%) |
Health & Disability in Ottawa County
Health Insurance Coverage by Age in Ottawa County
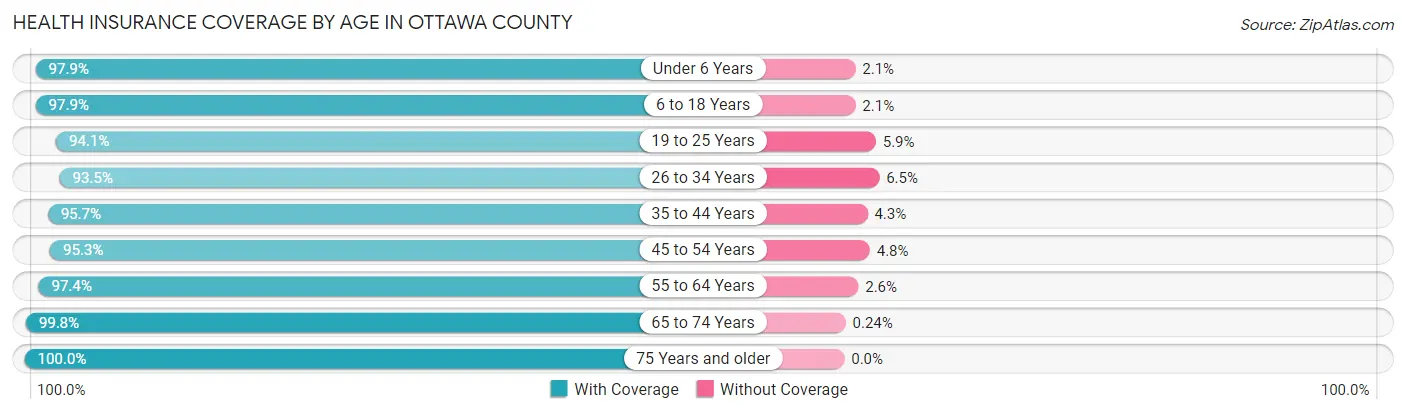
| Age Bracket | With Coverage | Without Coverage |
| Under 6 Years | 20,027 (97.9%) | 422 (2.1%) |
| 6 to 18 Years | 53,671 (97.9%) | 1,133 (2.1%) |
| 19 to 25 Years | 35,193 (94.1%) | 2,195 (5.9%) |
| 26 to 34 Years | 30,176 (93.5%) | 2,101 (6.5%) |
| 35 to 44 Years | 34,162 (95.7%) | 1,543 (4.3%) |
| 45 to 54 Years | 31,377 (95.3%) | 1,566 (4.8%) |
| 55 to 64 Years | 34,411 (97.4%) | 923 (2.6%) |
| 65 to 74 Years | 26,867 (99.8%) | 64 (0.2%) |
| 75 Years and older | 18,820 (100.0%) | 0 (0.0%) |
| Total | 284,704 (96.6%) | 9,947 (3.4%) |
Health Insurance Coverage by Citizenship Status in Ottawa County
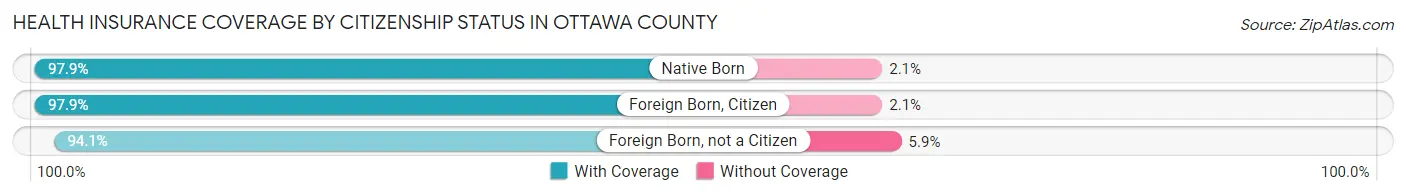
| Citizenship Status | With Coverage | Without Coverage |
| Native Born | 20,027 (97.9%) | 422 (2.1%) |
| Foreign Born, Citizen | 53,671 (97.9%) | 1,133 (2.1%) |
| Foreign Born, not a Citizen | 35,193 (94.1%) | 2,195 (5.9%) |
Health Insurance Coverage by Household Income in Ottawa County
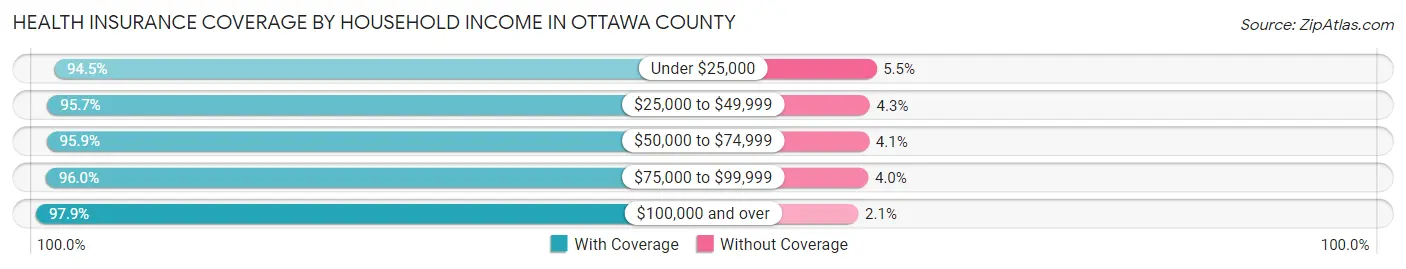
| Household Income | With Coverage | Without Coverage |
| Under $25,000 | 16,352 (94.5%) | 953 (5.5%) |
| $25,000 to $49,999 | 33,280 (95.7%) | 1,489 (4.3%) |
| $50,000 to $74,999 | 41,595 (95.9%) | 1,798 (4.1%) |
| $75,000 to $99,999 | 46,707 (96.0%) | 1,935 (4.0%) |
| $100,000 and over | 139,048 (97.9%) | 3,029 (2.1%) |
Public vs Private Health Insurance Coverage by Age in Ottawa County
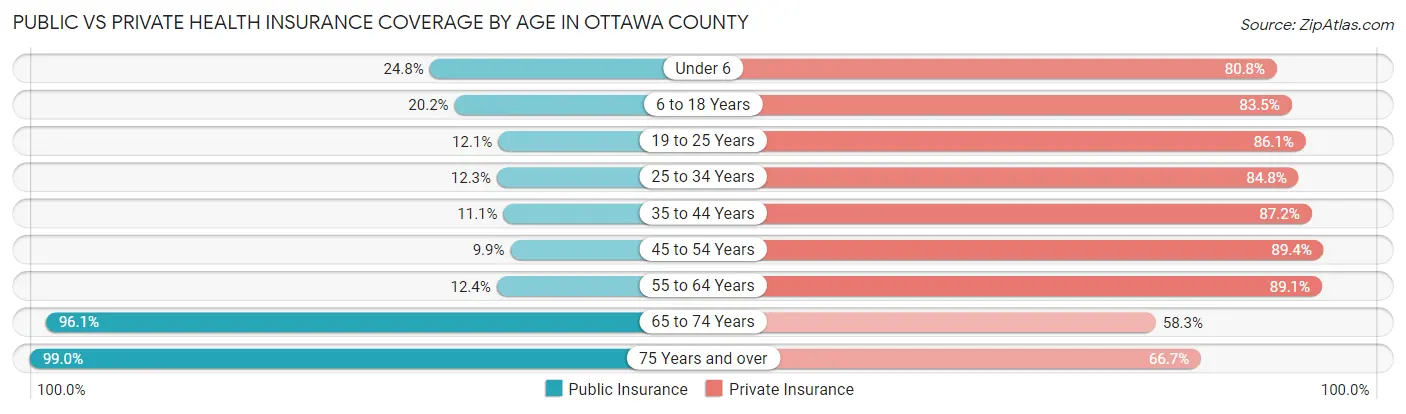
| Age Bracket | Public Insurance | Private Insurance |
| Under 6 | 5,077 (24.8%) | 16,512 (80.7%) |
| 6 to 18 Years | 11,083 (20.2%) | 45,749 (83.5%) |
| 19 to 25 Years | 4,526 (12.1%) | 32,191 (86.1%) |
| 25 to 34 Years | 3,982 (12.3%) | 27,369 (84.8%) |
| 35 to 44 Years | 3,975 (11.1%) | 31,129 (87.2%) |
| 45 to 54 Years | 3,245 (9.9%) | 29,460 (89.4%) |
| 55 to 64 Years | 4,380 (12.4%) | 31,483 (89.1%) |
| 65 to 74 Years | 25,876 (96.1%) | 15,697 (58.3%) |
| 75 Years and over | 18,640 (99.0%) | 12,550 (66.7%) |
| Total | 80,784 (27.4%) | 242,140 (82.2%) |
Disability Status by Sex by Age in Ottawa County
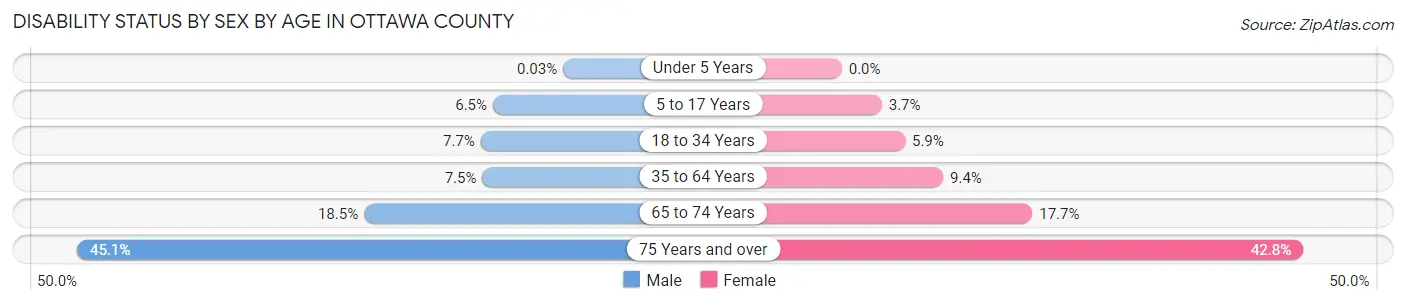
| Age Bracket | Male | Female |
| Under 5 Years | 3 (0.0%) | 0 (0.0%) |
| 5 to 17 Years | 1,757 (6.5%) | 941 (3.7%) |
| 18 to 34 Years | 2,883 (7.7%) | 2,238 (5.9%) |
| 35 to 64 Years | 3,942 (7.5%) | 4,849 (9.4%) |
| 65 to 74 Years | 2,407 (18.5%) | 2,461 (17.7%) |
| 75 Years and over | 3,564 (45.1%) | 4,675 (42.8%) |
Disability Class by Sex by Age in Ottawa County
Disability Class: Hearing Difficulty
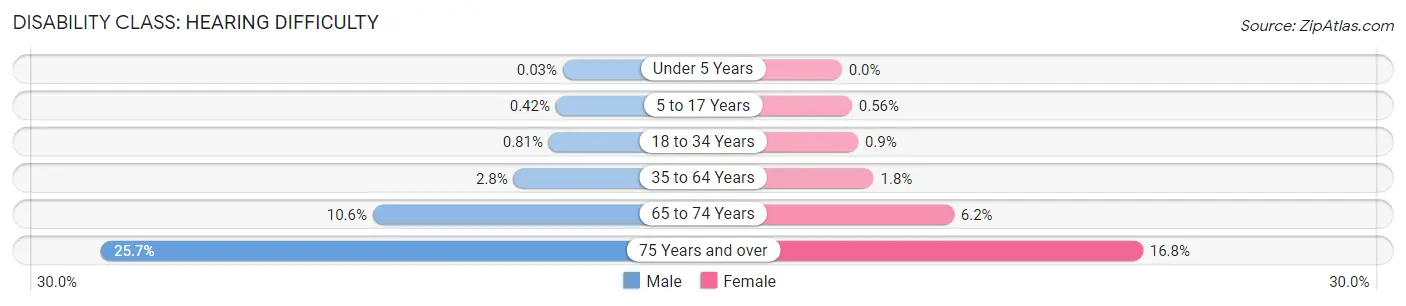
| Age Bracket | Male | Female |
| Under 5 Years | 3 (0.0%) | 0 (0.0%) |
| 5 to 17 Years | 113 (0.4%) | 142 (0.6%) |
| 18 to 34 Years | 303 (0.8%) | 344 (0.9%) |
| 35 to 64 Years | 1,450 (2.8%) | 914 (1.8%) |
| 65 to 74 Years | 1,380 (10.6%) | 869 (6.2%) |
| 75 Years and over | 2,033 (25.7%) | 1,830 (16.8%) |
Disability Class: Vision Difficulty
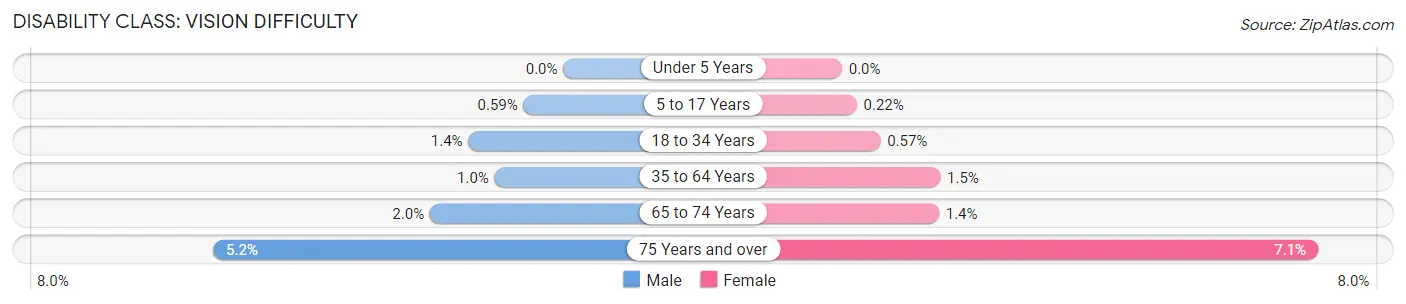
| Age Bracket | Male | Female |
| Under 5 Years | 0 (0.0%) | 0 (0.0%) |
| 5 to 17 Years | 158 (0.6%) | 56 (0.2%) |
| 18 to 34 Years | 528 (1.4%) | 218 (0.6%) |
| 35 to 64 Years | 533 (1.0%) | 754 (1.5%) |
| 65 to 74 Years | 258 (2.0%) | 201 (1.4%) |
| 75 Years and over | 411 (5.2%) | 772 (7.1%) |
Disability Class: Cognitive Difficulty
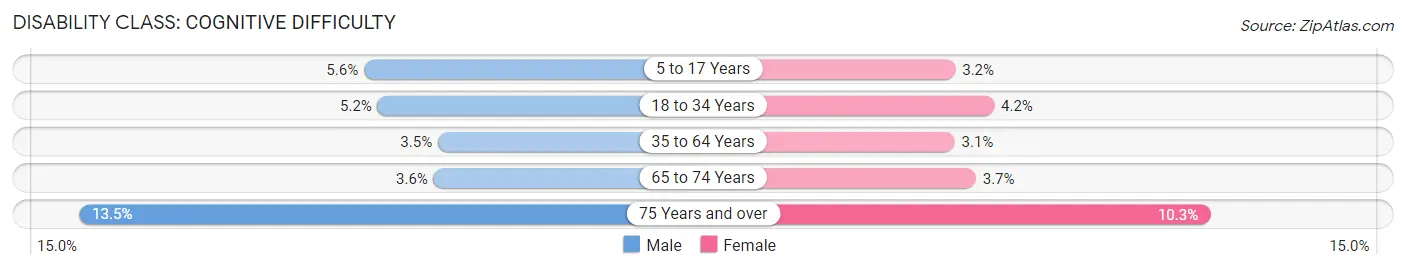
| Age Bracket | Male | Female |
| 5 to 17 Years | 1,492 (5.6%) | 802 (3.2%) |
| 18 to 34 Years | 1,943 (5.2%) | 1,615 (4.2%) |
| 35 to 64 Years | 1,828 (3.5%) | 1,622 (3.1%) |
| 65 to 74 Years | 470 (3.6%) | 519 (3.7%) |
| 75 Years and over | 1,065 (13.5%) | 1,120 (10.2%) |
Disability Class: Ambulatory Difficulty
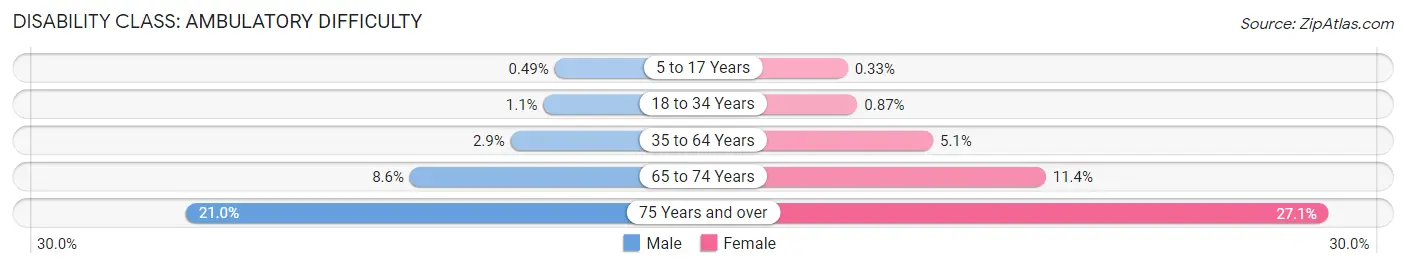
| Age Bracket | Male | Female |
| 5 to 17 Years | 131 (0.5%) | 83 (0.3%) |
| 18 to 34 Years | 418 (1.1%) | 332 (0.9%) |
| 35 to 64 Years | 1,540 (2.9%) | 2,623 (5.1%) |
| 65 to 74 Years | 1,113 (8.6%) | 1,581 (11.4%) |
| 75 Years and over | 1,660 (21.0%) | 2,960 (27.1%) |
Disability Class: Self-Care Difficulty
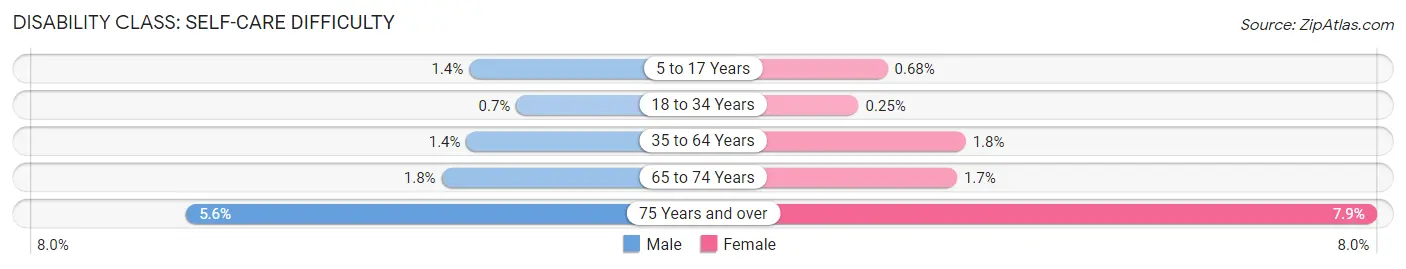
| Age Bracket | Male | Female |
| 5 to 17 Years | 375 (1.4%) | 173 (0.7%) |
| 18 to 34 Years | 262 (0.7%) | 94 (0.3%) |
| 35 to 64 Years | 754 (1.4%) | 947 (1.8%) |
| 65 to 74 Years | 235 (1.8%) | 238 (1.7%) |
| 75 Years and over | 442 (5.6%) | 867 (7.9%) |
Technology Access in Ottawa County
Computing Device Access in Ottawa County
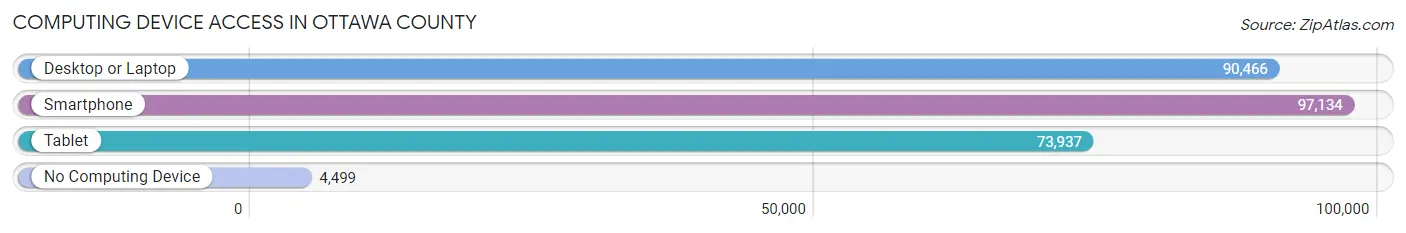
| Device Type | # Households | % Households |
| Desktop or Laptop | 90,466 | 83.5% |
| Smartphone | 97,134 | 89.6% |
| Tablet | 73,937 | 68.2% |
| No Computing Device | 4,499 | 4.2% |
| Total | 108,362 | 100.0% |
Internet Access in Ottawa County
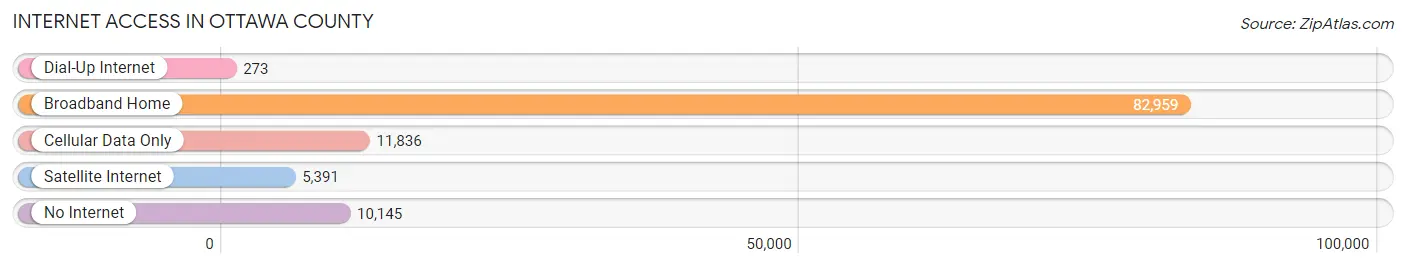
| Internet Type | # Households | % Households |
| Dial-Up Internet | 273 | 0.3% |
| Broadband Home | 82,959 | 76.6% |
| Cellular Data Only | 11,836 | 10.9% |
| Satellite Internet | 5,391 | 5.0% |
| No Internet | 10,145 | 9.4% |
| Total | 108,362 | 100.0% |
Ottawa County Summary
Ottawa County is a county located in the U.S. state of Michigan. As of the 2010 census, the population was 263,801, making it the fourth-most populous county in Michigan. The county seat is Grand Haven. The county was organized in 1837 and is named for the Ottawa Nation. It is located in the west-central portion of the Lower Peninsula of Michigan.
History
Ottawa County was first settled by Europeans in the early 19th century. The first permanent settlement was established in 1834 by a group of Dutch immigrants led by Reverend Albertus Van Raalte. The group established a settlement in what is now Holland, Michigan. The settlement was named after the Netherlands, and the county was named after the Ottawa Nation, a Native American tribe that had inhabited the area for centuries.
The county was officially organized in 1837 and the first county seat was established in Grand Haven. The county was initially divided into two townships, Grand Haven and Port Sheldon. In 1846, the county was divided into four townships: Grand Haven, Port Sheldon, Robinson, and Allendale.
In the late 19th century, the county experienced a period of rapid growth and development. The lumber industry was a major contributor to the county's economy, and the county's population grew rapidly. By 1900, the population had reached nearly 40,000.
Geography
Ottawa County is located in the west-central portion of the Lower Peninsula of Michigan. It is bordered by Lake Michigan to the west, Muskegon County to the north, Allegan County to the east, and Kent County to the south. The county has a total area of 1,631 square miles, of which 1,541 square miles is land and 90 square miles is water.
The county is home to several lakes, including Lake Macatawa, Spring Lake, and Lake Michigan. The county also contains several rivers, including the Grand River, the Muskegon River, and the Kalamazoo River.
Economy
The economy of Ottawa County is largely based on tourism, manufacturing, and agriculture. The county is home to several major employers, including Herman Miller, Haworth, and Gentex. The county is also home to several major tourist attractions, including the Grand Haven State Park, the Grand Haven Lighthouse, and the Grand Haven Musical Fountain.
Agriculture is also an important part of the county's economy. The county is home to several large farms, including dairy farms, vegetable farms, and fruit farms.
Demographics
As of the 2010 census, there were 263,801 people, 97,945 households, and 68,945 families residing in the county. The population density was 170.7 people per square mile. There were 105,945 housing units at an average density of 68.3 per square mile. The racial makeup of the county was 87.2% White, 5.3% African American, 0.7% Native American, 2.2% Asian, 0.1% Pacific Islander, 1.9% from other races, and 2.6% from two or more races. Hispanic or Latino of any race were 5.2% of the population.
The median income for a household in the county was $50,936 and the median income for a family was $63,945. The per capita income for the county was $25,945. About 6.2% of families and 8.7% of the population were below the poverty line, including 11.2% of those under age 18 and 6.2% of those age 65 or over.
Common Questions
What is the Total Population of Ottawa County?
Total Population of Ottawa County is 296,183.
What is the Total Male Population of Ottawa County?
Total Male Population of Ottawa County is 147,228.
What is the Total Female Population of Ottawa County?
Total Female Population of Ottawa County is 148,955.
What is the Ratio of Males per 100 Females in Ottawa County?
There are 98.84 Males per 100 Females in Ottawa County.
What is the Ratio of Females per 100 Males in Ottawa County?
There are 101.17 Females per 100 Males in Ottawa County.
What is the Median Population Age in Ottawa County?
Median Population Age in Ottawa County is 35.8 Years.
What is the Average Family Size in Ottawa County
Average Family Size in Ottawa County is 3.1 People.
What is the Average Household Size in Ottawa County
Average Household Size in Ottawa County is 2.6 People.
What is Per Capita Income in Ottawa County?
Per Capita income in Ottawa County is $39,116.
What is the Median Family Income in Ottawa County?
Median Family Income in Ottawa County is $100,174.
What is the Median Household income in Ottawa County?
Median Household Income in Ottawa County is $83,932.
What is Income or Wage Gap in Ottawa County?
Income or Wage Gap in Ottawa County is 42.8%.
Women in Ottawa County earn 57.2 cents for every dollar earned by a man.
What is Family Income Deficit in Ottawa County?
Family Income Deficit in Ottawa County is $9,126.
Families that are below poverty line in Ottawa County earn $9,126 less on average than the poverty threshold level.
What is Inequality or Gini Index in Ottawa County?
Inequality or Gini Index in Ottawa County is 0.42.
How Large is the Labor Force in Ottawa County?
There are 159,704 People in the Labor Forcein in Ottawa County.
What is the Percentage of People in the Labor Force in Ottawa County?
67.8% of People are in the Labor Force in Ottawa County.
What is the Unemployment Rate in Ottawa County?
Unemployment Rate in Ottawa County is 3.8%.