Oscoda County, MI
Oscoda County Map
Oscoda County Overview
8,264
TOTAL POPULATION
4,231
MALE POPULATION
4,033
FEMALE POPULATION
104.91
MALES / 100 FEMALES
95.32
FEMALES / 100 MALES
52.0
MEDIAN AGE
2.9
AVG FAMILY SIZE
2.4
AVG HOUSEHOLD SIZE
$26,129
PER CAPITA INCOME
$58,234
AVG FAMILY INCOME
$48,692
AVG HOUSEHOLD INCOME
27.2%
WAGE / INCOME GAP [ % ]
72.8¢/ $1
WAGE / INCOME GAP [ $ ]
$10,631
FAMILY INCOME DEFICIT
0.41
INEQUALITY / GINI INDEX
3,046
LABOR FORCE [ PEOPLE ]
44.5%
PERCENT IN LABOR FORCE
8.9%
UNEMPLOYMENT RATE
Oscoda County Area Codes
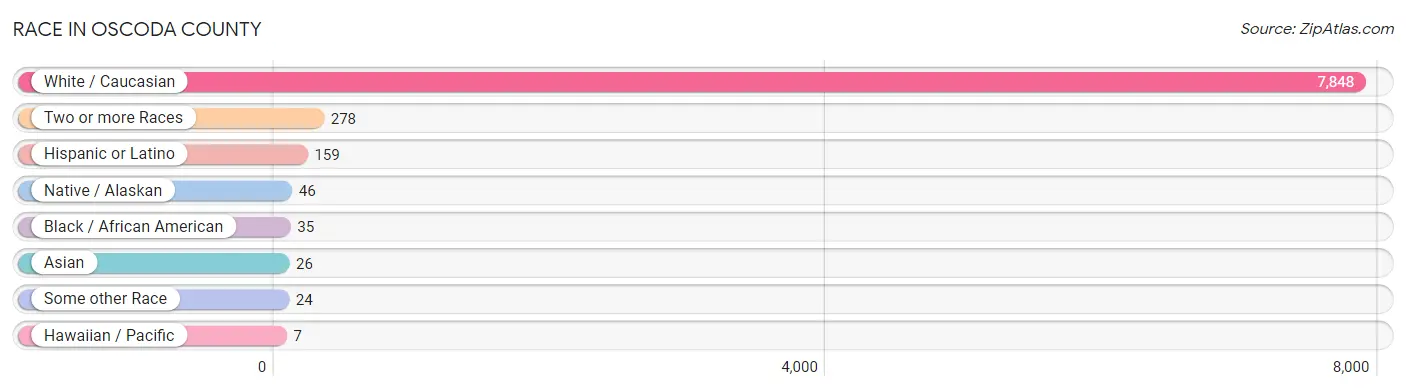
Race in Oscoda County
The most populous races in Oscoda County are White / Caucasian (7,848 | 95.0%), Two or more Races (278 | 3.4%), and Hispanic or Latino (159 | 1.9%).
| Race | # Population | % Population |
| Asian | 26 | 0.3% |
| Black / African American | 35 | 0.4% |
| Hawaiian / Pacific | 7 | 0.1% |
| Hispanic or Latino | 159 | 1.9% |
| Native / Alaskan | 46 | 0.6% |
| White / Caucasian | 7,848 | 95.0% |
| Two or more Races | 278 | 3.4% |
| Some other Race | 24 | 0.3% |
| Total | 8,264 | 100.0% |
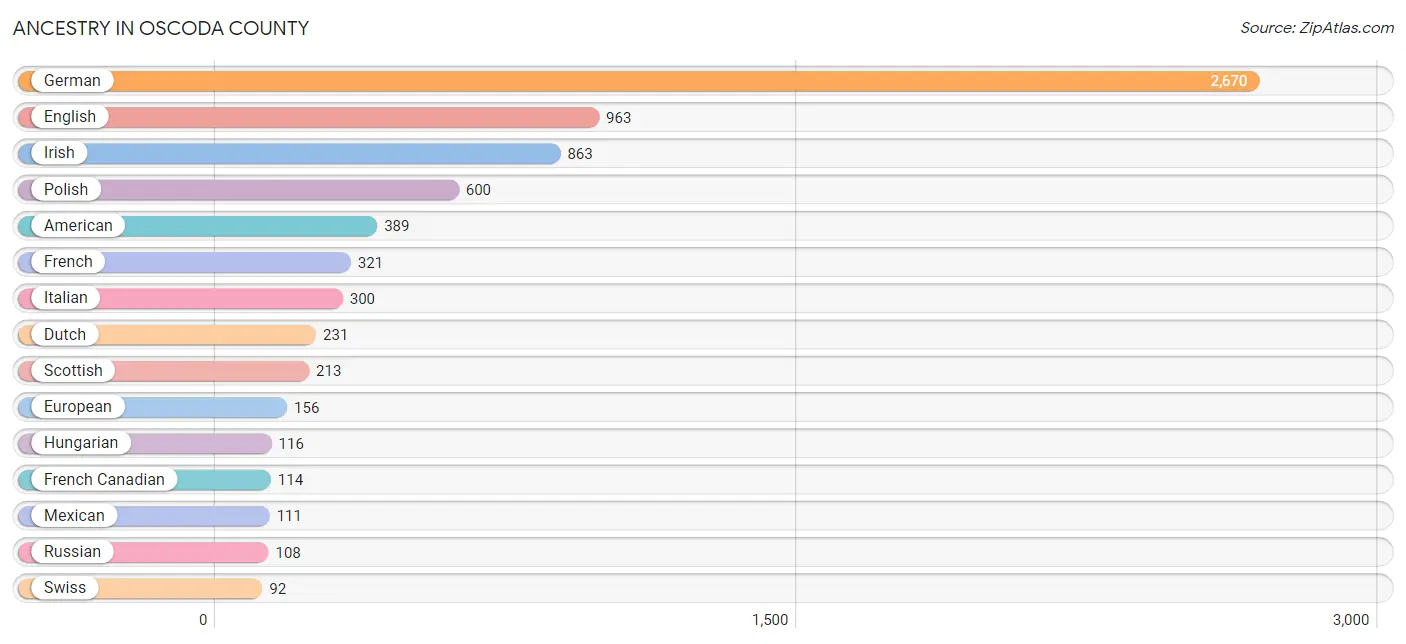
Ancestry in Oscoda County
The most populous ancestries reported in Oscoda County are German (2,670 | 32.3%), English (963 | 11.7%), Irish (863 | 10.4%), Polish (600 | 7.3%), and American (389 | 4.7%), together accounting for 66.4% of all Oscoda County residents.
| Ancestry | # Population | % Population |
| American | 389 | 4.7% |
| Apache | 12 | 0.2% |
| Arab | 3 | 0.0% |
| Austrian | 10 | 0.1% |
| Belgian | 22 | 0.3% |
| Blackfeet | 12 | 0.2% |
| British | 56 | 0.7% |
| Canadian | 54 | 0.6% |
| Central American | 19 | 0.2% |
| Central American Indian | 3 | 0.0% |
| Cherokee | 27 | 0.3% |
| Chippewa | 11 | 0.1% |
| Cree | 5 | 0.1% |
| Cuban | 7 | 0.1% |
| Czech | 8 | 0.1% |
| Danish | 33 | 0.4% |
| Dutch | 231 | 2.8% |
| Eastern European | 3 | 0.0% |
| English | 963 | 11.7% |
| European | 156 | 1.9% |
| Finnish | 62 | 0.7% |
| French | 321 | 3.9% |
| French American Indian | 1 | 0.0% |
| French Canadian | 114 | 1.4% |
| German | 2,670 | 32.3% |
| Greek | 33 | 0.4% |
| Guatemalan | 16 | 0.2% |
| Honduran | 3 | 0.0% |
| Hungarian | 116 | 1.4% |
| Indian (Asian) | 20 | 0.2% |
| Irish | 863 | 10.4% |
| Iroquois | 8 | 0.1% |
| Italian | 300 | 3.6% |
| Korean | 3 | 0.0% |
| Lebanese | 3 | 0.0% |
| Lithuanian | 28 | 0.3% |
| Mexican | 111 | 1.3% |
| Northern European | 6 | 0.1% |
| Norwegian | 40 | 0.5% |
| Ottawa | 20 | 0.2% |
| Pennsylvania German | 13 | 0.2% |
| Polish | 600 | 7.3% |
| Potawatomi | 25 | 0.3% |
| Puerto Rican | 19 | 0.2% |
| Russian | 108 | 1.3% |
| Scandinavian | 29 | 0.4% |
| Scotch-Irish | 33 | 0.4% |
| Scottish | 213 | 2.6% |
| Sioux | 11 | 0.1% |
| Slovak | 10 | 0.1% |
| Sri Lankan | 3 | 0.0% |
| Swedish | 87 | 1.1% |
| Swiss | 92 | 1.1% |
| U.S. Virgin Islander | 4 | 0.1% |
| Ukrainian | 30 | 0.4% |
| Welsh | 52 | 0.6% |
| Yugoslavian | 17 | 0.2% | View All 57 Rows |
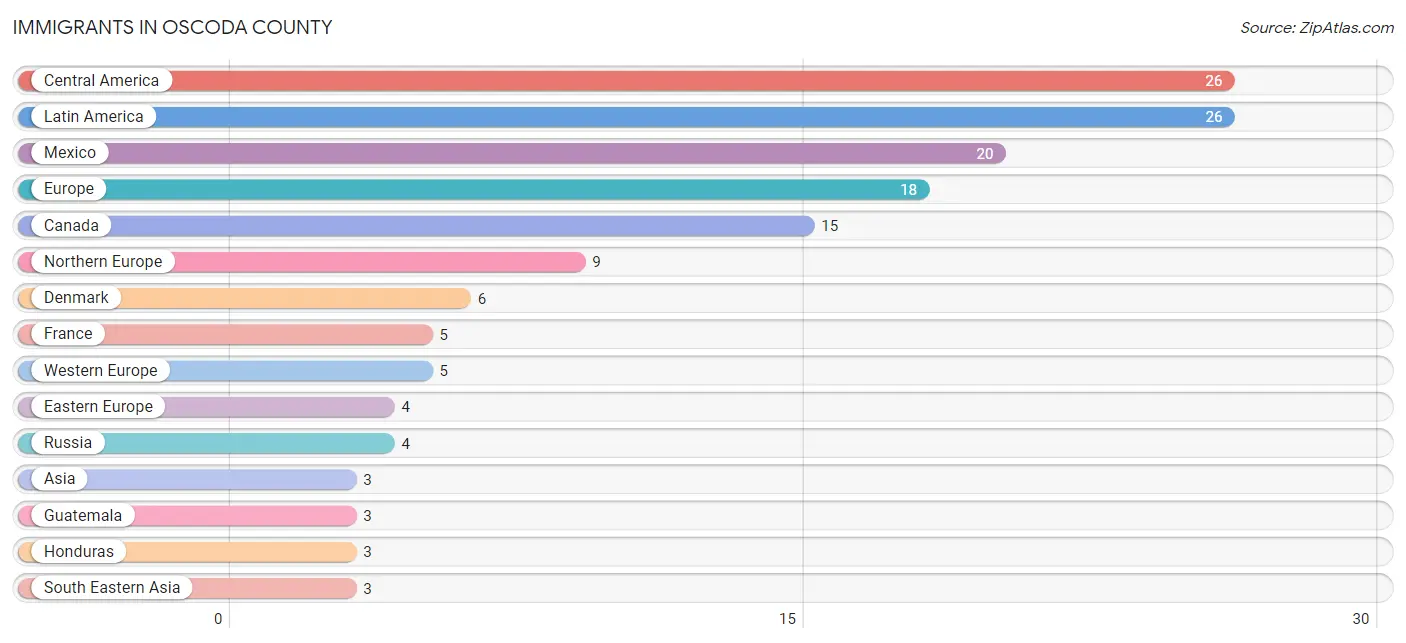
Immigrants in Oscoda County
The most numerous immigrant groups reported in Oscoda County came from Central America (26 | 0.3%), Latin America (26 | 0.3%), Mexico (20 | 0.2%), Europe (18 | 0.2%), and Canada (15 | 0.2%), together accounting for 1.3% of all Oscoda County residents.
| Immigration Origin | # Population | % Population |
| Asia | 3 | 0.0% |
| Canada | 15 | 0.2% |
| Central America | 26 | 0.3% |
| Denmark | 6 | 0.1% |
| Eastern Europe | 4 | 0.1% |
| Europe | 18 | 0.2% |
| France | 5 | 0.1% |
| Guatemala | 3 | 0.0% |
| Honduras | 3 | 0.0% |
| Latin America | 26 | 0.3% |
| Mexico | 20 | 0.2% |
| Northern Europe | 9 | 0.1% |
| Russia | 4 | 0.1% |
| South Eastern Asia | 3 | 0.0% |
| Vietnam | 3 | 0.0% |
| Western Europe | 5 | 0.1% | View All 16 Rows |
Sex and Age in Oscoda County
Sex and Age in Oscoda County
The most populous age groups in Oscoda County are 65 to 69 Years (443 | 10.5%) for men and 60 to 64 Years (425 | 10.5%) for women.

| Age Bracket | Male | Female |
| Under 5 Years | 213 (5.0%) | 220 (5.4%) |
| 5 to 9 Years | 287 (6.8%) | 174 (4.3%) |
| 10 to 14 Years | 206 (4.9%) | 249 (6.2%) |
| 15 to 19 Years | 231 (5.5%) | 193 (4.8%) |
| 20 to 24 Years | 171 (4.0%) | 160 (4.0%) |
| 25 to 29 Years | 177 (4.2%) | 172 (4.3%) |
| 30 to 34 Years | 176 (4.2%) | 182 (4.5%) |
| 35 to 39 Years | 188 (4.4%) | 118 (2.9%) |
| 40 to 44 Years | 220 (5.2%) | 243 (6.0%) |
| 45 to 49 Years | 177 (4.2%) | 171 (4.2%) |
| 50 to 54 Years | 224 (5.3%) | 228 (5.7%) |
| 55 to 59 Years | 351 (8.3%) | 340 (8.4%) |
| 60 to 64 Years | 427 (10.1%) | 425 (10.5%) |
| 65 to 69 Years | 443 (10.5%) | 342 (8.5%) |
| 70 to 74 Years | 302 (7.1%) | 338 (8.4%) |
| 75 to 79 Years | 198 (4.7%) | 208 (5.2%) |
| 80 to 84 Years | 130 (3.1%) | 124 (3.1%) |
| 85 Years and over | 110 (2.6%) | 146 (3.6%) |
| Total | 4,231 (100.0%) | 4,033 (100.0%) |
Families and Households in Oscoda County
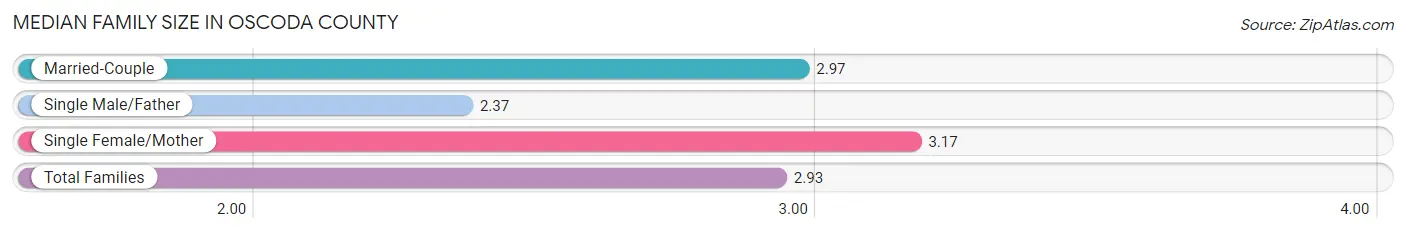
Median Family Size in Oscoda County
The median family size in Oscoda County is 2.93 persons per family, with single female/mother families (244 | 11.2%) accounting for the largest median family size of 3.17 persons per family. On the other hand, single male/father families (212 | 9.7%) represent the smallest median family size with 2.37 persons per family.
| Family Type | # Families | Family Size |
| Married-Couple | 1,729 (79.1%) | 2.97 |
| Single Male/Father | 212 (9.7%) | 2.37 |
| Single Female/Mother | 244 (11.2%) | 3.17 |
| Total Families | 2,185 (100.0%) | 2.93 |
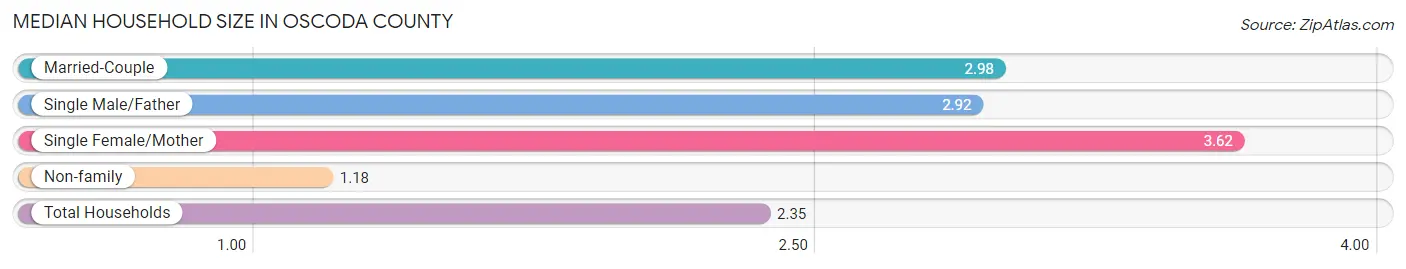
Median Household Size in Oscoda County
The median household size in Oscoda County is 2.35 persons per household, with single female/mother households (244 | 7.0%) accounting for the largest median household size of 3.62 persons per household. non-family households (1,315 | 37.6%) represent the smallest median household size with 1.18 persons per household.
| Household Type | # Households | Household Size |
| Married-Couple | 1,729 (49.4%) | 2.98 |
| Single Male/Father | 212 (6.1%) | 2.92 |
| Single Female/Mother | 244 (7.0%) | 3.62 |
| Non-family | 1,315 (37.6%) | 1.18 |
| Total Households | 3,500 (100.0%) | 2.35 |
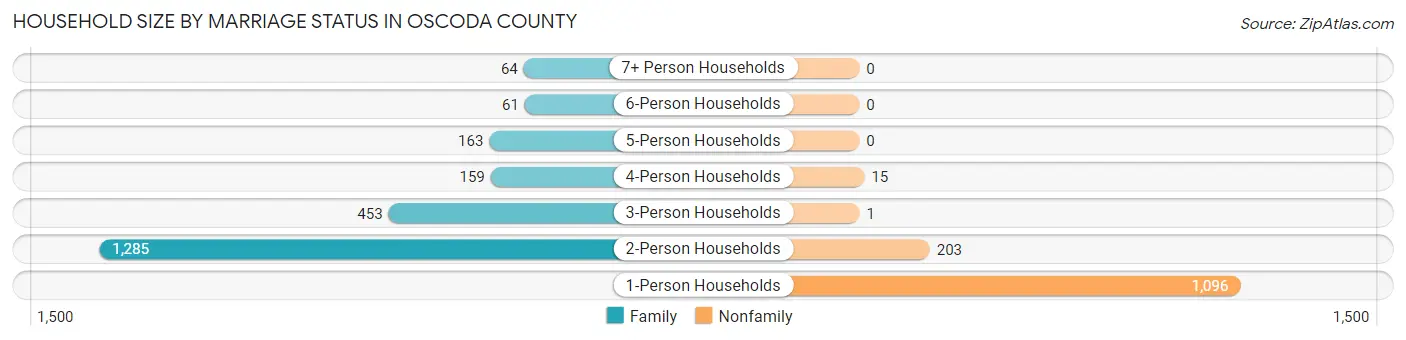
Household Size by Marriage Status in Oscoda County
Out of a total of 3,500 households in Oscoda County, 2,185 (62.4%) are family households, while 1,315 (37.6%) are nonfamily households. The most numerous type of family households are 2-person households, comprising 1,285, and the most common type of nonfamily households are 1-person households, comprising 1,096.
| Household Size | Family Households | Nonfamily Households |
| 1-Person Households | - | 1,096 (31.3%) |
| 2-Person Households | 1,285 (36.7%) | 203 (5.8%) |
| 3-Person Households | 453 (12.9%) | 1 (0.0%) |
| 4-Person Households | 159 (4.5%) | 15 (0.4%) |
| 5-Person Households | 163 (4.7%) | 0 (0.0%) |
| 6-Person Households | 61 (1.7%) | 0 (0.0%) |
| 7+ Person Households | 64 (1.8%) | 0 (0.0%) |
| Total | 2,185 (62.4%) | 1,315 (37.6%) |
Female Fertility in Oscoda County
Fertility by Age in Oscoda County
Average fertility rate in Oscoda County is 28.0 births per 1,000 women. Women in the age bracket of 20 to 34 years have the highest fertility rate with 56.0 births per 1,000 women. Women in the age bracket of 20 to 34 years acount for 80.6% of all women with births.

| Age Bracket | Women with Births | Births / 1,000 Women |
| 15 to 19 years | 0 (0.0%) | 0.0 |
| 20 to 34 years | 29 (80.6%) | 56.0 |
| 35 to 50 years | 7 (19.4%) | 12.0 |
| Total | 36 (100.0%) | 28.0 |
Fertility by Age by Marriage Status in Oscoda County
72.2% of women with births (36) in Oscoda County are married. The highest percentage of unmarried women with births falls into 20 to 34 years age bracket with 34.5% of them unmarried at the time of birth, while the lowest percentage of unmarried women with births belong to 35 to 50 years age bracket with 0.0% of them unmarried.

| Age Bracket | Married | Unmarried |
| 15 to 19 years | 0 (0.0%) | 0 (0.0%) |
| 20 to 34 years | 19 (65.5%) | 10 (34.5%) |
| 35 to 50 years | 7 (100.0%) | 0 (0.0%) |
| Total | 26 (72.2%) | 10 (27.8%) |
Fertility by Education in Oscoda County

| Educational Attainment | Women with Births | Births / 1,000 Women |
| Less than High School | 3 (8.3%) | 8.0 |
| High School Diploma | 7 (19.4%) | 23.0 |
| College or Associate's Degree | 11 (30.6%) | 25.0 |
| Bachelor's Degree | 15 (41.7%) | 176.0 |
| Graduate Degree | 0 (0.0%) | 0.0 |
| Total | 36 (100.0%) | 28.0 |
Fertility by Education by Marriage Status in Oscoda County
27.8% of women with births in Oscoda County are unmarried. Women with the educational attainment of less than high school are most likely to be married with 100.0% of them married at childbirth, while women with the educational attainment of college or associate's degree are least likely to be married with 63.6% of them unmarried at childbirth.

| Educational Attainment | Married | Unmarried |
| Less than High School | 3 (100.0%) | 0 (0.0%) |
| High School Diploma | 4 (57.1%) | 3 (42.9%) |
| College or Associate's Degree | 4 (36.4%) | 7 (63.6%) |
| Bachelor's Degree | 15 (100.0%) | 0 (0.0%) |
| Graduate Degree | 0 (0.0%) | 0 (0.0%) |
| Total | 26 (72.2%) | 10 (27.8%) |
Income in Oscoda County
Income Overview in Oscoda County
Per Capita Income in Oscoda County is $26,129, while median incomes of families and households are $58,234 and $48,692 respectively.
| Characteristic | Number | Measure |
| Per Capita Income | 8,264 | $26,129 |
| Median Family Income | 2,185 | $58,234 |
| Mean Family Income | 2,185 | $69,323 |
| Median Household Income | 3,500 | $48,692 |
| Mean Household Income | 3,500 | $59,781 |
| Income Deficit | 2,185 | $10,631 |
| Wage / Income Gap (%) | 8,264 | 27.16% |
| Wage / Income Gap ($) | 8,264 | 72.84¢ per $1 |
| Gini / Inequality Index | 8,264 | 0.41 |
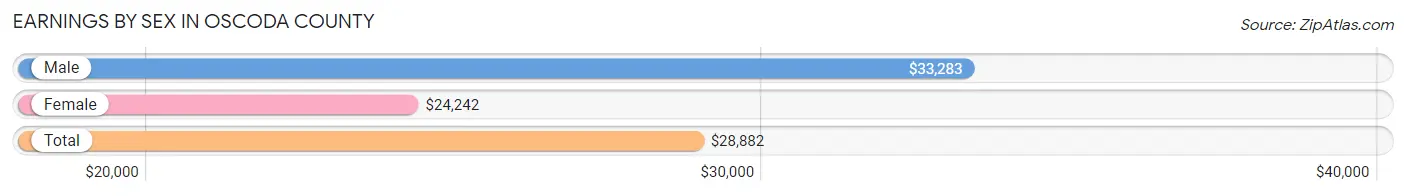
Earnings by Sex in Oscoda County
Average Earnings in Oscoda County are $28,882, $33,283 for men and $24,242 for women, a difference of 27.2%.
| Sex | Number | Average Earnings |
| Male | 1,803 (54.1%) | $33,283 |
| Female | 1,529 (45.9%) | $24,242 |
| Total | 3,332 (100.0%) | $28,882 |
Earnings by Sex by Income Bracket in Oscoda County
The most common earnings brackets in Oscoda County are $55,000 to $64,999 for men (154 | 8.5%) and $30,000 to $34,999 for women (178 | 11.6%).
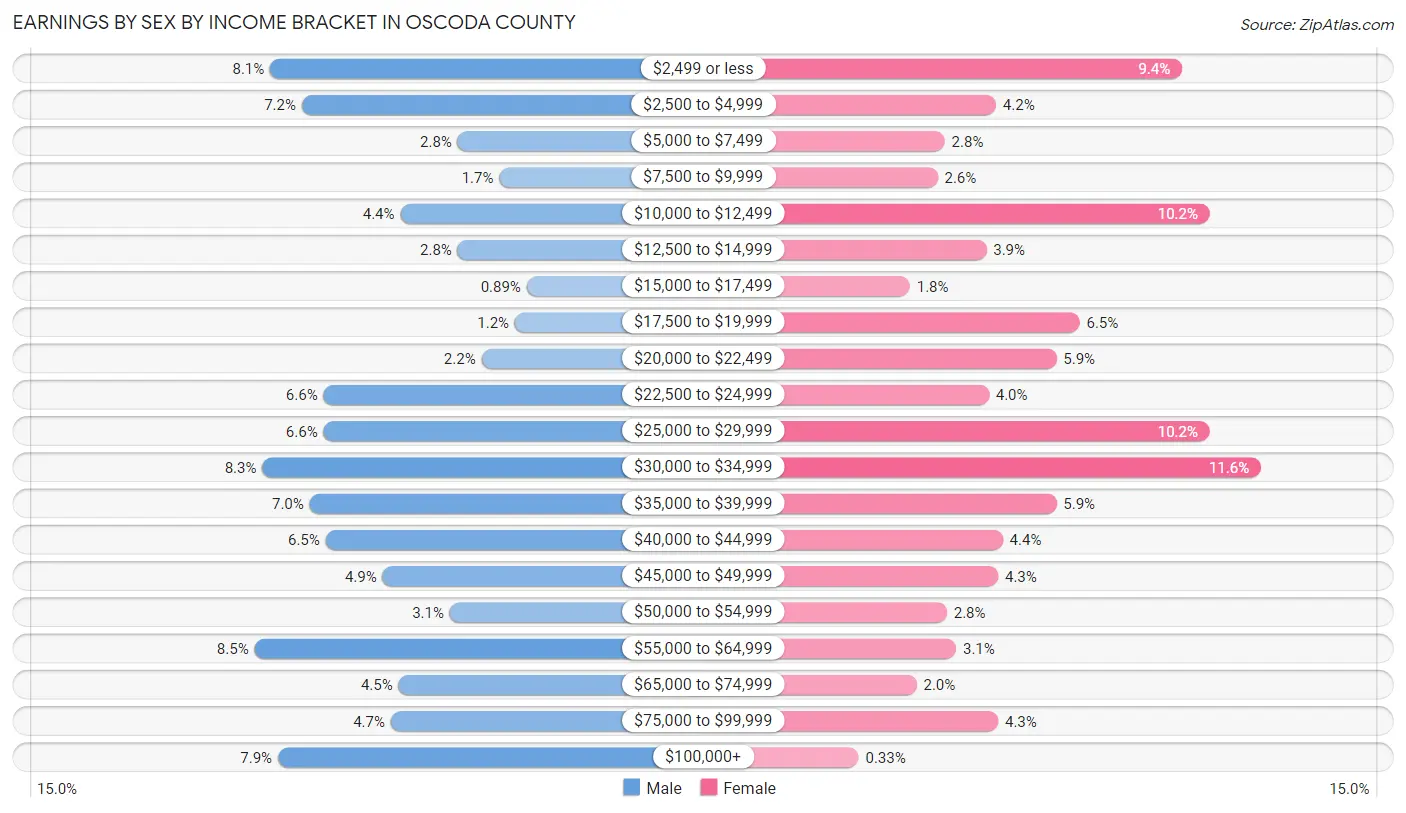
| Income | Male | Female |
| $2,499 or less | 146 (8.1%) | 144 (9.4%) |
| $2,500 to $4,999 | 130 (7.2%) | 64 (4.2%) |
| $5,000 to $7,499 | 51 (2.8%) | 42 (2.8%) |
| $7,500 to $9,999 | 30 (1.7%) | 39 (2.5%) |
| $10,000 to $12,499 | 80 (4.4%) | 156 (10.2%) |
| $12,500 to $14,999 | 51 (2.8%) | 60 (3.9%) |
| $15,000 to $17,499 | 16 (0.9%) | 27 (1.8%) |
| $17,500 to $19,999 | 22 (1.2%) | 100 (6.5%) |
| $20,000 to $22,499 | 39 (2.2%) | 90 (5.9%) |
| $22,500 to $24,999 | 119 (6.6%) | 61 (4.0%) |
| $25,000 to $29,999 | 119 (6.6%) | 156 (10.2%) |
| $30,000 to $34,999 | 150 (8.3%) | 178 (11.6%) |
| $35,000 to $39,999 | 126 (7.0%) | 90 (5.9%) |
| $40,000 to $44,999 | 118 (6.5%) | 67 (4.4%) |
| $45,000 to $49,999 | 89 (4.9%) | 65 (4.3%) |
| $50,000 to $54,999 | 55 (3.0%) | 43 (2.8%) |
| $55,000 to $64,999 | 154 (8.5%) | 47 (3.1%) |
| $65,000 to $74,999 | 81 (4.5%) | 30 (2.0%) |
| $75,000 to $99,999 | 85 (4.7%) | 65 (4.3%) |
| $100,000+ | 142 (7.9%) | 5 (0.3%) |
| Total | 1,803 (100.0%) | 1,529 (100.0%) |
Earnings by Sex by Educational Attainment in Oscoda County
Average earnings in Oscoda County are $35,938 for men and $27,394 for women, a difference of 23.8%. Men with an educational attainment of graduate degree enjoy the highest average annual earnings of $51,250, while those with less than high school education earn the least with $34,479. Women with an educational attainment of graduate degree earn the most with the average annual earnings of $55,750, while those with less than high school education have the smallest earnings of $10,817.
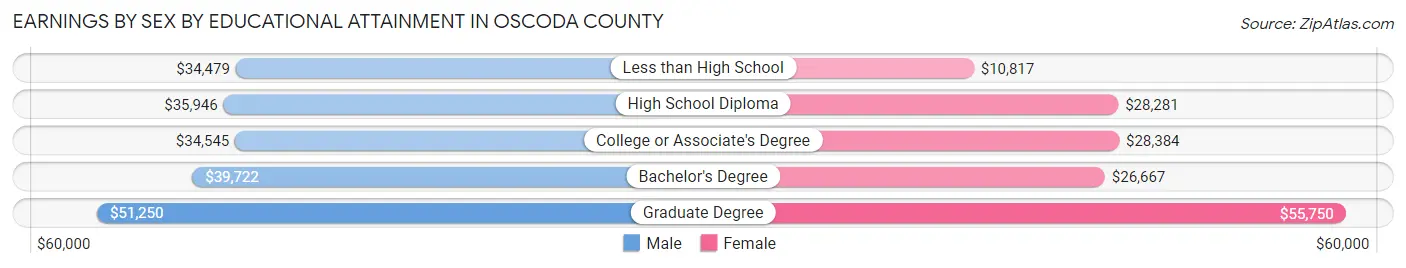
| Educational Attainment | Male Income | Female Income |
| Less than High School | $34,479 | $10,817 |
| High School Diploma | $35,946 | $28,281 |
| College or Associate's Degree | $34,545 | $28,384 |
| Bachelor's Degree | $39,722 | $26,667 |
| Graduate Degree | $51,250 | $55,750 |
| Total | $35,938 | $27,394 |
Family Income in Oscoda County
Family Income Brackets in Oscoda County
According to the Oscoda County family income data, there are 520 families falling into the $50,000 to $74,999 income range, which is the most common income bracket and makes up 23.8% of all families. Conversely, the $200,000+ income bracket is the least frequent group with only 42 families (1.9%) belonging to this category.
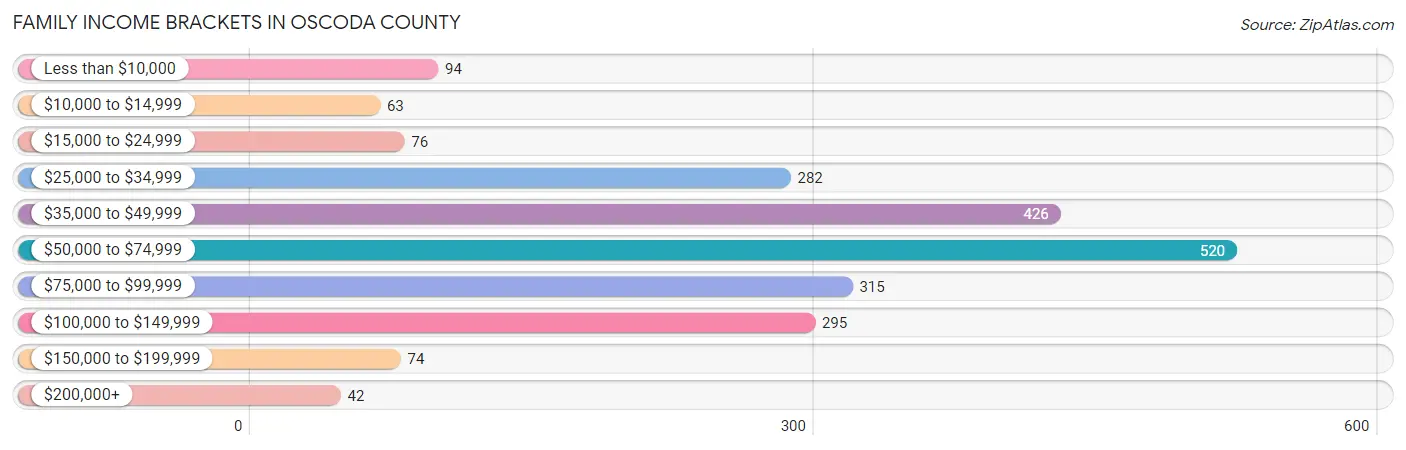
| Income Bracket | # Families | % Families |
| Less than $10,000 | 94 | 4.3% |
| $10,000 to $14,999 | 63 | 2.9% |
| $15,000 to $24,999 | 76 | 3.5% |
| $25,000 to $34,999 | 282 | 12.9% |
| $35,000 to $49,999 | 426 | 19.5% |
| $50,000 to $74,999 | 520 | 23.8% |
| $75,000 to $99,999 | 315 | 14.4% |
| $100,000 to $149,999 | 295 | 13.5% |
| $150,000 to $199,999 | 74 | 3.4% |
| $200,000+ | 42 | 1.9% |
Family Income by Famaliy Size in Oscoda County
5-person families (154 | 7.0%) account for the highest median family income in Oscoda County with $75,179 per family, while 2-person families (1,424 | 65.2%) have the highest median income of $24,930 per family member.
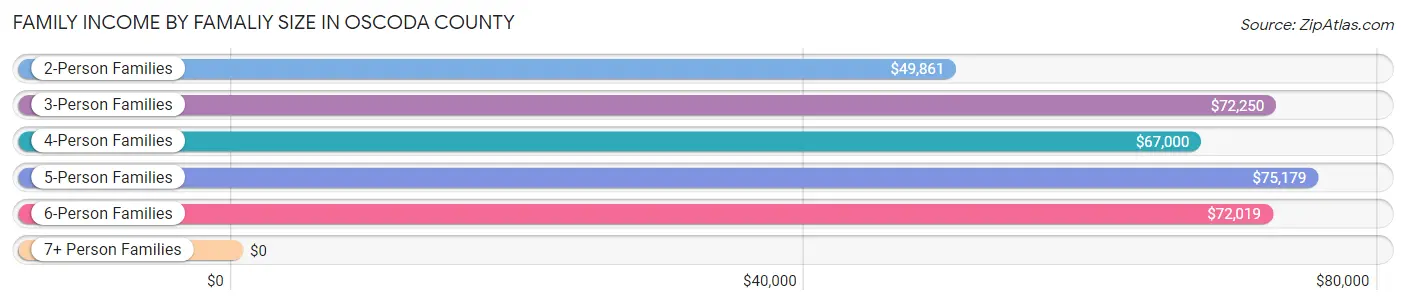
| Income Bracket | # Families | Median Income |
| 2-Person Families | 1,424 (65.2%) | $49,861 |
| 3-Person Families | 355 (16.3%) | $72,250 |
| 4-Person Families | 152 (7.0%) | $67,000 |
| 5-Person Families | 154 (7.0%) | $75,179 |
| 6-Person Families | 48 (2.2%) | $72,019 |
| 7+ Person Families | 52 (2.4%) | $0 |
| Total | 2,185 (100.0%) | $58,234 |
Family Income by Number of Earners in Oscoda County
The median family income in Oscoda County is $58,234, with families comprising 3+ earners (149) having the highest median family income of $79,083, while families with no earners (790) have the lowest median family income of $39,816, accounting for 6.8% and 36.2% of families, respectively.
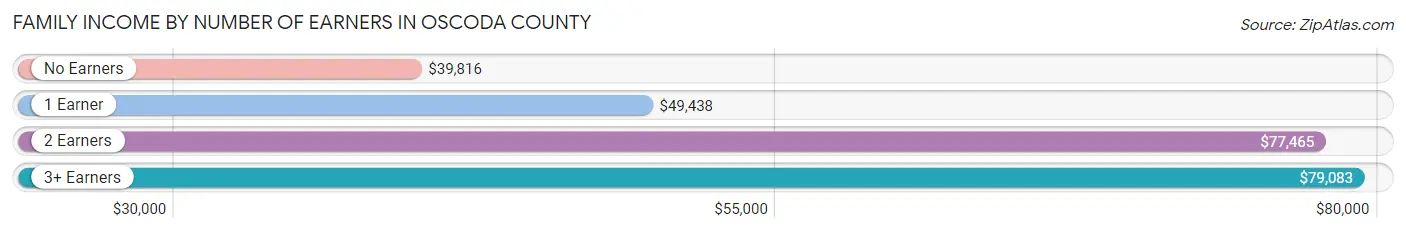
| Number of Earners | # Families | Median Income |
| No Earners | 790 (36.2%) | $39,816 |
| 1 Earner | 661 (30.2%) | $49,438 |
| 2 Earners | 585 (26.8%) | $77,465 |
| 3+ Earners | 149 (6.8%) | $79,083 |
| Total | 2,185 (100.0%) | $58,234 |
Household Income in Oscoda County
Household Income Brackets in Oscoda County
With 784 households falling in the category, the $50,000 to $74,999 income range is the most frequent in Oscoda County, accounting for 22.4% of all households. In contrast, only 52 households (1.5%) fall into the $200,000+ income bracket, making it the least populous group.
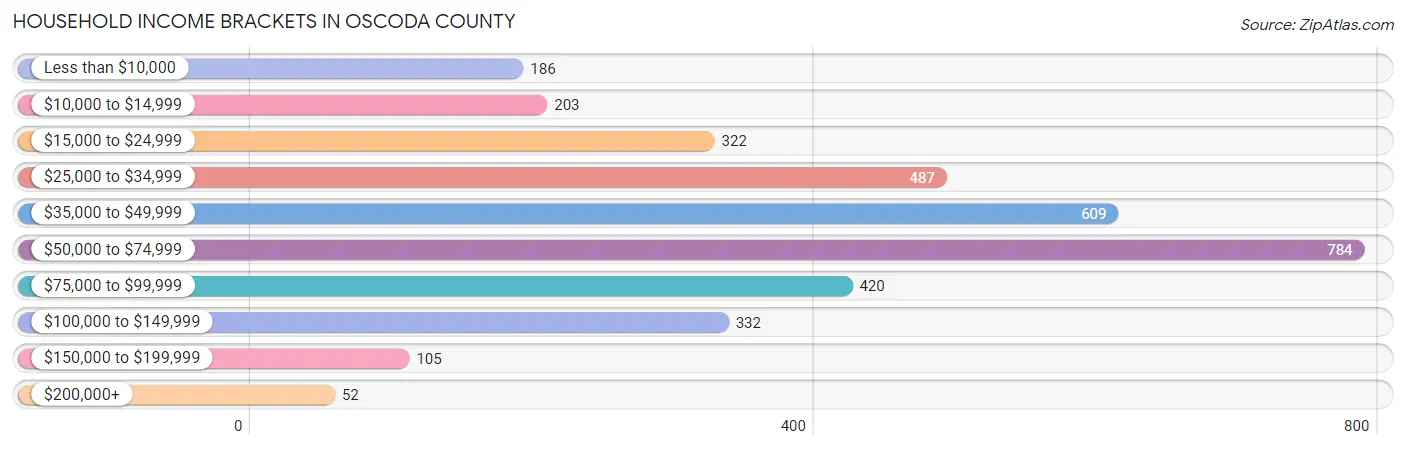
| Income Bracket | # Households | % Households |
| Less than $10,000 | 186 | 5.3% |
| $10,000 to $14,999 | 203 | 5.8% |
| $15,000 to $24,999 | 322 | 9.2% |
| $25,000 to $34,999 | 487 | 13.9% |
| $35,000 to $49,999 | 609 | 17.4% |
| $50,000 to $74,999 | 784 | 22.4% |
| $75,000 to $99,999 | 420 | 12.0% |
| $100,000 to $149,999 | 332 | 9.5% |
| $150,000 to $199,999 | 105 | 3.0% |
| $200,000+ | 52 | 1.5% |
Household Income by Householder Age in Oscoda County
The median household income in Oscoda County is $48,692, with the highest median household income of $62,000 found in the 25 to 44 years age bracket for the primary householder. A total of 608 households (17.4%) fall into this category. Meanwhile, the 65+ years age bracket for the primary householder has the lowest median household income of $39,233, with 1,530 households (43.7%) in this group.

| Income Bracket | # Households | Median Income |
| 15 to 24 Years | 75 (2.1%) | $44,886 |
| 25 to 44 Years | 608 (17.4%) | $62,000 |
| 45 to 64 Years | 1,287 (36.8%) | $55,117 |
| 65+ Years | 1,530 (43.7%) | $39,233 |
| Total | 3,500 (100.0%) | $48,692 |
Poverty in Oscoda County
Income Below Poverty by Sex and Age in Oscoda County
With 14.0% poverty level for males and 13.8% for females among the residents of Oscoda County, 15 year old males and 35 to 44 year old females are the most vulnerable to poverty, with 9 males (47.4%) and 93 females (25.8%) in their respective age groups living below the poverty level.
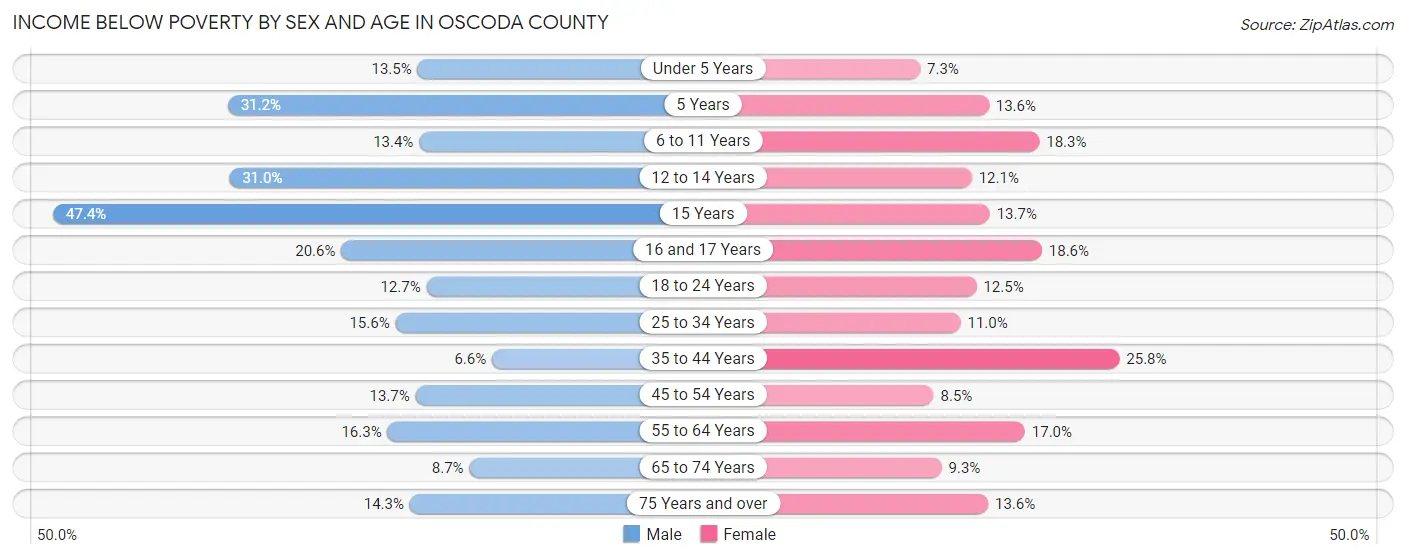
| Age Bracket | Male | Female |
| Under 5 Years | 28 (13.5%) | 16 (7.3%) |
| 5 Years | 19 (31.1%) | 3 (13.6%) |
| 6 to 11 Years | 36 (13.4%) | 44 (18.3%) |
| 12 to 14 Years | 49 (31.0%) | 17 (12.1%) |
| 15 Years | 9 (47.4%) | 7 (13.7%) |
| 16 and 17 Years | 27 (20.6%) | 13 (18.6%) |
| 18 to 24 Years | 32 (12.7%) | 29 (12.5%) |
| 25 to 34 Years | 55 (15.6%) | 39 (11.0%) |
| 35 to 44 Years | 27 (6.6%) | 93 (25.8%) |
| 45 to 54 Years | 55 (13.7%) | 34 (8.5%) |
| 55 to 64 Years | 127 (16.3%) | 130 (17.0%) |
| 65 to 74 Years | 65 (8.7%) | 63 (9.3%) |
| 75 Years and over | 60 (14.2%) | 62 (13.6%) |
| Total | 589 (14.0%) | 550 (13.8%) |
Income Above Poverty by Sex and Age in Oscoda County
According to the poverty statistics in Oscoda County, males aged 35 to 44 years and females aged under 5 years are the age groups that are most secure financially, with 93.4% of males and 92.7% of females in these age groups living above the poverty line.
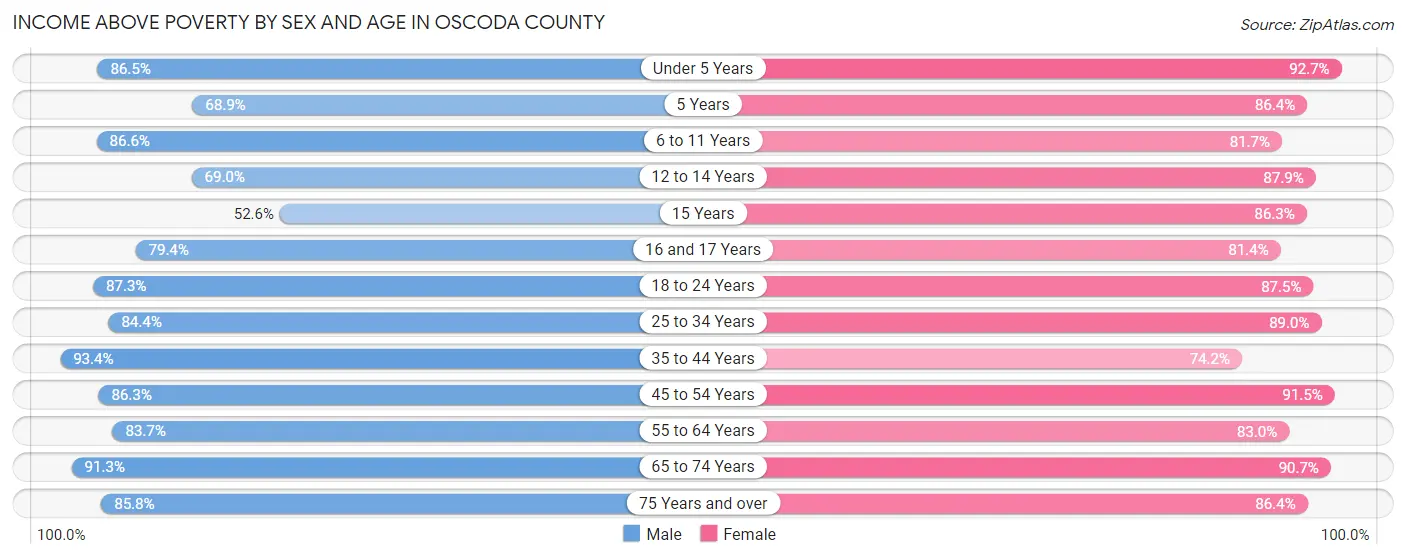
| Age Bracket | Male | Female |
| Under 5 Years | 179 (86.5%) | 204 (92.7%) |
| 5 Years | 42 (68.9%) | 19 (86.4%) |
| 6 to 11 Years | 233 (86.6%) | 196 (81.7%) |
| 12 to 14 Years | 109 (69.0%) | 124 (87.9%) |
| 15 Years | 10 (52.6%) | 44 (86.3%) |
| 16 and 17 Years | 104 (79.4%) | 57 (81.4%) |
| 18 to 24 Years | 220 (87.3%) | 203 (87.5%) |
| 25 to 34 Years | 298 (84.4%) | 315 (89.0%) |
| 35 to 44 Years | 381 (93.4%) | 268 (74.2%) |
| 45 to 54 Years | 346 (86.3%) | 365 (91.5%) |
| 55 to 64 Years | 651 (83.7%) | 635 (83.0%) |
| 65 to 74 Years | 680 (91.3%) | 617 (90.7%) |
| 75 Years and over | 361 (85.8%) | 395 (86.4%) |
| Total | 3,614 (86.0%) | 3,442 (86.2%) |
Income Below Poverty Among Married-Couple Families in Oscoda County
The poverty statistics for married-couple families in Oscoda County show that 7.5% or 130 of the total 1,729 families live below the poverty line. Families with no children have the highest poverty rate of 8.0%, comprising of 103 families. On the other hand, families with 5 or more children have the lowest poverty rate of 0.0%, which includes 0 families.

| Children | Above Poverty | Below Poverty |
| No Children | 1,190 (92.0%) | 103 (8.0%) |
| 1 or 2 Children | 268 (92.1%) | 23 (7.9%) |
| 3 or 4 Children | 117 (96.7%) | 4 (3.3%) |
| 5 or more Children | 24 (100.0%) | 0 (0.0%) |
| Total | 1,599 (92.5%) | 130 (7.5%) |
Income Below Poverty Among Single-Parent Households in Oscoda County
According to the poverty data in Oscoda County, 10.4% or 22 single-father households and 25.4% or 62 single-mother households are living below the poverty line. Among single-father households, those with 1 or 2 children have the highest poverty rate, with 19 households (19.4%) experiencing poverty. Likewise, among single-mother households, those with 5 or more children have the highest poverty rate, with 6 households (66.7%) falling below the poverty line.
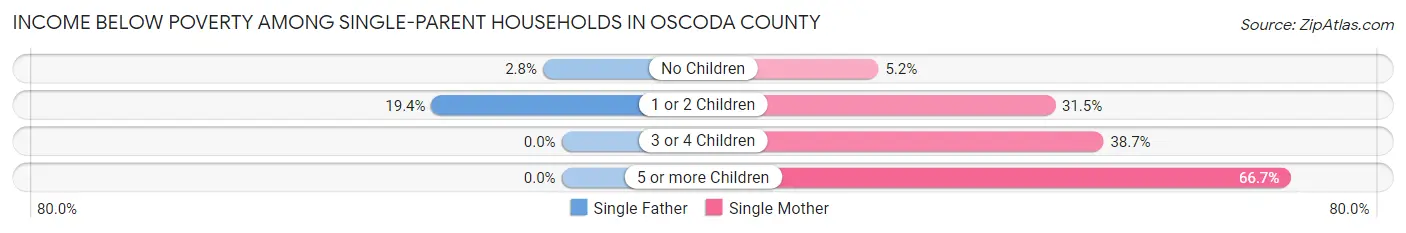
| Children | Single Father | Single Mother |
| No Children | 3 (2.8%) | 4 (5.2%) |
| 1 or 2 Children | 19 (19.4%) | 40 (31.5%) |
| 3 or 4 Children | 0 (0.0%) | 12 (38.7%) |
| 5 or more Children | 0 (0.0%) | 6 (66.7%) |
| Total | 22 (10.4%) | 62 (25.4%) |
Income Below Poverty Among Married-Couple vs Single-Parent Households in Oscoda County
The poverty data for Oscoda County shows that 130 of the married-couple family households (7.5%) and 84 of the single-parent households (18.4%) are living below the poverty level. Within the married-couple family households, those with no children have the highest poverty rate, with 103 households (8.0%) falling below the poverty line. Among the single-parent households, those with 5 or more children have the highest poverty rate, with 6 household (66.7%) living below poverty.
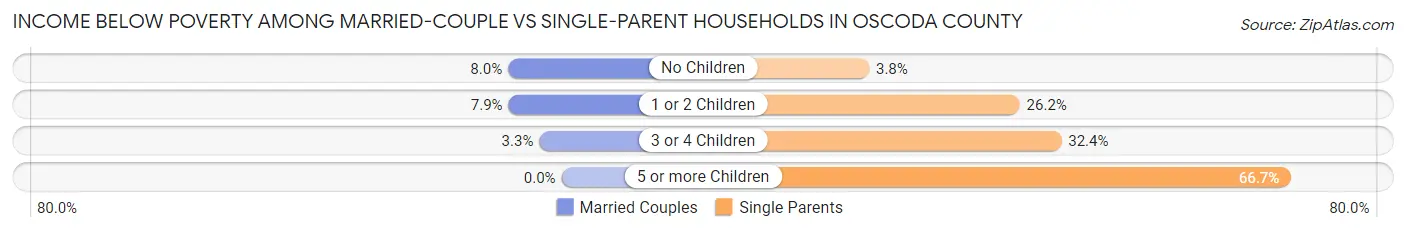
| Children | Married-Couple Families | Single-Parent Households |
| No Children | 103 (8.0%) | 7 (3.8%) |
| 1 or 2 Children | 23 (7.9%) | 59 (26.2%) |
| 3 or 4 Children | 4 (3.3%) | 12 (32.4%) |
| 5 or more Children | 0 (0.0%) | 6 (66.7%) |
| Total | 130 (7.5%) | 84 (18.4%) |
Employment Characteristics in Oscoda County
Employment by Class of Employer in Oscoda County
Among the 2,719 employed individuals in Oscoda County, private company employees (1,806 | 66.4%), self-employed (not incorporated) (255 | 9.4%), and local government employees (225 | 8.3%) make up the most common classes of employment.
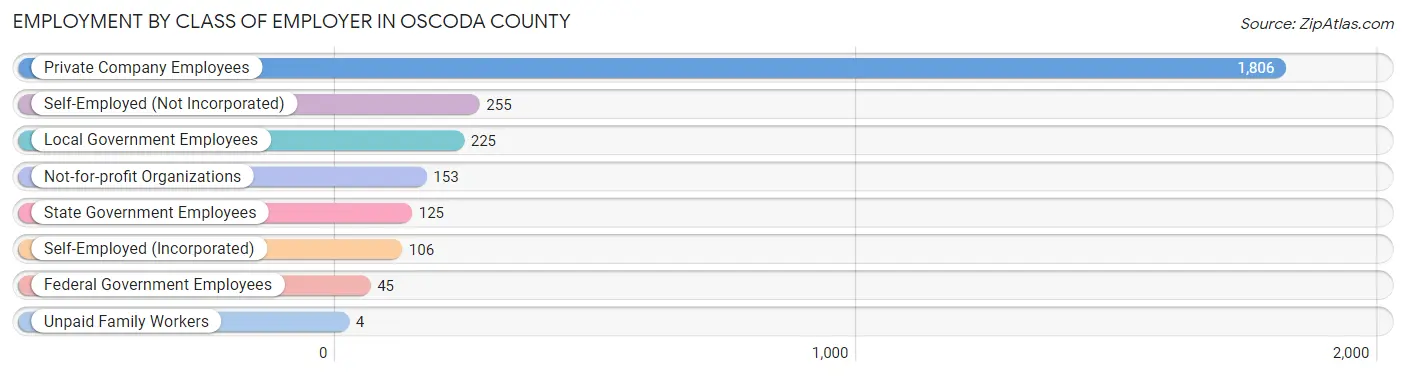
| Employer Class | # Employees | % Employees |
| Private Company Employees | 1,806 | 66.4% |
| Self-Employed (Incorporated) | 106 | 3.9% |
| Self-Employed (Not Incorporated) | 255 | 9.4% |
| Not-for-profit Organizations | 153 | 5.6% |
| Local Government Employees | 225 | 8.3% |
| State Government Employees | 125 | 4.6% |
| Federal Government Employees | 45 | 1.7% |
| Unpaid Family Workers | 4 | 0.2% |
| Total | 2,719 | 100.0% |
Employment Status by Age in Oscoda County
According to the labor force statistics for Oscoda County, out of the total population over 16 years of age (6,845), 44.5% or 3,046 individuals are in the labor force, with 8.9% or 271 of them unemployed. The age group with the highest labor force participation rate is 25 to 29 years, with 86.0% or 300 individuals in the labor force. Within the labor force, the 16 to 19 years age range has the highest percentage of unemployed individuals, with 30.7% or 47 of them being unemployed.
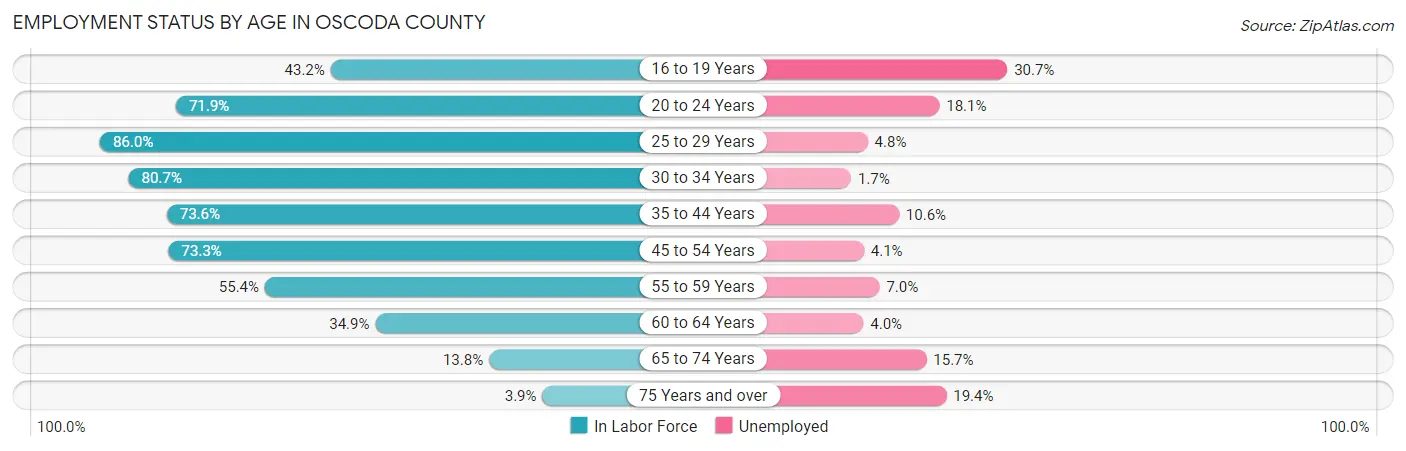
| Age Bracket | In Labor Force | Unemployed |
| 16 to 19 Years | 153 (43.2%) | 47 (30.7%) |
| 20 to 24 Years | 238 (71.9%) | 43 (18.1%) |
| 25 to 29 Years | 300 (86.0%) | 14 (4.8%) |
| 30 to 34 Years | 289 (80.7%) | 5 (1.7%) |
| 35 to 44 Years | 566 (73.6%) | 60 (10.6%) |
| 45 to 54 Years | 586 (73.3%) | 24 (4.1%) |
| 55 to 59 Years | 383 (55.4%) | 27 (7.0%) |
| 60 to 64 Years | 297 (34.9%) | 12 (4.0%) |
| 65 to 74 Years | 197 (13.8%) | 31 (15.7%) |
| 75 Years and over | 36 (3.9%) | 7 (19.4%) |
| Total | 3,046 (44.5%) | 271 (8.9%) |
Employment Status by Educational Attainment in Oscoda County
According to labor force statistics for Oscoda County, 63.4% of individuals (2,421) out of the total population between 25 and 64 years of age (3,819) are in the labor force, with 5.9% or 143 of them being unemployed. The group with the highest labor force participation rate are those with the educational attainment of college / associate degree, with 69.8% or 981 individuals in the labor force. Within the labor force, individuals with less than high school education have the highest percentage of unemployment, with 9.7% or 31 of them being unemployed.

| Educational Attainment | In Labor Force | Unemployed |
| Less than High School | 318 (55.9%) | 55 (9.7%) |
| High School Diploma | 728 (57.0%) | 68 (5.3%) |
| College / Associate Degree | 981 (69.8%) | 79 (5.6%) |
| Bachelor's Degree or higher | 392 (69.3%) | 26 (4.6%) |
| Total | 2,421 (63.4%) | 225 (5.9%) |
Employment Occupations by Sex in Oscoda County
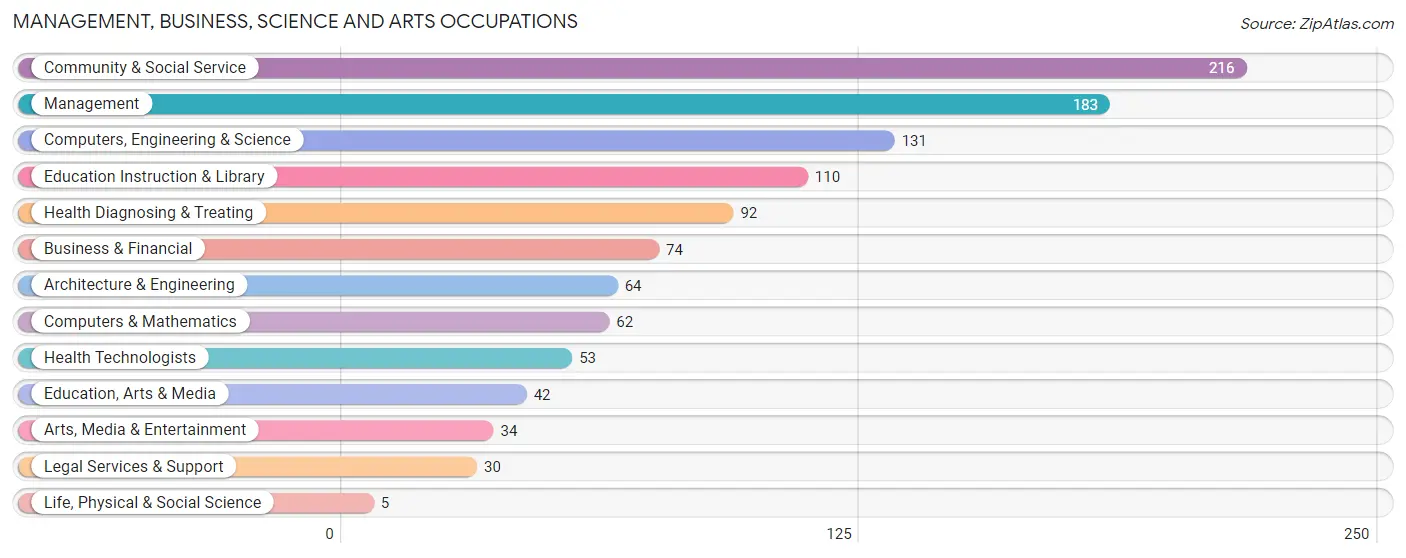
Management, Business, Science and Arts Occupations
The most common Management, Business, Science and Arts occupations in Oscoda County are Community & Social Service (216 | 7.8%), Management (183 | 6.6%), Computers, Engineering & Science (131 | 4.7%), Education Instruction & Library (110 | 4.0%), and Health Diagnosing & Treating (92 | 3.3%).
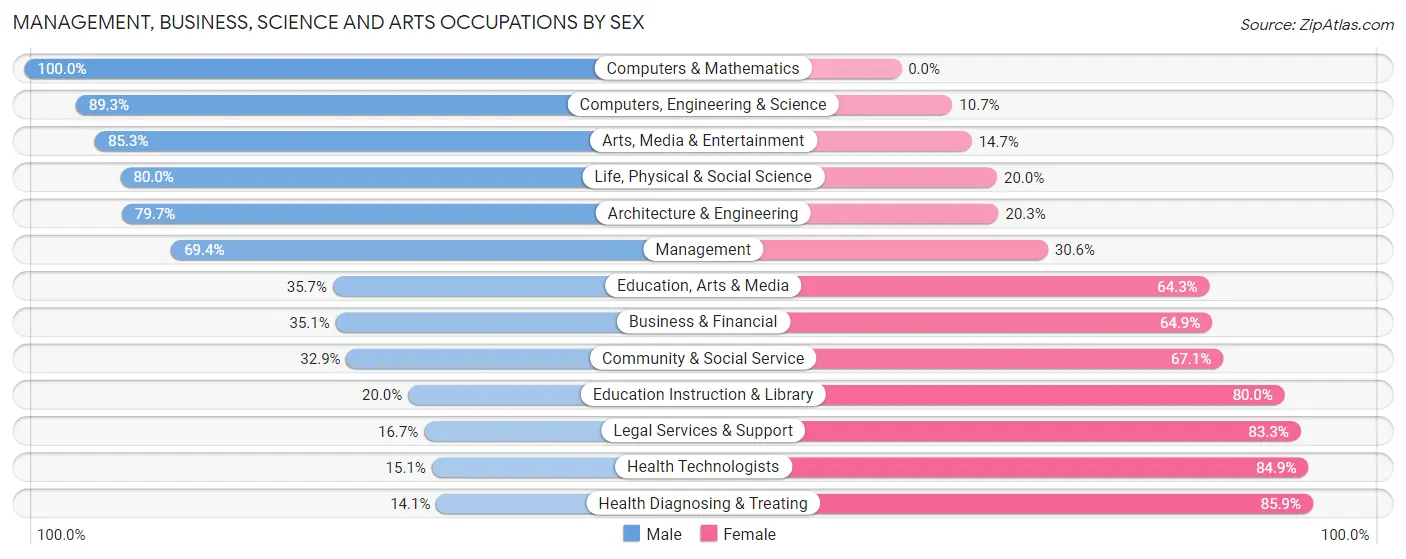
Management, Business, Science and Arts Occupations by Sex
Within the Management, Business, Science and Arts occupations in Oscoda County, the most male-oriented occupations are Computers & Mathematics (100.0%), Computers, Engineering & Science (89.3%), and Arts, Media & Entertainment (85.3%), while the most female-oriented occupations are Health Diagnosing & Treating (85.9%), Health Technologists (84.9%), and Legal Services & Support (83.3%).
| Occupation | Male | Female |
| Management | 127 (69.4%) | 56 (30.6%) |
| Business & Financial | 26 (35.1%) | 48 (64.9%) |
| Computers, Engineering & Science | 117 (89.3%) | 14 (10.7%) |
| Computers & Mathematics | 62 (100.0%) | 0 (0.0%) |
| Architecture & Engineering | 51 (79.7%) | 13 (20.3%) |
| Life, Physical & Social Science | 4 (80.0%) | 1 (20.0%) |
| Community & Social Service | 71 (32.9%) | 145 (67.1%) |
| Education, Arts & Media | 15 (35.7%) | 27 (64.3%) |
| Legal Services & Support | 5 (16.7%) | 25 (83.3%) |
| Education Instruction & Library | 22 (20.0%) | 88 (80.0%) |
| Arts, Media & Entertainment | 29 (85.3%) | 5 (14.7%) |
| Health Diagnosing & Treating | 13 (14.1%) | 79 (85.9%) |
| Health Technologists | 8 (15.1%) | 45 (84.9%) |
| Total (Category) | 354 (50.9%) | 342 (49.1%) |
| Total (Overall) | 1,482 (53.5%) | 1,286 (46.5%) |
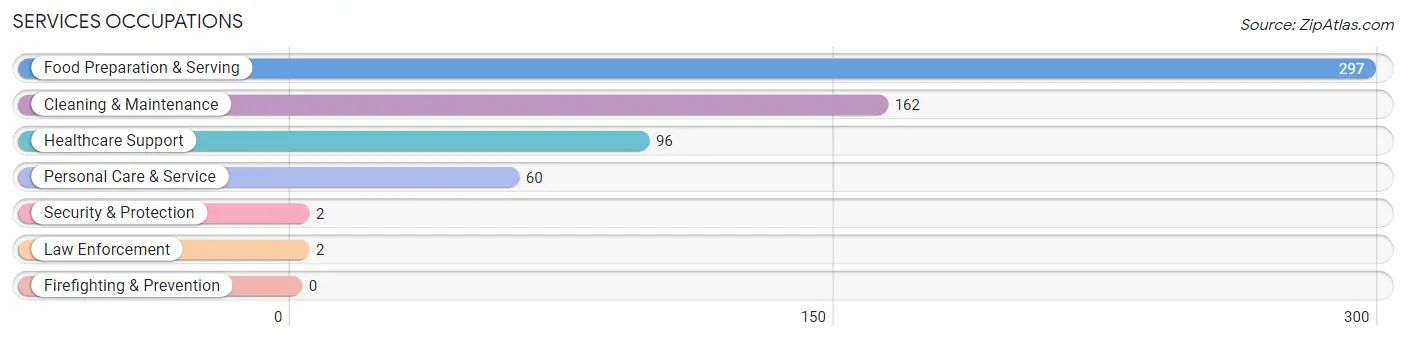
Services Occupations
The most common Services occupations in Oscoda County are Food Preparation & Serving (297 | 10.7%), Cleaning & Maintenance (162 | 5.9%), Healthcare Support (96 | 3.5%), Personal Care & Service (60 | 2.2%), and Security & Protection (2 | 0.1%).
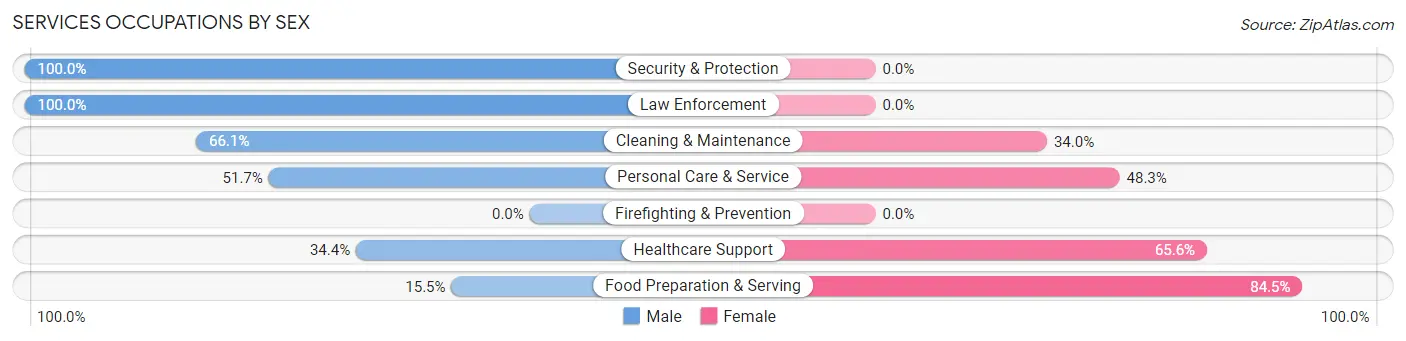
Services Occupations by Sex
Within the Services occupations in Oscoda County, the most male-oriented occupations are Security & Protection (100.0%), Law Enforcement (100.0%), and Cleaning & Maintenance (66.0%), while the most female-oriented occupations are Food Preparation & Serving (84.5%), Healthcare Support (65.6%), and Personal Care & Service (48.3%).
| Occupation | Male | Female |
| Healthcare Support | 33 (34.4%) | 63 (65.6%) |
| Security & Protection | 2 (100.0%) | 0 (0.0%) |
| Firefighting & Prevention | 0 (0.0%) | 0 (0.0%) |
| Law Enforcement | 2 (100.0%) | 0 (0.0%) |
| Food Preparation & Serving | 46 (15.5%) | 251 (84.5%) |
| Cleaning & Maintenance | 107 (66.0%) | 55 (34.0%) |
| Personal Care & Service | 31 (51.7%) | 29 (48.3%) |
| Total (Category) | 219 (35.5%) | 398 (64.5%) |
| Total (Overall) | 1,482 (53.5%) | 1,286 (46.5%) |
Sales and Office Occupations
The most common Sales and Office occupations in Oscoda County are Sales & Related (299 | 10.8%), and Office & Administration (233 | 8.4%).

Sales and Office Occupations by Sex

| Occupation | Male | Female |
| Sales & Related | 135 (45.2%) | 164 (54.8%) |
| Office & Administration | 23 (9.9%) | 210 (90.1%) |
| Total (Category) | 158 (29.7%) | 374 (70.3%) |
| Total (Overall) | 1,482 (53.5%) | 1,286 (46.5%) |
Natural Resources, Construction and Maintenance Occupations
The most common Natural Resources, Construction and Maintenance occupations in Oscoda County are Construction & Extraction (184 | 6.7%), Installation, Maintenance & Repair (124 | 4.5%), and Farming, Fishing & Forestry (57 | 2.1%).
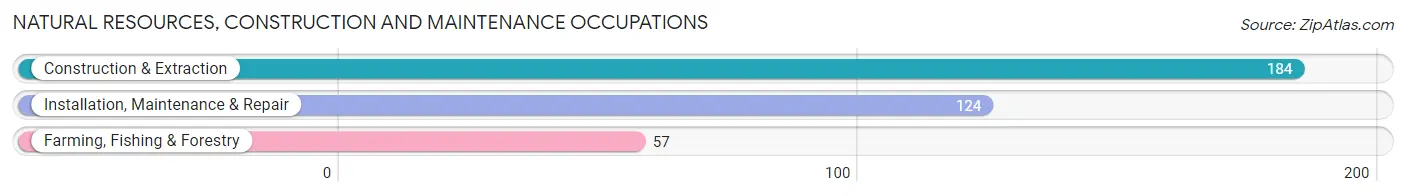
Natural Resources, Construction and Maintenance Occupations by Sex

| Occupation | Male | Female |
| Farming, Fishing & Forestry | 54 (94.7%) | 3 (5.3%) |
| Construction & Extraction | 184 (100.0%) | 0 (0.0%) |
| Installation, Maintenance & Repair | 120 (96.8%) | 4 (3.2%) |
| Total (Category) | 358 (98.1%) | 7 (1.9%) |
| Total (Overall) | 1,482 (53.5%) | 1,286 (46.5%) |
Production, Transportation and Moving Occupations
The most common Production, Transportation and Moving occupations in Oscoda County are Production (376 | 13.6%), Transportation (124 | 4.5%), and Material Moving (58 | 2.1%).

Production, Transportation and Moving Occupations by Sex
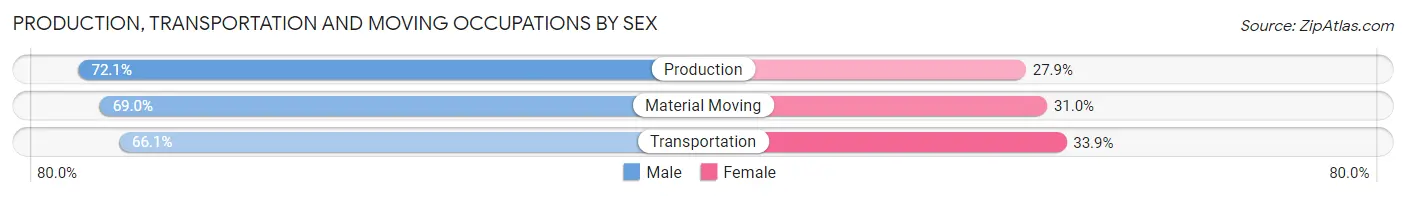
| Occupation | Male | Female |
| Production | 271 (72.1%) | 105 (27.9%) |
| Transportation | 82 (66.1%) | 42 (33.9%) |
| Material Moving | 40 (69.0%) | 18 (31.0%) |
| Total (Category) | 393 (70.4%) | 165 (29.6%) |
| Total (Overall) | 1,482 (53.5%) | 1,286 (46.5%) |
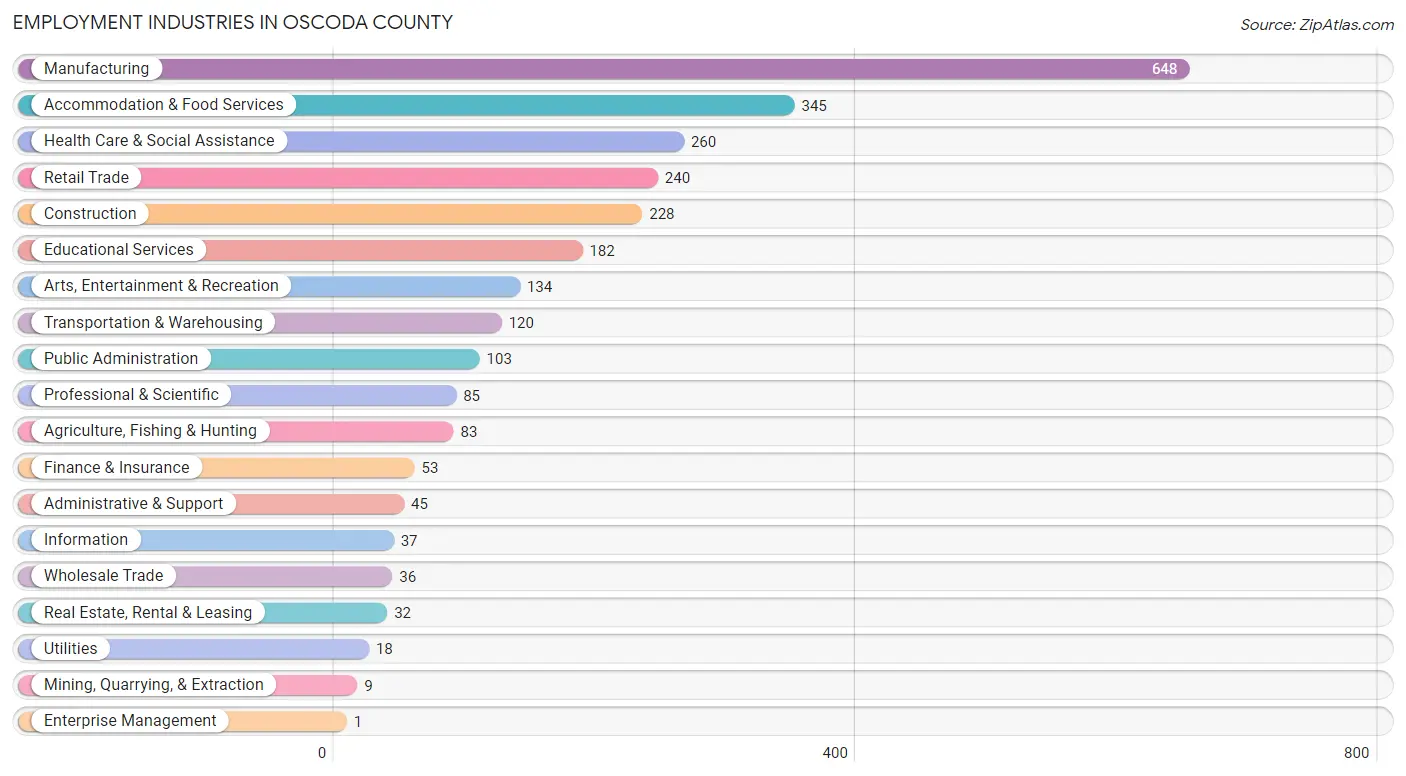
Employment Industries by Sex in Oscoda County
Employment Industries in Oscoda County
The major employment industries in Oscoda County include Manufacturing (648 | 23.4%), Accommodation & Food Services (345 | 12.5%), Health Care & Social Assistance (260 | 9.4%), Retail Trade (240 | 8.7%), and Construction (228 | 8.2%).
Employment Industries by Sex in Oscoda County
The Oscoda County industries that see more men than women are Utilities (100.0%), Agriculture, Fishing & Hunting (91.6%), and Administrative & Support (88.9%), whereas the industries that tend to have a higher number of women are Enterprise Management (100.0%), Public Administration (84.5%), and Accommodation & Food Services (80.0%).
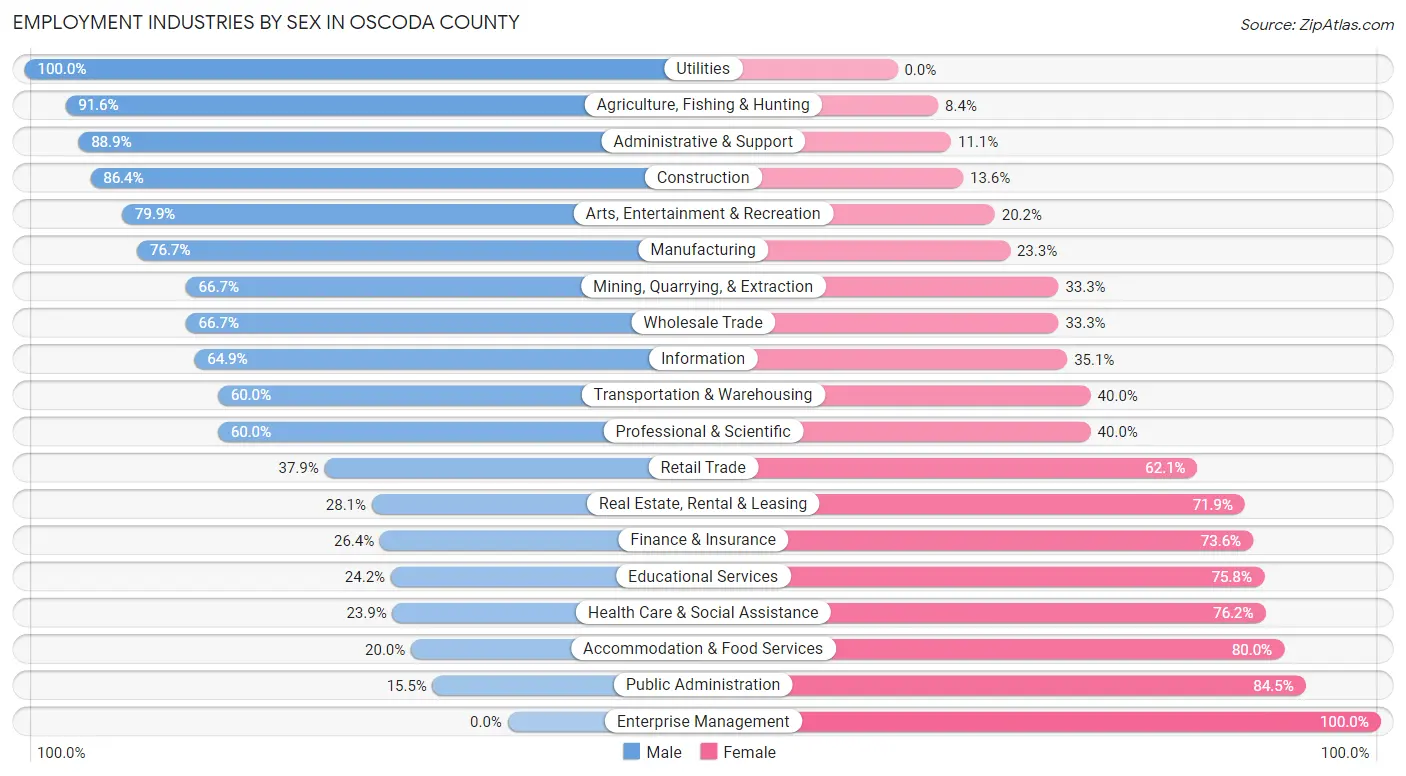
| Industry | Male | Female |
| Agriculture, Fishing & Hunting | 76 (91.6%) | 7 (8.4%) |
| Mining, Quarrying, & Extraction | 6 (66.7%) | 3 (33.3%) |
| Construction | 197 (86.4%) | 31 (13.6%) |
| Manufacturing | 497 (76.7%) | 151 (23.3%) |
| Wholesale Trade | 24 (66.7%) | 12 (33.3%) |
| Retail Trade | 91 (37.9%) | 149 (62.1%) |
| Transportation & Warehousing | 72 (60.0%) | 48 (40.0%) |
| Utilities | 18 (100.0%) | 0 (0.0%) |
| Information | 24 (64.9%) | 13 (35.1%) |
| Finance & Insurance | 14 (26.4%) | 39 (73.6%) |
| Real Estate, Rental & Leasing | 9 (28.1%) | 23 (71.9%) |
| Professional & Scientific | 51 (60.0%) | 34 (40.0%) |
| Enterprise Management | 0 (0.0%) | 1 (100.0%) |
| Administrative & Support | 40 (88.9%) | 5 (11.1%) |
| Educational Services | 44 (24.2%) | 138 (75.8%) |
| Health Care & Social Assistance | 62 (23.8%) | 198 (76.1%) |
| Arts, Entertainment & Recreation | 107 (79.8%) | 27 (20.2%) |
| Accommodation & Food Services | 69 (20.0%) | 276 (80.0%) |
| Public Administration | 16 (15.5%) | 87 (84.5%) |
| Total | 1,482 (53.5%) | 1,286 (46.5%) |
Education in Oscoda County
School Enrollment in Oscoda County
The most common levels of schooling among the 1,297 students in Oscoda County are middle school (332 | 25.6%), elementary school (324 | 25.0%), and high school (306 | 23.6%).
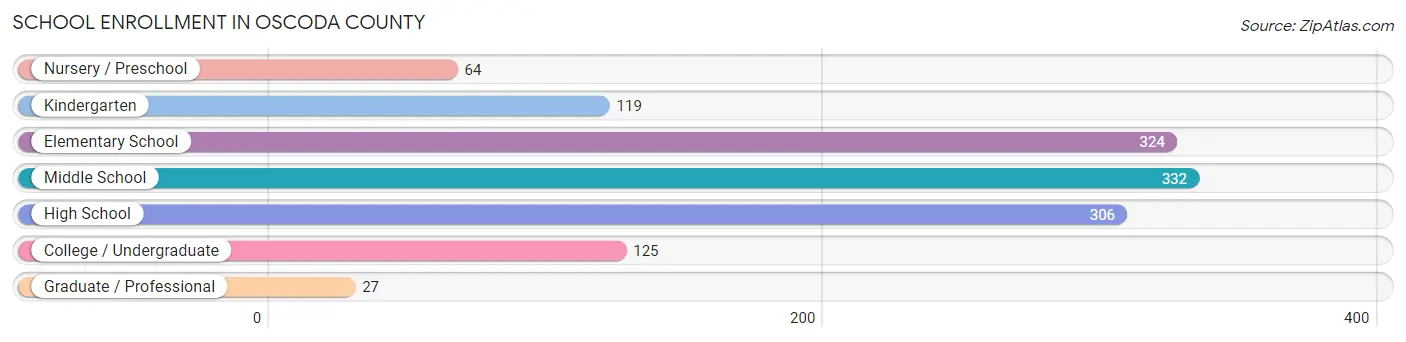
| School Level | # Students | % Students |
| Nursery / Preschool | 64 | 4.9% |
| Kindergarten | 119 | 9.2% |
| Elementary School | 324 | 25.0% |
| Middle School | 332 | 25.6% |
| High School | 306 | 23.6% |
| College / Undergraduate | 125 | 9.6% |
| Graduate / Professional | 27 | 2.1% |
| Total | 1,297 | 100.0% |
School Enrollment by Age by Funding Source in Oscoda County
Out of a total of 1,297 students who are enrolled in schools in Oscoda County, 188 (14.5%) attend a private institution, while the remaining 1,109 (85.5%) are enrolled in public schools. The age group of 25 to 34 year olds has the highest likelihood of being enrolled in private schools, with 8 (25.0% in the age bracket) enrolled. Conversely, the age group of 18 to 19 year olds has the lowest likelihood of being enrolled in a private school, with 47 (100.0% in the age bracket) attending a public institution.

| Age Bracket | Public School | Private School |
| 3 to 4 Year Olds | 33 (89.2%) | 4 (10.8%) |
| 5 to 9 Year Old | 334 (78.0%) | 94 (22.0%) |
| 10 to 14 Year Olds | 349 (85.1%) | 61 (14.9%) |
| 15 to 17 Year Olds | 196 (92.9%) | 15 (7.1%) |
| 18 to 19 Year Olds | 47 (100.0%) | 0 (0.0%) |
| 20 to 24 Year Olds | 85 (96.6%) | 3 (3.4%) |
| 25 to 34 Year Olds | 24 (75.0%) | 8 (25.0%) |
| 35 Years and over | 41 (93.2%) | 3 (6.8%) |
| Total | 1,109 (85.5%) | 188 (14.5%) |
Educational Attainment by Field of Study in Oscoda County
Education (183 | 20.8%), business (179 | 20.3%), science & technology (134 | 15.2%), arts & humanities (79 | 9.0%), and computers & mathematics (75 | 8.5%) are the most common fields of study among 881 individuals in Oscoda County who have obtained a bachelor's degree or higher.
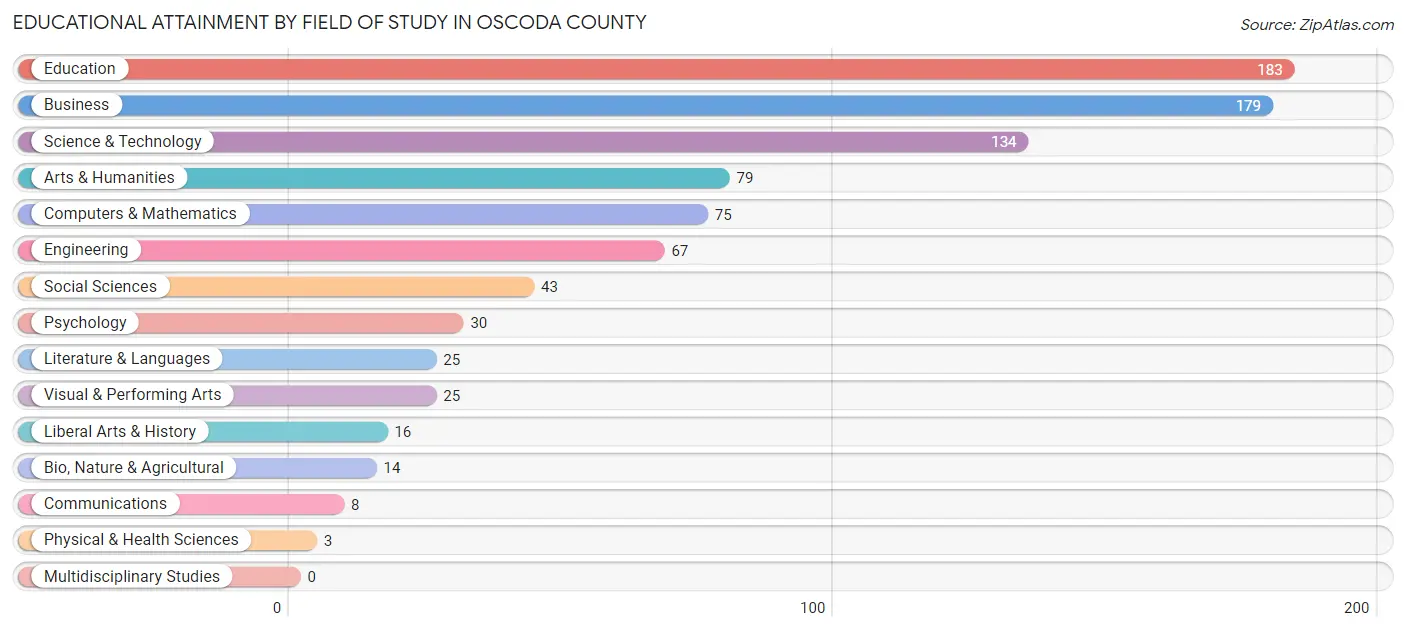
| Field of Study | # Graduates | % Graduates |
| Computers & Mathematics | 75 | 8.5% |
| Bio, Nature & Agricultural | 14 | 1.6% |
| Physical & Health Sciences | 3 | 0.3% |
| Psychology | 30 | 3.4% |
| Social Sciences | 43 | 4.9% |
| Engineering | 67 | 7.6% |
| Multidisciplinary Studies | 0 | 0.0% |
| Science & Technology | 134 | 15.2% |
| Business | 179 | 20.3% |
| Education | 183 | 20.8% |
| Literature & Languages | 25 | 2.8% |
| Liberal Arts & History | 16 | 1.8% |
| Visual & Performing Arts | 25 | 2.8% |
| Communications | 8 | 0.9% |
| Arts & Humanities | 79 | 9.0% |
| Total | 881 | 100.0% |
Transportation & Commute in Oscoda County
Vehicle Availability by Sex in Oscoda County
The most prevalent vehicle ownership categories in Oscoda County are males with 2 vehicles (568, accounting for 39.7%) and females with 2 vehicles (439, making up 44.3%).
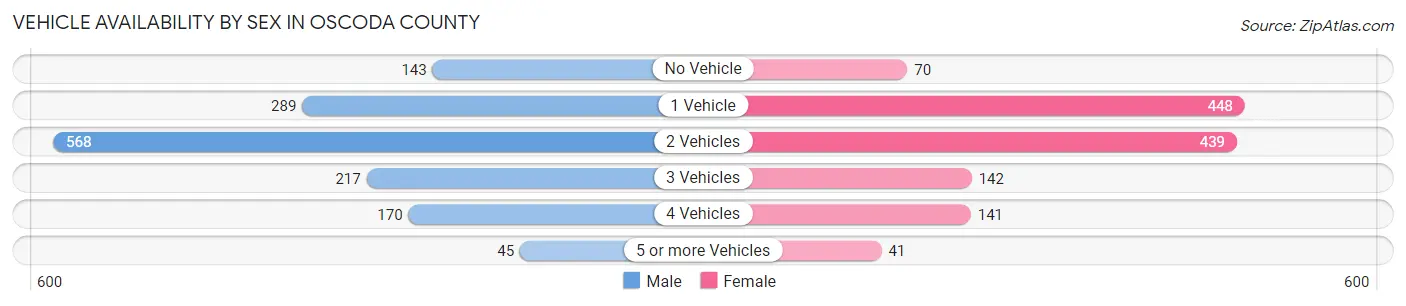
| Vehicles Available | Male | Female |
| No Vehicle | 143 (10.0%) | 70 (5.5%) |
| 1 Vehicle | 289 (20.2%) | 448 (35.0%) |
| 2 Vehicles | 568 (39.7%) | 439 (34.3%) |
| 3 Vehicles | 217 (15.1%) | 142 (11.1%) |
| 4 Vehicles | 170 (11.9%) | 141 (11.0%) |
| 5 or more Vehicles | 45 (3.1%) | 41 (3.2%) |
| Total | 1,432 (100.0%) | 1,281 (100.0%) |
Commute Time in Oscoda County
The most frequently occuring commute durations in Oscoda County are 5 to 9 minutes (520 commuters, 21.6%), 10 to 14 minutes (348 commuters, 14.5%), and 15 to 19 minutes (331 commuters, 13.8%).
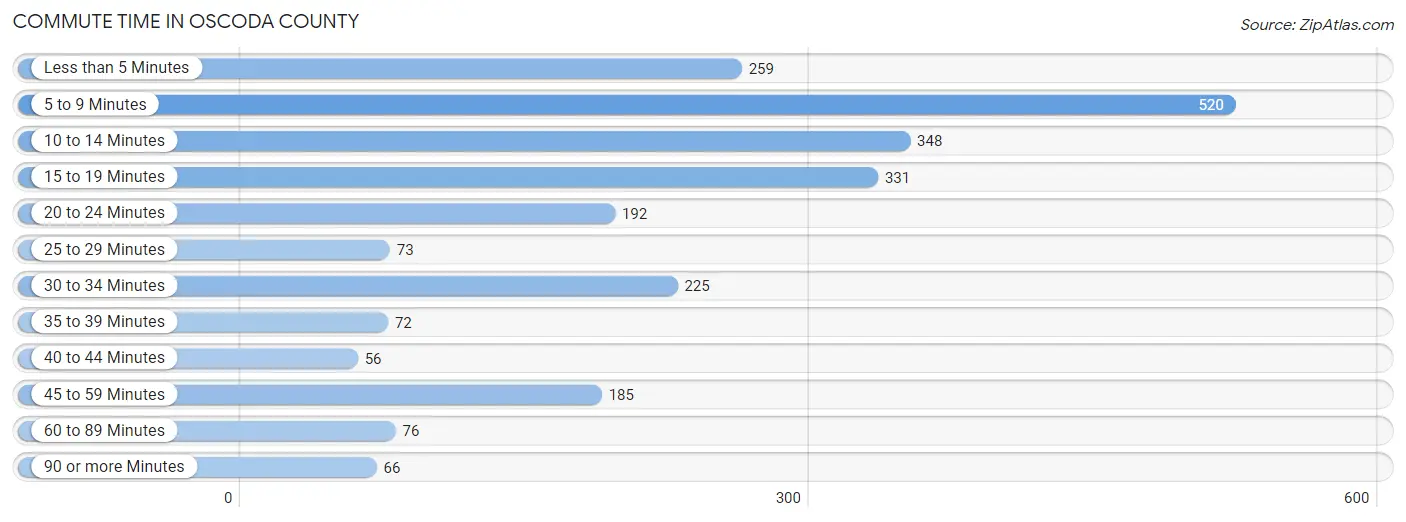
| Commute Time | # Commuters | % Commuters |
| Less than 5 Minutes | 259 | 10.8% |
| 5 to 9 Minutes | 520 | 21.6% |
| 10 to 14 Minutes | 348 | 14.5% |
| 15 to 19 Minutes | 331 | 13.8% |
| 20 to 24 Minutes | 192 | 8.0% |
| 25 to 29 Minutes | 73 | 3.0% |
| 30 to 34 Minutes | 225 | 9.4% |
| 35 to 39 Minutes | 72 | 3.0% |
| 40 to 44 Minutes | 56 | 2.3% |
| 45 to 59 Minutes | 185 | 7.7% |
| 60 to 89 Minutes | 76 | 3.2% |
| 90 or more Minutes | 66 | 2.8% |
Commute Time by Sex in Oscoda County
The most common commute times in Oscoda County are 5 to 9 minutes (250 commuters, 19.4%) for males and 5 to 9 minutes (270 commuters, 24.2%) for females.

| Commute Time | Male | Female |
| Less than 5 Minutes | 137 (10.6%) | 122 (10.9%) |
| 5 to 9 Minutes | 250 (19.4%) | 270 (24.2%) |
| 10 to 14 Minutes | 218 (17.0%) | 130 (11.6%) |
| 15 to 19 Minutes | 169 (13.1%) | 162 (14.5%) |
| 20 to 24 Minutes | 91 (7.1%) | 101 (9.0%) |
| 25 to 29 Minutes | 41 (3.2%) | 32 (2.9%) |
| 30 to 34 Minutes | 94 (7.3%) | 131 (11.7%) |
| 35 to 39 Minutes | 43 (3.3%) | 29 (2.6%) |
| 40 to 44 Minutes | 18 (1.4%) | 38 (3.4%) |
| 45 to 59 Minutes | 112 (8.7%) | 73 (6.5%) |
| 60 to 89 Minutes | 64 (5.0%) | 12 (1.1%) |
| 90 or more Minutes | 49 (3.8%) | 17 (1.5%) |
Time of Departure to Work by Sex in Oscoda County
The most frequent times of departure to work in Oscoda County are 5:30 AM to 5:59 AM (274, 21.3%) for males and 8:00 AM to 8:29 AM (165, 14.8%) for females.

| Time of Departure | Male | Female |
| 12:00 AM to 4:59 AM | 89 (6.9%) | 32 (2.9%) |
| 5:00 AM to 5:29 AM | 98 (7.6%) | 31 (2.8%) |
| 5:30 AM to 5:59 AM | 274 (21.3%) | 44 (3.9%) |
| 6:00 AM to 6:29 AM | 104 (8.1%) | 69 (6.2%) |
| 6:30 AM to 6:59 AM | 198 (15.4%) | 159 (14.2%) |
| 7:00 AM to 7:29 AM | 117 (9.1%) | 154 (13.8%) |
| 7:30 AM to 7:59 AM | 96 (7.5%) | 124 (11.1%) |
| 8:00 AM to 8:29 AM | 87 (6.8%) | 165 (14.8%) |
| 8:30 AM to 8:59 AM | 42 (3.3%) | 87 (7.8%) |
| 9:00 AM to 9:59 AM | 41 (3.2%) | 50 (4.5%) |
| 10:00 AM to 10:59 AM | 4 (0.3%) | 34 (3.0%) |
| 11:00 AM to 11:59 AM | 3 (0.2%) | 17 (1.5%) |
| 12:00 PM to 3:59 PM | 100 (7.8%) | 96 (8.6%) |
| 4:00 PM to 11:59 PM | 33 (2.6%) | 55 (4.9%) |
| Total | 1,286 (100.0%) | 1,117 (100.0%) |
Housing Occupancy in Oscoda County
Occupancy by Ownership in Oscoda County
Of the total 3,500 dwellings in Oscoda County, owner-occupied units account for 3,056 (87.3%), while renter-occupied units make up 444 (12.7%).
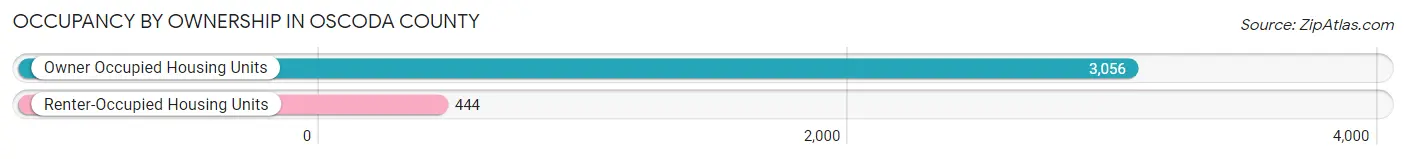
| Occupancy | # Housing Units | % Housing Units |
| Owner Occupied Housing Units | 3,056 | 87.3% |
| Renter-Occupied Housing Units | 444 | 12.7% |
| Total Occupied Housing Units | 3,500 | 100.0% |
Occupancy by Household Size in Oscoda County
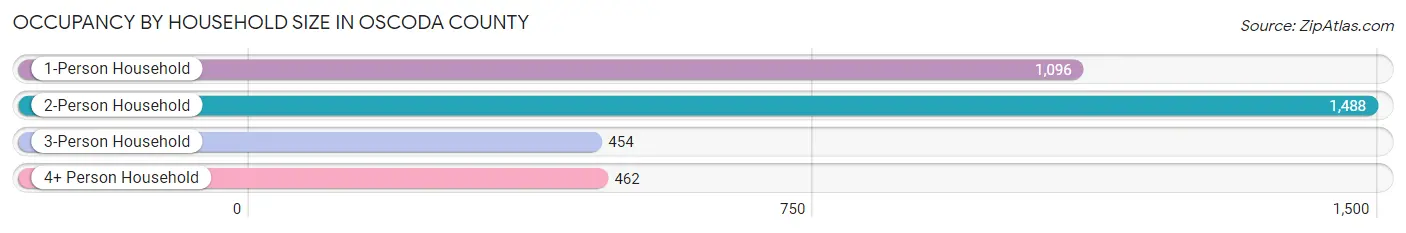
| Household Size | # Housing Units | % Housing Units |
| 1-Person Household | 1,096 | 31.3% |
| 2-Person Household | 1,488 | 42.5% |
| 3-Person Household | 454 | 13.0% |
| 4+ Person Household | 462 | 13.2% |
| Total Housing Units | 3,500 | 100.0% |
Occupancy by Ownership by Household Size in Oscoda County
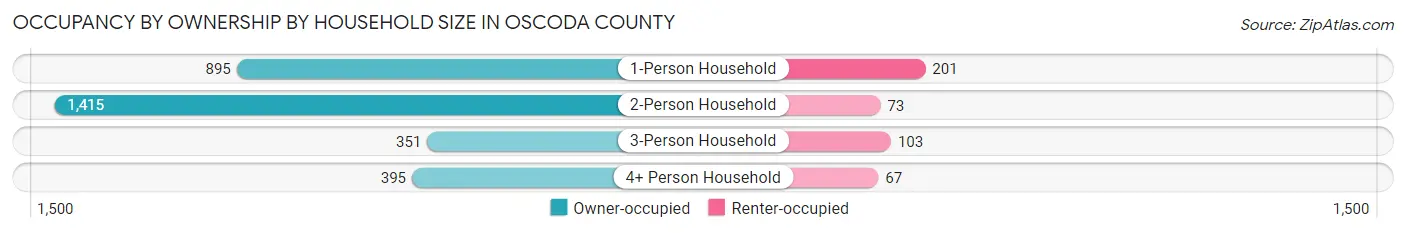
| Household Size | Owner-occupied | Renter-occupied |
| 1-Person Household | 895 (81.7%) | 201 (18.3%) |
| 2-Person Household | 1,415 (95.1%) | 73 (4.9%) |
| 3-Person Household | 351 (77.3%) | 103 (22.7%) |
| 4+ Person Household | 395 (85.5%) | 67 (14.5%) |
| Total Housing Units | 3,056 (87.3%) | 444 (12.7%) |
Occupancy by Educational Attainment in Oscoda County

| Household Size | Owner-occupied | Renter-occupied |
| Less than High School | 351 (83.4%) | 70 (16.6%) |
| High School Diploma | 1,176 (84.8%) | 211 (15.2%) |
| College/Associate Degree | 1,041 (89.7%) | 119 (10.3%) |
| Bachelor's Degree or higher | 488 (91.7%) | 44 (8.3%) |
Occupancy by Age of Householder in Oscoda County
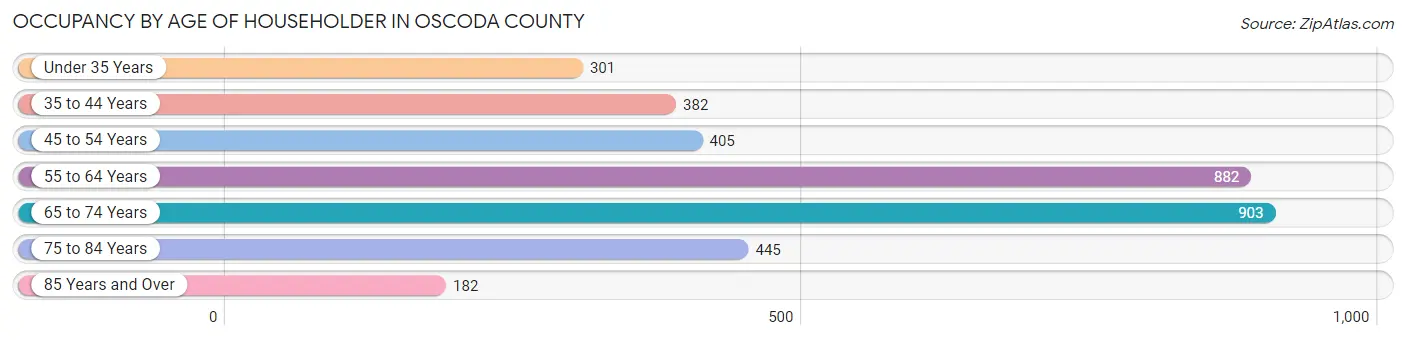
| Age Bracket | # Households | % Households |
| Under 35 Years | 301 | 8.6% |
| 35 to 44 Years | 382 | 10.9% |
| 45 to 54 Years | 405 | 11.6% |
| 55 to 64 Years | 882 | 25.2% |
| 65 to 74 Years | 903 | 25.8% |
| 75 to 84 Years | 445 | 12.7% |
| 85 Years and Over | 182 | 5.2% |
| Total | 3,500 | 100.0% |
Housing Finances in Oscoda County
Median Income by Occupancy in Oscoda County
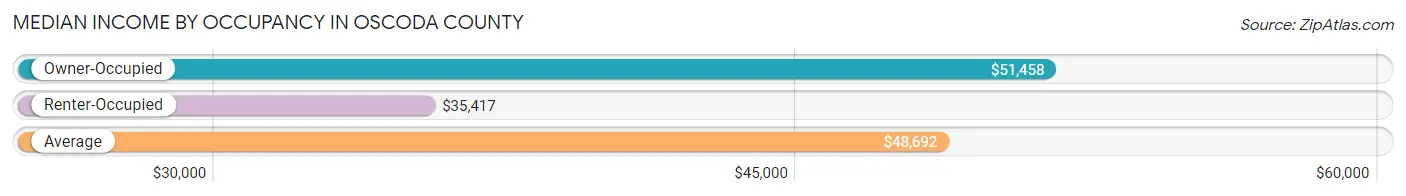
| Occupancy Type | # Households | Median Income |
| Owner-Occupied | 3,056 (87.3%) | $51,458 |
| Renter-Occupied | 444 (12.7%) | $35,417 |
| Average | 3,500 (100.0%) | $48,692 |
Occupancy by Householder Income Bracket in Oscoda County

| Income Bracket | Owner-occupied | Renter-occupied |
| Less than $5,000 | 110 (3.6%) | 9 (2.0%) |
| $5,000 to $9,999 | 47 (1.5%) | 19 (4.3%) |
| $10,000 to $14,999 | 170 (5.6%) | 33 (7.4%) |
| $15,000 to $19,999 | 113 (3.7%) | 53 (11.9%) |
| $20,000 to $24,999 | 110 (3.6%) | 45 (10.1%) |
| $25,000 to $34,999 | 426 (13.9%) | 61 (13.7%) |
| $35,000 to $49,999 | 510 (16.7%) | 100 (22.5%) |
| $50,000 to $74,999 | 732 (23.9%) | 52 (11.7%) |
| $75,000 to $99,999 | 350 (11.5%) | 69 (15.5%) |
| $100,000 to $149,999 | 332 (10.9%) | 0 (0.0%) |
| $150,000 or more | 156 (5.1%) | 3 (0.7%) |
| Total | 3,056 (100.0%) | 444 (100.0%) |
Monthly Housing Cost Tiers in Oscoda County
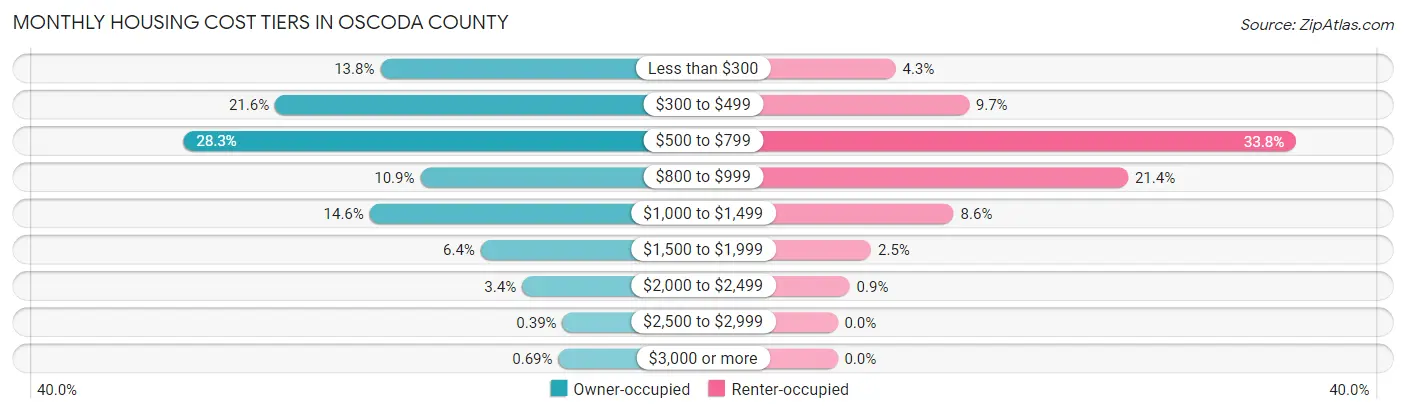
| Monthly Cost | Owner-occupied | Renter-occupied |
| Less than $300 | 422 (13.8%) | 19 (4.3%) |
| $300 to $499 | 659 (21.6%) | 43 (9.7%) |
| $500 to $799 | 865 (28.3%) | 150 (33.8%) |
| $800 to $999 | 332 (10.9%) | 95 (21.4%) |
| $1,000 to $1,499 | 446 (14.6%) | 38 (8.6%) |
| $1,500 to $1,999 | 196 (6.4%) | 11 (2.5%) |
| $2,000 to $2,499 | 103 (3.4%) | 4 (0.9%) |
| $2,500 to $2,999 | 12 (0.4%) | 0 (0.0%) |
| $3,000 or more | 21 (0.7%) | 0 (0.0%) |
| Total | 3,056 (100.0%) | 444 (100.0%) |
Physical Housing Characteristics in Oscoda County
Housing Structures in Oscoda County
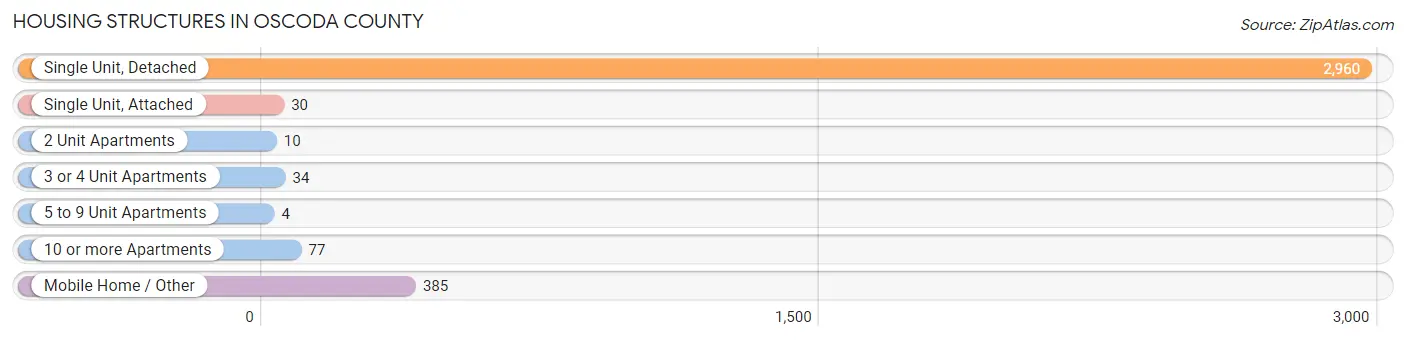
| Structure Type | # Housing Units | % Housing Units |
| Single Unit, Detached | 2,960 | 84.6% |
| Single Unit, Attached | 30 | 0.9% |
| 2 Unit Apartments | 10 | 0.3% |
| 3 or 4 Unit Apartments | 34 | 1.0% |
| 5 to 9 Unit Apartments | 4 | 0.1% |
| 10 or more Apartments | 77 | 2.2% |
| Mobile Home / Other | 385 | 11.0% |
| Total | 3,500 | 100.0% |
Housing Structures by Occupancy in Oscoda County

| Structure Type | Owner-occupied | Renter-occupied |
| Single Unit, Detached | 2,732 (92.3%) | 228 (7.7%) |
| Single Unit, Attached | 16 (53.3%) | 14 (46.7%) |
| 2 Unit Apartments | 0 (0.0%) | 10 (100.0%) |
| 3 or 4 Unit Apartments | 11 (32.4%) | 23 (67.6%) |
| 5 to 9 Unit Apartments | 0 (0.0%) | 4 (100.0%) |
| 10 or more Apartments | 8 (10.4%) | 69 (89.6%) |
| Mobile Home / Other | 289 (75.1%) | 96 (24.9%) |
| Total | 3,056 (87.3%) | 444 (12.7%) |
Housing Structures by Number of Rooms in Oscoda County

| Number of Rooms | Owner-occupied | Renter-occupied |
| 1 Room | 18 (0.6%) | 24 (5.4%) |
| 2 or 3 Rooms | 109 (3.6%) | 67 (15.1%) |
| 4 or 5 Rooms | 1,135 (37.1%) | 256 (57.7%) |
| 6 or 7 Rooms | 1,146 (37.5%) | 56 (12.6%) |
| 8 or more Rooms | 648 (21.2%) | 41 (9.2%) |
| Total | 3,056 (100.0%) | 444 (100.0%) |
Housing Structure by Heating Type in Oscoda County
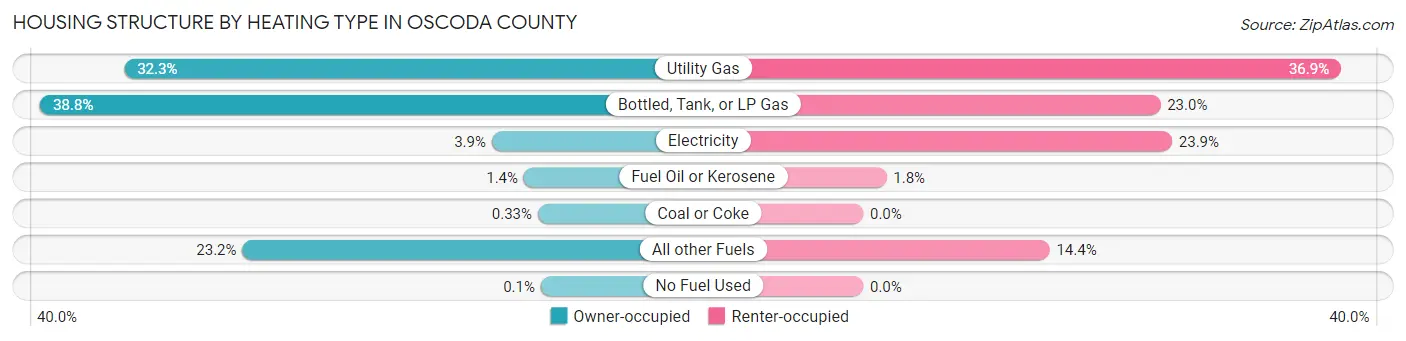
| Heating Type | Owner-occupied | Renter-occupied |
| Utility Gas | 987 (32.3%) | 164 (36.9%) |
| Bottled, Tank, or LP Gas | 1,186 (38.8%) | 102 (23.0%) |
| Electricity | 119 (3.9%) | 106 (23.9%) |
| Fuel Oil or Kerosene | 43 (1.4%) | 8 (1.8%) |
| Coal or Coke | 10 (0.3%) | 0 (0.0%) |
| All other Fuels | 708 (23.2%) | 64 (14.4%) |
| No Fuel Used | 3 (0.1%) | 0 (0.0%) |
| Total | 3,056 (100.0%) | 444 (100.0%) |
Household Vehicle Usage in Oscoda County

| Vehicles per Household | Owner-occupied | Renter-occupied |
| No Vehicle | 176 (5.8%) | 76 (17.1%) |
| 1 Vehicle | 1,035 (33.9%) | 282 (63.5%) |
| 2 Vehicles | 1,233 (40.4%) | 61 (13.7%) |
| 3 or more Vehicles | 612 (20.0%) | 25 (5.6%) |
| Total | 3,056 (100.0%) | 444 (100.0%) |
Real Estate & Mortgages in Oscoda County
Real Estate and Mortgage Overview in Oscoda County
| Characteristic | Without Mortgage | With Mortgage |
| Housing Units | 1,586 | 1,470 |
| Median Property Value | $117,500 | $128,300 |
| Median Household Income | $44,194 | $113 |
| Monthly Housing Costs | $435 | $21 |
| Real Estate Taxes | $1,120 | $54 |
Property Value by Mortgage Status in Oscoda County
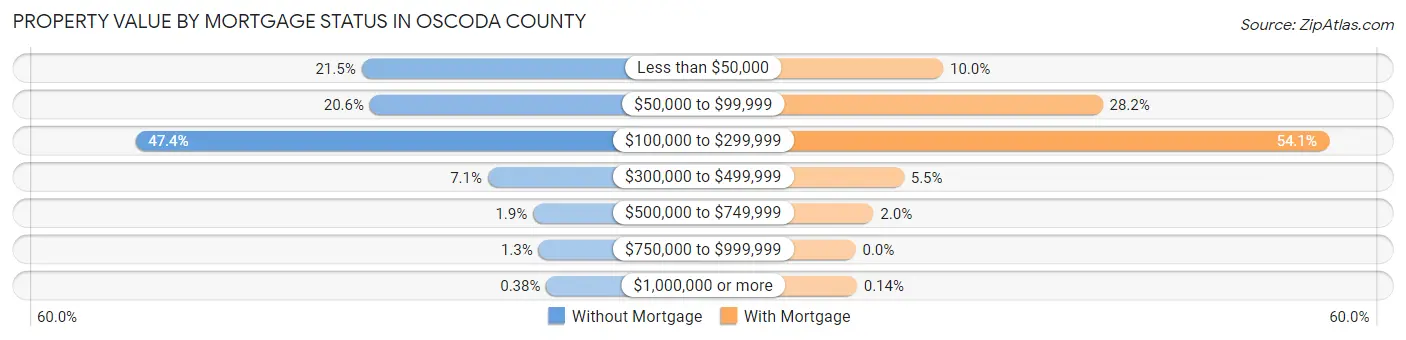
| Property Value | Without Mortgage | With Mortgage |
| Less than $50,000 | 341 (21.5%) | 147 (10.0%) |
| $50,000 to $99,999 | 326 (20.5%) | 415 (28.2%) |
| $100,000 to $299,999 | 751 (47.3%) | 795 (54.1%) |
| $300,000 to $499,999 | 112 (7.1%) | 81 (5.5%) |
| $500,000 to $749,999 | 30 (1.9%) | 30 (2.0%) |
| $750,000 to $999,999 | 20 (1.3%) | 0 (0.0%) |
| $1,000,000 or more | 6 (0.4%) | 2 (0.1%) |
| Total | 1,586 (100.0%) | 1,470 (100.0%) |
Household Income by Mortgage Status in Oscoda County
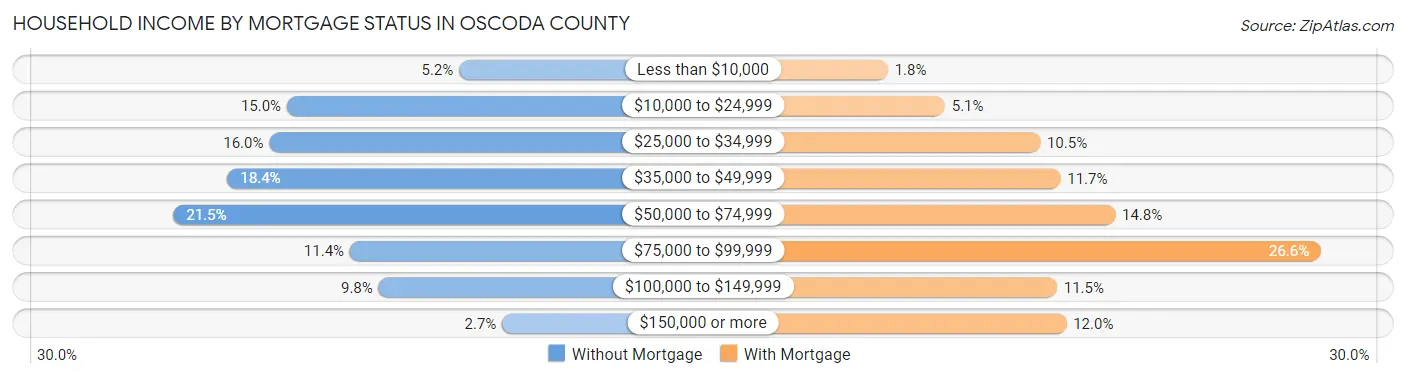
| Household Income | Without Mortgage | With Mortgage |
| Less than $10,000 | 82 (5.2%) | 27 (1.8%) |
| $10,000 to $24,999 | 238 (15.0%) | 75 (5.1%) |
| $25,000 to $34,999 | 254 (16.0%) | 155 (10.5%) |
| $35,000 to $49,999 | 292 (18.4%) | 172 (11.7%) |
| $50,000 to $74,999 | 341 (21.5%) | 218 (14.8%) |
| $75,000 to $99,999 | 181 (11.4%) | 391 (26.6%) |
| $100,000 to $149,999 | 155 (9.8%) | 169 (11.5%) |
| $150,000 or more | 43 (2.7%) | 177 (12.0%) |
| Total | 1,586 (100.0%) | 1,470 (100.0%) |
Property Value to Household Income Ratio in Oscoda County
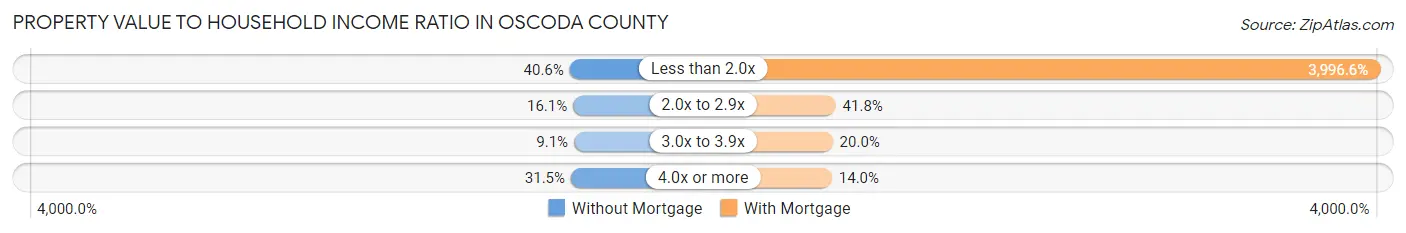
| Value-to-Income Ratio | Without Mortgage | With Mortgage |
| Less than 2.0x | 644 (40.6%) | 58,750 (3,996.6%) |
| 2.0x to 2.9x | 255 (16.1%) | 614 (41.8%) |
| 3.0x to 3.9x | 145 (9.1%) | 294 (20.0%) |
| 4.0x or more | 500 (31.5%) | 205 (14.0%) |
| Total | 1,586 (100.0%) | 1,470 (100.0%) |
Real Estate Taxes by Mortgage Status in Oscoda County

| Property Taxes | Without Mortgage | With Mortgage |
| Less than $800 | 553 (34.9%) | 30 (2.0%) |
| $800 to $1,499 | 424 (26.7%) | 273 (18.6%) |
| $800 to $1,499 | 536 (33.8%) | 675 (45.9%) |
| Total | 1,586 (100.0%) | 1,470 (100.0%) |
Health & Disability in Oscoda County
Health Insurance Coverage by Age in Oscoda County
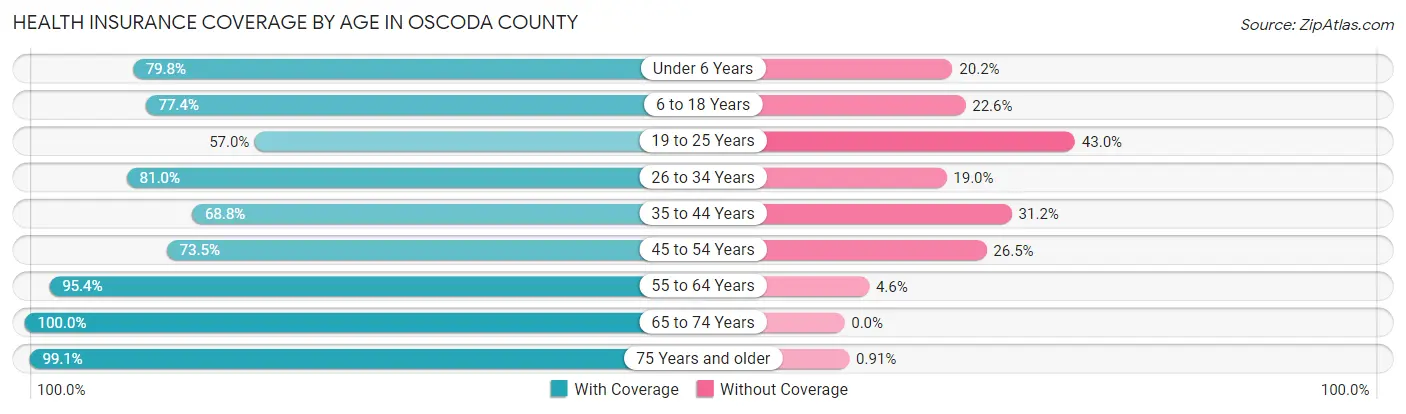
| Age Bracket | With Coverage | Without Coverage |
| Under 6 Years | 412 (79.8%) | 104 (20.2%) |
| 6 to 18 Years | 903 (77.4%) | 263 (22.6%) |
| 19 to 25 Years | 277 (57.0%) | 209 (43.0%) |
| 26 to 34 Years | 515 (81.0%) | 121 (19.0%) |
| 35 to 44 Years | 529 (68.8%) | 240 (31.2%) |
| 45 to 54 Years | 588 (73.5%) | 212 (26.5%) |
| 55 to 64 Years | 1,472 (95.4%) | 71 (4.6%) |
| 65 to 74 Years | 1,425 (100.0%) | 0 (0.0%) |
| 75 Years and older | 870 (99.1%) | 8 (0.9%) |
| Total | 6,991 (85.1%) | 1,228 (14.9%) |
Health Insurance Coverage by Citizenship Status in Oscoda County

| Citizenship Status | With Coverage | Without Coverage |
| Native Born | 412 (79.8%) | 104 (20.2%) |
| Foreign Born, Citizen | 903 (77.4%) | 263 (22.6%) |
| Foreign Born, not a Citizen | 277 (57.0%) | 209 (43.0%) |
Health Insurance Coverage by Household Income in Oscoda County
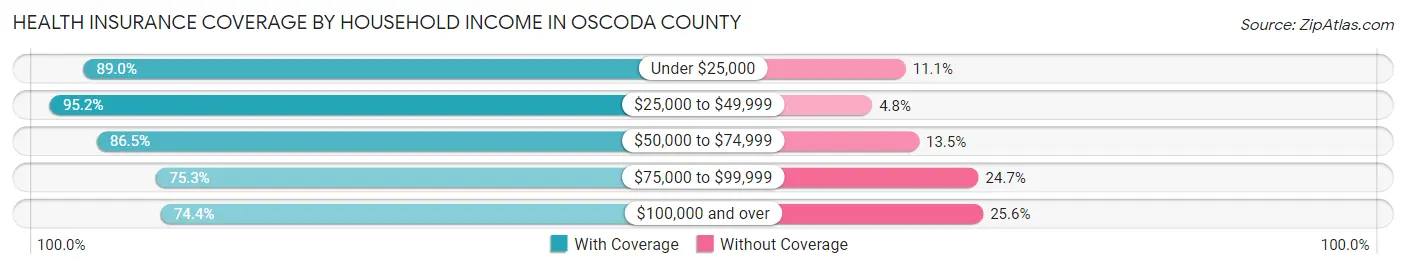
| Household Income | With Coverage | Without Coverage |
| Under $25,000 | 990 (88.9%) | 123 (11.1%) |
| $25,000 to $49,999 | 2,041 (95.2%) | 102 (4.8%) |
| $50,000 to $74,999 | 1,796 (86.5%) | 281 (13.5%) |
| $75,000 to $99,999 | 994 (75.3%) | 326 (24.7%) |
| $100,000 and over | 1,153 (74.4%) | 396 (25.6%) |
Public vs Private Health Insurance Coverage by Age in Oscoda County

| Age Bracket | Public Insurance | Private Insurance |
| Under 6 | 273 (52.9%) | 154 (29.8%) |
| 6 to 18 Years | 581 (49.8%) | 355 (30.4%) |
| 19 to 25 Years | 133 (27.4%) | 160 (32.9%) |
| 25 to 34 Years | 313 (49.2%) | 216 (34.0%) |
| 35 to 44 Years | 265 (34.5%) | 325 (42.3%) |
| 45 to 54 Years | 253 (31.6%) | 374 (46.8%) |
| 55 to 64 Years | 529 (34.3%) | 1,128 (73.1%) |
| 65 to 74 Years | 1,418 (99.5%) | 976 (68.5%) |
| 75 Years and over | 863 (98.3%) | 733 (83.5%) |
| Total | 4,628 (56.3%) | 4,421 (53.8%) |
Disability Status by Sex by Age in Oscoda County

| Age Bracket | Male | Female |
| Under 5 Years | 0 (0.0%) | 0 (0.0%) |
| 5 to 17 Years | 101 (15.7%) | 23 (4.2%) |
| 18 to 34 Years | 113 (18.9%) | 122 (20.8%) |
| 35 to 64 Years | 340 (21.4%) | 294 (19.3%) |
| 65 to 74 Years | 289 (38.8%) | 144 (21.2%) |
| 75 Years and over | 273 (64.8%) | 192 (42.0%) |
Disability Class by Sex by Age in Oscoda County
Disability Class: Hearing Difficulty
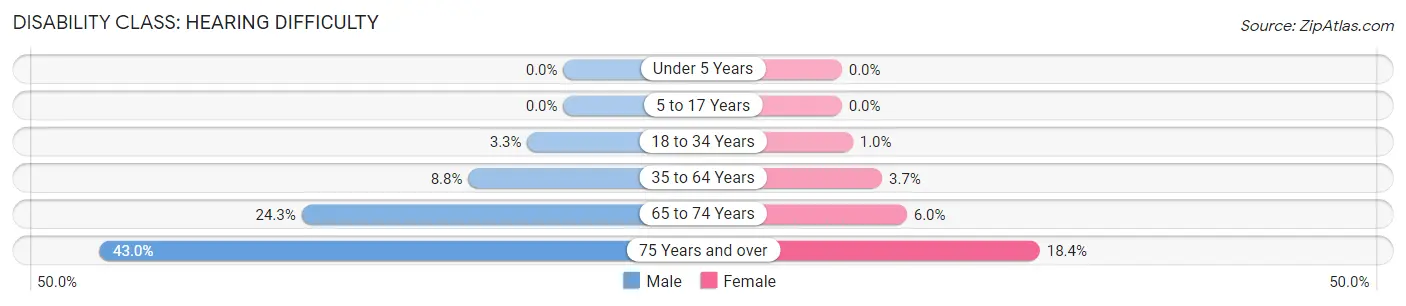
| Age Bracket | Male | Female |
| Under 5 Years | 0 (0.0%) | 0 (0.0%) |
| 5 to 17 Years | 0 (0.0%) | 0 (0.0%) |
| 18 to 34 Years | 20 (3.3%) | 6 (1.0%) |
| 35 to 64 Years | 140 (8.8%) | 57 (3.7%) |
| 65 to 74 Years | 181 (24.3%) | 41 (6.0%) |
| 75 Years and over | 181 (43.0%) | 84 (18.4%) |
Disability Class: Vision Difficulty

| Age Bracket | Male | Female |
| Under 5 Years | 0 (0.0%) | 0 (0.0%) |
| 5 to 17 Years | 0 (0.0%) | 2 (0.4%) |
| 18 to 34 Years | 56 (9.4%) | 9 (1.5%) |
| 35 to 64 Years | 35 (2.2%) | 55 (3.6%) |
| 65 to 74 Years | 22 (2.9%) | 14 (2.1%) |
| 75 Years and over | 70 (16.6%) | 41 (9.0%) |
Disability Class: Cognitive Difficulty
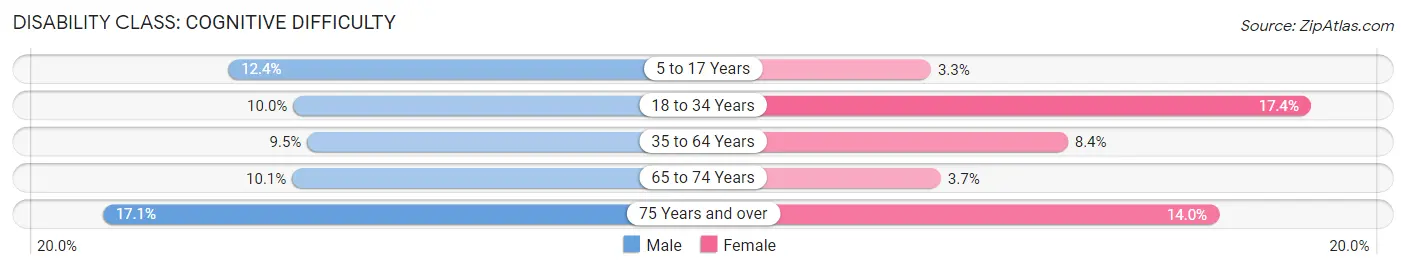
| Age Bracket | Male | Female |
| 5 to 17 Years | 80 (12.4%) | 18 (3.3%) |
| 18 to 34 Years | 60 (10.0%) | 102 (17.4%) |
| 35 to 64 Years | 151 (9.5%) | 128 (8.4%) |
| 65 to 74 Years | 75 (10.1%) | 25 (3.7%) |
| 75 Years and over | 72 (17.1%) | 64 (14.0%) |
Disability Class: Ambulatory Difficulty

| Age Bracket | Male | Female |
| 5 to 17 Years | 21 (3.3%) | 3 (0.5%) |
| 18 to 34 Years | 43 (7.2%) | 11 (1.9%) |
| 35 to 64 Years | 208 (13.1%) | 150 (9.8%) |
| 65 to 74 Years | 146 (19.6%) | 110 (16.2%) |
| 75 Years and over | 122 (29.0%) | 106 (23.2%) |
Disability Class: Self-Care Difficulty

| Age Bracket | Male | Female |
| 5 to 17 Years | 0 (0.0%) | 7 (1.3%) |
| 18 to 34 Years | 49 (8.2%) | 4 (0.7%) |
| 35 to 64 Years | 73 (4.6%) | 28 (1.8%) |
| 65 to 74 Years | 39 (5.2%) | 9 (1.3%) |
| 75 Years and over | 19 (4.5%) | 32 (7.0%) |
Technology Access in Oscoda County
Computing Device Access in Oscoda County
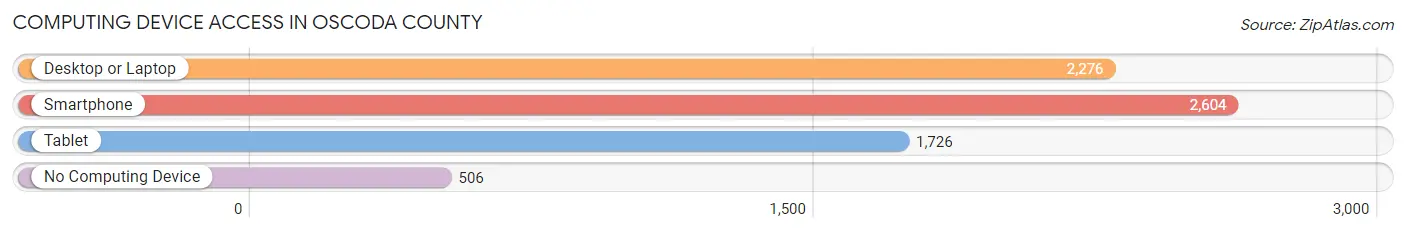
| Device Type | # Households | % Households |
| Desktop or Laptop | 2,276 | 65.0% |
| Smartphone | 2,604 | 74.4% |
| Tablet | 1,726 | 49.3% |
| No Computing Device | 506 | 14.5% |
| Total | 3,500 | 100.0% |
Internet Access in Oscoda County
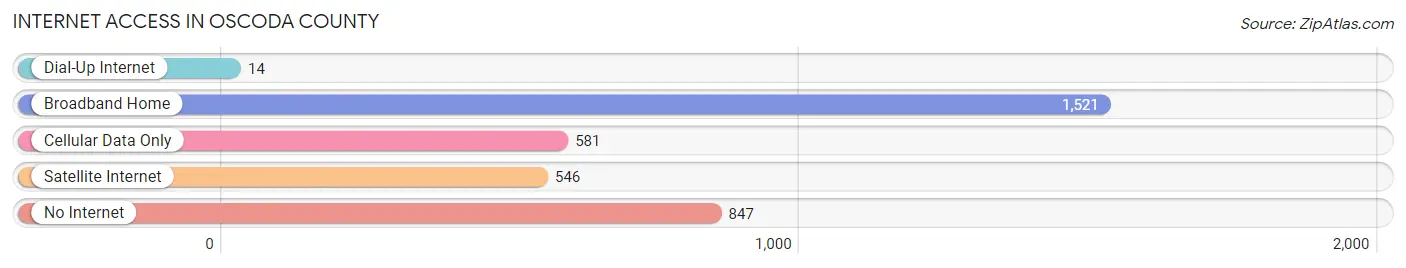
| Internet Type | # Households | % Households |
| Dial-Up Internet | 14 | 0.4% |
| Broadband Home | 1,521 | 43.5% |
| Cellular Data Only | 581 | 16.6% |
| Satellite Internet | 546 | 15.6% |
| No Internet | 847 | 24.2% |
| Total | 3,500 | 100.0% |
Oscoda County Summary
Oscoda County is a county located in the northeastern part of the Lower Peninsula of Michigan. It is part of the Northern Michigan region and is bordered by Alcona County to the north, Alpena County to the east, Iosco County to the south, and Crawford County to the west. The county seat is Mio, and the largest city is Oscoda. The county was created in 1840 and organized in 1881.
Geography
Oscoda County is located in the northeastern part of the Lower Peninsula of Michigan. It is bordered by Alcona County to the north, Alpena County to the east, Iosco County to the south, and Crawford County to the west. The county has a total area of 576 square miles, of which 563 square miles is land and 13 square miles (2.2%) is water. The Au Sable River flows through the county, and the Huron National Forest is located in the northern part of the county.
The terrain of Oscoda County is generally flat, with rolling hills in the northern part of the county. The highest point in the county is located in the Huron National Forest, at an elevation of 1,092 feet above sea level. The county is home to several lakes, including Big Lake, Big Creek Lake, and Lake Margrethe.
Demographics
As of the 2010 United States Census, there were 8,640 people, 3,717 households, and 2,521 families residing in the county. The population density was 15.3 inhabitants per square mile (5.9/km2). There were 5,845 housing units at an average density of 10.4 per square mile (4.0/km2). The racial makeup of the county was 96.7% white, 0.5% American Indian, 0.4% black or African American, 0.3% Asian, 0.2% from other races, and 1.9% from two or more races. Those of Hispanic or Latino origin made up 1.2% of the population. In terms of ancestry, 34.2% were German, 13.7% were English, 11.7% were Irish, and 8.2% were Polish.
Of the 3,717 households, 25.3% had children under the age of 18 living with them, 53.2% were married couples living together, 9.2% had a female householder with no husband present, 32.3% were non-families, and 27.2% of all households were made up of individuals. The average household size was 2.30 and the average family size was 2.76. The median age was 47.2 years.
The median income for a household in the county was $37,945 and the median income for a family was $45,938. Males had a median income of $37,945 versus $25,938 for females. The per capita income for the county was $20,945. About 11.2% of families and 14.7% of the population were below the poverty line, including 22.2% of those under age 18 and 8.2% of those age 65 or over.
Economy
The economy of Oscoda County is largely based on tourism and agriculture. The county is home to several state parks, including Huron National Forest, which is a popular destination for camping, fishing, and other outdoor activities. The county is also home to several wineries and breweries, as well as several golf courses.
Agriculture is also an important part of the county's economy. The county is home to several farms, which produce a variety of crops, including corn, soybeans, wheat, and hay. Livestock production is also an important part of the county's agricultural industry, with beef cattle, dairy cows, and hogs being the most common types of livestock.
The county is also home to several manufacturing companies, including Oscoda Plastics, which produces plastic products, and Oscoda Metal Products, which produces metal products. The county is also home to several logging companies, which harvest timber from the Huron National Forest.
Conclusion
Oscoda County is a county located in the northeastern part of the Lower Peninsula of Michigan. It is part of the Northern Michigan region and is bordered by Alcona County to the north, Alpena County to the east, Iosco County to the south, and Crawford County to the west. The county has a total area of 576 square miles, of which 563 square miles is land and 13 square miles (2.2%) is water. The county has a population of 8,640 people, and the median income for a household is $37,945. The economy of Oscoda County is largely based on tourism and agriculture, with state parks, wineries, breweries, golf courses, farms, and manufacturing companies all contributing to the local economy.
Common Questions
What is the Total Population of Oscoda County?
Total Population of Oscoda County is 8,264.
What is the Total Male Population of Oscoda County?
Total Male Population of Oscoda County is 4,231.
What is the Total Female Population of Oscoda County?
Total Female Population of Oscoda County is 4,033.
What is the Ratio of Males per 100 Females in Oscoda County?
There are 104.91 Males per 100 Females in Oscoda County.
What is the Ratio of Females per 100 Males in Oscoda County?
There are 95.32 Females per 100 Males in Oscoda County.
What is the Median Population Age in Oscoda County?
Median Population Age in Oscoda County is 52.0 Years.
What is the Average Family Size in Oscoda County
Average Family Size in Oscoda County is 2.9 People.
What is the Average Household Size in Oscoda County
Average Household Size in Oscoda County is 2.4 People.
What is Per Capita Income in Oscoda County?
Per Capita income in Oscoda County is $26,129.
What is the Median Family Income in Oscoda County?
Median Family Income in Oscoda County is $58,234.
What is the Median Household income in Oscoda County?
Median Household Income in Oscoda County is $48,692.
What is Income or Wage Gap in Oscoda County?
Income or Wage Gap in Oscoda County is 27.2%.
Women in Oscoda County earn 72.8 cents for every dollar earned by a man.
What is Family Income Deficit in Oscoda County?
Family Income Deficit in Oscoda County is $10,631.
Families that are below poverty line in Oscoda County earn $10,631 less on average than the poverty threshold level.
What is Inequality or Gini Index in Oscoda County?
Inequality or Gini Index in Oscoda County is 0.41.
How Large is the Labor Force in Oscoda County?
There are 3,046 People in the Labor Forcein in Oscoda County.
What is the Percentage of People in the Labor Force in Oscoda County?
44.5% of People are in the Labor Force in Oscoda County.
What is the Unemployment Rate in Oscoda County?
Unemployment Rate in Oscoda County is 8.9%.