Montcalm County, MI
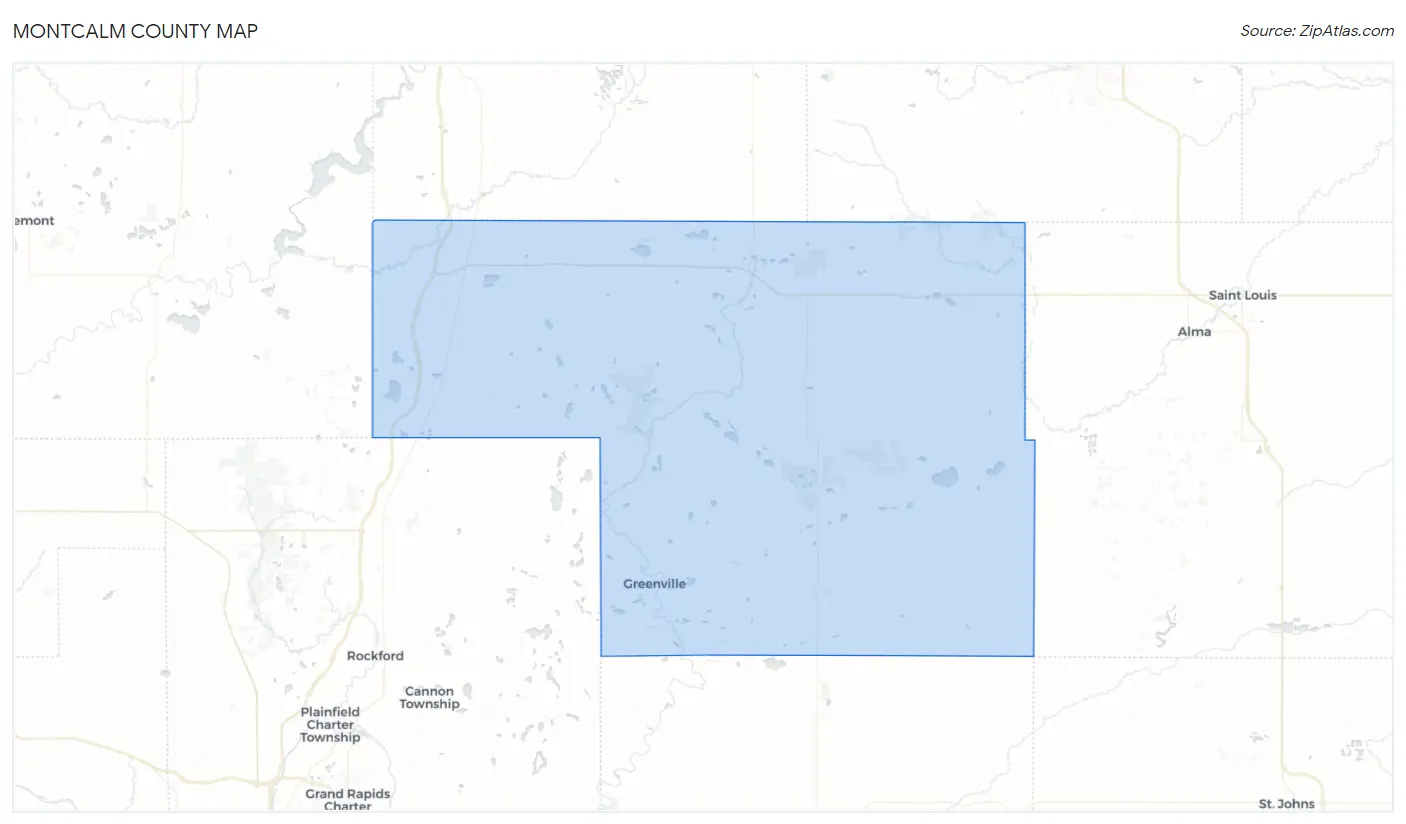
Montcalm County Map
Montcalm County Overview
66,901
TOTAL POPULATION
35,863
MALE POPULATION
31,038
FEMALE POPULATION
115.55
MALES / 100 FEMALES
86.55
FEMALES / 100 MALES
40.6
MEDIAN AGE
3.2
AVG FAMILY SIZE
2.7
AVG HOUSEHOLD SIZE
$28,370
PER CAPITA INCOME
$70,362
AVG FAMILY INCOME
$61,250
AVG HOUSEHOLD INCOME
30.1%
WAGE / INCOME GAP [ % ]
69.9¢/ $1
WAGE / INCOME GAP [ $ ]
$10,051
FAMILY INCOME DEFICIT
0.40
INEQUALITY / GINI INDEX
30,109
LABOR FORCE [ PEOPLE ]
55.5%
PERCENT IN LABOR FORCE
4.2%
UNEMPLOYMENT RATE
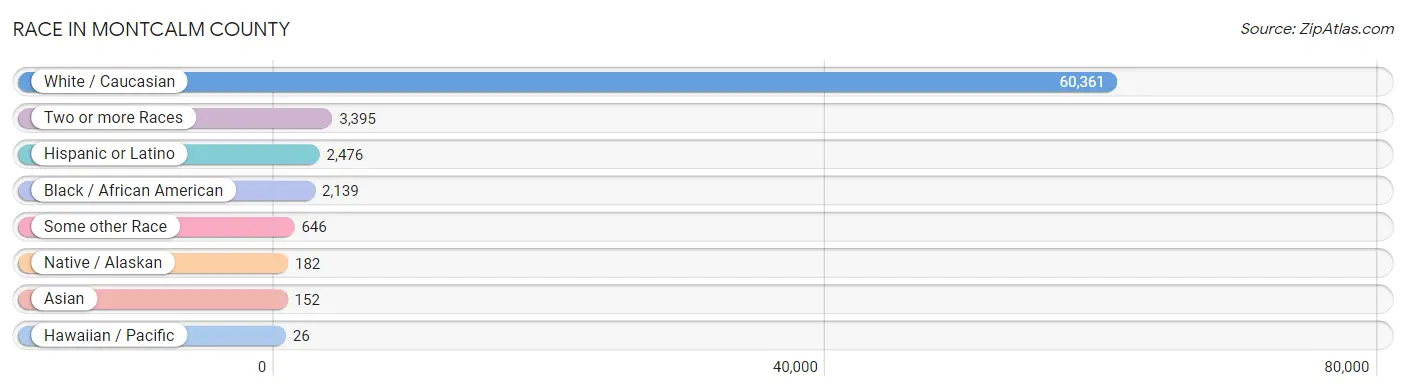
Race in Montcalm County
The most populous races in Montcalm County are White / Caucasian (60,361 | 90.2%), Two or more Races (3,395 | 5.1%), and Hispanic or Latino (2,476 | 3.7%).
| Race | # Population | % Population |
| Asian | 152 | 0.2% |
| Black / African American | 2,139 | 3.2% |
| Hawaiian / Pacific | 26 | 0.0% |
| Hispanic or Latino | 2,476 | 3.7% |
| Native / Alaskan | 182 | 0.3% |
| White / Caucasian | 60,361 | 90.2% |
| Two or more Races | 3,395 | 5.1% |
| Some other Race | 646 | 1.0% |
| Total | 66,901 | 100.0% |
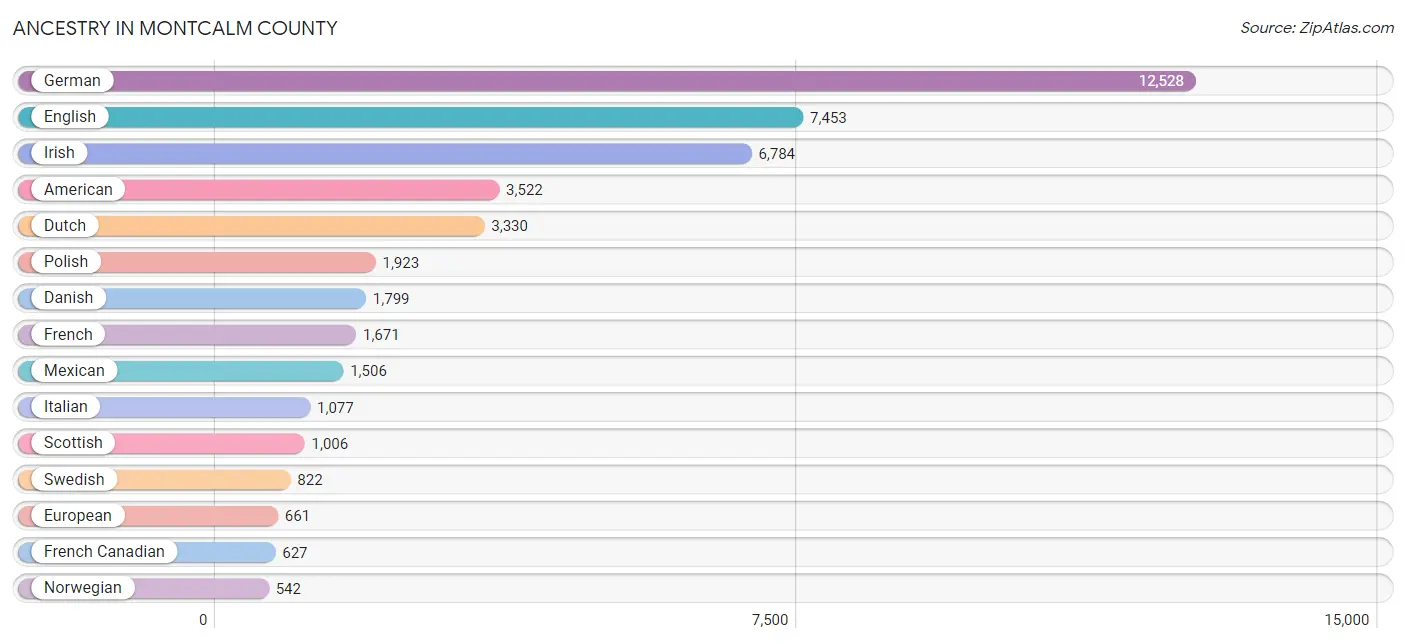
Ancestry in Montcalm County
The most populous ancestries reported in Montcalm County are German (12,528 | 18.7%), English (7,453 | 11.1%), Irish (6,784 | 10.1%), American (3,522 | 5.3%), and Dutch (3,330 | 5.0%), together accounting for 50.2% of all Montcalm County residents.
| Ancestry | # Population | % Population |
| African | 122 | 0.2% |
| American | 3,522 | 5.3% |
| Arab | 226 | 0.3% |
| Assyrian / Chaldean / Syriac | 9 | 0.0% |
| Austrian | 80 | 0.1% |
| Belgian | 99 | 0.2% |
| Bhutanese | 45 | 0.1% |
| Blackfeet | 5 | 0.0% |
| British | 188 | 0.3% |
| British West Indian | 23 | 0.0% |
| Bulgarian | 29 | 0.0% |
| Burmese | 7 | 0.0% |
| Canadian | 213 | 0.3% |
| Celtic | 17 | 0.0% |
| Central American | 9 | 0.0% |
| Cherokee | 38 | 0.1% |
| Chilean | 45 | 0.1% |
| Chippewa | 171 | 0.3% |
| Colombian | 27 | 0.0% |
| Cree | 3 | 0.0% |
| Croatian | 46 | 0.1% |
| Cuban | 119 | 0.2% |
| Czech | 164 | 0.3% |
| Czechoslovakian | 54 | 0.1% |
| Danish | 1,799 | 2.7% |
| Dutch | 3,330 | 5.0% |
| Eastern European | 99 | 0.2% |
| Egyptian | 3 | 0.0% |
| English | 7,453 | 11.1% |
| European | 661 | 1.0% |
| Finnish | 353 | 0.5% |
| French | 1,671 | 2.5% |
| French American Indian | 3 | 0.0% |
| French Canadian | 627 | 0.9% |
| German | 12,528 | 18.7% |
| Greek | 140 | 0.2% |
| Guatemalan | 9 | 0.0% |
| Haitian | 52 | 0.1% |
| Hungarian | 102 | 0.2% |
| Icelander | 5 | 0.0% |
| Indian (Asian) | 37 | 0.1% |
| Iraqi | 19 | 0.0% |
| Irish | 6,784 | 10.1% |
| Iroquois | 4 | 0.0% |
| Israeli | 4 | 0.0% |
| Italian | 1,077 | 1.6% |
| Jamaican | 274 | 0.4% |
| Korean | 140 | 0.2% |
| Latvian | 8 | 0.0% |
| Lebanese | 58 | 0.1% |
| Lithuanian | 44 | 0.1% |
| Menominee | 6 | 0.0% |
| Mexican | 1,506 | 2.2% |
| Mexican American Indian | 11 | 0.0% |
| Moroccan | 43 | 0.1% |
| Native Hawaiian | 225 | 0.3% |
| Navajo | 3 | 0.0% |
| Northern European | 23 | 0.0% |
| Norwegian | 542 | 0.8% |
| Ottawa | 23 | 0.0% |
| Pakistani | 66 | 0.1% |
| Pennsylvania German | 163 | 0.2% |
| Polish | 1,923 | 2.9% |
| Portuguese | 27 | 0.0% |
| Potawatomi | 14 | 0.0% |
| Puerto Rican | 395 | 0.6% |
| Romanian | 28 | 0.0% |
| Russian | 104 | 0.2% |
| Scandinavian | 173 | 0.3% |
| Scotch-Irish | 366 | 0.5% |
| Scottish | 1,006 | 1.5% |
| Slavic | 25 | 0.0% |
| Slovak | 67 | 0.1% |
| South American | 82 | 0.1% |
| Spaniard | 1 | 0.0% |
| Spanish | 91 | 0.1% |
| Sri Lankan | 97 | 0.1% |
| Subsaharan African | 124 | 0.2% |
| Swedish | 822 | 1.2% |
| Swiss | 174 | 0.3% |
| Syrian | 68 | 0.1% |
| Tlingit-Haida | 21 | 0.0% |
| Ukrainian | 21 | 0.0% |
| Venezuelan | 10 | 0.0% |
| Welsh | 195 | 0.3% |
| West Indian | 9 | 0.0% |
| Yugoslavian | 50 | 0.1% | View All 87 Rows |
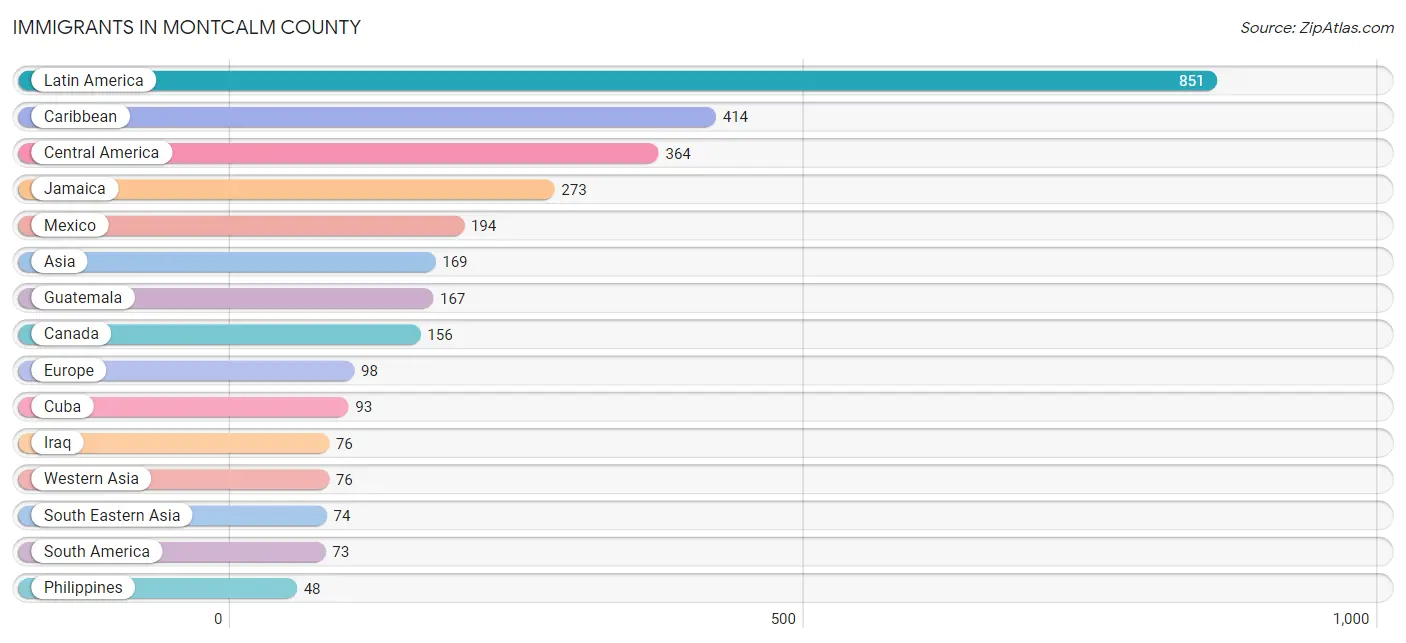
Immigrants in Montcalm County
The most numerous immigrant groups reported in Montcalm County came from Latin America (851 | 1.3%), Caribbean (414 | 0.6%), Central America (364 | 0.5%), Jamaica (273 | 0.4%), and Mexico (194 | 0.3%), together accounting for 3.1% of all Montcalm County residents.
| Immigration Origin | # Population | % Population |
| Africa | 2 | 0.0% |
| Asia | 169 | 0.3% |
| Barbados | 17 | 0.0% |
| Canada | 156 | 0.2% |
| Caribbean | 414 | 0.6% |
| Central America | 364 | 0.5% |
| Chile | 29 | 0.0% |
| China | 9 | 0.0% |
| Colombia | 27 | 0.0% |
| Costa Rica | 3 | 0.0% |
| Cuba | 93 | 0.1% |
| Eastern Africa | 2 | 0.0% |
| Eastern Asia | 19 | 0.0% |
| Eastern Europe | 41 | 0.1% |
| Ecuador | 13 | 0.0% |
| England | 7 | 0.0% |
| Europe | 98 | 0.2% |
| Germany | 27 | 0.0% |
| Guatemala | 167 | 0.3% |
| Haiti | 8 | 0.0% |
| Iraq | 76 | 0.1% |
| Jamaica | 273 | 0.4% |
| Japan | 3 | 0.0% |
| Korea | 7 | 0.0% |
| Latin America | 851 | 1.3% |
| Mexico | 194 | 0.3% |
| Netherlands | 20 | 0.0% |
| Northern Europe | 10 | 0.0% |
| Philippines | 48 | 0.1% |
| Poland | 37 | 0.1% |
| Russia | 4 | 0.0% |
| Scotland | 3 | 0.0% |
| South America | 73 | 0.1% |
| South Eastern Asia | 74 | 0.1% |
| Venezuela | 4 | 0.0% |
| Vietnam | 26 | 0.0% |
| Western Asia | 76 | 0.1% |
| Western Europe | 47 | 0.1% | View All 38 Rows |
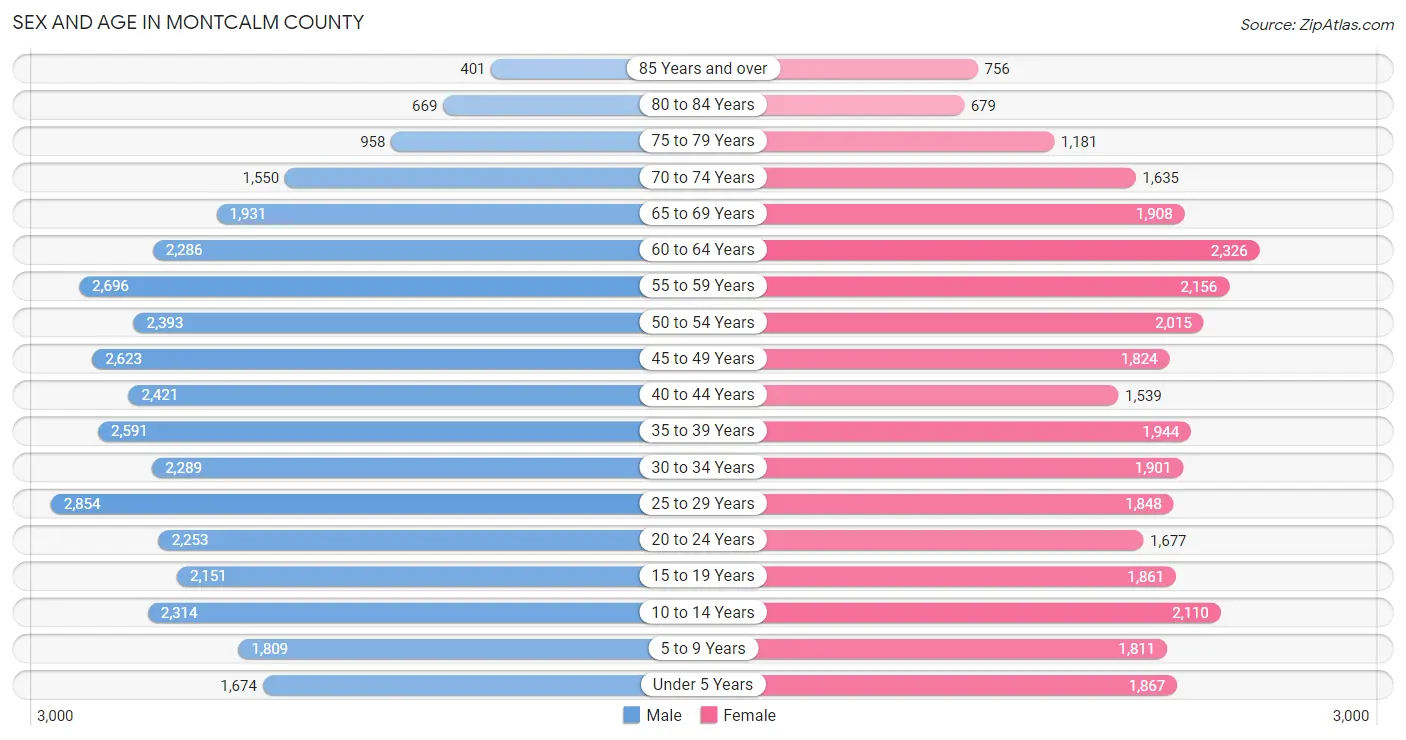
Sex and Age in Montcalm County
Sex and Age in Montcalm County
The most populous age groups in Montcalm County are 25 to 29 Years (2,854 | 8.0%) for men and 60 to 64 Years (2,326 | 7.5%) for women.
| Age Bracket | Male | Female |
| Under 5 Years | 1,674 (4.7%) | 1,867 (6.0%) |
| 5 to 9 Years | 1,809 (5.0%) | 1,811 (5.8%) |
| 10 to 14 Years | 2,314 (6.5%) | 2,110 (6.8%) |
| 15 to 19 Years | 2,151 (6.0%) | 1,861 (6.0%) |
| 20 to 24 Years | 2,253 (6.3%) | 1,677 (5.4%) |
| 25 to 29 Years | 2,854 (8.0%) | 1,848 (5.9%) |
| 30 to 34 Years | 2,289 (6.4%) | 1,901 (6.1%) |
| 35 to 39 Years | 2,591 (7.2%) | 1,944 (6.3%) |
| 40 to 44 Years | 2,421 (6.8%) | 1,539 (5.0%) |
| 45 to 49 Years | 2,623 (7.3%) | 1,824 (5.9%) |
| 50 to 54 Years | 2,393 (6.7%) | 2,015 (6.5%) |
| 55 to 59 Years | 2,696 (7.5%) | 2,156 (7.0%) |
| 60 to 64 Years | 2,286 (6.4%) | 2,326 (7.5%) |
| 65 to 69 Years | 1,931 (5.4%) | 1,908 (6.1%) |
| 70 to 74 Years | 1,550 (4.3%) | 1,635 (5.3%) |
| 75 to 79 Years | 958 (2.7%) | 1,181 (3.8%) |
| 80 to 84 Years | 669 (1.9%) | 679 (2.2%) |
| 85 Years and over | 401 (1.1%) | 756 (2.4%) |
| Total | 35,863 (100.0%) | 31,038 (100.0%) |
Families and Households in Montcalm County
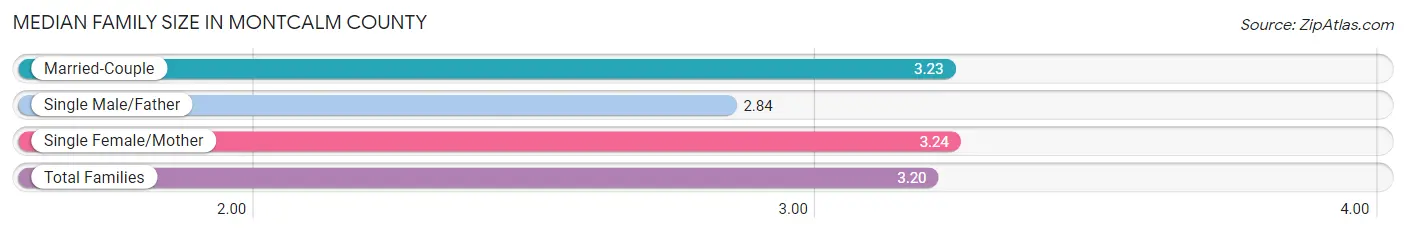
Median Family Size in Montcalm County
The median family size in Montcalm County is 3.20 persons per family, with single female/mother families (2,228 | 13.5%) accounting for the largest median family size of 3.24 persons per family. On the other hand, single male/father families (1,571 | 9.5%) represent the smallest median family size with 2.84 persons per family.
| Family Type | # Families | Family Size |
| Married-Couple | 12,697 (77.0%) | 3.23 |
| Single Male/Father | 1,571 (9.5%) | 2.84 |
| Single Female/Mother | 2,228 (13.5%) | 3.24 |
| Total Families | 16,496 (100.0%) | 3.20 |
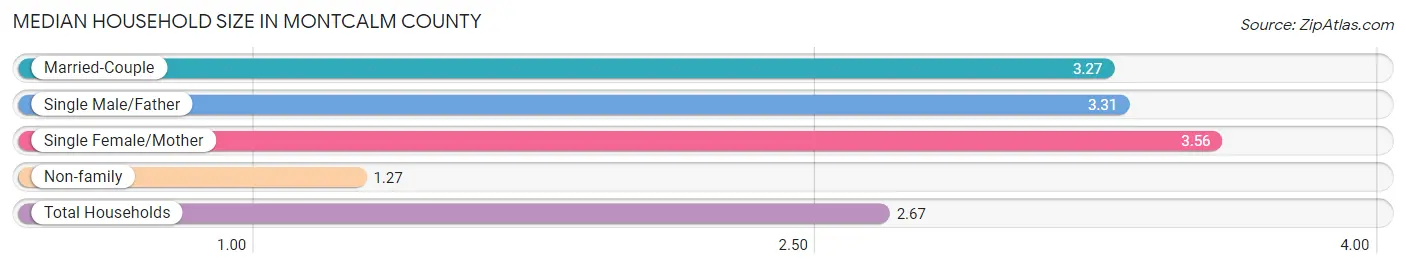
Median Household Size in Montcalm County
The median household size in Montcalm County is 2.67 persons per household, with single female/mother households (2,228 | 9.3%) accounting for the largest median household size of 3.56 persons per household. non-family households (7,488 | 31.2%) represent the smallest median household size with 1.27 persons per household.
| Household Type | # Households | Household Size |
| Married-Couple | 12,697 (52.9%) | 3.27 |
| Single Male/Father | 1,571 (6.6%) | 3.31 |
| Single Female/Mother | 2,228 (9.3%) | 3.56 |
| Non-family | 7,488 (31.2%) | 1.27 |
| Total Households | 23,984 (100.0%) | 2.67 |
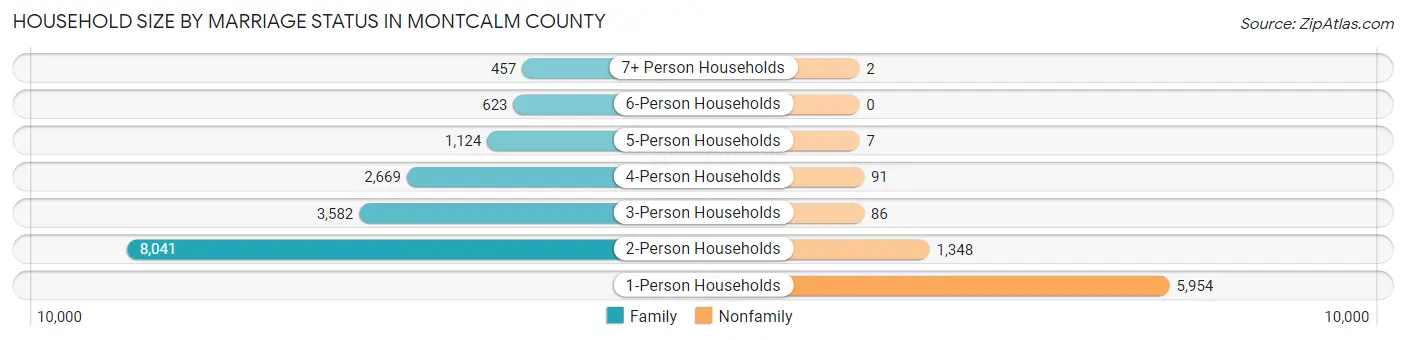
Household Size by Marriage Status in Montcalm County
Out of a total of 23,984 households in Montcalm County, 16,496 (68.8%) are family households, while 7,488 (31.2%) are nonfamily households. The most numerous type of family households are 2-person households, comprising 8,041, and the most common type of nonfamily households are 1-person households, comprising 5,954.
| Household Size | Family Households | Nonfamily Households |
| 1-Person Households | - | 5,954 (24.8%) |
| 2-Person Households | 8,041 (33.5%) | 1,348 (5.6%) |
| 3-Person Households | 3,582 (14.9%) | 86 (0.4%) |
| 4-Person Households | 2,669 (11.1%) | 91 (0.4%) |
| 5-Person Households | 1,124 (4.7%) | 7 (0.0%) |
| 6-Person Households | 623 (2.6%) | 0 (0.0%) |
| 7+ Person Households | 457 (1.9%) | 2 (0.0%) |
| Total | 16,496 (68.8%) | 7,488 (31.2%) |
Female Fertility in Montcalm County
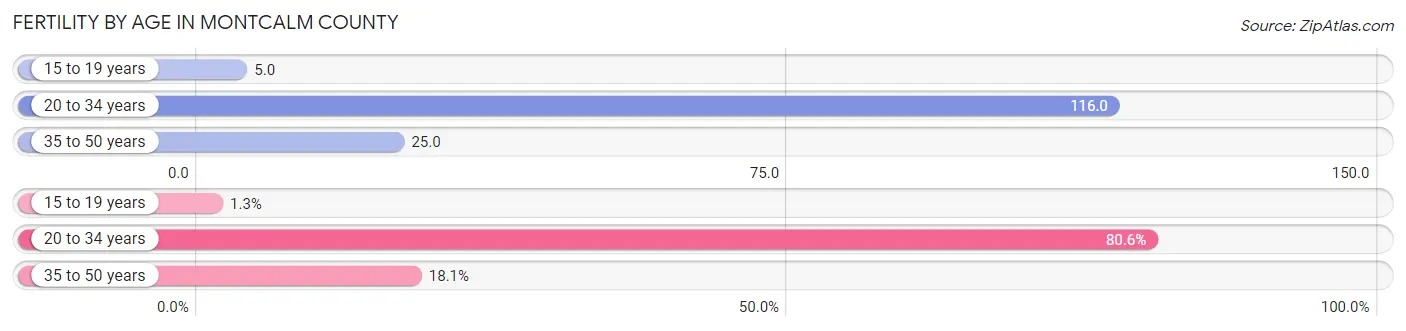
Fertility by Age in Montcalm County
Average fertility rate in Montcalm County is 60.0 births per 1,000 women. Women in the age bracket of 20 to 34 years have the highest fertility rate with 116.0 births per 1,000 women. Women in the age bracket of 20 to 34 years acount for 80.6% of all women with births.
| Age Bracket | Women with Births | Births / 1,000 Women |
| 15 to 19 years | 10 (1.3%) | 5.0 |
| 20 to 34 years | 631 (80.6%) | 116.0 |
| 35 to 50 years | 142 (18.1%) | 25.0 |
| Total | 783 (100.0%) | 60.0 |
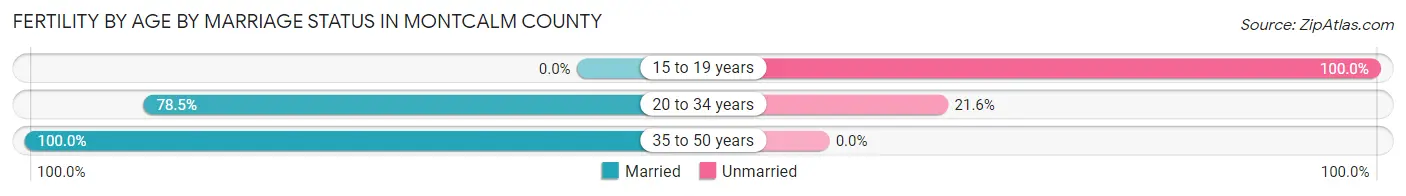
Fertility by Age by Marriage Status in Montcalm County
81.4% of women with births (783) in Montcalm County are married. The highest percentage of unmarried women with births falls into 15 to 19 years age bracket with 100.0% of them unmarried at the time of birth, while the lowest percentage of unmarried women with births belong to 35 to 50 years age bracket with 0.0% of them unmarried.
| Age Bracket | Married | Unmarried |
| 15 to 19 years | 0 (0.0%) | 10 (100.0%) |
| 20 to 34 years | 495 (78.4%) | 136 (21.5%) |
| 35 to 50 years | 142 (100.0%) | 0 (0.0%) |
| Total | 637 (81.4%) | 146 (18.6%) |
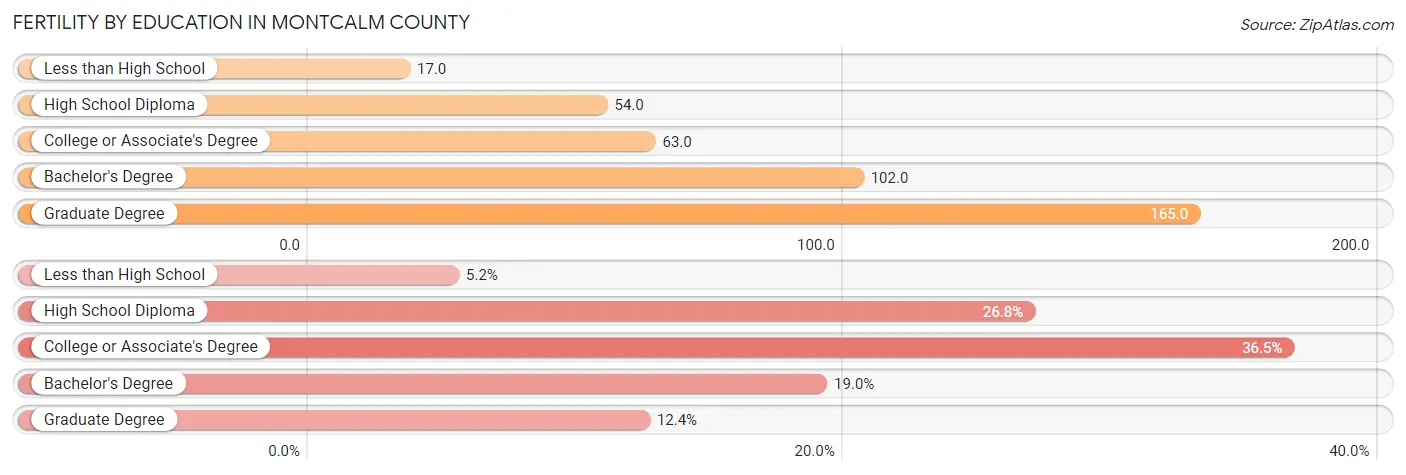
Fertility by Education in Montcalm County
Average fertility rate in Montcalm County is 60.0 births per 1,000 women. Women with the education attainment of graduate degree have the highest fertility rate of 165.0 births per 1,000 women, while women with the education attainment of less than high school have the lowest fertility at 17.0 births per 1,000 women. Women with the education attainment of college or associate's degree represent 36.5% of all women with births.
| Educational Attainment | Women with Births | Births / 1,000 Women |
| Less than High School | 41 (5.2%) | 17.0 |
| High School Diploma | 210 (26.8%) | 54.0 |
| College or Associate's Degree | 286 (36.5%) | 63.0 |
| Bachelor's Degree | 149 (19.0%) | 102.0 |
| Graduate Degree | 97 (12.4%) | 165.0 |
| Total | 783 (100.0%) | 60.0 |
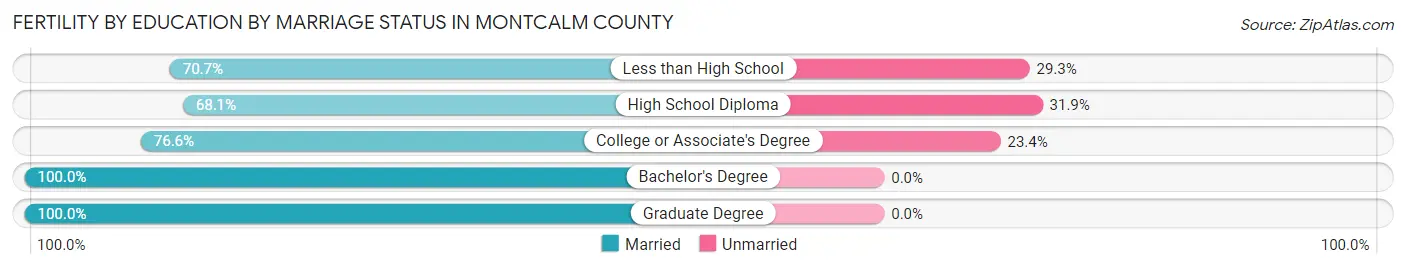
Fertility by Education by Marriage Status in Montcalm County
18.6% of women with births in Montcalm County are unmarried. Women with the educational attainment of bachelor's degree are most likely to be married with 100.0% of them married at childbirth, while women with the educational attainment of high school diploma are least likely to be married with 31.9% of them unmarried at childbirth.
| Educational Attainment | Married | Unmarried |
| Less than High School | 29 (70.7%) | 12 (29.3%) |
| High School Diploma | 143 (68.1%) | 67 (31.9%) |
| College or Associate's Degree | 219 (76.6%) | 67 (23.4%) |
| Bachelor's Degree | 149 (100.0%) | 0 (0.0%) |
| Graduate Degree | 97 (100.0%) | 0 (0.0%) |
| Total | 637 (81.4%) | 146 (18.6%) |
Income in Montcalm County
Income Overview in Montcalm County
Per Capita Income in Montcalm County is $28,370, while median incomes of families and households are $70,362 and $61,250 respectively.
| Characteristic | Number | Measure |
| Per Capita Income | 66,901 | $28,370 |
| Median Family Income | 16,496 | $70,362 |
| Mean Family Income | 16,496 | $83,351 |
| Median Household Income | 23,984 | $61,250 |
| Mean Household Income | 23,984 | $73,320 |
| Income Deficit | 16,496 | $10,051 |
| Wage / Income Gap (%) | 66,901 | 30.07% |
| Wage / Income Gap ($) | 66,901 | 69.93¢ per $1 |
| Gini / Inequality Index | 66,901 | 0.40 |
Earnings by Sex in Montcalm County
Average Earnings in Montcalm County are $35,622, $41,717 for men and $29,174 for women, a difference of 30.1%.
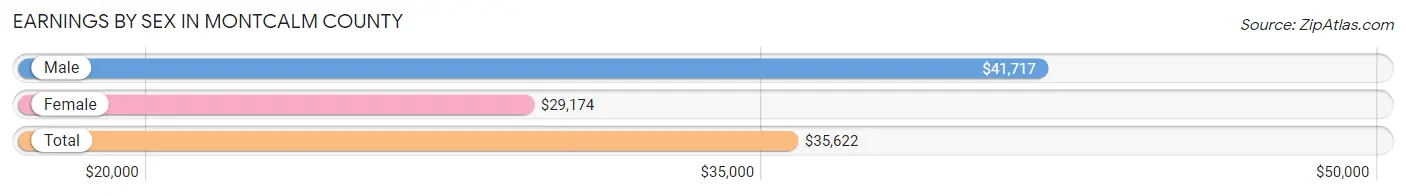
| Sex | Number | Average Earnings |
| Male | 18,699 (58.4%) | $41,717 |
| Female | 13,332 (41.6%) | $29,174 |
| Total | 32,031 (100.0%) | $35,622 |
Earnings by Sex by Income Bracket in Montcalm County
The most common earnings brackets in Montcalm County are $55,000 to $64,999 for men (1,884 | 10.1%) and $30,000 to $34,999 for women (1,232 | 9.2%).
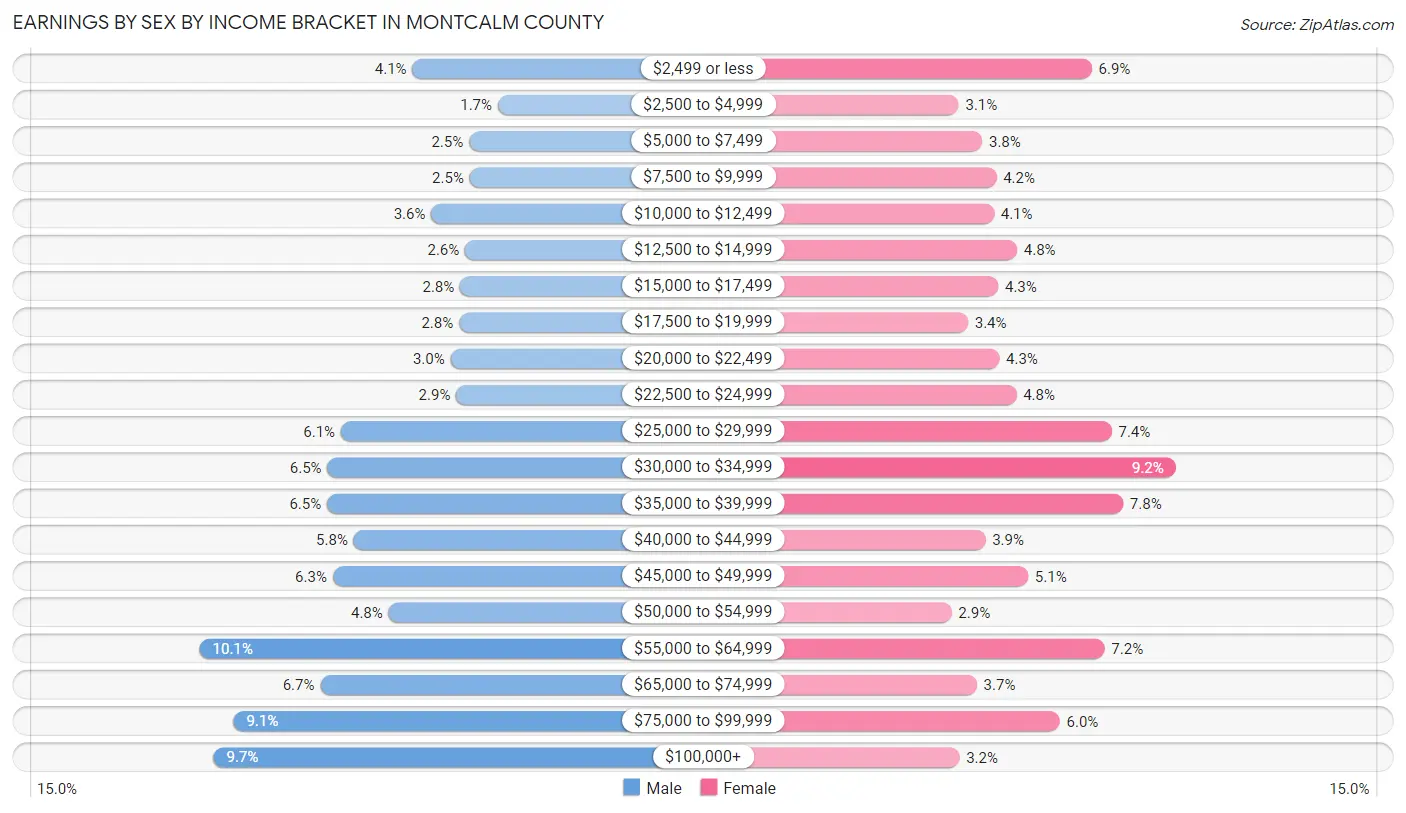
| Income | Male | Female |
| $2,499 or less | 767 (4.1%) | 917 (6.9%) |
| $2,500 to $4,999 | 317 (1.7%) | 419 (3.1%) |
| $5,000 to $7,499 | 470 (2.5%) | 507 (3.8%) |
| $7,500 to $9,999 | 465 (2.5%) | 560 (4.2%) |
| $10,000 to $12,499 | 667 (3.6%) | 551 (4.1%) |
| $12,500 to $14,999 | 490 (2.6%) | 637 (4.8%) |
| $15,000 to $17,499 | 516 (2.8%) | 566 (4.3%) |
| $17,500 to $19,999 | 522 (2.8%) | 453 (3.4%) |
| $20,000 to $22,499 | 567 (3.0%) | 571 (4.3%) |
| $22,500 to $24,999 | 537 (2.9%) | 635 (4.8%) |
| $25,000 to $29,999 | 1,143 (6.1%) | 992 (7.4%) |
| $30,000 to $34,999 | 1,214 (6.5%) | 1,232 (9.2%) |
| $35,000 to $39,999 | 1,215 (6.5%) | 1,034 (7.8%) |
| $40,000 to $44,999 | 1,076 (5.8%) | 518 (3.9%) |
| $45,000 to $49,999 | 1,186 (6.3%) | 679 (5.1%) |
| $50,000 to $54,999 | 892 (4.8%) | 392 (2.9%) |
| $55,000 to $64,999 | 1,884 (10.1%) | 965 (7.2%) |
| $65,000 to $74,999 | 1,251 (6.7%) | 486 (3.6%) |
| $75,000 to $99,999 | 1,708 (9.1%) | 797 (6.0%) |
| $100,000+ | 1,812 (9.7%) | 421 (3.2%) |
| Total | 18,699 (100.0%) | 13,332 (100.0%) |
Earnings by Sex by Educational Attainment in Montcalm County
Average earnings in Montcalm County are $46,212 for men and $33,200 for women, a difference of 28.2%. Men with an educational attainment of graduate degree enjoy the highest average annual earnings of $61,705, while those with high school diploma education earn the least with $38,821. Women with an educational attainment of graduate degree earn the most with the average annual earnings of $74,421, while those with less than high school education have the smallest earnings of $21,976.
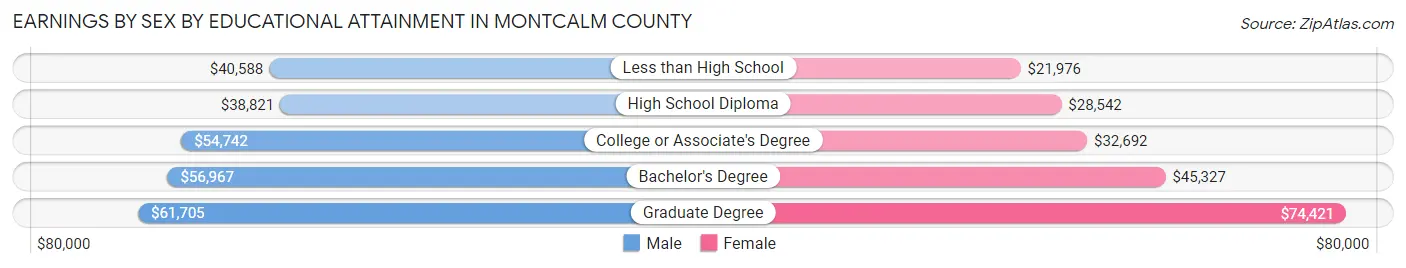
| Educational Attainment | Male Income | Female Income |
| Less than High School | $40,588 | $21,976 |
| High School Diploma | $38,821 | $28,542 |
| College or Associate's Degree | $54,742 | $32,692 |
| Bachelor's Degree | $56,967 | $45,327 |
| Graduate Degree | $61,705 | $74,421 |
| Total | $46,212 | $33,200 |
Family Income in Montcalm County
Family Income Brackets in Montcalm County
According to the Montcalm County family income data, there are 3,745 families falling into the $50,000 to $74,999 income range, which is the most common income bracket and makes up 22.7% of all families. Conversely, the less than $10,000 income bracket is the least frequent group with only 412 families (2.5%) belonging to this category.
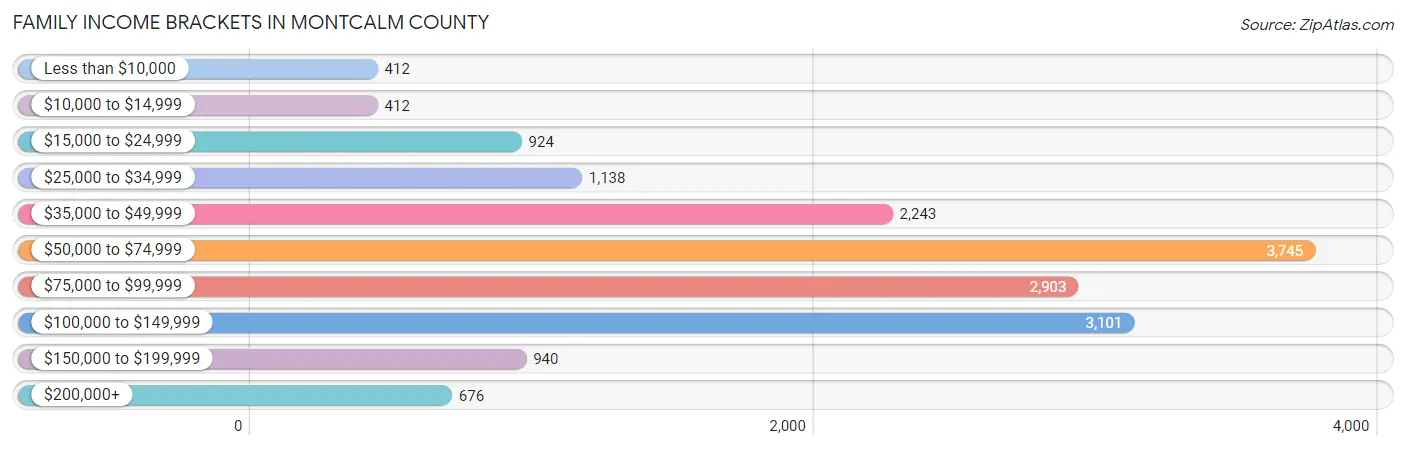
| Income Bracket | # Families | % Families |
| Less than $10,000 | 412 | 2.5% |
| $10,000 to $14,999 | 412 | 2.5% |
| $15,000 to $24,999 | 924 | 5.6% |
| $25,000 to $34,999 | 1,138 | 6.9% |
| $35,000 to $49,999 | 2,243 | 13.6% |
| $50,000 to $74,999 | 3,745 | 22.7% |
| $75,000 to $99,999 | 2,903 | 17.6% |
| $100,000 to $149,999 | 3,101 | 18.8% |
| $150,000 to $199,999 | 940 | 5.7% |
| $200,000+ | 676 | 4.1% |
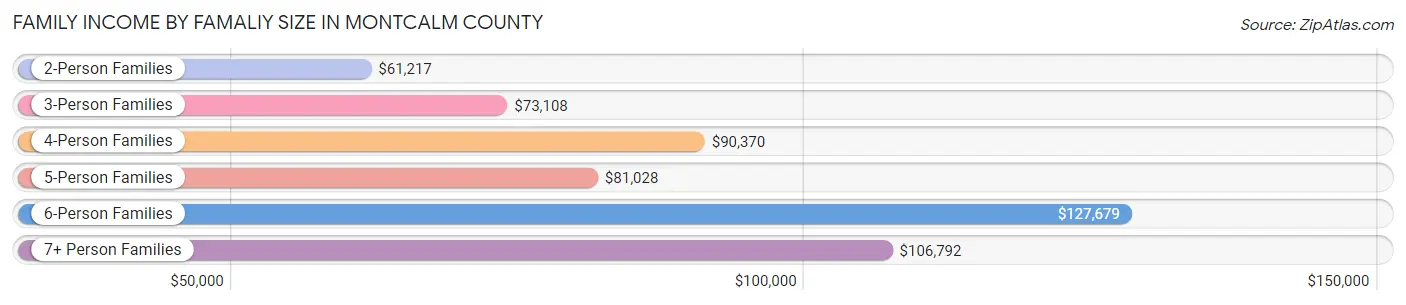
Family Income by Famaliy Size in Montcalm County
6-person families (581 | 3.5%) account for the highest median family income in Montcalm County with $127,679 per family, while 2-person families (8,706 | 52.8%) have the highest median income of $30,608 per family member.
| Income Bracket | # Families | Median Income |
| 2-Person Families | 8,706 (52.8%) | $61,217 |
| 3-Person Families | 3,507 (21.3%) | $73,108 |
| 4-Person Families | 2,287 (13.9%) | $90,370 |
| 5-Person Families | 1,003 (6.1%) | $81,028 |
| 6-Person Families | 581 (3.5%) | $127,679 |
| 7+ Person Families | 412 (2.5%) | $106,792 |
| Total | 16,496 (100.0%) | $70,362 |
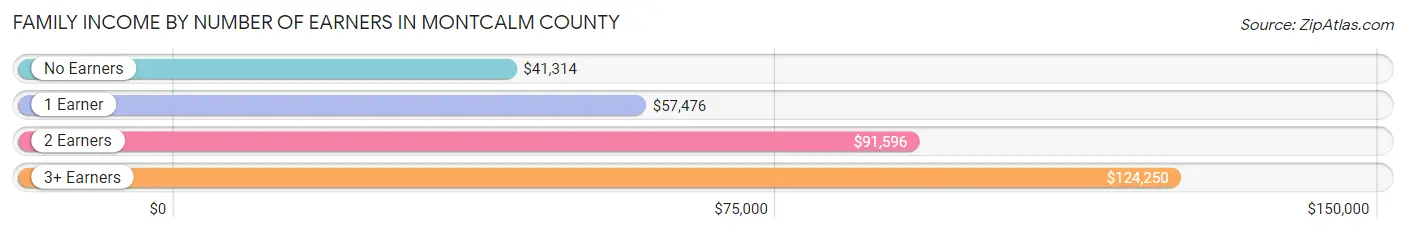
Family Income by Number of Earners in Montcalm County
The median family income in Montcalm County is $70,362, with families comprising 3+ earners (1,420) having the highest median family income of $124,250, while families with no earners (3,492) have the lowest median family income of $41,314, accounting for 8.6% and 21.2% of families, respectively.
| Number of Earners | # Families | Median Income |
| No Earners | 3,492 (21.2%) | $41,314 |
| 1 Earner | 5,294 (32.1%) | $57,476 |
| 2 Earners | 6,290 (38.1%) | $91,596 |
| 3+ Earners | 1,420 (8.6%) | $124,250 |
| Total | 16,496 (100.0%) | $70,362 |
Household Income in Montcalm County
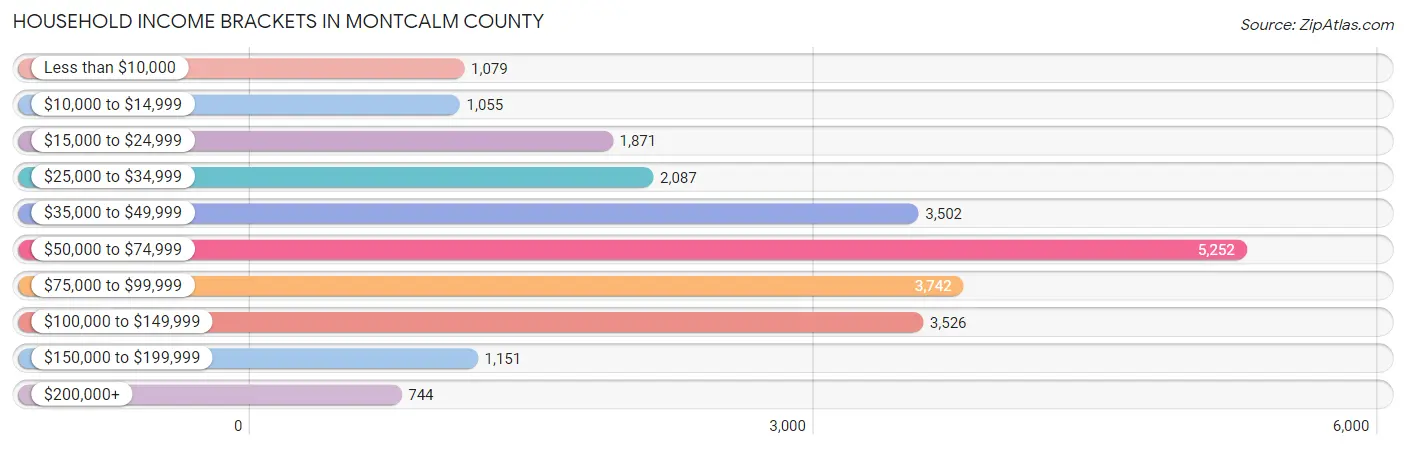
Household Income Brackets in Montcalm County
With 5,252 households falling in the category, the $50,000 to $74,999 income range is the most frequent in Montcalm County, accounting for 21.9% of all households. In contrast, only 744 households (3.1%) fall into the $200,000+ income bracket, making it the least populous group.
| Income Bracket | # Households | % Households |
| Less than $10,000 | 1,079 | 4.5% |
| $10,000 to $14,999 | 1,055 | 4.4% |
| $15,000 to $24,999 | 1,871 | 7.8% |
| $25,000 to $34,999 | 2,087 | 8.7% |
| $35,000 to $49,999 | 3,502 | 14.6% |
| $50,000 to $74,999 | 5,252 | 21.9% |
| $75,000 to $99,999 | 3,742 | 15.6% |
| $100,000 to $149,999 | 3,526 | 14.7% |
| $150,000 to $199,999 | 1,151 | 4.8% |
| $200,000+ | 744 | 3.1% |
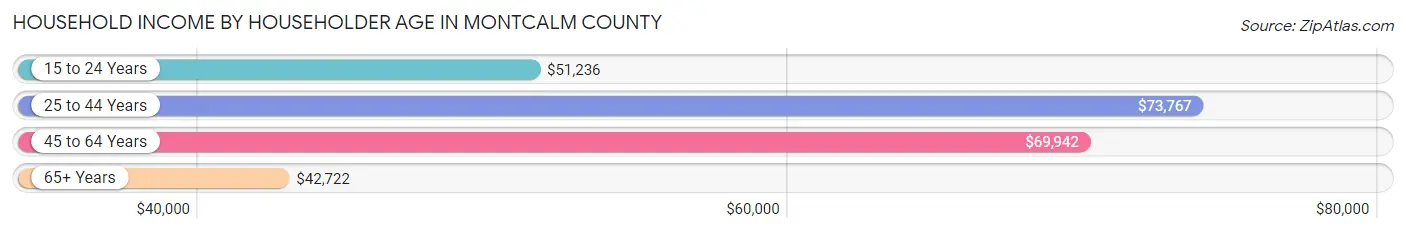
Household Income by Householder Age in Montcalm County
The median household income in Montcalm County is $61,250, with the highest median household income of $73,767 found in the 25 to 44 years age bracket for the primary householder. A total of 6,968 households (29.0%) fall into this category. Meanwhile, the 65+ years age bracket for the primary householder has the lowest median household income of $42,722, with 7,150 households (29.8%) in this group.
| Income Bracket | # Households | Median Income |
| 15 to 24 Years | 945 (3.9%) | $51,236 |
| 25 to 44 Years | 6,968 (29.0%) | $73,767 |
| 45 to 64 Years | 8,921 (37.2%) | $69,942 |
| 65+ Years | 7,150 (29.8%) | $42,722 |
| Total | 23,984 (100.0%) | $61,250 |
Poverty in Montcalm County
Income Below Poverty by Sex and Age in Montcalm County
With 11.1% poverty level for males and 13.6% for females among the residents of Montcalm County, 5 year old males and under 5 year old females are the most vulnerable to poverty, with 70 males (22.2%) and 421 females (22.7%) in their respective age groups living below the poverty level.
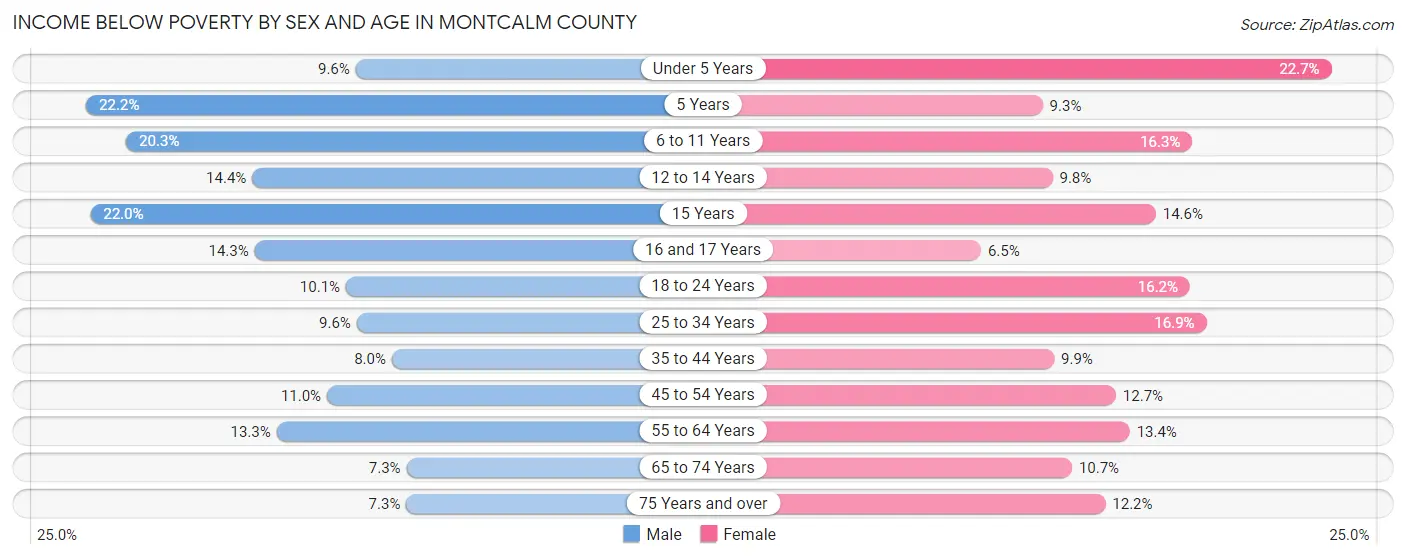
| Age Bracket | Male | Female |
| Under 5 Years | 159 (9.6%) | 421 (22.7%) |
| 5 Years | 70 (22.2%) | 29 (9.3%) |
| 6 to 11 Years | 456 (20.3%) | 369 (16.3%) |
| 12 to 14 Years | 214 (14.4%) | 117 (9.8%) |
| 15 Years | 124 (22.0%) | 73 (14.6%) |
| 16 and 17 Years | 104 (14.3%) | 49 (6.5%) |
| 18 to 24 Years | 299 (10.1%) | 368 (16.2%) |
| 25 to 34 Years | 436 (9.6%) | 632 (16.9%) |
| 35 to 44 Years | 351 (8.0%) | 343 (9.9%) |
| 45 to 54 Years | 506 (11.0%) | 486 (12.7%) |
| 55 to 64 Years | 609 (13.3%) | 599 (13.4%) |
| 65 to 74 Years | 245 (7.3%) | 375 (10.7%) |
| 75 Years and over | 142 (7.3%) | 306 (12.2%) |
| Total | 3,715 (11.1%) | 4,167 (13.6%) |
Income Above Poverty by Sex and Age in Montcalm County
According to the poverty statistics in Montcalm County, males aged 65 to 74 years and females aged 16 and 17 years are the age groups that are most secure financially, with 92.7% of males and 93.5% of females in these age groups living above the poverty line.
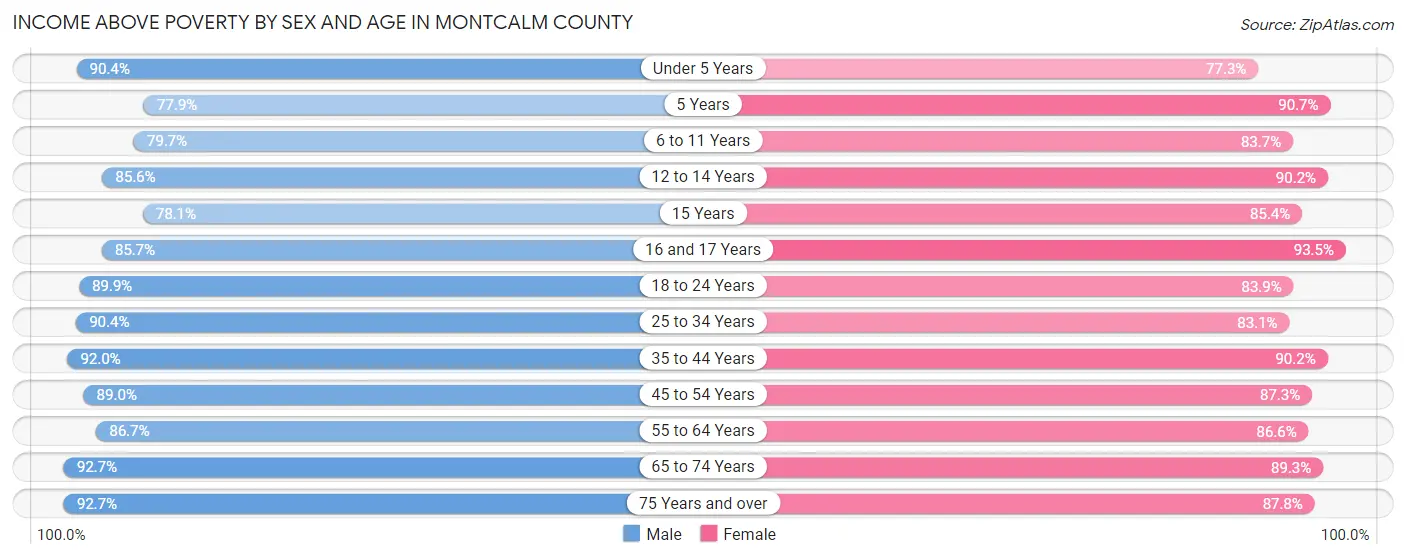
| Age Bracket | Male | Female |
| Under 5 Years | 1,491 (90.4%) | 1,432 (77.3%) |
| 5 Years | 246 (77.8%) | 282 (90.7%) |
| 6 to 11 Years | 1,791 (79.7%) | 1,901 (83.7%) |
| 12 to 14 Years | 1,268 (85.6%) | 1,079 (90.2%) |
| 15 Years | 441 (78.0%) | 428 (85.4%) |
| 16 and 17 Years | 622 (85.7%) | 710 (93.5%) |
| 18 to 24 Years | 2,663 (89.9%) | 1,910 (83.9%) |
| 25 to 34 Years | 4,110 (90.4%) | 3,103 (83.1%) |
| 35 to 44 Years | 4,056 (92.0%) | 3,140 (90.1%) |
| 45 to 54 Years | 4,106 (89.0%) | 3,334 (87.3%) |
| 55 to 64 Years | 3,968 (86.7%) | 3,883 (86.6%) |
| 65 to 74 Years | 3,120 (92.7%) | 3,136 (89.3%) |
| 75 Years and over | 1,806 (92.7%) | 2,197 (87.8%) |
| Total | 29,688 (88.9%) | 26,535 (86.4%) |
Income Below Poverty Among Married-Couple Families in Montcalm County
The poverty statistics for married-couple families in Montcalm County show that 6.4% or 807 of the total 12,697 families live below the poverty line. Families with 3 or 4 children have the highest poverty rate of 16.8%, comprising of 194 families. On the other hand, families with no children have the lowest poverty rate of 4.4%, which includes 353 families.
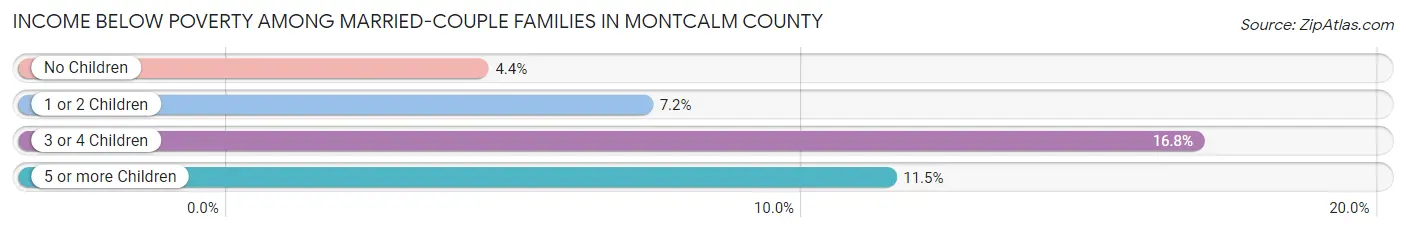
| Children | Above Poverty | Below Poverty |
| No Children | 7,738 (95.6%) | 353 (4.4%) |
| 1 or 2 Children | 2,969 (92.8%) | 231 (7.2%) |
| 3 or 4 Children | 959 (83.2%) | 194 (16.8%) |
| 5 or more Children | 224 (88.5%) | 29 (11.5%) |
| Total | 11,890 (93.6%) | 807 (6.4%) |
Income Below Poverty Among Single-Parent Households in Montcalm County
According to the poverty data in Montcalm County, 8.2% or 128 single-father households and 20.1% or 447 single-mother households are living below the poverty line. Among single-father households, those with 1 or 2 children have the highest poverty rate, with 112 households (13.3%) experiencing poverty. Likewise, among single-mother households, those with 3 or 4 children have the highest poverty rate, with 60 households (36.1%) falling below the poverty line.
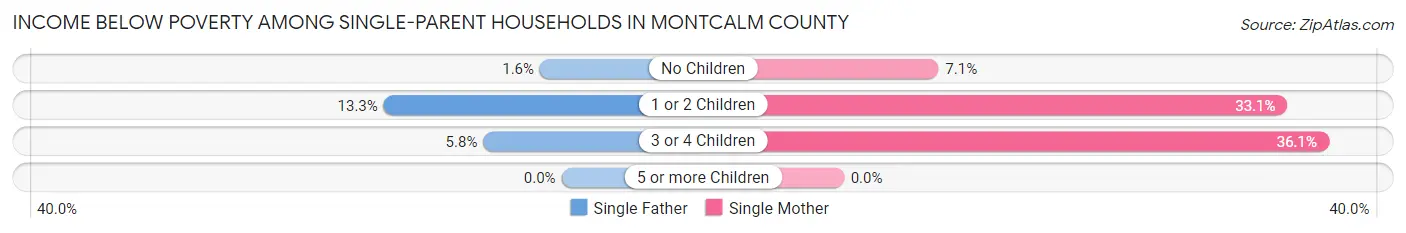
| Children | Single Father | Single Mother |
| No Children | 10 (1.6%) | 80 (7.1%) |
| 1 or 2 Children | 112 (13.3%) | 307 (33.1%) |
| 3 or 4 Children | 6 (5.8%) | 60 (36.1%) |
| 5 or more Children | 0 (0.0%) | 0 (0.0%) |
| Total | 128 (8.2%) | 447 (20.1%) |
Income Below Poverty Among Married-Couple vs Single-Parent Households in Montcalm County
The poverty data for Montcalm County shows that 807 of the married-couple family households (6.4%) and 575 of the single-parent households (15.1%) are living below the poverty level. Within the married-couple family households, those with 3 or 4 children have the highest poverty rate, with 194 households (16.8%) falling below the poverty line. Among the single-parent households, those with 3 or 4 children have the highest poverty rate, with 66 household (24.5%) living below poverty.
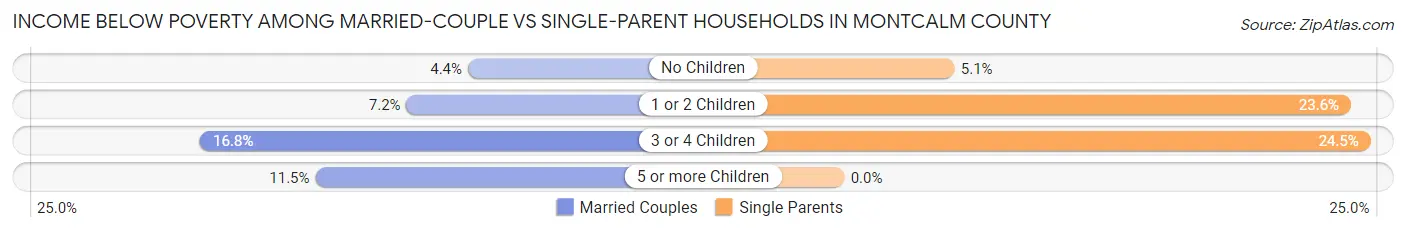
| Children | Married-Couple Families | Single-Parent Households |
| No Children | 353 (4.4%) | 90 (5.1%) |
| 1 or 2 Children | 231 (7.2%) | 419 (23.6%) |
| 3 or 4 Children | 194 (16.8%) | 66 (24.5%) |
| 5 or more Children | 29 (11.5%) | 0 (0.0%) |
| Total | 807 (6.4%) | 575 (15.1%) |
Employment Characteristics in Montcalm County
Employment by Class of Employer in Montcalm County
Among the 28,450 employed individuals in Montcalm County, private company employees (20,813 | 73.2%), not-for-profit organizations (2,132 | 7.5%), and self-employed (not incorporated) (1,796 | 6.3%) make up the most common classes of employment.
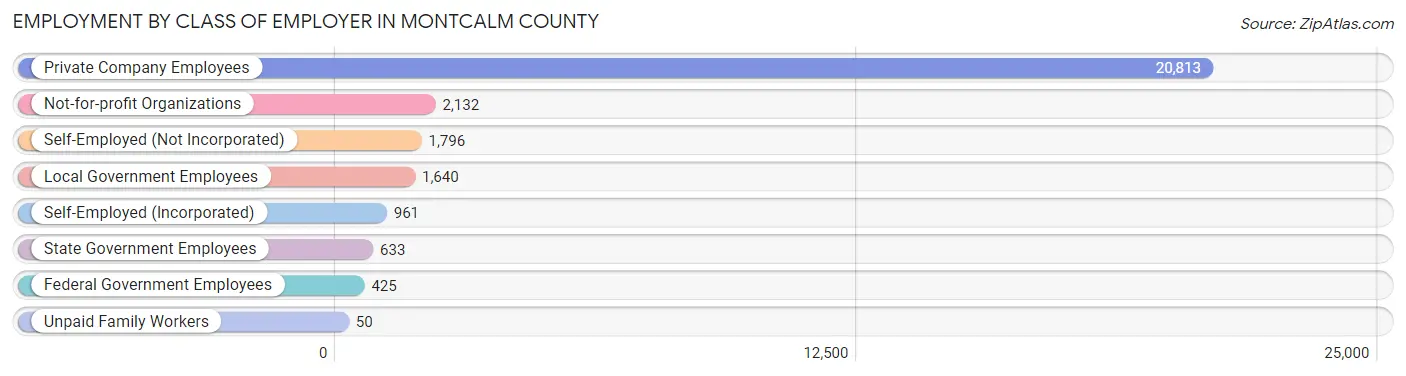
| Employer Class | # Employees | % Employees |
| Private Company Employees | 20,813 | 73.2% |
| Self-Employed (Incorporated) | 961 | 3.4% |
| Self-Employed (Not Incorporated) | 1,796 | 6.3% |
| Not-for-profit Organizations | 2,132 | 7.5% |
| Local Government Employees | 1,640 | 5.8% |
| State Government Employees | 633 | 2.2% |
| Federal Government Employees | 425 | 1.5% |
| Unpaid Family Workers | 50 | 0.2% |
| Total | 28,450 | 100.0% |
Employment Status by Age in Montcalm County
According to the labor force statistics for Montcalm County, out of the total population over 16 years of age (54,250), 55.5% or 30,109 individuals are in the labor force, with 4.2% or 1,265 of them unemployed. The age group with the highest labor force participation rate is 25 to 29 years, with 79.9% or 3,757 individuals in the labor force. Within the labor force, the 16 to 19 years age range has the highest percentage of unemployed individuals, with 10.4% or 151 of them being unemployed.
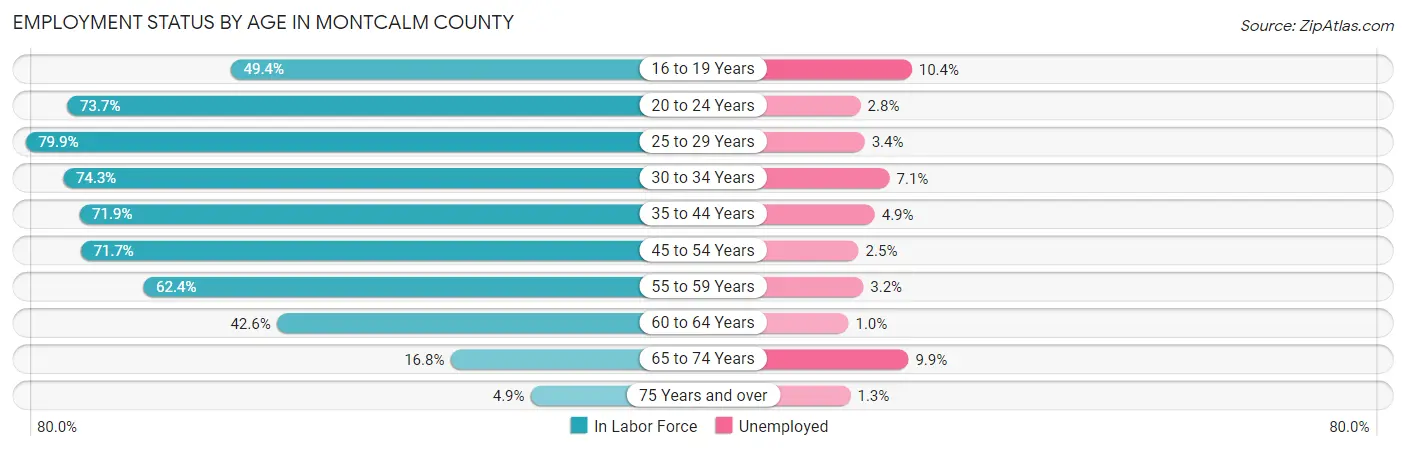
| Age Bracket | In Labor Force | Unemployed |
| 16 to 19 Years | 1,455 (49.4%) | 151 (10.4%) |
| 20 to 24 Years | 2,896 (73.7%) | 81 (2.8%) |
| 25 to 29 Years | 3,757 (79.9%) | 128 (3.4%) |
| 30 to 34 Years | 3,113 (74.3%) | 221 (7.1%) |
| 35 to 44 Years | 6,108 (71.9%) | 299 (4.9%) |
| 45 to 54 Years | 6,349 (71.7%) | 159 (2.5%) |
| 55 to 59 Years | 3,028 (62.4%) | 97 (3.2%) |
| 60 to 64 Years | 1,965 (42.6%) | 20 (1.0%) |
| 65 to 74 Years | 1,180 (16.8%) | 117 (9.9%) |
| 75 Years and over | 228 (4.9%) | 3 (1.3%) |
| Total | 30,109 (55.5%) | 1,265 (4.2%) |
Employment Status by Educational Attainment in Montcalm County
According to labor force statistics for Montcalm County, 68.1% of individuals (24,316) out of the total population between 25 and 64 years of age (35,706) are in the labor force, with 3.8% or 924 of them being unemployed. The group with the highest labor force participation rate are those with the educational attainment of bachelor's degree or higher, with 81.3% or 4,093 individuals in the labor force. Within the labor force, individuals with college / associate degree education have the highest percentage of unemployment, with 4.4% or 408 of them being unemployed.
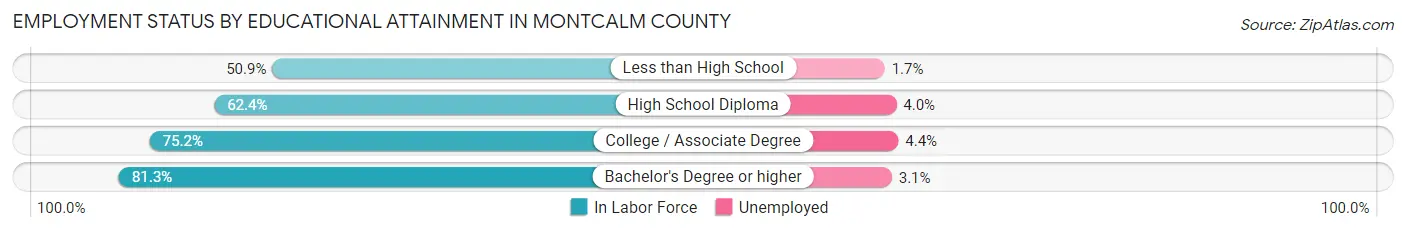
| Educational Attainment | In Labor Force | Unemployed |
| Less than High School | 2,146 (50.9%) | 72 (1.7%) |
| High School Diploma | 8,808 (62.4%) | 565 (4.0%) |
| College / Associate Degree | 9,280 (75.2%) | 543 (4.4%) |
| Bachelor's Degree or higher | 4,093 (81.3%) | 156 (3.1%) |
| Total | 24,316 (68.1%) | 1,357 (3.8%) |
Employment Occupations by Sex in Montcalm County
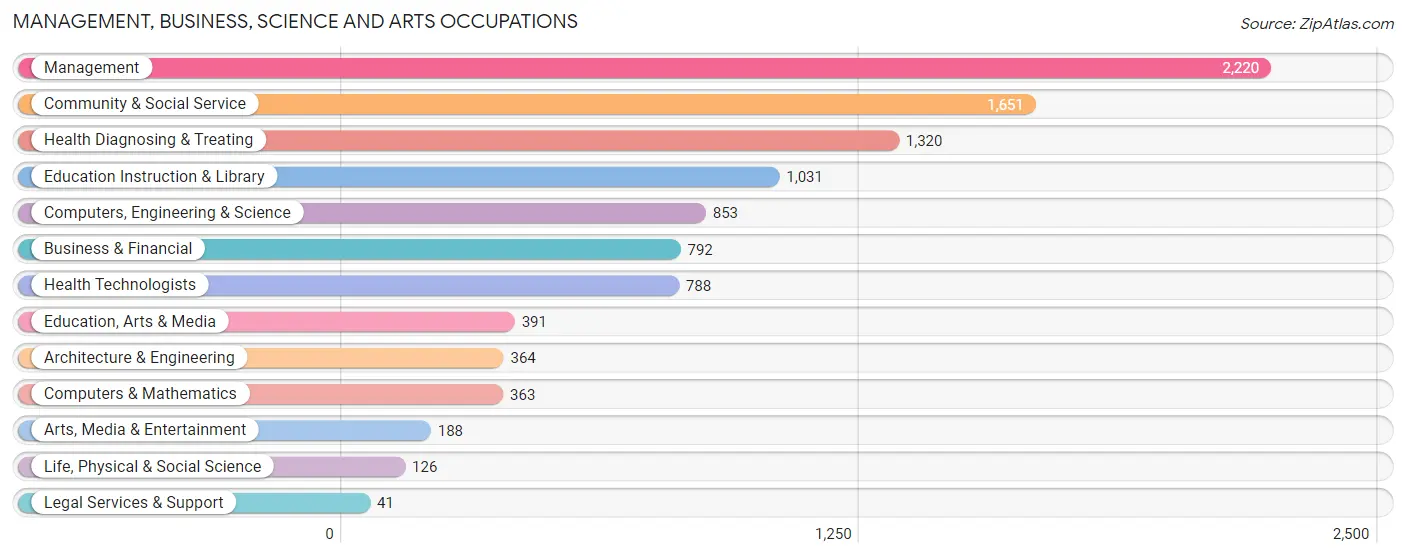
Management, Business, Science and Arts Occupations
The most common Management, Business, Science and Arts occupations in Montcalm County are Management (2,220 | 7.7%), Community & Social Service (1,651 | 5.7%), Health Diagnosing & Treating (1,320 | 4.6%), Education Instruction & Library (1,031 | 3.6%), and Computers, Engineering & Science (853 | 3.0%).
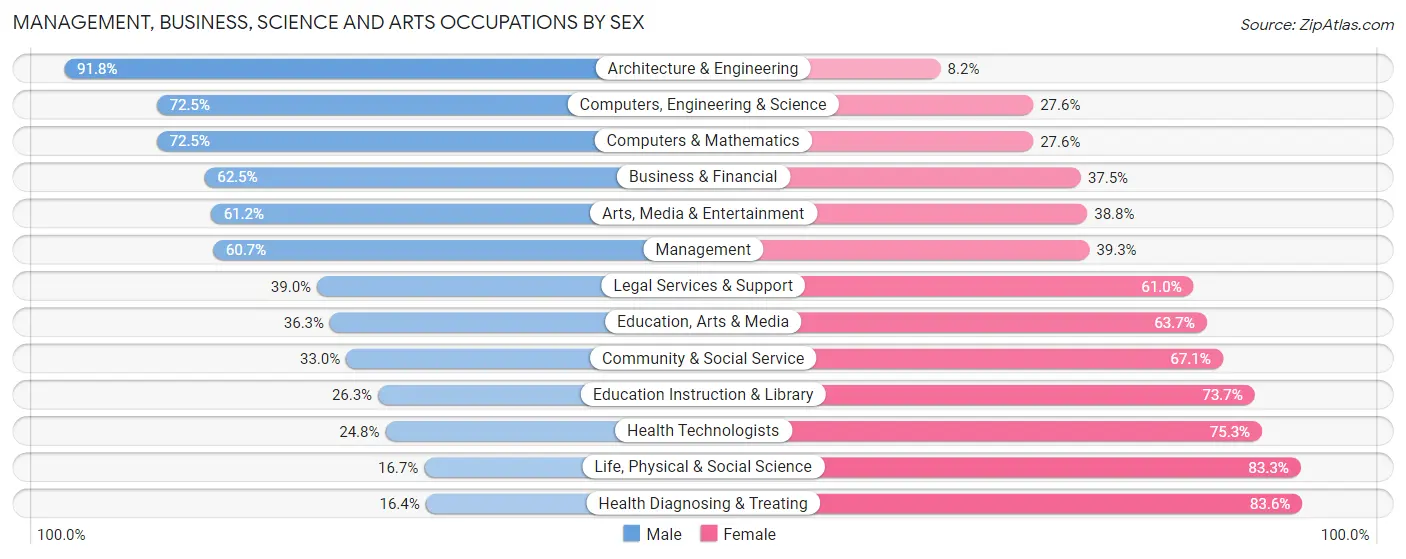
Management, Business, Science and Arts Occupations by Sex
Within the Management, Business, Science and Arts occupations in Montcalm County, the most male-oriented occupations are Architecture & Engineering (91.8%), Computers, Engineering & Science (72.5%), and Computers & Mathematics (72.5%), while the most female-oriented occupations are Health Diagnosing & Treating (83.6%), Life, Physical & Social Science (83.3%), and Health Technologists (75.2%).
| Occupation | Male | Female |
| Management | 1,348 (60.7%) | 872 (39.3%) |
| Business & Financial | 495 (62.5%) | 297 (37.5%) |
| Computers, Engineering & Science | 618 (72.5%) | 235 (27.6%) |
| Computers & Mathematics | 263 (72.5%) | 100 (27.6%) |
| Architecture & Engineering | 334 (91.8%) | 30 (8.2%) |
| Life, Physical & Social Science | 21 (16.7%) | 105 (83.3%) |
| Community & Social Service | 544 (33.0%) | 1,107 (67.0%) |
| Education, Arts & Media | 142 (36.3%) | 249 (63.7%) |
| Legal Services & Support | 16 (39.0%) | 25 (61.0%) |
| Education Instruction & Library | 271 (26.3%) | 760 (73.7%) |
| Arts, Media & Entertainment | 115 (61.2%) | 73 (38.8%) |
| Health Diagnosing & Treating | 216 (16.4%) | 1,104 (83.6%) |
| Health Technologists | 195 (24.7%) | 593 (75.2%) |
| Total (Category) | 3,221 (47.1%) | 3,615 (52.9%) |
| Total (Overall) | 16,722 (58.1%) | 12,049 (41.9%) |
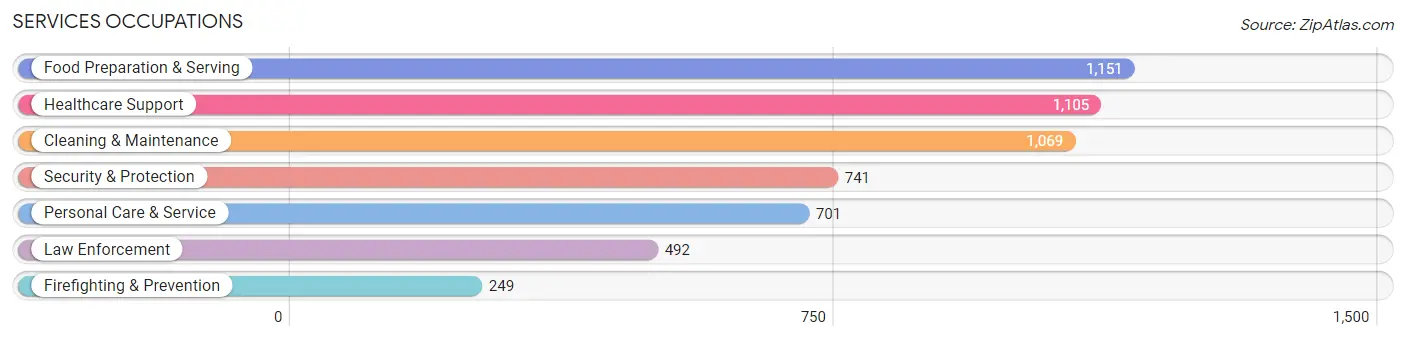
Services Occupations
The most common Services occupations in Montcalm County are Food Preparation & Serving (1,151 | 4.0%), Healthcare Support (1,105 | 3.8%), Cleaning & Maintenance (1,069 | 3.7%), Security & Protection (741 | 2.6%), and Personal Care & Service (701 | 2.4%).
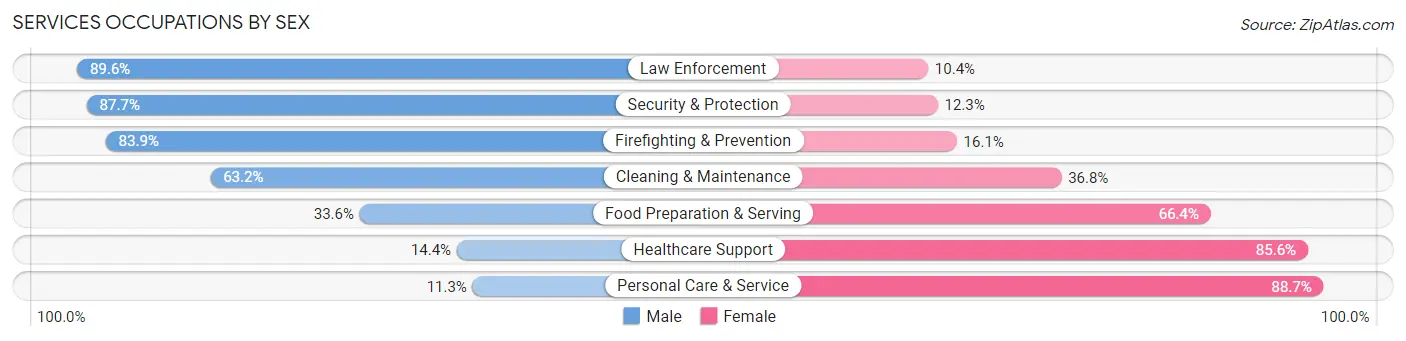
Services Occupations by Sex
Within the Services occupations in Montcalm County, the most male-oriented occupations are Law Enforcement (89.6%), Security & Protection (87.7%), and Firefighting & Prevention (83.9%), while the most female-oriented occupations are Personal Care & Service (88.7%), Healthcare Support (85.6%), and Food Preparation & Serving (66.4%).
| Occupation | Male | Female |
| Healthcare Support | 159 (14.4%) | 946 (85.6%) |
| Security & Protection | 650 (87.7%) | 91 (12.3%) |
| Firefighting & Prevention | 209 (83.9%) | 40 (16.1%) |
| Law Enforcement | 441 (89.6%) | 51 (10.4%) |
| Food Preparation & Serving | 387 (33.6%) | 764 (66.4%) |
| Cleaning & Maintenance | 676 (63.2%) | 393 (36.8%) |
| Personal Care & Service | 79 (11.3%) | 622 (88.7%) |
| Total (Category) | 1,951 (40.9%) | 2,816 (59.1%) |
| Total (Overall) | 16,722 (58.1%) | 12,049 (41.9%) |
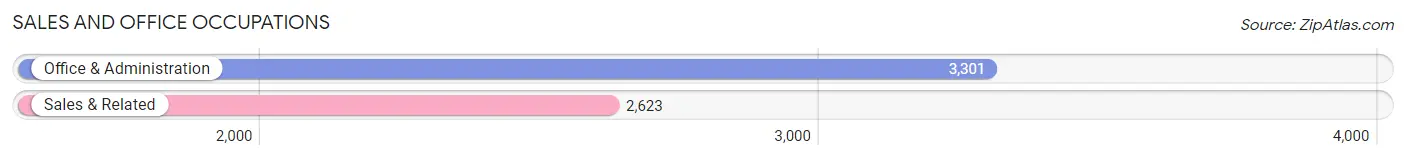
Sales and Office Occupations
The most common Sales and Office occupations in Montcalm County are Office & Administration (3,301 | 11.5%), and Sales & Related (2,623 | 9.1%).
Sales and Office Occupations by Sex
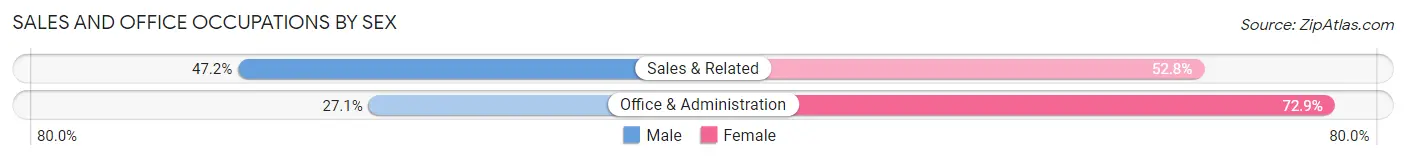
| Occupation | Male | Female |
| Sales & Related | 1,237 (47.2%) | 1,386 (52.8%) |
| Office & Administration | 894 (27.1%) | 2,407 (72.9%) |
| Total (Category) | 2,131 (36.0%) | 3,793 (64.0%) |
| Total (Overall) | 16,722 (58.1%) | 12,049 (41.9%) |
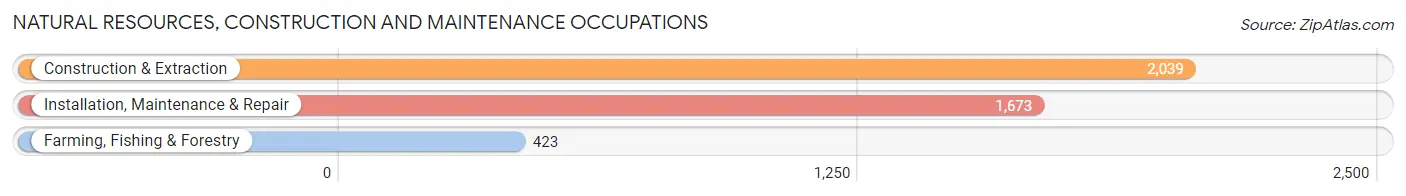
Natural Resources, Construction and Maintenance Occupations
The most common Natural Resources, Construction and Maintenance occupations in Montcalm County are Construction & Extraction (2,039 | 7.1%), Installation, Maintenance & Repair (1,673 | 5.8%), and Farming, Fishing & Forestry (423 | 1.5%).
Natural Resources, Construction and Maintenance Occupations by Sex
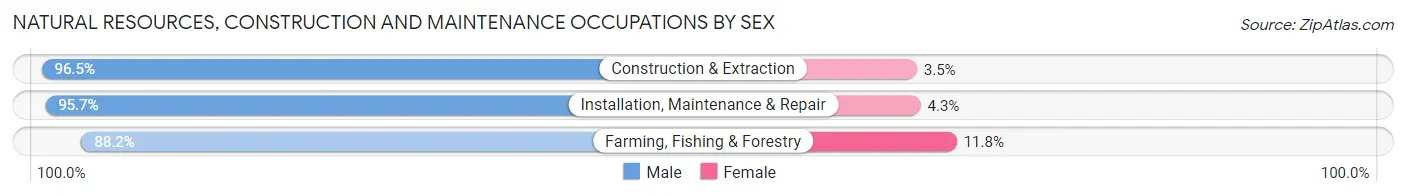
| Occupation | Male | Female |
| Farming, Fishing & Forestry | 373 (88.2%) | 50 (11.8%) |
| Construction & Extraction | 1,967 (96.5%) | 72 (3.5%) |
| Installation, Maintenance & Repair | 1,601 (95.7%) | 72 (4.3%) |
| Total (Category) | 3,941 (95.3%) | 194 (4.7%) |
| Total (Overall) | 16,722 (58.1%) | 12,049 (41.9%) |
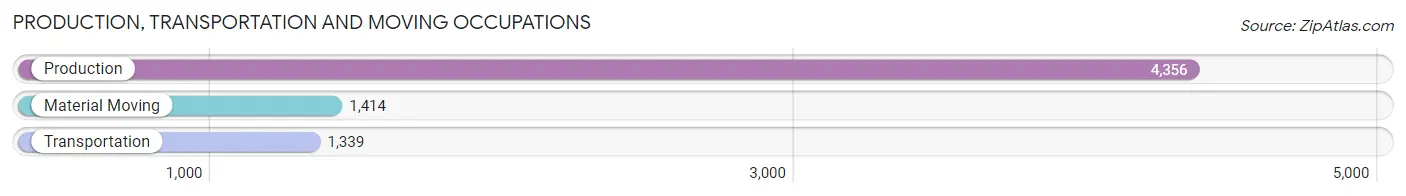
Production, Transportation and Moving Occupations
The most common Production, Transportation and Moving occupations in Montcalm County are Production (4,356 | 15.1%), Material Moving (1,414 | 4.9%), and Transportation (1,339 | 4.6%).
Production, Transportation and Moving Occupations by Sex
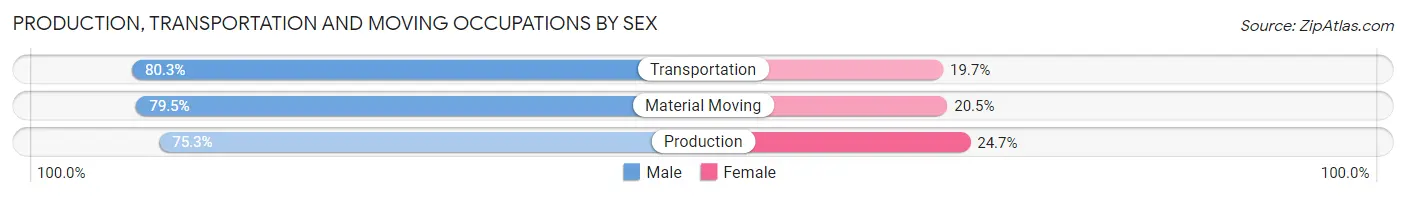
| Occupation | Male | Female |
| Production | 3,279 (75.3%) | 1,077 (24.7%) |
| Transportation | 1,075 (80.3%) | 264 (19.7%) |
| Material Moving | 1,124 (79.5%) | 290 (20.5%) |
| Total (Category) | 5,478 (77.1%) | 1,631 (22.9%) |
| Total (Overall) | 16,722 (58.1%) | 12,049 (41.9%) |
Employment Industries by Sex in Montcalm County
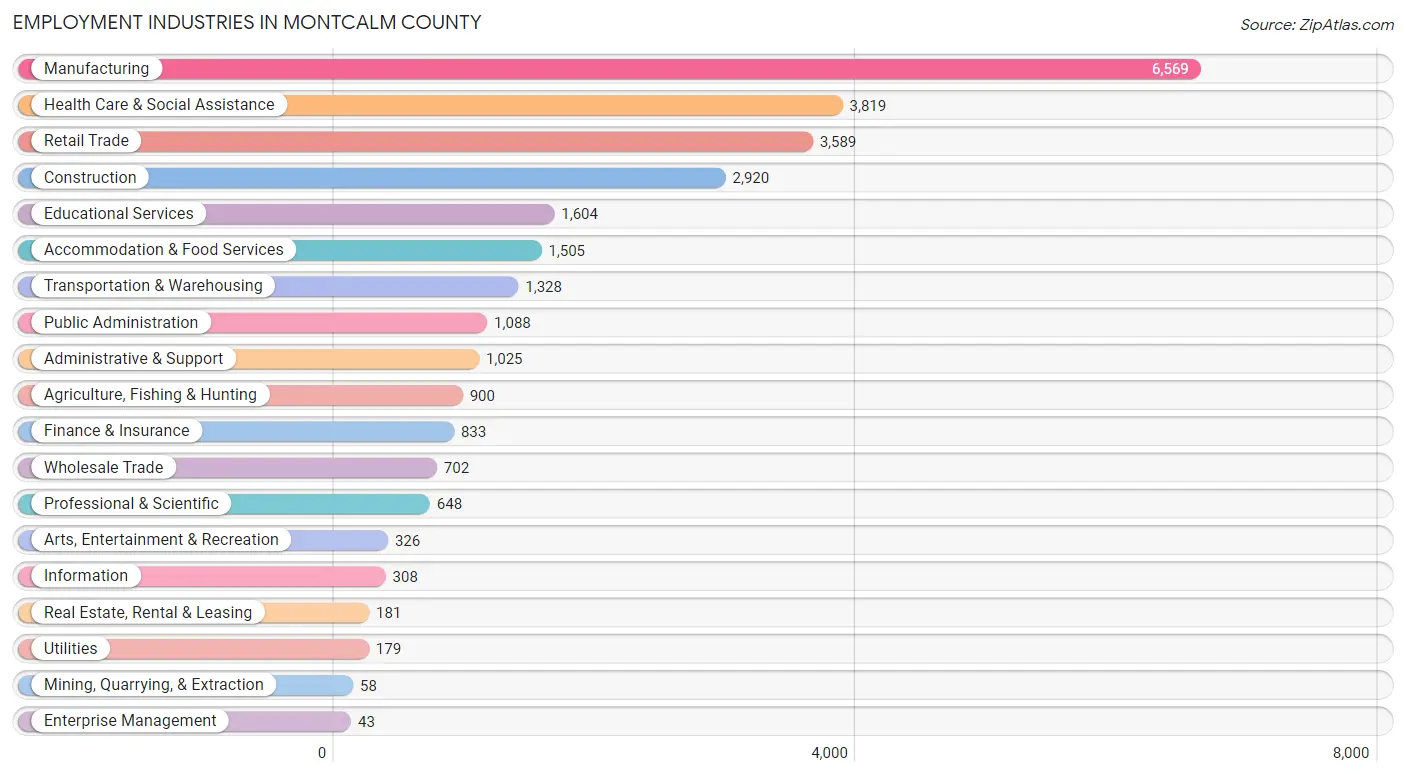
Employment Industries in Montcalm County
The major employment industries in Montcalm County include Manufacturing (6,569 | 22.8%), Health Care & Social Assistance (3,819 | 13.3%), Retail Trade (3,589 | 12.5%), Construction (2,920 | 10.2%), and Educational Services (1,604 | 5.6%).
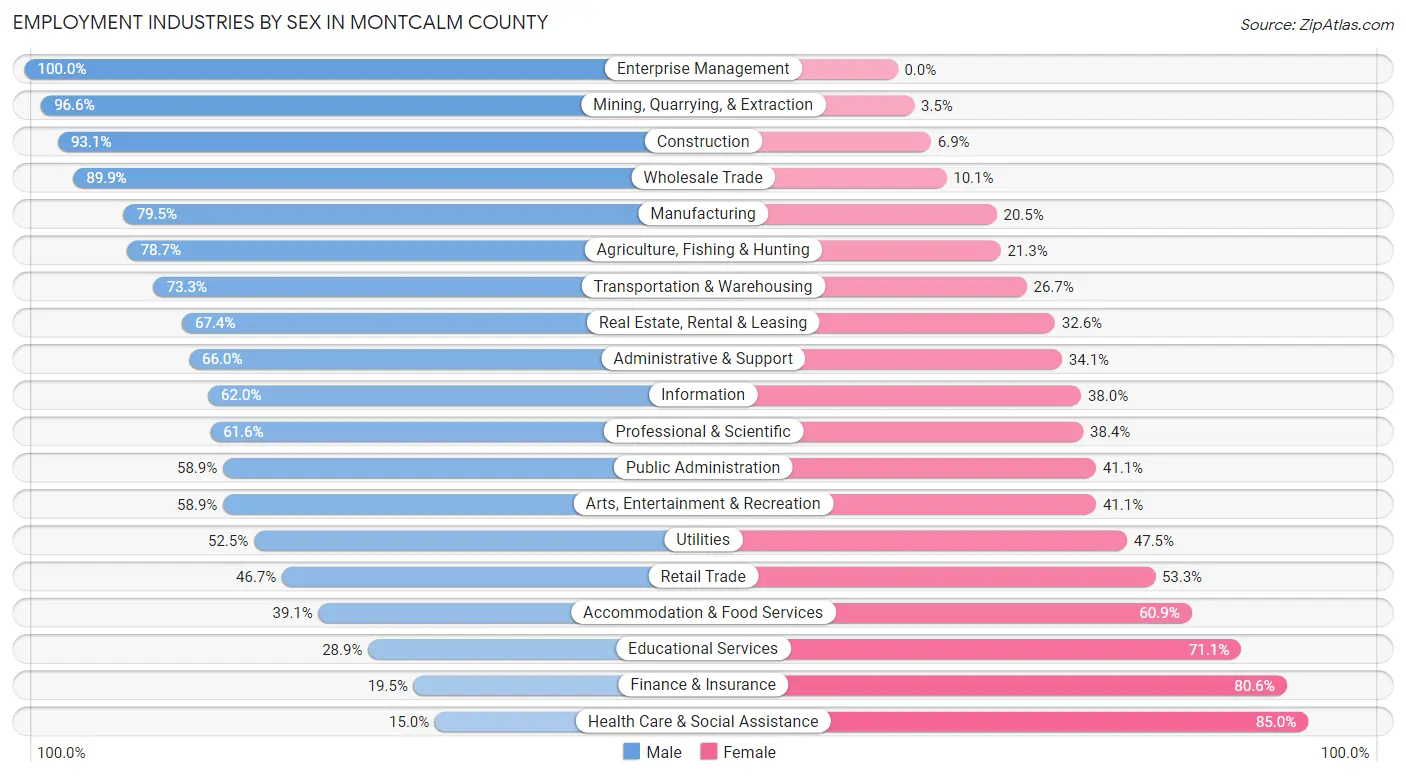
Employment Industries by Sex in Montcalm County
The Montcalm County industries that see more men than women are Enterprise Management (100.0%), Mining, Quarrying, & Extraction (96.6%), and Construction (93.1%), whereas the industries that tend to have a higher number of women are Health Care & Social Assistance (85.0%), Finance & Insurance (80.5%), and Educational Services (71.1%).
| Industry | Male | Female |
| Agriculture, Fishing & Hunting | 708 (78.7%) | 192 (21.3%) |
| Mining, Quarrying, & Extraction | 56 (96.6%) | 2 (3.5%) |
| Construction | 2,718 (93.1%) | 202 (6.9%) |
| Manufacturing | 5,221 (79.5%) | 1,348 (20.5%) |
| Wholesale Trade | 631 (89.9%) | 71 (10.1%) |
| Retail Trade | 1,676 (46.7%) | 1,913 (53.3%) |
| Transportation & Warehousing | 973 (73.3%) | 355 (26.7%) |
| Utilities | 94 (52.5%) | 85 (47.5%) |
| Information | 191 (62.0%) | 117 (38.0%) |
| Finance & Insurance | 162 (19.5%) | 671 (80.5%) |
| Real Estate, Rental & Leasing | 122 (67.4%) | 59 (32.6%) |
| Professional & Scientific | 399 (61.6%) | 249 (38.4%) |
| Enterprise Management | 43 (100.0%) | 0 (0.0%) |
| Administrative & Support | 676 (65.9%) | 349 (34.1%) |
| Educational Services | 463 (28.9%) | 1,141 (71.1%) |
| Health Care & Social Assistance | 574 (15.0%) | 3,245 (85.0%) |
| Arts, Entertainment & Recreation | 192 (58.9%) | 134 (41.1%) |
| Accommodation & Food Services | 589 (39.1%) | 916 (60.9%) |
| Public Administration | 641 (58.9%) | 447 (41.1%) |
| Total | 16,722 (58.1%) | 12,049 (41.9%) |
Education in Montcalm County
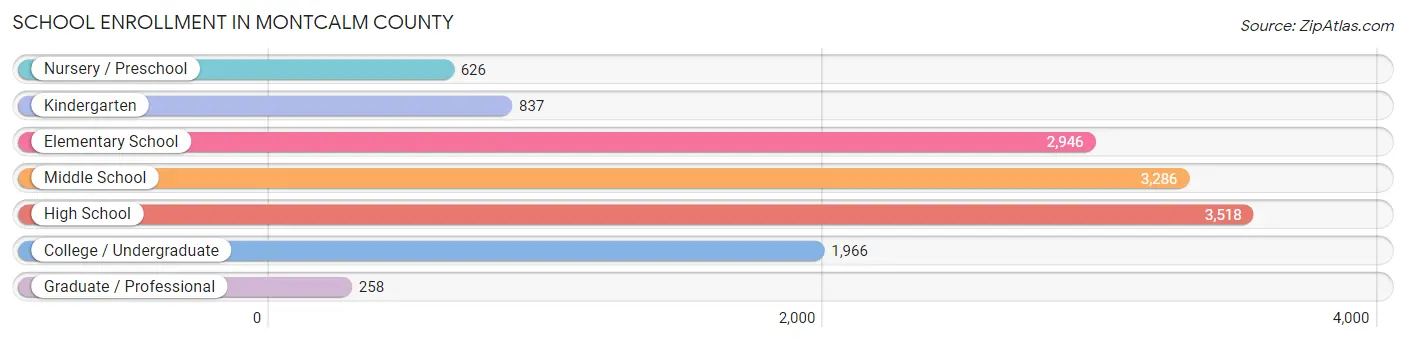
School Enrollment in Montcalm County
The most common levels of schooling among the 13,437 students in Montcalm County are high school (3,518 | 26.2%), middle school (3,286 | 24.4%), and elementary school (2,946 | 21.9%).
| School Level | # Students | % Students |
| Nursery / Preschool | 626 | 4.7% |
| Kindergarten | 837 | 6.2% |
| Elementary School | 2,946 | 21.9% |
| Middle School | 3,286 | 24.4% |
| High School | 3,518 | 26.2% |
| College / Undergraduate | 1,966 | 14.6% |
| Graduate / Professional | 258 | 1.9% |
| Total | 13,437 | 100.0% |
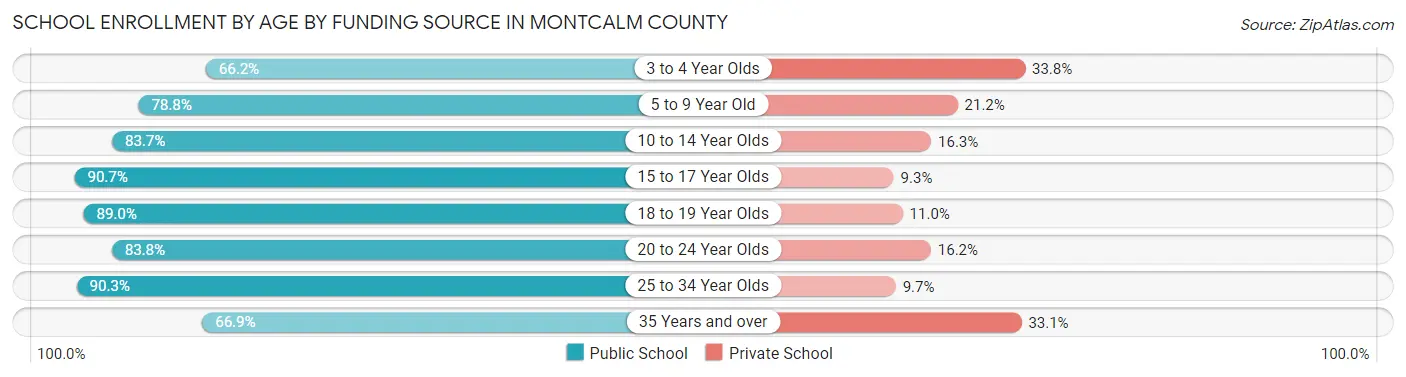
School Enrollment by Age by Funding Source in Montcalm County
Out of a total of 13,437 students who are enrolled in schools in Montcalm County, 2,311 (17.2%) attend a private institution, while the remaining 11,126 (82.8%) are enrolled in public schools. The age group of 3 to 4 year olds has the highest likelihood of being enrolled in private schools, with 175 (33.8% in the age bracket) enrolled. Conversely, the age group of 15 to 17 year olds has the lowest likelihood of being enrolled in a private school, with 2,162 (90.7% in the age bracket) attending a public institution.
| Age Bracket | Public School | Private School |
| 3 to 4 Year Olds | 343 (66.2%) | 175 (33.8%) |
| 5 to 9 Year Old | 2,673 (78.8%) | 720 (21.2%) |
| 10 to 14 Year Olds | 3,628 (83.7%) | 706 (16.3%) |
| 15 to 17 Year Olds | 2,162 (90.7%) | 222 (9.3%) |
| 18 to 19 Year Olds | 656 (89.0%) | 81 (11.0%) |
| 20 to 24 Year Olds | 846 (83.8%) | 164 (16.2%) |
| 25 to 34 Year Olds | 410 (90.3%) | 44 (9.7%) |
| 35 Years and over | 406 (66.9%) | 201 (33.1%) |
| Total | 11,126 (82.8%) | 2,311 (17.2%) |
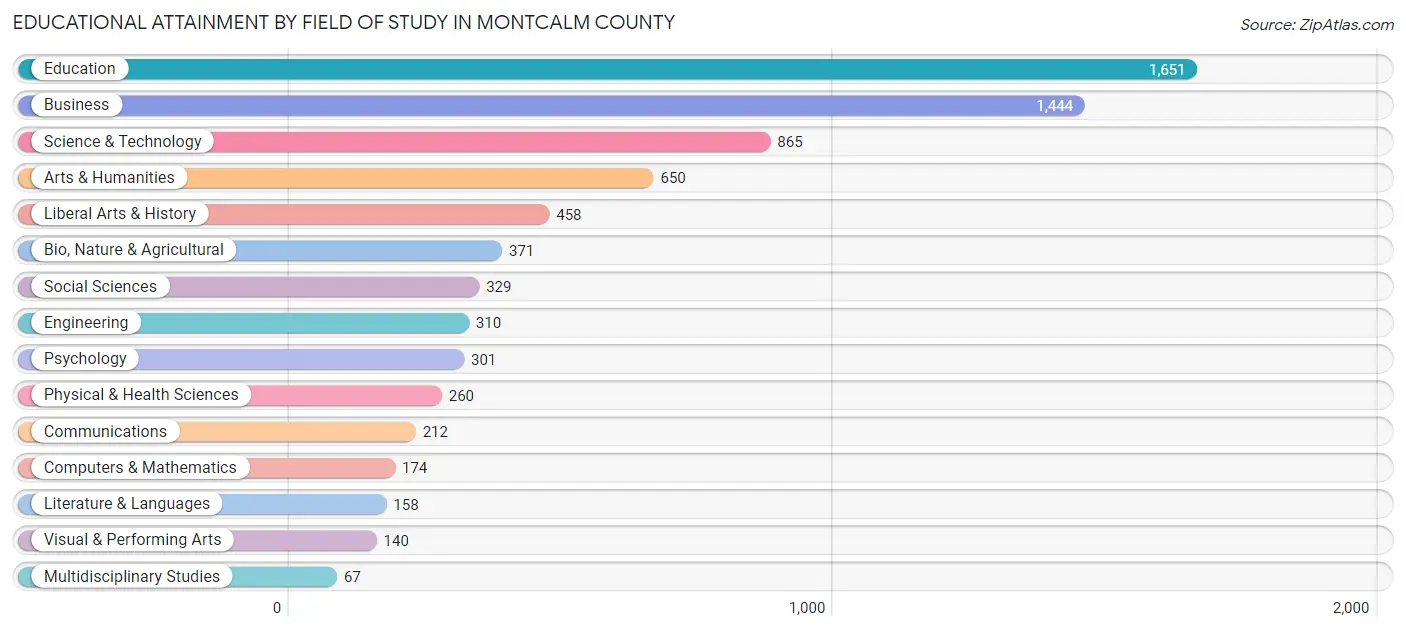
Educational Attainment by Field of Study in Montcalm County
Education (1,651 | 22.3%), business (1,444 | 19.5%), science & technology (865 | 11.7%), arts & humanities (650 | 8.8%), and liberal arts & history (458 | 6.2%) are the most common fields of study among 7,390 individuals in Montcalm County who have obtained a bachelor's degree or higher.
| Field of Study | # Graduates | % Graduates |
| Computers & Mathematics | 174 | 2.4% |
| Bio, Nature & Agricultural | 371 | 5.0% |
| Physical & Health Sciences | 260 | 3.5% |
| Psychology | 301 | 4.1% |
| Social Sciences | 329 | 4.4% |
| Engineering | 310 | 4.2% |
| Multidisciplinary Studies | 67 | 0.9% |
| Science & Technology | 865 | 11.7% |
| Business | 1,444 | 19.5% |
| Education | 1,651 | 22.3% |
| Literature & Languages | 158 | 2.1% |
| Liberal Arts & History | 458 | 6.2% |
| Visual & Performing Arts | 140 | 1.9% |
| Communications | 212 | 2.9% |
| Arts & Humanities | 650 | 8.8% |
| Total | 7,390 | 100.0% |
Transportation & Commute in Montcalm County
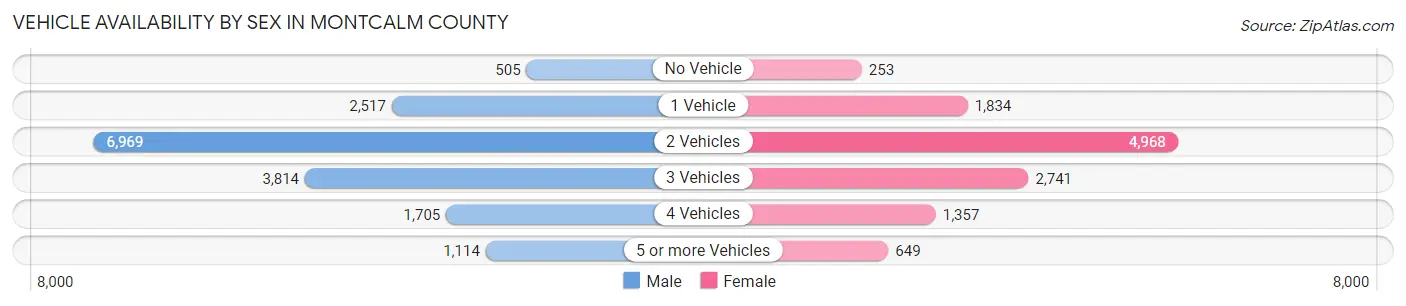
Vehicle Availability by Sex in Montcalm County
The most prevalent vehicle ownership categories in Montcalm County are males with 2 vehicles (6,969, accounting for 41.9%) and females with 2 vehicles (4,968, making up 59.1%).
| Vehicles Available | Male | Female |
| No Vehicle | 505 (3.0%) | 253 (2.1%) |
| 1 Vehicle | 2,517 (15.1%) | 1,834 (15.5%) |
| 2 Vehicles | 6,969 (41.9%) | 4,968 (42.1%) |
| 3 Vehicles | 3,814 (22.9%) | 2,741 (23.2%) |
| 4 Vehicles | 1,705 (10.3%) | 1,357 (11.5%) |
| 5 or more Vehicles | 1,114 (6.7%) | 649 (5.5%) |
| Total | 16,624 (100.0%) | 11,802 (100.0%) |
Commute Time in Montcalm County
The most frequently occuring commute durations in Montcalm County are 45 to 59 minutes (4,136 commuters, 15.3%), 5 to 9 minutes (3,679 commuters, 13.6%), and 30 to 34 minutes (3,002 commuters, 11.1%).
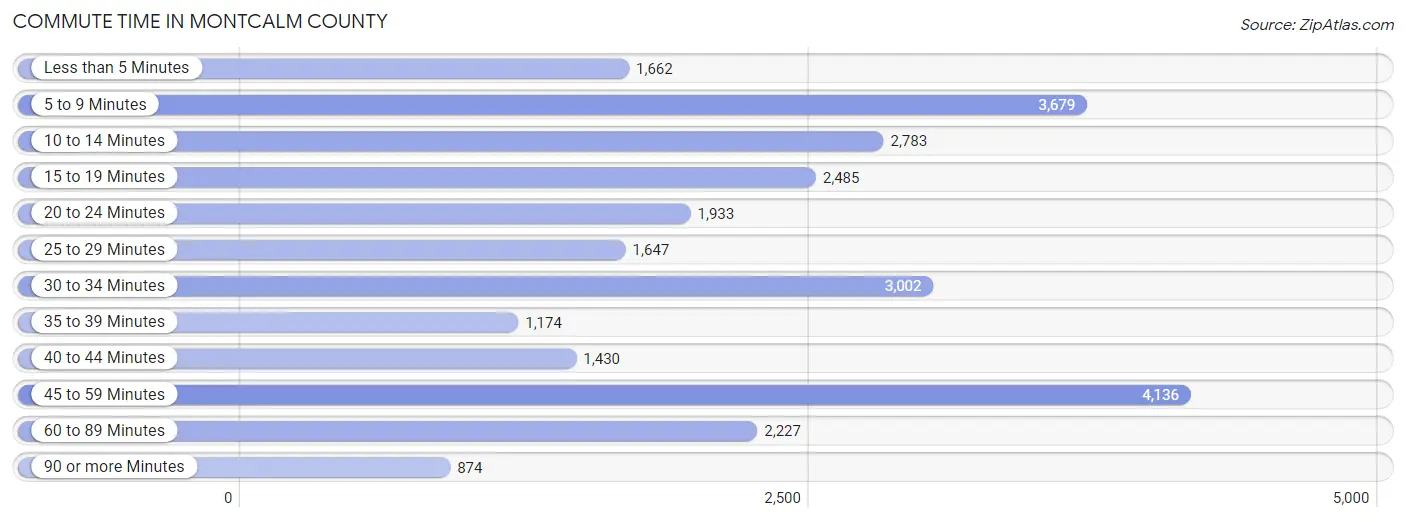
| Commute Time | # Commuters | % Commuters |
| Less than 5 Minutes | 1,662 | 6.1% |
| 5 to 9 Minutes | 3,679 | 13.6% |
| 10 to 14 Minutes | 2,783 | 10.3% |
| 15 to 19 Minutes | 2,485 | 9.2% |
| 20 to 24 Minutes | 1,933 | 7.1% |
| 25 to 29 Minutes | 1,647 | 6.1% |
| 30 to 34 Minutes | 3,002 | 11.1% |
| 35 to 39 Minutes | 1,174 | 4.3% |
| 40 to 44 Minutes | 1,430 | 5.3% |
| 45 to 59 Minutes | 4,136 | 15.3% |
| 60 to 89 Minutes | 2,227 | 8.2% |
| 90 or more Minutes | 874 | 3.2% |
Commute Time by Sex in Montcalm County
The most common commute times in Montcalm County are 45 to 59 minutes (2,793 commuters, 17.5%) for males and 5 to 9 minutes (1,813 commuters, 16.4%) for females.
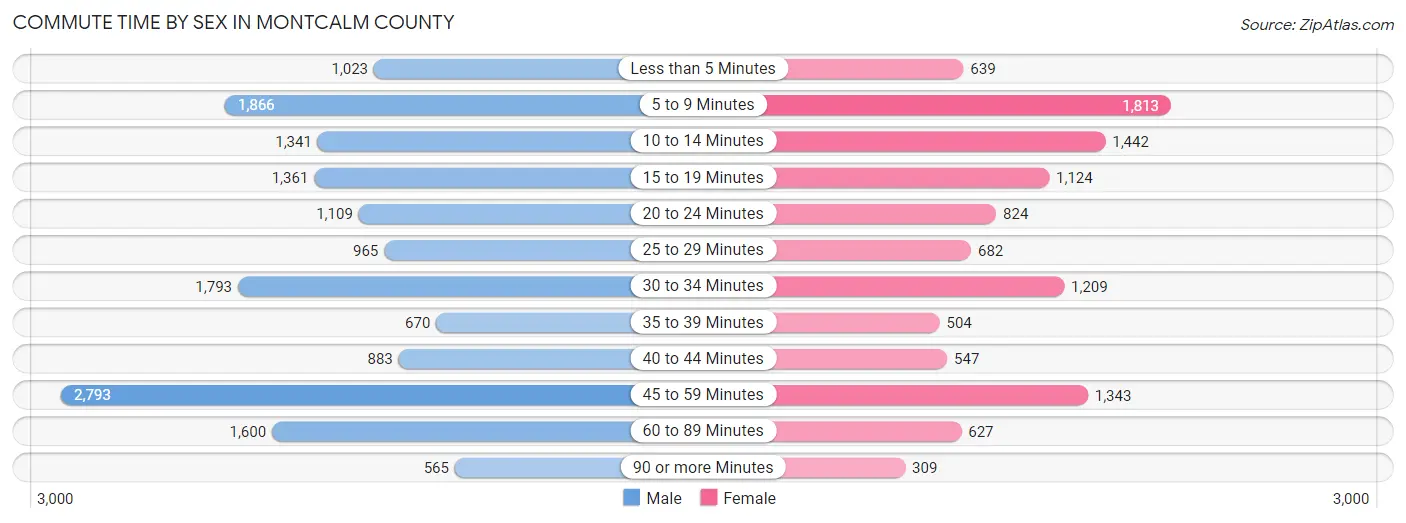
| Commute Time | Male | Female |
| Less than 5 Minutes | 1,023 (6.4%) | 639 (5.8%) |
| 5 to 9 Minutes | 1,866 (11.7%) | 1,813 (16.4%) |
| 10 to 14 Minutes | 1,341 (8.4%) | 1,442 (13.0%) |
| 15 to 19 Minutes | 1,361 (8.5%) | 1,124 (10.2%) |
| 20 to 24 Minutes | 1,109 (6.9%) | 824 (7.4%) |
| 25 to 29 Minutes | 965 (6.0%) | 682 (6.2%) |
| 30 to 34 Minutes | 1,793 (11.2%) | 1,209 (10.9%) |
| 35 to 39 Minutes | 670 (4.2%) | 504 (4.6%) |
| 40 to 44 Minutes | 883 (5.5%) | 547 (4.9%) |
| 45 to 59 Minutes | 2,793 (17.5%) | 1,343 (12.1%) |
| 60 to 89 Minutes | 1,600 (10.0%) | 627 (5.7%) |
| 90 or more Minutes | 565 (3.5%) | 309 (2.8%) |
Time of Departure to Work by Sex in Montcalm County
The most frequent times of departure to work in Montcalm County are 7:00 AM to 7:29 AM (2,002, 12.5%) for males and 7:00 AM to 7:29 AM (1,464, 13.2%) for females.
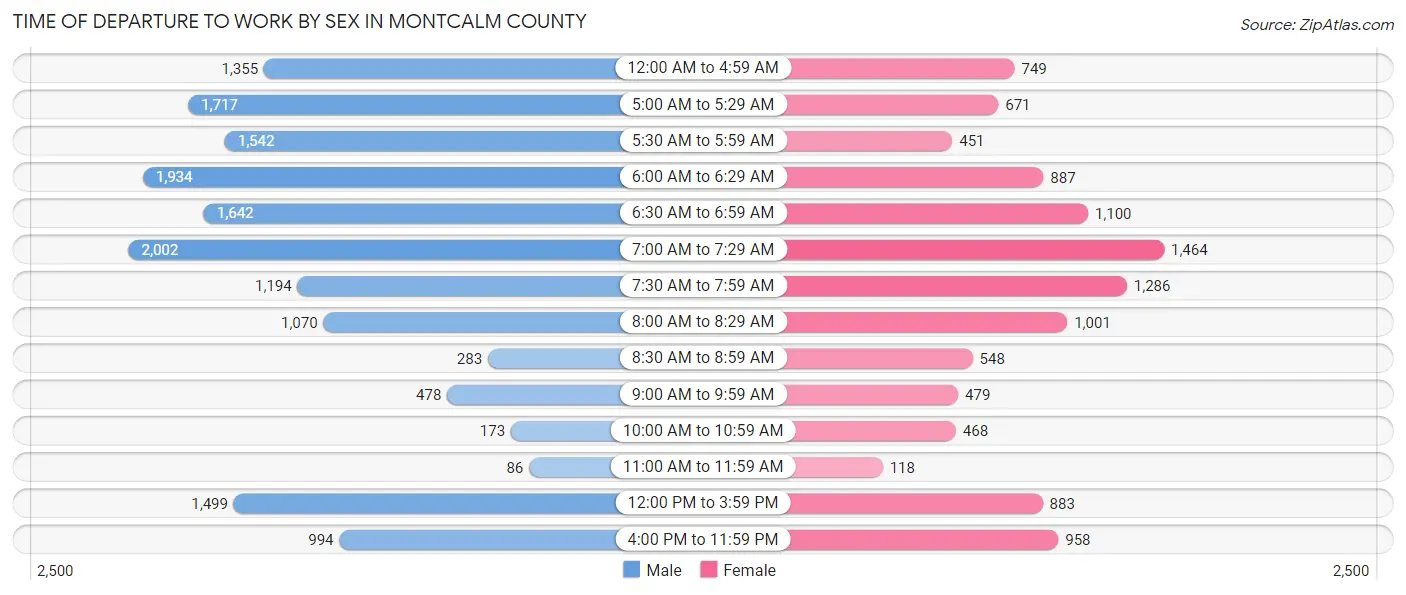
| Time of Departure | Male | Female |
| 12:00 AM to 4:59 AM | 1,355 (8.5%) | 749 (6.8%) |
| 5:00 AM to 5:29 AM | 1,717 (10.7%) | 671 (6.1%) |
| 5:30 AM to 5:59 AM | 1,542 (9.7%) | 451 (4.1%) |
| 6:00 AM to 6:29 AM | 1,934 (12.1%) | 887 (8.0%) |
| 6:30 AM to 6:59 AM | 1,642 (10.3%) | 1,100 (9.9%) |
| 7:00 AM to 7:29 AM | 2,002 (12.5%) | 1,464 (13.2%) |
| 7:30 AM to 7:59 AM | 1,194 (7.5%) | 1,286 (11.6%) |
| 8:00 AM to 8:29 AM | 1,070 (6.7%) | 1,001 (9.0%) |
| 8:30 AM to 8:59 AM | 283 (1.8%) | 548 (5.0%) |
| 9:00 AM to 9:59 AM | 478 (3.0%) | 479 (4.3%) |
| 10:00 AM to 10:59 AM | 173 (1.1%) | 468 (4.2%) |
| 11:00 AM to 11:59 AM | 86 (0.5%) | 118 (1.1%) |
| 12:00 PM to 3:59 PM | 1,499 (9.4%) | 883 (8.0%) |
| 4:00 PM to 11:59 PM | 994 (6.2%) | 958 (8.7%) |
| Total | 15,969 (100.0%) | 11,063 (100.0%) |
Housing Occupancy in Montcalm County
Occupancy by Ownership in Montcalm County
Of the total 23,984 dwellings in Montcalm County, owner-occupied units account for 19,565 (81.6%), while renter-occupied units make up 4,419 (18.4%).
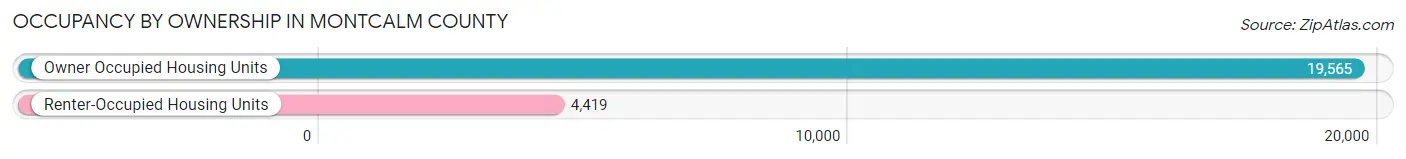
| Occupancy | # Housing Units | % Housing Units |
| Owner Occupied Housing Units | 19,565 | 81.6% |
| Renter-Occupied Housing Units | 4,419 | 18.4% |
| Total Occupied Housing Units | 23,984 | 100.0% |
Occupancy by Household Size in Montcalm County
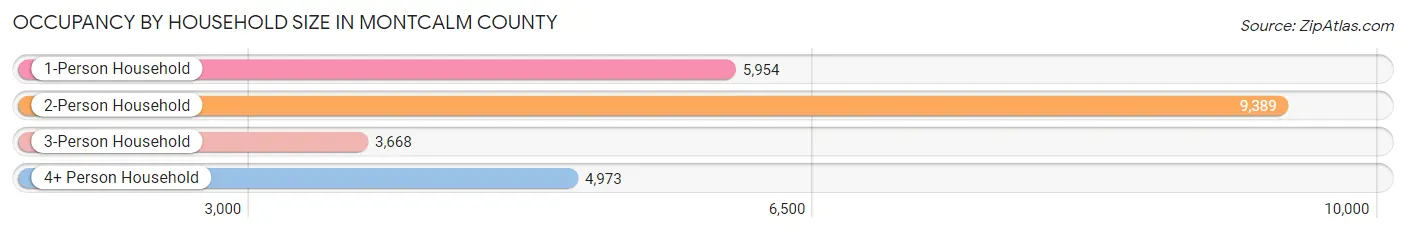
| Household Size | # Housing Units | % Housing Units |
| 1-Person Household | 5,954 | 24.8% |
| 2-Person Household | 9,389 | 39.2% |
| 3-Person Household | 3,668 | 15.3% |
| 4+ Person Household | 4,973 | 20.7% |
| Total Housing Units | 23,984 | 100.0% |
Occupancy by Ownership by Household Size in Montcalm County
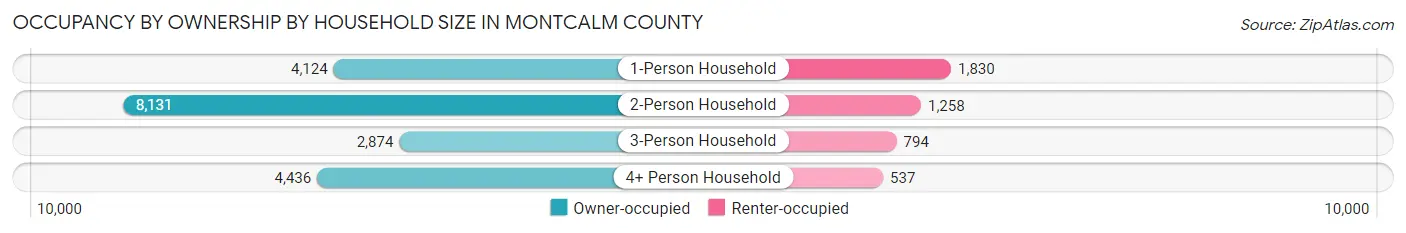
| Household Size | Owner-occupied | Renter-occupied |
| 1-Person Household | 4,124 (69.3%) | 1,830 (30.7%) |
| 2-Person Household | 8,131 (86.6%) | 1,258 (13.4%) |
| 3-Person Household | 2,874 (78.3%) | 794 (21.6%) |
| 4+ Person Household | 4,436 (89.2%) | 537 (10.8%) |
| Total Housing Units | 19,565 (81.6%) | 4,419 (18.4%) |
Occupancy by Educational Attainment in Montcalm County
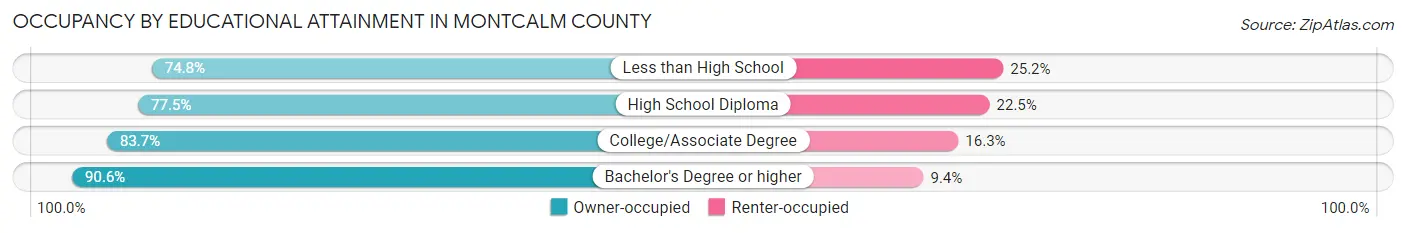
| Household Size | Owner-occupied | Renter-occupied |
| Less than High School | 1,821 (74.8%) | 614 (25.2%) |
| High School Diploma | 6,965 (77.5%) | 2,021 (22.5%) |
| College/Associate Degree | 7,313 (83.7%) | 1,425 (16.3%) |
| Bachelor's Degree or higher | 3,466 (90.6%) | 359 (9.4%) |
Occupancy by Age of Householder in Montcalm County
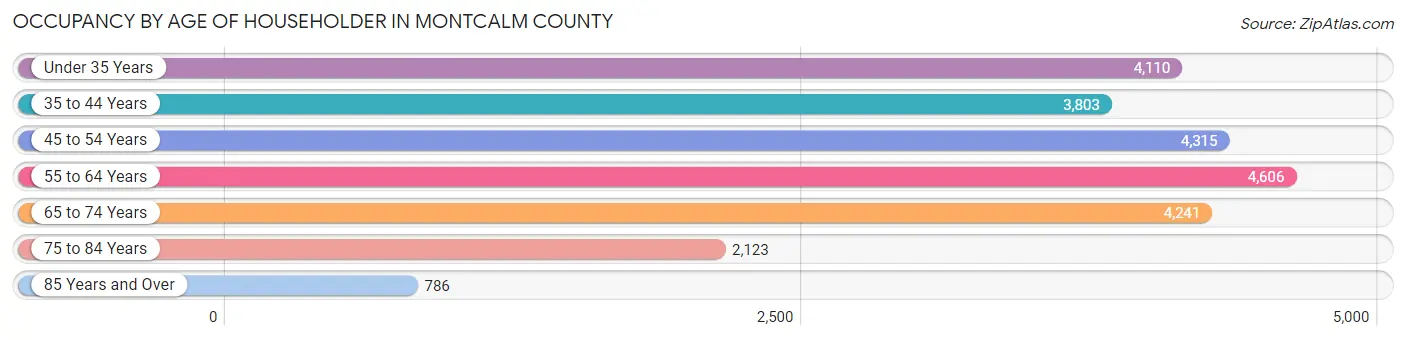
| Age Bracket | # Households | % Households |
| Under 35 Years | 4,110 | 17.1% |
| 35 to 44 Years | 3,803 | 15.9% |
| 45 to 54 Years | 4,315 | 18.0% |
| 55 to 64 Years | 4,606 | 19.2% |
| 65 to 74 Years | 4,241 | 17.7% |
| 75 to 84 Years | 2,123 | 8.8% |
| 85 Years and Over | 786 | 3.3% |
| Total | 23,984 | 100.0% |
Housing Finances in Montcalm County
Median Income by Occupancy in Montcalm County
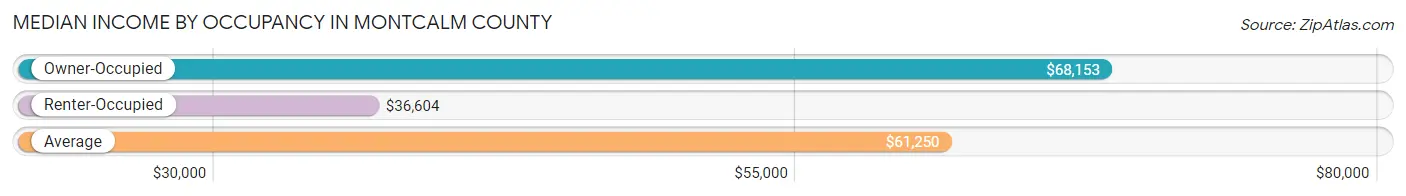
| Occupancy Type | # Households | Median Income |
| Owner-Occupied | 19,565 (81.6%) | $68,153 |
| Renter-Occupied | 4,419 (18.4%) | $36,604 |
| Average | 23,984 (100.0%) | $61,250 |
Occupancy by Householder Income Bracket in Montcalm County
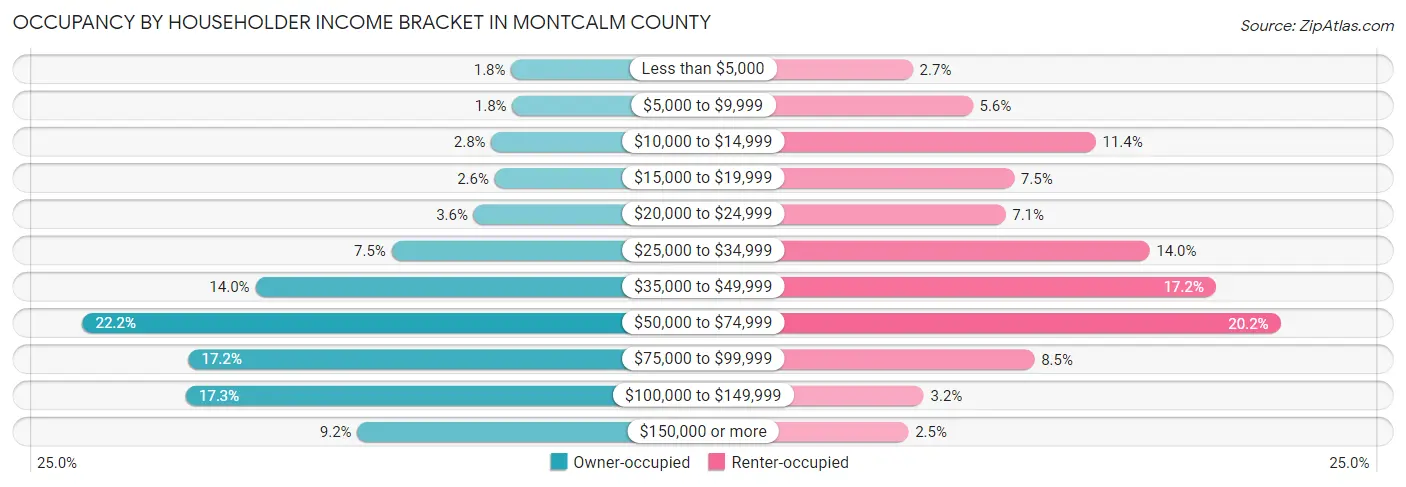
| Income Bracket | Owner-occupied | Renter-occupied |
| Less than $5,000 | 356 (1.8%) | 120 (2.7%) |
| $5,000 to $9,999 | 346 (1.8%) | 246 (5.6%) |
| $10,000 to $14,999 | 542 (2.8%) | 505 (11.4%) |
| $15,000 to $19,999 | 510 (2.6%) | 333 (7.5%) |
| $20,000 to $24,999 | 706 (3.6%) | 315 (7.1%) |
| $25,000 to $34,999 | 1,471 (7.5%) | 618 (14.0%) |
| $35,000 to $49,999 | 2,741 (14.0%) | 758 (17.2%) |
| $50,000 to $74,999 | 4,351 (22.2%) | 894 (20.2%) |
| $75,000 to $99,999 | 3,363 (17.2%) | 376 (8.5%) |
| $100,000 to $149,999 | 3,388 (17.3%) | 143 (3.2%) |
| $150,000 or more | 1,791 (9.1%) | 111 (2.5%) |
| Total | 19,565 (100.0%) | 4,419 (100.0%) |
Monthly Housing Cost Tiers in Montcalm County
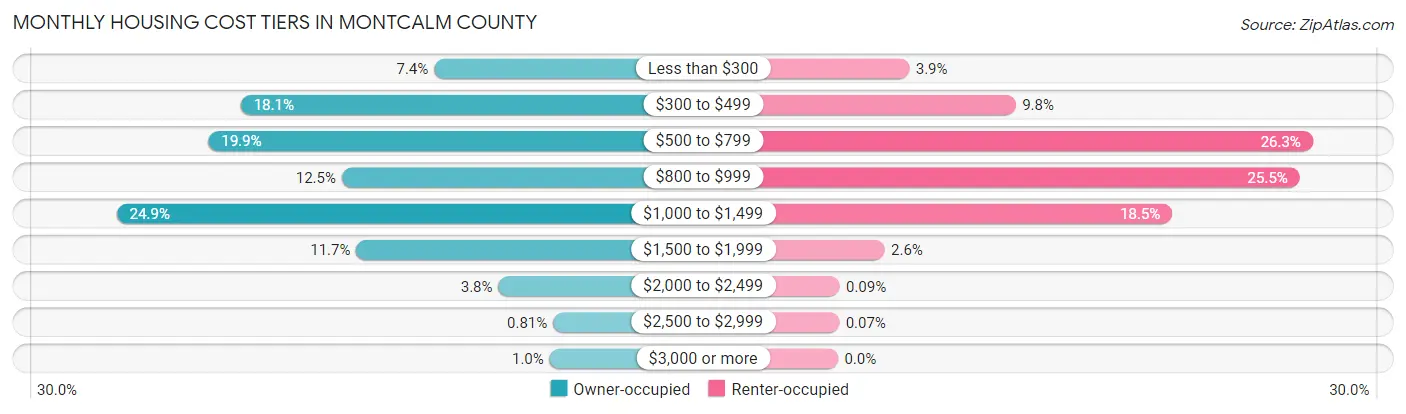
| Monthly Cost | Owner-occupied | Renter-occupied |
| Less than $300 | 1,444 (7.4%) | 174 (3.9%) |
| $300 to $499 | 3,534 (18.1%) | 434 (9.8%) |
| $500 to $799 | 3,883 (19.9%) | 1,160 (26.3%) |
| $800 to $999 | 2,441 (12.5%) | 1,128 (25.5%) |
| $1,000 to $1,499 | 4,876 (24.9%) | 817 (18.5%) |
| $1,500 to $1,999 | 2,285 (11.7%) | 114 (2.6%) |
| $2,000 to $2,499 | 749 (3.8%) | 4 (0.1%) |
| $2,500 to $2,999 | 158 (0.8%) | 3 (0.1%) |
| $3,000 or more | 195 (1.0%) | 0 (0.0%) |
| Total | 19,565 (100.0%) | 4,419 (100.0%) |
Physical Housing Characteristics in Montcalm County
Housing Structures in Montcalm County
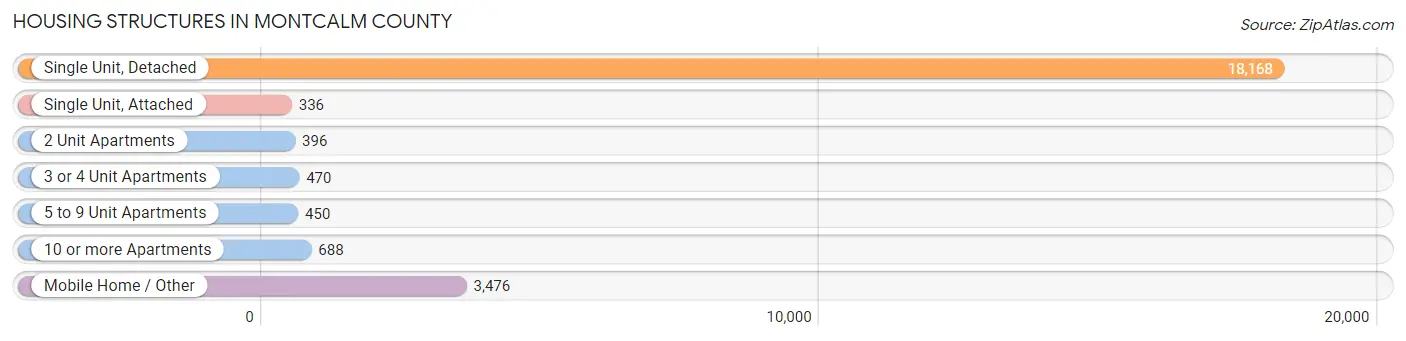
| Structure Type | # Housing Units | % Housing Units |
| Single Unit, Detached | 18,168 | 75.7% |
| Single Unit, Attached | 336 | 1.4% |
| 2 Unit Apartments | 396 | 1.7% |
| 3 or 4 Unit Apartments | 470 | 2.0% |
| 5 to 9 Unit Apartments | 450 | 1.9% |
| 10 or more Apartments | 688 | 2.9% |
| Mobile Home / Other | 3,476 | 14.5% |
| Total | 23,984 | 100.0% |
Housing Structures by Occupancy in Montcalm County
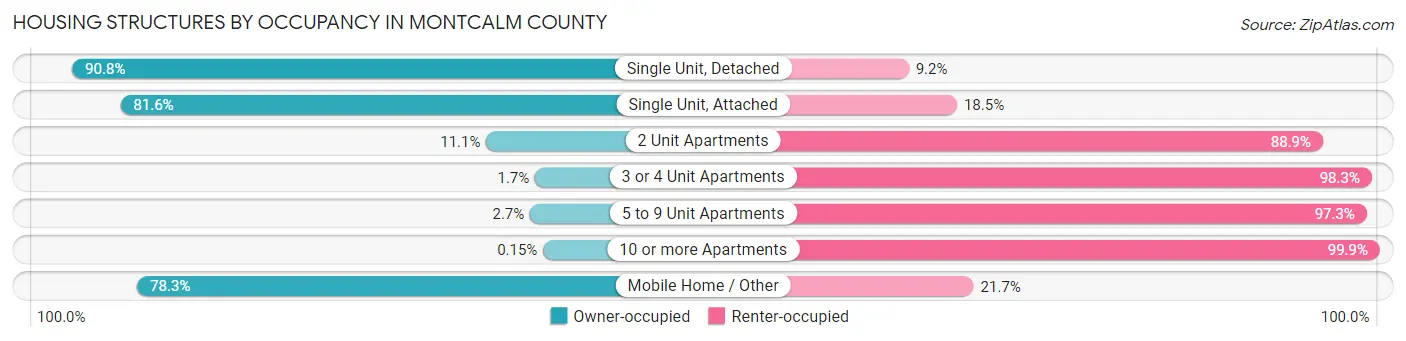
| Structure Type | Owner-occupied | Renter-occupied |
| Single Unit, Detached | 16,503 (90.8%) | 1,665 (9.2%) |
| Single Unit, Attached | 274 (81.6%) | 62 (18.4%) |
| 2 Unit Apartments | 44 (11.1%) | 352 (88.9%) |
| 3 or 4 Unit Apartments | 8 (1.7%) | 462 (98.3%) |
| 5 to 9 Unit Apartments | 12 (2.7%) | 438 (97.3%) |
| 10 or more Apartments | 1 (0.2%) | 687 (99.9%) |
| Mobile Home / Other | 2,723 (78.3%) | 753 (21.7%) |
| Total | 19,565 (81.6%) | 4,419 (18.4%) |
Housing Structures by Number of Rooms in Montcalm County
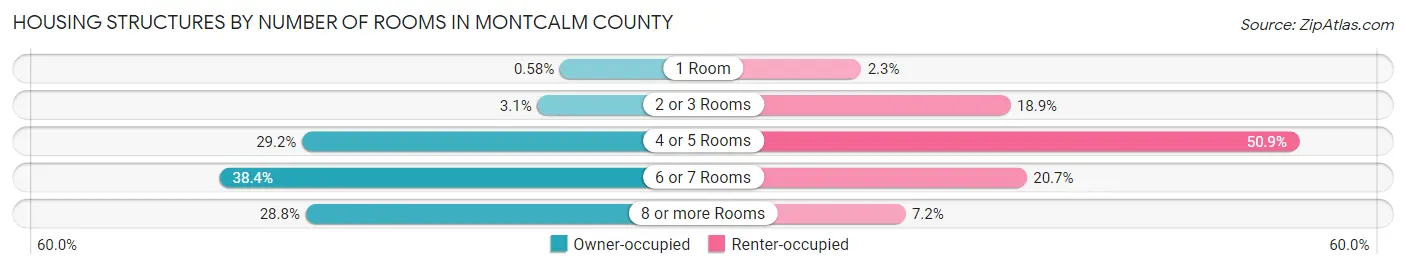
| Number of Rooms | Owner-occupied | Renter-occupied |
| 1 Room | 113 (0.6%) | 102 (2.3%) |
| 2 or 3 Rooms | 602 (3.1%) | 834 (18.9%) |
| 4 or 5 Rooms | 5,712 (29.2%) | 2,250 (50.9%) |
| 6 or 7 Rooms | 7,504 (38.4%) | 914 (20.7%) |
| 8 or more Rooms | 5,634 (28.8%) | 319 (7.2%) |
| Total | 19,565 (100.0%) | 4,419 (100.0%) |
Housing Structure by Heating Type in Montcalm County
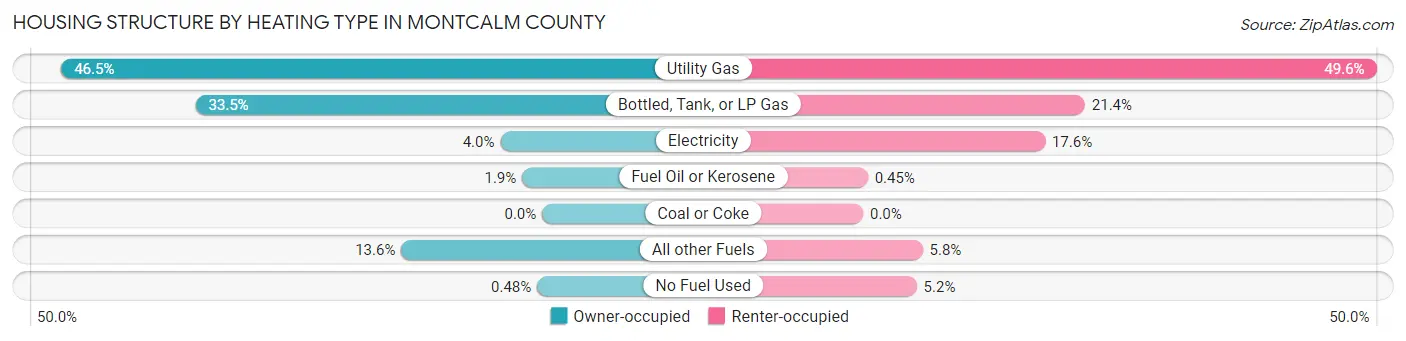
| Heating Type | Owner-occupied | Renter-occupied |
| Utility Gas | 9,089 (46.5%) | 2,192 (49.6%) |
| Bottled, Tank, or LP Gas | 6,553 (33.5%) | 947 (21.4%) |
| Electricity | 790 (4.0%) | 777 (17.6%) |
| Fuel Oil or Kerosene | 377 (1.9%) | 20 (0.4%) |
| Coal or Coke | 0 (0.0%) | 0 (0.0%) |
| All other Fuels | 2,663 (13.6%) | 254 (5.8%) |
| No Fuel Used | 93 (0.5%) | 229 (5.2%) |
| Total | 19,565 (100.0%) | 4,419 (100.0%) |
Household Vehicle Usage in Montcalm County
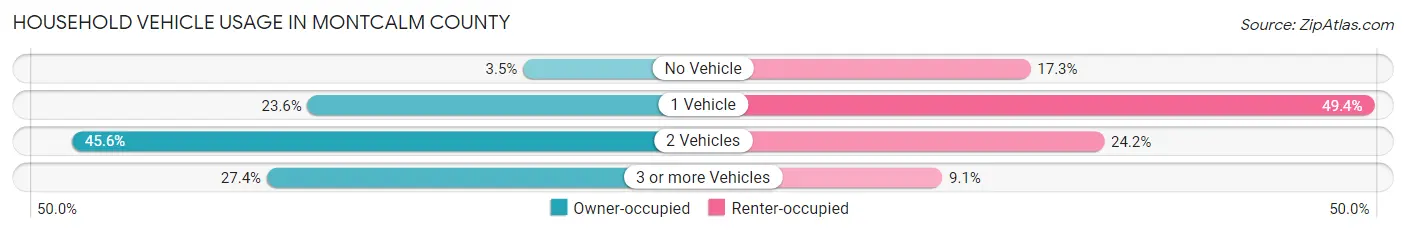
| Vehicles per Household | Owner-occupied | Renter-occupied |
| No Vehicle | 677 (3.5%) | 765 (17.3%) |
| 1 Vehicle | 4,613 (23.6%) | 2,184 (49.4%) |
| 2 Vehicles | 8,918 (45.6%) | 1,069 (24.2%) |
| 3 or more Vehicles | 5,357 (27.4%) | 401 (9.1%) |
| Total | 19,565 (100.0%) | 4,419 (100.0%) |
Real Estate & Mortgages in Montcalm County
Real Estate and Mortgage Overview in Montcalm County
| Characteristic | Without Mortgage | With Mortgage |
| Housing Units | 8,324 | 11,241 |
| Median Property Value | $143,700 | $159,500 |
| Median Household Income | $50,496 | $1,256 |
| Monthly Housing Costs | $461 | $186 |
| Real Estate Taxes | $1,663 | $489 |
Property Value by Mortgage Status in Montcalm County
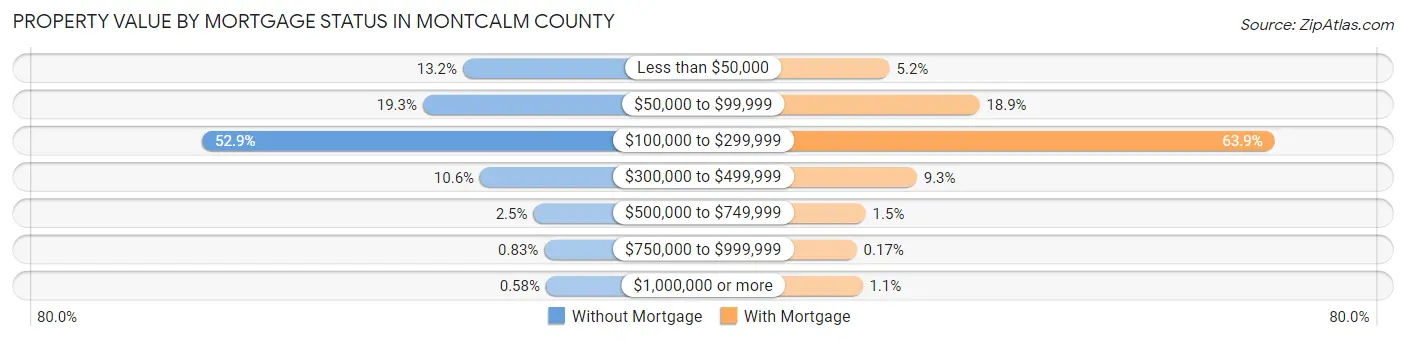
| Property Value | Without Mortgage | With Mortgage |
| Less than $50,000 | 1,101 (13.2%) | 583 (5.2%) |
| $50,000 to $99,999 | 1,608 (19.3%) | 2,122 (18.9%) |
| $100,000 to $299,999 | 4,407 (52.9%) | 7,177 (63.8%) |
| $300,000 to $499,999 | 884 (10.6%) | 1,049 (9.3%) |
| $500,000 to $749,999 | 207 (2.5%) | 173 (1.5%) |
| $750,000 to $999,999 | 69 (0.8%) | 19 (0.2%) |
| $1,000,000 or more | 48 (0.6%) | 118 (1.1%) |
| Total | 8,324 (100.0%) | 11,241 (100.0%) |
Household Income by Mortgage Status in Montcalm County
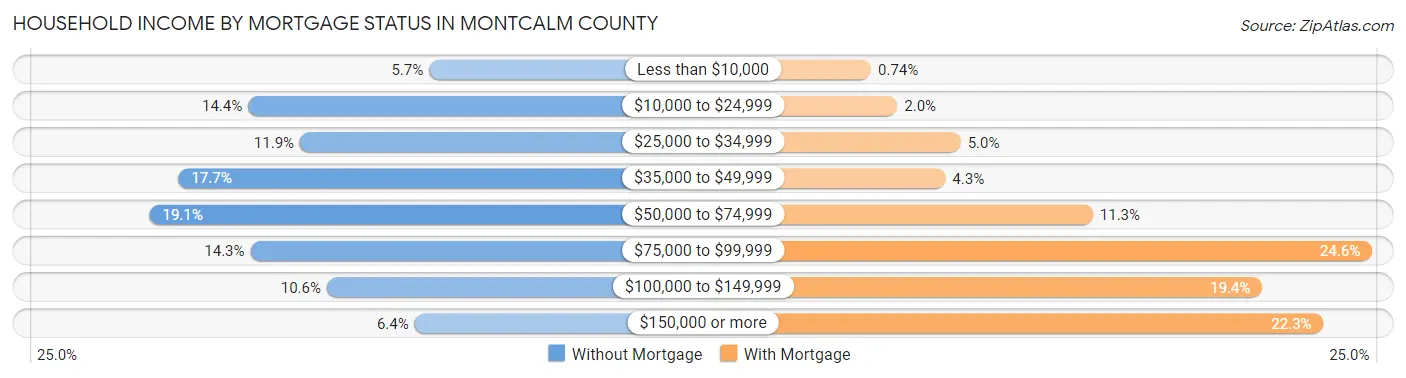
| Household Income | Without Mortgage | With Mortgage |
| Less than $10,000 | 478 (5.7%) | 83 (0.7%) |
| $10,000 to $24,999 | 1,195 (14.4%) | 224 (2.0%) |
| $25,000 to $34,999 | 990 (11.9%) | 563 (5.0%) |
| $35,000 to $49,999 | 1,471 (17.7%) | 481 (4.3%) |
| $50,000 to $74,999 | 1,586 (19.1%) | 1,270 (11.3%) |
| $75,000 to $99,999 | 1,186 (14.2%) | 2,765 (24.6%) |
| $100,000 to $149,999 | 883 (10.6%) | 2,177 (19.4%) |
| $150,000 or more | 535 (6.4%) | 2,505 (22.3%) |
| Total | 8,324 (100.0%) | 11,241 (100.0%) |
Property Value to Household Income Ratio in Montcalm County
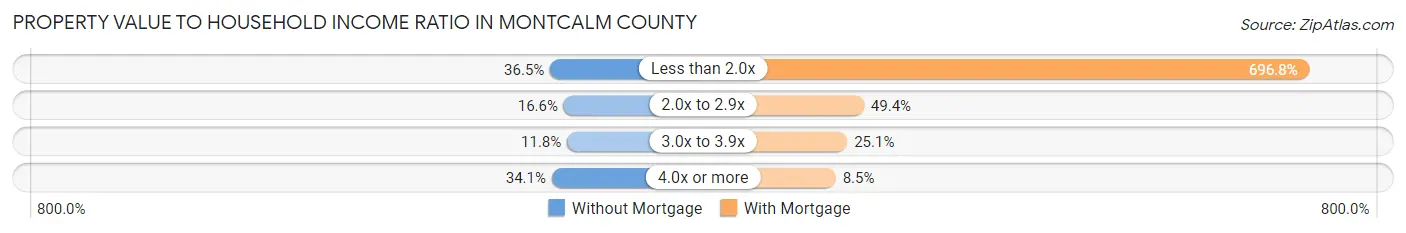
| Value-to-Income Ratio | Without Mortgage | With Mortgage |
| Less than 2.0x | 3,035 (36.5%) | 78,329 (696.8%) |
| 2.0x to 2.9x | 1,379 (16.6%) | 5,553 (49.4%) |
| 3.0x to 3.9x | 978 (11.7%) | 2,825 (25.1%) |
| 4.0x or more | 2,837 (34.1%) | 950 (8.5%) |
| Total | 8,324 (100.0%) | 11,241 (100.0%) |
Real Estate Taxes by Mortgage Status in Montcalm County
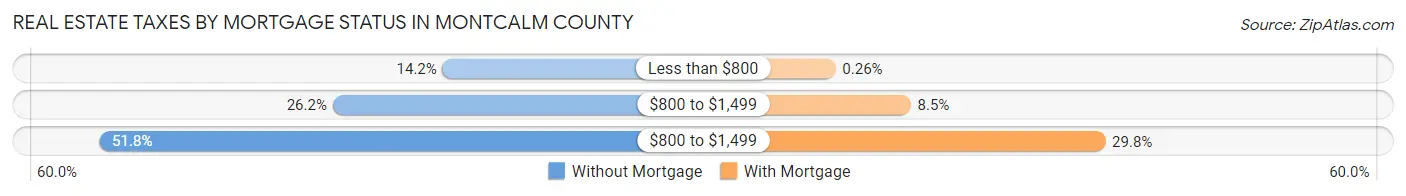
| Property Taxes | Without Mortgage | With Mortgage |
| Less than $800 | 1,181 (14.2%) | 29 (0.3%) |
| $800 to $1,499 | 2,183 (26.2%) | 956 (8.5%) |
| $800 to $1,499 | 4,314 (51.8%) | 3,352 (29.8%) |
| Total | 8,324 (100.0%) | 11,241 (100.0%) |
Health & Disability in Montcalm County
Health Insurance Coverage by Age in Montcalm County
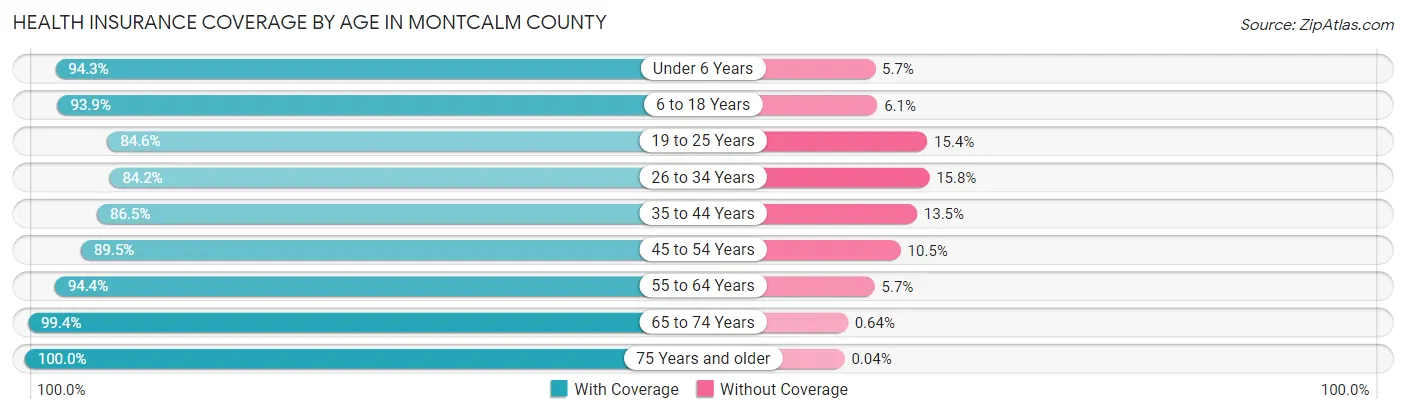
| Age Bracket | With Coverage | Without Coverage |
| Under 6 Years | 3,944 (94.3%) | 240 (5.7%) |
| 6 to 18 Years | 10,172 (93.9%) | 665 (6.1%) |
| 19 to 25 Years | 4,544 (84.6%) | 830 (15.4%) |
| 26 to 34 Years | 6,110 (84.2%) | 1,149 (15.8%) |
| 35 to 44 Years | 6,818 (86.5%) | 1,067 (13.5%) |
| 45 to 54 Years | 7,546 (89.5%) | 886 (10.5%) |
| 55 to 64 Years | 8,547 (94.4%) | 512 (5.7%) |
| 65 to 74 Years | 6,832 (99.4%) | 44 (0.6%) |
| 75 Years and older | 4,449 (100.0%) | 2 (0.0%) |
| Total | 58,962 (91.6%) | 5,395 (8.4%) |
Health Insurance Coverage by Citizenship Status in Montcalm County
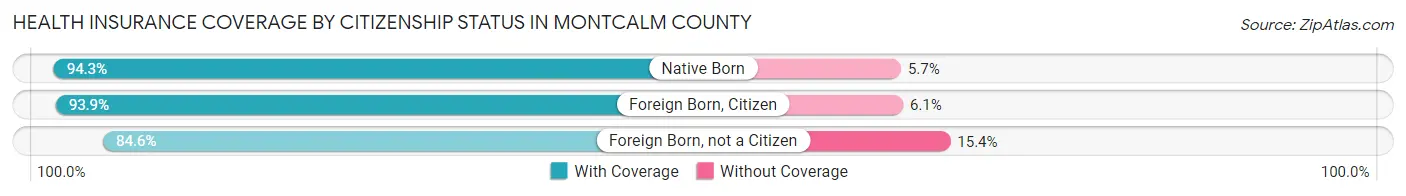
| Citizenship Status | With Coverage | Without Coverage |
| Native Born | 3,944 (94.3%) | 240 (5.7%) |
| Foreign Born, Citizen | 10,172 (93.9%) | 665 (6.1%) |
| Foreign Born, not a Citizen | 4,544 (84.6%) | 830 (15.4%) |
Health Insurance Coverage by Household Income in Montcalm County
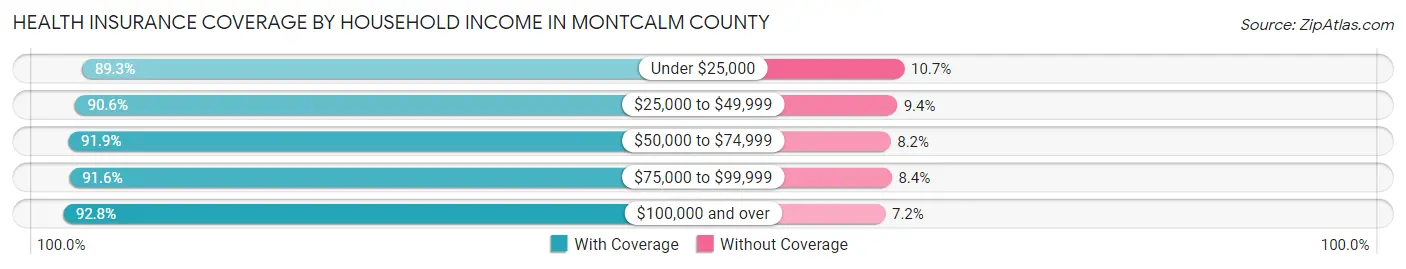
| Household Income | With Coverage | Without Coverage |
| Under $25,000 | 6,429 (89.3%) | 772 (10.7%) |
| $25,000 to $49,999 | 11,213 (90.6%) | 1,158 (9.4%) |
| $50,000 to $74,999 | 13,073 (91.8%) | 1,160 (8.2%) |
| $75,000 to $99,999 | 9,561 (91.6%) | 873 (8.4%) |
| $100,000 and over | 18,442 (92.8%) | 1,423 (7.2%) |
Public vs Private Health Insurance Coverage by Age in Montcalm County
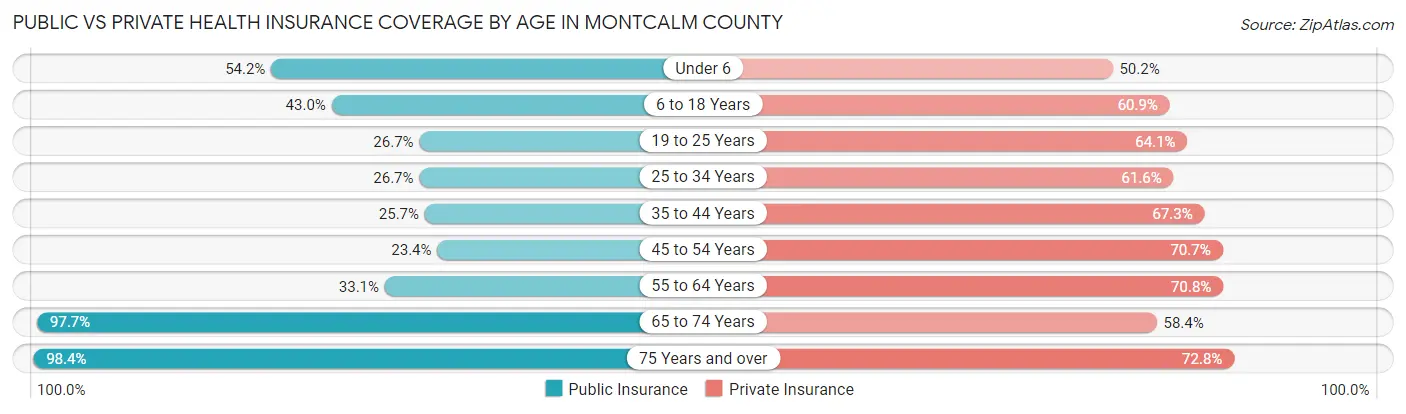
| Age Bracket | Public Insurance | Private Insurance |
| Under 6 | 2,269 (54.2%) | 2,102 (50.2%) |
| 6 to 18 Years | 4,661 (43.0%) | 6,595 (60.9%) |
| 19 to 25 Years | 1,436 (26.7%) | 3,447 (64.1%) |
| 25 to 34 Years | 1,940 (26.7%) | 4,470 (61.6%) |
| 35 to 44 Years | 2,027 (25.7%) | 5,309 (67.3%) |
| 45 to 54 Years | 1,972 (23.4%) | 5,958 (70.7%) |
| 55 to 64 Years | 3,001 (33.1%) | 6,412 (70.8%) |
| 65 to 74 Years | 6,719 (97.7%) | 4,017 (58.4%) |
| 75 Years and over | 4,380 (98.4%) | 3,241 (72.8%) |
| Total | 28,405 (44.1%) | 41,551 (64.6%) |
Disability Status by Sex by Age in Montcalm County
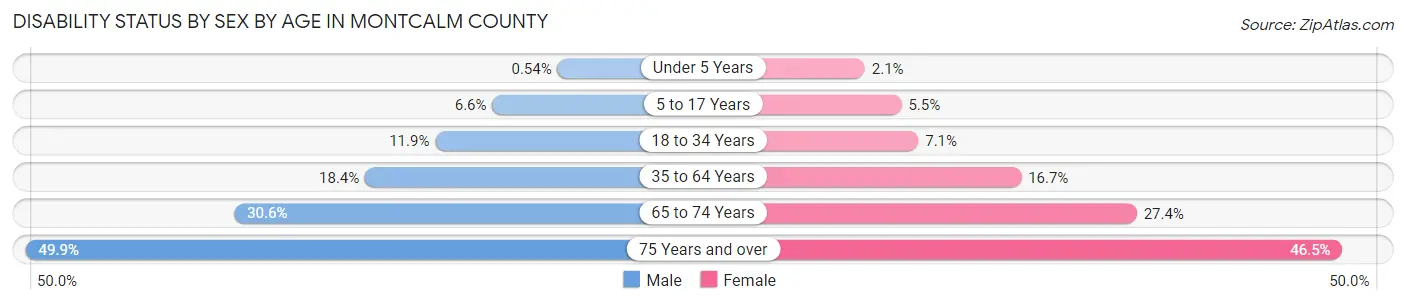
| Age Bracket | Male | Female |
| Under 5 Years | 9 (0.5%) | 40 (2.1%) |
| 5 to 17 Years | 357 (6.6%) | 287 (5.5%) |
| 18 to 34 Years | 892 (11.9%) | 427 (7.1%) |
| 35 to 64 Years | 2,501 (18.4%) | 1,961 (16.7%) |
| 65 to 74 Years | 1,028 (30.5%) | 961 (27.4%) |
| 75 Years and over | 972 (49.9%) | 1,163 (46.5%) |
Disability Class by Sex by Age in Montcalm County
Disability Class: Hearing Difficulty
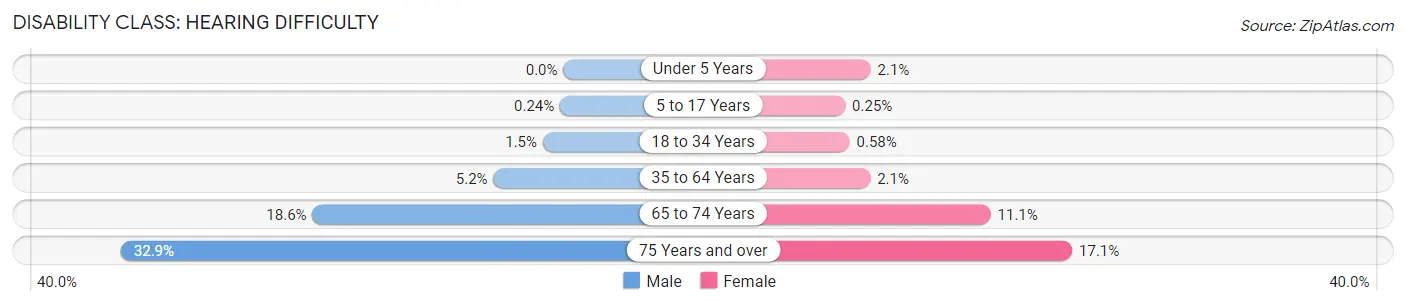
| Age Bracket | Male | Female |
| Under 5 Years | 0 (0.0%) | 40 (2.1%) |
| 5 to 17 Years | 13 (0.2%) | 13 (0.3%) |
| 18 to 34 Years | 114 (1.5%) | 35 (0.6%) |
| 35 to 64 Years | 706 (5.2%) | 249 (2.1%) |
| 65 to 74 Years | 627 (18.6%) | 388 (11.1%) |
| 75 Years and over | 640 (32.9%) | 428 (17.1%) |
Disability Class: Vision Difficulty
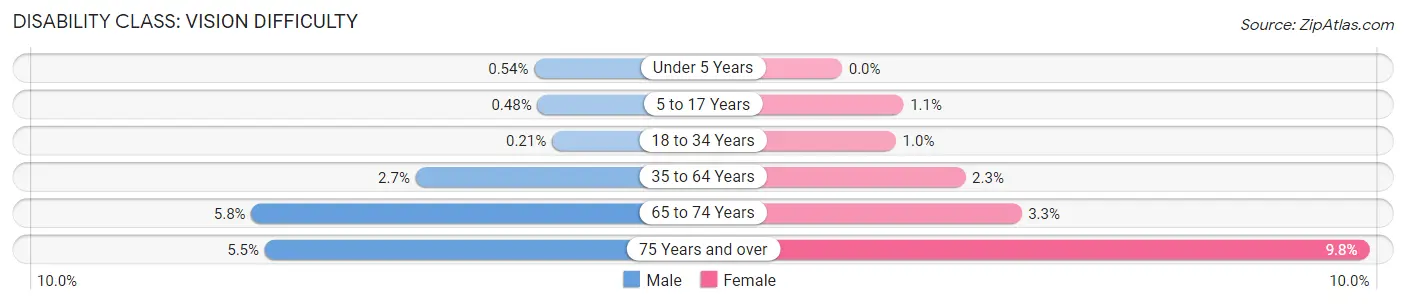
| Age Bracket | Male | Female |
| Under 5 Years | 9 (0.5%) | 0 (0.0%) |
| 5 to 17 Years | 26 (0.5%) | 59 (1.1%) |
| 18 to 34 Years | 16 (0.2%) | 60 (1.0%) |
| 35 to 64 Years | 372 (2.7%) | 270 (2.3%) |
| 65 to 74 Years | 195 (5.8%) | 117 (3.3%) |
| 75 Years and over | 108 (5.5%) | 245 (9.8%) |
Disability Class: Cognitive Difficulty
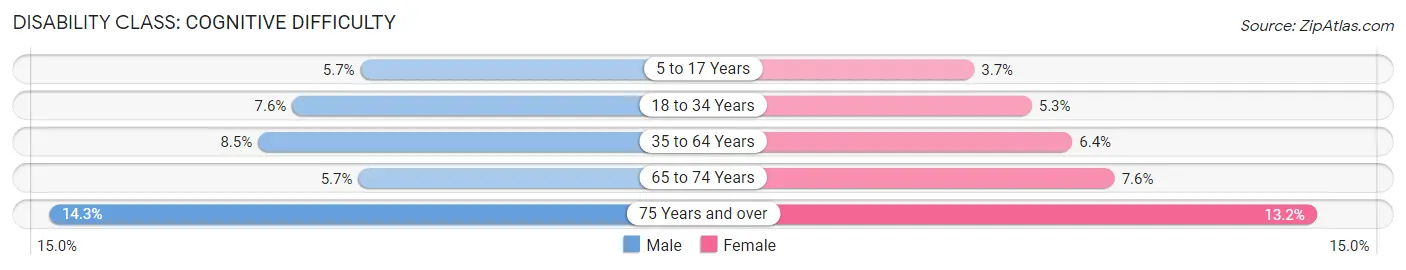
| Age Bracket | Male | Female |
| 5 to 17 Years | 306 (5.7%) | 191 (3.7%) |
| 18 to 34 Years | 567 (7.5%) | 318 (5.3%) |
| 35 to 64 Years | 1,155 (8.5%) | 756 (6.4%) |
| 65 to 74 Years | 192 (5.7%) | 267 (7.6%) |
| 75 Years and over | 279 (14.3%) | 331 (13.2%) |
Disability Class: Ambulatory Difficulty
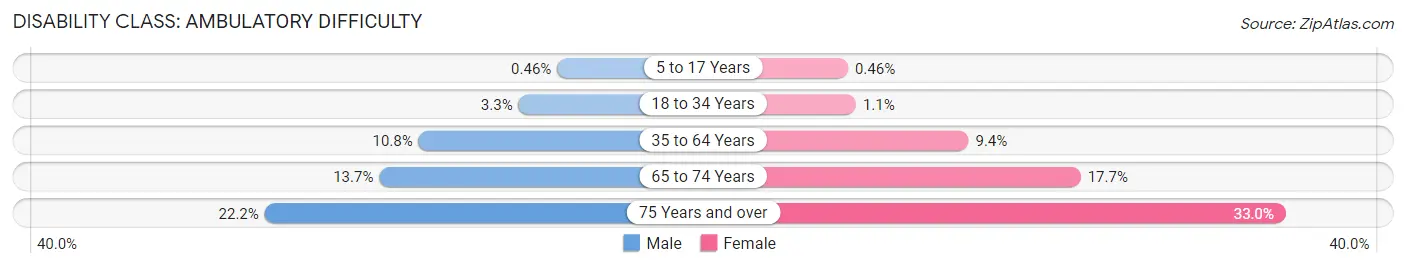
| Age Bracket | Male | Female |
| 5 to 17 Years | 25 (0.5%) | 24 (0.5%) |
| 18 to 34 Years | 250 (3.3%) | 63 (1.1%) |
| 35 to 64 Years | 1,461 (10.7%) | 1,109 (9.4%) |
| 65 to 74 Years | 460 (13.7%) | 623 (17.7%) |
| 75 Years and over | 432 (22.2%) | 825 (33.0%) |
Disability Class: Self-Care Difficulty
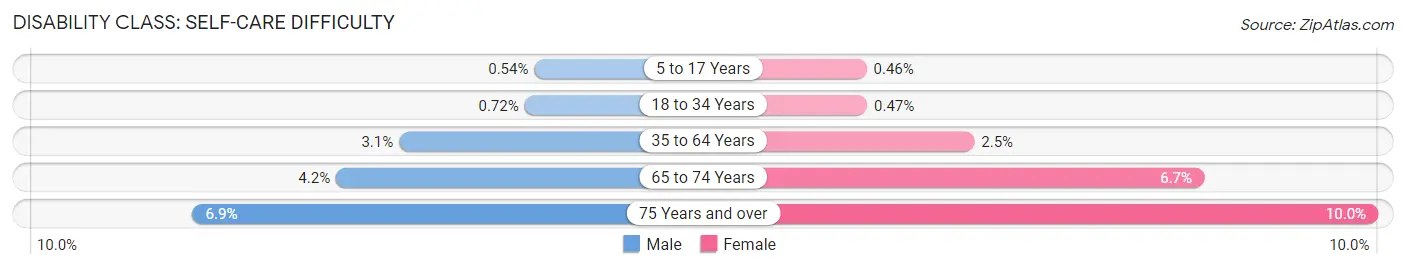
| Age Bracket | Male | Female |
| 5 to 17 Years | 29 (0.5%) | 24 (0.5%) |
| 18 to 34 Years | 54 (0.7%) | 28 (0.5%) |
| 35 to 64 Years | 415 (3.0%) | 290 (2.5%) |
| 65 to 74 Years | 142 (4.2%) | 236 (6.7%) |
| 75 Years and over | 134 (6.9%) | 249 (10.0%) |
Technology Access in Montcalm County
Computing Device Access in Montcalm County
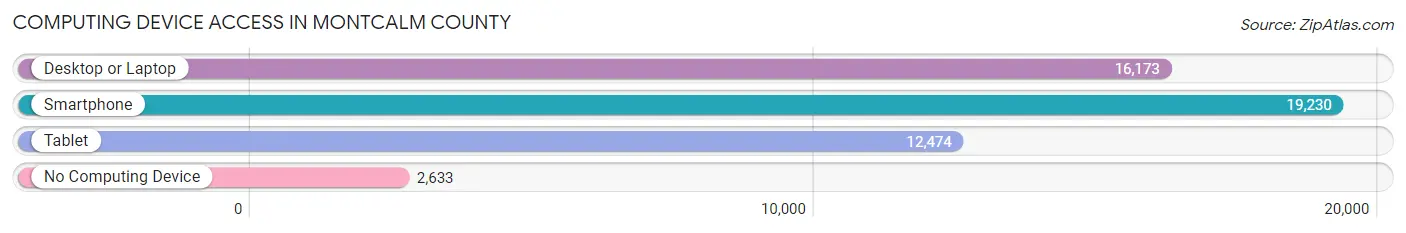
| Device Type | # Households | % Households |
| Desktop or Laptop | 16,173 | 67.4% |
| Smartphone | 19,230 | 80.2% |
| Tablet | 12,474 | 52.0% |
| No Computing Device | 2,633 | 11.0% |
| Total | 23,984 | 100.0% |
Internet Access in Montcalm County
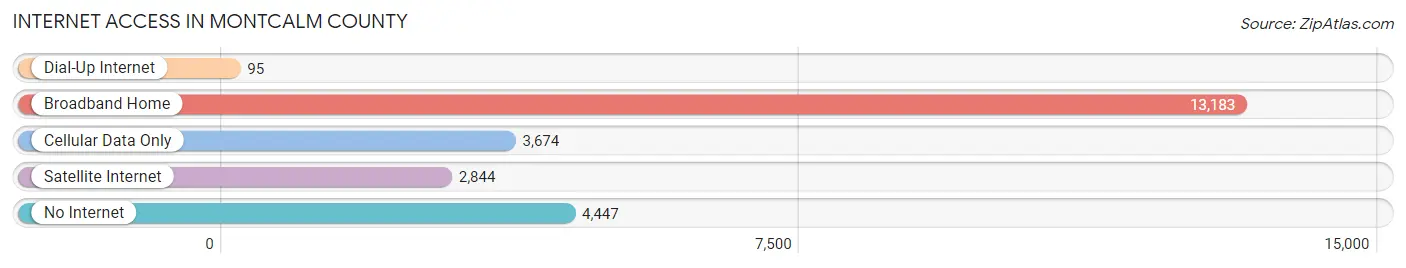
| Internet Type | # Households | % Households |
| Dial-Up Internet | 95 | 0.4% |
| Broadband Home | 13,183 | 55.0% |
| Cellular Data Only | 3,674 | 15.3% |
| Satellite Internet | 2,844 | 11.9% |
| No Internet | 4,447 | 18.5% |
| Total | 23,984 | 100.0% |
Montcalm County Summary
Montcalm County is located in the central part of the Lower Peninsula of Michigan. It is bordered by Gratiot County to the north, Isabella County to the east, Mecosta County to the south, and Newaygo County to the west. The county seat is Stanton, and the largest city is Greenville. The county was established in 1831 and named after General Louis-Joseph de Montcalm, a French military leader who fought in the French and Indian War.
History
The area that is now Montcalm County was originally inhabited by the Ojibwa people. The first European settlers arrived in the area in the early 1800s. The first permanent settlement was established in 1831, and the county was officially organized in 1859.
The county was largely agricultural in the 19th century, with the main crops being wheat, corn, and oats. The county also had a thriving lumber industry, with several sawmills located in the area.
In the early 20th century, the county began to diversify its economy. The automotive industry began to take hold in the area, and several factories were built in the county. The county also became a popular tourist destination, with several resorts and campgrounds located in the area.
Geography
Montcalm County is located in the central part of the Lower Peninsula of Michigan. It is bordered by Gratiot County to the north, Isabella County to the east, Mecosta County to the south, and Newaygo County to the west. The county has a total area of 576 square miles, of which 573 square miles is land and 3 square miles is water.
The county is mostly flat, with some rolling hills in the northern part of the county. The Flat River runs through the county, and there are several small lakes and ponds scattered throughout the area. The county is mostly covered in deciduous forests, with some coniferous forests in the northern part of the county.
Economy
The economy of Montcalm County is largely based on manufacturing and agriculture. The county is home to several automotive parts manufacturers, as well as several food processing plants. The county is also home to several farms, which produce corn, wheat, oats, and other crops.
The county also has a thriving tourism industry, with several resorts and campgrounds located in the area. The county is also home to several state parks, which attract visitors from all over the state.
Demographics
As of the 2010 census, the population of Montcalm County was 63,342. The population density was 110 people per square mile. The racial makeup of the county was 94.2% White, 1.7% African American, 0.7% Native American, 0.5% Asian, 0.1% Pacific Islander, 1.3% from other races, and 1.6% from two or more races. Hispanic or Latino of any race were 3.3% of the population.
The median income for a household in the county was $41,945, and the median income for a family was $50,945. The per capita income for the county was $20,945. About 11.2% of families and 14.7% of the population were below the poverty line, including 19.2% of those under age 18 and 8.2% of those age 65 or over.
Common Questions
What is the Total Population of Montcalm County?
Total Population of Montcalm County is 66,901.
What is the Total Male Population of Montcalm County?
Total Male Population of Montcalm County is 35,863.
What is the Total Female Population of Montcalm County?
Total Female Population of Montcalm County is 31,038.
What is the Ratio of Males per 100 Females in Montcalm County?
There are 115.55 Males per 100 Females in Montcalm County.
What is the Ratio of Females per 100 Males in Montcalm County?
There are 86.55 Females per 100 Males in Montcalm County.
What is the Median Population Age in Montcalm County?
Median Population Age in Montcalm County is 40.6 Years.
What is the Average Family Size in Montcalm County
Average Family Size in Montcalm County is 3.2 People.
What is the Average Household Size in Montcalm County
Average Household Size in Montcalm County is 2.7 People.
What is Per Capita Income in Montcalm County?
Per Capita income in Montcalm County is $28,370.
What is the Median Family Income in Montcalm County?
Median Family Income in Montcalm County is $70,362.
What is the Median Household income in Montcalm County?
Median Household Income in Montcalm County is $61,250.
What is Income or Wage Gap in Montcalm County?
Income or Wage Gap in Montcalm County is 30.1%.
Women in Montcalm County earn 69.9 cents for every dollar earned by a man.
What is Family Income Deficit in Montcalm County?
Family Income Deficit in Montcalm County is $10,051.
Families that are below poverty line in Montcalm County earn $10,051 less on average than the poverty threshold level.
What is Inequality or Gini Index in Montcalm County?
Inequality or Gini Index in Montcalm County is 0.40.
How Large is the Labor Force in Montcalm County?
There are 30,109 People in the Labor Forcein in Montcalm County.
What is the Percentage of People in the Labor Force in Montcalm County?
55.5% of People are in the Labor Force in Montcalm County.
What is the Unemployment Rate in Montcalm County?
Unemployment Rate in Montcalm County is 4.2%.