Monroe County, MI
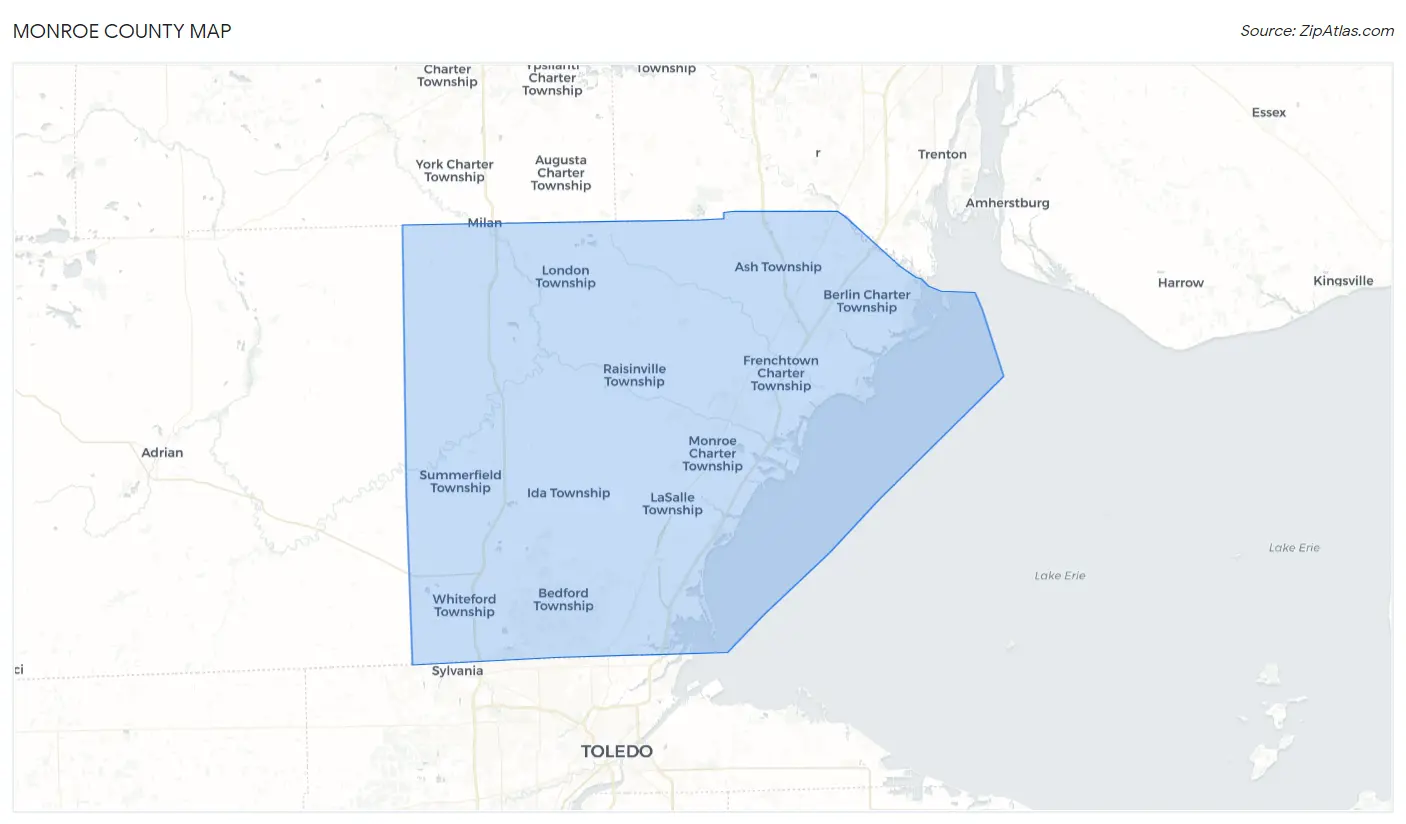
Monroe County Map
Monroe County Overview
154,823
TOTAL POPULATION
77,273
MALE POPULATION
77,550
FEMALE POPULATION
99.64
MALES / 100 FEMALES
100.36
FEMALES / 100 MALES
42.6
MEDIAN AGE
3.0
AVG FAMILY SIZE
2.5
AVG HOUSEHOLD SIZE
$37,704
PER CAPITA INCOME
$90,396
AVG FAMILY INCOME
$72,573
AVG HOUSEHOLD INCOME
42.8%
WAGE / INCOME GAP [ % ]
57.2¢/ $1
WAGE / INCOME GAP [ $ ]
$10,772
FAMILY INCOME DEFICIT
0.42
INEQUALITY / GINI INDEX
75,376
LABOR FORCE [ PEOPLE ]
59.7%
PERCENT IN LABOR FORCE
5.7%
UNEMPLOYMENT RATE
Monroe County Area Codes
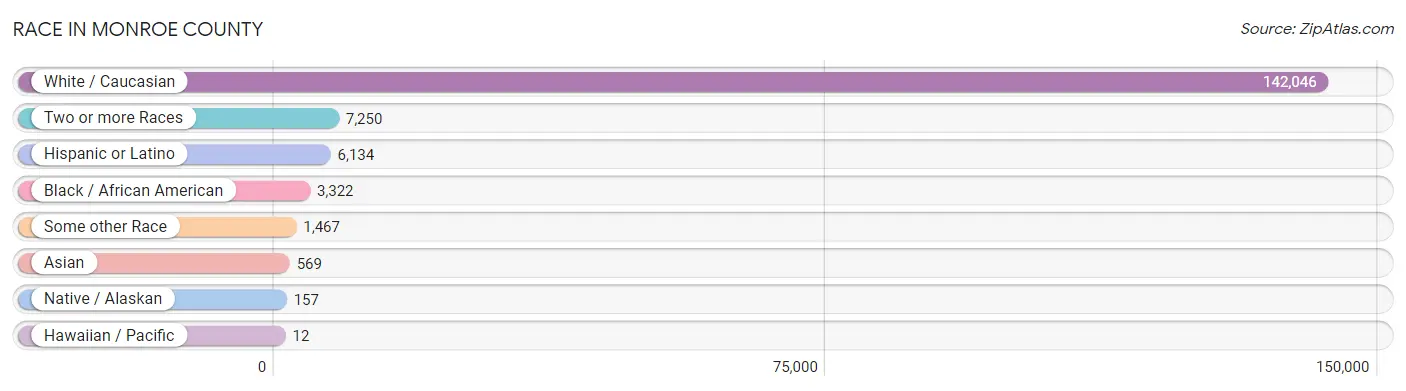
Race in Monroe County
The most populous races in Monroe County are White / Caucasian (142,046 | 91.7%), Two or more Races (7,250 | 4.7%), and Hispanic or Latino (6,134 | 4.0%).
| Race | # Population | % Population |
| Asian | 569 | 0.4% |
| Black / African American | 3,322 | 2.1% |
| Hawaiian / Pacific | 12 | 0.0% |
| Hispanic or Latino | 6,134 | 4.0% |
| Native / Alaskan | 157 | 0.1% |
| White / Caucasian | 142,046 | 91.7% |
| Two or more Races | 7,250 | 4.7% |
| Some other Race | 1,467 | 0.9% |
| Total | 154,823 | 100.0% |
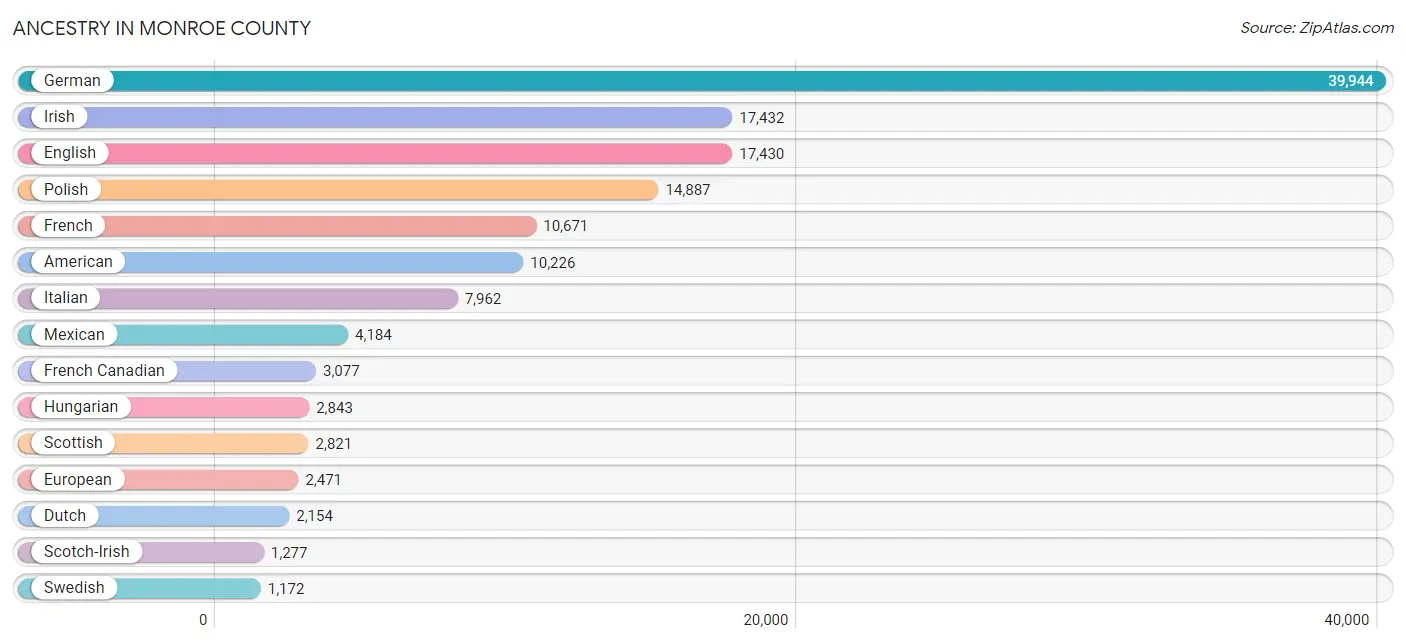
Ancestry in Monroe County
The most populous ancestries reported in Monroe County are German (39,944 | 25.8%), Irish (17,432 | 11.3%), English (17,430 | 11.3%), Polish (14,887 | 9.6%), and French (10,671 | 6.9%), together accounting for 64.8% of all Monroe County residents.
| Ancestry | # Population | % Population |
| Afghan | 340 | 0.2% |
| African | 184 | 0.1% |
| Albanian | 140 | 0.1% |
| American | 10,226 | 6.6% |
| Arab | 1,099 | 0.7% |
| Armenian | 94 | 0.1% |
| Assyrian / Chaldean / Syriac | 28 | 0.0% |
| Australian | 36 | 0.0% |
| Austrian | 169 | 0.1% |
| Bangladeshi | 62 | 0.0% |
| Basque | 12 | 0.0% |
| Belgian | 1,060 | 0.7% |
| Bhutanese | 200 | 0.1% |
| Blackfeet | 79 | 0.1% |
| Brazilian | 144 | 0.1% |
| British | 645 | 0.4% |
| Bulgarian | 172 | 0.1% |
| Burmese | 170 | 0.1% |
| Cajun | 6 | 0.0% |
| Canadian | 552 | 0.4% |
| Celtic | 11 | 0.0% |
| Central American | 392 | 0.3% |
| Cherokee | 296 | 0.2% |
| Chilean | 7 | 0.0% |
| Chippewa | 132 | 0.1% |
| Choctaw | 14 | 0.0% |
| Colombian | 34 | 0.0% |
| Comanche | 14 | 0.0% |
| Costa Rican | 35 | 0.0% |
| Cree | 7 | 0.0% |
| Creek | 5 | 0.0% |
| Croatian | 249 | 0.2% |
| Cuban | 228 | 0.2% |
| Czech | 632 | 0.4% |
| Czechoslovakian | 167 | 0.1% |
| Danish | 257 | 0.2% |
| Delaware | 6 | 0.0% |
| Dominican | 2 | 0.0% |
| Dutch | 2,154 | 1.4% |
| Dutch West Indian | 53 | 0.0% |
| Eastern European | 463 | 0.3% |
| Ecuadorian | 26 | 0.0% |
| Egyptian | 23 | 0.0% |
| English | 17,430 | 11.3% |
| European | 2,471 | 1.6% |
| Finnish | 609 | 0.4% |
| French | 10,671 | 6.9% |
| French American Indian | 20 | 0.0% |
| French Canadian | 3,077 | 2.0% |
| German | 39,944 | 25.8% |
| Ghanaian | 32 | 0.0% |
| Greek | 684 | 0.4% |
| Guatemalan | 76 | 0.1% |
| Hungarian | 2,843 | 1.8% |
| Indian (Asian) | 96 | 0.1% |
| Iranian | 18 | 0.0% |
| Iraqi | 65 | 0.0% |
| Irish | 17,432 | 11.3% |
| Iroquois | 29 | 0.0% |
| Italian | 7,962 | 5.1% |
| Jamaican | 1 | 0.0% |
| Jordanian | 14 | 0.0% |
| Korean | 293 | 0.2% |
| Laotian | 4 | 0.0% |
| Latvian | 41 | 0.0% |
| Lebanese | 409 | 0.3% |
| Lithuanian | 397 | 0.3% |
| Lumbee | 12 | 0.0% |
| Macedonian | 23 | 0.0% |
| Malaysian | 4 | 0.0% |
| Maltese | 167 | 0.1% |
| Mexican | 4,184 | 2.7% |
| Mexican American Indian | 45 | 0.0% |
| Native Hawaiian | 12 | 0.0% |
| Nicaraguan | 236 | 0.2% |
| Nigerian | 277 | 0.2% |
| Northern European | 208 | 0.1% |
| Norwegian | 584 | 0.4% |
| Ottawa | 24 | 0.0% |
| Pakistani | 30 | 0.0% |
| Palestinian | 78 | 0.1% |
| Panamanian | 40 | 0.0% |
| Pennsylvania German | 62 | 0.0% |
| Peruvian | 34 | 0.0% |
| Polish | 14,887 | 9.6% |
| Portuguese | 47 | 0.0% |
| Potawatomi | 3 | 0.0% |
| Puerto Rican | 671 | 0.4% |
| Romanian | 539 | 0.4% |
| Russian | 699 | 0.4% |
| Salvadoran | 5 | 0.0% |
| Samoan | 133 | 0.1% |
| Scandinavian | 207 | 0.1% |
| Scotch-Irish | 1,277 | 0.8% |
| Scottish | 2,821 | 1.8% |
| Serbian | 296 | 0.2% |
| Sioux | 27 | 0.0% |
| Slavic | 44 | 0.0% |
| Slovak | 299 | 0.2% |
| Slovene | 108 | 0.1% |
| Somali | 11 | 0.0% |
| South American | 101 | 0.1% |
| Spaniard | 42 | 0.0% |
| Spanish | 231 | 0.2% |
| Sri Lankan | 75 | 0.1% |
| Subsaharan African | 515 | 0.3% |
| Swedish | 1,172 | 0.8% |
| Swiss | 303 | 0.2% |
| Syrian | 141 | 0.1% |
| Thai | 219 | 0.1% |
| Turkish | 38 | 0.0% |
| Ukrainian | 631 | 0.4% |
| Welsh | 491 | 0.3% |
| West Indian | 1 | 0.0% |
| Yugoslavian | 161 | 0.1% |
| Zimbabwean | 11 | 0.0% | View All 116 Rows |
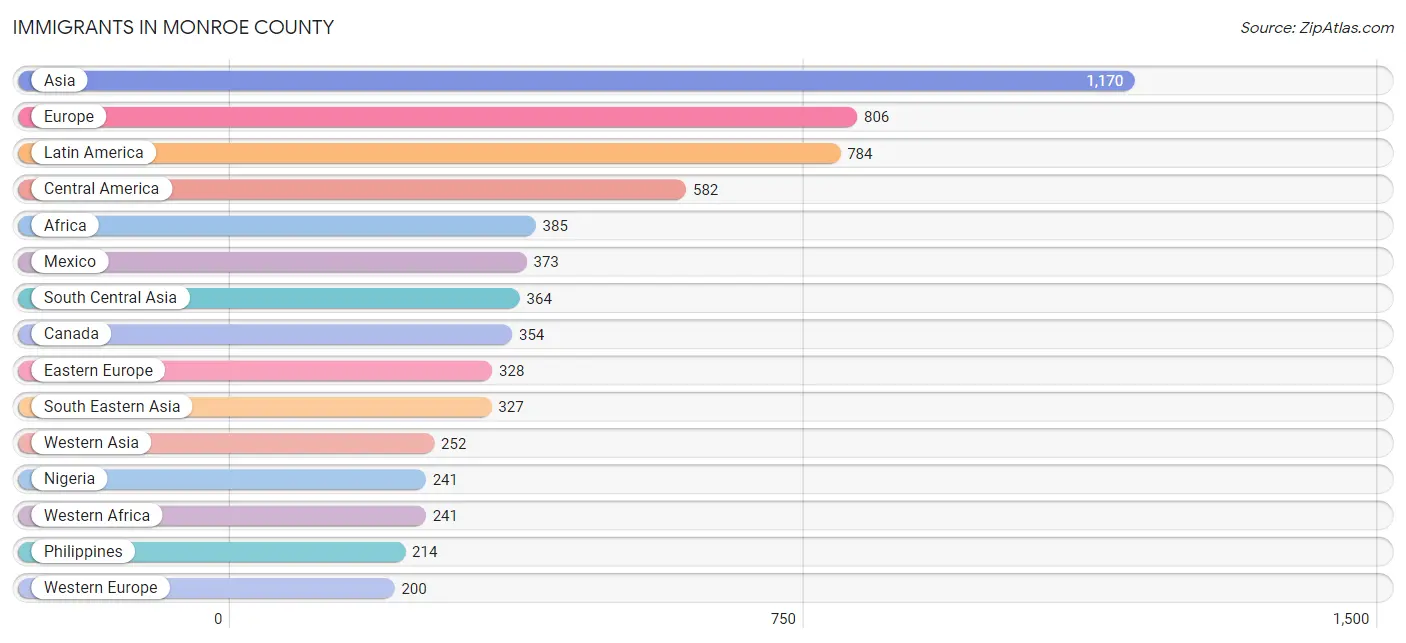
Immigrants in Monroe County
The most numerous immigrant groups reported in Monroe County came from Asia (1,170 | 0.8%), Europe (806 | 0.5%), Latin America (784 | 0.5%), Central America (582 | 0.4%), and Africa (385 | 0.3%), together accounting for 2.4% of all Monroe County residents.
| Immigration Origin | # Population | % Population |
| Afghanistan | 178 | 0.1% |
| Africa | 385 | 0.3% |
| Albania | 42 | 0.0% |
| Argentina | 4 | 0.0% |
| Asia | 1,170 | 0.8% |
| Australia | 13 | 0.0% |
| Brazil | 107 | 0.1% |
| Canada | 354 | 0.2% |
| Caribbean | 50 | 0.0% |
| Central America | 582 | 0.4% |
| Chile | 7 | 0.0% |
| China | 29 | 0.0% |
| Colombia | 34 | 0.0% |
| Costa Rica | 21 | 0.0% |
| Cuba | 47 | 0.0% |
| Czechoslovakia | 20 | 0.0% |
| Eastern Africa | 72 | 0.1% |
| Eastern Asia | 117 | 0.1% |
| Eastern Europe | 328 | 0.2% |
| Egypt | 23 | 0.0% |
| England | 93 | 0.1% |
| Europe | 806 | 0.5% |
| France | 7 | 0.0% |
| Germany | 155 | 0.1% |
| Greece | 30 | 0.0% |
| Guatemala | 75 | 0.1% |
| Hong Kong | 7 | 0.0% |
| Hungary | 8 | 0.0% |
| India | 70 | 0.1% |
| Iran | 18 | 0.0% |
| Iraq | 106 | 0.1% |
| Ireland | 19 | 0.0% |
| Israel | 2 | 0.0% |
| Italy | 59 | 0.0% |
| Jamaica | 3 | 0.0% |
| Japan | 13 | 0.0% |
| Jordan | 48 | 0.0% |
| Kenya | 60 | 0.0% |
| Korea | 75 | 0.1% |
| Kuwait | 11 | 0.0% |
| Laos | 62 | 0.0% |
| Latin America | 784 | 0.5% |
| Lebanon | 29 | 0.0% |
| Mexico | 373 | 0.2% |
| Netherlands | 38 | 0.0% |
| Nicaragua | 113 | 0.1% |
| Nigeria | 241 | 0.2% |
| Northern Africa | 23 | 0.0% |
| Northern Europe | 140 | 0.1% |
| Oceania | 13 | 0.0% |
| Pakistan | 84 | 0.1% |
| Philippines | 214 | 0.1% |
| Poland | 67 | 0.0% |
| Romania | 116 | 0.1% |
| Russia | 40 | 0.0% |
| South Africa | 49 | 0.0% |
| South America | 152 | 0.1% |
| South Central Asia | 364 | 0.2% |
| South Eastern Asia | 327 | 0.2% |
| Southern Europe | 138 | 0.1% |
| Sri Lanka | 14 | 0.0% |
| Syria | 38 | 0.0% |
| Ukraine | 25 | 0.0% |
| Vietnam | 51 | 0.0% |
| Western Africa | 241 | 0.2% |
| Western Asia | 252 | 0.2% |
| Western Europe | 200 | 0.1% |
| Zimbabwe | 11 | 0.0% | View All 68 Rows |
Sex and Age in Monroe County
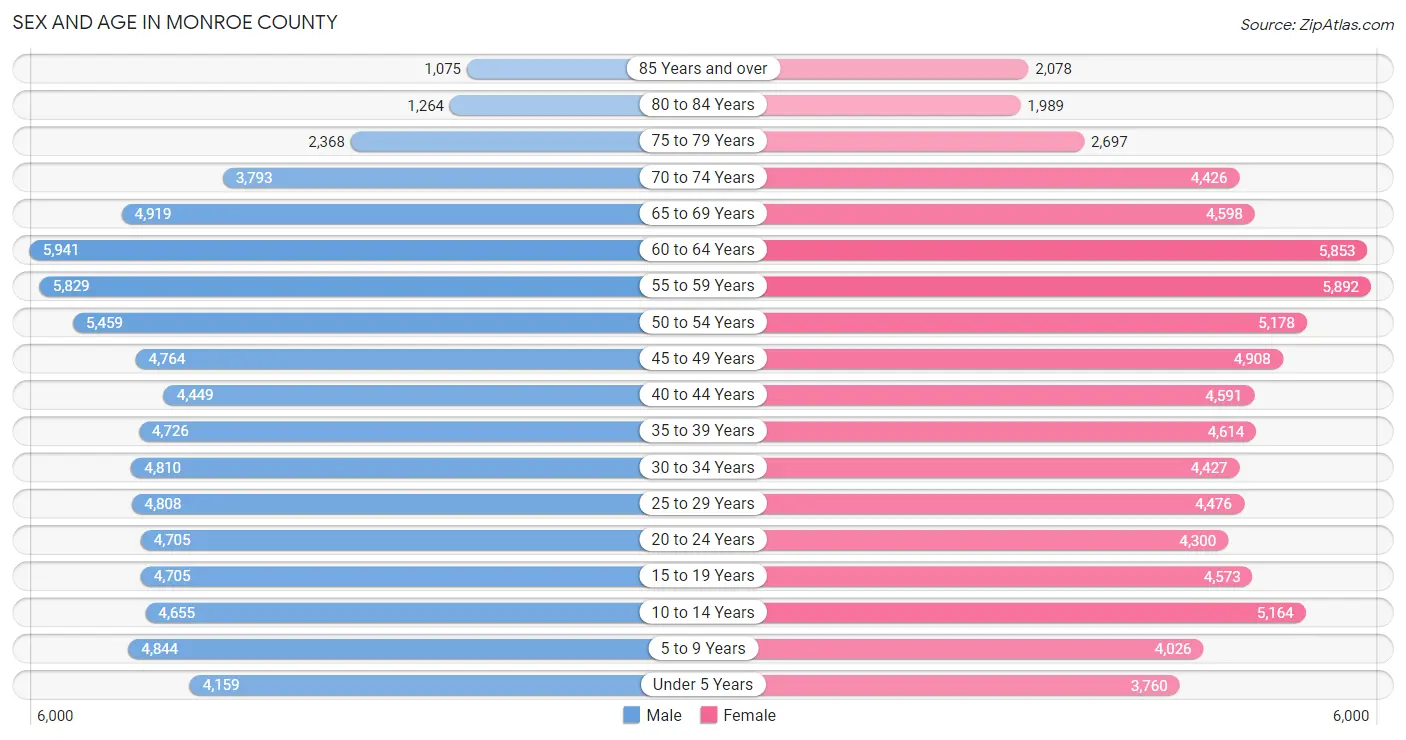
Sex and Age in Monroe County
The most populous age groups in Monroe County are 60 to 64 Years (5,941 | 7.7%) for men and 55 to 59 Years (5,892 | 7.6%) for women.
| Age Bracket | Male | Female |
| Under 5 Years | 4,159 (5.4%) | 3,760 (4.9%) |
| 5 to 9 Years | 4,844 (6.3%) | 4,026 (5.2%) |
| 10 to 14 Years | 4,655 (6.0%) | 5,164 (6.7%) |
| 15 to 19 Years | 4,705 (6.1%) | 4,573 (5.9%) |
| 20 to 24 Years | 4,705 (6.1%) | 4,300 (5.5%) |
| 25 to 29 Years | 4,808 (6.2%) | 4,476 (5.8%) |
| 30 to 34 Years | 4,810 (6.2%) | 4,427 (5.7%) |
| 35 to 39 Years | 4,726 (6.1%) | 4,614 (5.9%) |
| 40 to 44 Years | 4,449 (5.8%) | 4,591 (5.9%) |
| 45 to 49 Years | 4,764 (6.2%) | 4,908 (6.3%) |
| 50 to 54 Years | 5,459 (7.1%) | 5,178 (6.7%) |
| 55 to 59 Years | 5,829 (7.5%) | 5,892 (7.6%) |
| 60 to 64 Years | 5,941 (7.7%) | 5,853 (7.5%) |
| 65 to 69 Years | 4,919 (6.4%) | 4,598 (5.9%) |
| 70 to 74 Years | 3,793 (4.9%) | 4,426 (5.7%) |
| 75 to 79 Years | 2,368 (3.1%) | 2,697 (3.5%) |
| 80 to 84 Years | 1,264 (1.6%) | 1,989 (2.6%) |
| 85 Years and over | 1,075 (1.4%) | 2,078 (2.7%) |
| Total | 77,273 (100.0%) | 77,550 (100.0%) |
Families and Households in Monroe County
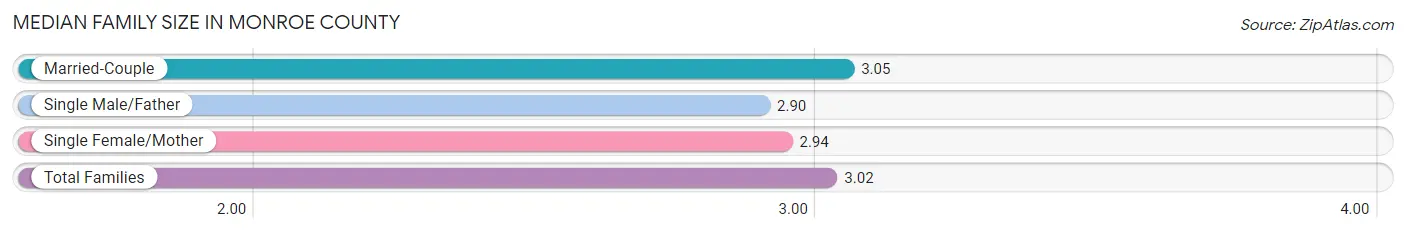
Median Family Size in Monroe County
The median family size in Monroe County is 3.02 persons per family, with married-couple families (31,673 | 78.0%) accounting for the largest median family size of 3.05 persons per family. On the other hand, single male/father families (3,102 | 7.6%) represent the smallest median family size with 2.90 persons per family.
| Family Type | # Families | Family Size |
| Married-Couple | 31,673 (78.0%) | 3.05 |
| Single Male/Father | 3,102 (7.6%) | 2.90 |
| Single Female/Mother | 5,838 (14.4%) | 2.94 |
| Total Families | 40,613 (100.0%) | 3.02 |
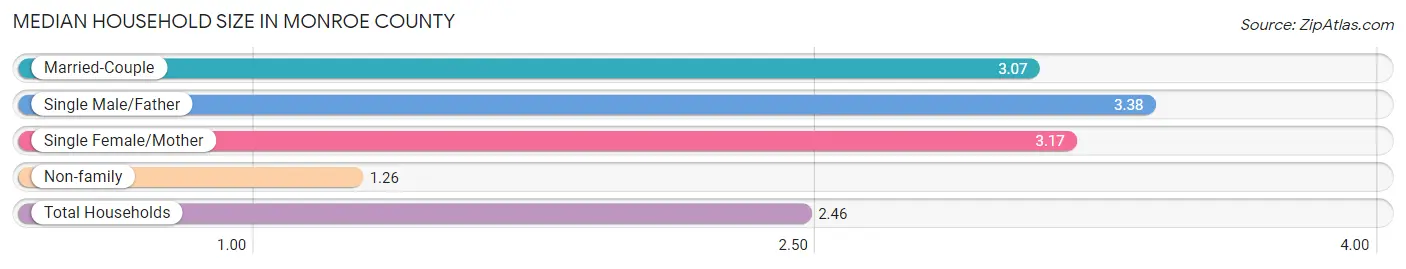
Median Household Size in Monroe County
The median household size in Monroe County is 2.46 persons per household, with single male/father households (3,102 | 5.0%) accounting for the largest median household size of 3.38 persons per household. non-family households (21,627 | 34.7%) represent the smallest median household size with 1.26 persons per household.
| Household Type | # Households | Household Size |
| Married-Couple | 31,673 (50.9%) | 3.07 |
| Single Male/Father | 3,102 (5.0%) | 3.38 |
| Single Female/Mother | 5,838 (9.4%) | 3.17 |
| Non-family | 21,627 (34.7%) | 1.26 |
| Total Households | 62,240 (100.0%) | 2.46 |
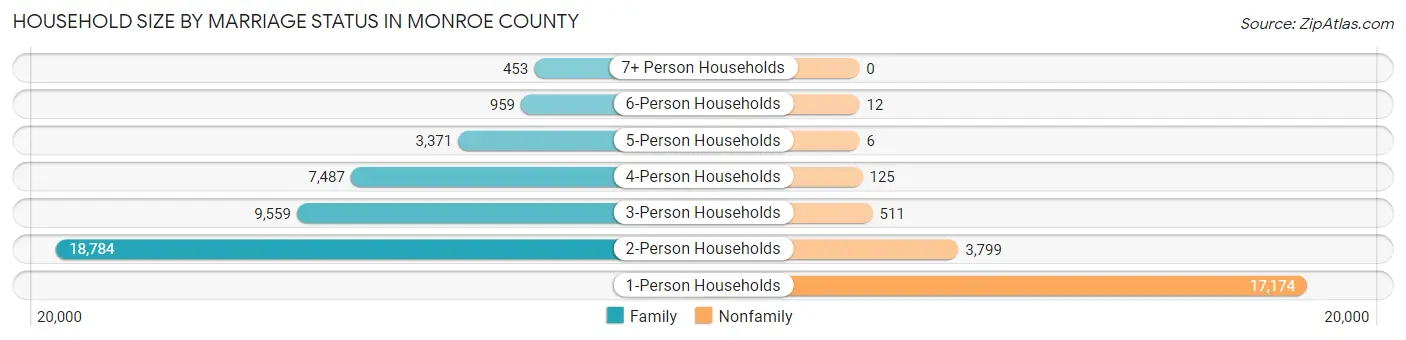
Household Size by Marriage Status in Monroe County
Out of a total of 62,240 households in Monroe County, 40,613 (65.2%) are family households, while 21,627 (34.7%) are nonfamily households. The most numerous type of family households are 2-person households, comprising 18,784, and the most common type of nonfamily households are 1-person households, comprising 17,174.
| Household Size | Family Households | Nonfamily Households |
| 1-Person Households | - | 17,174 (27.6%) |
| 2-Person Households | 18,784 (30.2%) | 3,799 (6.1%) |
| 3-Person Households | 9,559 (15.4%) | 511 (0.8%) |
| 4-Person Households | 7,487 (12.0%) | 125 (0.2%) |
| 5-Person Households | 3,371 (5.4%) | 6 (0.0%) |
| 6-Person Households | 959 (1.5%) | 12 (0.0%) |
| 7+ Person Households | 453 (0.7%) | 0 (0.0%) |
| Total | 40,613 (65.2%) | 21,627 (34.7%) |
Female Fertility in Monroe County
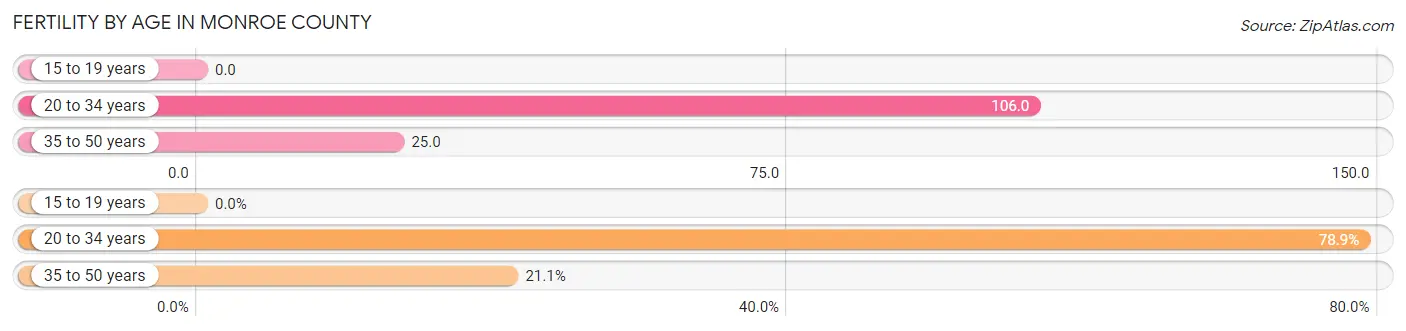
Fertility by Age in Monroe County
Average fertility rate in Monroe County is 54.0 births per 1,000 women. Women in the age bracket of 20 to 34 years have the highest fertility rate with 106.0 births per 1,000 women. Women in the age bracket of 20 to 34 years acount for 78.9% of all women with births.
| Age Bracket | Women with Births | Births / 1,000 Women |
| 15 to 19 years | 0 (0.0%) | 0.0 |
| 20 to 34 years | 1,405 (78.9%) | 106.0 |
| 35 to 50 years | 375 (21.1%) | 25.0 |
| Total | 1,780 (100.0%) | 54.0 |
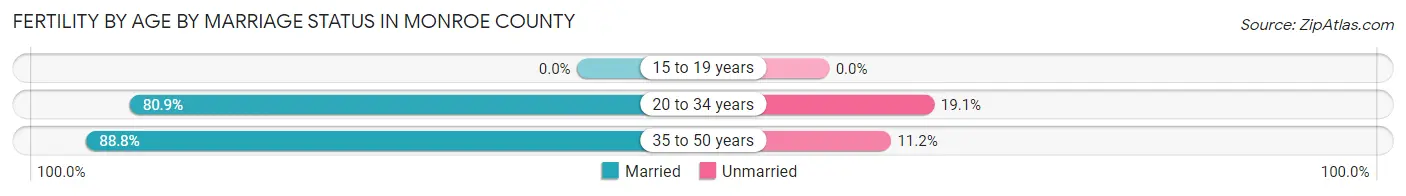
Fertility by Age by Marriage Status in Monroe County
82.5% of women with births (1,780) in Monroe County are married. The highest percentage of unmarried women with births falls into 20 to 34 years age bracket with 19.1% of them unmarried at the time of birth, while the lowest percentage of unmarried women with births belong to 35 to 50 years age bracket with 11.2% of them unmarried.
| Age Bracket | Married | Unmarried |
| 15 to 19 years | 0 (0.0%) | 0 (0.0%) |
| 20 to 34 years | 1,137 (80.9%) | 268 (19.1%) |
| 35 to 50 years | 333 (88.8%) | 42 (11.2%) |
| Total | 1,468 (82.5%) | 312 (17.5%) |
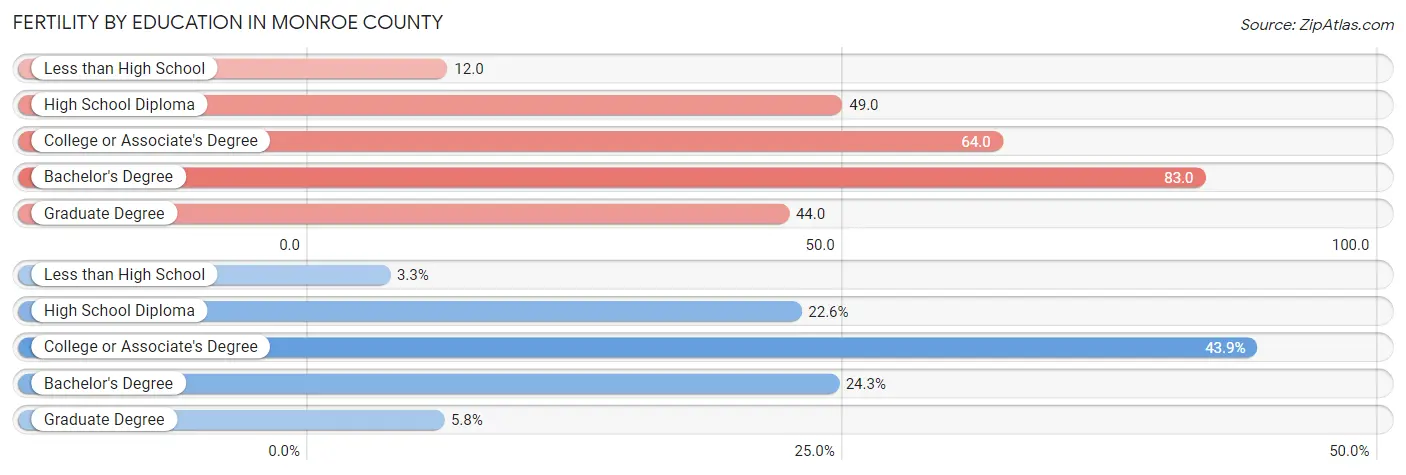
Fertility by Education in Monroe County
Average fertility rate in Monroe County is 54.0 births per 1,000 women. Women with the education attainment of bachelor's degree have the highest fertility rate of 83.0 births per 1,000 women, while women with the education attainment of less than high school have the lowest fertility at 12.0 births per 1,000 women. Women with the education attainment of college or associate's degree represent 43.9% of all women with births.
| Educational Attainment | Women with Births | Births / 1,000 Women |
| Less than High School | 59 (3.3%) | 12.0 |
| High School Diploma | 402 (22.6%) | 49.0 |
| College or Associate's Degree | 782 (43.9%) | 64.0 |
| Bachelor's Degree | 433 (24.3%) | 83.0 |
| Graduate Degree | 104 (5.8%) | 44.0 |
| Total | 1,780 (100.0%) | 54.0 |
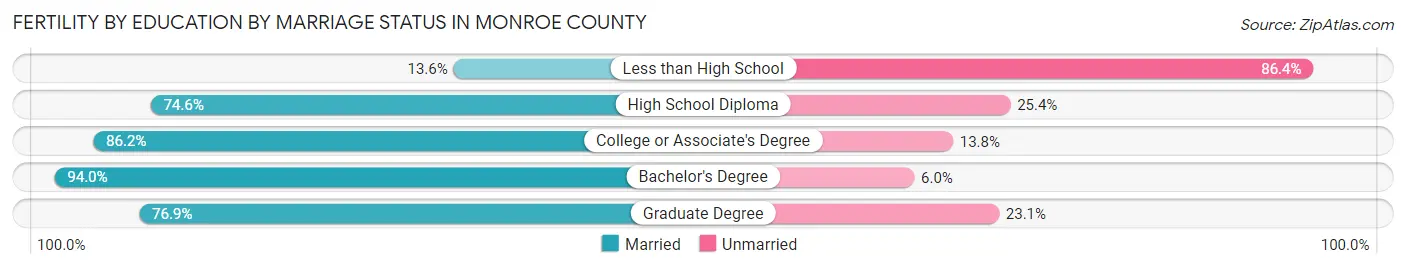
Fertility by Education by Marriage Status in Monroe County
17.5% of women with births in Monroe County are unmarried. Women with the educational attainment of bachelor's degree are most likely to be married with 94.0% of them married at childbirth, while women with the educational attainment of less than high school are least likely to be married with 86.4% of them unmarried at childbirth.
| Educational Attainment | Married | Unmarried |
| Less than High School | 8 (13.6%) | 51 (86.4%) |
| High School Diploma | 300 (74.6%) | 102 (25.4%) |
| College or Associate's Degree | 674 (86.2%) | 108 (13.8%) |
| Bachelor's Degree | 407 (94.0%) | 26 (6.0%) |
| Graduate Degree | 80 (76.9%) | 24 (23.1%) |
| Total | 1,468 (82.5%) | 312 (17.5%) |
Income in Monroe County
Income Overview in Monroe County
Per Capita Income in Monroe County is $37,704, while median incomes of families and households are $90,396 and $72,573 respectively.
| Characteristic | Number | Measure |
| Per Capita Income | 154,823 | $37,704 |
| Median Family Income | 40,613 | $90,396 |
| Mean Family Income | 40,613 | $109,470 |
| Median Household Income | 62,240 | $72,573 |
| Mean Household Income | 62,240 | $92,489 |
| Income Deficit | 40,613 | $10,772 |
| Wage / Income Gap (%) | 154,823 | 42.85% |
| Wage / Income Gap ($) | 154,823 | 57.15¢ per $1 |
| Gini / Inequality Index | 154,823 | 0.42 |
Earnings by Sex in Monroe County
Average Earnings in Monroe County are $44,277, $56,313 for men and $32,184 for women, a difference of 42.8%.
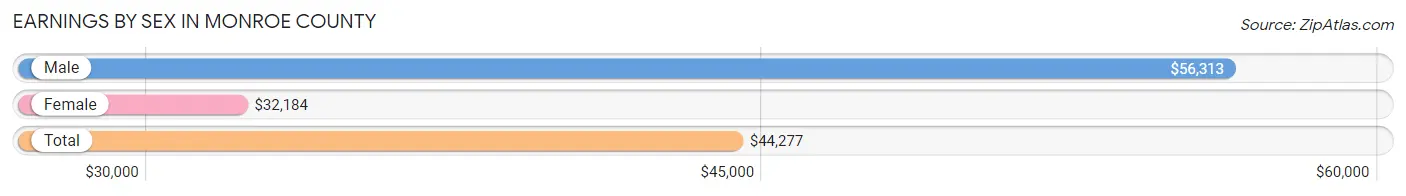
| Sex | Number | Average Earnings |
| Male | 42,249 (53.7%) | $56,313 |
| Female | 36,387 (46.3%) | $32,184 |
| Total | 78,636 (100.0%) | $44,277 |
Earnings by Sex by Income Bracket in Monroe County
The most common earnings brackets in Monroe County are $100,000+ for men (8,455 | 20.0%) and $75,000 to $99,999 for women (3,452 | 9.5%).
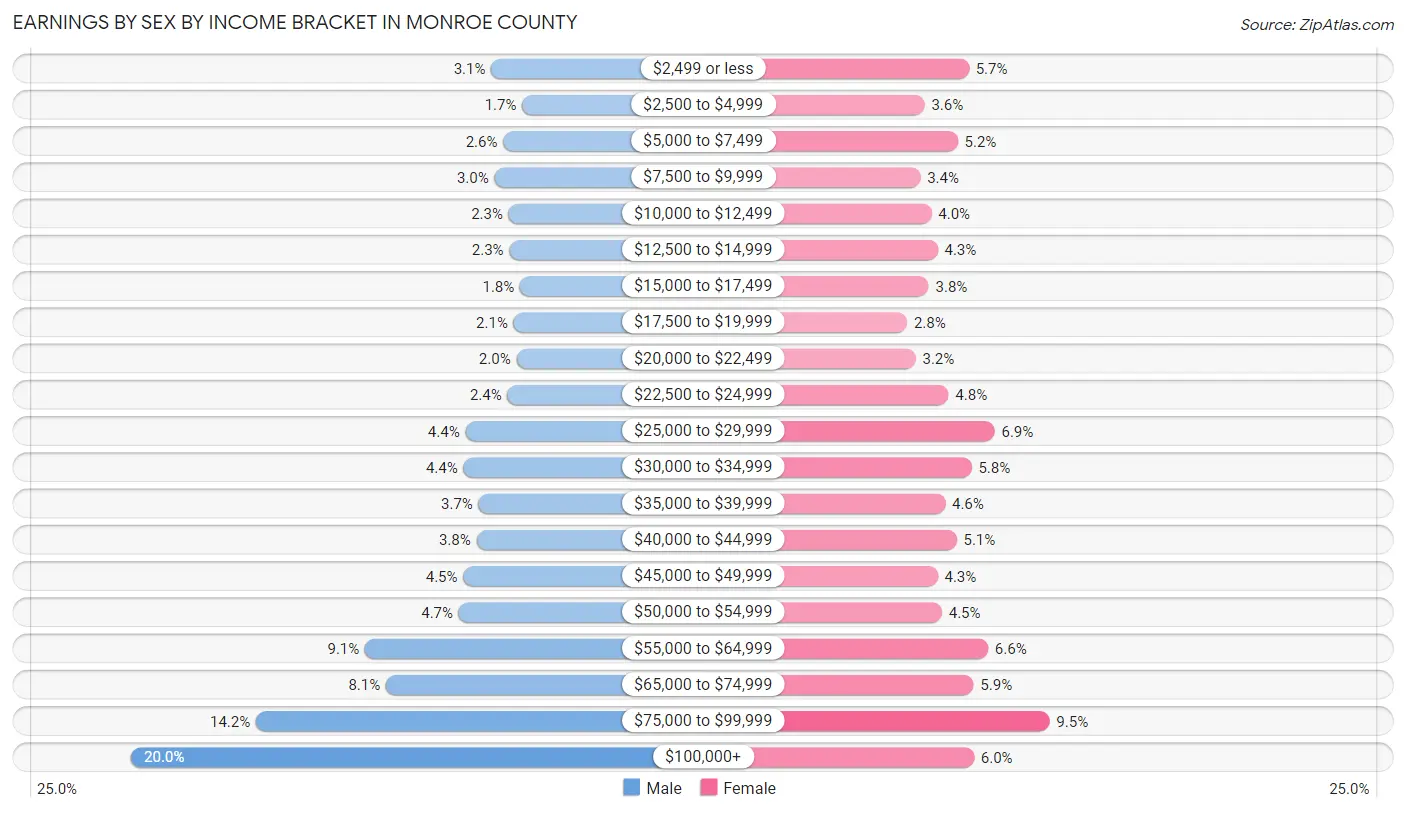
| Income | Male | Female |
| $2,499 or less | 1,325 (3.1%) | 2,078 (5.7%) |
| $2,500 to $4,999 | 714 (1.7%) | 1,325 (3.6%) |
| $5,000 to $7,499 | 1,090 (2.6%) | 1,889 (5.2%) |
| $7,500 to $9,999 | 1,264 (3.0%) | 1,252 (3.4%) |
| $10,000 to $12,499 | 982 (2.3%) | 1,440 (4.0%) |
| $12,500 to $14,999 | 968 (2.3%) | 1,548 (4.3%) |
| $15,000 to $17,499 | 756 (1.8%) | 1,392 (3.8%) |
| $17,500 to $19,999 | 884 (2.1%) | 1,026 (2.8%) |
| $20,000 to $22,499 | 830 (2.0%) | 1,171 (3.2%) |
| $22,500 to $24,999 | 1,007 (2.4%) | 1,731 (4.8%) |
| $25,000 to $29,999 | 1,839 (4.3%) | 2,517 (6.9%) |
| $30,000 to $34,999 | 1,875 (4.4%) | 2,126 (5.8%) |
| $35,000 to $39,999 | 1,575 (3.7%) | 1,675 (4.6%) |
| $40,000 to $44,999 | 1,620 (3.8%) | 1,870 (5.1%) |
| $45,000 to $49,999 | 1,881 (4.4%) | 1,546 (4.3%) |
| $50,000 to $54,999 | 1,970 (4.7%) | 1,620 (4.4%) |
| $55,000 to $64,999 | 3,824 (9.0%) | 2,407 (6.6%) |
| $65,000 to $74,999 | 3,409 (8.1%) | 2,156 (5.9%) |
| $75,000 to $99,999 | 5,981 (14.2%) | 3,452 (9.5%) |
| $100,000+ | 8,455 (20.0%) | 2,166 (5.9%) |
| Total | 42,249 (100.0%) | 36,387 (100.0%) |
Earnings by Sex by Educational Attainment in Monroe County
Average earnings in Monroe County are $62,144 for men and $38,833 for women, a difference of 37.5%. Men with an educational attainment of graduate degree enjoy the highest average annual earnings of $94,831, while those with less than high school education earn the least with $35,062. Women with an educational attainment of graduate degree earn the most with the average annual earnings of $69,314, while those with less than high school education have the smallest earnings of $17,003.
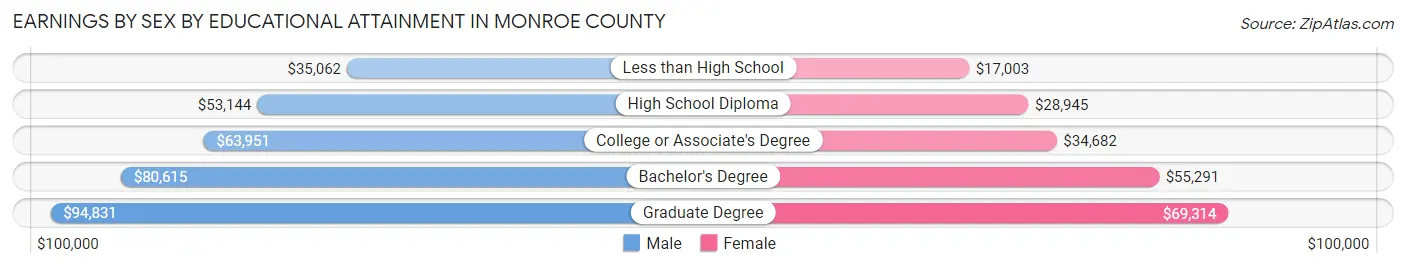
| Educational Attainment | Male Income | Female Income |
| Less than High School | $35,062 | $17,003 |
| High School Diploma | $53,144 | $28,945 |
| College or Associate's Degree | $63,951 | $34,682 |
| Bachelor's Degree | $80,615 | $55,291 |
| Graduate Degree | $94,831 | $69,314 |
| Total | $62,144 | $38,833 |
Family Income in Monroe County
Family Income Brackets in Monroe County
According to the Monroe County family income data, there are 9,382 families falling into the $100,000 to $149,999 income range, which is the most common income bracket and makes up 23.1% of all families. Conversely, the $10,000 to $14,999 income bracket is the least frequent group with only 690 families (1.7%) belonging to this category.
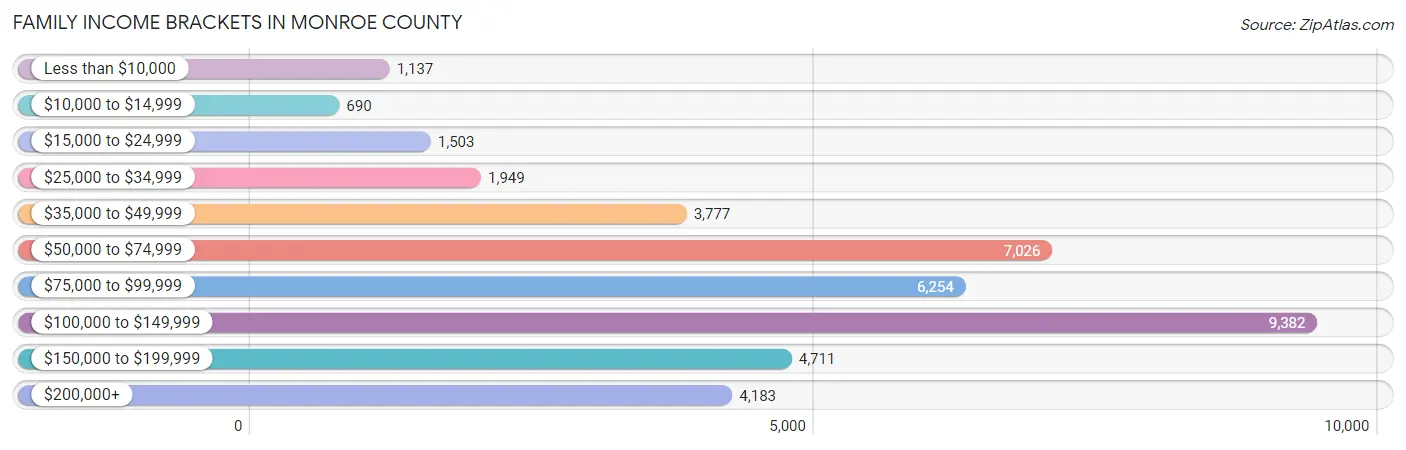
| Income Bracket | # Families | % Families |
| Less than $10,000 | 1,137 | 2.8% |
| $10,000 to $14,999 | 690 | 1.7% |
| $15,000 to $24,999 | 1,503 | 3.7% |
| $25,000 to $34,999 | 1,949 | 4.8% |
| $35,000 to $49,999 | 3,777 | 9.3% |
| $50,000 to $74,999 | 7,026 | 17.3% |
| $75,000 to $99,999 | 6,254 | 15.4% |
| $100,000 to $149,999 | 9,382 | 23.1% |
| $150,000 to $199,999 | 4,711 | 11.6% |
| $200,000+ | 4,183 | 10.3% |
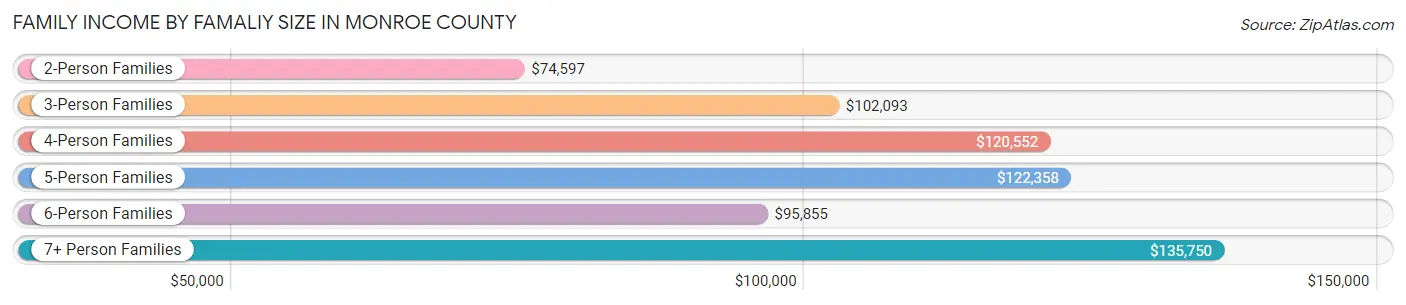
Family Income by Famaliy Size in Monroe County
7+ person families (250 | 0.6%) account for the highest median family income in Monroe County with $135,750 per family, while 2-person families (19,862 | 48.9%) have the highest median income of $37,298 per family member.
| Income Bracket | # Families | Median Income |
| 2-Person Families | 19,862 (48.9%) | $74,597 |
| 3-Person Families | 9,453 (23.3%) | $102,093 |
| 4-Person Families | 7,027 (17.3%) | $120,552 |
| 5-Person Families | 3,090 (7.6%) | $122,358 |
| 6-Person Families | 931 (2.3%) | $95,855 |
| 7+ Person Families | 250 (0.6%) | $135,750 |
| Total | 40,613 (100.0%) | $90,396 |
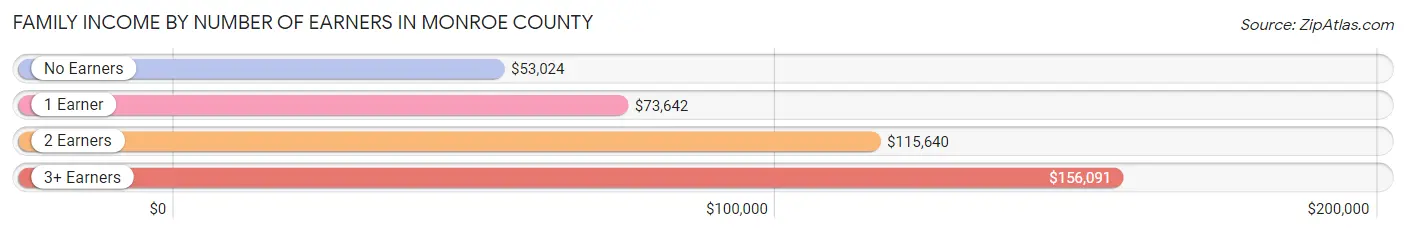
Family Income by Number of Earners in Monroe County
The median family income in Monroe County is $90,396, with families comprising 3+ earners (4,779) having the highest median family income of $156,091, while families with no earners (8,113) have the lowest median family income of $53,024, accounting for 11.8% and 20.0% of families, respectively.
| Number of Earners | # Families | Median Income |
| No Earners | 8,113 (20.0%) | $53,024 |
| 1 Earner | 11,754 (28.9%) | $73,642 |
| 2 Earners | 15,967 (39.3%) | $115,640 |
| 3+ Earners | 4,779 (11.8%) | $156,091 |
| Total | 40,613 (100.0%) | $90,396 |
Household Income in Monroe County
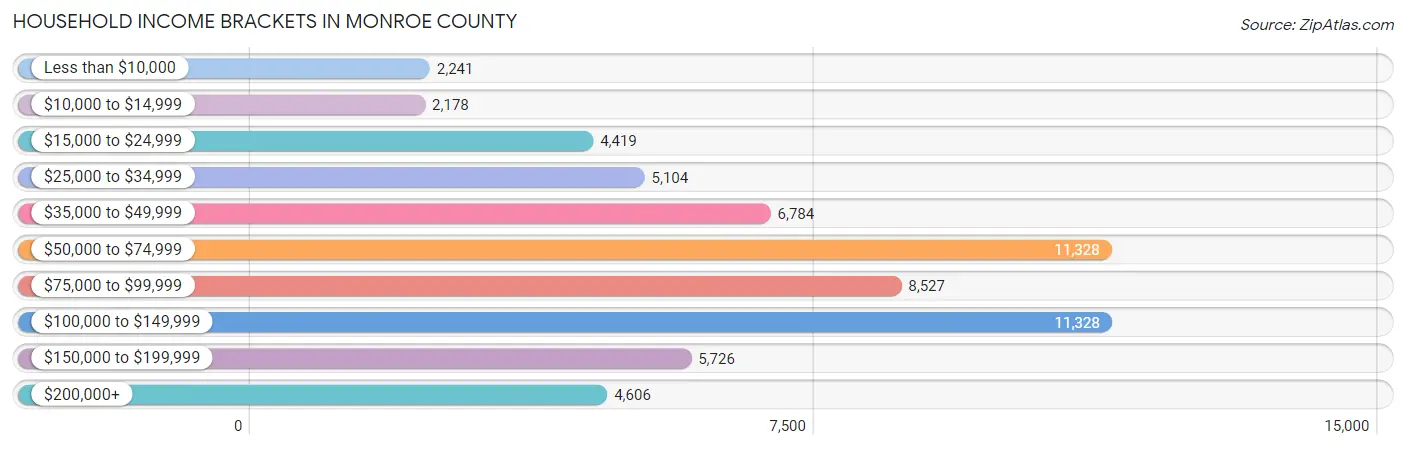
Household Income Brackets in Monroe County
With 11,328 households falling in the category, the $50,000 to $74,999 income range is the most frequent in Monroe County, accounting for 18.2% of all households. In contrast, only 2,178 households (3.5%) fall into the $10,000 to $14,999 income bracket, making it the least populous group.
| Income Bracket | # Households | % Households |
| Less than $10,000 | 2,241 | 3.6% |
| $10,000 to $14,999 | 2,178 | 3.5% |
| $15,000 to $24,999 | 4,419 | 7.1% |
| $25,000 to $34,999 | 5,104 | 8.2% |
| $35,000 to $49,999 | 6,784 | 10.9% |
| $50,000 to $74,999 | 11,328 | 18.2% |
| $75,000 to $99,999 | 8,527 | 13.7% |
| $100,000 to $149,999 | 11,328 | 18.2% |
| $150,000 to $199,999 | 5,726 | 9.2% |
| $200,000+ | 4,606 | 7.4% |
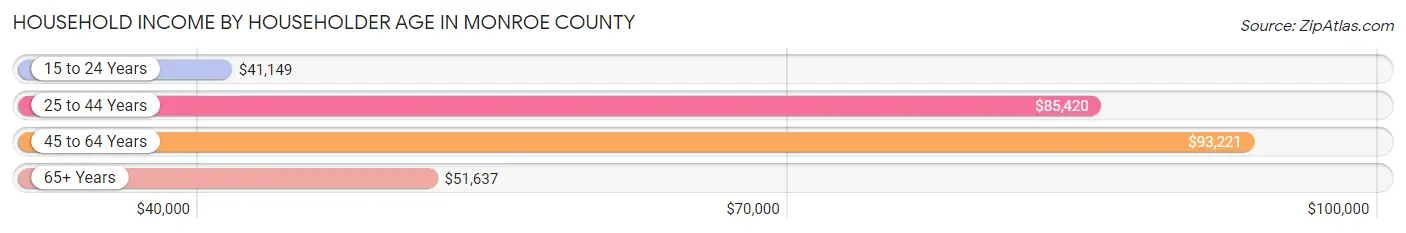
Household Income by Householder Age in Monroe County
The median household income in Monroe County is $72,573, with the highest median household income of $93,221 found in the 45 to 64 years age bracket for the primary householder. A total of 24,988 households (40.2%) fall into this category. Meanwhile, the 15 to 24 years age bracket for the primary householder has the lowest median household income of $41,149, with 1,706 households (2.7%) in this group.
| Income Bracket | # Households | Median Income |
| 15 to 24 Years | 1,706 (2.7%) | $41,149 |
| 25 to 44 Years | 16,996 (27.3%) | $85,420 |
| 45 to 64 Years | 24,988 (40.2%) | $93,221 |
| 65+ Years | 18,550 (29.8%) | $51,637 |
| Total | 62,240 (100.0%) | $72,573 |
Poverty in Monroe County
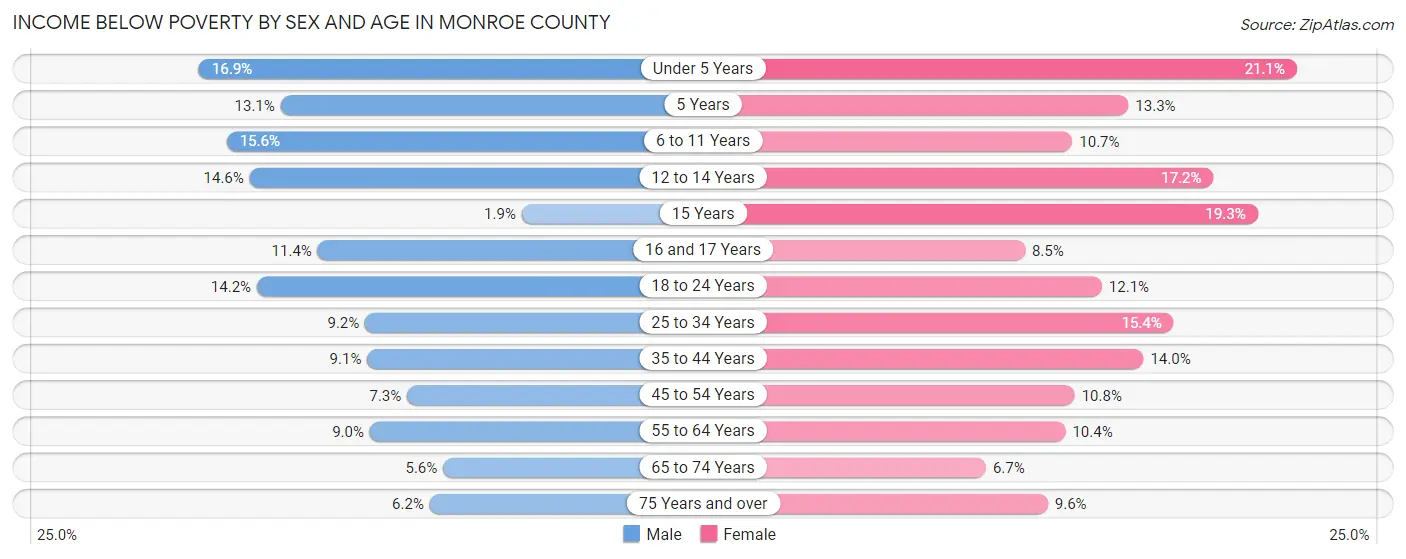
Income Below Poverty by Sex and Age in Monroe County
With 9.8% poverty level for males and 12.0% for females among the residents of Monroe County, under 5 year old males and under 5 year old females are the most vulnerable to poverty, with 698 males (16.9%) and 782 females (21.1%) in their respective age groups living below the poverty level.
| Age Bracket | Male | Female |
| Under 5 Years | 698 (16.9%) | 782 (21.1%) |
| 5 Years | 141 (13.1%) | 91 (13.3%) |
| 6 to 11 Years | 802 (15.6%) | 526 (10.7%) |
| 12 to 14 Years | 423 (14.6%) | 561 (17.2%) |
| 15 Years | 18 (1.9%) | 197 (19.3%) |
| 16 and 17 Years | 231 (11.4%) | 170 (8.5%) |
| 18 to 24 Years | 916 (14.2%) | 706 (12.1%) |
| 25 to 34 Years | 877 (9.2%) | 1,368 (15.4%) |
| 35 to 44 Years | 827 (9.1%) | 1,281 (14.0%) |
| 45 to 54 Years | 738 (7.2%) | 1,089 (10.8%) |
| 55 to 64 Years | 1,047 (9.0%) | 1,216 (10.4%) |
| 65 to 74 Years | 482 (5.6%) | 600 (6.7%) |
| 75 Years and over | 289 (6.2%) | 614 (9.6%) |
| Total | 7,489 (9.8%) | 9,201 (12.0%) |
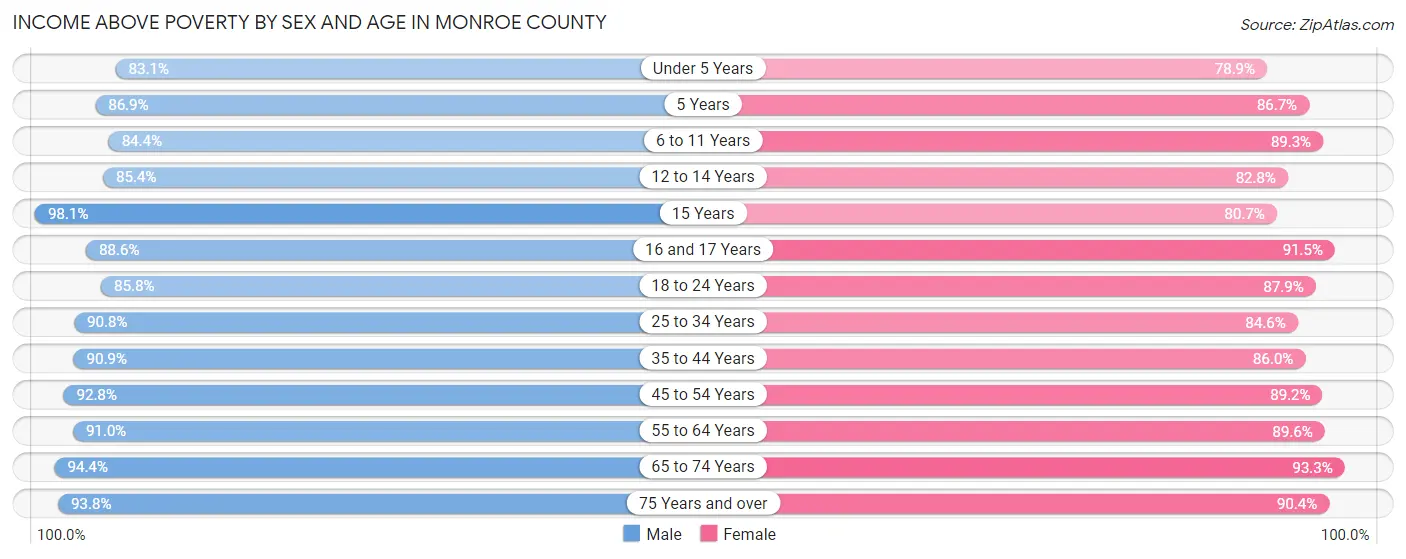
Income Above Poverty by Sex and Age in Monroe County
According to the poverty statistics in Monroe County, males aged 15 years and females aged 65 to 74 years are the age groups that are most secure financially, with 98.1% of males and 93.3% of females in these age groups living above the poverty line.
| Age Bracket | Male | Female |
| Under 5 Years | 3,430 (83.1%) | 2,923 (78.9%) |
| 5 Years | 934 (86.9%) | 593 (86.7%) |
| 6 to 11 Years | 4,333 (84.4%) | 4,390 (89.3%) |
| 12 to 14 Years | 2,483 (85.4%) | 2,694 (82.8%) |
| 15 Years | 915 (98.1%) | 824 (80.7%) |
| 16 and 17 Years | 1,795 (88.6%) | 1,831 (91.5%) |
| 18 to 24 Years | 5,524 (85.8%) | 5,142 (87.9%) |
| 25 to 34 Years | 8,655 (90.8%) | 7,515 (84.6%) |
| 35 to 44 Years | 8,264 (90.9%) | 7,868 (86.0%) |
| 45 to 54 Years | 9,435 (92.7%) | 8,983 (89.2%) |
| 55 to 64 Years | 10,618 (91.0%) | 10,497 (89.6%) |
| 65 to 74 Years | 8,160 (94.4%) | 8,371 (93.3%) |
| 75 Years and over | 4,372 (93.8%) | 5,810 (90.4%) |
| Total | 68,918 (90.2%) | 67,441 (88.0%) |
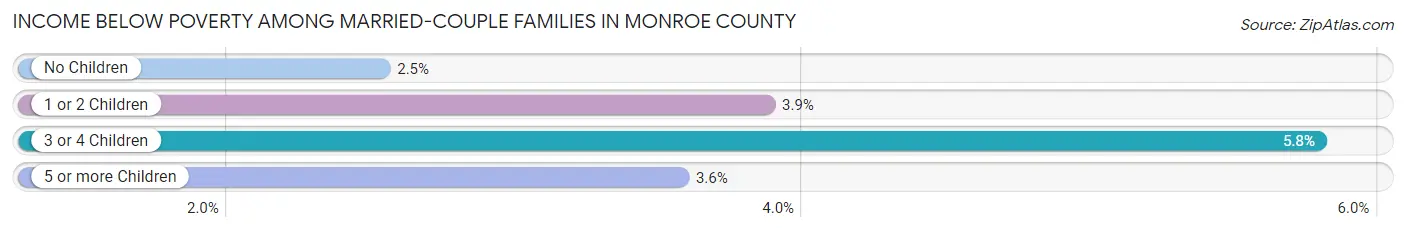
Income Below Poverty Among Married-Couple Families in Monroe County
The poverty statistics for married-couple families in Monroe County show that 3.2% or 1,003 of the total 31,673 families live below the poverty line. Families with 3 or 4 children have the highest poverty rate of 5.8%, comprising of 138 families. On the other hand, families with no children have the lowest poverty rate of 2.5%, which includes 506 families.
| Children | Above Poverty | Below Poverty |
| No Children | 19,505 (97.5%) | 506 (2.5%) |
| 1 or 2 Children | 8,784 (96.1%) | 354 (3.9%) |
| 3 or 4 Children | 2,246 (94.2%) | 138 (5.8%) |
| 5 or more Children | 135 (96.4%) | 5 (3.6%) |
| Total | 30,670 (96.8%) | 1,003 (3.2%) |
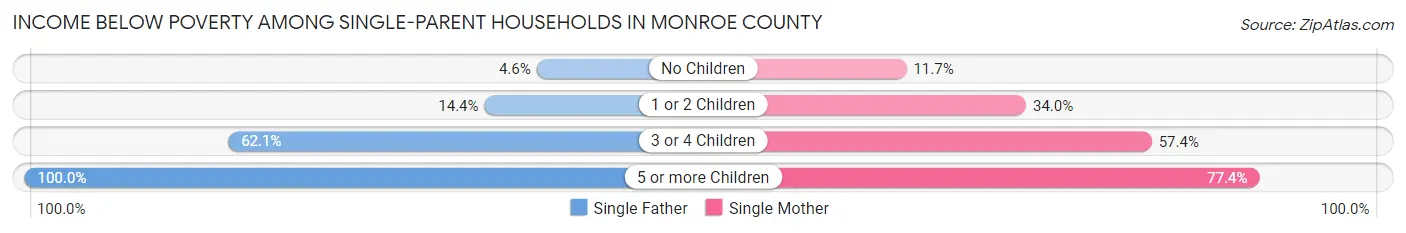
Income Below Poverty Among Single-Parent Households in Monroe County
According to the poverty data in Monroe County, 14.1% or 439 single-father households and 26.2% or 1,532 single-mother households are living below the poverty line. Among single-father households, those with 5 or more children have the highest poverty rate, with 11 households (100.0%) experiencing poverty. Likewise, among single-mother households, those with 5 or more children have the highest poverty rate, with 24 households (77.4%) falling below the poverty line.
| Children | Single Father | Single Mother |
| No Children | 67 (4.6%) | 296 (11.7%) |
| 1 or 2 Children | 199 (14.4%) | 971 (34.0%) |
| 3 or 4 Children | 162 (62.1%) | 241 (57.4%) |
| 5 or more Children | 11 (100.0%) | 24 (77.4%) |
| Total | 439 (14.1%) | 1,532 (26.2%) |
Income Below Poverty Among Married-Couple vs Single-Parent Households in Monroe County
The poverty data for Monroe County shows that 1,003 of the married-couple family households (3.2%) and 1,971 of the single-parent households (22.1%) are living below the poverty level. Within the married-couple family households, those with 3 or 4 children have the highest poverty rate, with 138 households (5.8%) falling below the poverty line. Among the single-parent households, those with 5 or more children have the highest poverty rate, with 35 household (83.3%) living below poverty.
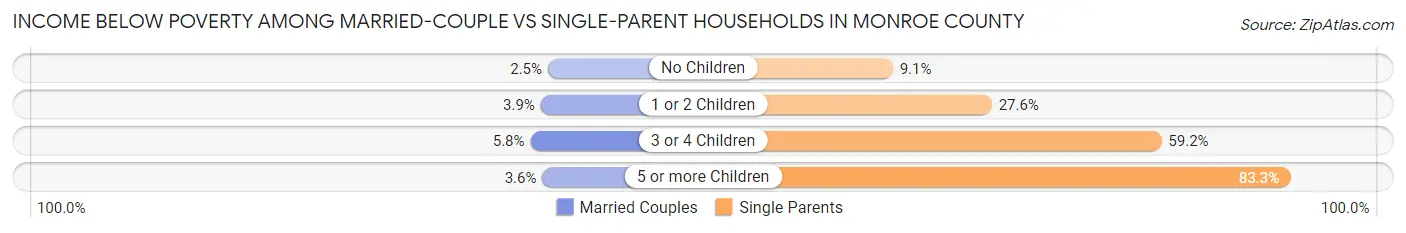
| Children | Married-Couple Families | Single-Parent Households |
| No Children | 506 (2.5%) | 363 (9.1%) |
| 1 or 2 Children | 354 (3.9%) | 1,170 (27.6%) |
| 3 or 4 Children | 138 (5.8%) | 403 (59.2%) |
| 5 or more Children | 5 (3.6%) | 35 (83.3%) |
| Total | 1,003 (3.2%) | 1,971 (22.1%) |
Employment Characteristics in Monroe County
Employment by Class of Employer in Monroe County
Among the 69,702 employed individuals in Monroe County, private company employees (51,745 | 74.2%), not-for-profit organizations (6,391 | 9.2%), and local government employees (4,509 | 6.5%) make up the most common classes of employment.
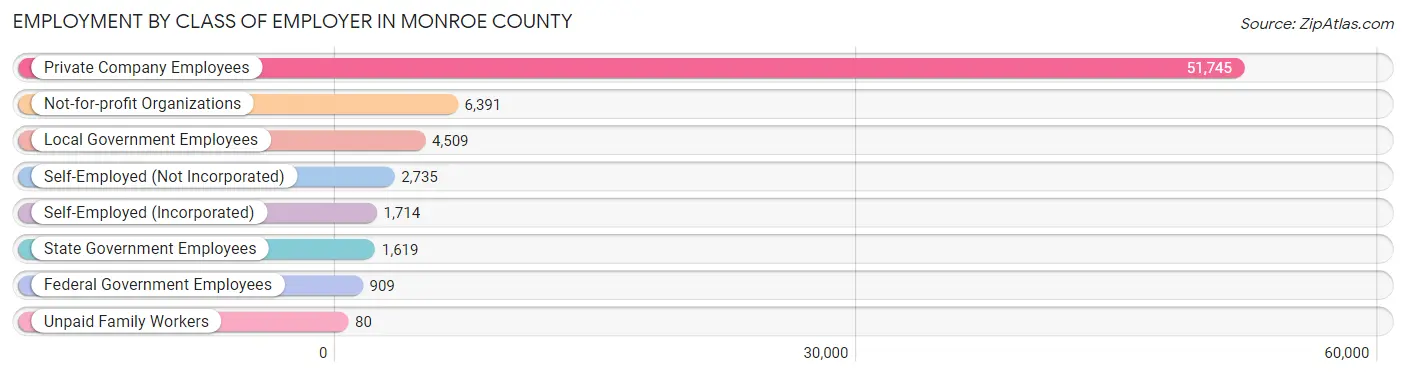
| Employer Class | # Employees | % Employees |
| Private Company Employees | 51,745 | 74.2% |
| Self-Employed (Incorporated) | 1,714 | 2.5% |
| Self-Employed (Not Incorporated) | 2,735 | 3.9% |
| Not-for-profit Organizations | 6,391 | 9.2% |
| Local Government Employees | 4,509 | 6.5% |
| State Government Employees | 1,619 | 2.3% |
| Federal Government Employees | 909 | 1.3% |
| Unpaid Family Workers | 80 | 0.1% |
| Total | 69,702 | 100.0% |
Employment Status by Age in Monroe County
According to the labor force statistics for Monroe County, out of the total population over 16 years of age (126,258), 59.7% or 75,376 individuals are in the labor force, with 5.7% or 4,296 of them unemployed. The age group with the highest labor force participation rate is 25 to 29 years, with 86.4% or 8,021 individuals in the labor force. Within the labor force, the 20 to 24 years age range has the highest percentage of unemployed individuals, with 9.9% or 733 of them being unemployed.
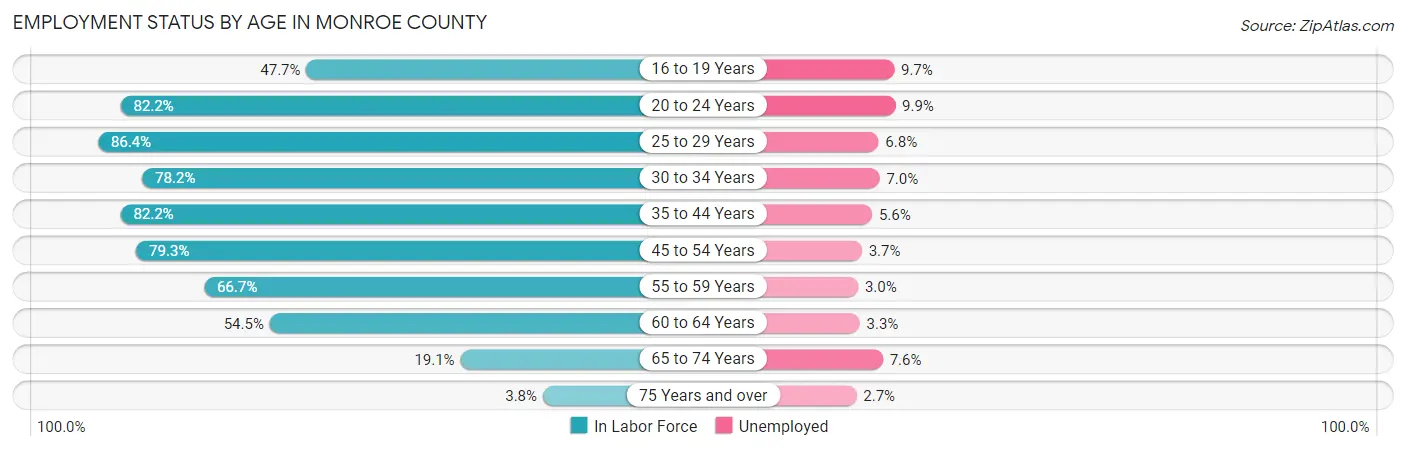
| Age Bracket | In Labor Force | Unemployed |
| 16 to 19 Years | 3,492 (47.7%) | 339 (9.7%) |
| 20 to 24 Years | 7,402 (82.2%) | 733 (9.9%) |
| 25 to 29 Years | 8,021 (86.4%) | 545 (6.8%) |
| 30 to 34 Years | 7,223 (78.2%) | 506 (7.0%) |
| 35 to 44 Years | 15,108 (82.2%) | 846 (5.6%) |
| 45 to 54 Years | 16,105 (79.3%) | 596 (3.7%) |
| 55 to 59 Years | 7,818 (66.7%) | 235 (3.0%) |
| 60 to 64 Years | 6,428 (54.5%) | 212 (3.3%) |
| 65 to 74 Years | 3,388 (19.1%) | 257 (7.6%) |
| 75 Years and over | 436 (3.8%) | 12 (2.7%) |
| Total | 75,376 (59.7%) | 4,296 (5.7%) |
Employment Status by Educational Attainment in Monroe County
According to labor force statistics for Monroe County, 75.2% of individuals (60,705) out of the total population between 25 and 64 years of age (80,725) are in the labor force, with 4.8% or 2,914 of them being unemployed. The group with the highest labor force participation rate are those with the educational attainment of bachelor's degree or higher, with 88.8% or 17,297 individuals in the labor force. Within the labor force, individuals with less than high school education have the highest percentage of unemployment, with 11.6% or 325 of them being unemployed.
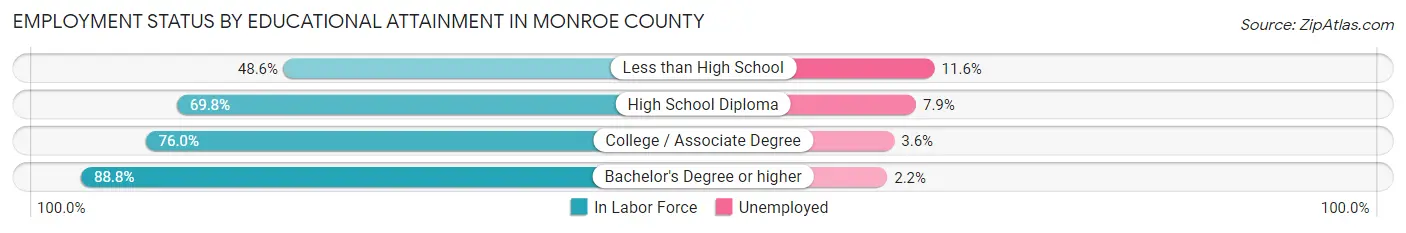
| Educational Attainment | In Labor Force | Unemployed |
| Less than High School | 2,799 (48.6%) | 668 (11.6%) |
| High School Diploma | 17,786 (69.8%) | 2,013 (7.9%) |
| College / Associate Degree | 22,803 (76.0%) | 1,080 (3.6%) |
| Bachelor's Degree or higher | 17,297 (88.8%) | 429 (2.2%) |
| Total | 60,705 (75.2%) | 3,875 (4.8%) |
Employment Occupations by Sex in Monroe County
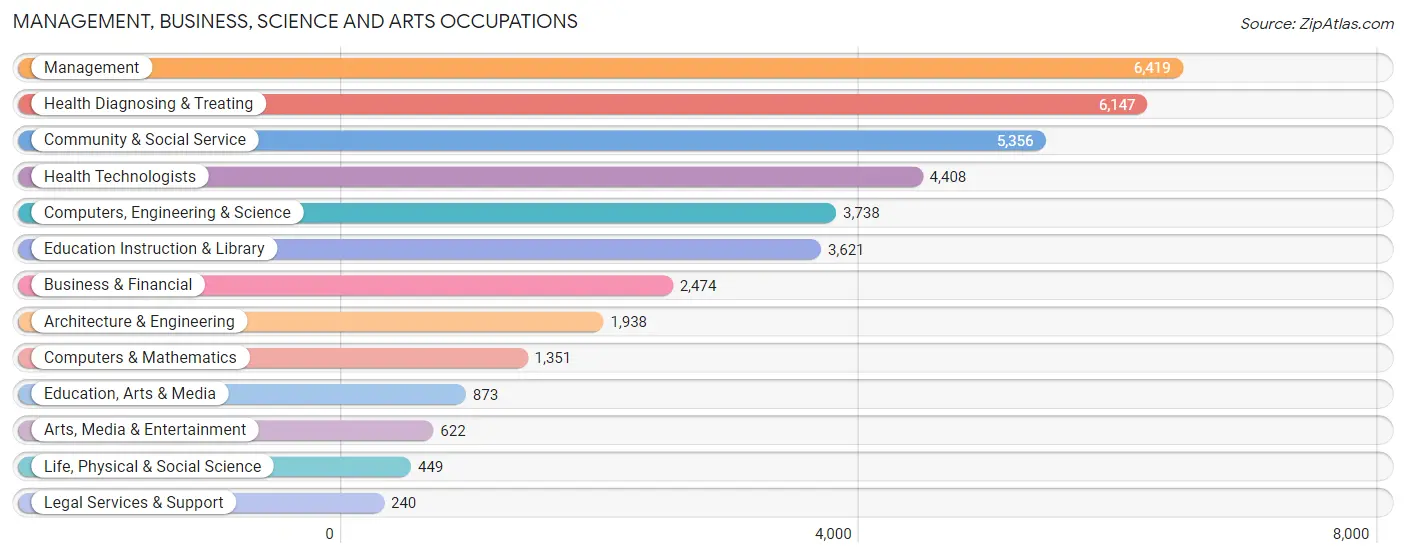
Management, Business, Science and Arts Occupations
The most common Management, Business, Science and Arts occupations in Monroe County are Management (6,419 | 9.0%), Health Diagnosing & Treating (6,147 | 8.6%), Community & Social Service (5,356 | 7.5%), Health Technologists (4,408 | 6.2%), and Computers, Engineering & Science (3,738 | 5.3%).
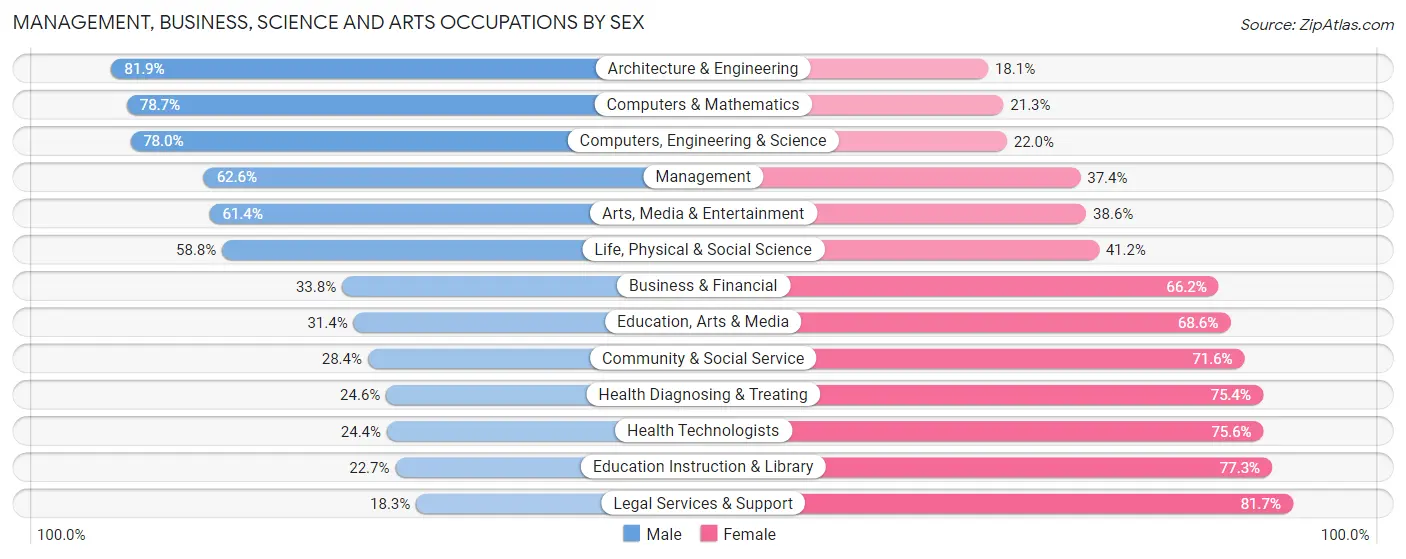
Management, Business, Science and Arts Occupations by Sex
Within the Management, Business, Science and Arts occupations in Monroe County, the most male-oriented occupations are Architecture & Engineering (81.9%), Computers & Mathematics (78.7%), and Computers, Engineering & Science (78.0%), while the most female-oriented occupations are Legal Services & Support (81.7%), Education Instruction & Library (77.3%), and Health Technologists (75.6%).
| Occupation | Male | Female |
| Management | 4,020 (62.6%) | 2,399 (37.4%) |
| Business & Financial | 836 (33.8%) | 1,638 (66.2%) |
| Computers, Engineering & Science | 2,914 (78.0%) | 824 (22.0%) |
| Computers & Mathematics | 1,063 (78.7%) | 288 (21.3%) |
| Architecture & Engineering | 1,587 (81.9%) | 351 (18.1%) |
| Life, Physical & Social Science | 264 (58.8%) | 185 (41.2%) |
| Community & Social Service | 1,521 (28.4%) | 3,835 (71.6%) |
| Education, Arts & Media | 274 (31.4%) | 599 (68.6%) |
| Legal Services & Support | 44 (18.3%) | 196 (81.7%) |
| Education Instruction & Library | 821 (22.7%) | 2,800 (77.3%) |
| Arts, Media & Entertainment | 382 (61.4%) | 240 (38.6%) |
| Health Diagnosing & Treating | 1,511 (24.6%) | 4,636 (75.4%) |
| Health Technologists | 1,077 (24.4%) | 3,331 (75.6%) |
| Total (Category) | 10,802 (44.8%) | 13,332 (55.2%) |
| Total (Overall) | 38,007 (53.5%) | 33,032 (46.5%) |
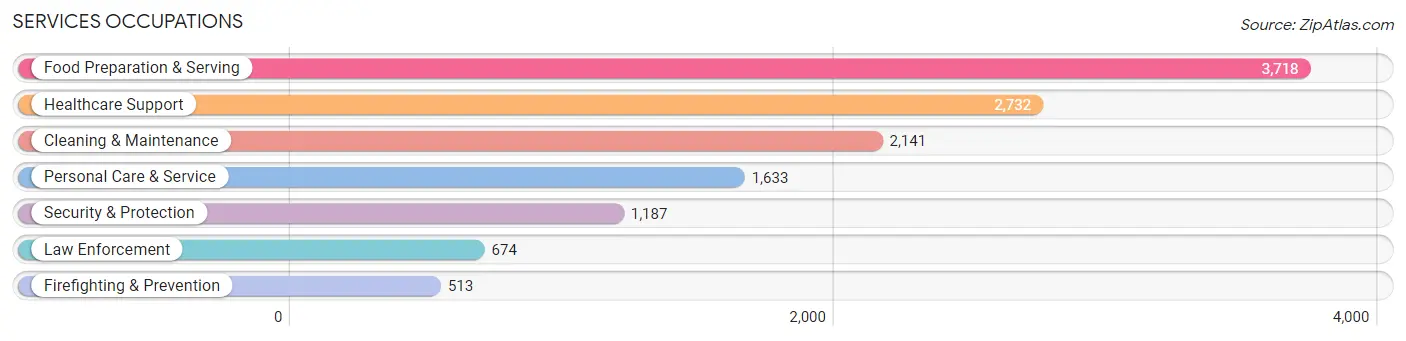
Services Occupations
The most common Services occupations in Monroe County are Food Preparation & Serving (3,718 | 5.2%), Healthcare Support (2,732 | 3.8%), Cleaning & Maintenance (2,141 | 3.0%), Personal Care & Service (1,633 | 2.3%), and Security & Protection (1,187 | 1.7%).
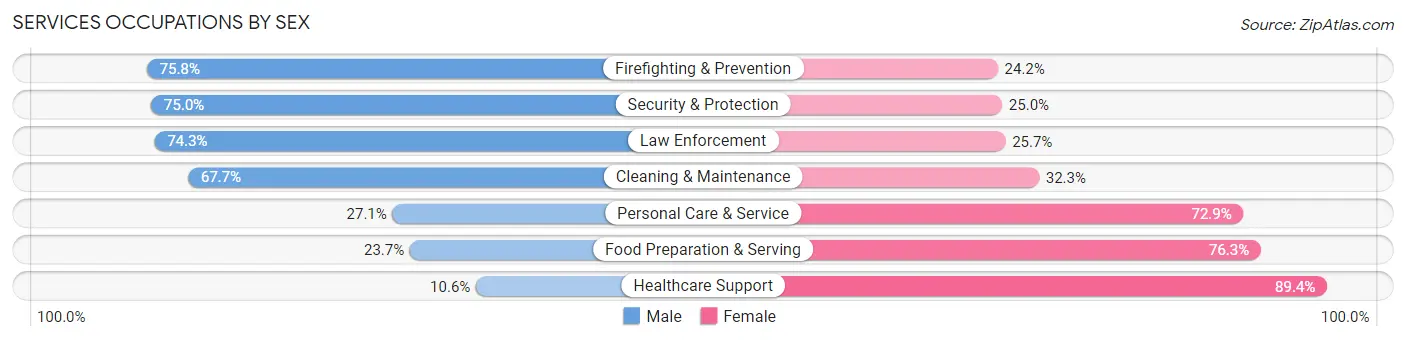
Services Occupations by Sex
Within the Services occupations in Monroe County, the most male-oriented occupations are Firefighting & Prevention (75.8%), Security & Protection (75.0%), and Law Enforcement (74.3%), while the most female-oriented occupations are Healthcare Support (89.4%), Food Preparation & Serving (76.3%), and Personal Care & Service (72.9%).
| Occupation | Male | Female |
| Healthcare Support | 289 (10.6%) | 2,443 (89.4%) |
| Security & Protection | 890 (75.0%) | 297 (25.0%) |
| Firefighting & Prevention | 389 (75.8%) | 124 (24.2%) |
| Law Enforcement | 501 (74.3%) | 173 (25.7%) |
| Food Preparation & Serving | 880 (23.7%) | 2,838 (76.3%) |
| Cleaning & Maintenance | 1,449 (67.7%) | 692 (32.3%) |
| Personal Care & Service | 443 (27.1%) | 1,190 (72.9%) |
| Total (Category) | 3,951 (34.6%) | 7,460 (65.4%) |
| Total (Overall) | 38,007 (53.5%) | 33,032 (46.5%) |
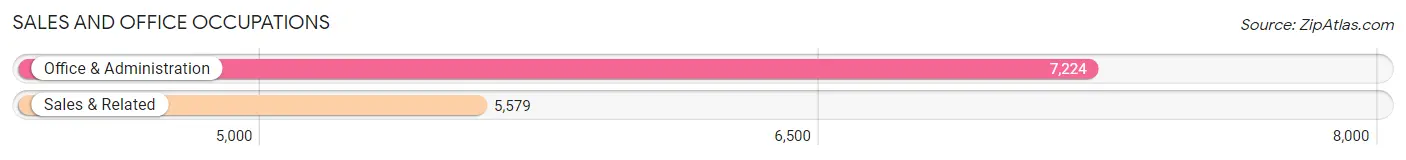
Sales and Office Occupations
The most common Sales and Office occupations in Monroe County are Office & Administration (7,224 | 10.2%), and Sales & Related (5,579 | 7.9%).
Sales and Office Occupations by Sex
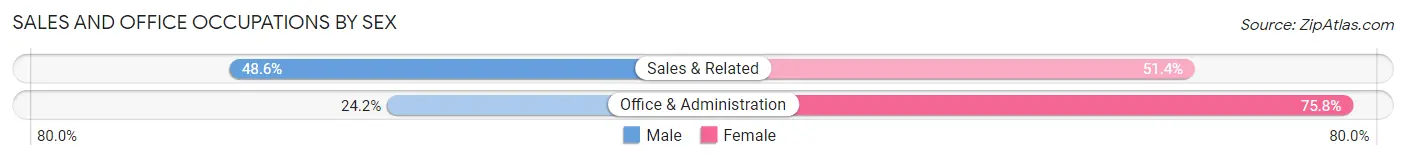
| Occupation | Male | Female |
| Sales & Related | 2,709 (48.6%) | 2,870 (51.4%) |
| Office & Administration | 1,751 (24.2%) | 5,473 (75.8%) |
| Total (Category) | 4,460 (34.8%) | 8,343 (65.2%) |
| Total (Overall) | 38,007 (53.5%) | 33,032 (46.5%) |
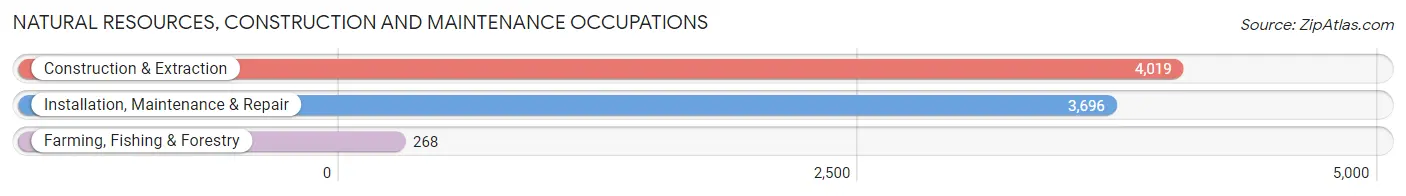
Natural Resources, Construction and Maintenance Occupations
The most common Natural Resources, Construction and Maintenance occupations in Monroe County are Construction & Extraction (4,019 | 5.7%), Installation, Maintenance & Repair (3,696 | 5.2%), and Farming, Fishing & Forestry (268 | 0.4%).
Natural Resources, Construction and Maintenance Occupations by Sex
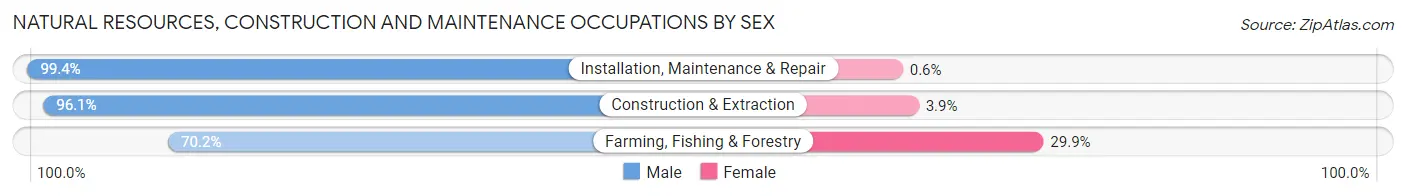
| Occupation | Male | Female |
| Farming, Fishing & Forestry | 188 (70.2%) | 80 (29.8%) |
| Construction & Extraction | 3,862 (96.1%) | 157 (3.9%) |
| Installation, Maintenance & Repair | 3,674 (99.4%) | 22 (0.6%) |
| Total (Category) | 7,724 (96.8%) | 259 (3.2%) |
| Total (Overall) | 38,007 (53.5%) | 33,032 (46.5%) |
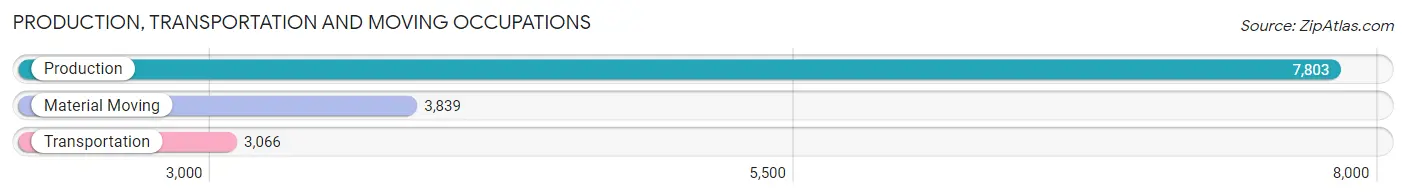
Production, Transportation and Moving Occupations
The most common Production, Transportation and Moving occupations in Monroe County are Production (7,803 | 11.0%), Material Moving (3,839 | 5.4%), and Transportation (3,066 | 4.3%).
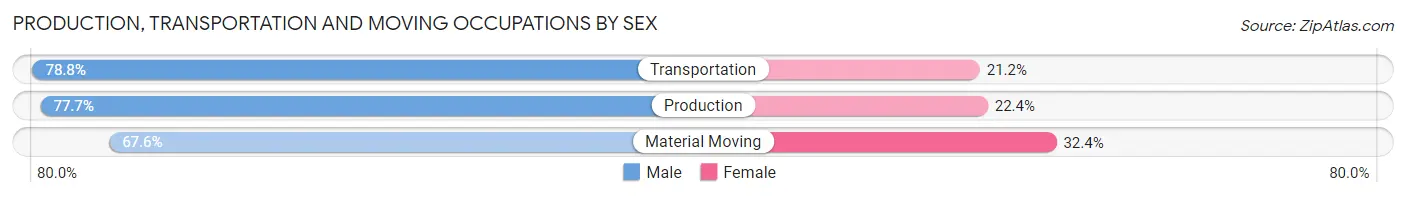
Production, Transportation and Moving Occupations by Sex
| Occupation | Male | Female |
| Production | 6,059 (77.6%) | 1,744 (22.4%) |
| Transportation | 2,417 (78.8%) | 649 (21.2%) |
| Material Moving | 2,594 (67.6%) | 1,245 (32.4%) |
| Total (Category) | 11,070 (75.3%) | 3,638 (24.7%) |
| Total (Overall) | 38,007 (53.5%) | 33,032 (46.5%) |
Employment Industries by Sex in Monroe County
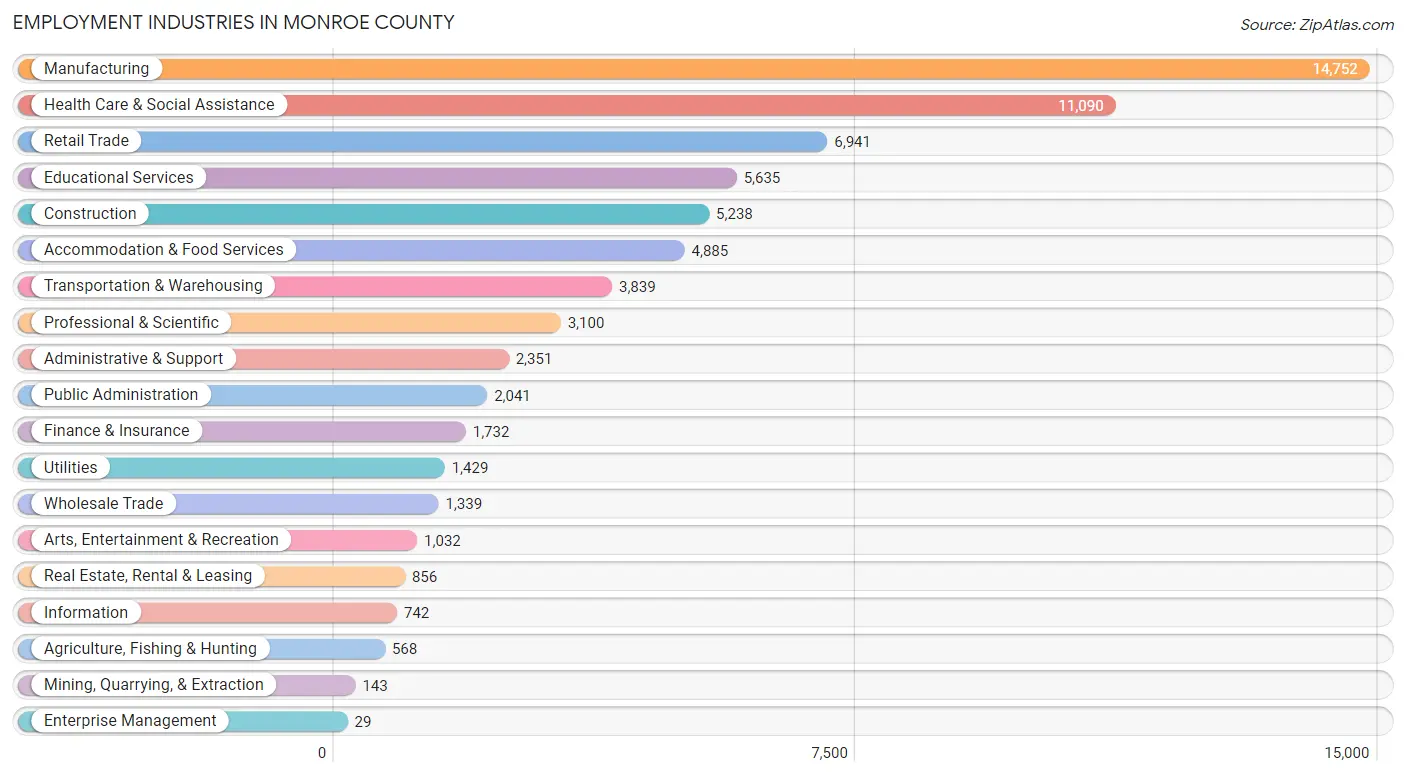
Employment Industries in Monroe County
The major employment industries in Monroe County include Manufacturing (14,752 | 20.8%), Health Care & Social Assistance (11,090 | 15.6%), Retail Trade (6,941 | 9.8%), Educational Services (5,635 | 7.9%), and Construction (5,238 | 7.4%).
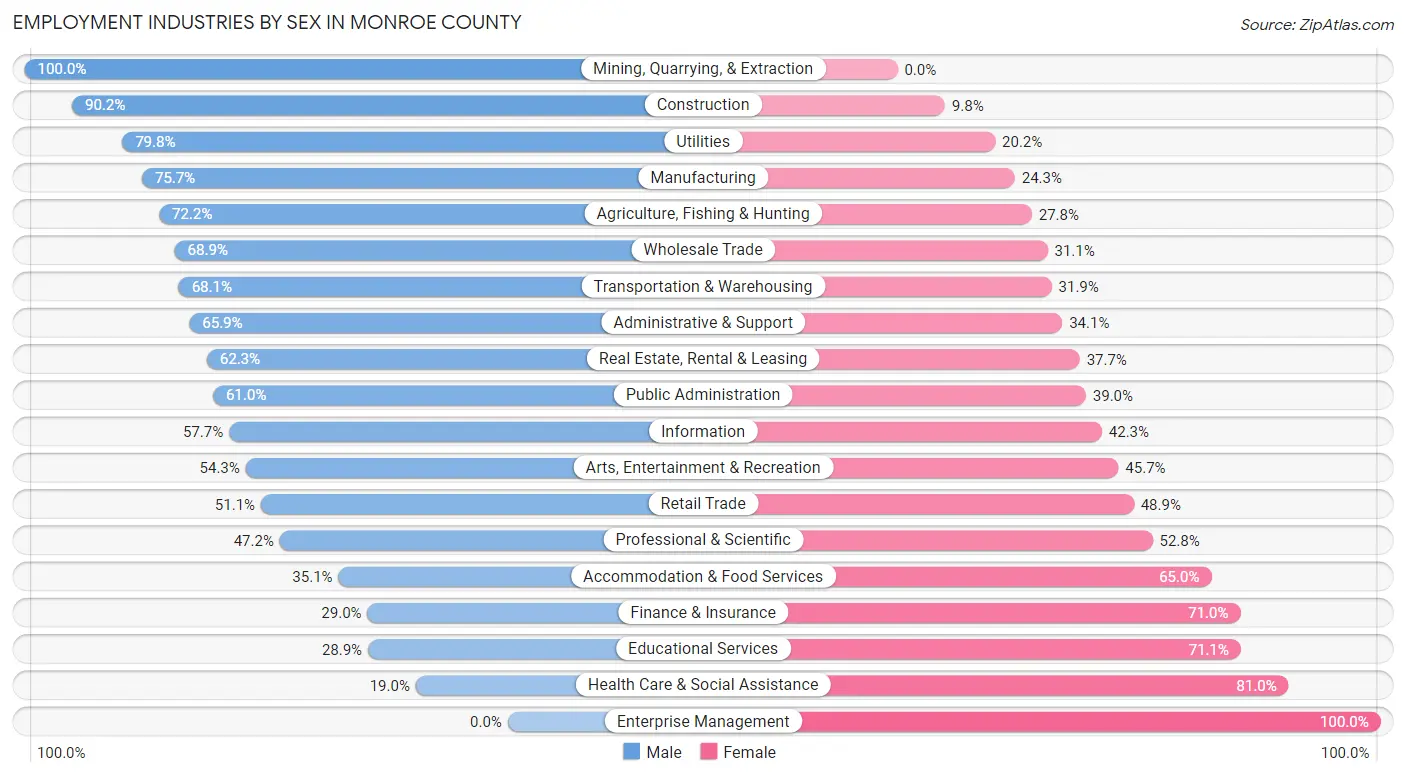
Employment Industries by Sex in Monroe County
The Monroe County industries that see more men than women are Mining, Quarrying, & Extraction (100.0%), Construction (90.2%), and Utilities (79.8%), whereas the industries that tend to have a higher number of women are Enterprise Management (100.0%), Health Care & Social Assistance (81.0%), and Educational Services (71.1%).
| Industry | Male | Female |
| Agriculture, Fishing & Hunting | 410 (72.2%) | 158 (27.8%) |
| Mining, Quarrying, & Extraction | 143 (100.0%) | 0 (0.0%) |
| Construction | 4,723 (90.2%) | 515 (9.8%) |
| Manufacturing | 11,167 (75.7%) | 3,585 (24.3%) |
| Wholesale Trade | 923 (68.9%) | 416 (31.1%) |
| Retail Trade | 3,546 (51.1%) | 3,395 (48.9%) |
| Transportation & Warehousing | 2,614 (68.1%) | 1,225 (31.9%) |
| Utilities | 1,140 (79.8%) | 289 (20.2%) |
| Information | 428 (57.7%) | 314 (42.3%) |
| Finance & Insurance | 503 (29.0%) | 1,229 (71.0%) |
| Real Estate, Rental & Leasing | 533 (62.3%) | 323 (37.7%) |
| Professional & Scientific | 1,463 (47.2%) | 1,637 (52.8%) |
| Enterprise Management | 0 (0.0%) | 29 (100.0%) |
| Administrative & Support | 1,549 (65.9%) | 802 (34.1%) |
| Educational Services | 1,630 (28.9%) | 4,005 (71.1%) |
| Health Care & Social Assistance | 2,112 (19.0%) | 8,978 (81.0%) |
| Arts, Entertainment & Recreation | 560 (54.3%) | 472 (45.7%) |
| Accommodation & Food Services | 1,712 (35.0%) | 3,173 (64.9%) |
| Public Administration | 1,245 (61.0%) | 796 (39.0%) |
| Total | 38,007 (53.5%) | 33,032 (46.5%) |
Education in Monroe County
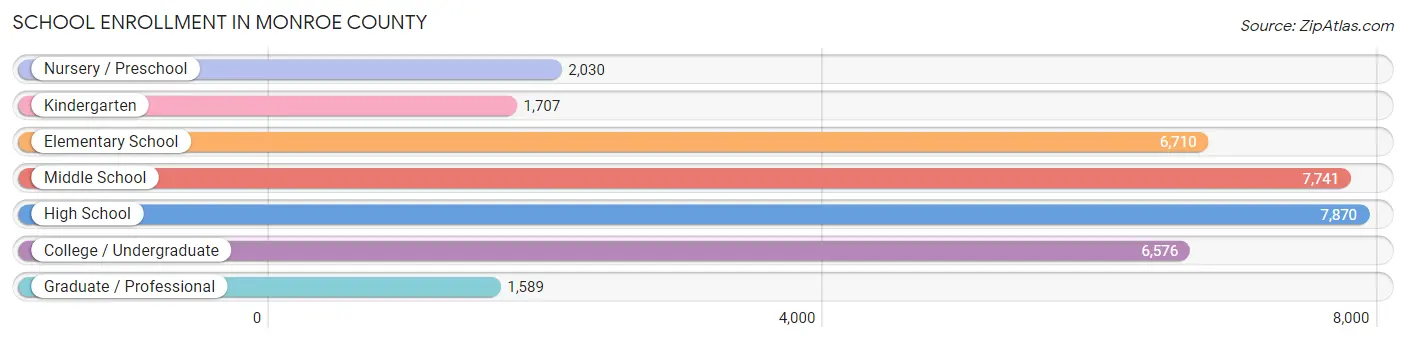
School Enrollment in Monroe County
The most common levels of schooling among the 34,223 students in Monroe County are high school (7,870 | 23.0%), middle school (7,741 | 22.6%), and elementary school (6,710 | 19.6%).
| School Level | # Students | % Students |
| Nursery / Preschool | 2,030 | 5.9% |
| Kindergarten | 1,707 | 5.0% |
| Elementary School | 6,710 | 19.6% |
| Middle School | 7,741 | 22.6% |
| High School | 7,870 | 23.0% |
| College / Undergraduate | 6,576 | 19.2% |
| Graduate / Professional | 1,589 | 4.6% |
| Total | 34,223 | 100.0% |
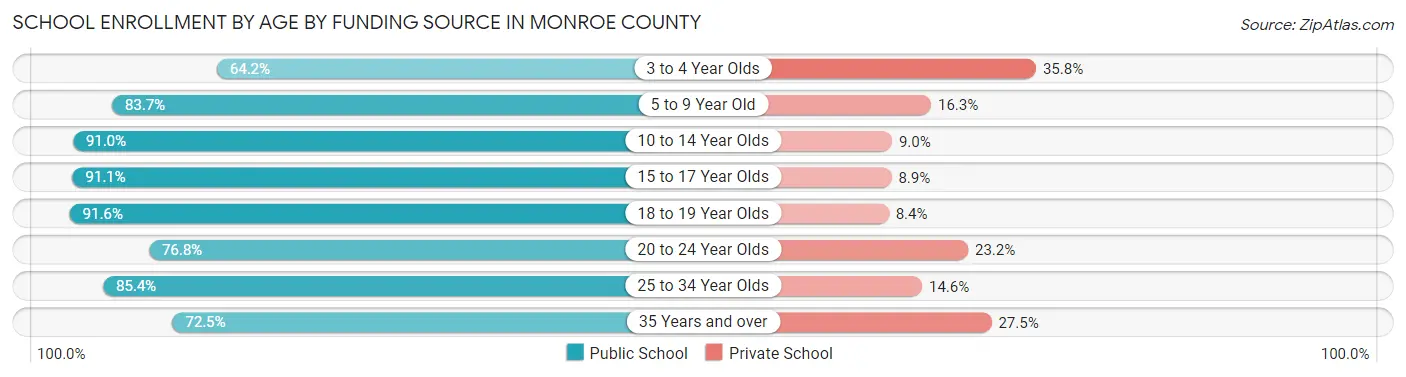
School Enrollment by Age by Funding Source in Monroe County
Out of a total of 34,223 students who are enrolled in schools in Monroe County, 4,962 (14.5%) attend a private institution, while the remaining 29,261 (85.5%) are enrolled in public schools. The age group of 3 to 4 year olds has the highest likelihood of being enrolled in private schools, with 581 (35.8% in the age bracket) enrolled. Conversely, the age group of 18 to 19 year olds has the lowest likelihood of being enrolled in a private school, with 2,010 (91.6% in the age bracket) attending a public institution.
| Age Bracket | Public School | Private School |
| 3 to 4 Year Olds | 1,041 (64.2%) | 581 (35.8%) |
| 5 to 9 Year Old | 6,742 (83.7%) | 1,310 (16.3%) |
| 10 to 14 Year Olds | 8,694 (91.0%) | 859 (9.0%) |
| 15 to 17 Year Olds | 5,243 (91.1%) | 512 (8.9%) |
| 18 to 19 Year Olds | 2,010 (91.6%) | 184 (8.4%) |
| 20 to 24 Year Olds | 2,517 (76.8%) | 759 (23.2%) |
| 25 to 34 Year Olds | 1,930 (85.4%) | 330 (14.6%) |
| 35 Years and over | 1,095 (72.5%) | 416 (27.5%) |
| Total | 29,261 (85.5%) | 4,962 (14.5%) |
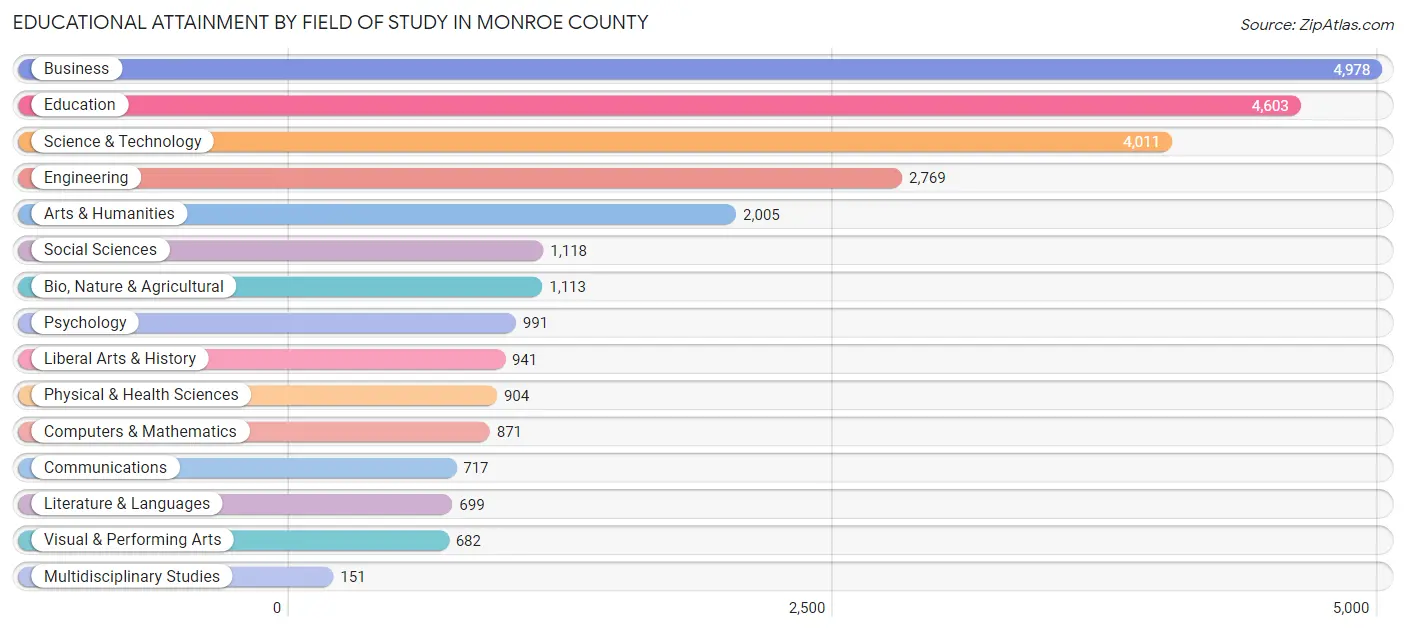
Educational Attainment by Field of Study in Monroe County
Business (4,978 | 18.8%), education (4,603 | 17.3%), science & technology (4,011 | 15.1%), engineering (2,769 | 10.4%), and arts & humanities (2,005 | 7.5%) are the most common fields of study among 26,553 individuals in Monroe County who have obtained a bachelor's degree or higher.
| Field of Study | # Graduates | % Graduates |
| Computers & Mathematics | 871 | 3.3% |
| Bio, Nature & Agricultural | 1,113 | 4.2% |
| Physical & Health Sciences | 904 | 3.4% |
| Psychology | 991 | 3.7% |
| Social Sciences | 1,118 | 4.2% |
| Engineering | 2,769 | 10.4% |
| Multidisciplinary Studies | 151 | 0.6% |
| Science & Technology | 4,011 | 15.1% |
| Business | 4,978 | 18.8% |
| Education | 4,603 | 17.3% |
| Literature & Languages | 699 | 2.6% |
| Liberal Arts & History | 941 | 3.5% |
| Visual & Performing Arts | 682 | 2.6% |
| Communications | 717 | 2.7% |
| Arts & Humanities | 2,005 | 7.5% |
| Total | 26,553 | 100.0% |
Transportation & Commute in Monroe County
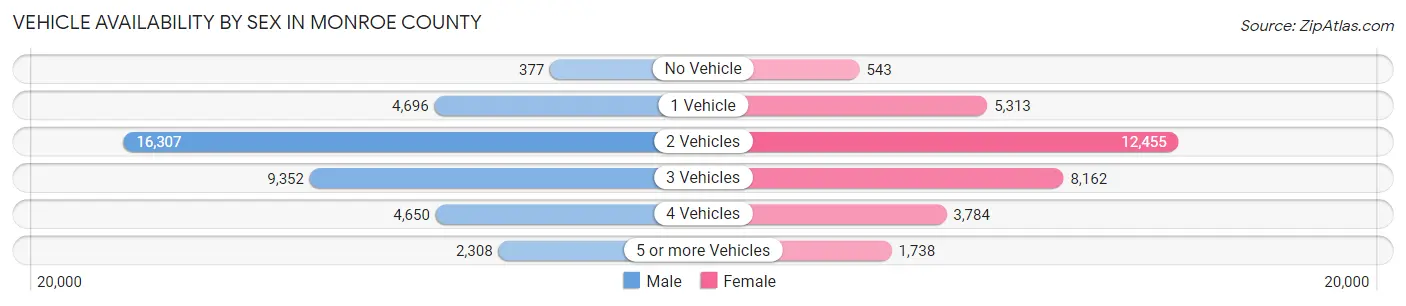
Vehicle Availability by Sex in Monroe County
The most prevalent vehicle ownership categories in Monroe County are males with 2 vehicles (16,307, accounting for 43.3%) and females with 2 vehicles (12,455, making up 51.0%).
| Vehicles Available | Male | Female |
| No Vehicle | 377 (1.0%) | 543 (1.7%) |
| 1 Vehicle | 4,696 (12.5%) | 5,313 (16.6%) |
| 2 Vehicles | 16,307 (43.3%) | 12,455 (38.9%) |
| 3 Vehicles | 9,352 (24.8%) | 8,162 (25.5%) |
| 4 Vehicles | 4,650 (12.3%) | 3,784 (11.8%) |
| 5 or more Vehicles | 2,308 (6.1%) | 1,738 (5.4%) |
| Total | 37,690 (100.0%) | 31,995 (100.0%) |
Commute Time in Monroe County
The most frequently occuring commute durations in Monroe County are 30 to 34 minutes (9,122 commuters, 14.1%), 20 to 24 minutes (9,012 commuters, 13.9%), and 10 to 14 minutes (8,027 commuters, 12.4%).
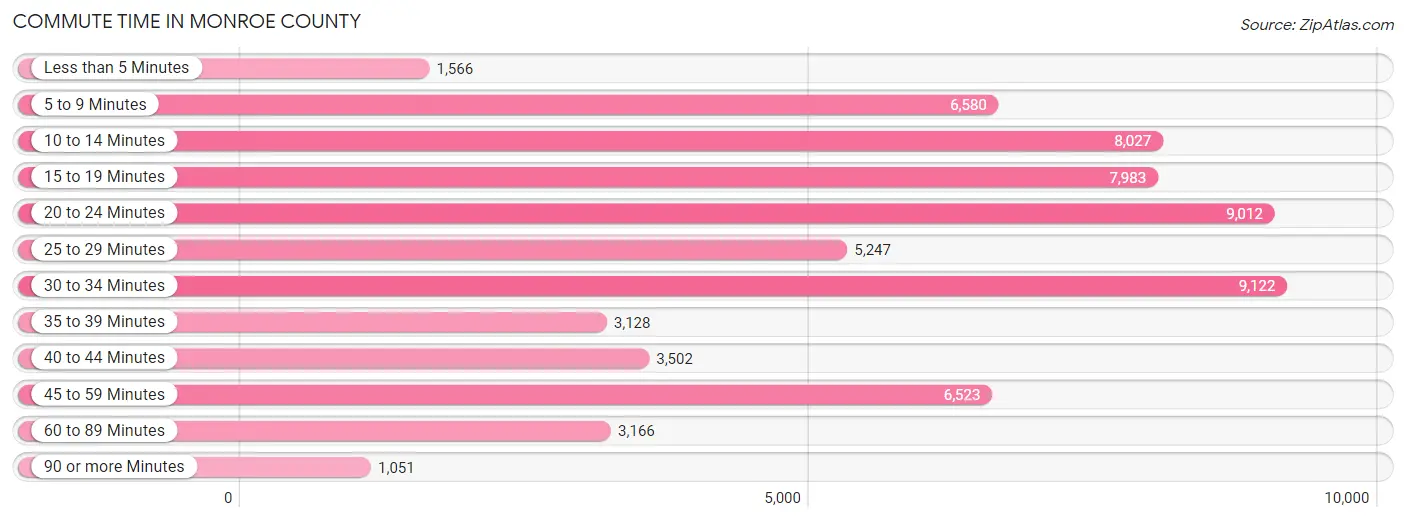
| Commute Time | # Commuters | % Commuters |
| Less than 5 Minutes | 1,566 | 2.4% |
| 5 to 9 Minutes | 6,580 | 10.1% |
| 10 to 14 Minutes | 8,027 | 12.4% |
| 15 to 19 Minutes | 7,983 | 12.3% |
| 20 to 24 Minutes | 9,012 | 13.9% |
| 25 to 29 Minutes | 5,247 | 8.1% |
| 30 to 34 Minutes | 9,122 | 14.1% |
| 35 to 39 Minutes | 3,128 | 4.8% |
| 40 to 44 Minutes | 3,502 | 5.4% |
| 45 to 59 Minutes | 6,523 | 10.1% |
| 60 to 89 Minutes | 3,166 | 4.9% |
| 90 or more Minutes | 1,051 | 1.6% |
Commute Time by Sex in Monroe County
The most common commute times in Monroe County are 30 to 34 minutes (5,383 commuters, 15.1%) for males and 10 to 14 minutes (4,539 commuters, 15.5%) for females.
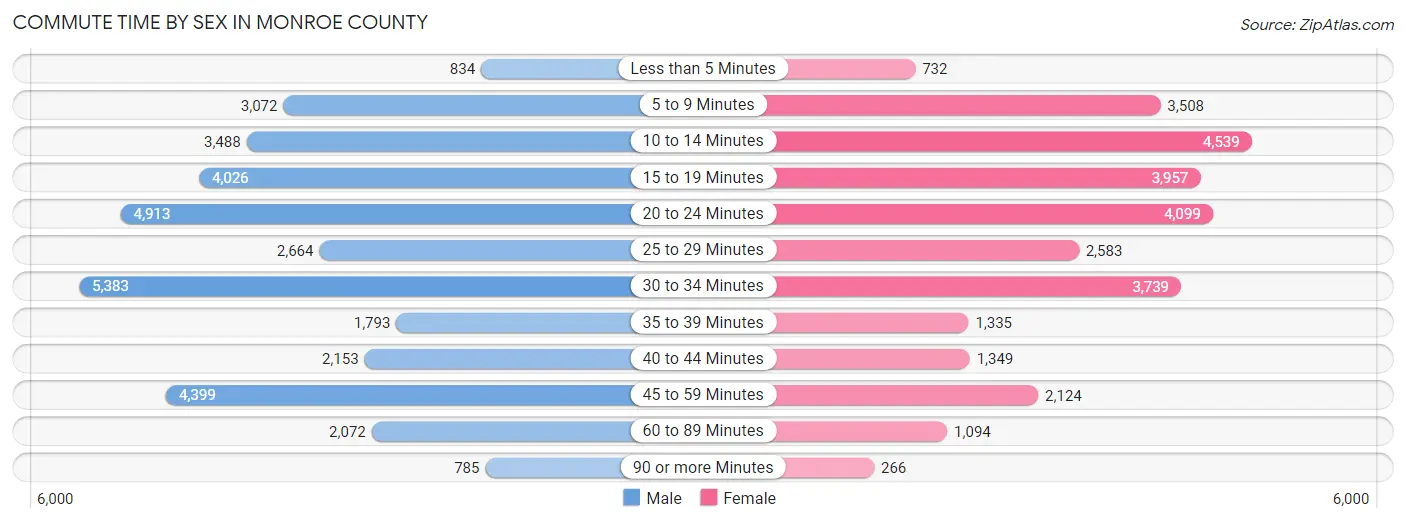
| Commute Time | Male | Female |
| Less than 5 Minutes | 834 (2.3%) | 732 (2.5%) |
| 5 to 9 Minutes | 3,072 (8.6%) | 3,508 (12.0%) |
| 10 to 14 Minutes | 3,488 (9.8%) | 4,539 (15.5%) |
| 15 to 19 Minutes | 4,026 (11.3%) | 3,957 (13.5%) |
| 20 to 24 Minutes | 4,913 (13.8%) | 4,099 (14.0%) |
| 25 to 29 Minutes | 2,664 (7.5%) | 2,583 (8.8%) |
| 30 to 34 Minutes | 5,383 (15.1%) | 3,739 (12.8%) |
| 35 to 39 Minutes | 1,793 (5.0%) | 1,335 (4.5%) |
| 40 to 44 Minutes | 2,153 (6.0%) | 1,349 (4.6%) |
| 45 to 59 Minutes | 4,399 (12.4%) | 2,124 (7.2%) |
| 60 to 89 Minutes | 2,072 (5.8%) | 1,094 (3.7%) |
| 90 or more Minutes | 785 (2.2%) | 266 (0.9%) |
Time of Departure to Work by Sex in Monroe County
The most frequent times of departure to work in Monroe County are 6:30 AM to 6:59 AM (4,651, 13.1%) for males and 7:30 AM to 7:59 AM (3,698, 12.6%) for females.
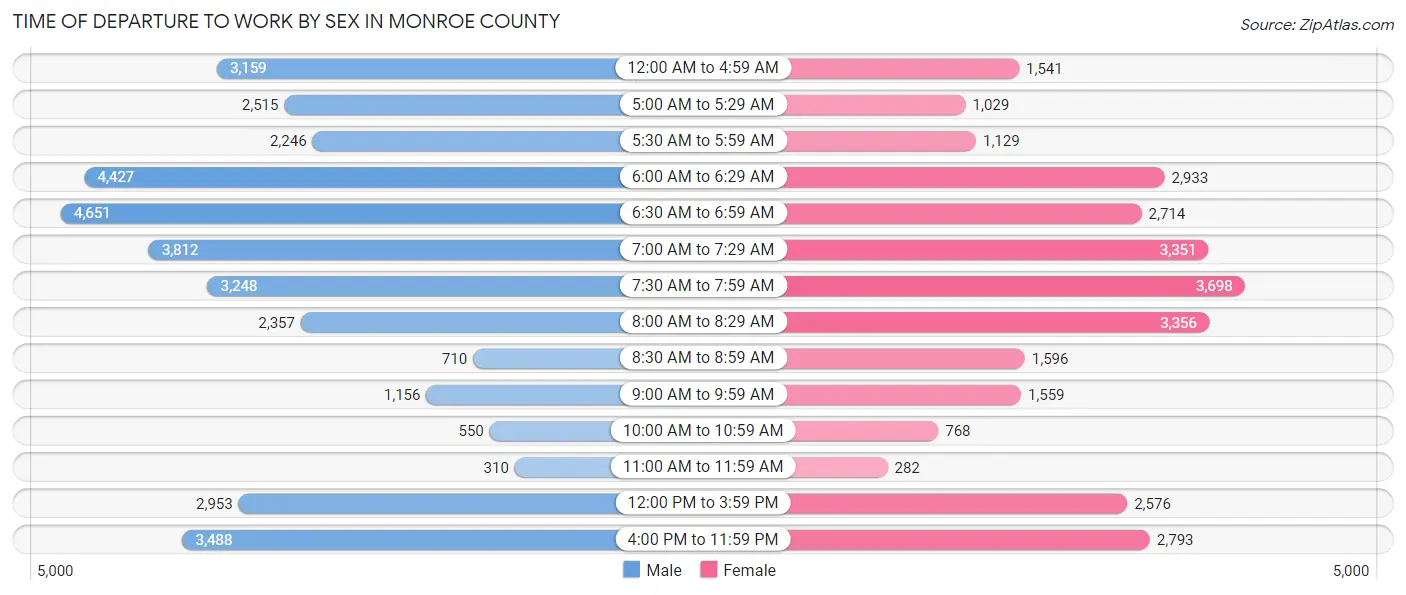
| Time of Departure | Male | Female |
| 12:00 AM to 4:59 AM | 3,159 (8.9%) | 1,541 (5.2%) |
| 5:00 AM to 5:29 AM | 2,515 (7.1%) | 1,029 (3.5%) |
| 5:30 AM to 5:59 AM | 2,246 (6.3%) | 1,129 (3.8%) |
| 6:00 AM to 6:29 AM | 4,427 (12.4%) | 2,933 (10.0%) |
| 6:30 AM to 6:59 AM | 4,651 (13.1%) | 2,714 (9.2%) |
| 7:00 AM to 7:29 AM | 3,812 (10.7%) | 3,351 (11.4%) |
| 7:30 AM to 7:59 AM | 3,248 (9.1%) | 3,698 (12.6%) |
| 8:00 AM to 8:29 AM | 2,357 (6.6%) | 3,356 (11.4%) |
| 8:30 AM to 8:59 AM | 710 (2.0%) | 1,596 (5.4%) |
| 9:00 AM to 9:59 AM | 1,156 (3.3%) | 1,559 (5.3%) |
| 10:00 AM to 10:59 AM | 550 (1.5%) | 768 (2.6%) |
| 11:00 AM to 11:59 AM | 310 (0.9%) | 282 (1.0%) |
| 12:00 PM to 3:59 PM | 2,953 (8.3%) | 2,576 (8.8%) |
| 4:00 PM to 11:59 PM | 3,488 (9.8%) | 2,793 (9.5%) |
| Total | 35,582 (100.0%) | 29,325 (100.0%) |
Housing Occupancy in Monroe County
Occupancy by Ownership in Monroe County
Of the total 62,240 dwellings in Monroe County, owner-occupied units account for 50,266 (80.8%), while renter-occupied units make up 11,974 (19.2%).
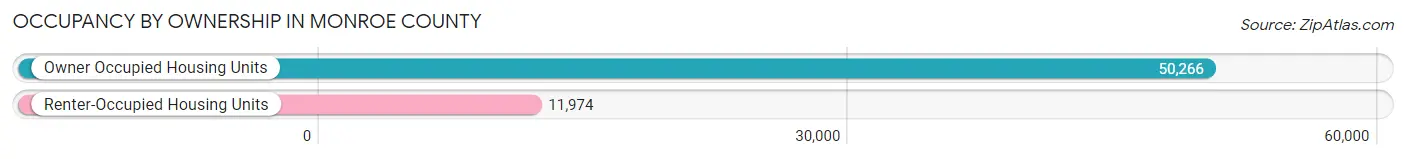
| Occupancy | # Housing Units | % Housing Units |
| Owner Occupied Housing Units | 50,266 | 80.8% |
| Renter-Occupied Housing Units | 11,974 | 19.2% |
| Total Occupied Housing Units | 62,240 | 100.0% |
Occupancy by Household Size in Monroe County
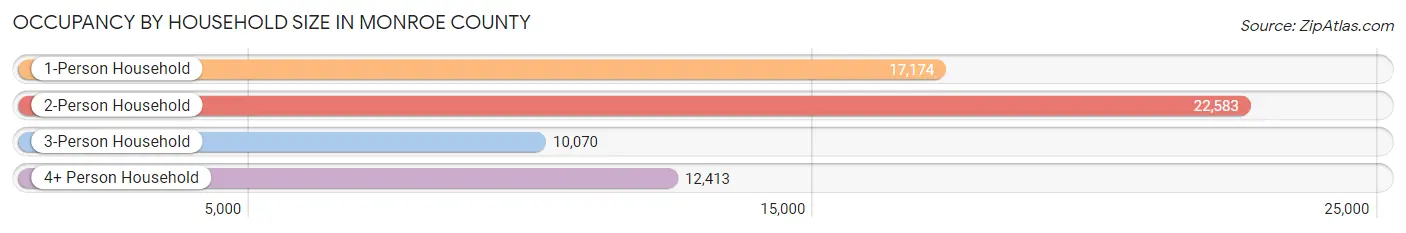
| Household Size | # Housing Units | % Housing Units |
| 1-Person Household | 17,174 | 27.6% |
| 2-Person Household | 22,583 | 36.3% |
| 3-Person Household | 10,070 | 16.2% |
| 4+ Person Household | 12,413 | 19.9% |
| Total Housing Units | 62,240 | 100.0% |
Occupancy by Ownership by Household Size in Monroe County
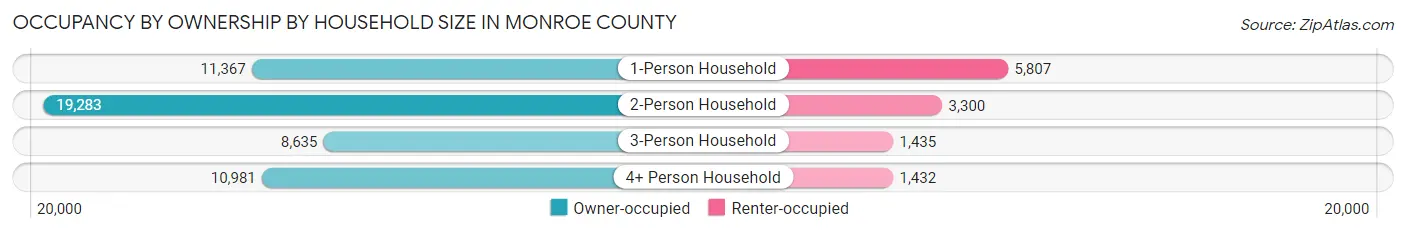
| Household Size | Owner-occupied | Renter-occupied |
| 1-Person Household | 11,367 (66.2%) | 5,807 (33.8%) |
| 2-Person Household | 19,283 (85.4%) | 3,300 (14.6%) |
| 3-Person Household | 8,635 (85.8%) | 1,435 (14.2%) |
| 4+ Person Household | 10,981 (88.5%) | 1,432 (11.5%) |
| Total Housing Units | 50,266 (80.8%) | 11,974 (19.2%) |
Occupancy by Educational Attainment in Monroe County
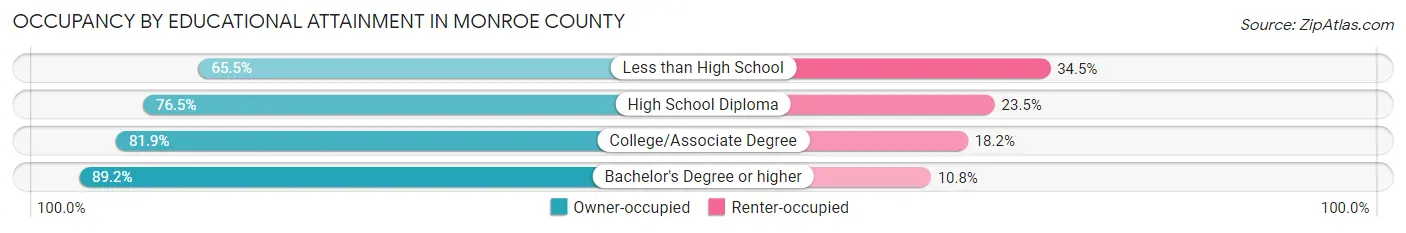
| Household Size | Owner-occupied | Renter-occupied |
| Less than High School | 3,062 (65.5%) | 1,613 (34.5%) |
| High School Diploma | 14,433 (76.5%) | 4,430 (23.5%) |
| College/Associate Degree | 19,472 (81.9%) | 4,319 (18.1%) |
| Bachelor's Degree or higher | 13,299 (89.2%) | 1,612 (10.8%) |
Occupancy by Age of Householder in Monroe County
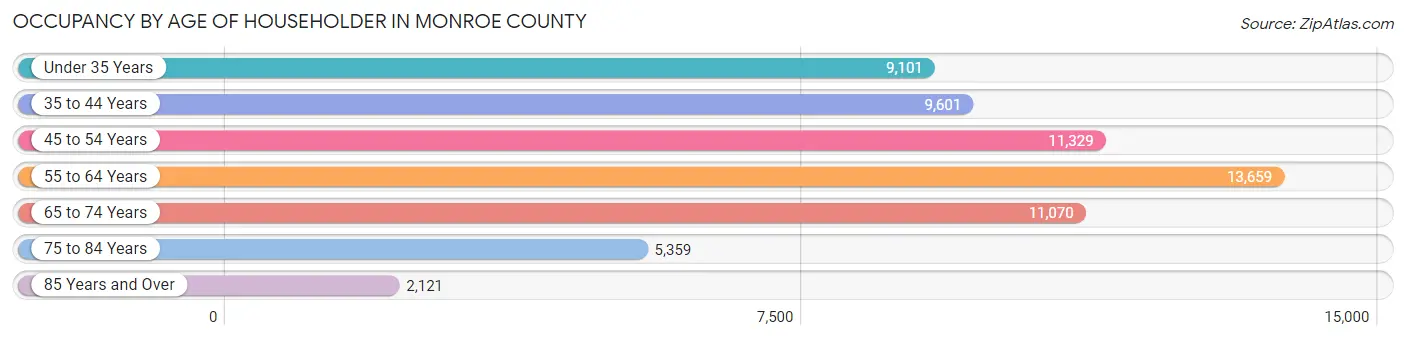
| Age Bracket | # Households | % Households |
| Under 35 Years | 9,101 | 14.6% |
| 35 to 44 Years | 9,601 | 15.4% |
| 45 to 54 Years | 11,329 | 18.2% |
| 55 to 64 Years | 13,659 | 22.0% |
| 65 to 74 Years | 11,070 | 17.8% |
| 75 to 84 Years | 5,359 | 8.6% |
| 85 Years and Over | 2,121 | 3.4% |
| Total | 62,240 | 100.0% |
Housing Finances in Monroe County
Median Income by Occupancy in Monroe County
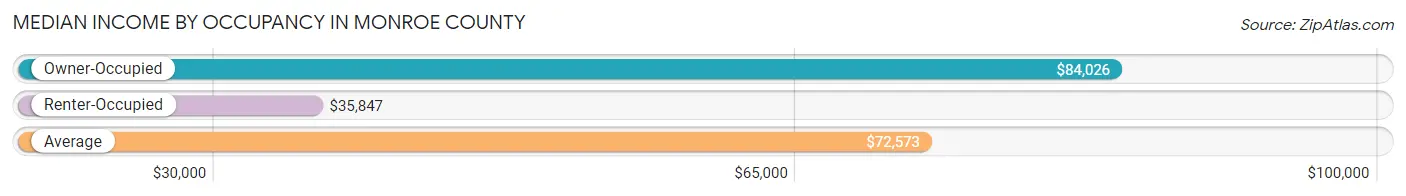
| Occupancy Type | # Households | Median Income |
| Owner-Occupied | 50,266 (80.8%) | $84,026 |
| Renter-Occupied | 11,974 (19.2%) | $35,847 |
| Average | 62,240 (100.0%) | $72,573 |
Occupancy by Householder Income Bracket in Monroe County
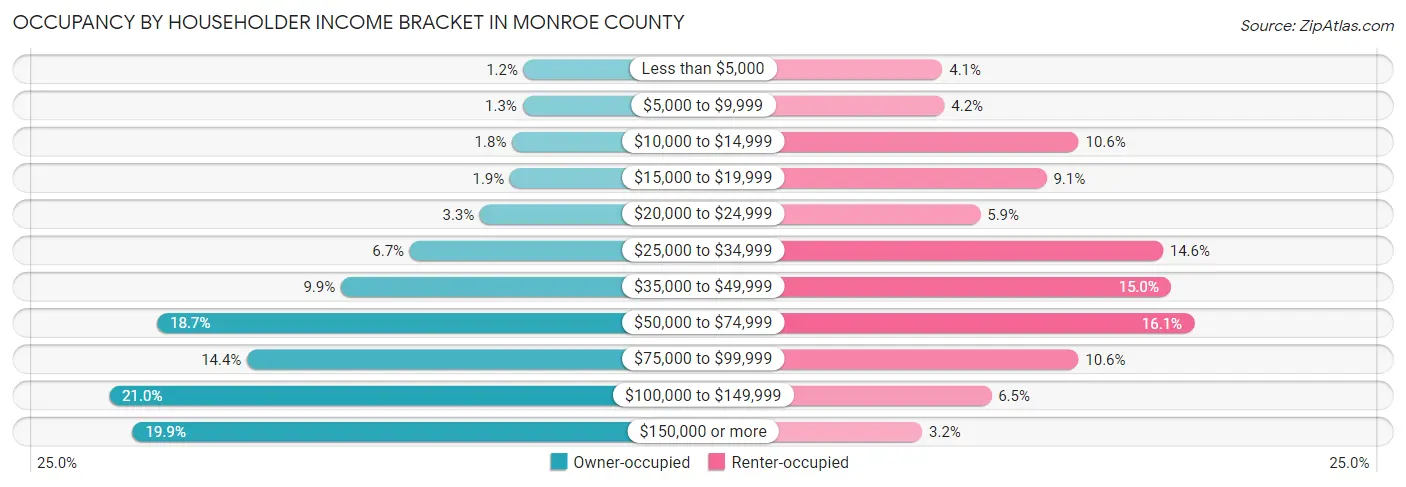
| Income Bracket | Owner-occupied | Renter-occupied |
| Less than $5,000 | 618 (1.2%) | 494 (4.1%) |
| $5,000 to $9,999 | 645 (1.3%) | 507 (4.2%) |
| $10,000 to $14,999 | 895 (1.8%) | 1,272 (10.6%) |
| $15,000 to $19,999 | 946 (1.9%) | 1,089 (9.1%) |
| $20,000 to $24,999 | 1,665 (3.3%) | 711 (5.9%) |
| $25,000 to $34,999 | 3,344 (6.7%) | 1,752 (14.6%) |
| $35,000 to $49,999 | 4,990 (9.9%) | 1,797 (15.0%) |
| $50,000 to $74,999 | 9,397 (18.7%) | 1,929 (16.1%) |
| $75,000 to $99,999 | 7,236 (14.4%) | 1,270 (10.6%) |
| $100,000 to $149,999 | 10,547 (21.0%) | 774 (6.5%) |
| $150,000 or more | 9,983 (19.9%) | 379 (3.2%) |
| Total | 50,266 (100.0%) | 11,974 (100.0%) |
Monthly Housing Cost Tiers in Monroe County
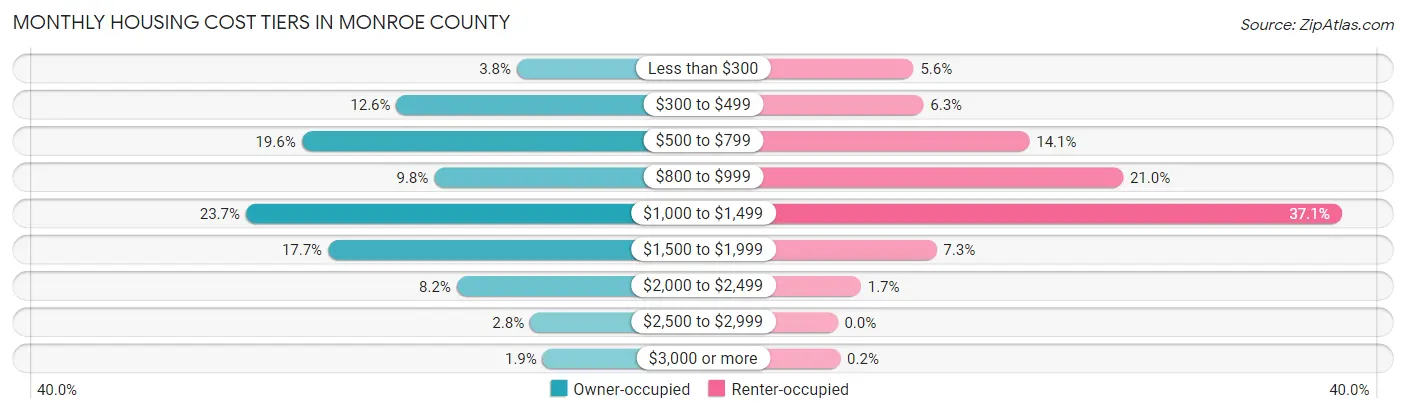
| Monthly Cost | Owner-occupied | Renter-occupied |
| Less than $300 | 1,885 (3.7%) | 671 (5.6%) |
| $300 to $499 | 6,346 (12.6%) | 758 (6.3%) |
| $500 to $799 | 9,856 (19.6%) | 1,692 (14.1%) |
| $800 to $999 | 4,945 (9.8%) | 2,518 (21.0%) |
| $1,000 to $1,499 | 11,917 (23.7%) | 4,445 (37.1%) |
| $1,500 to $1,999 | 8,878 (17.7%) | 873 (7.3%) |
| $2,000 to $2,499 | 4,113 (8.2%) | 206 (1.7%) |
| $2,500 to $2,999 | 1,396 (2.8%) | 0 (0.0%) |
| $3,000 or more | 930 (1.8%) | 24 (0.2%) |
| Total | 50,266 (100.0%) | 11,974 (100.0%) |
Physical Housing Characteristics in Monroe County
Housing Structures in Monroe County
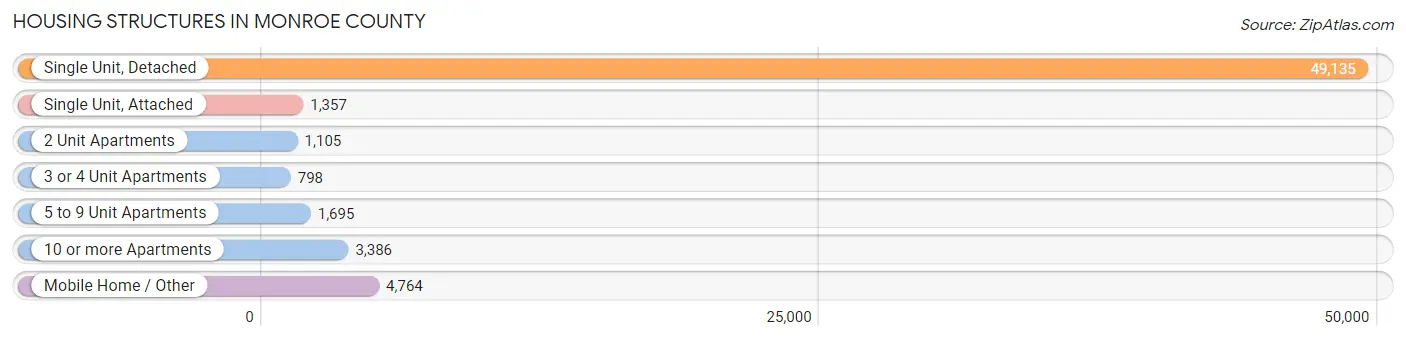
| Structure Type | # Housing Units | % Housing Units |
| Single Unit, Detached | 49,135 | 78.9% |
| Single Unit, Attached | 1,357 | 2.2% |
| 2 Unit Apartments | 1,105 | 1.8% |
| 3 or 4 Unit Apartments | 798 | 1.3% |
| 5 to 9 Unit Apartments | 1,695 | 2.7% |
| 10 or more Apartments | 3,386 | 5.4% |
| Mobile Home / Other | 4,764 | 7.6% |
| Total | 62,240 | 100.0% |
Housing Structures by Occupancy in Monroe County
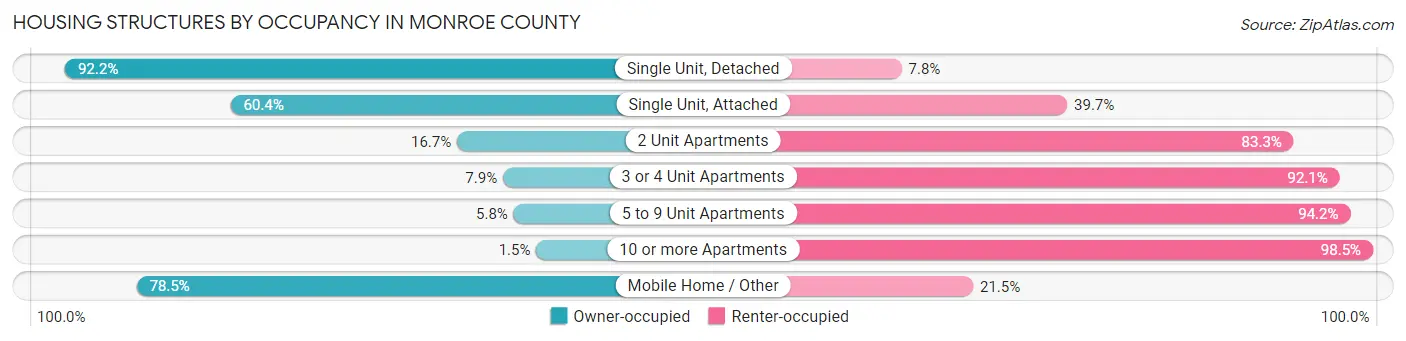
| Structure Type | Owner-occupied | Renter-occupied |
| Single Unit, Detached | 45,312 (92.2%) | 3,823 (7.8%) |
| Single Unit, Attached | 819 (60.4%) | 538 (39.7%) |
| 2 Unit Apartments | 185 (16.7%) | 920 (83.3%) |
| 3 or 4 Unit Apartments | 63 (7.9%) | 735 (92.1%) |
| 5 to 9 Unit Apartments | 99 (5.8%) | 1,596 (94.2%) |
| 10 or more Apartments | 50 (1.5%) | 3,336 (98.5%) |
| Mobile Home / Other | 3,738 (78.5%) | 1,026 (21.5%) |
| Total | 50,266 (80.8%) | 11,974 (19.2%) |
Housing Structures by Number of Rooms in Monroe County
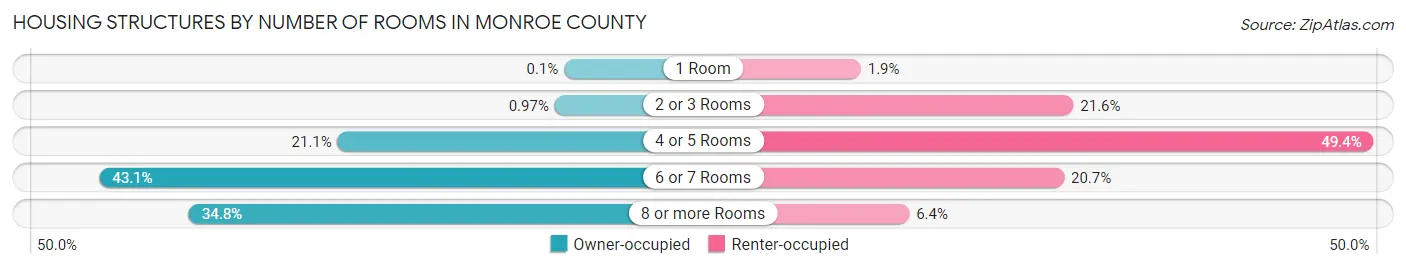
| Number of Rooms | Owner-occupied | Renter-occupied |
| 1 Room | 48 (0.1%) | 231 (1.9%) |
| 2 or 3 Rooms | 490 (1.0%) | 2,585 (21.6%) |
| 4 or 5 Rooms | 10,580 (21.0%) | 5,909 (49.3%) |
| 6 or 7 Rooms | 21,656 (43.1%) | 2,482 (20.7%) |
| 8 or more Rooms | 17,492 (34.8%) | 767 (6.4%) |
| Total | 50,266 (100.0%) | 11,974 (100.0%) |
Housing Structure by Heating Type in Monroe County
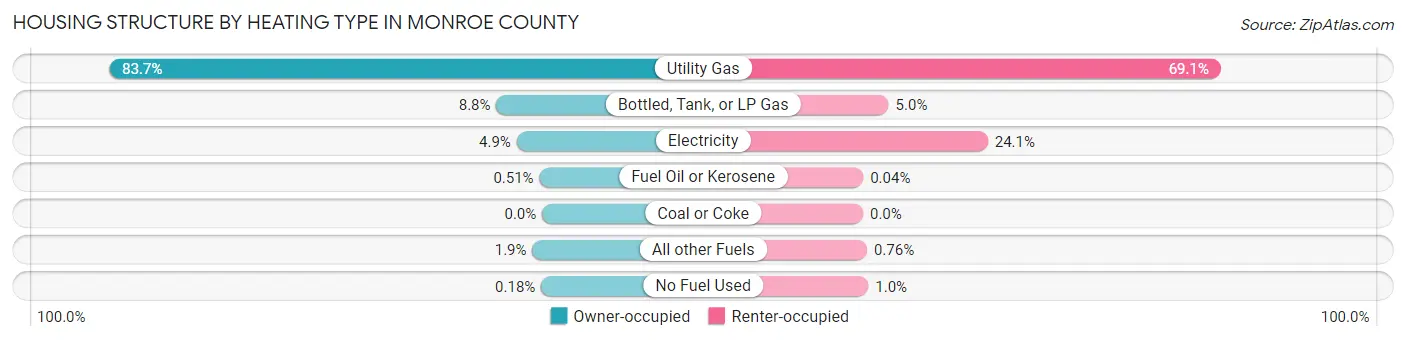
| Heating Type | Owner-occupied | Renter-occupied |
| Utility Gas | 42,058 (83.7%) | 8,275 (69.1%) |
| Bottled, Tank, or LP Gas | 4,445 (8.8%) | 593 (5.0%) |
| Electricity | 2,470 (4.9%) | 2,887 (24.1%) |
| Fuel Oil or Kerosene | 255 (0.5%) | 5 (0.0%) |
| Coal or Coke | 0 (0.0%) | 0 (0.0%) |
| All other Fuels | 947 (1.9%) | 91 (0.8%) |
| No Fuel Used | 91 (0.2%) | 123 (1.0%) |
| Total | 50,266 (100.0%) | 11,974 (100.0%) |
Household Vehicle Usage in Monroe County
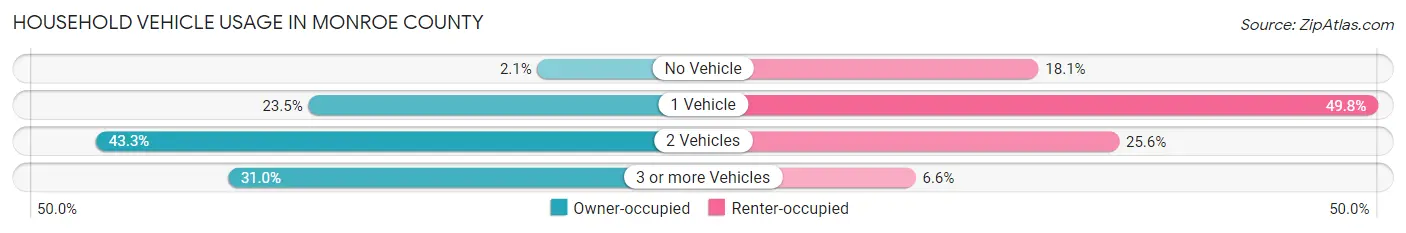
| Vehicles per Household | Owner-occupied | Renter-occupied |
| No Vehicle | 1,067 (2.1%) | 2,163 (18.1%) |
| 1 Vehicle | 11,810 (23.5%) | 5,958 (49.8%) |
| 2 Vehicles | 21,786 (43.3%) | 3,064 (25.6%) |
| 3 or more Vehicles | 15,603 (31.0%) | 789 (6.6%) |
| Total | 50,266 (100.0%) | 11,974 (100.0%) |
Real Estate & Mortgages in Monroe County
Real Estate and Mortgage Overview in Monroe County
| Characteristic | Without Mortgage | With Mortgage |
| Housing Units | 19,350 | 30,916 |
| Median Property Value | $182,000 | $213,300 |
| Median Household Income | $58,842 | $7,801 |
| Monthly Housing Costs | $553 | $908 |
| Real Estate Taxes | $2,203 | $1,656 |
Property Value by Mortgage Status in Monroe County
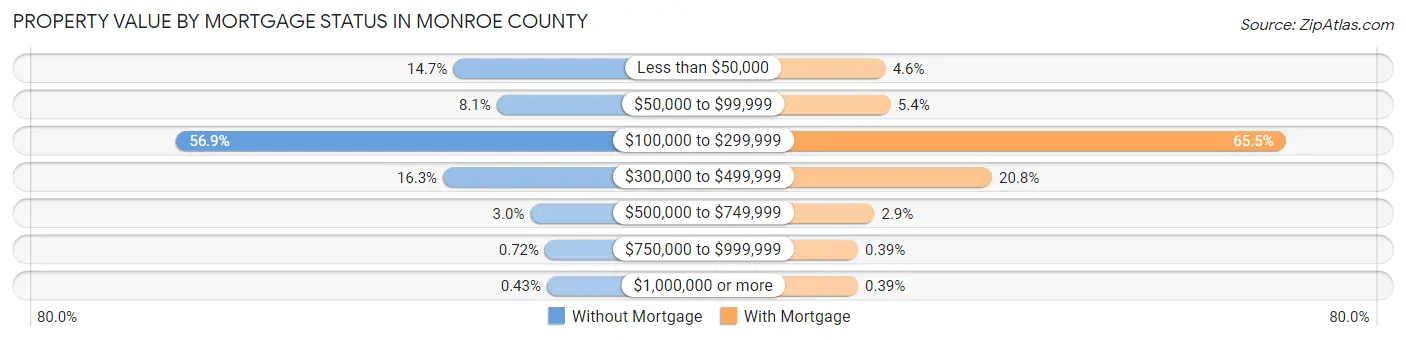
| Property Value | Without Mortgage | With Mortgage |
| Less than $50,000 | 2,845 (14.7%) | 1,421 (4.6%) |
| $50,000 to $99,999 | 1,561 (8.1%) | 1,667 (5.4%) |
| $100,000 to $299,999 | 11,006 (56.9%) | 20,258 (65.5%) |
| $300,000 to $499,999 | 3,144 (16.3%) | 6,435 (20.8%) |
| $500,000 to $749,999 | 571 (2.9%) | 892 (2.9%) |
| $750,000 to $999,999 | 140 (0.7%) | 121 (0.4%) |
| $1,000,000 or more | 83 (0.4%) | 122 (0.4%) |
| Total | 19,350 (100.0%) | 30,916 (100.0%) |
Household Income by Mortgage Status in Monroe County
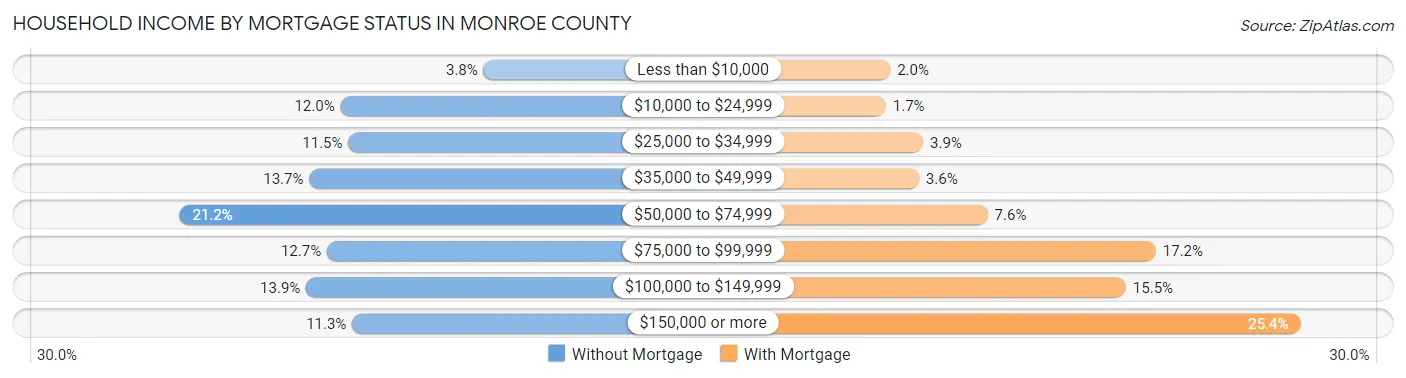
| Household Income | Without Mortgage | With Mortgage |
| Less than $10,000 | 729 (3.8%) | 613 (2.0%) |
| $10,000 to $24,999 | 2,313 (11.9%) | 534 (1.7%) |
| $25,000 to $34,999 | 2,225 (11.5%) | 1,193 (3.9%) |
| $35,000 to $49,999 | 2,656 (13.7%) | 1,119 (3.6%) |
| $50,000 to $74,999 | 4,092 (21.1%) | 2,334 (7.5%) |
| $75,000 to $99,999 | 2,461 (12.7%) | 5,305 (17.2%) |
| $100,000 to $149,999 | 2,692 (13.9%) | 4,775 (15.4%) |
| $150,000 or more | 2,182 (11.3%) | 7,855 (25.4%) |
| Total | 19,350 (100.0%) | 30,916 (100.0%) |
Property Value to Household Income Ratio in Monroe County
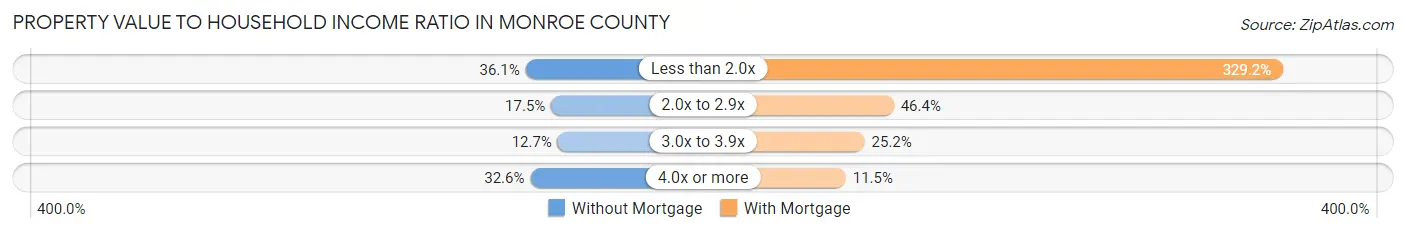
| Value-to-Income Ratio | Without Mortgage | With Mortgage |
| Less than 2.0x | 6,985 (36.1%) | 101,774 (329.2%) |
| 2.0x to 2.9x | 3,383 (17.5%) | 14,331 (46.4%) |
| 3.0x to 3.9x | 2,464 (12.7%) | 7,791 (25.2%) |
| 4.0x or more | 6,314 (32.6%) | 3,558 (11.5%) |
| Total | 19,350 (100.0%) | 30,916 (100.0%) |
Real Estate Taxes by Mortgage Status in Monroe County
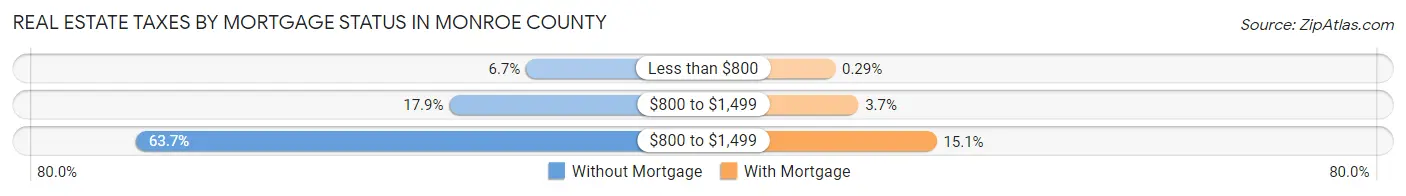
| Property Taxes | Without Mortgage | With Mortgage |
| Less than $800 | 1,300 (6.7%) | 90 (0.3%) |
| $800 to $1,499 | 3,471 (17.9%) | 1,137 (3.7%) |
| $800 to $1,499 | 12,331 (63.7%) | 4,672 (15.1%) |
| Total | 19,350 (100.0%) | 30,916 (100.0%) |
Health & Disability in Monroe County
Health Insurance Coverage by Age in Monroe County

| Age Bracket | With Coverage | Without Coverage |
| Under 6 Years | 9,344 (96.5%) | 338 (3.5%) |
| 6 to 18 Years | 24,410 (98.4%) | 394 (1.6%) |
| 19 to 25 Years | 11,717 (92.9%) | 898 (7.1%) |
| 26 to 34 Years | 14,862 (92.1%) | 1,277 (7.9%) |
| 35 to 44 Years | 17,366 (95.2%) | 874 (4.8%) |
| 45 to 54 Years | 19,284 (95.5%) | 918 (4.5%) |
| 55 to 64 Years | 22,565 (96.5%) | 813 (3.5%) |
| 65 to 74 Years | 17,545 (99.6%) | 68 (0.4%) |
| 75 Years and older | 11,069 (99.9%) | 16 (0.1%) |
| Total | 148,162 (96.4%) | 5,596 (3.6%) |
Health Insurance Coverage by Citizenship Status in Monroe County
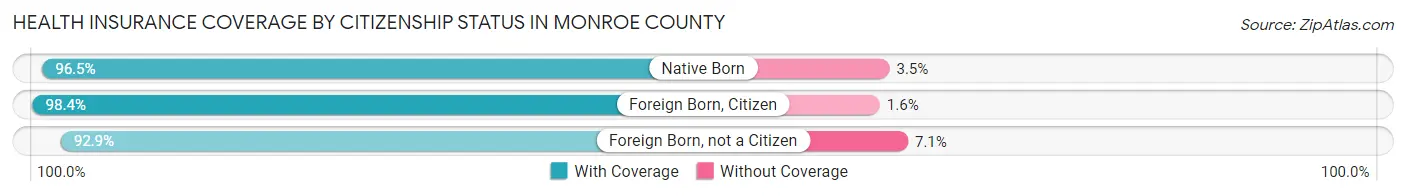
| Citizenship Status | With Coverage | Without Coverage |
| Native Born | 9,344 (96.5%) | 338 (3.5%) |
| Foreign Born, Citizen | 24,410 (98.4%) | 394 (1.6%) |
| Foreign Born, not a Citizen | 11,717 (92.9%) | 898 (7.1%) |
Health Insurance Coverage by Household Income in Monroe County
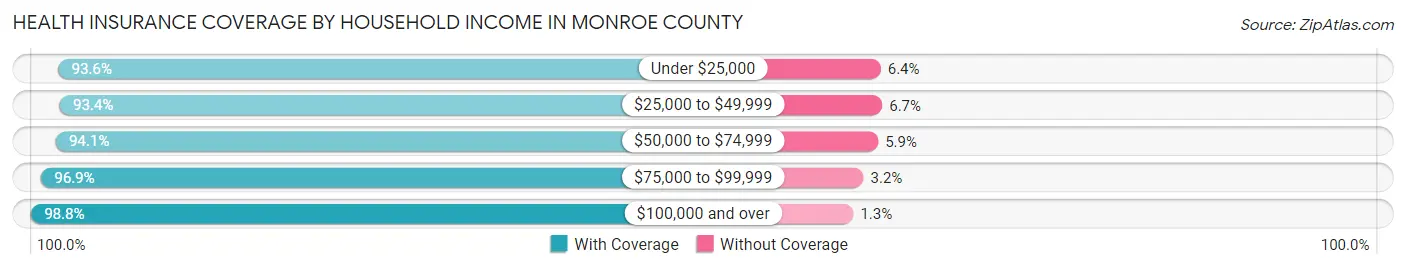
| Household Income | With Coverage | Without Coverage |
| Under $25,000 | 13,999 (93.6%) | 953 (6.4%) |
| $25,000 to $49,999 | 21,577 (93.3%) | 1,538 (6.7%) |
| $50,000 to $74,999 | 24,793 (94.1%) | 1,551 (5.9%) |
| $75,000 to $99,999 | 21,150 (96.9%) | 689 (3.2%) |
| $100,000 and over | 66,153 (98.8%) | 836 (1.3%) |
Public vs Private Health Insurance Coverage by Age in Monroe County
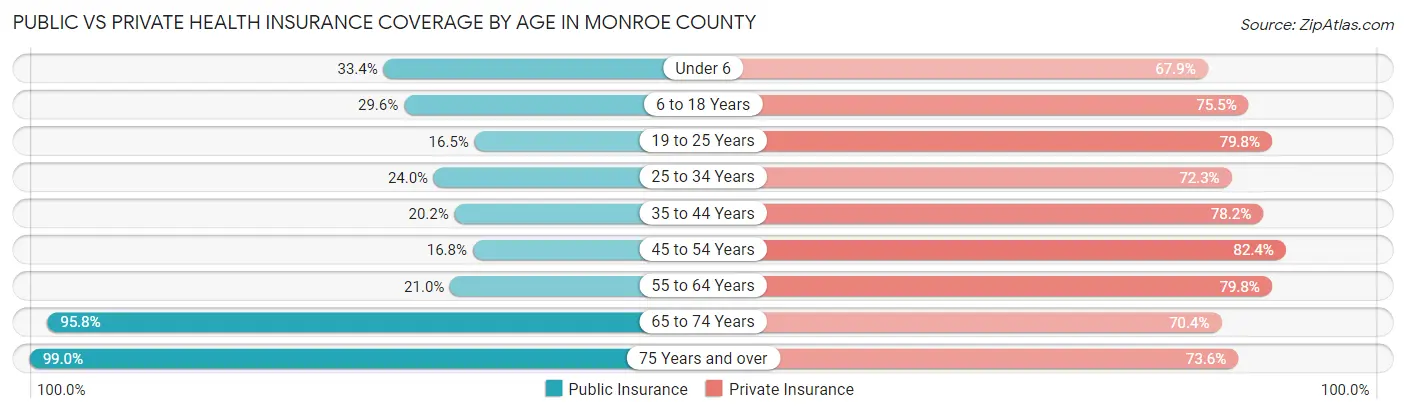
| Age Bracket | Public Insurance | Private Insurance |
| Under 6 | 3,232 (33.4%) | 6,571 (67.9%) |
| 6 to 18 Years | 7,334 (29.6%) | 18,721 (75.5%) |
| 19 to 25 Years | 2,077 (16.5%) | 10,067 (79.8%) |
| 25 to 34 Years | 3,877 (24.0%) | 11,671 (72.3%) |
| 35 to 44 Years | 3,682 (20.2%) | 14,259 (78.2%) |
| 45 to 54 Years | 3,395 (16.8%) | 16,643 (82.4%) |
| 55 to 64 Years | 4,912 (21.0%) | 18,654 (79.8%) |
| 65 to 74 Years | 16,870 (95.8%) | 12,403 (70.4%) |
| 75 Years and over | 10,979 (99.0%) | 8,153 (73.6%) |
| Total | 56,358 (36.6%) | 117,142 (76.2%) |
Disability Status by Sex by Age in Monroe County
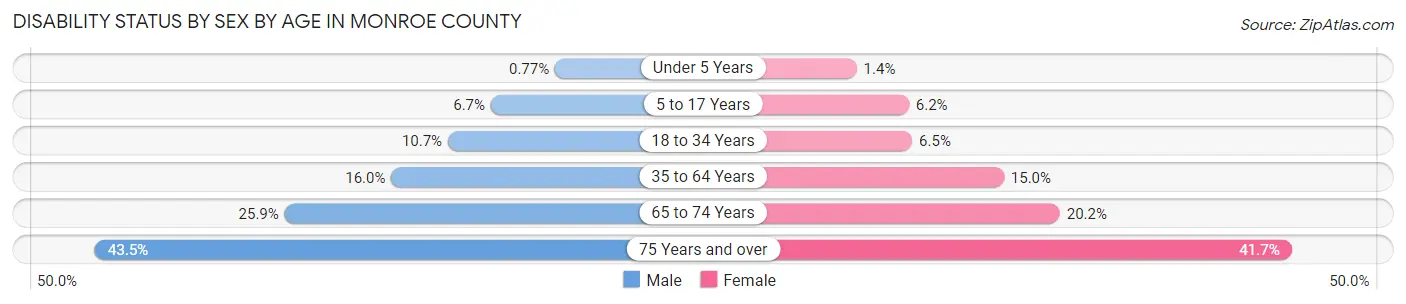
| Age Bracket | Male | Female |
| Under 5 Years | 32 (0.8%) | 52 (1.4%) |
| 5 to 17 Years | 838 (6.7%) | 760 (6.2%) |
| 18 to 34 Years | 1,705 (10.7%) | 962 (6.5%) |
| 35 to 64 Years | 4,932 (16.0%) | 4,652 (15.0%) |
| 65 to 74 Years | 2,236 (25.9%) | 1,815 (20.2%) |
| 75 Years and over | 2,026 (43.5%) | 2,681 (41.7%) |
Disability Class by Sex by Age in Monroe County
Disability Class: Hearing Difficulty
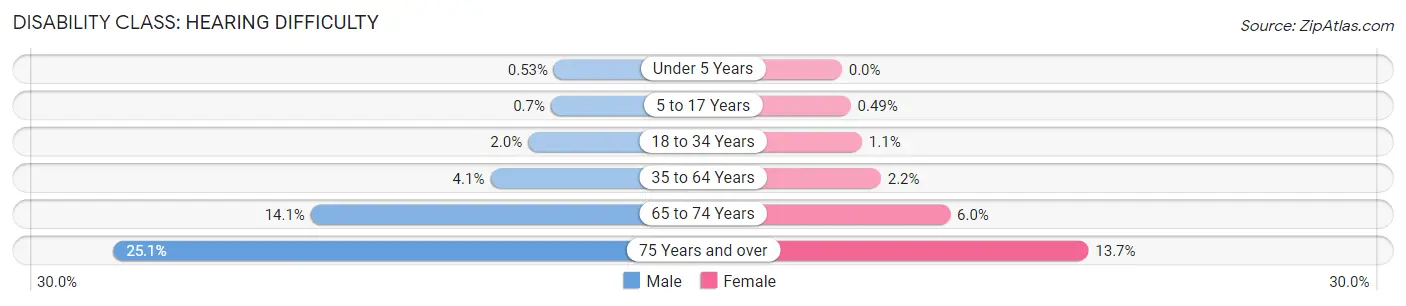
| Age Bracket | Male | Female |
| Under 5 Years | 22 (0.5%) | 0 (0.0%) |
| 5 to 17 Years | 87 (0.7%) | 60 (0.5%) |
| 18 to 34 Years | 314 (2.0%) | 165 (1.1%) |
| 35 to 64 Years | 1,257 (4.1%) | 670 (2.2%) |
| 65 to 74 Years | 1,216 (14.1%) | 541 (6.0%) |
| 75 Years and over | 1,168 (25.1%) | 882 (13.7%) |
Disability Class: Vision Difficulty
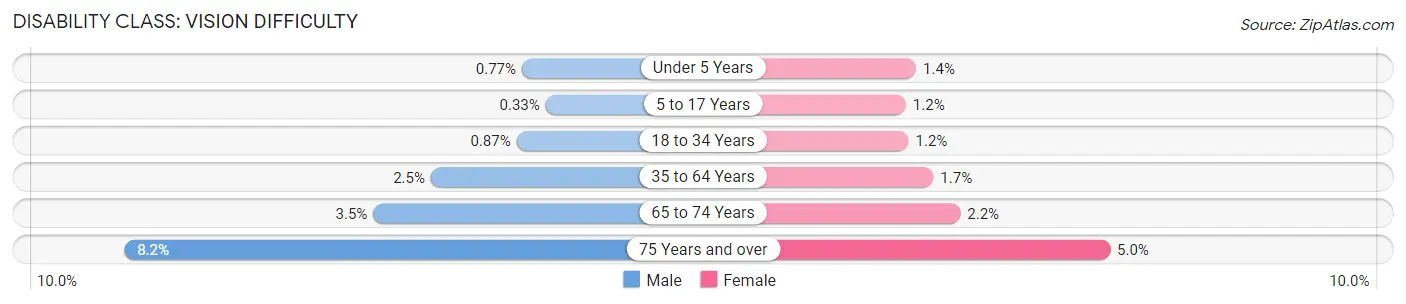
| Age Bracket | Male | Female |
| Under 5 Years | 32 (0.8%) | 52 (1.4%) |
| 5 to 17 Years | 41 (0.3%) | 145 (1.2%) |
| 18 to 34 Years | 139 (0.9%) | 182 (1.2%) |
| 35 to 64 Years | 761 (2.5%) | 525 (1.7%) |
| 65 to 74 Years | 305 (3.5%) | 197 (2.2%) |
| 75 Years and over | 380 (8.2%) | 320 (5.0%) |
Disability Class: Cognitive Difficulty
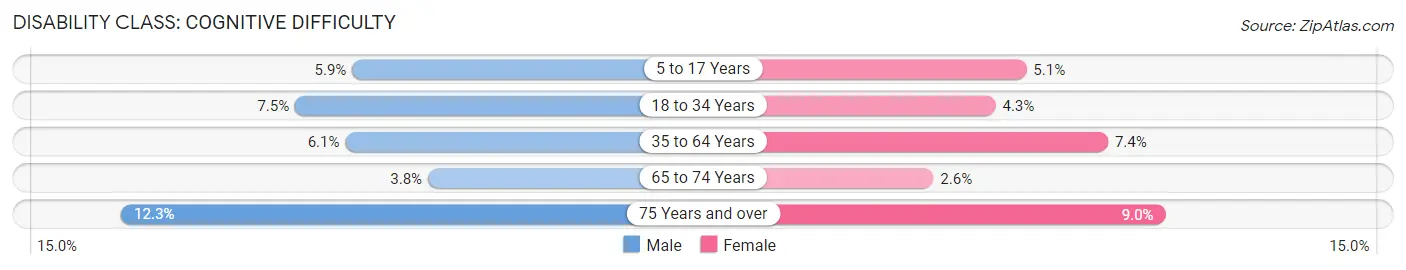
| Age Bracket | Male | Female |
| 5 to 17 Years | 732 (5.9%) | 627 (5.1%) |
| 18 to 34 Years | 1,189 (7.5%) | 630 (4.3%) |
| 35 to 64 Years | 1,875 (6.1%) | 2,291 (7.4%) |
| 65 to 74 Years | 326 (3.8%) | 229 (2.5%) |
| 75 Years and over | 574 (12.3%) | 579 (9.0%) |
Disability Class: Ambulatory Difficulty

| Age Bracket | Male | Female |
| 5 to 17 Years | 144 (1.2%) | 147 (1.2%) |
| 18 to 34 Years | 172 (1.1%) | 205 (1.4%) |
| 35 to 64 Years | 2,395 (7.7%) | 2,687 (8.7%) |
| 65 to 74 Years | 1,020 (11.8%) | 1,176 (13.1%) |
| 75 Years and over | 1,203 (25.8%) | 1,887 (29.4%) |
Disability Class: Self-Care Difficulty
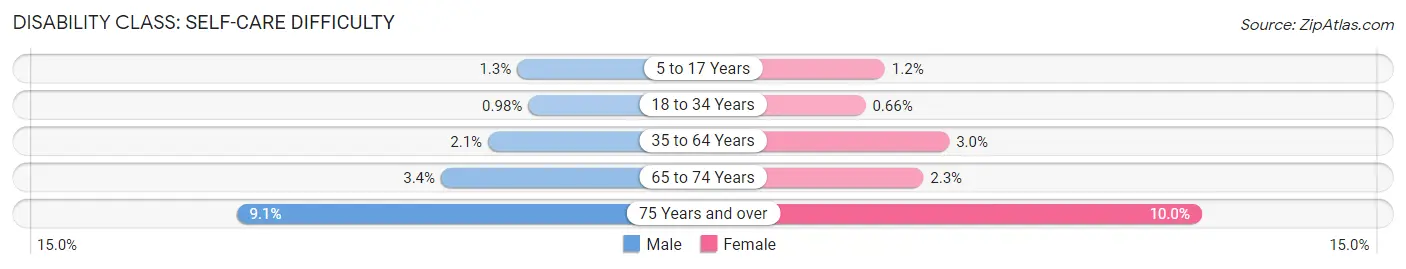
| Age Bracket | Male | Female |
| 5 to 17 Years | 161 (1.3%) | 146 (1.2%) |
| 18 to 34 Years | 156 (1.0%) | 97 (0.7%) |
| 35 to 64 Years | 648 (2.1%) | 925 (3.0%) |
| 65 to 74 Years | 295 (3.4%) | 204 (2.3%) |
| 75 Years and over | 424 (9.1%) | 644 (10.0%) |
Technology Access in Monroe County
Computing Device Access in Monroe County
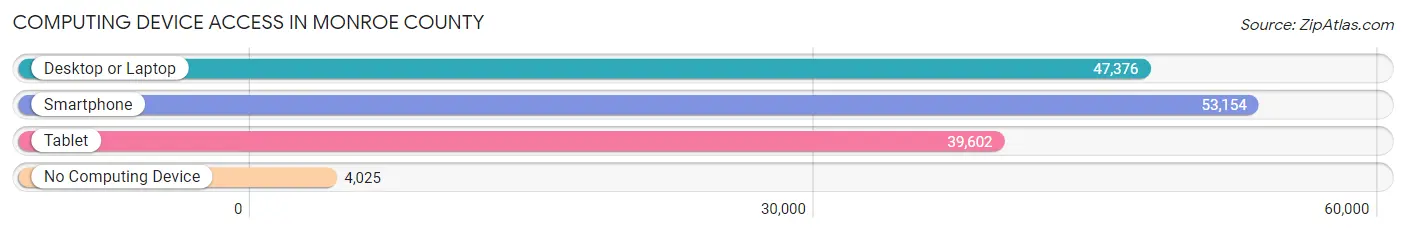
| Device Type | # Households | % Households |
| Desktop or Laptop | 47,376 | 76.1% |
| Smartphone | 53,154 | 85.4% |
| Tablet | 39,602 | 63.6% |
| No Computing Device | 4,025 | 6.5% |
| Total | 62,240 | 100.0% |
Internet Access in Monroe County
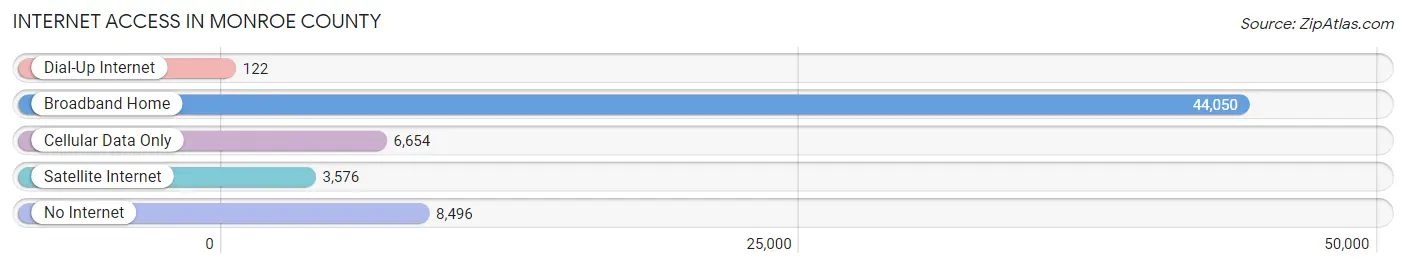
| Internet Type | # Households | % Households |
| Dial-Up Internet | 122 | 0.2% |
| Broadband Home | 44,050 | 70.8% |
| Cellular Data Only | 6,654 | 10.7% |
| Satellite Internet | 3,576 | 5.8% |
| No Internet | 8,496 | 13.7% |
| Total | 62,240 | 100.0% |
Monroe County Summary
Monroe County is located in the southeastern corner of Michigan, along the shores of Lake Erie. It is bordered by Wayne County to the north, Washtenaw County to the west, and Ohio to the south. The county seat is Monroe, and the largest city is Monroe. The county has a total area of 577 square miles, of which 545 square miles is land and 32 square miles is water.
History
Monroe County was established in 1817 and named after James Monroe, the fifth President of the United States. The county was originally part of Wayne County, but was split off in 1817. The county was initially populated by Native Americans, primarily the Potawatomi and Ottawa tribes. The first European settlers arrived in the area in the early 1800s, and the county was officially organized in 1817.
In the early 19th century, the county was largely agricultural, with the main crops being wheat, corn, and potatoes. The county also had a thriving lumber industry, with many sawmills located along the River Raisin. The county was also home to several salt mines, which were used to produce salt for the Great Lakes region.
In the late 19th century, the county began to industrialize, with the establishment of several factories and mills. The county also became a popular tourist destination, with many resorts and hotels being built along the shores of Lake Erie.
Geography
Monroe County is located in the southeastern corner of Michigan, along the shores of Lake Erie. It is bordered by Wayne County to the north, Washtenaw County to the west, and Ohio to the south. The county has a total area of 577 square miles, of which 545 square miles is land and 32 square miles is water.
The county is mostly flat, with some rolling hills in the northern part of the county. The River Raisin runs through the county, and there are several small lakes and ponds scattered throughout the county. The county is also home to several state parks, including Sterling State Park and Pointe Mouillee State Game Area.
Economy
Monroe County has a diverse economy, with a mix of manufacturing, agriculture, and tourism. The county is home to several large manufacturing companies, including La-Z-Boy, Monroe Bank & Trust, and Monroe County Community College. The county is also home to several agricultural operations, including dairy farms, fruit orchards, and vegetable farms.
Tourism is also an important part of the county’s economy, with many resorts and hotels located along the shores of Lake Erie. The county is also home to several state parks, which attract visitors from all over the region.
Demographics
As of the 2010 census, Monroe County had a population of 152,021. The racial makeup of the county was 87.3% White, 8.2% African American, 0.5% Native American, 1.2% Asian, 0.1% Pacific Islander, and 2.7% from other races. Hispanic or Latino of any race were 4.3% of the population.
The median household income in the county was $45,945, and the median family income was $54,945. The per capita income was $22,945. About 11.2% of the population was below the poverty line.
Common Questions
What is the Total Population of Monroe County?
Total Population of Monroe County is 154,823.
What is the Total Male Population of Monroe County?
Total Male Population of Monroe County is 77,273.
What is the Total Female Population of Monroe County?
Total Female Population of Monroe County is 77,550.
What is the Ratio of Males per 100 Females in Monroe County?
There are 99.64 Males per 100 Females in Monroe County.
What is the Ratio of Females per 100 Males in Monroe County?
There are 100.36 Females per 100 Males in Monroe County.
What is the Median Population Age in Monroe County?
Median Population Age in Monroe County is 42.6 Years.
What is the Average Family Size in Monroe County
Average Family Size in Monroe County is 3.0 People.
What is the Average Household Size in Monroe County
Average Household Size in Monroe County is 2.5 People.
What is Per Capita Income in Monroe County?
Per Capita income in Monroe County is $37,704.
What is the Median Family Income in Monroe County?
Median Family Income in Monroe County is $90,396.
What is the Median Household income in Monroe County?
Median Household Income in Monroe County is $72,573.
What is Income or Wage Gap in Monroe County?
Income or Wage Gap in Monroe County is 42.8%.
Women in Monroe County earn 57.2 cents for every dollar earned by a man.
What is Family Income Deficit in Monroe County?
Family Income Deficit in Monroe County is $10,772.
Families that are below poverty line in Monroe County earn $10,772 less on average than the poverty threshold level.
What is Inequality or Gini Index in Monroe County?
Inequality or Gini Index in Monroe County is 0.42.
How Large is the Labor Force in Monroe County?
There are 75,376 People in the Labor Forcein in Monroe County.
What is the Percentage of People in the Labor Force in Monroe County?
59.7% of People are in the Labor Force in Monroe County.
What is the Unemployment Rate in Monroe County?
Unemployment Rate in Monroe County is 5.7%.