Missaukee County, MI
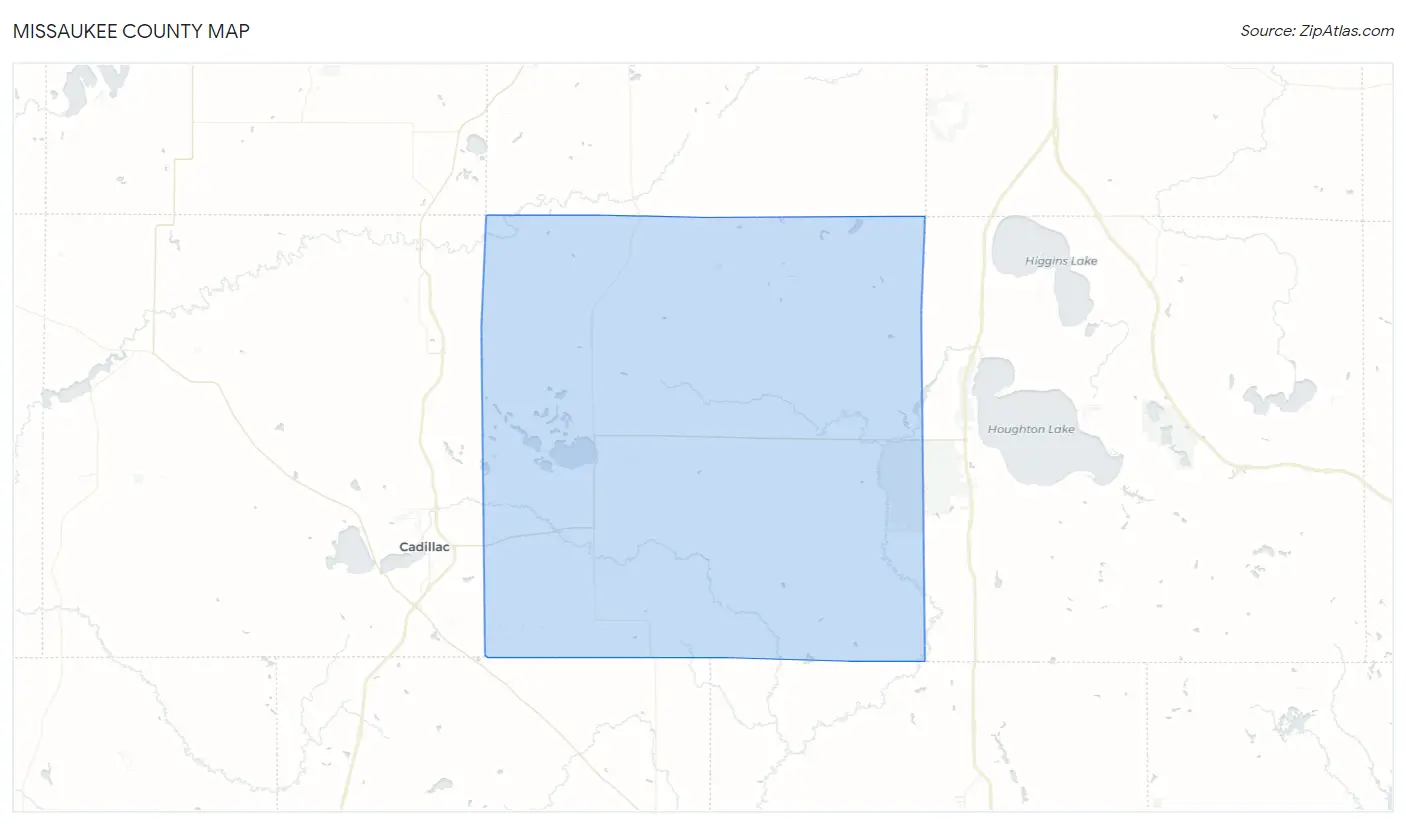
Missaukee County Map
Missaukee County Overview
15,089
TOTAL POPULATION
7,634
MALE POPULATION
7,455
FEMALE POPULATION
102.40
MALES / 100 FEMALES
97.66
FEMALES / 100 MALES
42.6
MEDIAN AGE
3.0
AVG FAMILY SIZE
2.6
AVG HOUSEHOLD SIZE
$29,386
PER CAPITA INCOME
$70,793
AVG FAMILY INCOME
$57,667
AVG HOUSEHOLD INCOME
29.5%
WAGE / INCOME GAP [ % ]
70.5¢/ $1
WAGE / INCOME GAP [ $ ]
$8,604
FAMILY INCOME DEFICIT
0.42
INEQUALITY / GINI INDEX
7,026
LABOR FORCE [ PEOPLE ]
58.0%
PERCENT IN LABOR FORCE
6.9%
UNEMPLOYMENT RATE
Missaukee County Area Codes
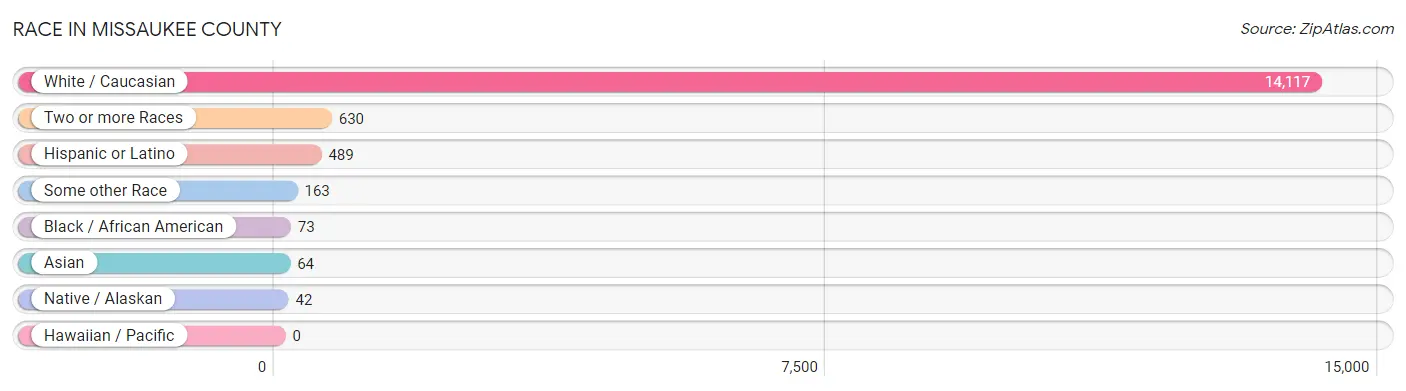
Race in Missaukee County
The most populous races in Missaukee County are White / Caucasian (14,117 | 93.6%), Two or more Races (630 | 4.2%), and Hispanic or Latino (489 | 3.2%).
| Race | # Population | % Population |
| Asian | 64 | 0.4% |
| Black / African American | 73 | 0.5% |
| Hawaiian / Pacific | 0 | 0.0% |
| Hispanic or Latino | 489 | 3.2% |
| Native / Alaskan | 42 | 0.3% |
| White / Caucasian | 14,117 | 93.6% |
| Two or more Races | 630 | 4.2% |
| Some other Race | 163 | 1.1% |
| Total | 15,089 | 100.0% |
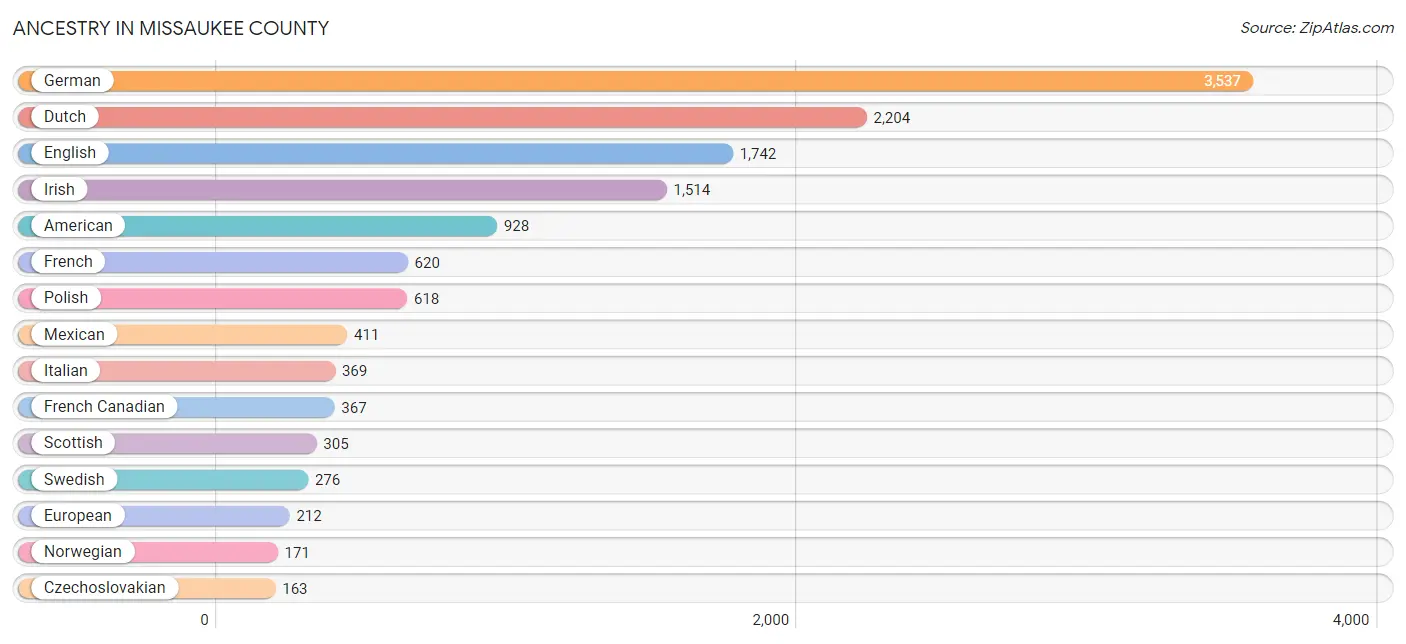
Ancestry in Missaukee County
The most populous ancestries reported in Missaukee County are German (3,537 | 23.4%), Dutch (2,204 | 14.6%), English (1,742 | 11.5%), Irish (1,514 | 10.0%), and American (928 | 6.1%), together accounting for 65.8% of all Missaukee County residents.
| Ancestry | # Population | % Population |
| Alaskan Athabascan | 3 | 0.0% |
| Albanian | 1 | 0.0% |
| American | 928 | 6.1% |
| Apache | 26 | 0.2% |
| Arab | 19 | 0.1% |
| Armenian | 11 | 0.1% |
| Austrian | 24 | 0.2% |
| Belgian | 40 | 0.3% |
| Brazilian | 22 | 0.2% |
| British | 61 | 0.4% |
| Bulgarian | 5 | 0.0% |
| Burmese | 60 | 0.4% |
| Canadian | 46 | 0.3% |
| Central American | 32 | 0.2% |
| Cherokee | 50 | 0.3% |
| Chippewa | 60 | 0.4% |
| Cree | 1 | 0.0% |
| Croatian | 19 | 0.1% |
| Czech | 40 | 0.3% |
| Czechoslovakian | 163 | 1.1% |
| Danish | 27 | 0.2% |
| Dutch | 2,204 | 14.6% |
| Eastern European | 6 | 0.0% |
| English | 1,742 | 11.5% |
| European | 212 | 1.4% |
| Finnish | 135 | 0.9% |
| French | 620 | 4.1% |
| French Canadian | 367 | 2.4% |
| German | 3,537 | 23.4% |
| Greek | 25 | 0.2% |
| Guatemalan | 32 | 0.2% |
| Hungarian | 58 | 0.4% |
| Indian (Asian) | 11 | 0.1% |
| Inupiat | 1 | 0.0% |
| Iranian | 2 | 0.0% |
| Irish | 1,514 | 10.0% |
| Iroquois | 4 | 0.0% |
| Israeli | 12 | 0.1% |
| Italian | 369 | 2.5% |
| Korean | 28 | 0.2% |
| Lebanese | 15 | 0.1% |
| Lithuanian | 26 | 0.2% |
| Macedonian | 2 | 0.0% |
| Menominee | 1 | 0.0% |
| Mexican | 411 | 2.7% |
| Navajo | 6 | 0.0% |
| Northern European | 15 | 0.1% |
| Norwegian | 171 | 1.1% |
| Ottawa | 5 | 0.0% |
| Pennsylvania German | 4 | 0.0% |
| Polish | 618 | 4.1% |
| Potawatomi | 2 | 0.0% |
| Puerto Rican | 11 | 0.1% |
| Romanian | 21 | 0.1% |
| Russian | 37 | 0.3% |
| Scandinavian | 36 | 0.2% |
| Scotch-Irish | 110 | 0.7% |
| Scottish | 305 | 2.0% |
| Serbian | 2 | 0.0% |
| Slavic | 24 | 0.2% |
| Spanish | 5 | 0.0% |
| Sri Lankan | 6 | 0.0% |
| Swedish | 276 | 1.8% |
| Swiss | 122 | 0.8% |
| Thai | 19 | 0.1% |
| Ukrainian | 28 | 0.2% |
| Welsh | 50 | 0.3% |
| Yugoslavian | 13 | 0.1% | View All 68 Rows |
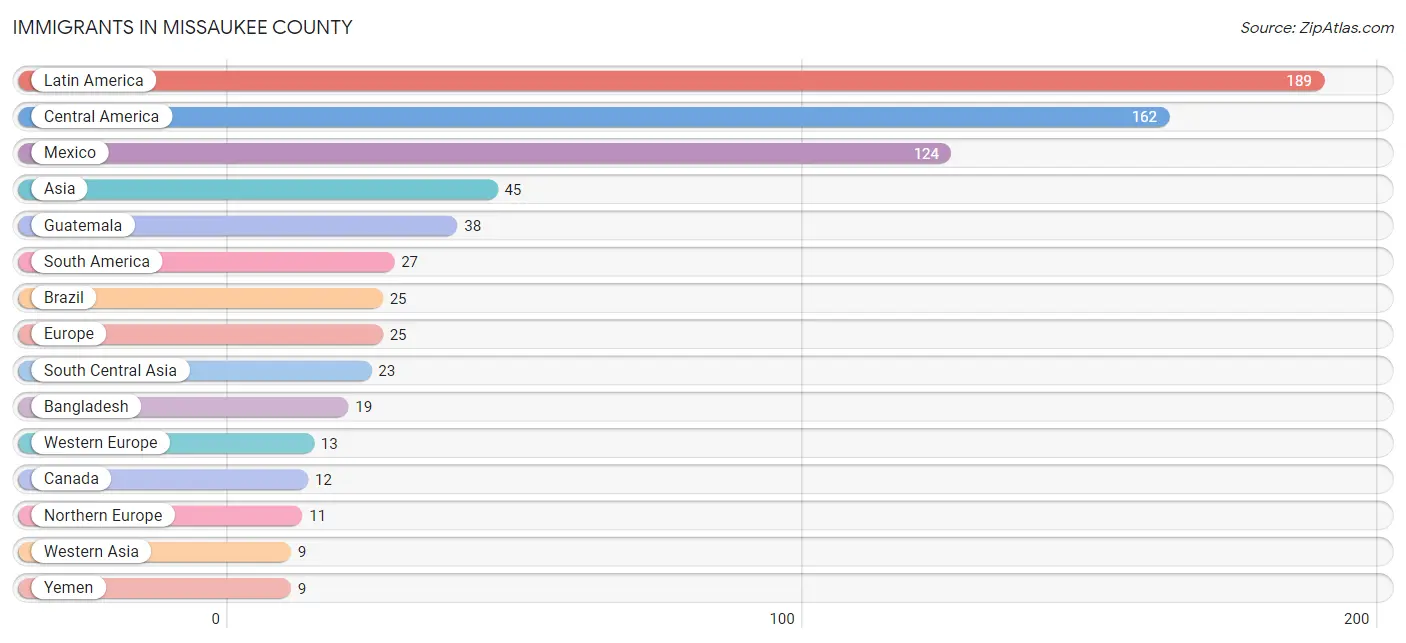
Immigrants in Missaukee County
The most numerous immigrant groups reported in Missaukee County came from Latin America (189 | 1.3%), Central America (162 | 1.1%), Mexico (124 | 0.8%), Asia (45 | 0.3%), and Guatemala (38 | 0.3%), together accounting for 3.7% of all Missaukee County residents.
| Immigration Origin | # Population | % Population |
| Argentina | 2 | 0.0% |
| Asia | 45 | 0.3% |
| Bangladesh | 19 | 0.1% |
| Brazil | 25 | 0.2% |
| Canada | 12 | 0.1% |
| Central America | 162 | 1.1% |
| Eastern Asia | 6 | 0.0% |
| Eastern Europe | 1 | 0.0% |
| England | 1 | 0.0% |
| Europe | 25 | 0.2% |
| Germany | 7 | 0.1% |
| Guatemala | 38 | 0.3% |
| Hungary | 1 | 0.0% |
| India | 4 | 0.0% |
| Indonesia | 7 | 0.1% |
| Korea | 6 | 0.0% |
| Latin America | 189 | 1.3% |
| Mexico | 124 | 0.8% |
| Netherlands | 6 | 0.0% |
| Northern Europe | 11 | 0.1% |
| Scotland | 3 | 0.0% |
| South America | 27 | 0.2% |
| South Central Asia | 23 | 0.2% |
| South Eastern Asia | 7 | 0.1% |
| Western Asia | 9 | 0.1% |
| Western Europe | 13 | 0.1% |
| Yemen | 9 | 0.1% | View All 27 Rows |
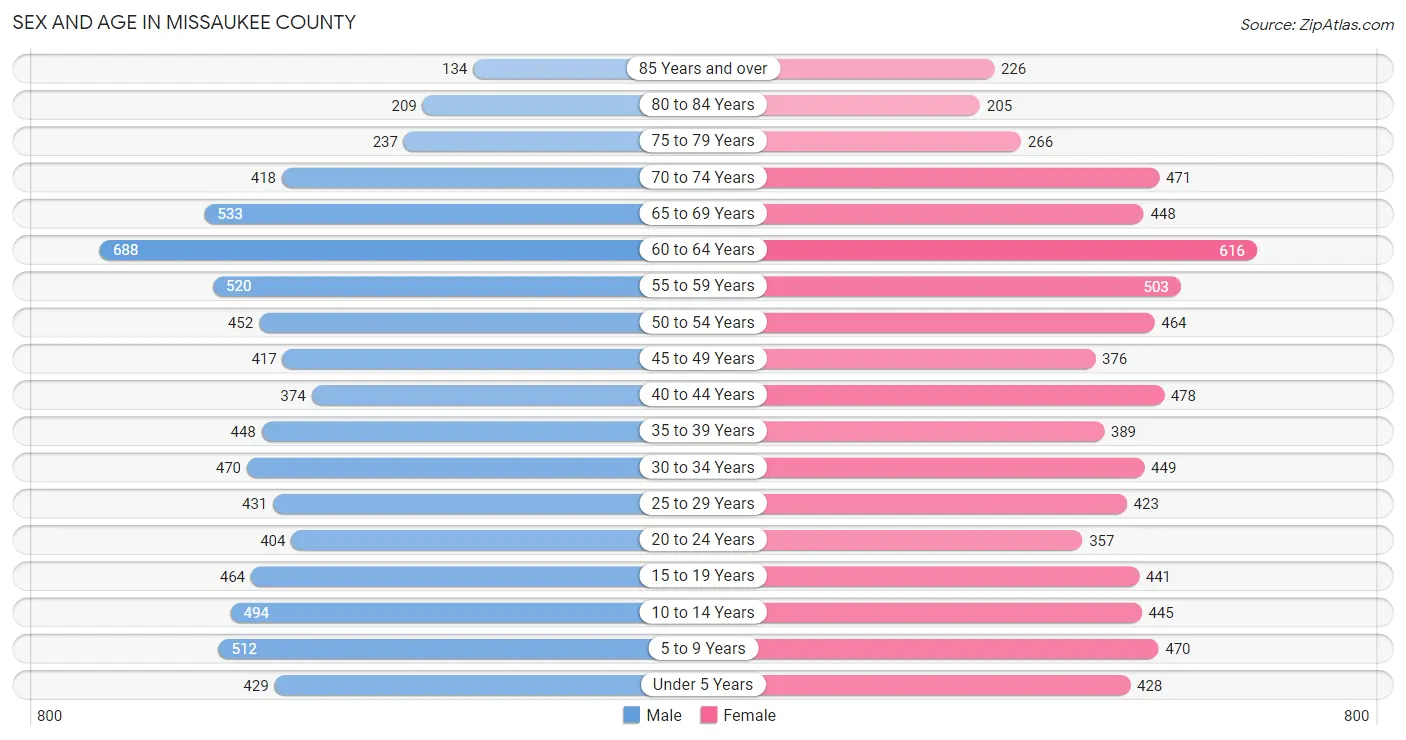
Sex and Age in Missaukee County
Sex and Age in Missaukee County
The most populous age groups in Missaukee County are 60 to 64 Years (688 | 9.0%) for men and 60 to 64 Years (616 | 8.3%) for women.
| Age Bracket | Male | Female |
| Under 5 Years | 429 (5.6%) | 428 (5.7%) |
| 5 to 9 Years | 512 (6.7%) | 470 (6.3%) |
| 10 to 14 Years | 494 (6.5%) | 445 (6.0%) |
| 15 to 19 Years | 464 (6.1%) | 441 (5.9%) |
| 20 to 24 Years | 404 (5.3%) | 357 (4.8%) |
| 25 to 29 Years | 431 (5.7%) | 423 (5.7%) |
| 30 to 34 Years | 470 (6.2%) | 449 (6.0%) |
| 35 to 39 Years | 448 (5.9%) | 389 (5.2%) |
| 40 to 44 Years | 374 (4.9%) | 478 (6.4%) |
| 45 to 49 Years | 417 (5.5%) | 376 (5.0%) |
| 50 to 54 Years | 452 (5.9%) | 464 (6.2%) |
| 55 to 59 Years | 520 (6.8%) | 503 (6.8%) |
| 60 to 64 Years | 688 (9.0%) | 616 (8.3%) |
| 65 to 69 Years | 533 (7.0%) | 448 (6.0%) |
| 70 to 74 Years | 418 (5.5%) | 471 (6.3%) |
| 75 to 79 Years | 237 (3.1%) | 266 (3.6%) |
| 80 to 84 Years | 209 (2.7%) | 205 (2.8%) |
| 85 Years and over | 134 (1.8%) | 226 (3.0%) |
| Total | 7,634 (100.0%) | 7,455 (100.0%) |
Families and Households in Missaukee County
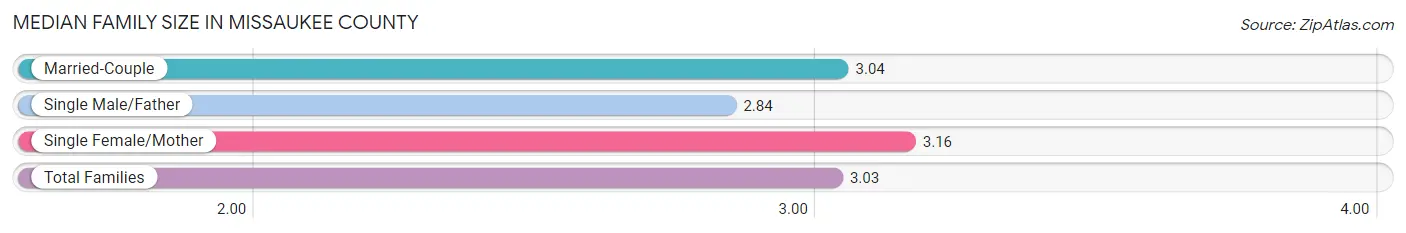
Median Family Size in Missaukee County
The median family size in Missaukee County is 3.03 persons per family, with single female/mother families (435 | 10.7%) accounting for the largest median family size of 3.16 persons per family. On the other hand, single male/father families (364 | 8.9%) represent the smallest median family size with 2.84 persons per family.
| Family Type | # Families | Family Size |
| Married-Couple | 3,271 (80.4%) | 3.04 |
| Single Male/Father | 364 (8.9%) | 2.84 |
| Single Female/Mother | 435 (10.7%) | 3.16 |
| Total Families | 4,070 (100.0%) | 3.03 |
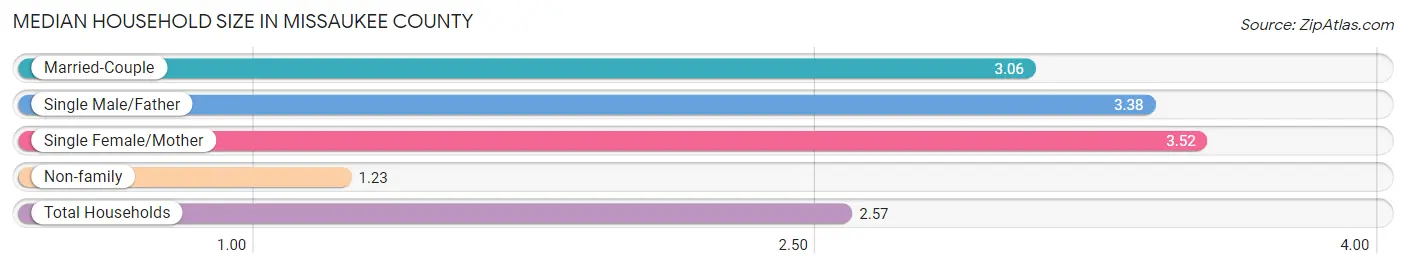
Median Household Size in Missaukee County
The median household size in Missaukee County is 2.57 persons per household, with single female/mother households (435 | 7.5%) accounting for the largest median household size of 3.52 persons per household. non-family households (1,746 | 30.0%) represent the smallest median household size with 1.23 persons per household.
| Household Type | # Households | Household Size |
| Married-Couple | 3,271 (56.2%) | 3.06 |
| Single Male/Father | 364 (6.3%) | 3.38 |
| Single Female/Mother | 435 (7.5%) | 3.52 |
| Non-family | 1,746 (30.0%) | 1.23 |
| Total Households | 5,816 (100.0%) | 2.57 |
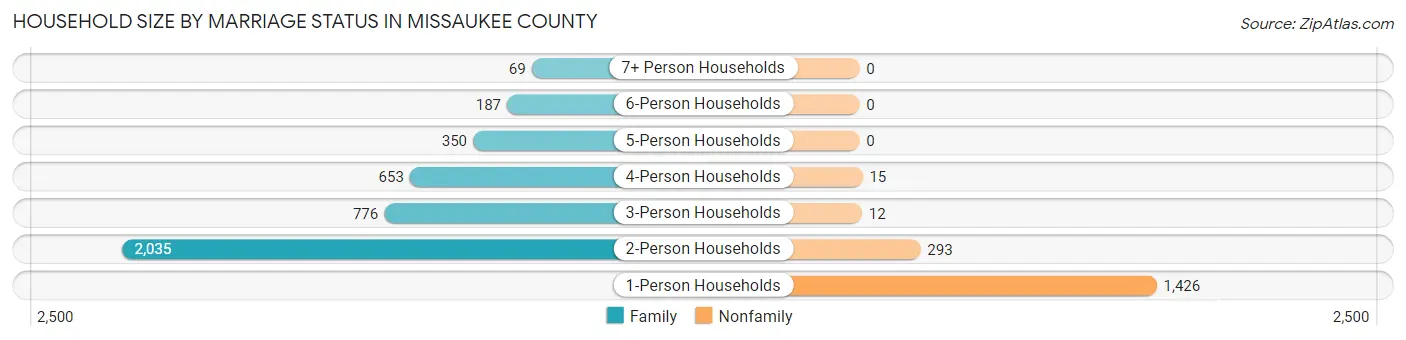
Household Size by Marriage Status in Missaukee County
Out of a total of 5,816 households in Missaukee County, 4,070 (70.0%) are family households, while 1,746 (30.0%) are nonfamily households. The most numerous type of family households are 2-person households, comprising 2,035, and the most common type of nonfamily households are 1-person households, comprising 1,426.
| Household Size | Family Households | Nonfamily Households |
| 1-Person Households | - | 1,426 (24.5%) |
| 2-Person Households | 2,035 (35.0%) | 293 (5.0%) |
| 3-Person Households | 776 (13.3%) | 12 (0.2%) |
| 4-Person Households | 653 (11.2%) | 15 (0.3%) |
| 5-Person Households | 350 (6.0%) | 0 (0.0%) |
| 6-Person Households | 187 (3.2%) | 0 (0.0%) |
| 7+ Person Households | 69 (1.2%) | 0 (0.0%) |
| Total | 4,070 (70.0%) | 1,746 (30.0%) |
Female Fertility in Missaukee County
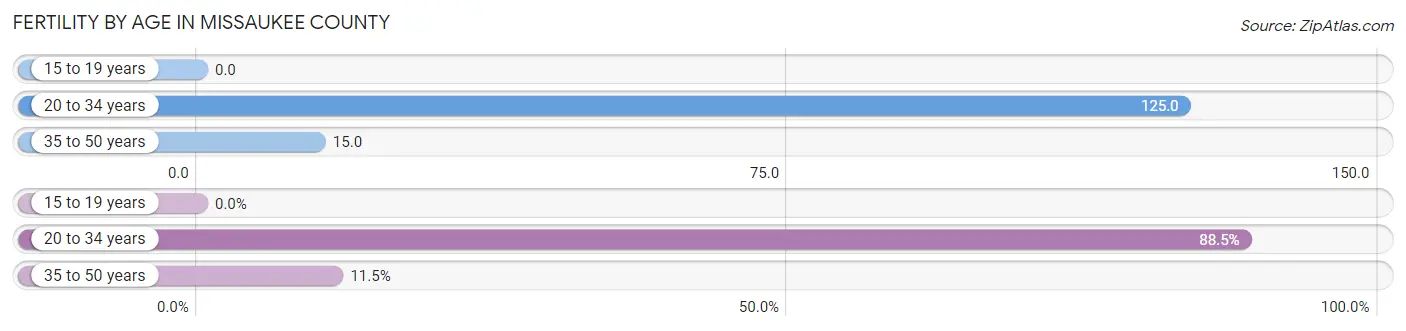
Fertility by Age in Missaukee County
Average fertility rate in Missaukee County is 58.0 births per 1,000 women. Women in the age bracket of 20 to 34 years have the highest fertility rate with 125.0 births per 1,000 women. Women in the age bracket of 20 to 34 years acount for 88.5% of all women with births.
| Age Bracket | Women with Births | Births / 1,000 Women |
| 15 to 19 years | 0 (0.0%) | 0.0 |
| 20 to 34 years | 154 (88.5%) | 125.0 |
| 35 to 50 years | 20 (11.5%) | 15.0 |
| Total | 174 (100.0%) | 58.0 |
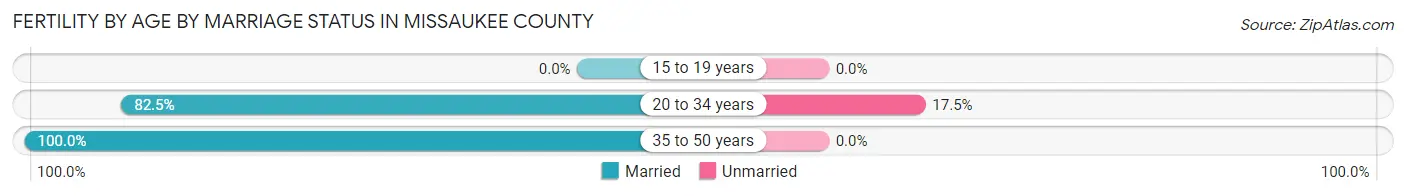
Fertility by Age by Marriage Status in Missaukee County
84.5% of women with births (174) in Missaukee County are married. The highest percentage of unmarried women with births falls into 20 to 34 years age bracket with 17.5% of them unmarried at the time of birth, while the lowest percentage of unmarried women with births belong to 35 to 50 years age bracket with 0.0% of them unmarried.
| Age Bracket | Married | Unmarried |
| 15 to 19 years | 0 (0.0%) | 0 (0.0%) |
| 20 to 34 years | 127 (82.5%) | 27 (17.5%) |
| 35 to 50 years | 20 (100.0%) | 0 (0.0%) |
| Total | 147 (84.5%) | 27 (15.5%) |
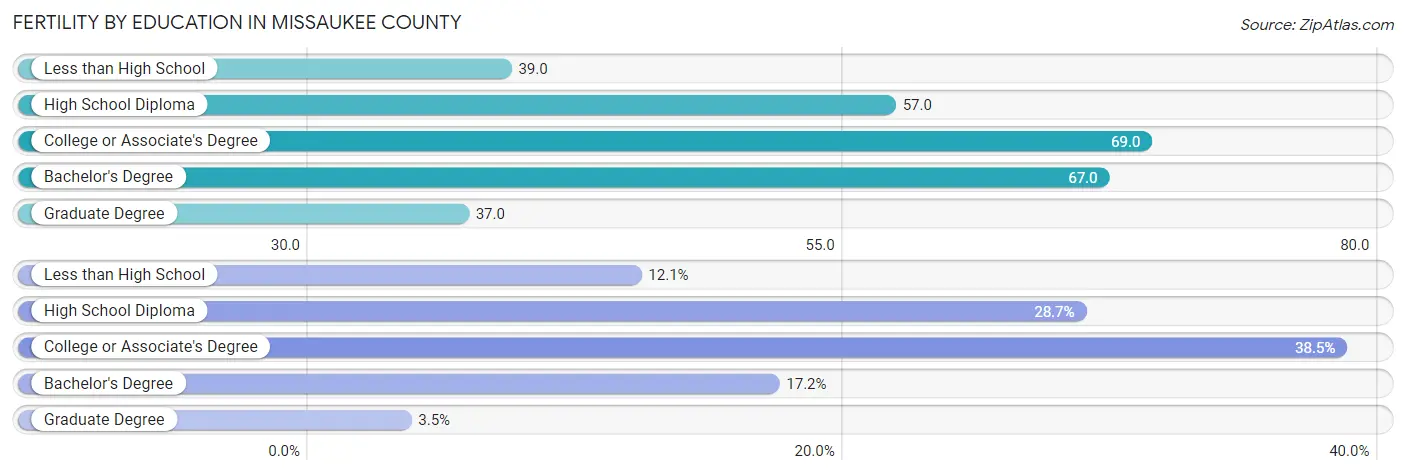
Fertility by Education in Missaukee County
Average fertility rate in Missaukee County is 58.0 births per 1,000 women. Women with the education attainment of college or associate's degree have the highest fertility rate of 69.0 births per 1,000 women, while women with the education attainment of graduate degree have the lowest fertility at 37.0 births per 1,000 women. Women with the education attainment of college or associate's degree represent 38.5% of all women with births.
| Educational Attainment | Women with Births | Births / 1,000 Women |
| Less than High School | 21 (12.1%) | 39.0 |
| High School Diploma | 50 (28.7%) | 57.0 |
| College or Associate's Degree | 67 (38.5%) | 69.0 |
| Bachelor's Degree | 30 (17.2%) | 67.0 |
| Graduate Degree | 6 (3.5%) | 37.0 |
| Total | 174 (100.0%) | 58.0 |
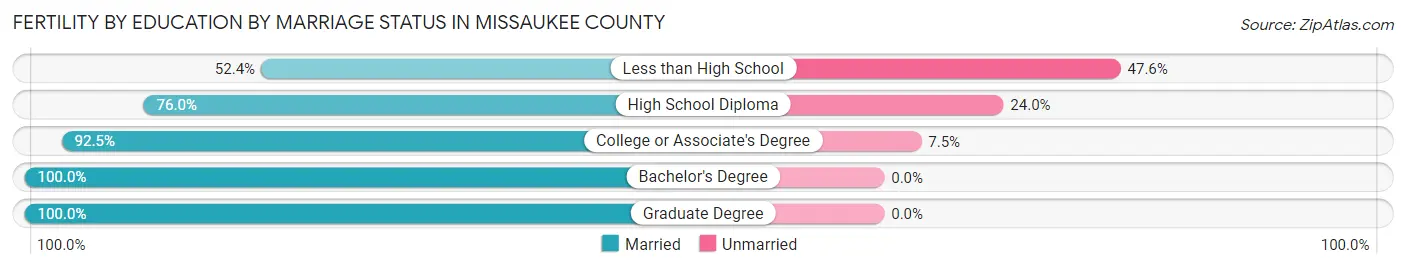
Fertility by Education by Marriage Status in Missaukee County
15.5% of women with births in Missaukee County are unmarried. Women with the educational attainment of bachelor's degree are most likely to be married with 100.0% of them married at childbirth, while women with the educational attainment of less than high school are least likely to be married with 47.6% of them unmarried at childbirth.
| Educational Attainment | Married | Unmarried |
| Less than High School | 11 (52.4%) | 10 (47.6%) |
| High School Diploma | 38 (76.0%) | 12 (24.0%) |
| College or Associate's Degree | 62 (92.5%) | 5 (7.5%) |
| Bachelor's Degree | 30 (100.0%) | 0 (0.0%) |
| Graduate Degree | 6 (100.0%) | 0 (0.0%) |
| Total | 147 (84.5%) | 27 (15.5%) |
Income in Missaukee County
Income Overview in Missaukee County
Per Capita Income in Missaukee County is $29,386, while median incomes of families and households are $70,793 and $57,667 respectively.
| Characteristic | Number | Measure |
| Per Capita Income | 15,089 | $29,386 |
| Median Family Income | 4,070 | $70,793 |
| Mean Family Income | 4,070 | $87,346 |
| Median Household Income | 5,816 | $57,667 |
| Mean Household Income | 5,816 | $74,849 |
| Income Deficit | 4,070 | $8,604 |
| Wage / Income Gap (%) | 15,089 | 29.54% |
| Wage / Income Gap ($) | 15,089 | 70.46¢ per $1 |
| Gini / Inequality Index | 15,089 | 0.42 |
Earnings by Sex in Missaukee County
Average Earnings in Missaukee County are $33,877, $40,490 for men and $28,528 for women, a difference of 29.5%.
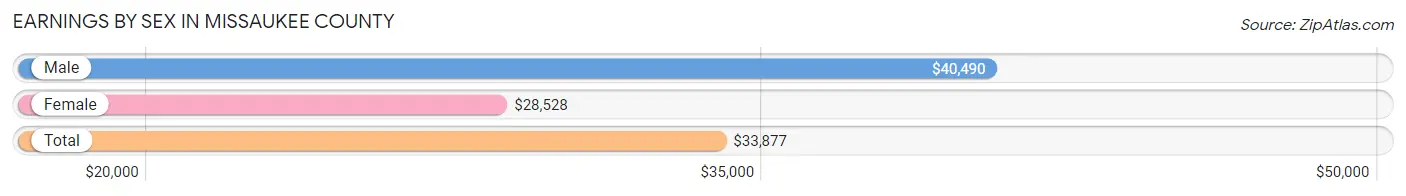
| Sex | Number | Average Earnings |
| Male | 3,920 (52.9%) | $40,490 |
| Female | 3,492 (47.1%) | $28,528 |
| Total | 7,412 (100.0%) | $33,877 |
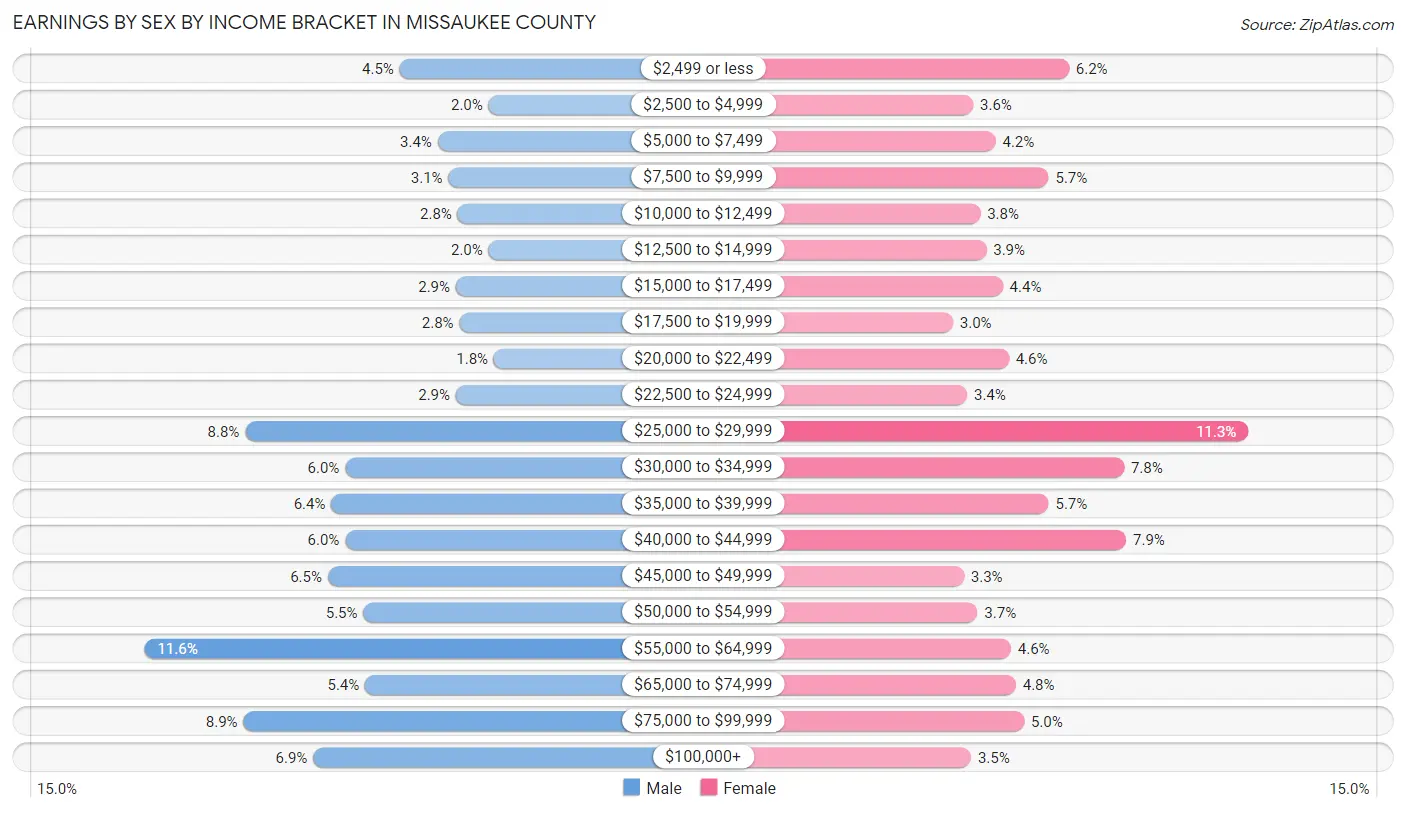
Earnings by Sex by Income Bracket in Missaukee County
The most common earnings brackets in Missaukee County are $55,000 to $64,999 for men (456 | 11.6%) and $25,000 to $29,999 for women (394 | 11.3%).
| Income | Male | Female |
| $2,499 or less | 175 (4.5%) | 218 (6.2%) |
| $2,500 to $4,999 | 77 (2.0%) | 124 (3.5%) |
| $5,000 to $7,499 | 133 (3.4%) | 146 (4.2%) |
| $7,500 to $9,999 | 121 (3.1%) | 198 (5.7%) |
| $10,000 to $12,499 | 111 (2.8%) | 131 (3.7%) |
| $12,500 to $14,999 | 77 (2.0%) | 137 (3.9%) |
| $15,000 to $17,499 | 113 (2.9%) | 153 (4.4%) |
| $17,500 to $19,999 | 109 (2.8%) | 104 (3.0%) |
| $20,000 to $22,499 | 71 (1.8%) | 159 (4.5%) |
| $22,500 to $24,999 | 113 (2.9%) | 118 (3.4%) |
| $25,000 to $29,999 | 345 (8.8%) | 394 (11.3%) |
| $30,000 to $34,999 | 235 (6.0%) | 272 (7.8%) |
| $35,000 to $39,999 | 250 (6.4%) | 198 (5.7%) |
| $40,000 to $44,999 | 235 (6.0%) | 274 (7.9%) |
| $45,000 to $49,999 | 254 (6.5%) | 115 (3.3%) |
| $50,000 to $54,999 | 215 (5.5%) | 128 (3.7%) |
| $55,000 to $64,999 | 456 (11.6%) | 161 (4.6%) |
| $65,000 to $74,999 | 213 (5.4%) | 166 (4.8%) |
| $75,000 to $99,999 | 347 (8.8%) | 174 (5.0%) |
| $100,000+ | 270 (6.9%) | 122 (3.5%) |
| Total | 3,920 (100.0%) | 3,492 (100.0%) |
Earnings by Sex by Educational Attainment in Missaukee County
Average earnings in Missaukee County are $45,226 for men and $31,058 for women, a difference of 31.3%. Men with an educational attainment of bachelor's degree enjoy the highest average annual earnings of $56,597, while those with less than high school education earn the least with $35,781. Women with an educational attainment of graduate degree earn the most with the average annual earnings of $66,500, while those with less than high school education have the smallest earnings of $17,500.

| Educational Attainment | Male Income | Female Income |
| Less than High School | $35,781 | $17,500 |
| High School Diploma | $41,130 | $23,101 |
| College or Associate's Degree | $46,207 | $29,296 |
| Bachelor's Degree | $56,597 | $52,610 |
| Graduate Degree | $56,563 | $66,500 |
| Total | $45,226 | $31,058 |
Family Income in Missaukee County
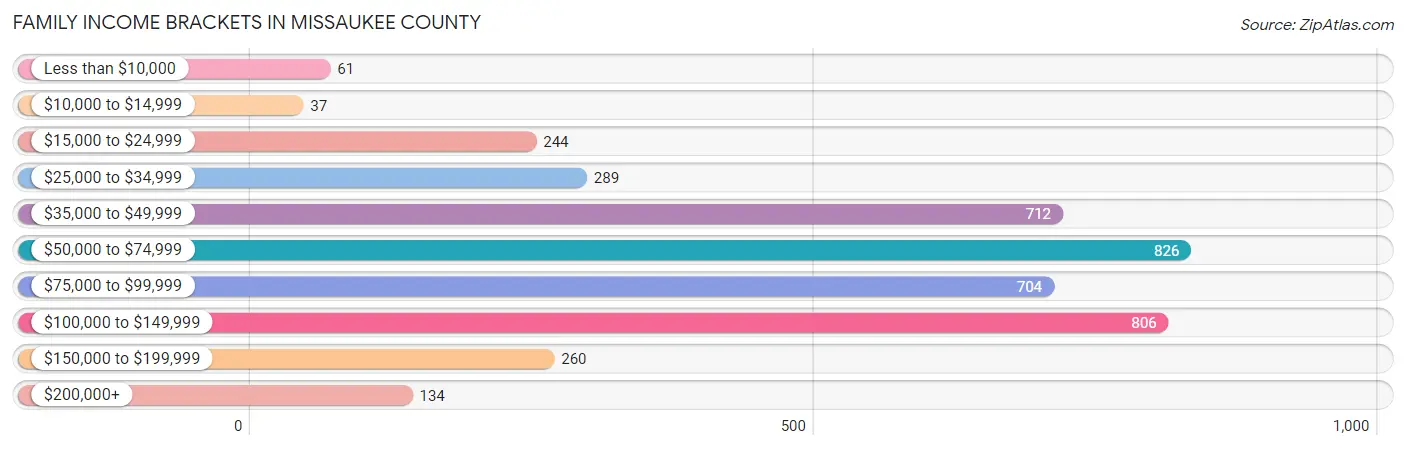
Family Income Brackets in Missaukee County
According to the Missaukee County family income data, there are 826 families falling into the $50,000 to $74,999 income range, which is the most common income bracket and makes up 20.3% of all families. Conversely, the $10,000 to $14,999 income bracket is the least frequent group with only 37 families (0.9%) belonging to this category.
| Income Bracket | # Families | % Families |
| Less than $10,000 | 61 | 1.5% |
| $10,000 to $14,999 | 37 | 0.9% |
| $15,000 to $24,999 | 244 | 6.0% |
| $25,000 to $34,999 | 289 | 7.1% |
| $35,000 to $49,999 | 712 | 17.5% |
| $50,000 to $74,999 | 826 | 20.3% |
| $75,000 to $99,999 | 704 | 17.3% |
| $100,000 to $149,999 | 806 | 19.8% |
| $150,000 to $199,999 | 260 | 6.4% |
| $200,000+ | 134 | 3.3% |
Family Income by Famaliy Size in Missaukee County
7+ person families (52 | 1.3%) account for the highest median family income in Missaukee County with $123,214 per family, while 2-person families (2,150 | 52.8%) have the highest median income of $30,190 per family member.

| Income Bracket | # Families | Median Income |
| 2-Person Families | 2,150 (52.8%) | $60,379 |
| 3-Person Families | 800 (19.7%) | $79,545 |
| 4-Person Families | 597 (14.7%) | $86,587 |
| 5-Person Families | 320 (7.9%) | $69,224 |
| 6-Person Families | 151 (3.7%) | $98,036 |
| 7+ Person Families | 52 (1.3%) | $123,214 |
| Total | 4,070 (100.0%) | $70,793 |
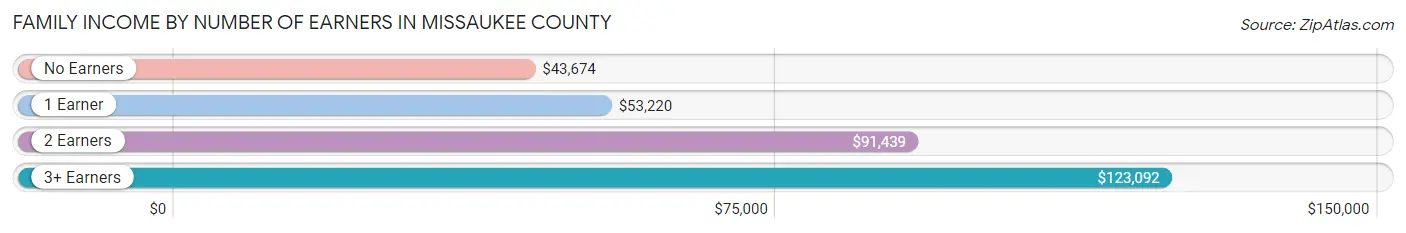
Family Income by Number of Earners in Missaukee County
The median family income in Missaukee County is $70,793, with families comprising 3+ earners (467) having the highest median family income of $123,092, while families with no earners (817) have the lowest median family income of $43,674, accounting for 11.5% and 20.1% of families, respectively.
| Number of Earners | # Families | Median Income |
| No Earners | 817 (20.1%) | $43,674 |
| 1 Earner | 1,275 (31.3%) | $53,220 |
| 2 Earners | 1,511 (37.1%) | $91,439 |
| 3+ Earners | 467 (11.5%) | $123,092 |
| Total | 4,070 (100.0%) | $70,793 |
Household Income in Missaukee County
Household Income Brackets in Missaukee County
With 1,111 households falling in the category, the $50,000 to $74,999 income range is the most frequent in Missaukee County, accounting for 19.1% of all households. In contrast, only 151 households (2.6%) fall into the $10,000 to $14,999 income bracket, making it the least populous group.

| Income Bracket | # Households | % Households |
| Less than $10,000 | 238 | 4.1% |
| $10,000 to $14,999 | 151 | 2.6% |
| $15,000 to $24,999 | 628 | 10.8% |
| $25,000 to $34,999 | 553 | 9.5% |
| $35,000 to $49,999 | 931 | 16.0% |
| $50,000 to $74,999 | 1,111 | 19.1% |
| $75,000 to $99,999 | 861 | 14.8% |
| $100,000 to $149,999 | 890 | 15.3% |
| $150,000 to $199,999 | 302 | 5.2% |
| $200,000+ | 151 | 2.6% |
Household Income by Householder Age in Missaukee County
The median household income in Missaukee County is $57,667, with the highest median household income of $71,000 found in the 25 to 44 years age bracket for the primary householder. A total of 1,534 households (26.4%) fall into this category. Meanwhile, the 65+ years age bracket for the primary householder has the lowest median household income of $42,716, with 1,893 households (32.6%) in this group.
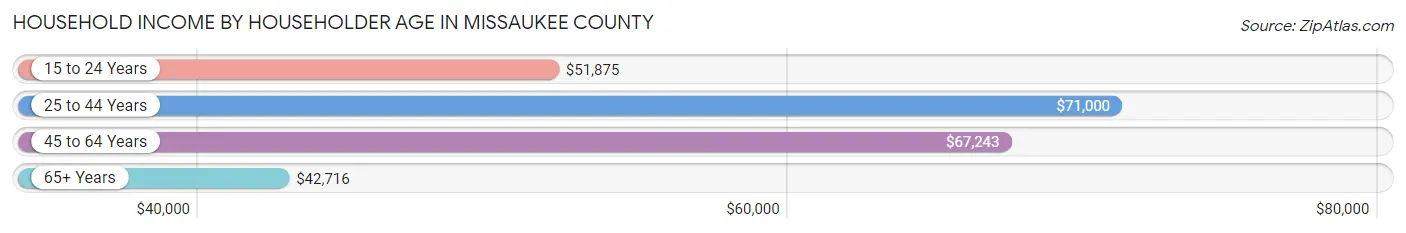
| Income Bracket | # Households | Median Income |
| 15 to 24 Years | 150 (2.6%) | $51,875 |
| 25 to 44 Years | 1,534 (26.4%) | $71,000 |
| 45 to 64 Years | 2,239 (38.5%) | $67,243 |
| 65+ Years | 1,893 (32.6%) | $42,716 |
| Total | 5,816 (100.0%) | $57,667 |
Poverty in Missaukee County
Income Below Poverty by Sex and Age in Missaukee County
With 9.0% poverty level for males and 13.4% for females among the residents of Missaukee County, 16 and 17 year old males and 18 to 24 year old females are the most vulnerable to poverty, with 45 males (24.9%) and 131 females (26.1%) in their respective age groups living below the poverty level.
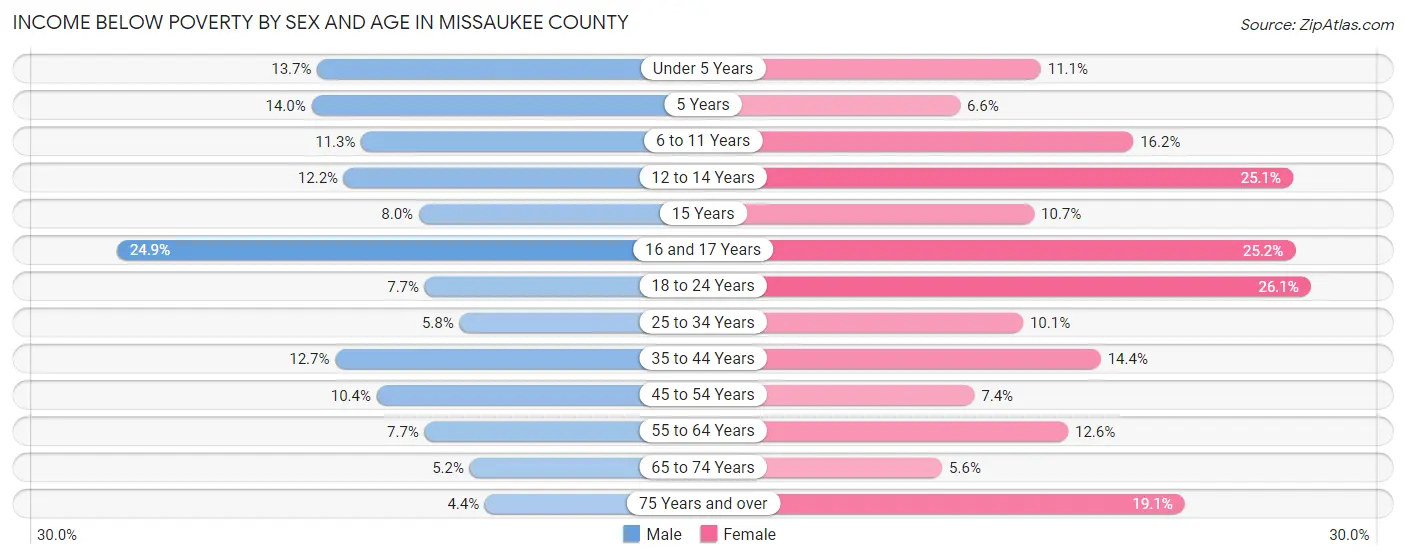
| Age Bracket | Male | Female |
| Under 5 Years | 57 (13.7%) | 46 (11.1%) |
| 5 Years | 15 (14.0%) | 5 (6.6%) |
| 6 to 11 Years | 70 (11.3%) | 98 (16.2%) |
| 12 to 14 Years | 33 (12.2%) | 59 (25.1%) |
| 15 Years | 9 (8.0%) | 9 (10.7%) |
| 16 and 17 Years | 45 (24.9%) | 53 (25.2%) |
| 18 to 24 Years | 44 (7.7%) | 131 (26.1%) |
| 25 to 34 Years | 52 (5.8%) | 88 (10.1%) |
| 35 to 44 Years | 104 (12.7%) | 125 (14.4%) |
| 45 to 54 Years | 90 (10.4%) | 62 (7.4%) |
| 55 to 64 Years | 93 (7.7%) | 141 (12.6%) |
| 65 to 74 Years | 49 (5.2%) | 51 (5.6%) |
| 75 Years and over | 25 (4.4%) | 122 (19.1%) |
| Total | 686 (9.0%) | 990 (13.4%) |
Income Above Poverty by Sex and Age in Missaukee County
According to the poverty statistics in Missaukee County, males aged 75 years and over and females aged 65 to 74 years are the age groups that are most secure financially, with 95.6% of males and 94.4% of females in these age groups living above the poverty line.

| Age Bracket | Male | Female |
| Under 5 Years | 359 (86.3%) | 369 (88.9%) |
| 5 Years | 92 (86.0%) | 71 (93.4%) |
| 6 to 11 Years | 552 (88.7%) | 506 (83.8%) |
| 12 to 14 Years | 237 (87.8%) | 176 (74.9%) |
| 15 Years | 103 (92.0%) | 75 (89.3%) |
| 16 and 17 Years | 136 (75.1%) | 157 (74.8%) |
| 18 to 24 Years | 527 (92.3%) | 371 (73.9%) |
| 25 to 34 Years | 848 (94.2%) | 784 (89.9%) |
| 35 to 44 Years | 715 (87.3%) | 742 (85.6%) |
| 45 to 54 Years | 776 (89.6%) | 778 (92.6%) |
| 55 to 64 Years | 1,112 (92.3%) | 978 (87.4%) |
| 65 to 74 Years | 891 (94.8%) | 862 (94.4%) |
| 75 Years and over | 549 (95.6%) | 517 (80.9%) |
| Total | 6,897 (90.9%) | 6,386 (86.6%) |
Income Below Poverty Among Married-Couple Families in Missaukee County
The poverty statistics for married-couple families in Missaukee County show that 2.8% or 90 of the total 3,271 families live below the poverty line. Families with 1 or 2 children have the highest poverty rate of 4.6%, comprising of 36 families. On the other hand, families with 5 or more children have the lowest poverty rate of 0.0%, which includes 0 families.

| Children | Above Poverty | Below Poverty |
| No Children | 2,133 (97.8%) | 48 (2.2%) |
| 1 or 2 Children | 750 (95.4%) | 36 (4.6%) |
| 3 or 4 Children | 268 (97.8%) | 6 (2.2%) |
| 5 or more Children | 30 (100.0%) | 0 (0.0%) |
| Total | 3,181 (97.3%) | 90 (2.8%) |
Income Below Poverty Among Single-Parent Households in Missaukee County
According to the poverty data in Missaukee County, 7.7% or 28 single-father households and 34.3% or 149 single-mother households are living below the poverty line. Among single-father households, those with 3 or 4 children have the highest poverty rate, with 5 households (12.5%) experiencing poverty. Likewise, among single-mother households, those with 1 or 2 children have the highest poverty rate, with 74 households (44.9%) falling below the poverty line.
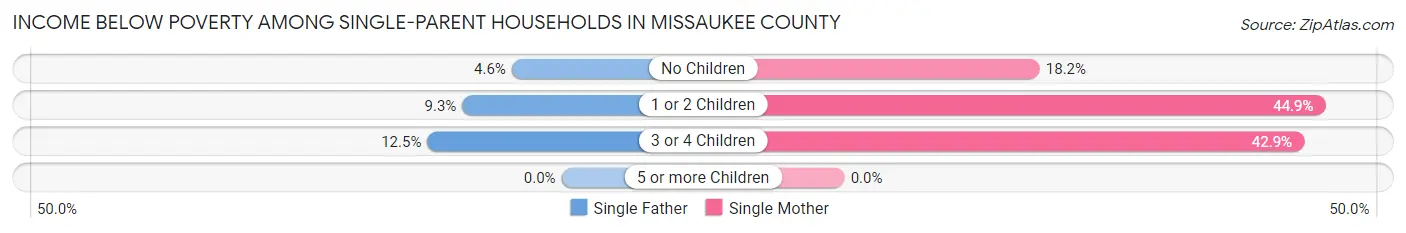
| Children | Single Father | Single Mother |
| No Children | 7 (4.6%) | 30 (18.2%) |
| 1 or 2 Children | 16 (9.2%) | 74 (44.9%) |
| 3 or 4 Children | 5 (12.5%) | 45 (42.9%) |
| 5 or more Children | 0 (0.0%) | 0 (0.0%) |
| Total | 28 (7.7%) | 149 (34.3%) |
Income Below Poverty Among Married-Couple vs Single-Parent Households in Missaukee County
The poverty data for Missaukee County shows that 90 of the married-couple family households (2.8%) and 177 of the single-parent households (22.2%) are living below the poverty level. Within the married-couple family households, those with 1 or 2 children have the highest poverty rate, with 36 households (4.6%) falling below the poverty line. Among the single-parent households, those with 3 or 4 children have the highest poverty rate, with 50 household (34.5%) living below poverty.

| Children | Married-Couple Families | Single-Parent Households |
| No Children | 48 (2.2%) | 37 (11.7%) |
| 1 or 2 Children | 36 (4.6%) | 90 (26.6%) |
| 3 or 4 Children | 6 (2.2%) | 50 (34.5%) |
| 5 or more Children | 0 (0.0%) | 0 (0.0%) |
| Total | 90 (2.8%) | 177 (22.2%) |
Employment Characteristics in Missaukee County
Employment by Class of Employer in Missaukee County
Among the 6,424 employed individuals in Missaukee County, private company employees (4,417 | 68.8%), not-for-profit organizations (517 | 8.1%), and local government employees (451 | 7.0%) make up the most common classes of employment.
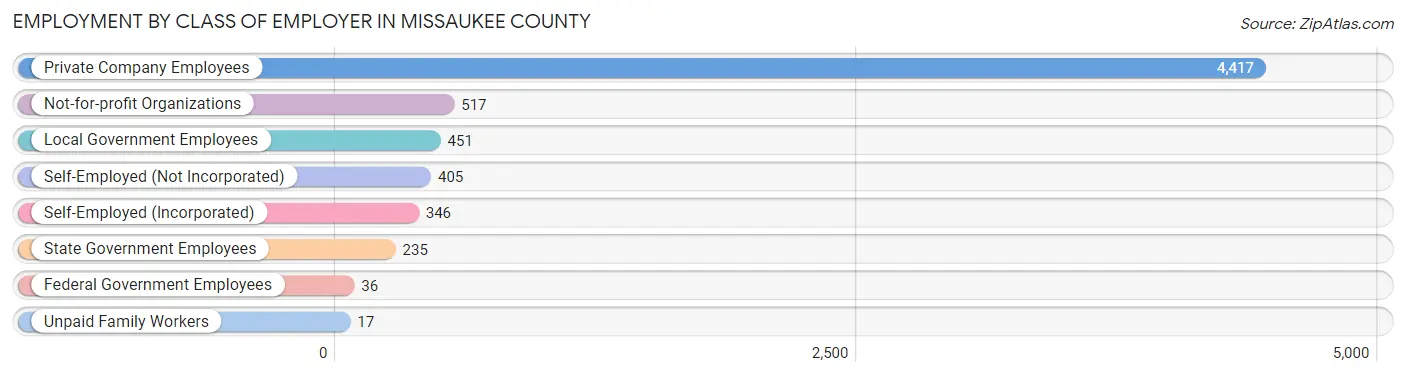
| Employer Class | # Employees | % Employees |
| Private Company Employees | 4,417 | 68.8% |
| Self-Employed (Incorporated) | 346 | 5.4% |
| Self-Employed (Not Incorporated) | 405 | 6.3% |
| Not-for-profit Organizations | 517 | 8.1% |
| Local Government Employees | 451 | 7.0% |
| State Government Employees | 235 | 3.7% |
| Federal Government Employees | 36 | 0.6% |
| Unpaid Family Workers | 17 | 0.3% |
| Total | 6,424 | 100.0% |
Employment Status by Age in Missaukee County
According to the labor force statistics for Missaukee County, out of the total population over 16 years of age (12,114), 58.0% or 7,026 individuals are in the labor force, with 6.9% or 485 of them unemployed. The age group with the highest labor force participation rate is 30 to 34 years, with 86.3% or 793 individuals in the labor force. Within the labor force, the 16 to 19 years age range has the highest percentage of unemployed individuals, with 19.4% or 67 of them being unemployed.
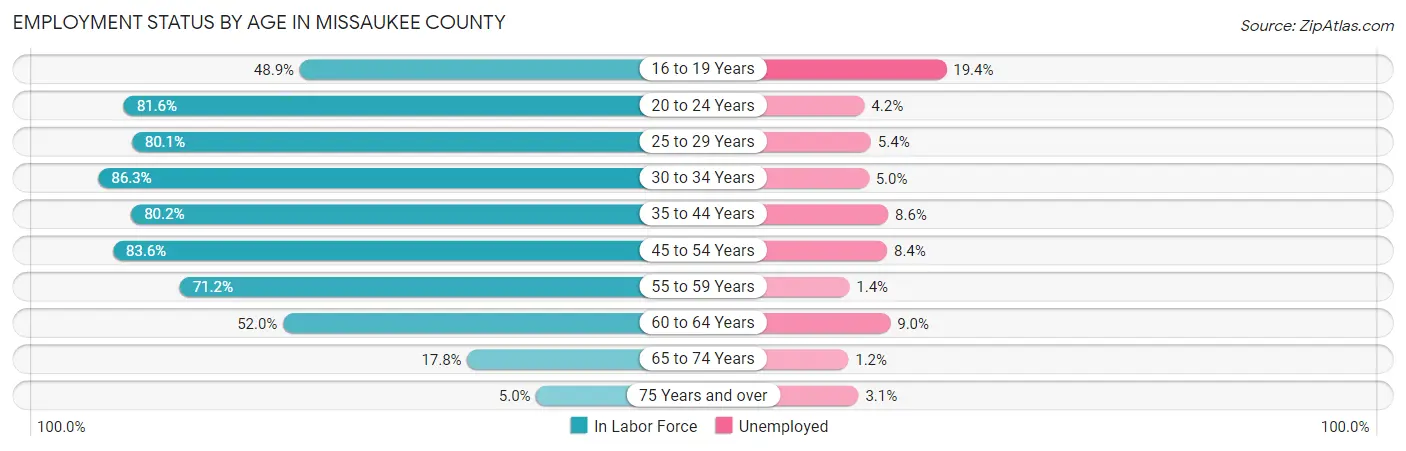
| Age Bracket | In Labor Force | Unemployed |
| 16 to 19 Years | 346 (48.9%) | 67 (19.4%) |
| 20 to 24 Years | 621 (81.6%) | 26 (4.2%) |
| 25 to 29 Years | 684 (80.1%) | 37 (5.4%) |
| 30 to 34 Years | 793 (86.3%) | 40 (5.0%) |
| 35 to 44 Years | 1,355 (80.2%) | 117 (8.6%) |
| 45 to 54 Years | 1,429 (83.6%) | 120 (8.4%) |
| 55 to 59 Years | 728 (71.2%) | 10 (1.4%) |
| 60 to 64 Years | 678 (52.0%) | 61 (9.0%) |
| 65 to 74 Years | 333 (17.8%) | 4 (1.2%) |
| 75 Years and over | 64 (5.0%) | 2 (3.1%) |
| Total | 7,026 (58.0%) | 485 (6.9%) |
Employment Status by Educational Attainment in Missaukee County
According to labor force statistics for Missaukee County, 75.6% of individuals (5,668) out of the total population between 25 and 64 years of age (7,498) are in the labor force, with 6.8% or 385 of them being unemployed. The group with the highest labor force participation rate are those with the educational attainment of bachelor's degree or higher, with 86.2% or 1,162 individuals in the labor force. Within the labor force, individuals with less than high school education have the highest percentage of unemployment, with 14.6% or 64 of them being unemployed.
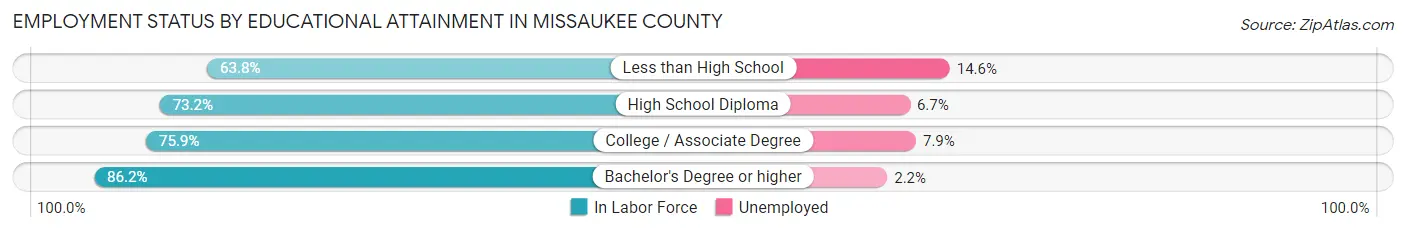
| Educational Attainment | In Labor Force | Unemployed |
| Less than High School | 439 (63.8%) | 100 (14.6%) |
| High School Diploma | 2,164 (73.2%) | 198 (6.7%) |
| College / Associate Degree | 1,902 (75.9%) | 198 (7.9%) |
| Bachelor's Degree or higher | 1,162 (86.2%) | 30 (2.2%) |
| Total | 5,668 (75.6%) | 510 (6.8%) |
Employment Occupations by Sex in Missaukee County
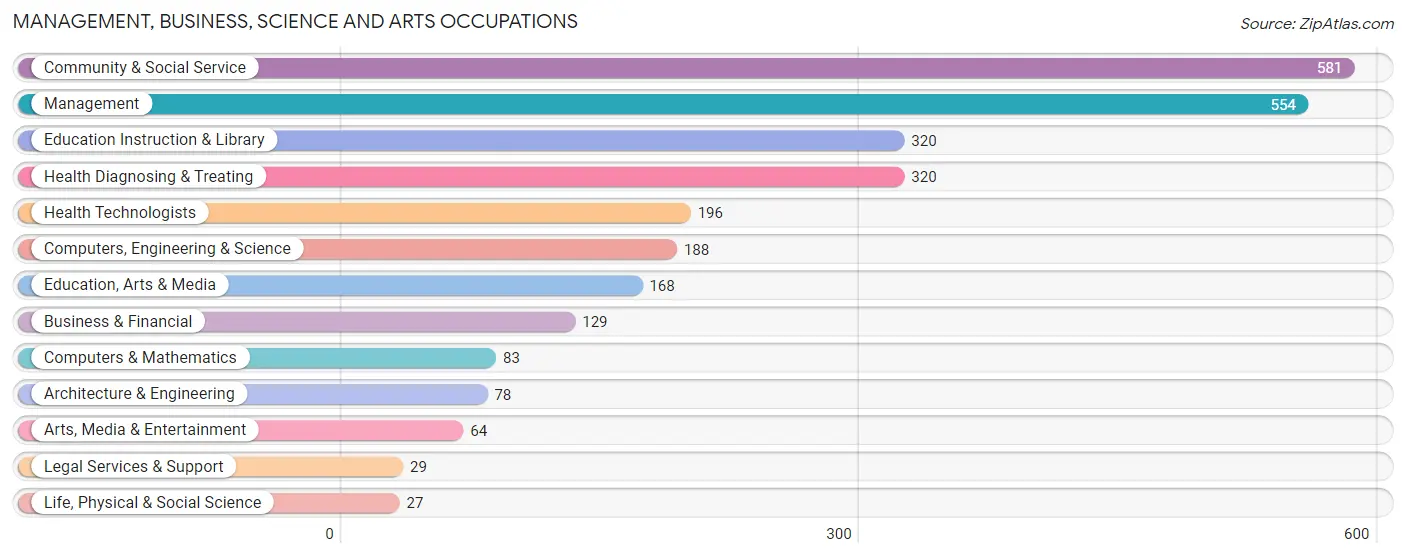
Management, Business, Science and Arts Occupations
The most common Management, Business, Science and Arts occupations in Missaukee County are Community & Social Service (581 | 8.9%), Management (554 | 8.5%), Education Instruction & Library (320 | 4.9%), Health Diagnosing & Treating (320 | 4.9%), and Health Technologists (196 | 3.0%).
Management, Business, Science and Arts Occupations by Sex
Within the Management, Business, Science and Arts occupations in Missaukee County, the most male-oriented occupations are Architecture & Engineering (84.6%), Arts, Media & Entertainment (68.8%), and Computers, Engineering & Science (61.2%), while the most female-oriented occupations are Legal Services & Support (89.7%), Health Diagnosing & Treating (85.6%), and Health Technologists (79.1%).

| Occupation | Male | Female |
| Management | 328 (59.2%) | 226 (40.8%) |
| Business & Financial | 66 (51.2%) | 63 (48.8%) |
| Computers, Engineering & Science | 115 (61.2%) | 73 (38.8%) |
| Computers & Mathematics | 34 (41.0%) | 49 (59.0%) |
| Architecture & Engineering | 66 (84.6%) | 12 (15.4%) |
| Life, Physical & Social Science | 15 (55.6%) | 12 (44.4%) |
| Community & Social Service | 169 (29.1%) | 412 (70.9%) |
| Education, Arts & Media | 45 (26.8%) | 123 (73.2%) |
| Legal Services & Support | 3 (10.3%) | 26 (89.7%) |
| Education Instruction & Library | 77 (24.1%) | 243 (75.9%) |
| Arts, Media & Entertainment | 44 (68.8%) | 20 (31.2%) |
| Health Diagnosing & Treating | 46 (14.4%) | 274 (85.6%) |
| Health Technologists | 41 (20.9%) | 155 (79.1%) |
| Total (Category) | 724 (40.9%) | 1,048 (59.1%) |
| Total (Overall) | 3,488 (53.3%) | 3,059 (46.7%) |
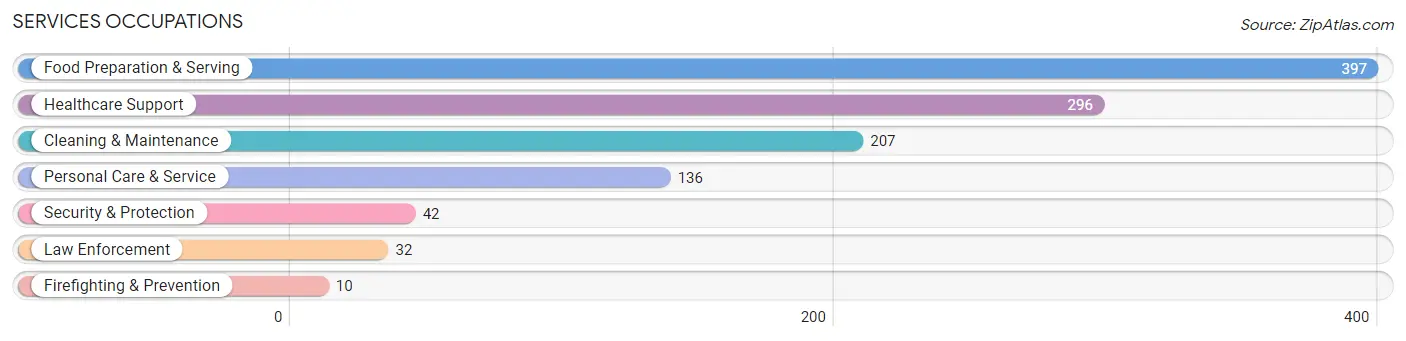
Services Occupations
The most common Services occupations in Missaukee County are Food Preparation & Serving (397 | 6.1%), Healthcare Support (296 | 4.5%), Cleaning & Maintenance (207 | 3.2%), Personal Care & Service (136 | 2.1%), and Security & Protection (42 | 0.6%).
Services Occupations by Sex
Within the Services occupations in Missaukee County, the most male-oriented occupations are Law Enforcement (100.0%), Security & Protection (90.5%), and Cleaning & Maintenance (68.6%), while the most female-oriented occupations are Healthcare Support (91.5%), Food Preparation & Serving (76.1%), and Personal Care & Service (73.5%).

| Occupation | Male | Female |
| Healthcare Support | 25 (8.5%) | 271 (91.5%) |
| Security & Protection | 38 (90.5%) | 4 (9.5%) |
| Firefighting & Prevention | 6 (60.0%) | 4 (40.0%) |
| Law Enforcement | 32 (100.0%) | 0 (0.0%) |
| Food Preparation & Serving | 95 (23.9%) | 302 (76.1%) |
| Cleaning & Maintenance | 142 (68.6%) | 65 (31.4%) |
| Personal Care & Service | 36 (26.5%) | 100 (73.5%) |
| Total (Category) | 336 (31.2%) | 742 (68.8%) |
| Total (Overall) | 3,488 (53.3%) | 3,059 (46.7%) |
Sales and Office Occupations
The most common Sales and Office occupations in Missaukee County are Office & Administration (704 | 10.7%), and Sales & Related (557 | 8.5%).
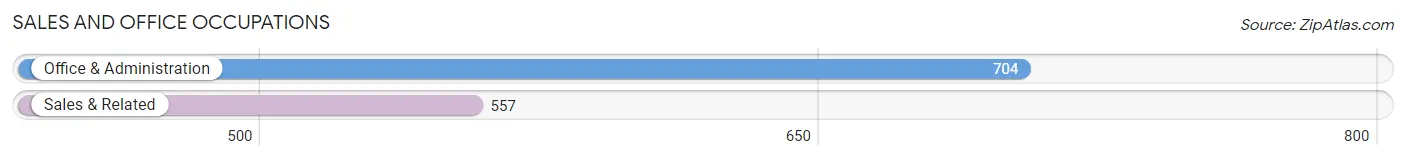
Sales and Office Occupations by Sex
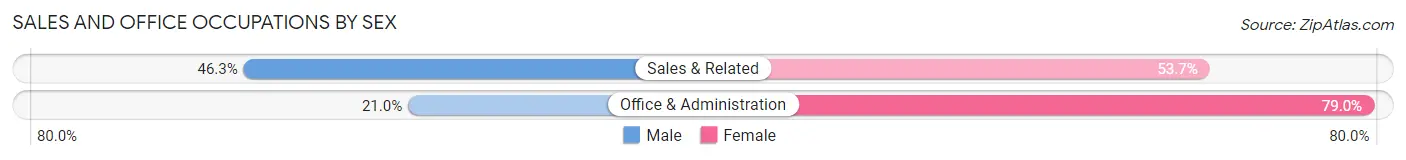
| Occupation | Male | Female |
| Sales & Related | 258 (46.3%) | 299 (53.7%) |
| Office & Administration | 148 (21.0%) | 556 (79.0%) |
| Total (Category) | 406 (32.2%) | 855 (67.8%) |
| Total (Overall) | 3,488 (53.3%) | 3,059 (46.7%) |
Natural Resources, Construction and Maintenance Occupations
The most common Natural Resources, Construction and Maintenance occupations in Missaukee County are Construction & Extraction (593 | 9.1%), Farming, Fishing & Forestry (303 | 4.6%), and Installation, Maintenance & Repair (247 | 3.8%).

Natural Resources, Construction and Maintenance Occupations by Sex
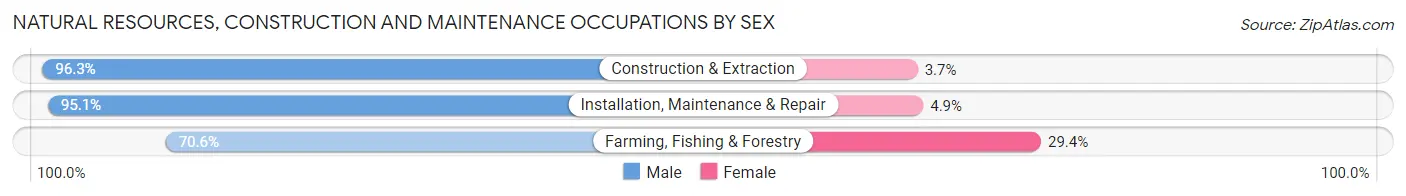
| Occupation | Male | Female |
| Farming, Fishing & Forestry | 214 (70.6%) | 89 (29.4%) |
| Construction & Extraction | 571 (96.3%) | 22 (3.7%) |
| Installation, Maintenance & Repair | 235 (95.1%) | 12 (4.9%) |
| Total (Category) | 1,020 (89.2%) | 123 (10.8%) |
| Total (Overall) | 3,488 (53.3%) | 3,059 (46.7%) |
Production, Transportation and Moving Occupations
The most common Production, Transportation and Moving occupations in Missaukee County are Production (711 | 10.9%), Transportation (323 | 4.9%), and Material Moving (259 | 4.0%).

Production, Transportation and Moving Occupations by Sex
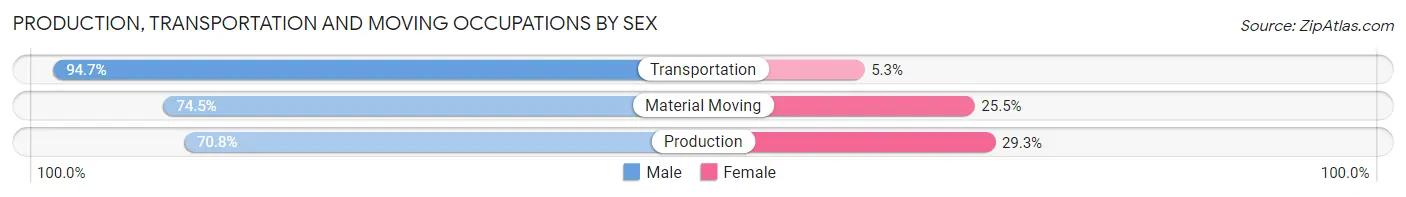
| Occupation | Male | Female |
| Production | 503 (70.8%) | 208 (29.2%) |
| Transportation | 306 (94.7%) | 17 (5.3%) |
| Material Moving | 193 (74.5%) | 66 (25.5%) |
| Total (Category) | 1,002 (77.5%) | 291 (22.5%) |
| Total (Overall) | 3,488 (53.3%) | 3,059 (46.7%) |
Employment Industries by Sex in Missaukee County
Employment Industries in Missaukee County
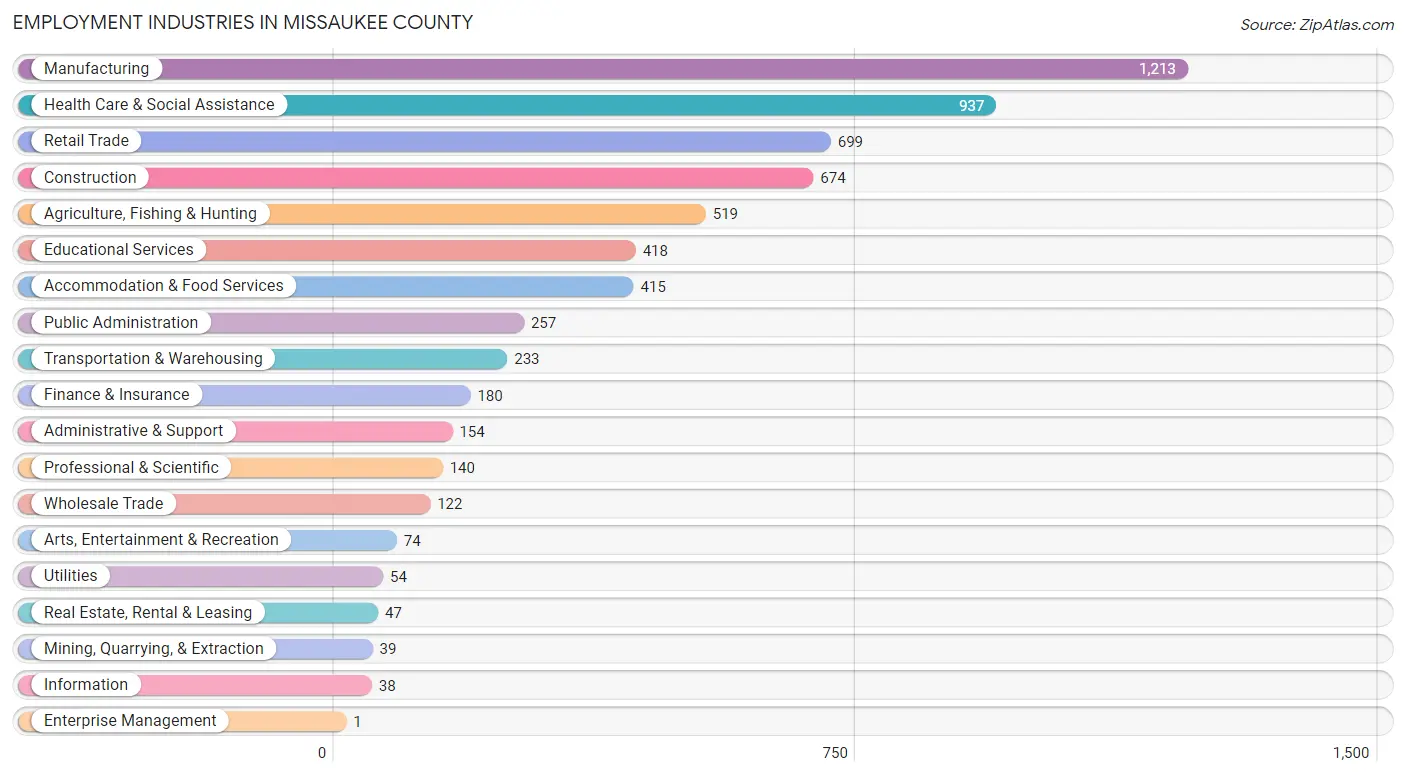
The major employment industries in Missaukee County include Manufacturing (1,213 | 18.5%), Health Care & Social Assistance (937 | 14.3%), Retail Trade (699 | 10.7%), Construction (674 | 10.3%), and Agriculture, Fishing & Hunting (519 | 7.9%).
Employment Industries by Sex in Missaukee County
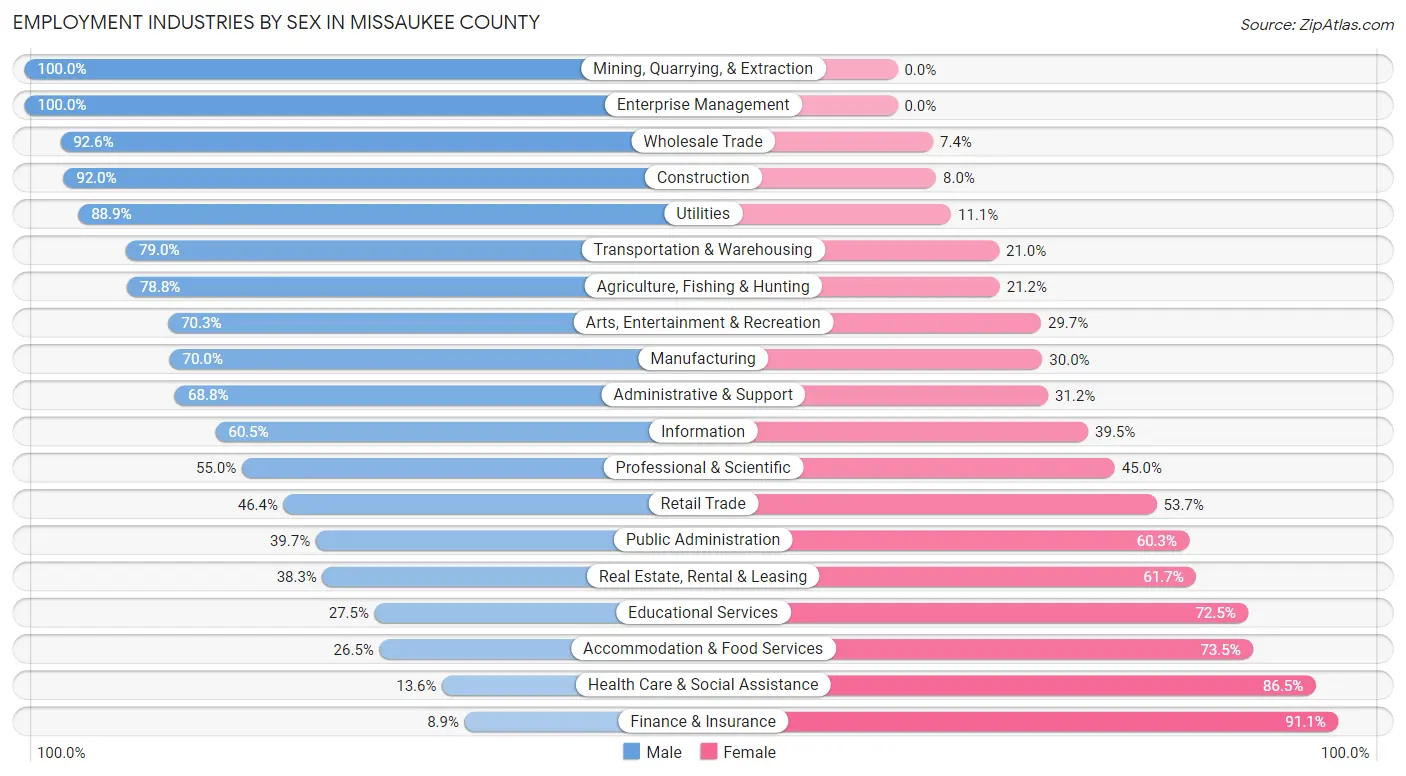
The Missaukee County industries that see more men than women are Mining, Quarrying, & Extraction (100.0%), Enterprise Management (100.0%), and Wholesale Trade (92.6%), whereas the industries that tend to have a higher number of women are Finance & Insurance (91.1%), Health Care & Social Assistance (86.5%), and Accommodation & Food Services (73.5%).
| Industry | Male | Female |
| Agriculture, Fishing & Hunting | 409 (78.8%) | 110 (21.2%) |
| Mining, Quarrying, & Extraction | 39 (100.0%) | 0 (0.0%) |
| Construction | 620 (92.0%) | 54 (8.0%) |
| Manufacturing | 849 (70.0%) | 364 (30.0%) |
| Wholesale Trade | 113 (92.6%) | 9 (7.4%) |
| Retail Trade | 324 (46.4%) | 375 (53.6%) |
| Transportation & Warehousing | 184 (79.0%) | 49 (21.0%) |
| Utilities | 48 (88.9%) | 6 (11.1%) |
| Information | 23 (60.5%) | 15 (39.5%) |
| Finance & Insurance | 16 (8.9%) | 164 (91.1%) |
| Real Estate, Rental & Leasing | 18 (38.3%) | 29 (61.7%) |
| Professional & Scientific | 77 (55.0%) | 63 (45.0%) |
| Enterprise Management | 1 (100.0%) | 0 (0.0%) |
| Administrative & Support | 106 (68.8%) | 48 (31.2%) |
| Educational Services | 115 (27.5%) | 303 (72.5%) |
| Health Care & Social Assistance | 127 (13.6%) | 810 (86.5%) |
| Arts, Entertainment & Recreation | 52 (70.3%) | 22 (29.7%) |
| Accommodation & Food Services | 110 (26.5%) | 305 (73.5%) |
| Public Administration | 102 (39.7%) | 155 (60.3%) |
| Total | 3,488 (53.3%) | 3,059 (46.7%) |
Education in Missaukee County
School Enrollment in Missaukee County
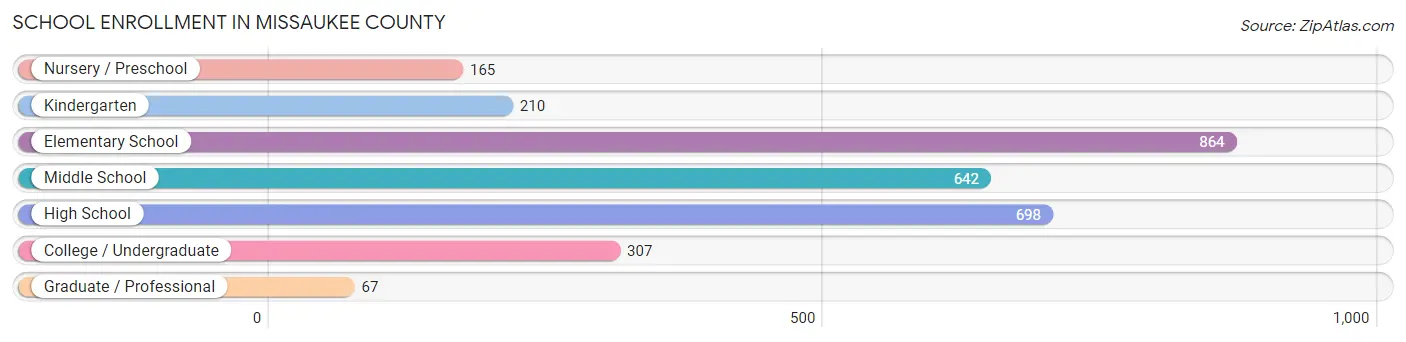
The most common levels of schooling among the 2,953 students in Missaukee County are elementary school (864 | 29.3%), high school (698 | 23.6%), and middle school (642 | 21.7%).
| School Level | # Students | % Students |
| Nursery / Preschool | 165 | 5.6% |
| Kindergarten | 210 | 7.1% |
| Elementary School | 864 | 29.3% |
| Middle School | 642 | 21.7% |
| High School | 698 | 23.6% |
| College / Undergraduate | 307 | 10.4% |
| Graduate / Professional | 67 | 2.3% |
| Total | 2,953 | 100.0% |
School Enrollment by Age by Funding Source in Missaukee County
Out of a total of 2,953 students who are enrolled in schools in Missaukee County, 434 (14.7%) attend a private institution, while the remaining 2,519 (85.3%) are enrolled in public schools. The age group of 25 to 34 year olds has the highest likelihood of being enrolled in private schools, with 54 (39.1% in the age bracket) enrolled. Conversely, the age group of 35 years and over has the lowest likelihood of being enrolled in a private school, with 82 (91.1% in the age bracket) attending a public institution.

| Age Bracket | Public School | Private School |
| 3 to 4 Year Olds | 95 (67.4%) | 46 (32.6%) |
| 5 to 9 Year Old | 839 (88.3%) | 111 (11.7%) |
| 10 to 14 Year Olds | 775 (88.6%) | 100 (11.4%) |
| 15 to 17 Year Olds | 416 (85.3%) | 72 (14.7%) |
| 18 to 19 Year Olds | 134 (84.8%) | 24 (15.2%) |
| 20 to 24 Year Olds | 93 (82.3%) | 20 (17.7%) |
| 25 to 34 Year Olds | 84 (60.9%) | 54 (39.1%) |
| 35 Years and over | 82 (91.1%) | 8 (8.9%) |
| Total | 2,519 (85.3%) | 434 (14.7%) |
Educational Attainment by Field of Study in Missaukee County
Business (446 | 22.6%), education (352 | 17.8%), science & technology (242 | 12.3%), arts & humanities (226 | 11.5%), and bio, nature & agricultural (114 | 5.8%) are the most common fields of study among 1,973 individuals in Missaukee County who have obtained a bachelor's degree or higher.

| Field of Study | # Graduates | % Graduates |
| Computers & Mathematics | 37 | 1.9% |
| Bio, Nature & Agricultural | 114 | 5.8% |
| Physical & Health Sciences | 82 | 4.2% |
| Psychology | 108 | 5.5% |
| Social Sciences | 81 | 4.1% |
| Engineering | 86 | 4.4% |
| Multidisciplinary Studies | 13 | 0.7% |
| Science & Technology | 242 | 12.3% |
| Business | 446 | 22.6% |
| Education | 352 | 17.8% |
| Literature & Languages | 49 | 2.5% |
| Liberal Arts & History | 83 | 4.2% |
| Visual & Performing Arts | 14 | 0.7% |
| Communications | 40 | 2.0% |
| Arts & Humanities | 226 | 11.5% |
| Total | 1,973 | 100.0% |
Transportation & Commute in Missaukee County
Vehicle Availability by Sex in Missaukee County
The most prevalent vehicle ownership categories in Missaukee County are males with 2 vehicles (1,580, accounting for 45.8%) and females with 2 vehicles (1,283, making up 53.2%).

| Vehicles Available | Male | Female |
| No Vehicle | 107 (3.1%) | 51 (1.7%) |
| 1 Vehicle | 512 (14.8%) | 465 (15.7%) |
| 2 Vehicles | 1,580 (45.8%) | 1,283 (43.2%) |
| 3 Vehicles | 788 (22.9%) | 728 (24.5%) |
| 4 Vehicles | 292 (8.5%) | 275 (9.3%) |
| 5 or more Vehicles | 169 (4.9%) | 167 (5.6%) |
| Total | 3,448 (100.0%) | 2,969 (100.0%) |
Commute Time in Missaukee County
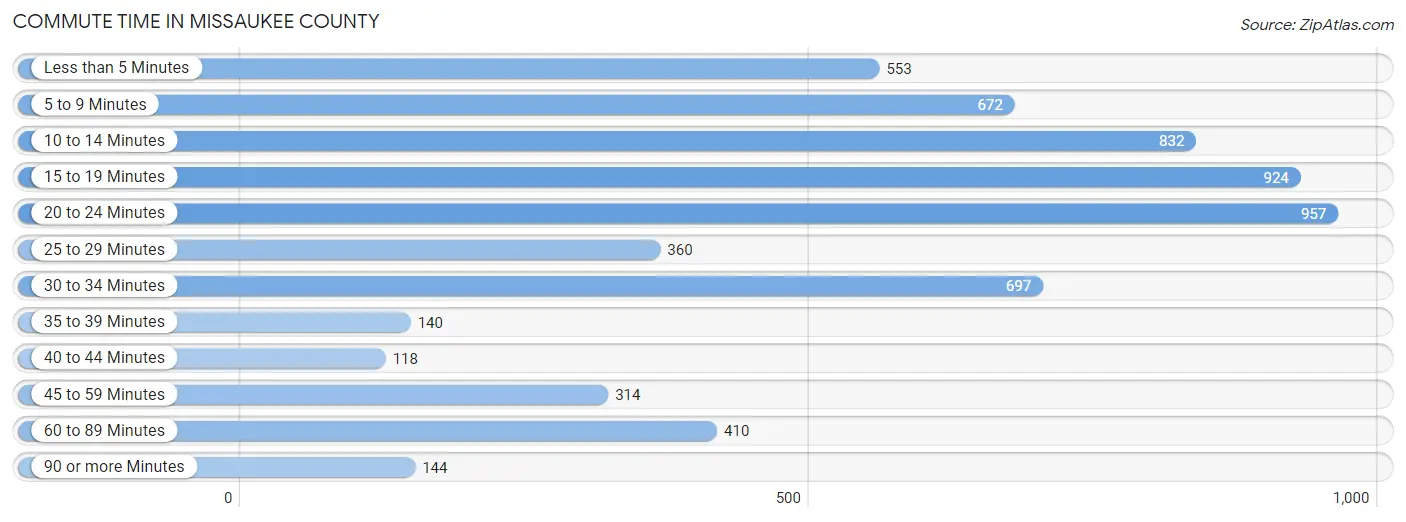
The most frequently occuring commute durations in Missaukee County are 20 to 24 minutes (957 commuters, 15.6%), 15 to 19 minutes (924 commuters, 15.1%), and 10 to 14 minutes (832 commuters, 13.6%).
| Commute Time | # Commuters | % Commuters |
| Less than 5 Minutes | 553 | 9.0% |
| 5 to 9 Minutes | 672 | 11.0% |
| 10 to 14 Minutes | 832 | 13.6% |
| 15 to 19 Minutes | 924 | 15.1% |
| 20 to 24 Minutes | 957 | 15.6% |
| 25 to 29 Minutes | 360 | 5.9% |
| 30 to 34 Minutes | 697 | 11.4% |
| 35 to 39 Minutes | 140 | 2.3% |
| 40 to 44 Minutes | 118 | 1.9% |
| 45 to 59 Minutes | 314 | 5.1% |
| 60 to 89 Minutes | 410 | 6.7% |
| 90 or more Minutes | 144 | 2.4% |
Commute Time by Sex in Missaukee County
The most common commute times in Missaukee County are 20 to 24 minutes (471 commuters, 14.2%) for males and 15 to 19 minutes (502 commuters, 17.9%) for females.
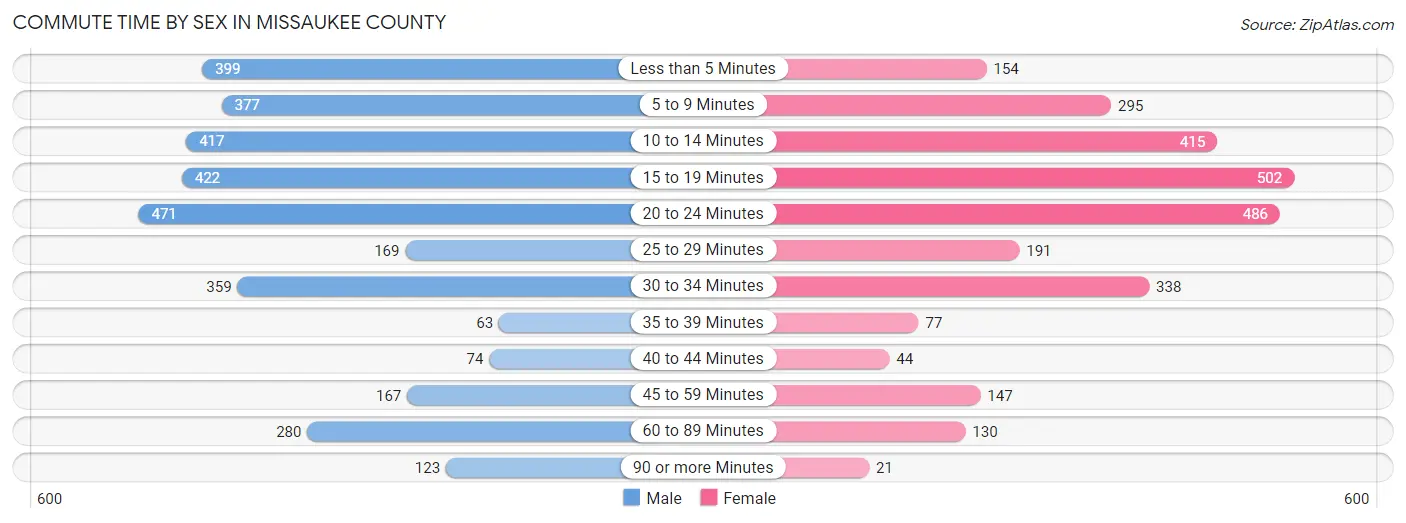
| Commute Time | Male | Female |
| Less than 5 Minutes | 399 (12.0%) | 154 (5.5%) |
| 5 to 9 Minutes | 377 (11.4%) | 295 (10.5%) |
| 10 to 14 Minutes | 417 (12.6%) | 415 (14.8%) |
| 15 to 19 Minutes | 422 (12.7%) | 502 (17.9%) |
| 20 to 24 Minutes | 471 (14.2%) | 486 (17.4%) |
| 25 to 29 Minutes | 169 (5.1%) | 191 (6.8%) |
| 30 to 34 Minutes | 359 (10.8%) | 338 (12.1%) |
| 35 to 39 Minutes | 63 (1.9%) | 77 (2.8%) |
| 40 to 44 Minutes | 74 (2.2%) | 44 (1.6%) |
| 45 to 59 Minutes | 167 (5.0%) | 147 (5.2%) |
| 60 to 89 Minutes | 280 (8.4%) | 130 (4.6%) |
| 90 or more Minutes | 123 (3.7%) | 21 (0.7%) |
Time of Departure to Work by Sex in Missaukee County
The most frequent times of departure to work in Missaukee County are 7:00 AM to 7:29 AM (505, 15.2%) for males and 7:30 AM to 7:59 AM (497, 17.7%) for females.
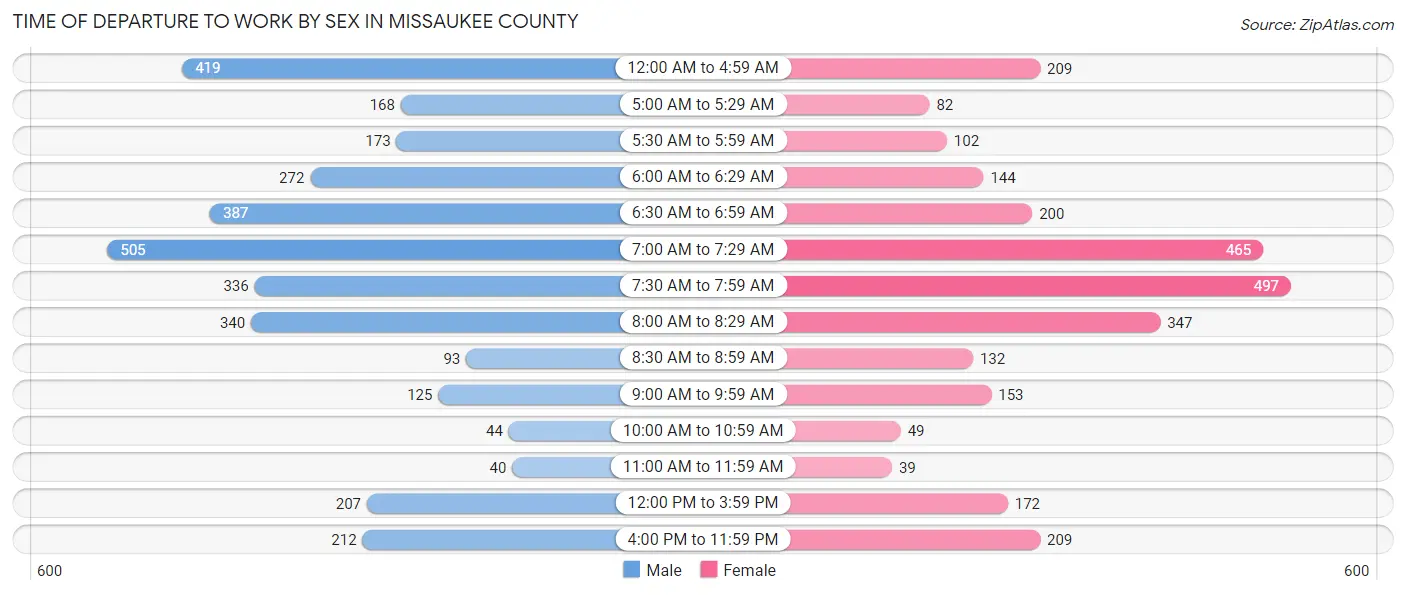
| Time of Departure | Male | Female |
| 12:00 AM to 4:59 AM | 419 (12.6%) | 209 (7.5%) |
| 5:00 AM to 5:29 AM | 168 (5.1%) | 82 (2.9%) |
| 5:30 AM to 5:59 AM | 173 (5.2%) | 102 (3.6%) |
| 6:00 AM to 6:29 AM | 272 (8.2%) | 144 (5.1%) |
| 6:30 AM to 6:59 AM | 387 (11.7%) | 200 (7.1%) |
| 7:00 AM to 7:29 AM | 505 (15.2%) | 465 (16.6%) |
| 7:30 AM to 7:59 AM | 336 (10.1%) | 497 (17.7%) |
| 8:00 AM to 8:29 AM | 340 (10.2%) | 347 (12.4%) |
| 8:30 AM to 8:59 AM | 93 (2.8%) | 132 (4.7%) |
| 9:00 AM to 9:59 AM | 125 (3.8%) | 153 (5.5%) |
| 10:00 AM to 10:59 AM | 44 (1.3%) | 49 (1.8%) |
| 11:00 AM to 11:59 AM | 40 (1.2%) | 39 (1.4%) |
| 12:00 PM to 3:59 PM | 207 (6.2%) | 172 (6.1%) |
| 4:00 PM to 11:59 PM | 212 (6.4%) | 209 (7.5%) |
| Total | 3,321 (100.0%) | 2,800 (100.0%) |
Housing Occupancy in Missaukee County
Occupancy by Ownership in Missaukee County
Of the total 5,816 dwellings in Missaukee County, owner-occupied units account for 4,710 (81.0%), while renter-occupied units make up 1,106 (19.0%).
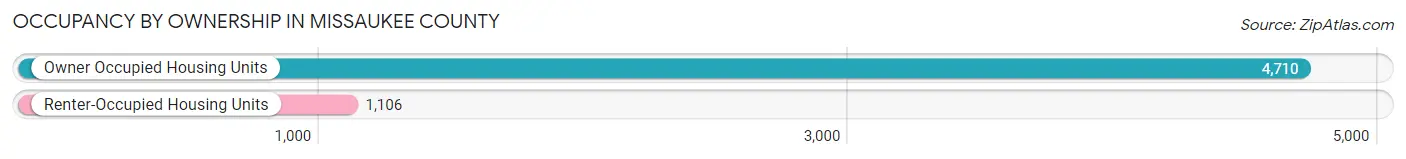
| Occupancy | # Housing Units | % Housing Units |
| Owner Occupied Housing Units | 4,710 | 81.0% |
| Renter-Occupied Housing Units | 1,106 | 19.0% |
| Total Occupied Housing Units | 5,816 | 100.0% |
Occupancy by Household Size in Missaukee County
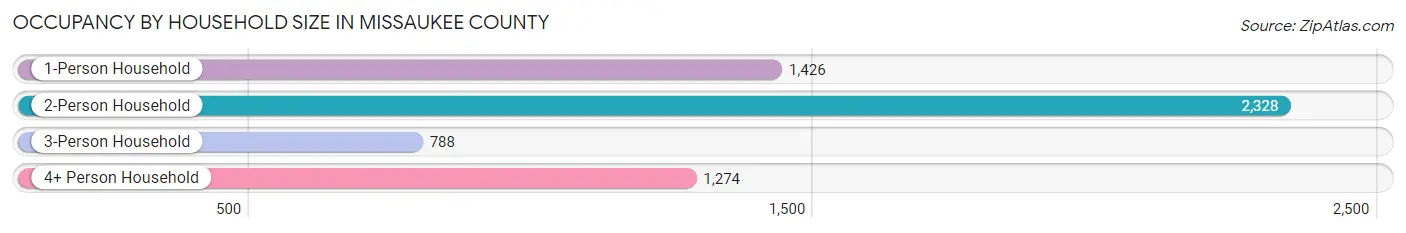
| Household Size | # Housing Units | % Housing Units |
| 1-Person Household | 1,426 | 24.5% |
| 2-Person Household | 2,328 | 40.0% |
| 3-Person Household | 788 | 13.6% |
| 4+ Person Household | 1,274 | 21.9% |
| Total Housing Units | 5,816 | 100.0% |
Occupancy by Ownership by Household Size in Missaukee County
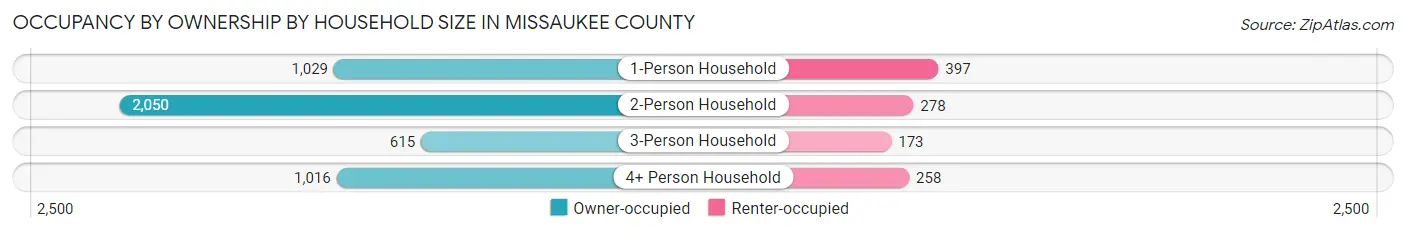
| Household Size | Owner-occupied | Renter-occupied |
| 1-Person Household | 1,029 (72.2%) | 397 (27.8%) |
| 2-Person Household | 2,050 (88.1%) | 278 (11.9%) |
| 3-Person Household | 615 (78.0%) | 173 (22.0%) |
| 4+ Person Household | 1,016 (79.7%) | 258 (20.3%) |
| Total Housing Units | 4,710 (81.0%) | 1,106 (19.0%) |
Occupancy by Educational Attainment in Missaukee County

| Household Size | Owner-occupied | Renter-occupied |
| Less than High School | 328 (74.6%) | 112 (25.5%) |
| High School Diploma | 1,803 (76.4%) | 556 (23.6%) |
| College/Associate Degree | 1,564 (81.6%) | 352 (18.4%) |
| Bachelor's Degree or higher | 1,015 (92.2%) | 86 (7.8%) |
Occupancy by Age of Householder in Missaukee County
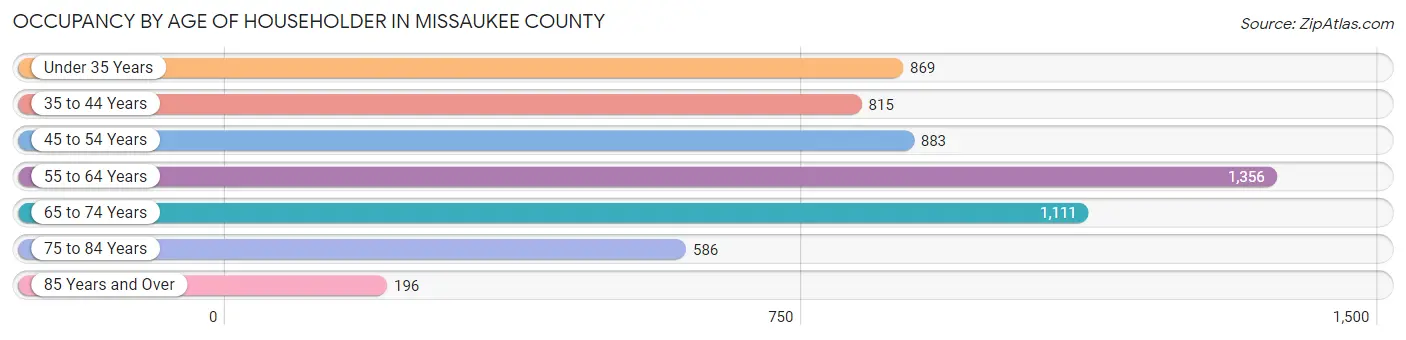
| Age Bracket | # Households | % Households |
| Under 35 Years | 869 | 14.9% |
| 35 to 44 Years | 815 | 14.0% |
| 45 to 54 Years | 883 | 15.2% |
| 55 to 64 Years | 1,356 | 23.3% |
| 65 to 74 Years | 1,111 | 19.1% |
| 75 to 84 Years | 586 | 10.1% |
| 85 Years and Over | 196 | 3.4% |
| Total | 5,816 | 100.0% |
Housing Finances in Missaukee County
Median Income by Occupancy in Missaukee County
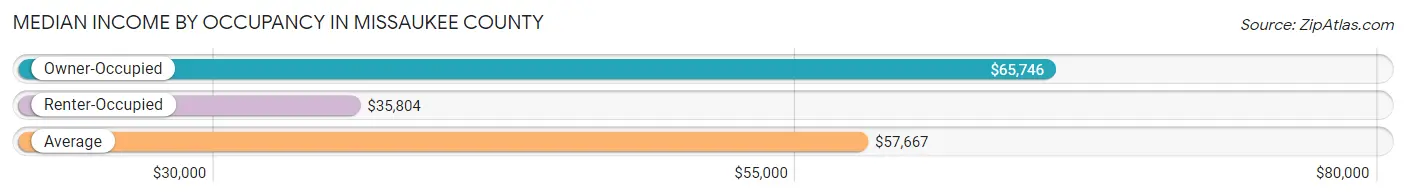
| Occupancy Type | # Households | Median Income |
| Owner-Occupied | 4,710 (81.0%) | $65,746 |
| Renter-Occupied | 1,106 (19.0%) | $35,804 |
| Average | 5,816 (100.0%) | $57,667 |
Occupancy by Householder Income Bracket in Missaukee County
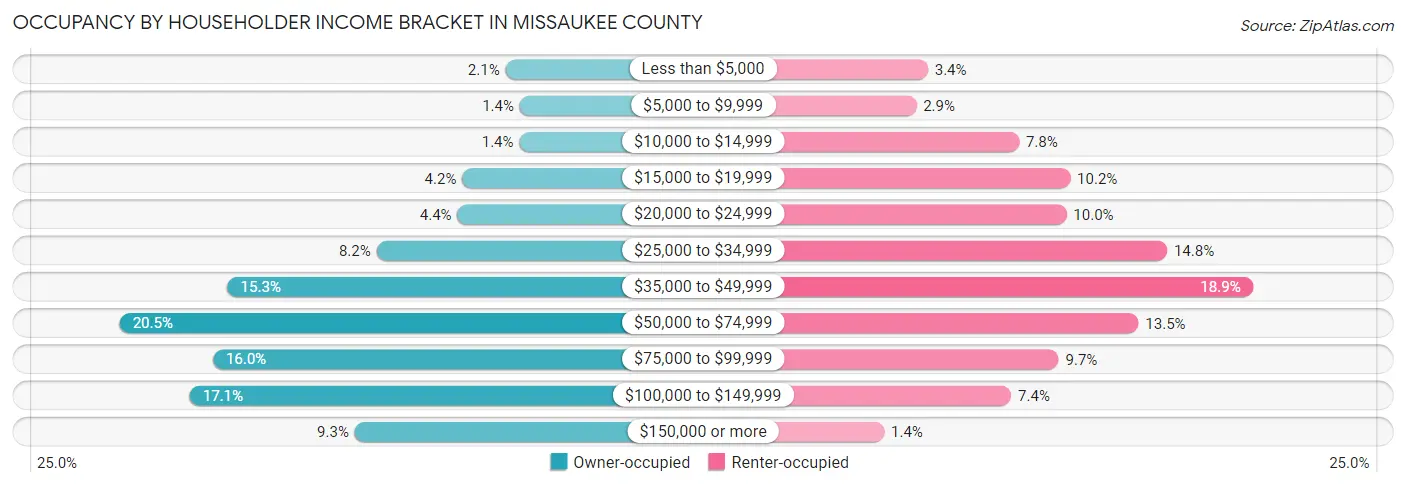
| Income Bracket | Owner-occupied | Renter-occupied |
| Less than $5,000 | 99 (2.1%) | 38 (3.4%) |
| $5,000 to $9,999 | 67 (1.4%) | 32 (2.9%) |
| $10,000 to $14,999 | 68 (1.4%) | 86 (7.8%) |
| $15,000 to $19,999 | 196 (4.2%) | 113 (10.2%) |
| $20,000 to $24,999 | 207 (4.4%) | 111 (10.0%) |
| $25,000 to $34,999 | 388 (8.2%) | 164 (14.8%) |
| $35,000 to $49,999 | 722 (15.3%) | 209 (18.9%) |
| $50,000 to $74,999 | 964 (20.5%) | 149 (13.5%) |
| $75,000 to $99,999 | 755 (16.0%) | 107 (9.7%) |
| $100,000 to $149,999 | 807 (17.1%) | 82 (7.4%) |
| $150,000 or more | 437 (9.3%) | 15 (1.4%) |
| Total | 4,710 (100.0%) | 1,106 (100.0%) |
Monthly Housing Cost Tiers in Missaukee County

| Monthly Cost | Owner-occupied | Renter-occupied |
| Less than $300 | 392 (8.3%) | 56 (5.1%) |
| $300 to $499 | 950 (20.2%) | 54 (4.9%) |
| $500 to $799 | 996 (21.1%) | 357 (32.3%) |
| $800 to $999 | 611 (13.0%) | 234 (21.2%) |
| $1,000 to $1,499 | 1,048 (22.3%) | 232 (21.0%) |
| $1,500 to $1,999 | 460 (9.8%) | 18 (1.6%) |
| $2,000 to $2,499 | 130 (2.8%) | 0 (0.0%) |
| $2,500 to $2,999 | 69 (1.5%) | 0 (0.0%) |
| $3,000 or more | 54 (1.1%) | 7 (0.6%) |
| Total | 4,710 (100.0%) | 1,106 (100.0%) |
Physical Housing Characteristics in Missaukee County
Housing Structures in Missaukee County

| Structure Type | # Housing Units | % Housing Units |
| Single Unit, Detached | 4,714 | 81.0% |
| Single Unit, Attached | 23 | 0.4% |
| 2 Unit Apartments | 48 | 0.8% |
| 3 or 4 Unit Apartments | 49 | 0.8% |
| 5 to 9 Unit Apartments | 50 | 0.9% |
| 10 or more Apartments | 92 | 1.6% |
| Mobile Home / Other | 840 | 14.4% |
| Total | 5,816 | 100.0% |
Housing Structures by Occupancy in Missaukee County

| Structure Type | Owner-occupied | Renter-occupied |
| Single Unit, Detached | 4,189 (88.9%) | 525 (11.1%) |
| Single Unit, Attached | 5 (21.7%) | 18 (78.3%) |
| 2 Unit Apartments | 9 (18.8%) | 39 (81.2%) |
| 3 or 4 Unit Apartments | 16 (32.7%) | 33 (67.3%) |
| 5 to 9 Unit Apartments | 0 (0.0%) | 50 (100.0%) |
| 10 or more Apartments | 0 (0.0%) | 92 (100.0%) |
| Mobile Home / Other | 491 (58.5%) | 349 (41.5%) |
| Total | 4,710 (81.0%) | 1,106 (19.0%) |
Housing Structures by Number of Rooms in Missaukee County
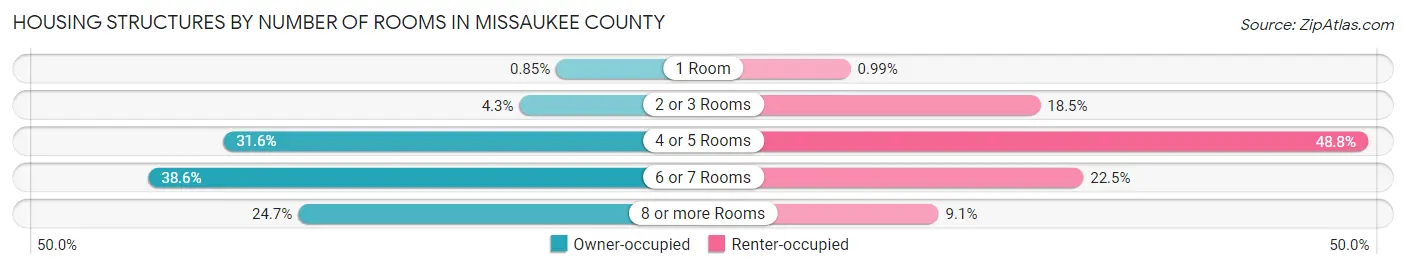
| Number of Rooms | Owner-occupied | Renter-occupied |
| 1 Room | 40 (0.9%) | 11 (1.0%) |
| 2 or 3 Rooms | 200 (4.3%) | 205 (18.5%) |
| 4 or 5 Rooms | 1,490 (31.6%) | 540 (48.8%) |
| 6 or 7 Rooms | 1,816 (38.6%) | 249 (22.5%) |
| 8 or more Rooms | 1,164 (24.7%) | 101 (9.1%) |
| Total | 4,710 (100.0%) | 1,106 (100.0%) |
Housing Structure by Heating Type in Missaukee County
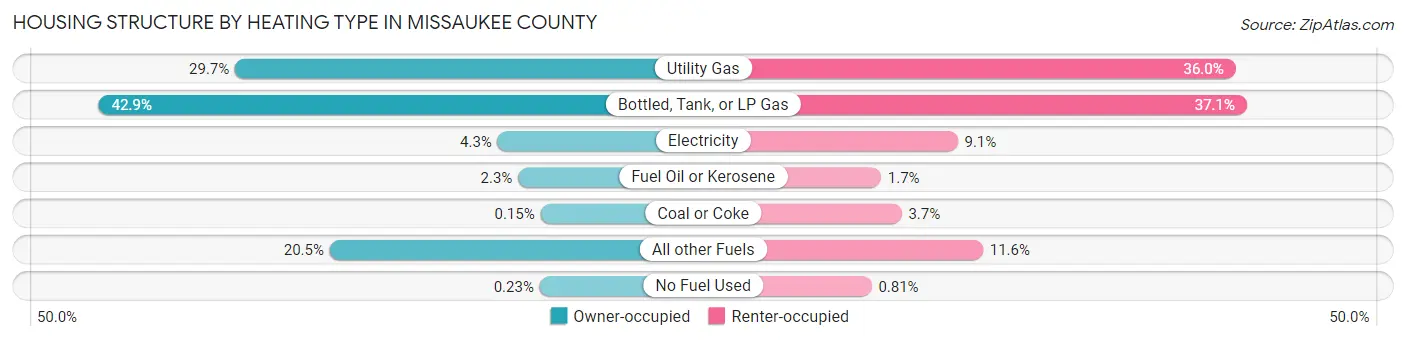
| Heating Type | Owner-occupied | Renter-occupied |
| Utility Gas | 1,397 (29.7%) | 398 (36.0%) |
| Bottled, Tank, or LP Gas | 2,018 (42.8%) | 410 (37.1%) |
| Electricity | 202 (4.3%) | 101 (9.1%) |
| Fuel Oil or Kerosene | 109 (2.3%) | 19 (1.7%) |
| Coal or Coke | 7 (0.2%) | 41 (3.7%) |
| All other Fuels | 966 (20.5%) | 128 (11.6%) |
| No Fuel Used | 11 (0.2%) | 9 (0.8%) |
| Total | 4,710 (100.0%) | 1,106 (100.0%) |
Household Vehicle Usage in Missaukee County
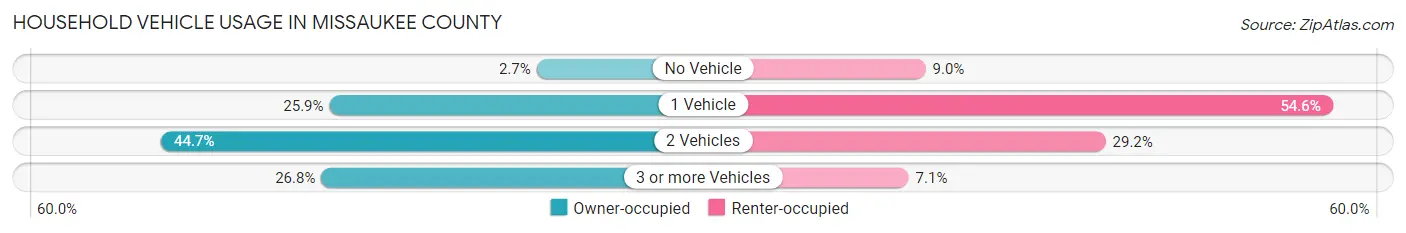
| Vehicles per Household | Owner-occupied | Renter-occupied |
| No Vehicle | 125 (2.6%) | 100 (9.0%) |
| 1 Vehicle | 1,218 (25.9%) | 604 (54.6%) |
| 2 Vehicles | 2,106 (44.7%) | 323 (29.2%) |
| 3 or more Vehicles | 1,261 (26.8%) | 79 (7.1%) |
| Total | 4,710 (100.0%) | 1,106 (100.0%) |
Real Estate & Mortgages in Missaukee County
Real Estate and Mortgage Overview in Missaukee County
| Characteristic | Without Mortgage | With Mortgage |
| Housing Units | 2,318 | 2,392 |
| Median Property Value | $135,600 | $165,400 |
| Median Household Income | $51,656 | $315 |
| Monthly Housing Costs | $462 | $54 |
| Real Estate Taxes | $1,388 | $106 |
Property Value by Mortgage Status in Missaukee County
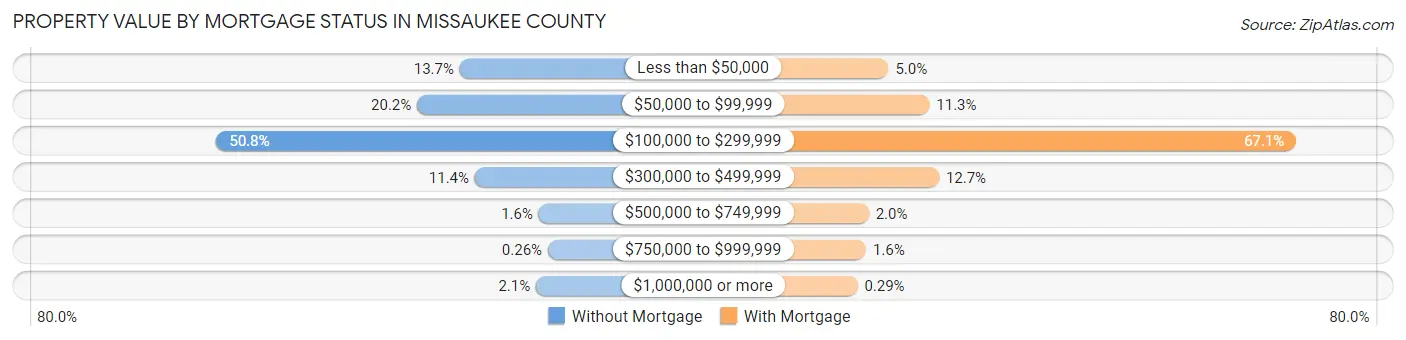
| Property Value | Without Mortgage | With Mortgage |
| Less than $50,000 | 317 (13.7%) | 120 (5.0%) |
| $50,000 to $99,999 | 468 (20.2%) | 269 (11.3%) |
| $100,000 to $299,999 | 1,177 (50.8%) | 1,606 (67.1%) |
| $300,000 to $499,999 | 264 (11.4%) | 304 (12.7%) |
| $500,000 to $749,999 | 38 (1.6%) | 48 (2.0%) |
| $750,000 to $999,999 | 6 (0.3%) | 38 (1.6%) |
| $1,000,000 or more | 48 (2.1%) | 7 (0.3%) |
| Total | 2,318 (100.0%) | 2,392 (100.0%) |
Household Income by Mortgage Status in Missaukee County

| Household Income | Without Mortgage | With Mortgage |
| Less than $10,000 | 107 (4.6%) | 41 (1.7%) |
| $10,000 to $24,999 | 350 (15.1%) | 59 (2.5%) |
| $25,000 to $34,999 | 238 (10.3%) | 121 (5.1%) |
| $35,000 to $49,999 | 413 (17.8%) | 150 (6.3%) |
| $50,000 to $74,999 | 496 (21.4%) | 309 (12.9%) |
| $75,000 to $99,999 | 322 (13.9%) | 468 (19.6%) |
| $100,000 to $149,999 | 270 (11.7%) | 433 (18.1%) |
| $150,000 or more | 122 (5.3%) | 537 (22.5%) |
| Total | 2,318 (100.0%) | 2,392 (100.0%) |
Property Value to Household Income Ratio in Missaukee County

| Value-to-Income Ratio | Without Mortgage | With Mortgage |
| Less than 2.0x | 818 (35.3%) | 80,714 (3,374.3%) |
| 2.0x to 2.9x | 543 (23.4%) | 1,104 (46.2%) |
| 3.0x to 3.9x | 266 (11.5%) | 561 (23.4%) |
| 4.0x or more | 669 (28.9%) | 232 (9.7%) |
| Total | 2,318 (100.0%) | 2,392 (100.0%) |
Real Estate Taxes by Mortgage Status in Missaukee County

| Property Taxes | Without Mortgage | With Mortgage |
| Less than $800 | 448 (19.3%) | 18 (0.7%) |
| $800 to $1,499 | 782 (33.7%) | 295 (12.3%) |
| $800 to $1,499 | 965 (41.6%) | 729 (30.5%) |
| Total | 2,318 (100.0%) | 2,392 (100.0%) |
Health & Disability in Missaukee County
Health Insurance Coverage by Age in Missaukee County
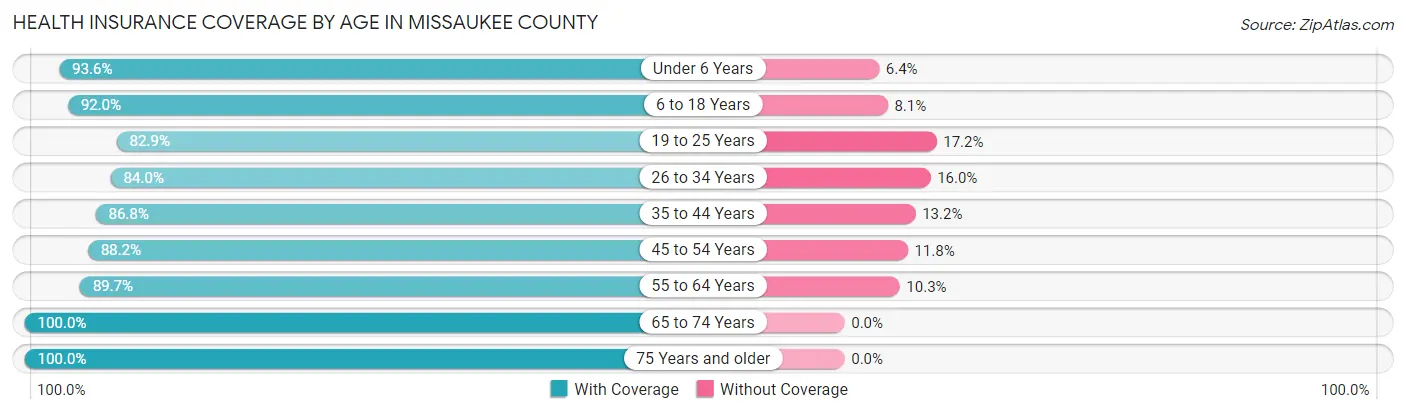
| Age Bracket | With Coverage | Without Coverage |
| Under 6 Years | 973 (93.6%) | 67 (6.4%) |
| 6 to 18 Years | 2,295 (91.9%) | 201 (8.1%) |
| 19 to 25 Years | 855 (82.9%) | 177 (17.2%) |
| 26 to 34 Years | 1,379 (84.0%) | 263 (16.0%) |
| 35 to 44 Years | 1,463 (86.8%) | 223 (13.2%) |
| 45 to 54 Years | 1,505 (88.2%) | 201 (11.8%) |
| 55 to 64 Years | 2,085 (89.7%) | 239 (10.3%) |
| 65 to 74 Years | 1,853 (100.0%) | 0 (0.0%) |
| 75 Years and older | 1,213 (100.0%) | 0 (0.0%) |
| Total | 13,621 (90.9%) | 1,371 (9.1%) |
Health Insurance Coverage by Citizenship Status in Missaukee County

| Citizenship Status | With Coverage | Without Coverage |
| Native Born | 973 (93.6%) | 67 (6.4%) |
| Foreign Born, Citizen | 2,295 (91.9%) | 201 (8.1%) |
| Foreign Born, not a Citizen | 855 (82.9%) | 177 (17.2%) |
Health Insurance Coverage by Household Income in Missaukee County

| Household Income | With Coverage | Without Coverage |
| Under $25,000 | 1,466 (92.7%) | 116 (7.3%) |
| $25,000 to $49,999 | 2,854 (90.4%) | 303 (9.6%) |
| $50,000 to $74,999 | 2,693 (88.3%) | 357 (11.7%) |
| $75,000 to $99,999 | 2,589 (91.5%) | 241 (8.5%) |
| $100,000 and over | 3,950 (91.8%) | 351 (8.2%) |
Public vs Private Health Insurance Coverage by Age in Missaukee County
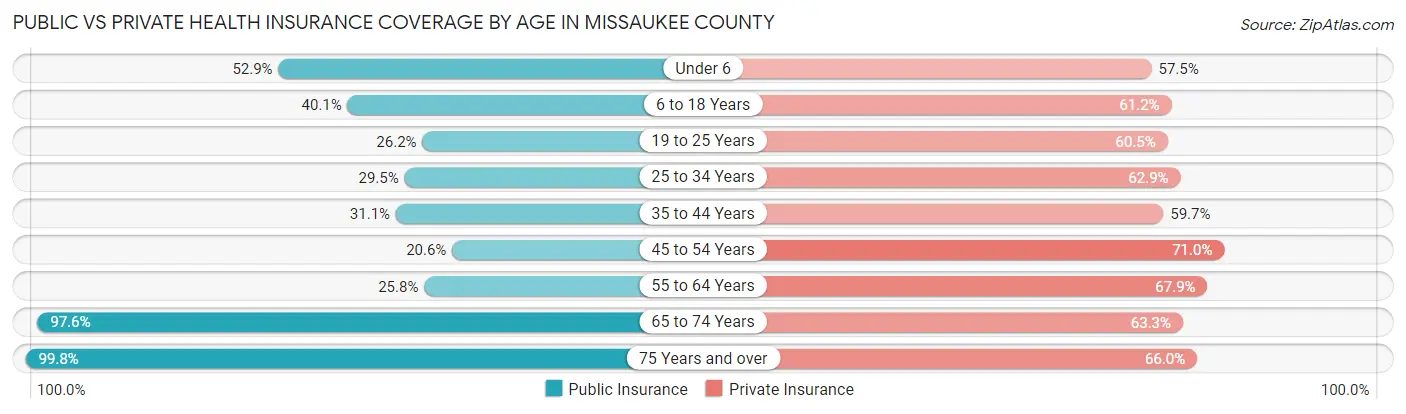
| Age Bracket | Public Insurance | Private Insurance |
| Under 6 | 550 (52.9%) | 598 (57.5%) |
| 6 to 18 Years | 1,000 (40.1%) | 1,527 (61.2%) |
| 19 to 25 Years | 270 (26.2%) | 624 (60.5%) |
| 25 to 34 Years | 484 (29.5%) | 1,032 (62.8%) |
| 35 to 44 Years | 524 (31.1%) | 1,006 (59.7%) |
| 45 to 54 Years | 352 (20.6%) | 1,211 (71.0%) |
| 55 to 64 Years | 600 (25.8%) | 1,577 (67.9%) |
| 65 to 74 Years | 1,809 (97.6%) | 1,173 (63.3%) |
| 75 Years and over | 1,211 (99.8%) | 800 (65.9%) |
| Total | 6,800 (45.4%) | 9,548 (63.7%) |
Disability Status by Sex by Age in Missaukee County
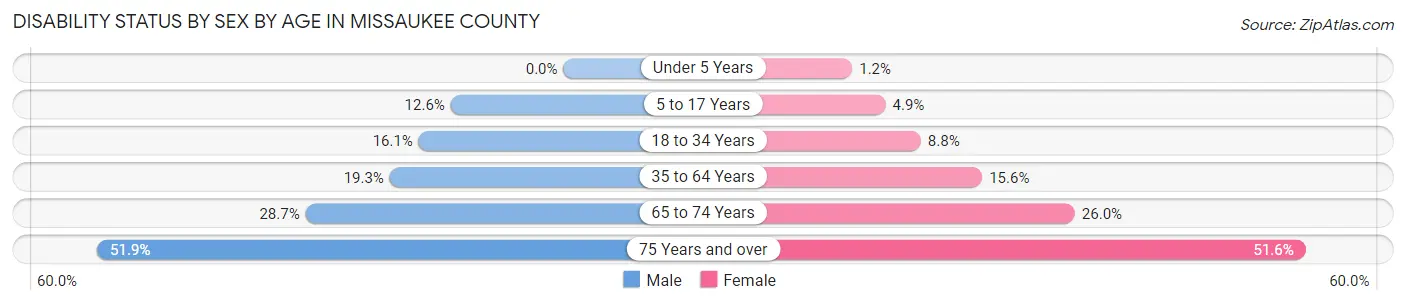
| Age Bracket | Male | Female |
| Under 5 Years | 0 (0.0%) | 5 (1.2%) |
| 5 to 17 Years | 163 (12.6%) | 59 (4.9%) |
| 18 to 34 Years | 237 (16.1%) | 121 (8.8%) |
| 35 to 64 Years | 559 (19.3%) | 442 (15.6%) |
| 65 to 74 Years | 270 (28.7%) | 237 (26.0%) |
| 75 Years and over | 298 (51.9%) | 330 (51.6%) |
Disability Class by Sex by Age in Missaukee County
Disability Class: Hearing Difficulty

| Age Bracket | Male | Female |
| Under 5 Years | 0 (0.0%) | 5 (1.2%) |
| 5 to 17 Years | 44 (3.4%) | 10 (0.8%) |
| 18 to 34 Years | 43 (2.9%) | 0 (0.0%) |
| 35 to 64 Years | 194 (6.7%) | 59 (2.1%) |
| 65 to 74 Years | 177 (18.8%) | 105 (11.5%) |
| 75 Years and over | 208 (36.2%) | 169 (26.5%) |
Disability Class: Vision Difficulty

| Age Bracket | Male | Female |
| Under 5 Years | 0 (0.0%) | 0 (0.0%) |
| 5 to 17 Years | 3 (0.2%) | 18 (1.5%) |
| 18 to 34 Years | 5 (0.3%) | 21 (1.5%) |
| 35 to 64 Years | 75 (2.6%) | 60 (2.1%) |
| 65 to 74 Years | 35 (3.7%) | 22 (2.4%) |
| 75 Years and over | 30 (5.2%) | 49 (7.7%) |
Disability Class: Cognitive Difficulty

| Age Bracket | Male | Female |
| 5 to 17 Years | 119 (9.2%) | 31 (2.6%) |
| 18 to 34 Years | 179 (12.2%) | 93 (6.8%) |
| 35 to 64 Years | 204 (7.1%) | 193 (6.8%) |
| 65 to 74 Years | 41 (4.4%) | 58 (6.4%) |
| 75 Years and over | 48 (8.4%) | 56 (8.8%) |
Disability Class: Ambulatory Difficulty

| Age Bracket | Male | Female |
| 5 to 17 Years | 11 (0.9%) | 4 (0.3%) |
| 18 to 34 Years | 33 (2.2%) | 30 (2.2%) |
| 35 to 64 Years | 261 (9.0%) | 210 (7.4%) |
| 65 to 74 Years | 105 (11.2%) | 138 (15.1%) |
| 75 Years and over | 173 (30.1%) | 182 (28.5%) |
Disability Class: Self-Care Difficulty

| Age Bracket | Male | Female |
| 5 to 17 Years | 13 (1.0%) | 0 (0.0%) |
| 18 to 34 Years | 24 (1.6%) | 20 (1.5%) |
| 35 to 64 Years | 75 (2.6%) | 70 (2.5%) |
| 65 to 74 Years | 31 (3.3%) | 54 (5.9%) |
| 75 Years and over | 108 (18.8%) | 86 (13.5%) |
Technology Access in Missaukee County
Computing Device Access in Missaukee County
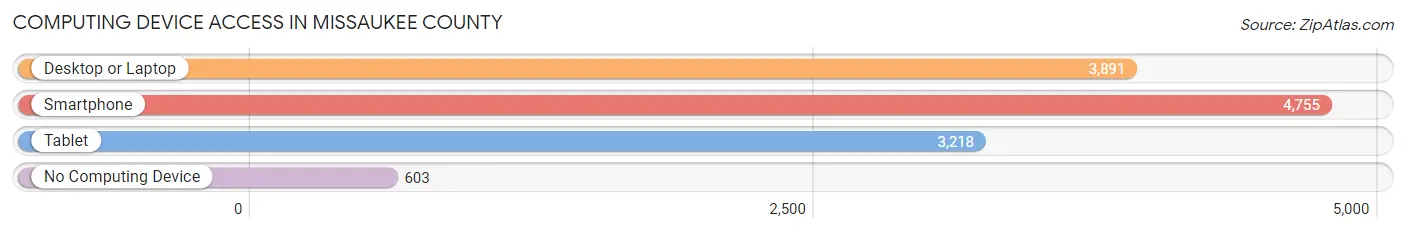
| Device Type | # Households | % Households |
| Desktop or Laptop | 3,891 | 66.9% |
| Smartphone | 4,755 | 81.8% |
| Tablet | 3,218 | 55.3% |
| No Computing Device | 603 | 10.4% |
| Total | 5,816 | 100.0% |
Internet Access in Missaukee County

| Internet Type | # Households | % Households |
| Dial-Up Internet | 27 | 0.5% |
| Broadband Home | 2,259 | 38.8% |
| Cellular Data Only | 1,853 | 31.9% |
| Satellite Internet | 795 | 13.7% |
| No Internet | 935 | 16.1% |
| Total | 5,816 | 100.0% |
Missaukee County Summary
History
Missaukee County is located in the northern part of Michigan’s Lower Peninsula. It was established in 1871 and named after the Missaukee River, which flows through the county. The county was originally inhabited by the Ojibwe people, who were later joined by French fur traders and settlers.
The first permanent settlement in the county was established in 1871, when a group of settlers from Canada arrived in the area. The settlers were attracted to the area by the abundance of timber and the potential for farming. The county was officially organized in 1873, and the first county seat was located in the town of Lake City.
In the late 19th century, the county experienced a period of rapid growth. The lumber industry was booming, and the county’s population grew from just over 1,000 in 1880 to nearly 10,000 by 1900. The county also experienced a period of industrialization, with the establishment of several factories and mills.
Geography
Missaukee County is located in the northern part of Michigan’s Lower Peninsula. It is bordered by Wexford County to the north, Osceola County to the east, Mecosta County to the south, and Lake County to the west. The county covers an area of 545 square miles and is home to several lakes, including Lake Missaukee, Lake Cadillac, and Lake Mitchell.
The terrain of the county is mostly flat, with some rolling hills in the northern part of the county. The highest point in the county is located in the town of Lake City, at an elevation of 1,092 feet. The county is also home to several rivers, including the Missaukee River, the Muskegon River, and the Pine River.
Economy
Missaukee County’s economy is largely based on agriculture and tourism. The county is home to several farms, which produce a variety of crops, including corn, soybeans, wheat, and hay. The county is also home to several wineries, which produce a variety of wines.
The county is also home to several manufacturing companies, which produce a variety of products, including furniture, automotive parts, and medical equipment. The county is also home to several retail stores, which sell a variety of goods, including clothing, electronics, and home goods.
Demographics
As of the 2010 census, Missaukee County had a population of 15,179. The population was spread out, with 51.2% of the population being female and 48.8% being male. The median age of the population was 43.7 years.
The racial makeup of the county was 95.2% White, 0.7% African American, 0.4% Native American, 0.3% Asian, 0.1% Pacific Islander, 1.7% from other races, and 1.5% from two or more races. Hispanic or Latino of any race were 3.2% of the population.
The median income for a household in the county was $41,945, and the median income for a family was $50,945. The per capita income for the county was $20,945. About 11.2% of the population was below the poverty line.
Common Questions
What is the Total Population of Missaukee County?
Total Population of Missaukee County is 15,089.
What is the Total Male Population of Missaukee County?
Total Male Population of Missaukee County is 7,634.
What is the Total Female Population of Missaukee County?
Total Female Population of Missaukee County is 7,455.
What is the Ratio of Males per 100 Females in Missaukee County?
There are 102.40 Males per 100 Females in Missaukee County.
What is the Ratio of Females per 100 Males in Missaukee County?
There are 97.66 Females per 100 Males in Missaukee County.
What is the Median Population Age in Missaukee County?
Median Population Age in Missaukee County is 42.6 Years.
What is the Average Family Size in Missaukee County
Average Family Size in Missaukee County is 3.0 People.
What is the Average Household Size in Missaukee County
Average Household Size in Missaukee County is 2.6 People.
What is Per Capita Income in Missaukee County?
Per Capita income in Missaukee County is $29,386.
What is the Median Family Income in Missaukee County?
Median Family Income in Missaukee County is $70,793.
What is the Median Household income in Missaukee County?
Median Household Income in Missaukee County is $57,667.
What is Income or Wage Gap in Missaukee County?
Income or Wage Gap in Missaukee County is 29.5%.
Women in Missaukee County earn 70.5 cents for every dollar earned by a man.
What is Family Income Deficit in Missaukee County?
Family Income Deficit in Missaukee County is $8,604.
Families that are below poverty line in Missaukee County earn $8,604 less on average than the poverty threshold level.
What is Inequality or Gini Index in Missaukee County?
Inequality or Gini Index in Missaukee County is 0.42.
How Large is the Labor Force in Missaukee County?
There are 7,026 People in the Labor Forcein in Missaukee County.
What is the Percentage of People in the Labor Force in Missaukee County?
58.0% of People are in the Labor Force in Missaukee County.
What is the Unemployment Rate in Missaukee County?
Unemployment Rate in Missaukee County is 6.9%.