Midland County, MI
Midland County Map
Midland County Overview
83,503
TOTAL POPULATION
41,623
MALE POPULATION
41,880
FEMALE POPULATION
99.39
MALES / 100 FEMALES
100.62
FEMALES / 100 MALES
41.7
MEDIAN AGE
2.9
AVG FAMILY SIZE
2.4
AVG HOUSEHOLD SIZE
$41,594
PER CAPITA INCOME
$91,778
AVG FAMILY INCOME
$73,643
AVG HOUSEHOLD INCOME
34.1%
WAGE / INCOME GAP [ % ]
65.9¢/ $1
WAGE / INCOME GAP [ $ ]
$11,878
FAMILY INCOME DEFICIT
0.46
INEQUALITY / GINI INDEX
40,263
LABOR FORCE [ PEOPLE ]
59.2%
PERCENT IN LABOR FORCE
5.0%
UNEMPLOYMENT RATE
Midland County Area Codes
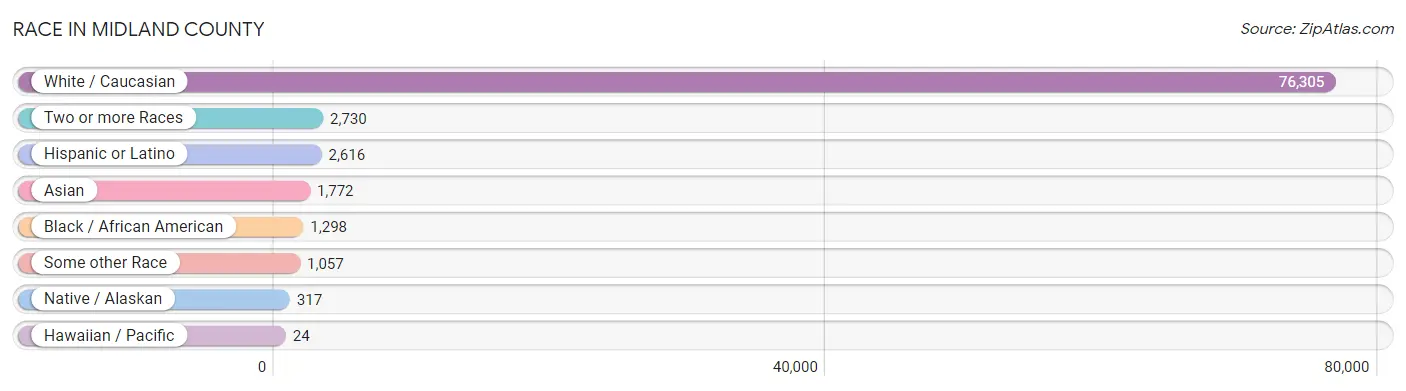
Race in Midland County
The most populous races in Midland County are White / Caucasian (76,305 | 91.4%), Two or more Races (2,730 | 3.3%), and Hispanic or Latino (2,616 | 3.1%).
| Race | # Population | % Population |
| Asian | 1,772 | 2.1% |
| Black / African American | 1,298 | 1.5% |
| Hawaiian / Pacific | 24 | 0.0% |
| Hispanic or Latino | 2,616 | 3.1% |
| Native / Alaskan | 317 | 0.4% |
| White / Caucasian | 76,305 | 91.4% |
| Two or more Races | 2,730 | 3.3% |
| Some other Race | 1,057 | 1.3% |
| Total | 83,503 | 100.0% |
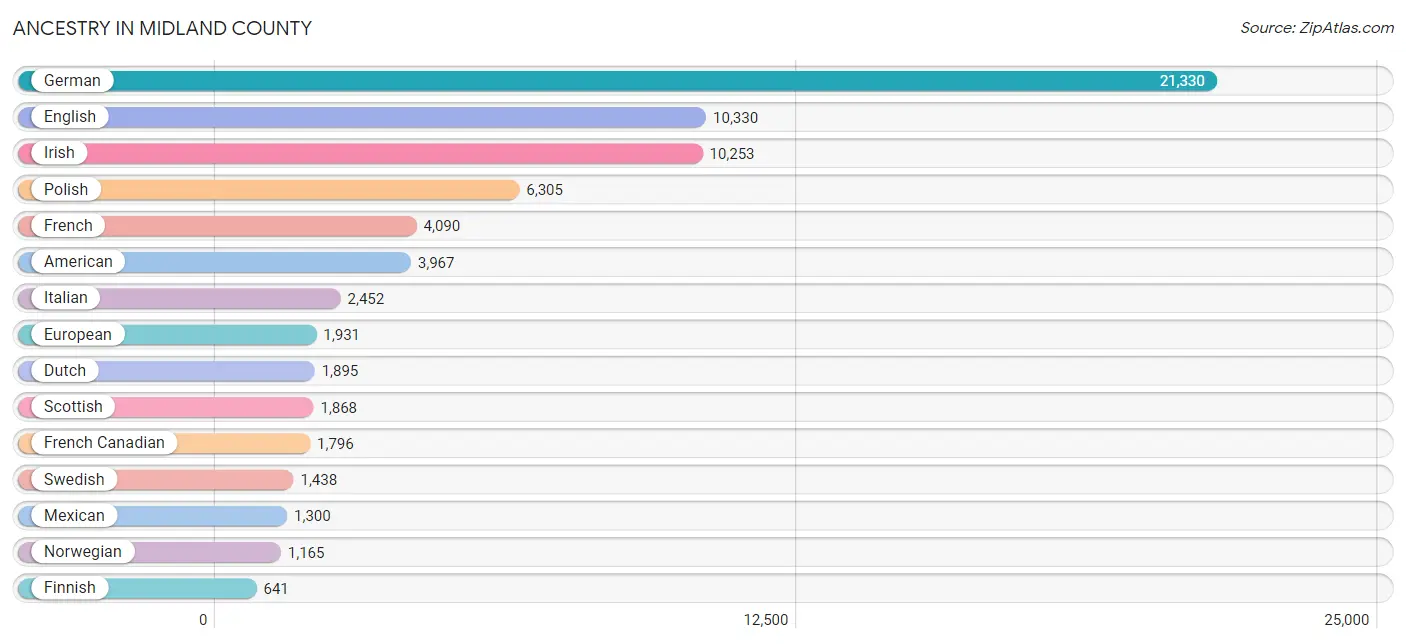
Ancestry in Midland County
The most populous ancestries reported in Midland County are German (21,330 | 25.5%), English (10,330 | 12.4%), Irish (10,253 | 12.3%), Polish (6,305 | 7.5%), and French (4,090 | 4.9%), together accounting for 62.6% of all Midland County residents.
| Ancestry | # Population | % Population |
| African | 15 | 0.0% |
| Albanian | 13 | 0.0% |
| Aleut | 28 | 0.0% |
| American | 3,967 | 4.8% |
| Apache | 16 | 0.0% |
| Arab | 137 | 0.2% |
| Argentinean | 40 | 0.1% |
| Armenian | 18 | 0.0% |
| Assyrian / Chaldean / Syriac | 4 | 0.0% |
| Australian | 14 | 0.0% |
| Austrian | 115 | 0.1% |
| Belgian | 296 | 0.4% |
| Bhutanese | 244 | 0.3% |
| Blackfeet | 1 | 0.0% |
| Brazilian | 7 | 0.0% |
| British | 555 | 0.7% |
| Bulgarian | 6 | 0.0% |
| Burmese | 393 | 0.5% |
| Canadian | 344 | 0.4% |
| Central American | 108 | 0.1% |
| Cherokee | 62 | 0.1% |
| Chippewa | 391 | 0.5% |
| Choctaw | 14 | 0.0% |
| Colombian | 74 | 0.1% |
| Croatian | 47 | 0.1% |
| Cuban | 413 | 0.5% |
| Czech | 491 | 0.6% |
| Czechoslovakian | 71 | 0.1% |
| Danish | 319 | 0.4% |
| Dominican | 14 | 0.0% |
| Dutch | 1,895 | 2.3% |
| Eastern European | 277 | 0.3% |
| Ecuadorian | 1 | 0.0% |
| English | 10,330 | 12.4% |
| European | 1,931 | 2.3% |
| Filipino | 108 | 0.1% |
| Finnish | 641 | 0.8% |
| French | 4,090 | 4.9% |
| French American Indian | 10 | 0.0% |
| French Canadian | 1,796 | 2.1% |
| German | 21,330 | 25.5% |
| Ghanaian | 30 | 0.0% |
| Greek | 301 | 0.4% |
| Guamanian / Chamorro | 89 | 0.1% |
| Guatemalan | 43 | 0.1% |
| Haitian | 10 | 0.0% |
| Honduran | 25 | 0.0% |
| Hungarian | 632 | 0.8% |
| Icelander | 15 | 0.0% |
| Indian (Asian) | 334 | 0.4% |
| Iranian | 16 | 0.0% |
| Iraqi | 4 | 0.0% |
| Irish | 10,253 | 12.3% |
| Iroquois | 15 | 0.0% |
| Italian | 2,452 | 2.9% |
| Jamaican | 64 | 0.1% |
| Japanese | 11 | 0.0% |
| Kenyan | 17 | 0.0% |
| Korean | 223 | 0.3% |
| Latvian | 24 | 0.0% |
| Lebanese | 94 | 0.1% |
| Lithuanian | 119 | 0.1% |
| Lumbee | 14 | 0.0% |
| Luxembourger | 15 | 0.0% |
| Macedonian | 13 | 0.0% |
| Maltese | 9 | 0.0% |
| Mexican | 1,300 | 1.6% |
| Mexican American Indian | 6 | 0.0% |
| Mongolian | 4 | 0.0% |
| Native Hawaiian | 82 | 0.1% |
| Nicaraguan | 4 | 0.0% |
| Northern European | 181 | 0.2% |
| Norwegian | 1,165 | 1.4% |
| Ottawa | 38 | 0.1% |
| Pakistani | 4 | 0.0% |
| Pennsylvania German | 79 | 0.1% |
| Polish | 6,305 | 7.5% |
| Portuguese | 20 | 0.0% |
| Potawatomi | 7 | 0.0% |
| Puerto Rican | 161 | 0.2% |
| Puget Sound Salish | 1 | 0.0% |
| Romanian | 113 | 0.1% |
| Russian | 427 | 0.5% |
| Salvadoran | 36 | 0.0% |
| Samoan | 2 | 0.0% |
| Scandinavian | 268 | 0.3% |
| Scotch-Irish | 501 | 0.6% |
| Scottish | 1,868 | 2.2% |
| Serbian | 16 | 0.0% |
| Shoshone | 6 | 0.0% |
| Sierra Leonean | 45 | 0.1% |
| Sioux | 7 | 0.0% |
| Slavic | 59 | 0.1% |
| Slovak | 173 | 0.2% |
| Slovene | 38 | 0.1% |
| South American | 189 | 0.2% |
| Spaniard | 125 | 0.2% |
| Spanish | 251 | 0.3% |
| Sri Lankan | 289 | 0.4% |
| Subsaharan African | 164 | 0.2% |
| Sudanese | 29 | 0.0% |
| Swedish | 1,438 | 1.7% |
| Swiss | 243 | 0.3% |
| Syrian | 31 | 0.0% |
| Thai | 548 | 0.7% |
| Ukrainian | 233 | 0.3% |
| Venezuelan | 74 | 0.1% |
| Welsh | 516 | 0.6% |
| Yugoslavian | 5 | 0.0% | View All 109 Rows |
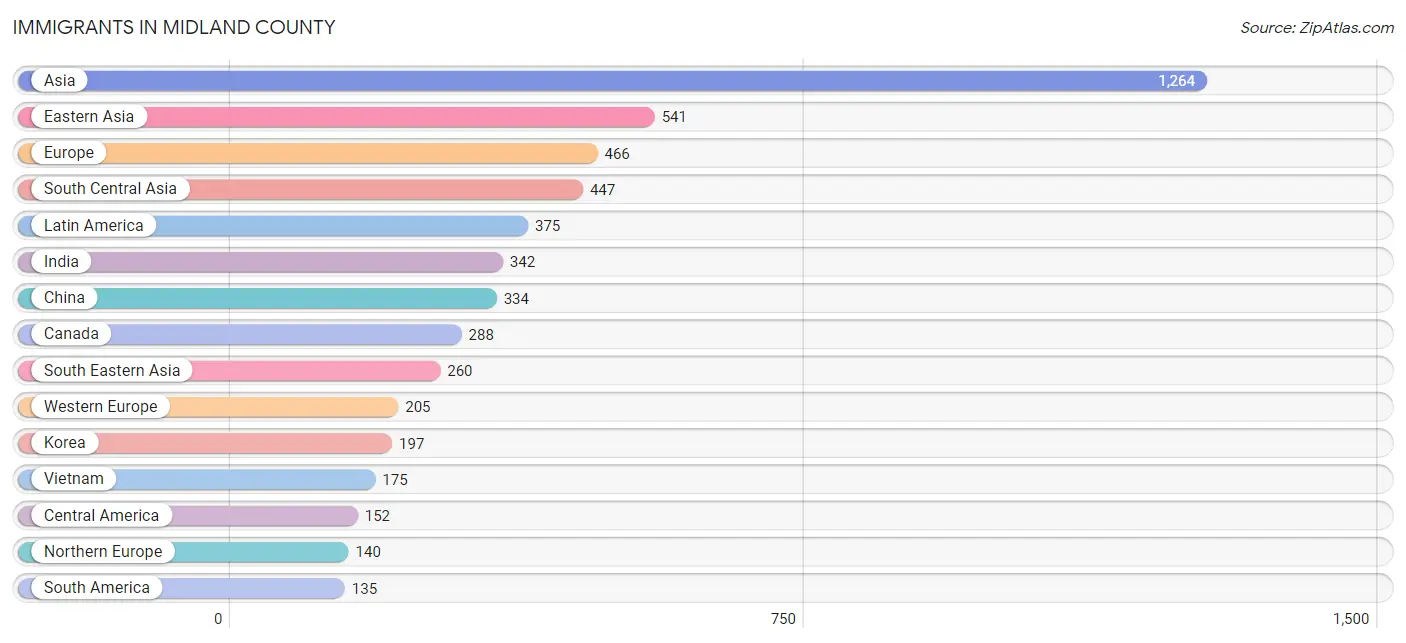
Immigrants in Midland County
The most numerous immigrant groups reported in Midland County came from Asia (1,264 | 1.5%), Eastern Asia (541 | 0.6%), Europe (466 | 0.6%), South Central Asia (447 | 0.5%), and Latin America (375 | 0.4%), together accounting for 3.7% of all Midland County residents.
| Immigration Origin | # Population | % Population |
| Africa | 102 | 0.1% |
| Argentina | 40 | 0.1% |
| Asia | 1,264 | 1.5% |
| Austria | 9 | 0.0% |
| Belgium | 6 | 0.0% |
| Brazil | 35 | 0.0% |
| Canada | 288 | 0.3% |
| Caribbean | 88 | 0.1% |
| Central America | 152 | 0.2% |
| China | 334 | 0.4% |
| Colombia | 30 | 0.0% |
| Cuba | 40 | 0.1% |
| Denmark | 20 | 0.0% |
| Dominican Republic | 38 | 0.1% |
| Eastern Africa | 31 | 0.0% |
| Eastern Asia | 541 | 0.6% |
| Eastern Europe | 105 | 0.1% |
| England | 70 | 0.1% |
| Europe | 466 | 0.6% |
| France | 69 | 0.1% |
| Germany | 79 | 0.1% |
| Ghana | 30 | 0.0% |
| Greece | 3 | 0.0% |
| Guatemala | 8 | 0.0% |
| Haiti | 10 | 0.0% |
| Honduras | 14 | 0.0% |
| Hong Kong | 23 | 0.0% |
| Hungary | 35 | 0.0% |
| India | 342 | 0.4% |
| Iran | 9 | 0.0% |
| Iraq | 16 | 0.0% |
| Ireland | 6 | 0.0% |
| Japan | 10 | 0.0% |
| Kenya | 17 | 0.0% |
| Korea | 197 | 0.2% |
| Latin America | 375 | 0.4% |
| Mexico | 126 | 0.2% |
| Nepal | 28 | 0.0% |
| Netherlands | 32 | 0.0% |
| Nicaragua | 4 | 0.0% |
| Nigeria | 8 | 0.0% |
| Northern Africa | 11 | 0.0% |
| Northern Europe | 140 | 0.2% |
| Pakistan | 57 | 0.1% |
| Philippines | 81 | 0.1% |
| Poland | 31 | 0.0% |
| Russia | 10 | 0.0% |
| Scotland | 8 | 0.0% |
| Sierra Leone | 9 | 0.0% |
| South Africa | 13 | 0.0% |
| South America | 135 | 0.2% |
| South Central Asia | 447 | 0.5% |
| South Eastern Asia | 260 | 0.3% |
| Southern Europe | 16 | 0.0% |
| Spain | 13 | 0.0% |
| Sudan | 11 | 0.0% |
| Switzerland | 10 | 0.0% |
| Taiwan | 75 | 0.1% |
| Thailand | 4 | 0.0% |
| Ukraine | 21 | 0.0% |
| Venezuela | 30 | 0.0% |
| Vietnam | 175 | 0.2% |
| Western Africa | 47 | 0.1% |
| Western Asia | 16 | 0.0% |
| Western Europe | 205 | 0.3% | View All 65 Rows |
Sex and Age in Midland County
Sex and Age in Midland County
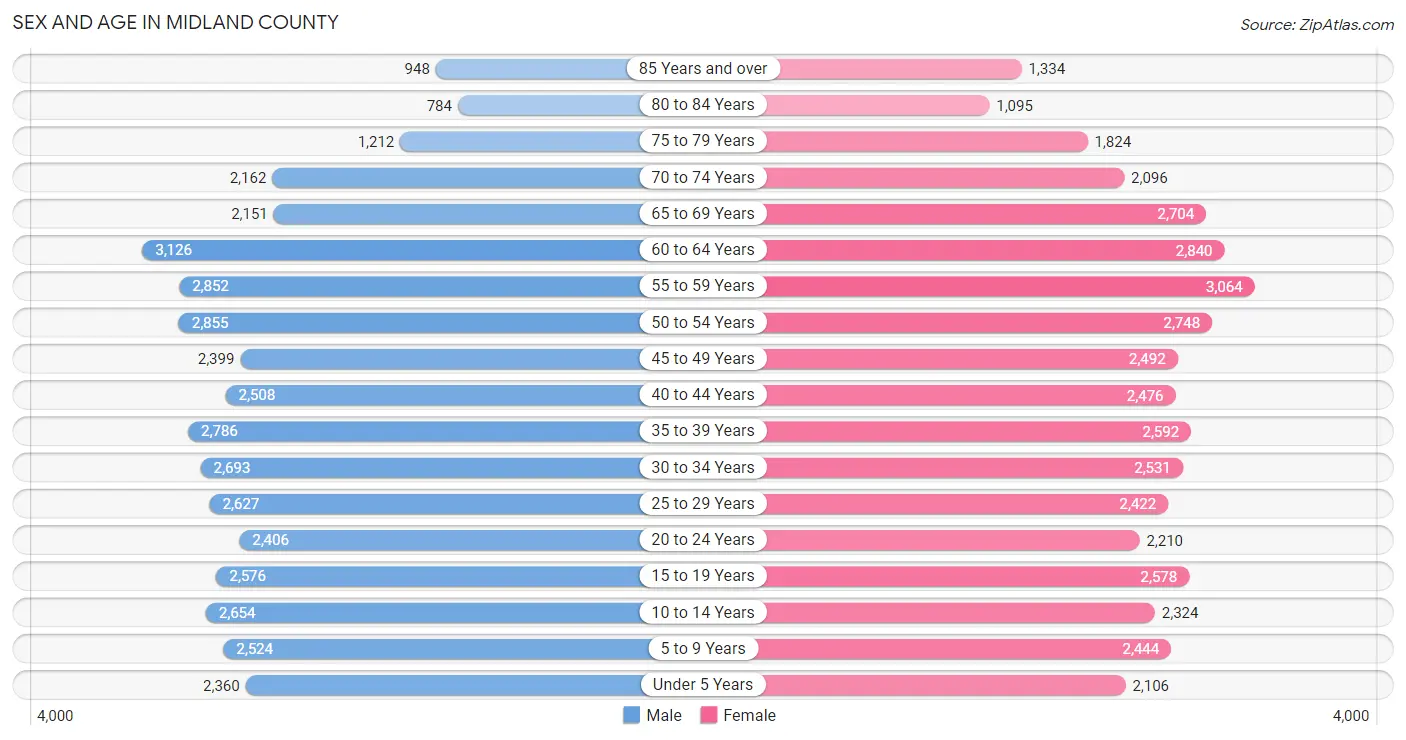
The most populous age groups in Midland County are 60 to 64 Years (3,126 | 7.5%) for men and 55 to 59 Years (3,064 | 7.3%) for women.
| Age Bracket | Male | Female |
| Under 5 Years | 2,360 (5.7%) | 2,106 (5.0%) |
| 5 to 9 Years | 2,524 (6.1%) | 2,444 (5.8%) |
| 10 to 14 Years | 2,654 (6.4%) | 2,324 (5.6%) |
| 15 to 19 Years | 2,576 (6.2%) | 2,578 (6.2%) |
| 20 to 24 Years | 2,406 (5.8%) | 2,210 (5.3%) |
| 25 to 29 Years | 2,627 (6.3%) | 2,422 (5.8%) |
| 30 to 34 Years | 2,693 (6.5%) | 2,531 (6.0%) |
| 35 to 39 Years | 2,786 (6.7%) | 2,592 (6.2%) |
| 40 to 44 Years | 2,508 (6.0%) | 2,476 (5.9%) |
| 45 to 49 Years | 2,399 (5.8%) | 2,492 (5.9%) |
| 50 to 54 Years | 2,855 (6.9%) | 2,748 (6.6%) |
| 55 to 59 Years | 2,852 (6.9%) | 3,064 (7.3%) |
| 60 to 64 Years | 3,126 (7.5%) | 2,840 (6.8%) |
| 65 to 69 Years | 2,151 (5.2%) | 2,704 (6.5%) |
| 70 to 74 Years | 2,162 (5.2%) | 2,096 (5.0%) |
| 75 to 79 Years | 1,212 (2.9%) | 1,824 (4.4%) |
| 80 to 84 Years | 784 (1.9%) | 1,095 (2.6%) |
| 85 Years and over | 948 (2.3%) | 1,334 (3.2%) |
| Total | 41,623 (100.0%) | 41,880 (100.0%) |
Families and Households in Midland County
Median Family Size in Midland County
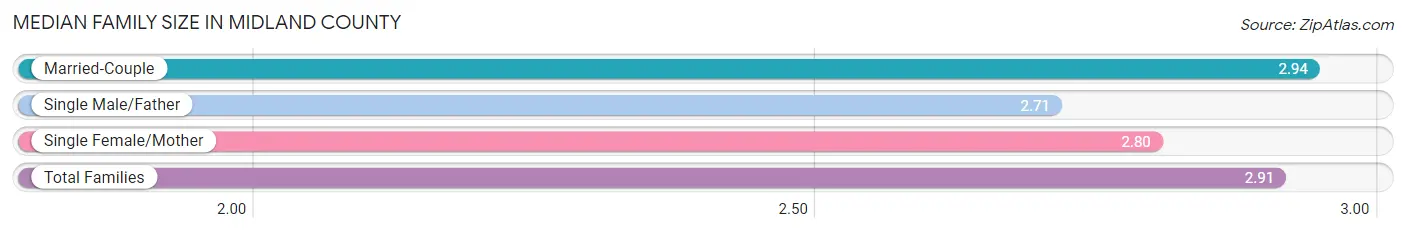
The median family size in Midland County is 2.91 persons per family, with married-couple families (18,376 | 80.4%) accounting for the largest median family size of 2.94 persons per family. On the other hand, single male/father families (1,341 | 5.9%) represent the smallest median family size with 2.71 persons per family.
| Family Type | # Families | Family Size |
| Married-Couple | 18,376 (80.4%) | 2.94 |
| Single Male/Father | 1,341 (5.9%) | 2.71 |
| Single Female/Mother | 3,126 (13.7%) | 2.80 |
| Total Families | 22,843 (100.0%) | 2.91 |
Median Household Size in Midland County
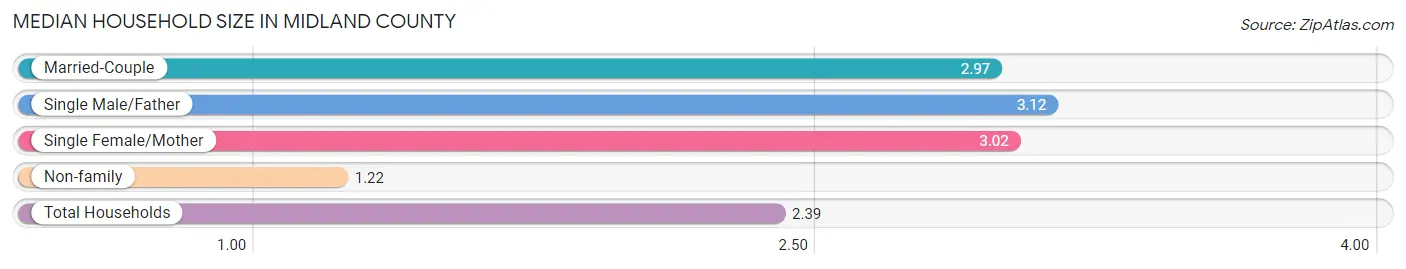
The median household size in Midland County is 2.39 persons per household, with single male/father households (1,341 | 3.9%) accounting for the largest median household size of 3.12 persons per household. non-family households (11,493 | 33.5%) represent the smallest median household size with 1.22 persons per household.
| Household Type | # Households | Household Size |
| Married-Couple | 18,376 (53.5%) | 2.97 |
| Single Male/Father | 1,341 (3.9%) | 3.12 |
| Single Female/Mother | 3,126 (9.1%) | 3.02 |
| Non-family | 11,493 (33.5%) | 1.22 |
| Total Households | 34,336 (100.0%) | 2.39 |
Household Size by Marriage Status in Midland County
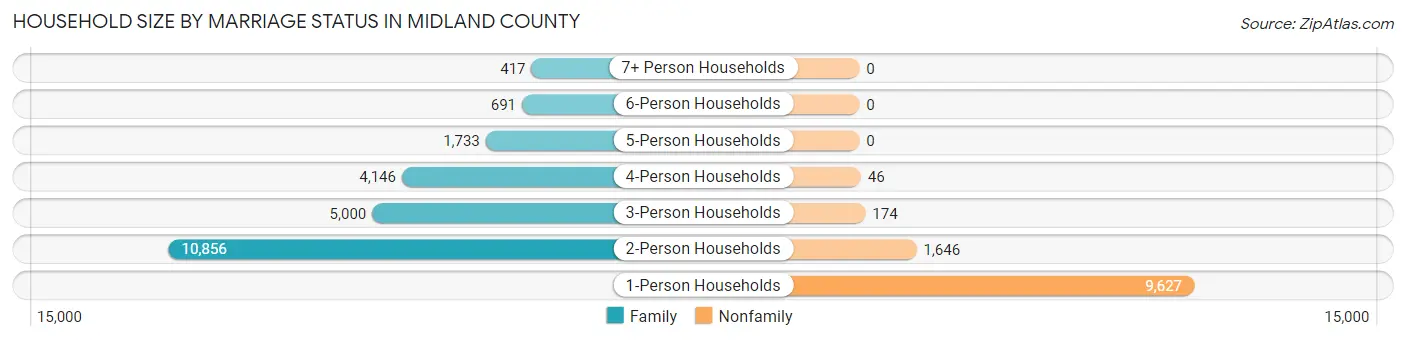
Out of a total of 34,336 households in Midland County, 22,843 (66.5%) are family households, while 11,493 (33.5%) are nonfamily households. The most numerous type of family households are 2-person households, comprising 10,856, and the most common type of nonfamily households are 1-person households, comprising 9,627.
| Household Size | Family Households | Nonfamily Households |
| 1-Person Households | - | 9,627 (28.0%) |
| 2-Person Households | 10,856 (31.6%) | 1,646 (4.8%) |
| 3-Person Households | 5,000 (14.6%) | 174 (0.5%) |
| 4-Person Households | 4,146 (12.1%) | 46 (0.1%) |
| 5-Person Households | 1,733 (5.1%) | 0 (0.0%) |
| 6-Person Households | 691 (2.0%) | 0 (0.0%) |
| 7+ Person Households | 417 (1.2%) | 0 (0.0%) |
| Total | 22,843 (66.5%) | 11,493 (33.5%) |
Female Fertility in Midland County
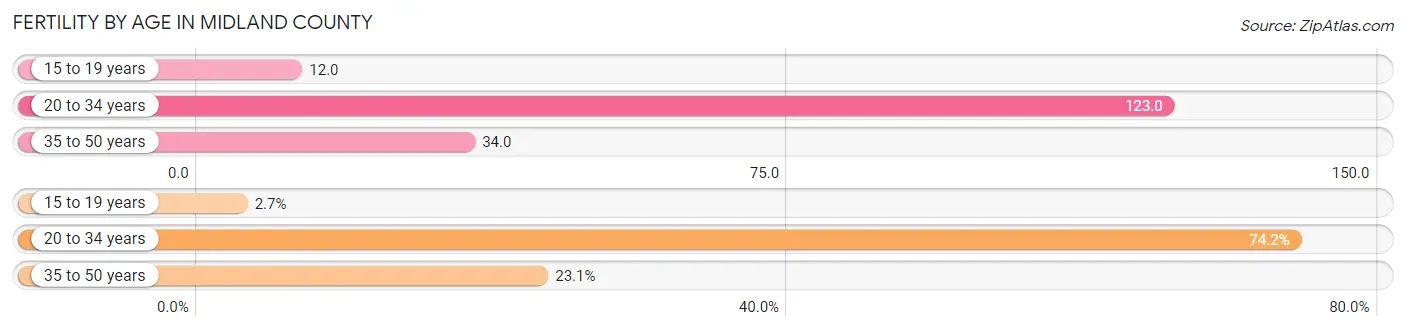
Fertility by Age in Midland County
Average fertility rate in Midland County is 67.0 births per 1,000 women. Women in the age bracket of 20 to 34 years have the highest fertility rate with 123.0 births per 1,000 women. Women in the age bracket of 20 to 34 years acount for 74.2% of all women with births.
| Age Bracket | Women with Births | Births / 1,000 Women |
| 15 to 19 years | 32 (2.7%) | 12.0 |
| 20 to 34 years | 884 (74.2%) | 123.0 |
| 35 to 50 years | 275 (23.1%) | 34.0 |
| Total | 1,191 (100.0%) | 67.0 |
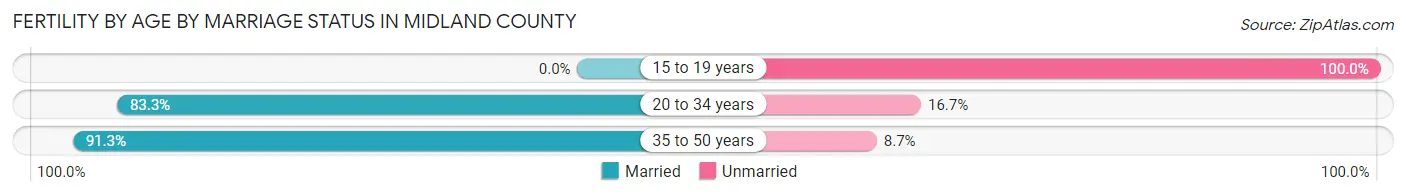
Fertility by Age by Marriage Status in Midland County
82.9% of women with births (1,191) in Midland County are married. The highest percentage of unmarried women with births falls into 15 to 19 years age bracket with 100.0% of them unmarried at the time of birth, while the lowest percentage of unmarried women with births belong to 35 to 50 years age bracket with 8.7% of them unmarried.
| Age Bracket | Married | Unmarried |
| 15 to 19 years | 0 (0.0%) | 32 (100.0%) |
| 20 to 34 years | 736 (83.3%) | 148 (16.7%) |
| 35 to 50 years | 251 (91.3%) | 24 (8.7%) |
| Total | 987 (82.9%) | 204 (17.1%) |
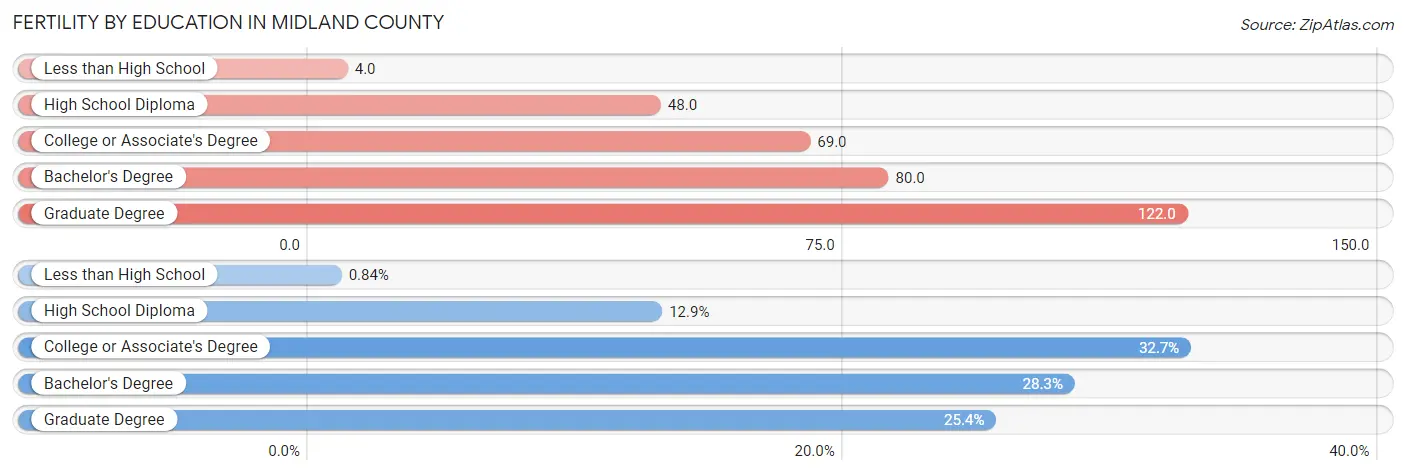
Fertility by Education in Midland County
Average fertility rate in Midland County is 67.0 births per 1,000 women. Women with the education attainment of graduate degree have the highest fertility rate of 122.0 births per 1,000 women, while women with the education attainment of less than high school have the lowest fertility at 4.0 births per 1,000 women. Women with the education attainment of college or associate's degree represent 32.7% of all women with births.
| Educational Attainment | Women with Births | Births / 1,000 Women |
| Less than High School | 10 (0.8%) | 4.0 |
| High School Diploma | 153 (12.9%) | 48.0 |
| College or Associate's Degree | 389 (32.7%) | 69.0 |
| Bachelor's Degree | 337 (28.3%) | 80.0 |
| Graduate Degree | 302 (25.4%) | 122.0 |
| Total | 1,191 (100.0%) | 67.0 |
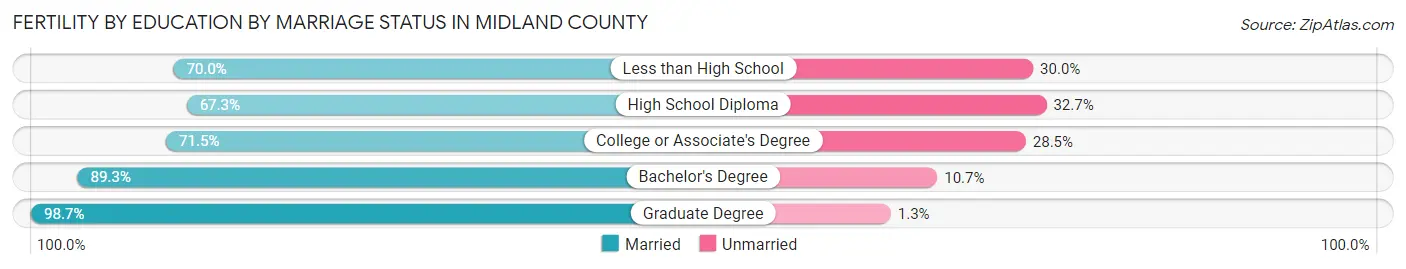
Fertility by Education by Marriage Status in Midland County
17.1% of women with births in Midland County are unmarried. Women with the educational attainment of graduate degree are most likely to be married with 98.7% of them married at childbirth, while women with the educational attainment of high school diploma are least likely to be married with 32.7% of them unmarried at childbirth.
| Educational Attainment | Married | Unmarried |
| Less than High School | 7 (70.0%) | 3 (30.0%) |
| High School Diploma | 103 (67.3%) | 50 (32.7%) |
| College or Associate's Degree | 278 (71.5%) | 111 (28.5%) |
| Bachelor's Degree | 301 (89.3%) | 36 (10.7%) |
| Graduate Degree | 298 (98.7%) | 4 (1.3%) |
| Total | 987 (82.9%) | 204 (17.1%) |
Income in Midland County
Income Overview in Midland County
Per Capita Income in Midland County is $41,594, while median incomes of families and households are $91,778 and $73,643 respectively.
| Characteristic | Number | Measure |
| Per Capita Income | 83,503 | $41,594 |
| Median Family Income | 22,843 | $91,778 |
| Mean Family Income | 22,843 | $119,550 |
| Median Household Income | 34,336 | $73,643 |
| Mean Household Income | 34,336 | $99,402 |
| Income Deficit | 22,843 | $11,878 |
| Wage / Income Gap (%) | 83,503 | 34.10% |
| Wage / Income Gap ($) | 83,503 | 65.90¢ per $1 |
| Gini / Inequality Index | 83,503 | 0.46 |
Earnings by Sex in Midland County
Average Earnings in Midland County are $42,934, $52,994 for men and $34,925 for women, a difference of 34.1%.
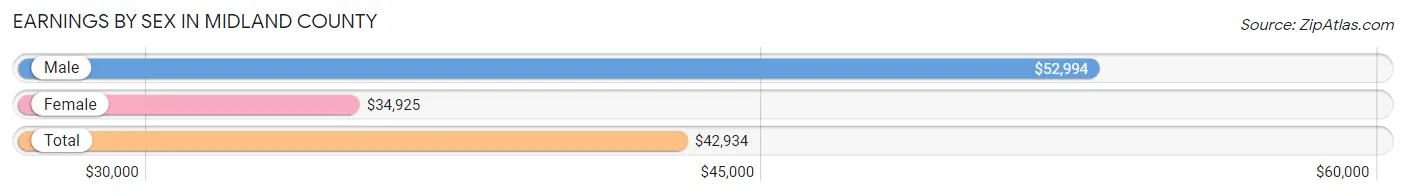
| Sex | Number | Average Earnings |
| Male | 22,333 (52.6%) | $52,994 |
| Female | 20,118 (47.4%) | $34,925 |
| Total | 42,451 (100.0%) | $42,934 |
Earnings by Sex by Income Bracket in Midland County
The most common earnings brackets in Midland County are $100,000+ for men (4,400 | 19.7%) and $100,000+ for women (1,748 | 8.7%).
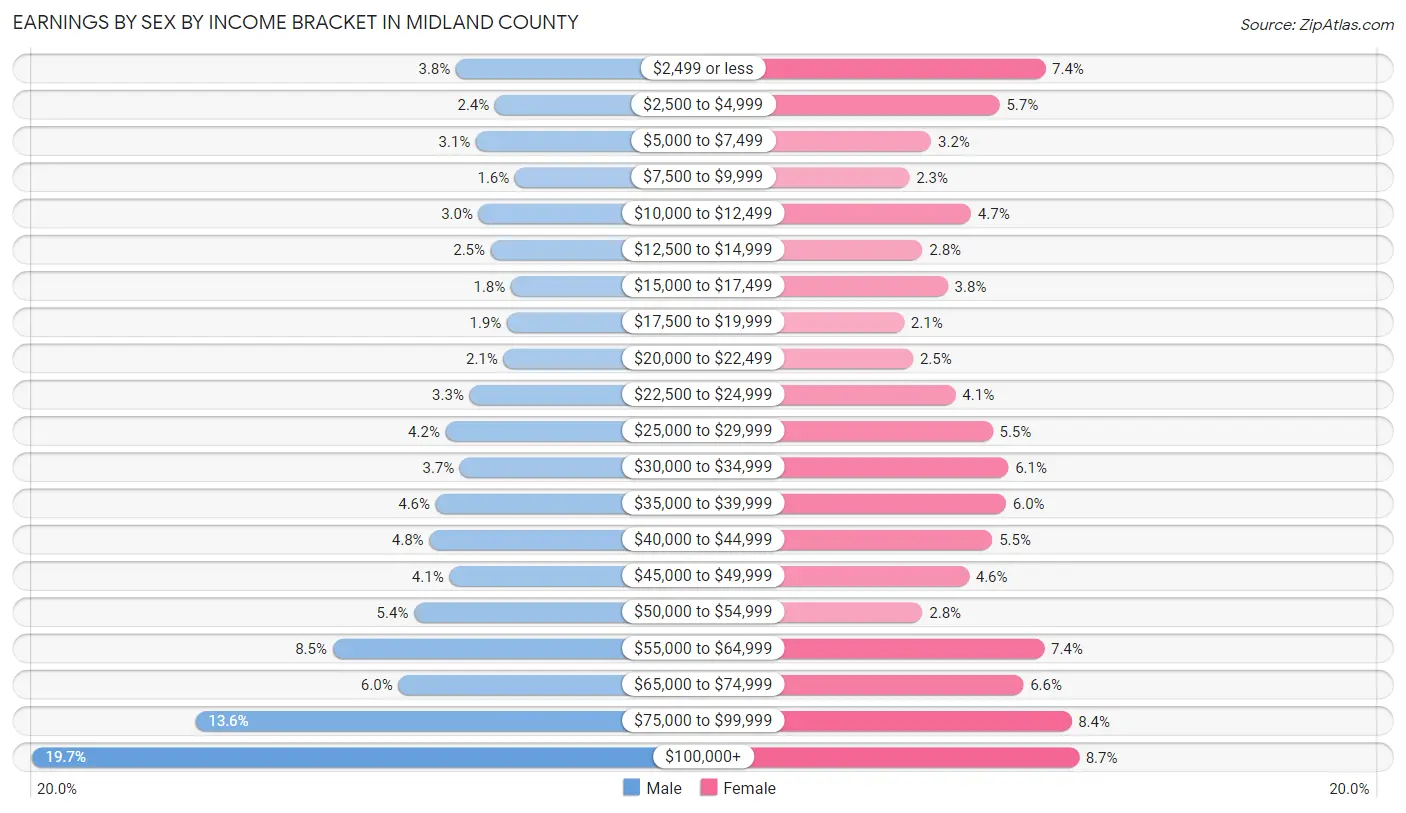
| Income | Male | Female |
| $2,499 or less | 855 (3.8%) | 1,495 (7.4%) |
| $2,500 to $4,999 | 529 (2.4%) | 1,150 (5.7%) |
| $5,000 to $7,499 | 687 (3.1%) | 635 (3.2%) |
| $7,500 to $9,999 | 361 (1.6%) | 470 (2.3%) |
| $10,000 to $12,499 | 665 (3.0%) | 936 (4.6%) |
| $12,500 to $14,999 | 564 (2.5%) | 570 (2.8%) |
| $15,000 to $17,499 | 396 (1.8%) | 760 (3.8%) |
| $17,500 to $19,999 | 428 (1.9%) | 430 (2.1%) |
| $20,000 to $22,499 | 458 (2.1%) | 499 (2.5%) |
| $22,500 to $24,999 | 741 (3.3%) | 819 (4.1%) |
| $25,000 to $29,999 | 942 (4.2%) | 1,098 (5.5%) |
| $30,000 to $34,999 | 822 (3.7%) | 1,217 (6.0%) |
| $35,000 to $39,999 | 1,026 (4.6%) | 1,200 (6.0%) |
| $40,000 to $44,999 | 1,079 (4.8%) | 1,096 (5.4%) |
| $45,000 to $49,999 | 912 (4.1%) | 919 (4.6%) |
| $50,000 to $54,999 | 1,207 (5.4%) | 569 (2.8%) |
| $55,000 to $64,999 | 1,887 (8.5%) | 1,486 (7.4%) |
| $65,000 to $74,999 | 1,337 (6.0%) | 1,329 (6.6%) |
| $75,000 to $99,999 | 3,037 (13.6%) | 1,692 (8.4%) |
| $100,000+ | 4,400 (19.7%) | 1,748 (8.7%) |
| Total | 22,333 (100.0%) | 20,118 (100.0%) |
Earnings by Sex by Educational Attainment in Midland County
Average earnings in Midland County are $58,608 for men and $40,345 for women, a difference of 31.2%. Men with an educational attainment of graduate degree enjoy the highest average annual earnings of $117,140, while those with less than high school education earn the least with $27,164. Women with an educational attainment of graduate degree earn the most with the average annual earnings of $70,488, while those with less than high school education have the smallest earnings of $15,712.
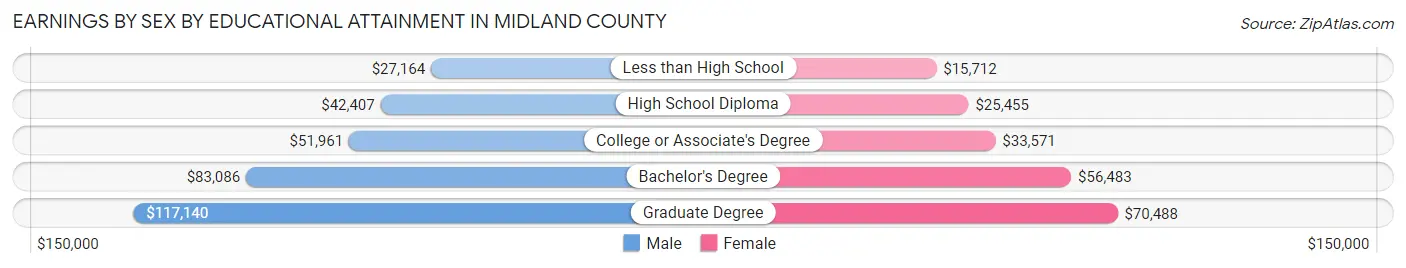
| Educational Attainment | Male Income | Female Income |
| Less than High School | $27,164 | $15,712 |
| High School Diploma | $42,407 | $25,455 |
| College or Associate's Degree | $51,961 | $33,571 |
| Bachelor's Degree | $83,086 | $56,483 |
| Graduate Degree | $117,140 | $70,488 |
| Total | $58,608 | $40,345 |
Family Income in Midland County
Family Income Brackets in Midland County
According to the Midland County family income data, there are 4,523 families falling into the $100,000 to $149,999 income range, which is the most common income bracket and makes up 19.8% of all families. Conversely, the $10,000 to $14,999 income bracket is the least frequent group with only 434 families (1.9%) belonging to this category.
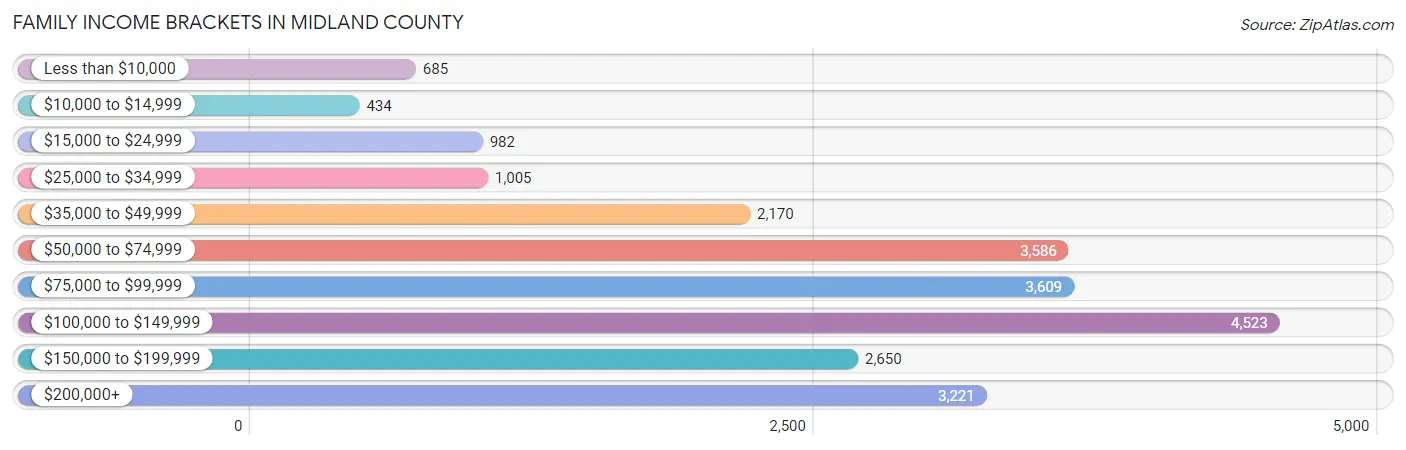
| Income Bracket | # Families | % Families |
| Less than $10,000 | 685 | 3.0% |
| $10,000 to $14,999 | 434 | 1.9% |
| $15,000 to $24,999 | 982 | 4.3% |
| $25,000 to $34,999 | 1,005 | 4.4% |
| $35,000 to $49,999 | 2,170 | 9.5% |
| $50,000 to $74,999 | 3,586 | 15.7% |
| $75,000 to $99,999 | 3,609 | 15.8% |
| $100,000 to $149,999 | 4,523 | 19.8% |
| $150,000 to $199,999 | 2,650 | 11.6% |
| $200,000+ | 3,221 | 14.1% |
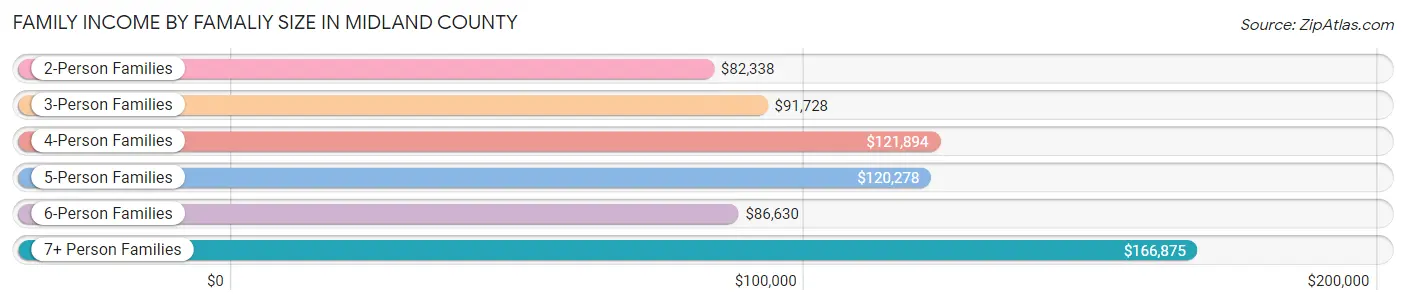
Family Income by Famaliy Size in Midland County
7+ person families (324 | 1.4%) account for the highest median family income in Midland County with $166,875 per family, while 2-person families (11,474 | 50.2%) have the highest median income of $41,169 per family member.
| Income Bracket | # Families | Median Income |
| 2-Person Families | 11,474 (50.2%) | $82,338 |
| 3-Person Families | 4,807 (21.0%) | $91,728 |
| 4-Person Families | 4,054 (17.7%) | $121,894 |
| 5-Person Families | 1,546 (6.8%) | $120,278 |
| 6-Person Families | 638 (2.8%) | $86,630 |
| 7+ Person Families | 324 (1.4%) | $166,875 |
| Total | 22,843 (100.0%) | $91,778 |
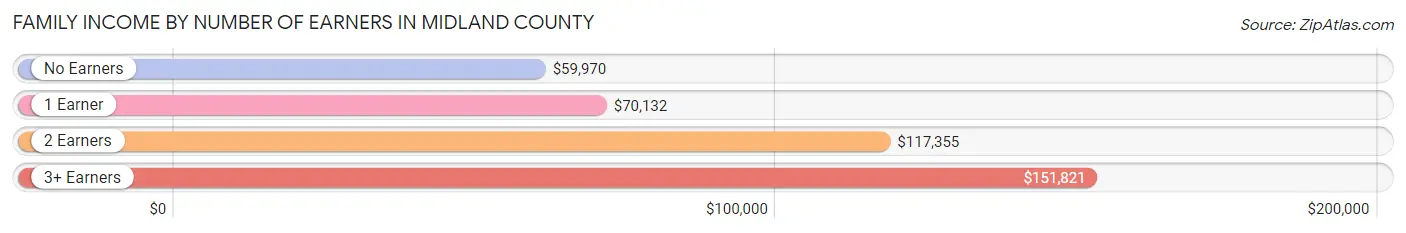
Family Income by Number of Earners in Midland County
The median family income in Midland County is $91,778, with families comprising 3+ earners (2,068) having the highest median family income of $151,821, while families with no earners (4,700) have the lowest median family income of $59,970, accounting for 9.0% and 20.6% of families, respectively.
| Number of Earners | # Families | Median Income |
| No Earners | 4,700 (20.6%) | $59,970 |
| 1 Earner | 6,728 (29.4%) | $70,132 |
| 2 Earners | 9,347 (40.9%) | $117,355 |
| 3+ Earners | 2,068 (9.0%) | $151,821 |
| Total | 22,843 (100.0%) | $91,778 |
Household Income in Midland County
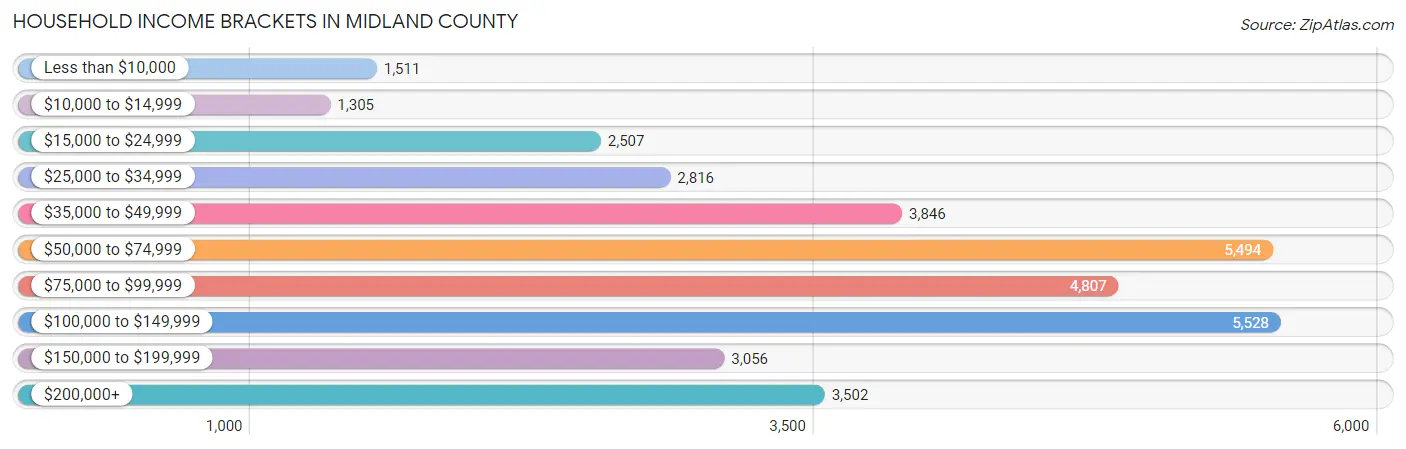
Household Income Brackets in Midland County
With 5,528 households falling in the category, the $100,000 to $149,999 income range is the most frequent in Midland County, accounting for 16.1% of all households. In contrast, only 1,305 households (3.8%) fall into the $10,000 to $14,999 income bracket, making it the least populous group.
| Income Bracket | # Households | % Households |
| Less than $10,000 | 1,511 | 4.4% |
| $10,000 to $14,999 | 1,305 | 3.8% |
| $15,000 to $24,999 | 2,507 | 7.3% |
| $25,000 to $34,999 | 2,816 | 8.2% |
| $35,000 to $49,999 | 3,846 | 11.2% |
| $50,000 to $74,999 | 5,494 | 16.0% |
| $75,000 to $99,999 | 4,807 | 14.0% |
| $100,000 to $149,999 | 5,528 | 16.1% |
| $150,000 to $199,999 | 3,056 | 8.9% |
| $200,000+ | 3,502 | 10.2% |
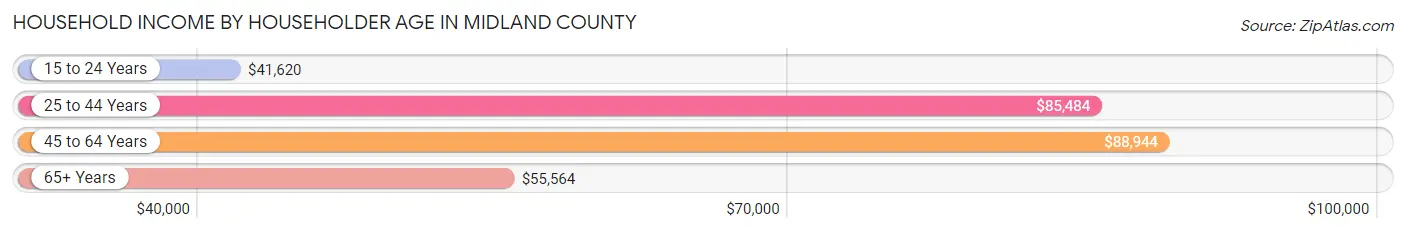
Household Income by Householder Age in Midland County
The median household income in Midland County is $73,643, with the highest median household income of $88,944 found in the 45 to 64 years age bracket for the primary householder. A total of 12,803 households (37.3%) fall into this category. Meanwhile, the 15 to 24 years age bracket for the primary householder has the lowest median household income of $41,620, with 1,274 households (3.7%) in this group.
| Income Bracket | # Households | Median Income |
| 15 to 24 Years | 1,274 (3.7%) | $41,620 |
| 25 to 44 Years | 10,219 (29.8%) | $85,484 |
| 45 to 64 Years | 12,803 (37.3%) | $88,944 |
| 65+ Years | 10,040 (29.2%) | $55,564 |
| Total | 34,336 (100.0%) | $73,643 |
Poverty in Midland County
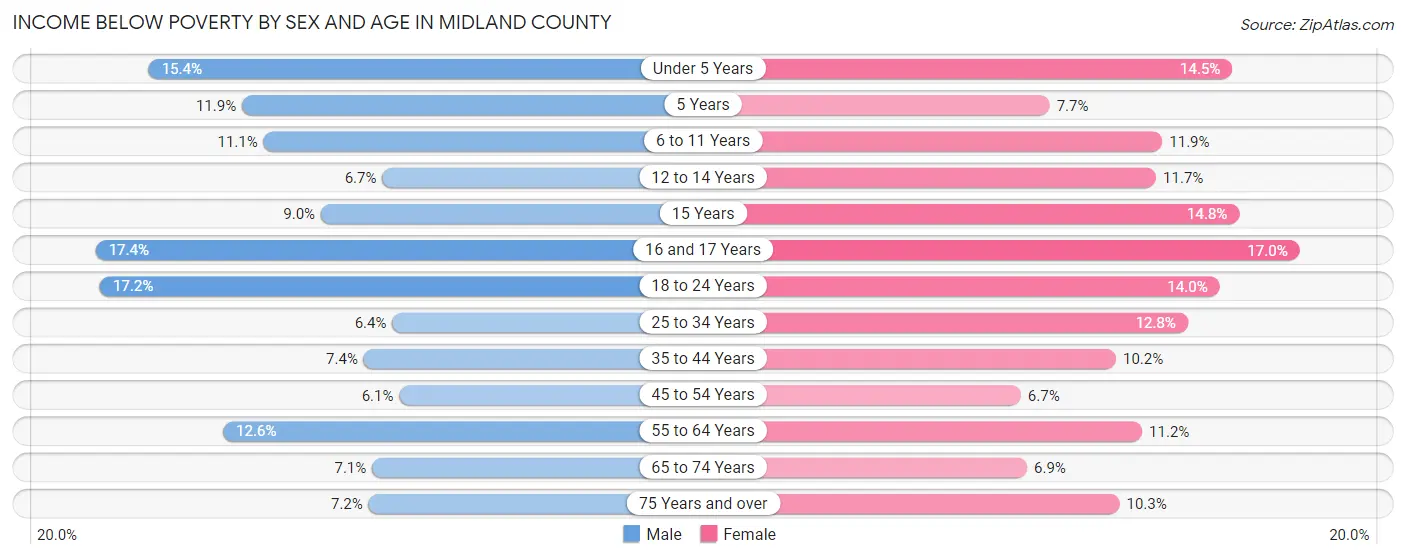
Income Below Poverty by Sex and Age in Midland County
With 9.6% poverty level for males and 10.7% for females among the residents of Midland County, 16 and 17 year old males and 16 and 17 year old females are the most vulnerable to poverty, with 187 males (17.4%) and 176 females (17.0%) in their respective age groups living below the poverty level.
| Age Bracket | Male | Female |
| Under 5 Years | 362 (15.4%) | 291 (14.5%) |
| 5 Years | 50 (11.9%) | 42 (7.7%) |
| 6 to 11 Years | 343 (11.1%) | 319 (11.9%) |
| 12 to 14 Years | 109 (6.7%) | 164 (11.7%) |
| 15 Years | 47 (9.0%) | 82 (14.7%) |
| 16 and 17 Years | 187 (17.4%) | 176 (17.0%) |
| 18 to 24 Years | 542 (17.2%) | 423 (14.0%) |
| 25 to 34 Years | 333 (6.4%) | 636 (12.8%) |
| 35 to 44 Years | 387 (7.4%) | 514 (10.2%) |
| 45 to 54 Years | 318 (6.1%) | 348 (6.7%) |
| 55 to 64 Years | 754 (12.6%) | 656 (11.2%) |
| 65 to 74 Years | 300 (7.1%) | 326 (6.9%) |
| 75 Years and over | 208 (7.2%) | 420 (10.3%) |
| Total | 3,940 (9.6%) | 4,397 (10.7%) |
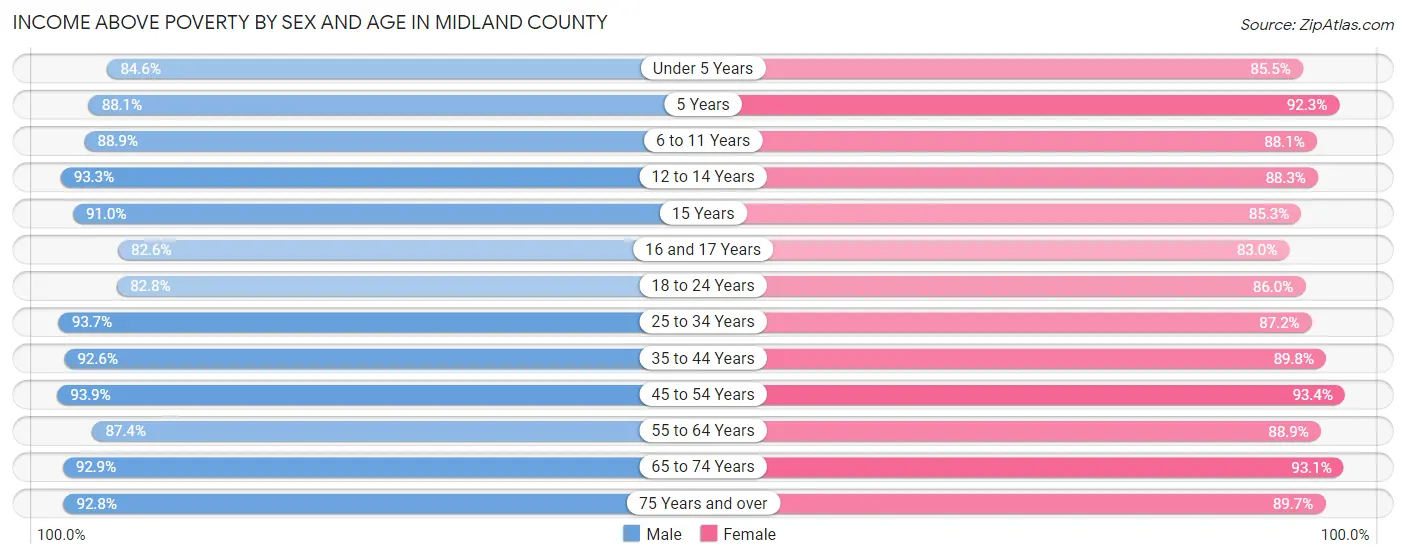
Income Above Poverty by Sex and Age in Midland County
According to the poverty statistics in Midland County, males aged 45 to 54 years and females aged 45 to 54 years are the age groups that are most secure financially, with 93.9% of males and 93.3% of females in these age groups living above the poverty line.
| Age Bracket | Male | Female |
| Under 5 Years | 1,990 (84.6%) | 1,717 (85.5%) |
| 5 Years | 369 (88.1%) | 502 (92.3%) |
| 6 to 11 Years | 2,738 (88.9%) | 2,362 (88.1%) |
| 12 to 14 Years | 1,514 (93.3%) | 1,241 (88.3%) |
| 15 Years | 475 (91.0%) | 474 (85.3%) |
| 16 and 17 Years | 890 (82.6%) | 860 (83.0%) |
| 18 to 24 Years | 2,609 (82.8%) | 2,594 (86.0%) |
| 25 to 34 Years | 4,912 (93.6%) | 4,317 (87.2%) |
| 35 to 44 Years | 4,833 (92.6%) | 4,536 (89.8%) |
| 45 to 54 Years | 4,906 (93.9%) | 4,886 (93.3%) |
| 55 to 64 Years | 5,215 (87.4%) | 5,228 (88.8%) |
| 65 to 74 Years | 3,923 (92.9%) | 4,415 (93.1%) |
| 75 Years and over | 2,668 (92.8%) | 3,655 (89.7%) |
| Total | 37,042 (90.4%) | 36,787 (89.3%) |
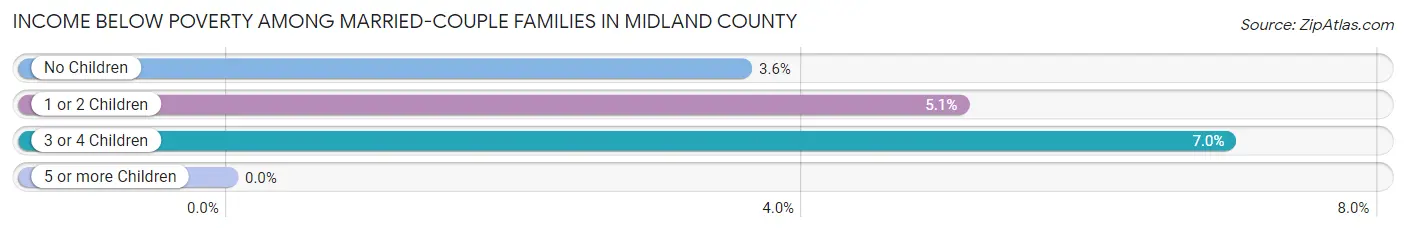
Income Below Poverty Among Married-Couple Families in Midland County
The poverty statistics for married-couple families in Midland County show that 4.3% or 791 of the total 18,376 families live below the poverty line. Families with 3 or 4 children have the highest poverty rate of 7.0%, comprising of 121 families. On the other hand, families with 5 or more children have the lowest poverty rate of 0.0%, which includes 0 families.
| Children | Above Poverty | Below Poverty |
| No Children | 10,701 (96.4%) | 397 (3.6%) |
| 1 or 2 Children | 5,090 (94.9%) | 273 (5.1%) |
| 3 or 4 Children | 1,620 (93.0%) | 121 (7.0%) |
| 5 or more Children | 174 (100.0%) | 0 (0.0%) |
| Total | 17,585 (95.7%) | 791 (4.3%) |
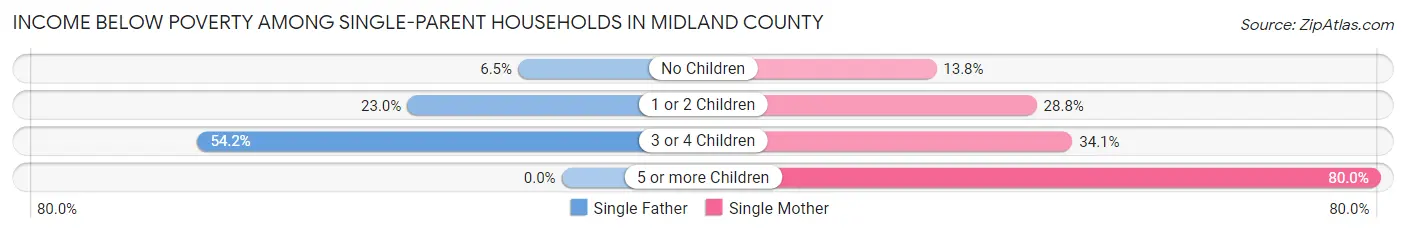
Income Below Poverty Among Single-Parent Households in Midland County
According to the poverty data in Midland County, 21.2% or 285 single-father households and 24.1% or 752 single-mother households are living below the poverty line. Among single-father households, those with 3 or 4 children have the highest poverty rate, with 96 households (54.2%) experiencing poverty. Likewise, among single-mother households, those with 5 or more children have the highest poverty rate, with 56 households (80.0%) falling below the poverty line.
| Children | Single Father | Single Mother |
| No Children | 31 (6.5%) | 180 (13.8%) |
| 1 or 2 Children | 158 (23.0%) | 440 (28.8%) |
| 3 or 4 Children | 96 (54.2%) | 76 (34.1%) |
| 5 or more Children | 0 (0.0%) | 56 (80.0%) |
| Total | 285 (21.2%) | 752 (24.1%) |
Income Below Poverty Among Married-Couple vs Single-Parent Households in Midland County
The poverty data for Midland County shows that 791 of the married-couple family households (4.3%) and 1,037 of the single-parent households (23.2%) are living below the poverty level. Within the married-couple family households, those with 3 or 4 children have the highest poverty rate, with 121 households (7.0%) falling below the poverty line. Among the single-parent households, those with 5 or more children have the highest poverty rate, with 56 household (80.0%) living below poverty.
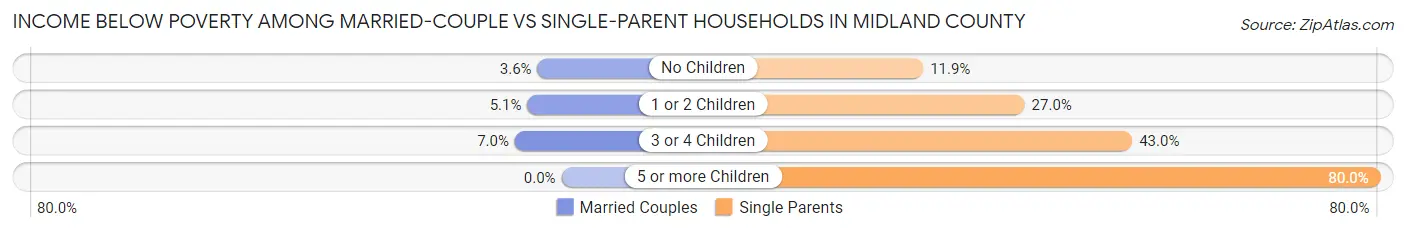
| Children | Married-Couple Families | Single-Parent Households |
| No Children | 397 (3.6%) | 211 (11.8%) |
| 1 or 2 Children | 273 (5.1%) | 598 (27.0%) |
| 3 or 4 Children | 121 (7.0%) | 172 (43.0%) |
| 5 or more Children | 0 (0.0%) | 56 (80.0%) |
| Total | 791 (4.3%) | 1,037 (23.2%) |
Employment Characteristics in Midland County
Employment by Class of Employer in Midland County
Among the 37,379 employed individuals in Midland County, private company employees (26,236 | 70.2%), not-for-profit organizations (4,036 | 10.8%), and local government employees (2,244 | 6.0%) make up the most common classes of employment.
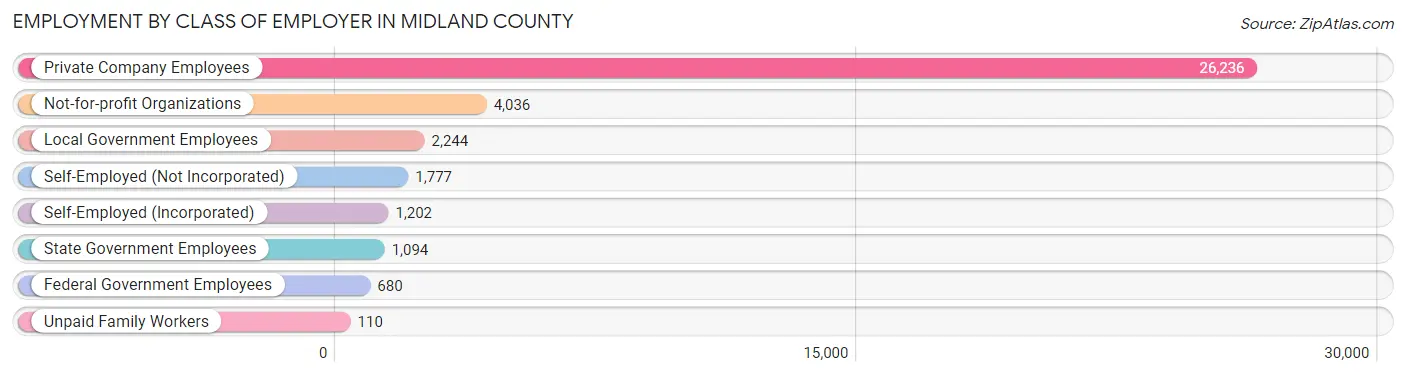
| Employer Class | # Employees | % Employees |
| Private Company Employees | 26,236 | 70.2% |
| Self-Employed (Incorporated) | 1,202 | 3.2% |
| Self-Employed (Not Incorporated) | 1,777 | 4.8% |
| Not-for-profit Organizations | 4,036 | 10.8% |
| Local Government Employees | 2,244 | 6.0% |
| State Government Employees | 1,094 | 2.9% |
| Federal Government Employees | 680 | 1.8% |
| Unpaid Family Workers | 110 | 0.3% |
| Total | 37,379 | 100.0% |
Employment Status by Age in Midland County
According to the labor force statistics for Midland County, out of the total population over 16 years of age (68,011), 59.2% or 40,263 individuals are in the labor force, with 5.0% or 2,013 of them unemployed. The age group with the highest labor force participation rate is 30 to 34 years, with 87.7% or 4,581 individuals in the labor force. Within the labor force, the 16 to 19 years age range has the highest percentage of unemployed individuals, with 15.0% or 242 of them being unemployed.
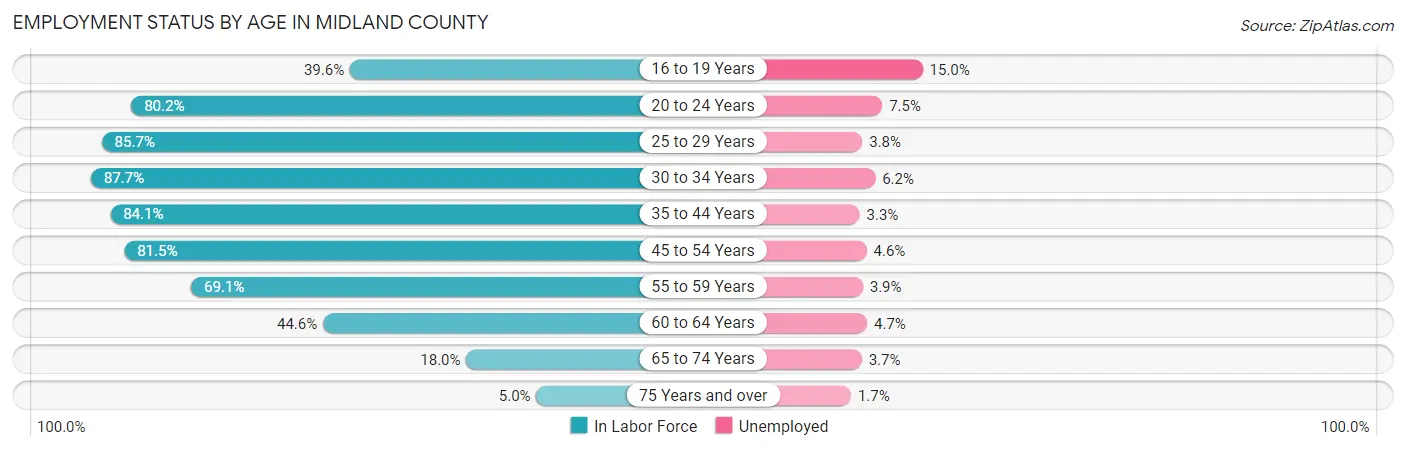
| Age Bracket | In Labor Force | Unemployed |
| 16 to 19 Years | 1,613 (39.6%) | 242 (15.0%) |
| 20 to 24 Years | 3,702 (80.2%) | 278 (7.5%) |
| 25 to 29 Years | 4,327 (85.7%) | 164 (3.8%) |
| 30 to 34 Years | 4,581 (87.7%) | 284 (6.2%) |
| 35 to 44 Years | 8,714 (84.1%) | 288 (3.3%) |
| 45 to 54 Years | 8,553 (81.5%) | 393 (4.6%) |
| 55 to 59 Years | 4,088 (69.1%) | 159 (3.9%) |
| 60 to 64 Years | 2,661 (44.6%) | 125 (4.7%) |
| 65 to 74 Years | 1,640 (18.0%) | 61 (3.7%) |
| 75 Years and over | 360 (5.0%) | 6 (1.7%) |
| Total | 40,263 (59.2%) | 2,013 (5.0%) |
Employment Status by Educational Attainment in Midland County
According to labor force statistics for Midland County, 76.6% of individuals (32,946) out of the total population between 25 and 64 years of age (43,011) are in the labor force, with 4.3% or 1,417 of them being unemployed. The group with the highest labor force participation rate are those with the educational attainment of bachelor's degree or higher, with 85.4% or 14,106 individuals in the labor force. Within the labor force, individuals with less than high school education have the highest percentage of unemployment, with 9.2% or 104 of them being unemployed.
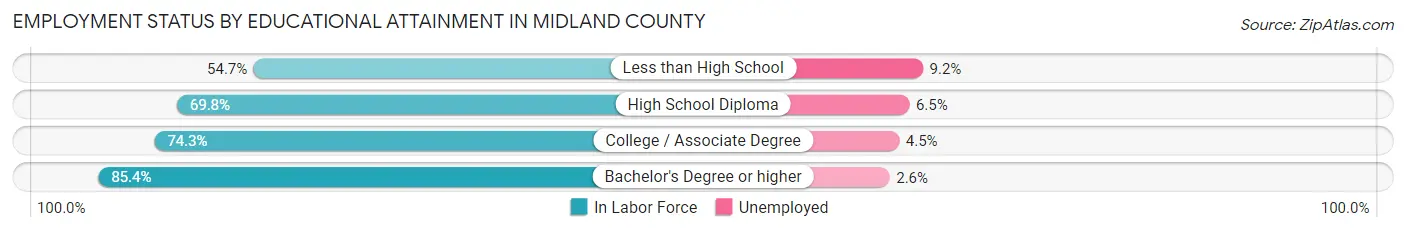
| Educational Attainment | In Labor Force | Unemployed |
| Less than High School | 1,131 (54.7%) | 190 (9.2%) |
| High School Diploma | 7,289 (69.8%) | 679 (6.5%) |
| College / Associate Degree | 10,389 (74.3%) | 629 (4.5%) |
| Bachelor's Degree or higher | 14,106 (85.4%) | 429 (2.6%) |
| Total | 32,946 (76.6%) | 1,849 (4.3%) |
Employment Occupations by Sex in Midland County
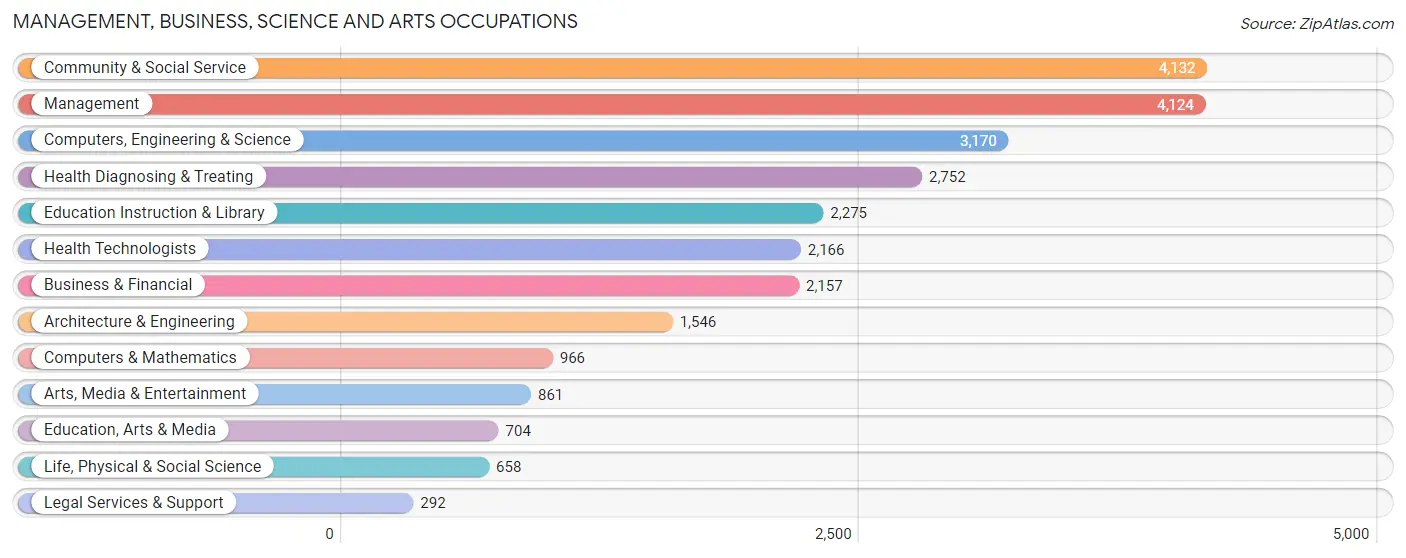
Management, Business, Science and Arts Occupations
The most common Management, Business, Science and Arts occupations in Midland County are Community & Social Service (4,132 | 10.8%), Management (4,124 | 10.8%), Computers, Engineering & Science (3,170 | 8.3%), Health Diagnosing & Treating (2,752 | 7.2%), and Education Instruction & Library (2,275 | 6.0%).
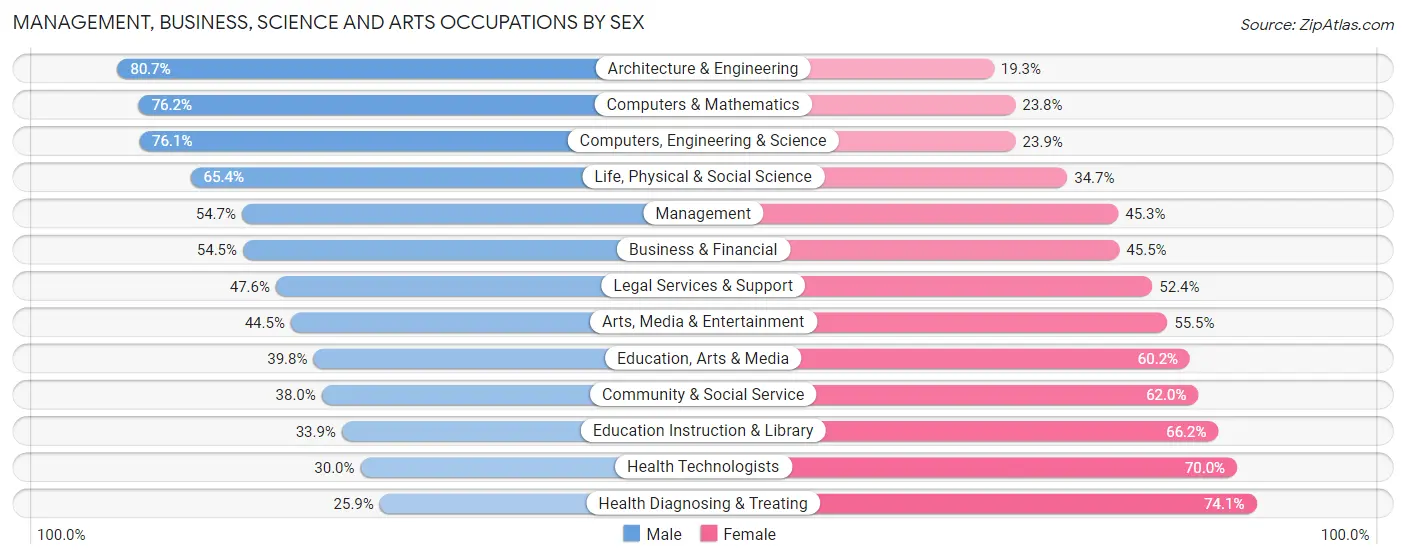
Management, Business, Science and Arts Occupations by Sex
Within the Management, Business, Science and Arts occupations in Midland County, the most male-oriented occupations are Architecture & Engineering (80.7%), Computers & Mathematics (76.2%), and Computers, Engineering & Science (76.1%), while the most female-oriented occupations are Health Diagnosing & Treating (74.1%), Health Technologists (70.0%), and Education Instruction & Library (66.1%).
| Occupation | Male | Female |
| Management | 2,256 (54.7%) | 1,868 (45.3%) |
| Business & Financial | 1,175 (54.5%) | 982 (45.5%) |
| Computers, Engineering & Science | 2,413 (76.1%) | 757 (23.9%) |
| Computers & Mathematics | 736 (76.2%) | 230 (23.8%) |
| Architecture & Engineering | 1,247 (80.7%) | 299 (19.3%) |
| Life, Physical & Social Science | 430 (65.3%) | 228 (34.6%) |
| Community & Social Service | 1,572 (38.0%) | 2,560 (62.0%) |
| Education, Arts & Media | 280 (39.8%) | 424 (60.2%) |
| Legal Services & Support | 139 (47.6%) | 153 (52.4%) |
| Education Instruction & Library | 770 (33.9%) | 1,505 (66.1%) |
| Arts, Media & Entertainment | 383 (44.5%) | 478 (55.5%) |
| Health Diagnosing & Treating | 714 (25.9%) | 2,038 (74.1%) |
| Health Technologists | 649 (30.0%) | 1,517 (70.0%) |
| Total (Category) | 8,130 (49.8%) | 8,205 (50.2%) |
| Total (Overall) | 20,290 (53.2%) | 17,864 (46.8%) |
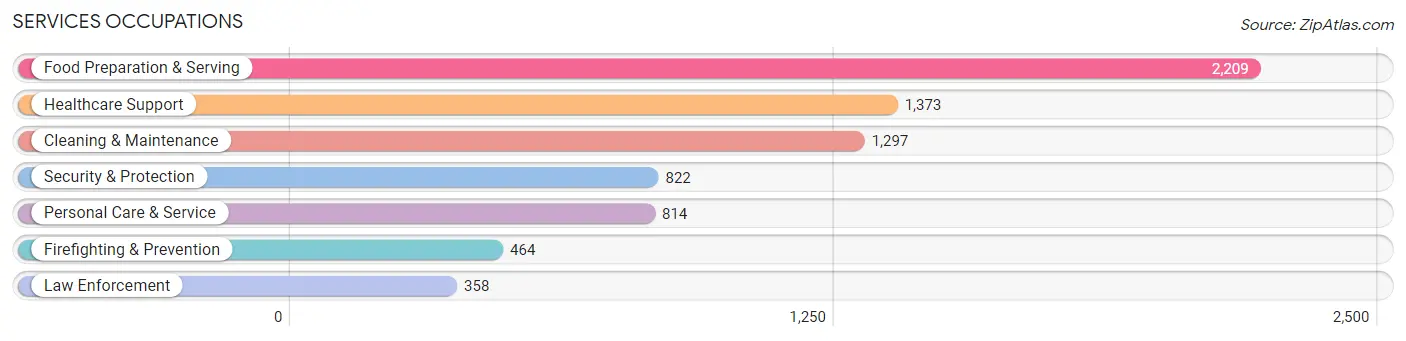
Services Occupations
The most common Services occupations in Midland County are Food Preparation & Serving (2,209 | 5.8%), Healthcare Support (1,373 | 3.6%), Cleaning & Maintenance (1,297 | 3.4%), Security & Protection (822 | 2.1%), and Personal Care & Service (814 | 2.1%).
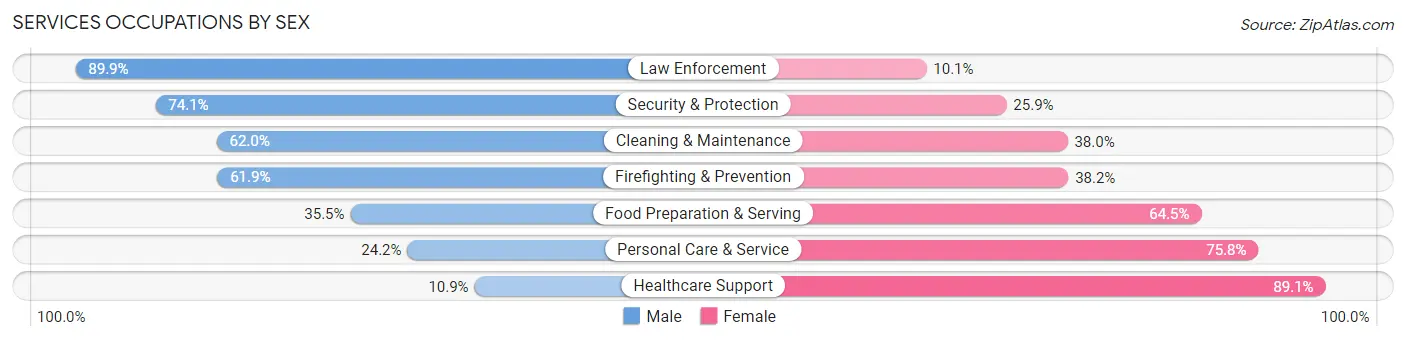
Services Occupations by Sex
Within the Services occupations in Midland County, the most male-oriented occupations are Law Enforcement (89.9%), Security & Protection (74.1%), and Cleaning & Maintenance (62.0%), while the most female-oriented occupations are Healthcare Support (89.1%), Personal Care & Service (75.8%), and Food Preparation & Serving (64.5%).
| Occupation | Male | Female |
| Healthcare Support | 150 (10.9%) | 1,223 (89.1%) |
| Security & Protection | 609 (74.1%) | 213 (25.9%) |
| Firefighting & Prevention | 287 (61.9%) | 177 (38.2%) |
| Law Enforcement | 322 (89.9%) | 36 (10.1%) |
| Food Preparation & Serving | 784 (35.5%) | 1,425 (64.5%) |
| Cleaning & Maintenance | 804 (62.0%) | 493 (38.0%) |
| Personal Care & Service | 197 (24.2%) | 617 (75.8%) |
| Total (Category) | 2,544 (39.1%) | 3,971 (61.0%) |
| Total (Overall) | 20,290 (53.2%) | 17,864 (46.8%) |
Sales and Office Occupations
The most common Sales and Office occupations in Midland County are Office & Administration (4,082 | 10.7%), and Sales & Related (3,363 | 8.8%).

Sales and Office Occupations by Sex
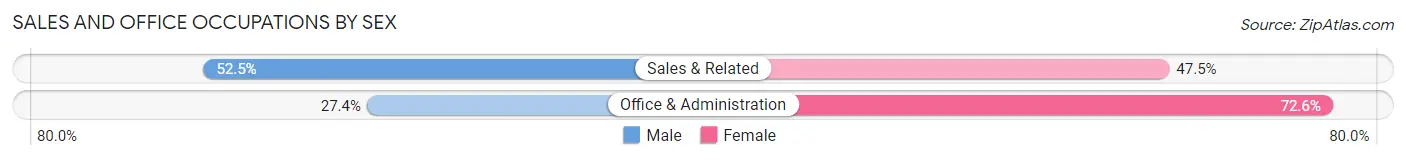
| Occupation | Male | Female |
| Sales & Related | 1,765 (52.5%) | 1,598 (47.5%) |
| Office & Administration | 1,117 (27.4%) | 2,965 (72.6%) |
| Total (Category) | 2,882 (38.7%) | 4,563 (61.3%) |
| Total (Overall) | 20,290 (53.2%) | 17,864 (46.8%) |
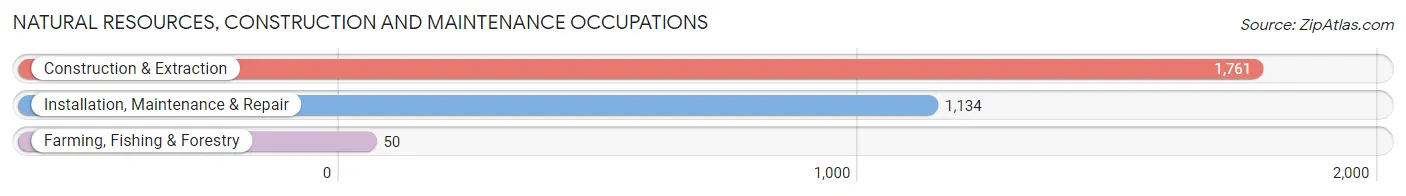
Natural Resources, Construction and Maintenance Occupations
The most common Natural Resources, Construction and Maintenance occupations in Midland County are Construction & Extraction (1,761 | 4.6%), Installation, Maintenance & Repair (1,134 | 3.0%), and Farming, Fishing & Forestry (50 | 0.1%).
Natural Resources, Construction and Maintenance Occupations by Sex
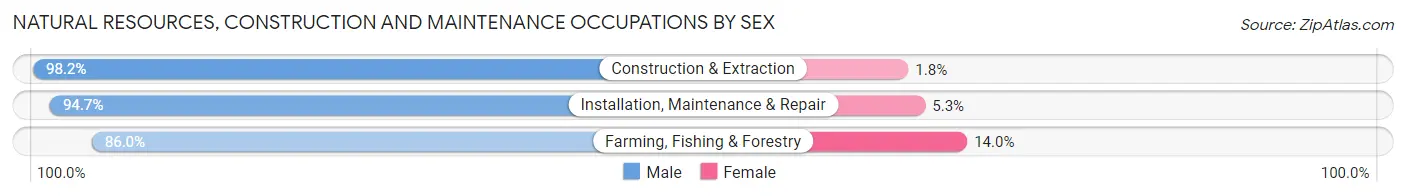
| Occupation | Male | Female |
| Farming, Fishing & Forestry | 43 (86.0%) | 7 (14.0%) |
| Construction & Extraction | 1,730 (98.2%) | 31 (1.8%) |
| Installation, Maintenance & Repair | 1,074 (94.7%) | 60 (5.3%) |
| Total (Category) | 2,847 (96.7%) | 98 (3.3%) |
| Total (Overall) | 20,290 (53.2%) | 17,864 (46.8%) |
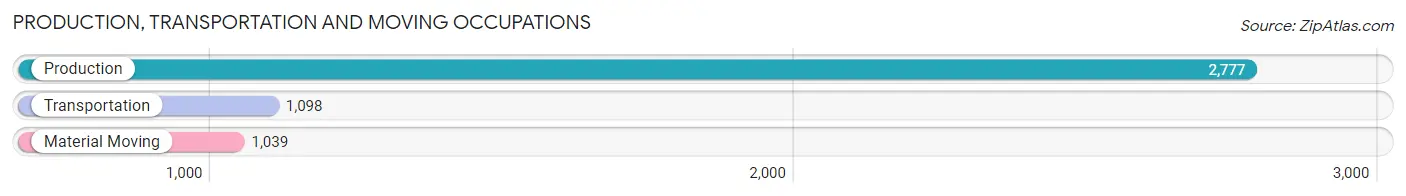
Production, Transportation and Moving Occupations
The most common Production, Transportation and Moving occupations in Midland County are Production (2,777 | 7.3%), Transportation (1,098 | 2.9%), and Material Moving (1,039 | 2.7%).
Production, Transportation and Moving Occupations by Sex
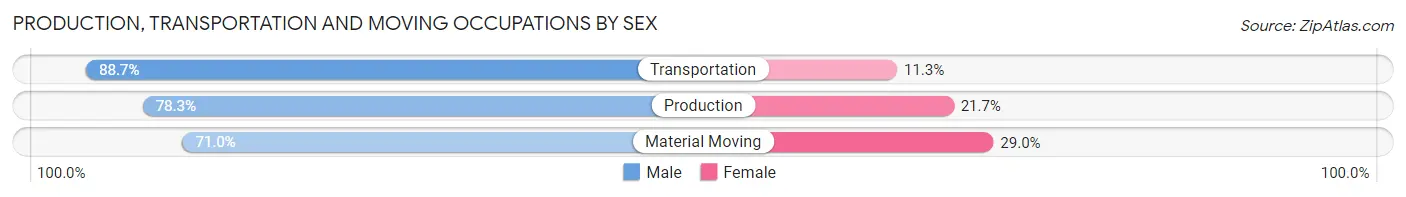
| Occupation | Male | Female |
| Production | 2,175 (78.3%) | 602 (21.7%) |
| Transportation | 974 (88.7%) | 124 (11.3%) |
| Material Moving | 738 (71.0%) | 301 (29.0%) |
| Total (Category) | 3,887 (79.1%) | 1,027 (20.9%) |
| Total (Overall) | 20,290 (53.2%) | 17,864 (46.8%) |
Employment Industries by Sex in Midland County
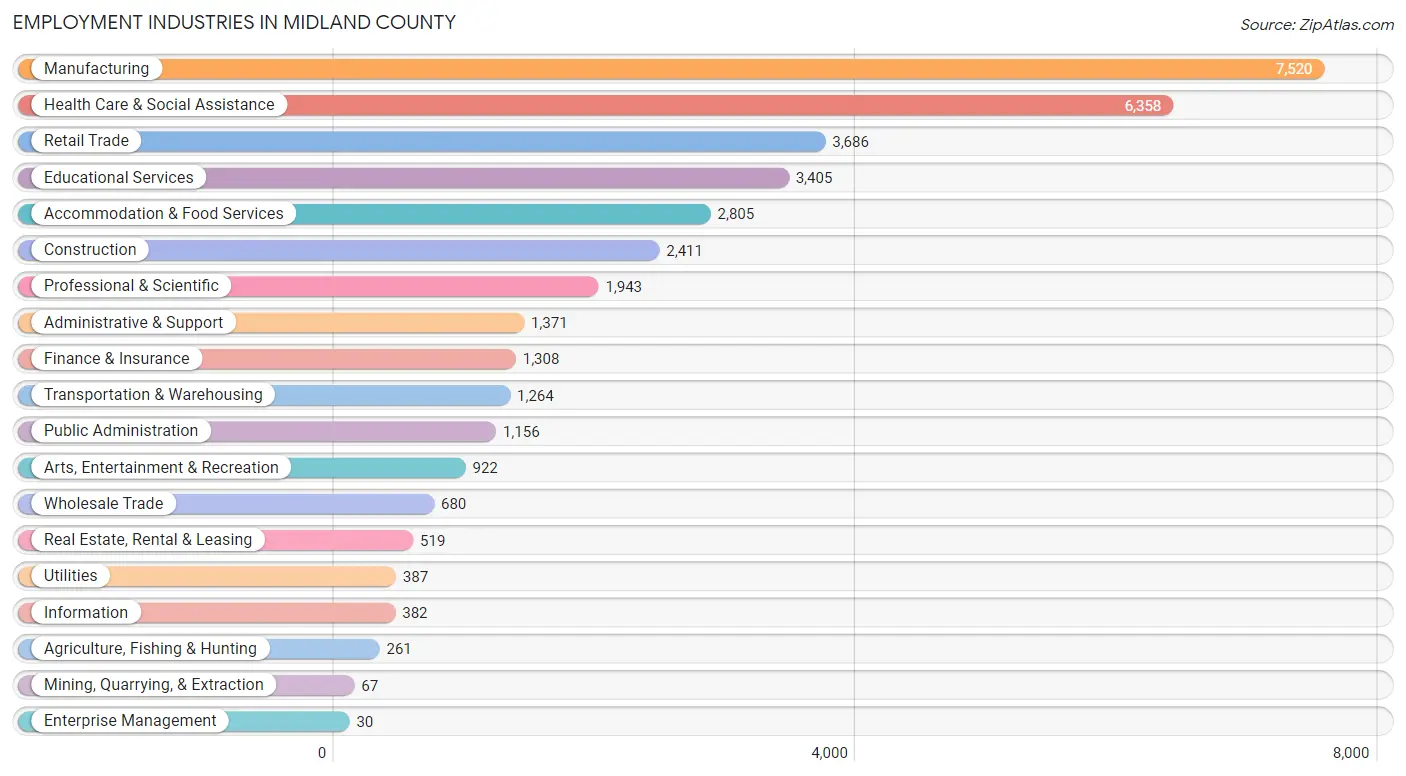
Employment Industries in Midland County
The major employment industries in Midland County include Manufacturing (7,520 | 19.7%), Health Care & Social Assistance (6,358 | 16.7%), Retail Trade (3,686 | 9.7%), Educational Services (3,405 | 8.9%), and Accommodation & Food Services (2,805 | 7.3%).
Employment Industries by Sex in Midland County
The Midland County industries that see more men than women are Mining, Quarrying, & Extraction (100.0%), Construction (87.6%), and Agriculture, Fishing & Hunting (80.8%), whereas the industries that tend to have a higher number of women are Enterprise Management (100.0%), Health Care & Social Assistance (79.5%), and Finance & Insurance (66.8%).
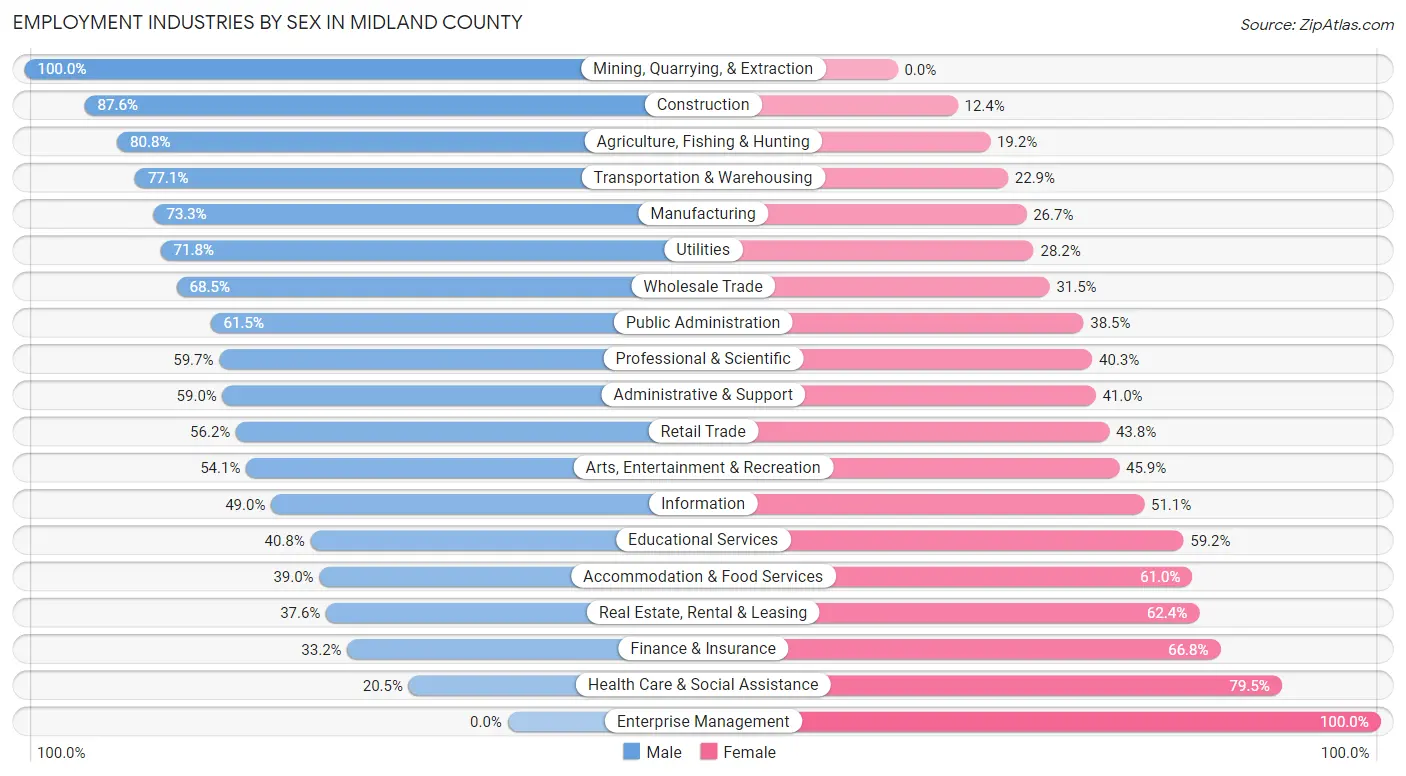
| Industry | Male | Female |
| Agriculture, Fishing & Hunting | 211 (80.8%) | 50 (19.2%) |
| Mining, Quarrying, & Extraction | 67 (100.0%) | 0 (0.0%) |
| Construction | 2,111 (87.6%) | 300 (12.4%) |
| Manufacturing | 5,515 (73.3%) | 2,005 (26.7%) |
| Wholesale Trade | 466 (68.5%) | 214 (31.5%) |
| Retail Trade | 2,072 (56.2%) | 1,614 (43.8%) |
| Transportation & Warehousing | 975 (77.1%) | 289 (22.9%) |
| Utilities | 278 (71.8%) | 109 (28.2%) |
| Information | 187 (48.9%) | 195 (51.0%) |
| Finance & Insurance | 434 (33.2%) | 874 (66.8%) |
| Real Estate, Rental & Leasing | 195 (37.6%) | 324 (62.4%) |
| Professional & Scientific | 1,160 (59.7%) | 783 (40.3%) |
| Enterprise Management | 0 (0.0%) | 30 (100.0%) |
| Administrative & Support | 809 (59.0%) | 562 (41.0%) |
| Educational Services | 1,390 (40.8%) | 2,015 (59.2%) |
| Health Care & Social Assistance | 1,302 (20.5%) | 5,056 (79.5%) |
| Arts, Entertainment & Recreation | 499 (54.1%) | 423 (45.9%) |
| Accommodation & Food Services | 1,093 (39.0%) | 1,712 (61.0%) |
| Public Administration | 711 (61.5%) | 445 (38.5%) |
| Total | 20,290 (53.2%) | 17,864 (46.8%) |
Education in Midland County
School Enrollment in Midland County
The most common levels of schooling among the 18,671 students in Midland County are high school (4,082 | 21.9%), middle school (4,003 | 21.4%), and elementary school (3,866 | 20.7%).
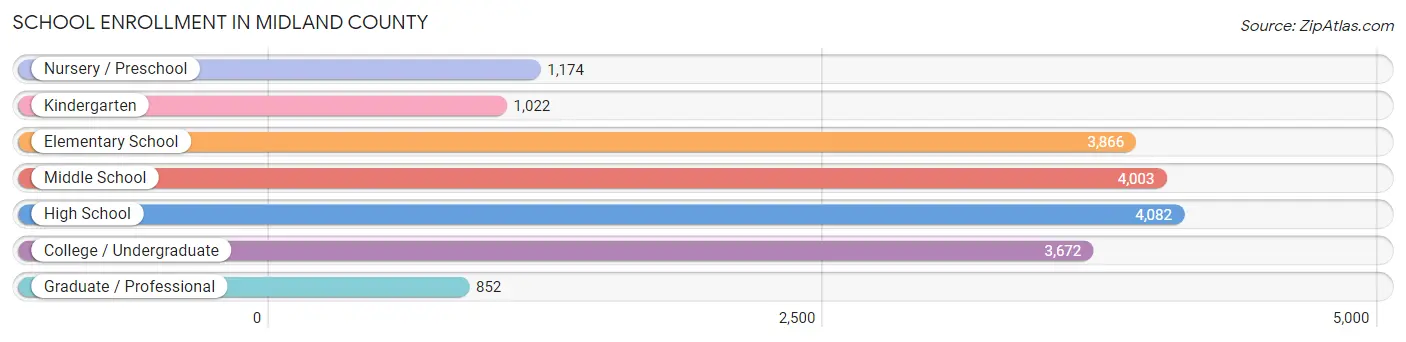
| School Level | # Students | % Students |
| Nursery / Preschool | 1,174 | 6.3% |
| Kindergarten | 1,022 | 5.5% |
| Elementary School | 3,866 | 20.7% |
| Middle School | 4,003 | 21.4% |
| High School | 4,082 | 21.9% |
| College / Undergraduate | 3,672 | 19.7% |
| Graduate / Professional | 852 | 4.6% |
| Total | 18,671 | 100.0% |
School Enrollment by Age by Funding Source in Midland County
Out of a total of 18,671 students who are enrolled in schools in Midland County, 2,595 (13.9%) attend a private institution, while the remaining 16,076 (86.1%) are enrolled in public schools. The age group of 3 to 4 year olds has the highest likelihood of being enrolled in private schools, with 343 (40.3% in the age bracket) enrolled. Conversely, the age group of 15 to 17 year olds has the lowest likelihood of being enrolled in a private school, with 3,024 (97.3% in the age bracket) attending a public institution.
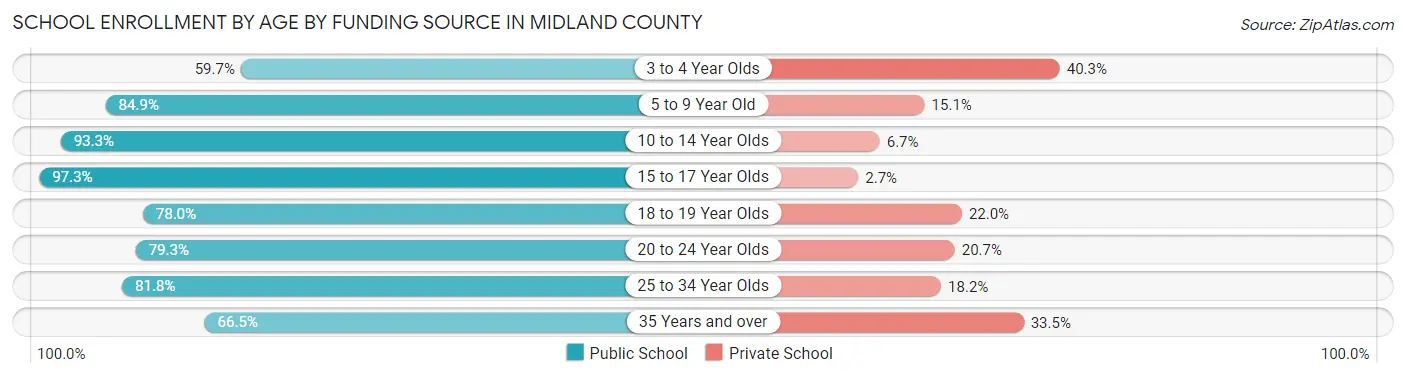
| Age Bracket | Public School | Private School |
| 3 to 4 Year Olds | 509 (59.7%) | 343 (40.3%) |
| 5 to 9 Year Old | 3,986 (84.9%) | 708 (15.1%) |
| 10 to 14 Year Olds | 4,562 (93.3%) | 329 (6.7%) |
| 15 to 17 Year Olds | 3,024 (97.3%) | 85 (2.7%) |
| 18 to 19 Year Olds | 1,193 (78.0%) | 337 (22.0%) |
| 20 to 24 Year Olds | 1,475 (79.3%) | 385 (20.7%) |
| 25 to 34 Year Olds | 888 (81.8%) | 197 (18.2%) |
| 35 Years and over | 432 (66.5%) | 218 (33.5%) |
| Total | 16,076 (86.1%) | 2,595 (13.9%) |
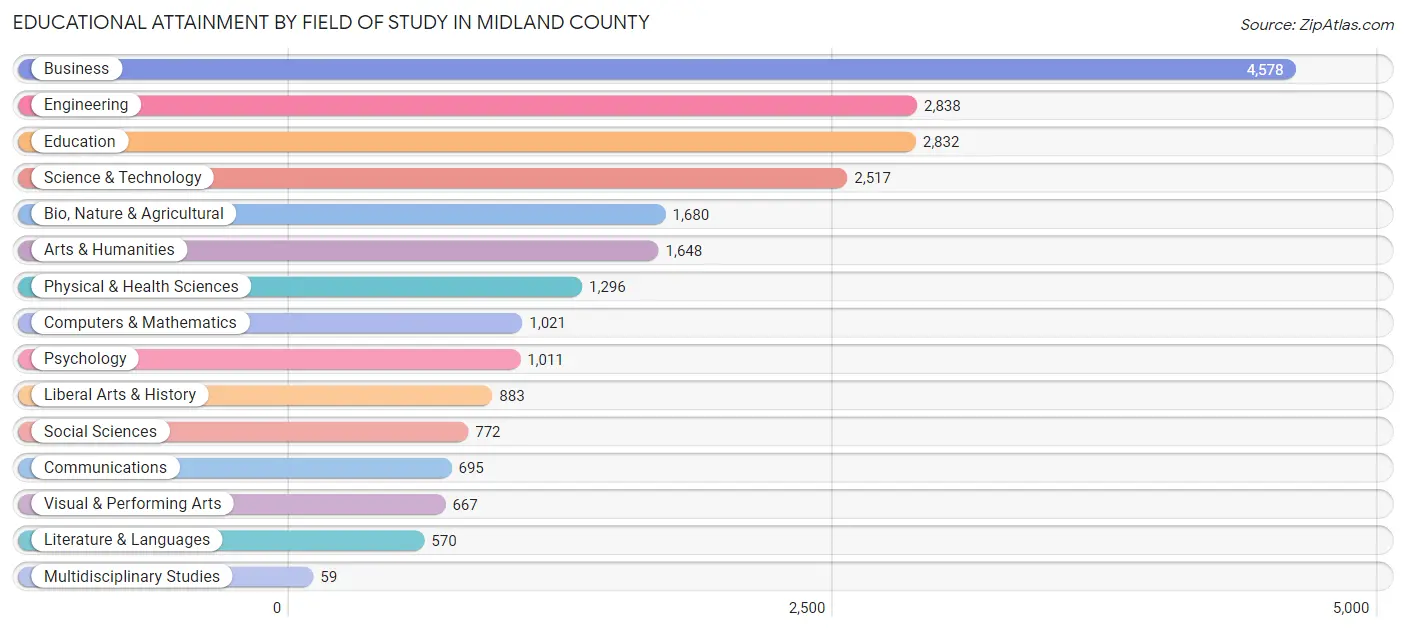
Educational Attainment by Field of Study in Midland County
Business (4,578 | 19.9%), engineering (2,838 | 12.3%), education (2,832 | 12.3%), science & technology (2,517 | 10.9%), and bio, nature & agricultural (1,680 | 7.3%) are the most common fields of study among 23,067 individuals in Midland County who have obtained a bachelor's degree or higher.
| Field of Study | # Graduates | % Graduates |
| Computers & Mathematics | 1,021 | 4.4% |
| Bio, Nature & Agricultural | 1,680 | 7.3% |
| Physical & Health Sciences | 1,296 | 5.6% |
| Psychology | 1,011 | 4.4% |
| Social Sciences | 772 | 3.4% |
| Engineering | 2,838 | 12.3% |
| Multidisciplinary Studies | 59 | 0.3% |
| Science & Technology | 2,517 | 10.9% |
| Business | 4,578 | 19.9% |
| Education | 2,832 | 12.3% |
| Literature & Languages | 570 | 2.5% |
| Liberal Arts & History | 883 | 3.8% |
| Visual & Performing Arts | 667 | 2.9% |
| Communications | 695 | 3.0% |
| Arts & Humanities | 1,648 | 7.1% |
| Total | 23,067 | 100.0% |
Transportation & Commute in Midland County
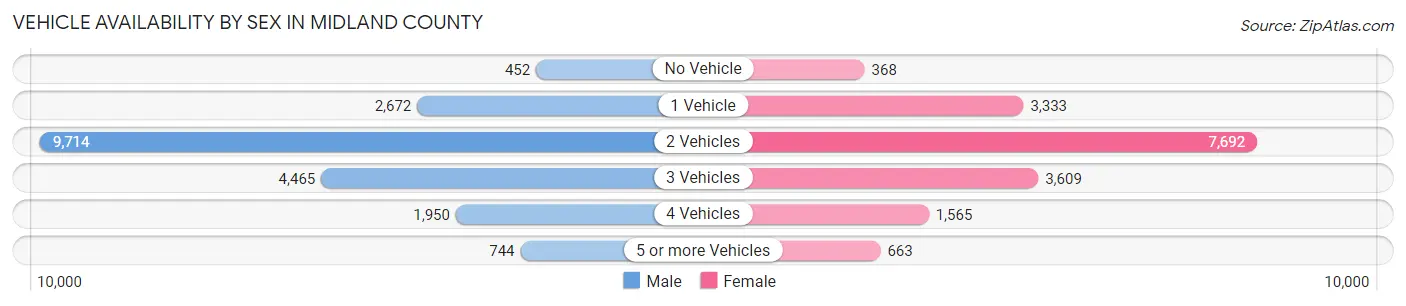
Vehicle Availability by Sex in Midland County
The most prevalent vehicle ownership categories in Midland County are males with 2 vehicles (9,714, accounting for 48.6%) and females with 2 vehicles (7,692, making up 56.4%).
| Vehicles Available | Male | Female |
| No Vehicle | 452 (2.3%) | 368 (2.1%) |
| 1 Vehicle | 2,672 (13.4%) | 3,333 (19.3%) |
| 2 Vehicles | 9,714 (48.6%) | 7,692 (44.6%) |
| 3 Vehicles | 4,465 (22.3%) | 3,609 (20.9%) |
| 4 Vehicles | 1,950 (9.8%) | 1,565 (9.1%) |
| 5 or more Vehicles | 744 (3.7%) | 663 (3.8%) |
| Total | 19,997 (100.0%) | 17,230 (100.0%) |
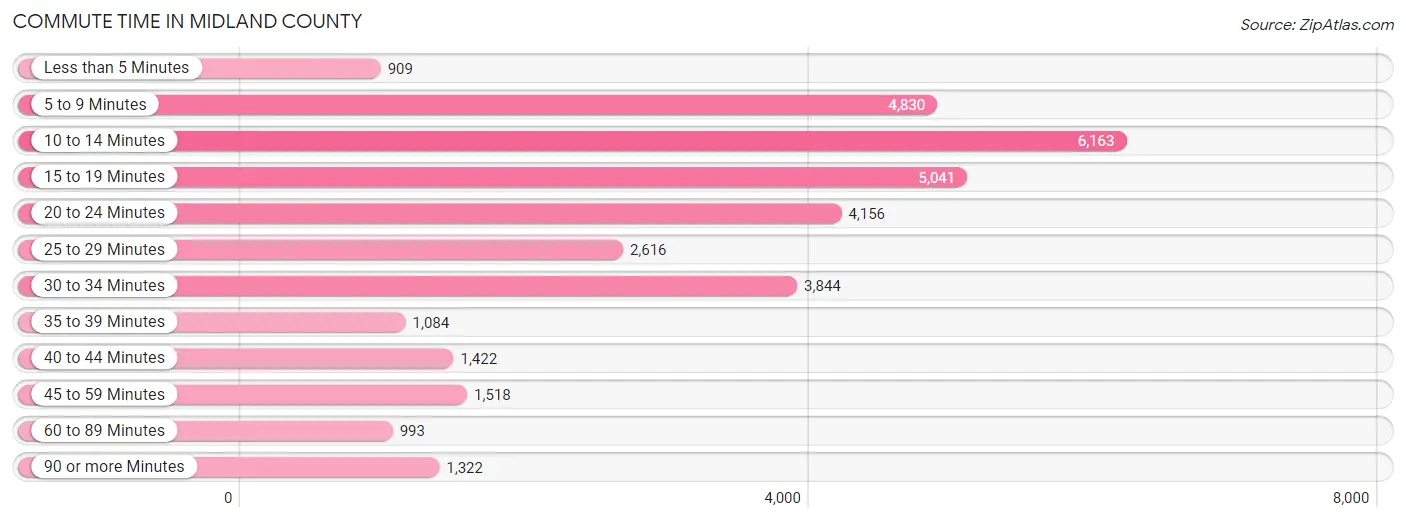
Commute Time in Midland County
The most frequently occuring commute durations in Midland County are 10 to 14 minutes (6,163 commuters, 18.2%), 15 to 19 minutes (5,041 commuters, 14.9%), and 5 to 9 minutes (4,830 commuters, 14.2%).
| Commute Time | # Commuters | % Commuters |
| Less than 5 Minutes | 909 | 2.7% |
| 5 to 9 Minutes | 4,830 | 14.2% |
| 10 to 14 Minutes | 6,163 | 18.2% |
| 15 to 19 Minutes | 5,041 | 14.9% |
| 20 to 24 Minutes | 4,156 | 12.3% |
| 25 to 29 Minutes | 2,616 | 7.7% |
| 30 to 34 Minutes | 3,844 | 11.3% |
| 35 to 39 Minutes | 1,084 | 3.2% |
| 40 to 44 Minutes | 1,422 | 4.2% |
| 45 to 59 Minutes | 1,518 | 4.5% |
| 60 to 89 Minutes | 993 | 2.9% |
| 90 or more Minutes | 1,322 | 3.9% |
Commute Time by Sex in Midland County
The most common commute times in Midland County are 10 to 14 minutes (3,325 commuters, 18.1%) for males and 10 to 14 minutes (2,838 commuters, 18.3%) for females.
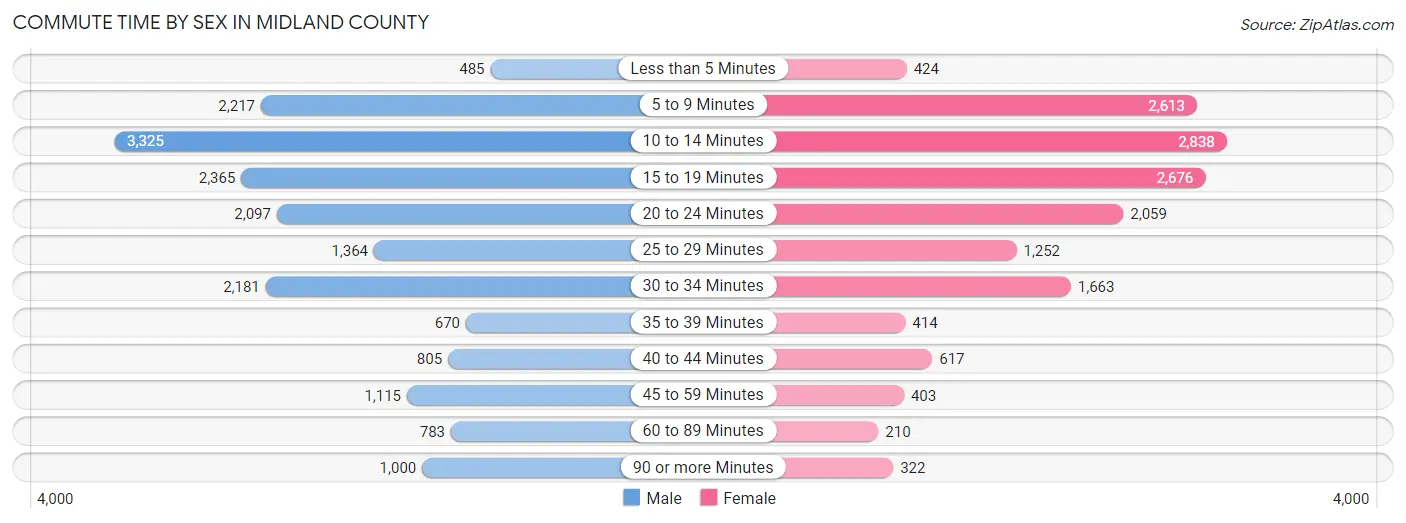
| Commute Time | Male | Female |
| Less than 5 Minutes | 485 (2.6%) | 424 (2.7%) |
| 5 to 9 Minutes | 2,217 (12.0%) | 2,613 (16.9%) |
| 10 to 14 Minutes | 3,325 (18.1%) | 2,838 (18.3%) |
| 15 to 19 Minutes | 2,365 (12.9%) | 2,676 (17.3%) |
| 20 to 24 Minutes | 2,097 (11.4%) | 2,059 (13.3%) |
| 25 to 29 Minutes | 1,364 (7.4%) | 1,252 (8.1%) |
| 30 to 34 Minutes | 2,181 (11.8%) | 1,663 (10.7%) |
| 35 to 39 Minutes | 670 (3.6%) | 414 (2.7%) |
| 40 to 44 Minutes | 805 (4.4%) | 617 (4.0%) |
| 45 to 59 Minutes | 1,115 (6.1%) | 403 (2.6%) |
| 60 to 89 Minutes | 783 (4.3%) | 210 (1.4%) |
| 90 or more Minutes | 1,000 (5.4%) | 322 (2.1%) |
Time of Departure to Work by Sex in Midland County
The most frequent times of departure to work in Midland County are 7:00 AM to 7:29 AM (2,948, 16.0%) for males and 7:30 AM to 7:59 AM (3,310, 21.4%) for females.
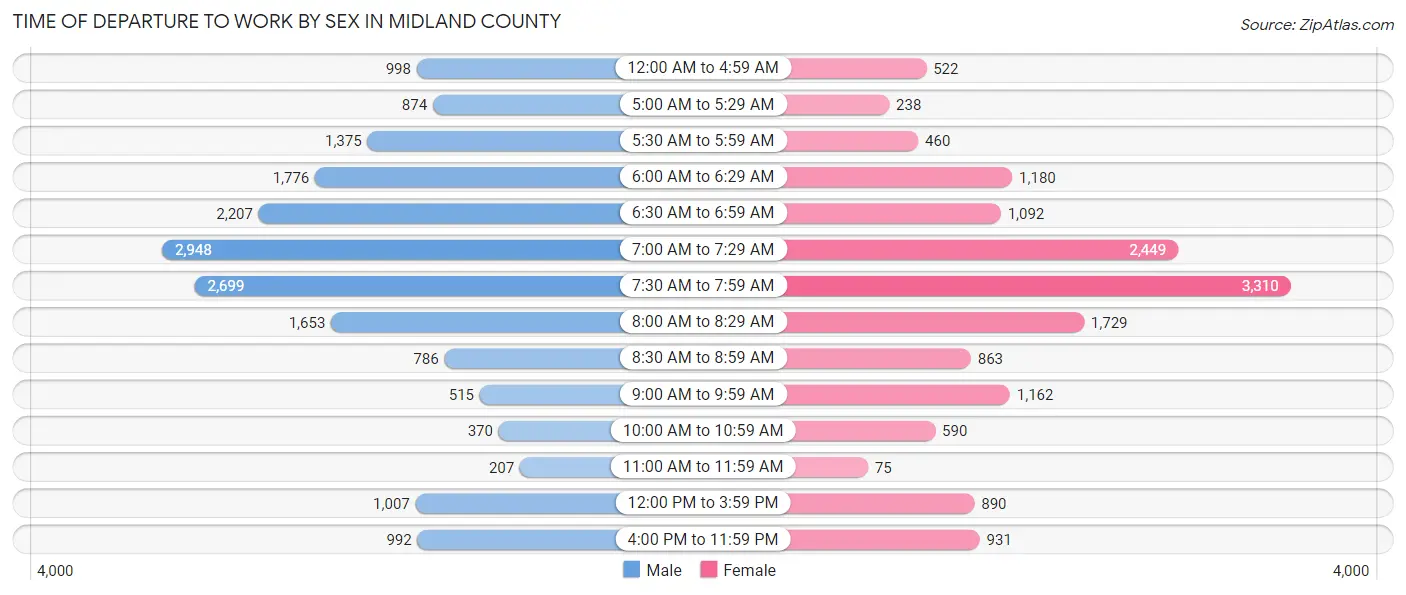
| Time of Departure | Male | Female |
| 12:00 AM to 4:59 AM | 998 (5.4%) | 522 (3.4%) |
| 5:00 AM to 5:29 AM | 874 (4.8%) | 238 (1.5%) |
| 5:30 AM to 5:59 AM | 1,375 (7.5%) | 460 (3.0%) |
| 6:00 AM to 6:29 AM | 1,776 (9.7%) | 1,180 (7.6%) |
| 6:30 AM to 6:59 AM | 2,207 (12.0%) | 1,092 (7.0%) |
| 7:00 AM to 7:29 AM | 2,948 (16.0%) | 2,449 (15.8%) |
| 7:30 AM to 7:59 AM | 2,699 (14.7%) | 3,310 (21.4%) |
| 8:00 AM to 8:29 AM | 1,653 (9.0%) | 1,729 (11.2%) |
| 8:30 AM to 8:59 AM | 786 (4.3%) | 863 (5.6%) |
| 9:00 AM to 9:59 AM | 515 (2.8%) | 1,162 (7.5%) |
| 10:00 AM to 10:59 AM | 370 (2.0%) | 590 (3.8%) |
| 11:00 AM to 11:59 AM | 207 (1.1%) | 75 (0.5%) |
| 12:00 PM to 3:59 PM | 1,007 (5.5%) | 890 (5.8%) |
| 4:00 PM to 11:59 PM | 992 (5.4%) | 931 (6.0%) |
| Total | 18,407 (100.0%) | 15,491 (100.0%) |
Housing Occupancy in Midland County
Occupancy by Ownership in Midland County
Of the total 34,336 dwellings in Midland County, owner-occupied units account for 26,769 (78.0%), while renter-occupied units make up 7,567 (22.0%).
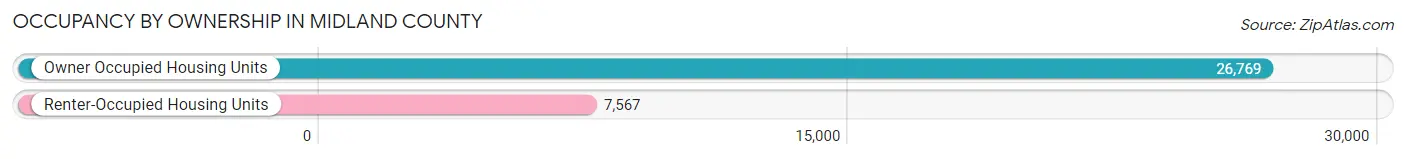
| Occupancy | # Housing Units | % Housing Units |
| Owner Occupied Housing Units | 26,769 | 78.0% |
| Renter-Occupied Housing Units | 7,567 | 22.0% |
| Total Occupied Housing Units | 34,336 | 100.0% |
Occupancy by Household Size in Midland County
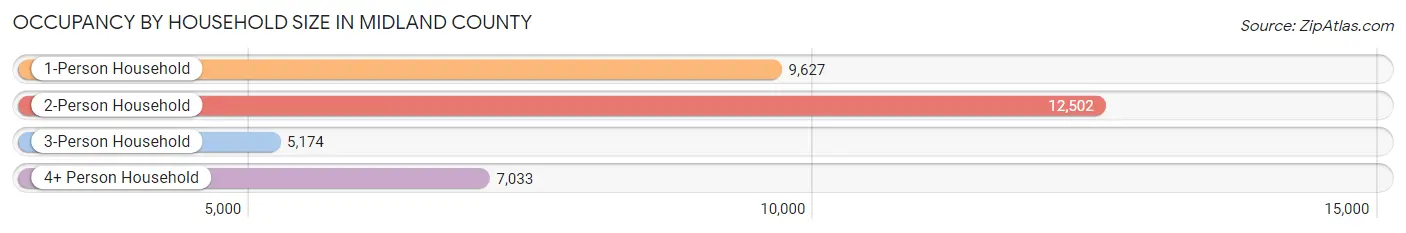
| Household Size | # Housing Units | % Housing Units |
| 1-Person Household | 9,627 | 28.0% |
| 2-Person Household | 12,502 | 36.4% |
| 3-Person Household | 5,174 | 15.1% |
| 4+ Person Household | 7,033 | 20.5% |
| Total Housing Units | 34,336 | 100.0% |
Occupancy by Ownership by Household Size in Midland County
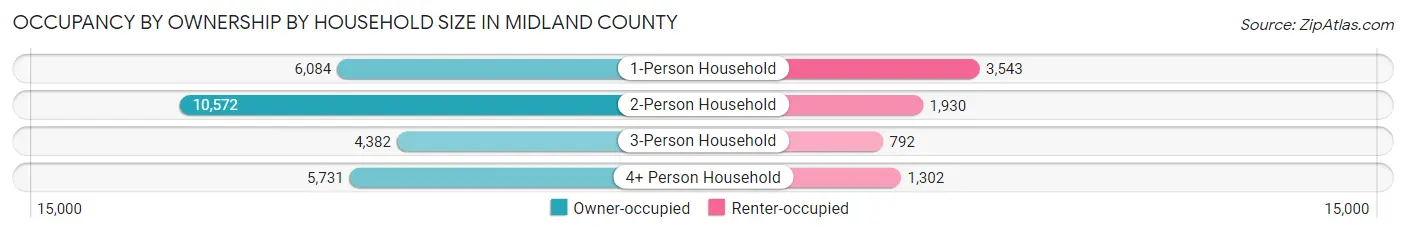
| Household Size | Owner-occupied | Renter-occupied |
| 1-Person Household | 6,084 (63.2%) | 3,543 (36.8%) |
| 2-Person Household | 10,572 (84.6%) | 1,930 (15.4%) |
| 3-Person Household | 4,382 (84.7%) | 792 (15.3%) |
| 4+ Person Household | 5,731 (81.5%) | 1,302 (18.5%) |
| Total Housing Units | 26,769 (78.0%) | 7,567 (22.0%) |
Occupancy by Educational Attainment in Midland County
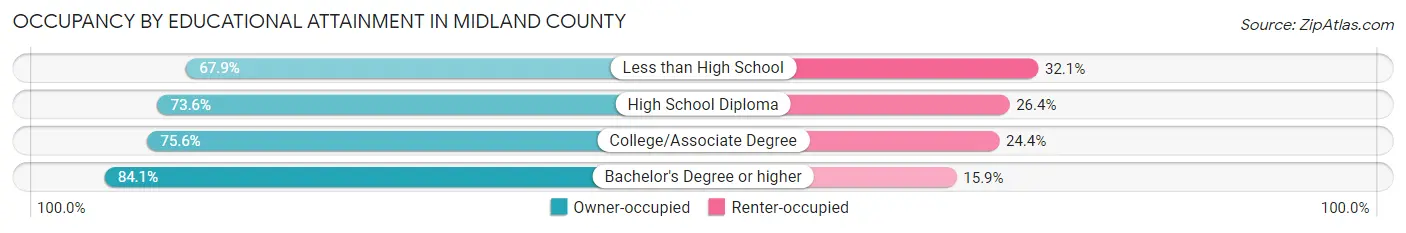
| Household Size | Owner-occupied | Renter-occupied |
| Less than High School | 1,016 (67.9%) | 480 (32.1%) |
| High School Diploma | 6,055 (73.6%) | 2,170 (26.4%) |
| College/Associate Degree | 8,979 (75.6%) | 2,891 (24.4%) |
| Bachelor's Degree or higher | 10,719 (84.1%) | 2,026 (15.9%) |
Occupancy by Age of Householder in Midland County
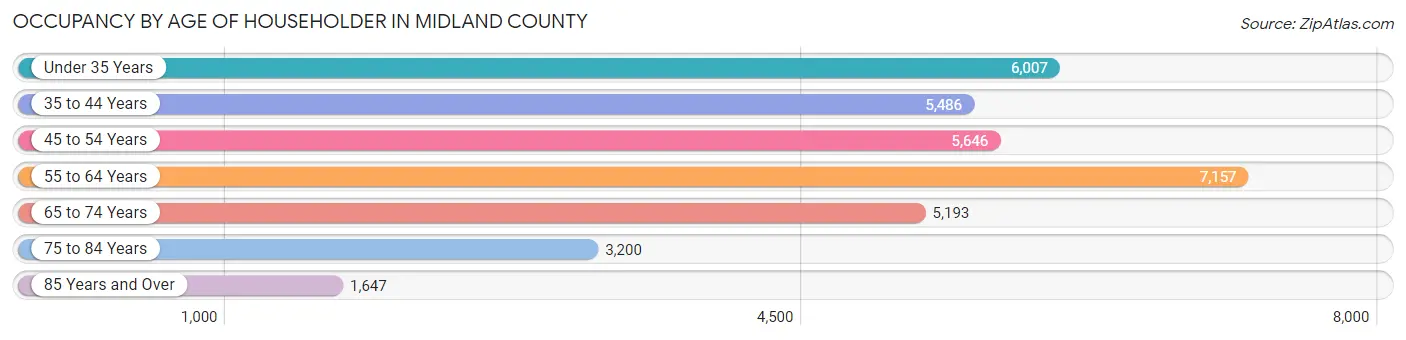
| Age Bracket | # Households | % Households |
| Under 35 Years | 6,007 | 17.5% |
| 35 to 44 Years | 5,486 | 16.0% |
| 45 to 54 Years | 5,646 | 16.4% |
| 55 to 64 Years | 7,157 | 20.8% |
| 65 to 74 Years | 5,193 | 15.1% |
| 75 to 84 Years | 3,200 | 9.3% |
| 85 Years and Over | 1,647 | 4.8% |
| Total | 34,336 | 100.0% |
Housing Finances in Midland County
Median Income by Occupancy in Midland County
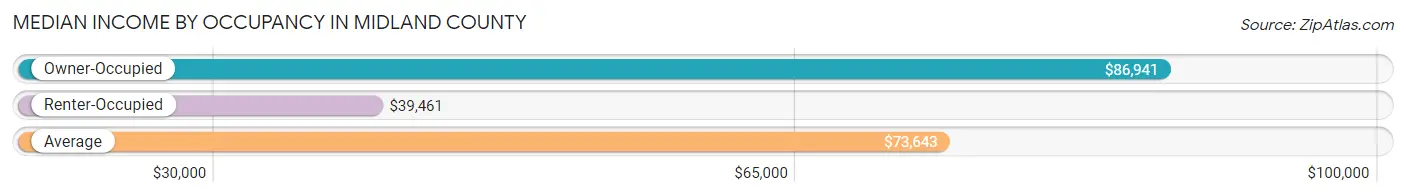
| Occupancy Type | # Households | Median Income |
| Owner-Occupied | 26,769 (78.0%) | $86,941 |
| Renter-Occupied | 7,567 (22.0%) | $39,461 |
| Average | 34,336 (100.0%) | $73,643 |
Occupancy by Householder Income Bracket in Midland County
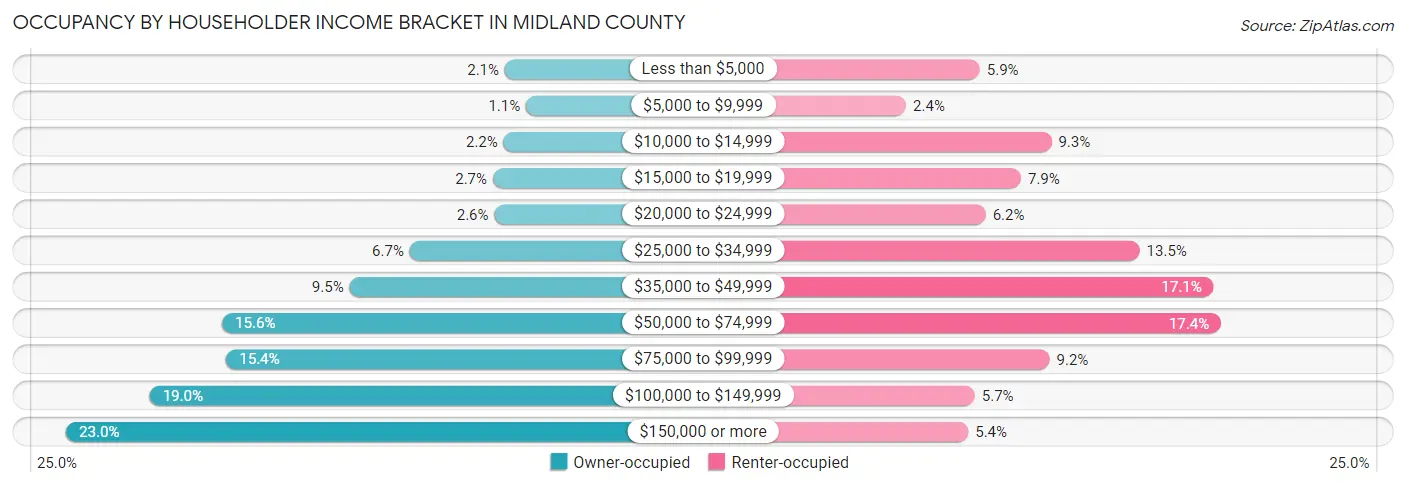
| Income Bracket | Owner-occupied | Renter-occupied |
| Less than $5,000 | 570 (2.1%) | 448 (5.9%) |
| $5,000 to $9,999 | 299 (1.1%) | 182 (2.4%) |
| $10,000 to $14,999 | 585 (2.2%) | 706 (9.3%) |
| $15,000 to $19,999 | 723 (2.7%) | 596 (7.9%) |
| $20,000 to $24,999 | 705 (2.6%) | 469 (6.2%) |
| $25,000 to $34,999 | 1,782 (6.7%) | 1,024 (13.5%) |
| $35,000 to $49,999 | 2,552 (9.5%) | 1,290 (17.1%) |
| $50,000 to $74,999 | 4,174 (15.6%) | 1,317 (17.4%) |
| $75,000 to $99,999 | 4,121 (15.4%) | 699 (9.2%) |
| $100,000 to $149,999 | 5,097 (19.0%) | 430 (5.7%) |
| $150,000 or more | 6,161 (23.0%) | 406 (5.4%) |
| Total | 26,769 (100.0%) | 7,567 (100.0%) |
Monthly Housing Cost Tiers in Midland County
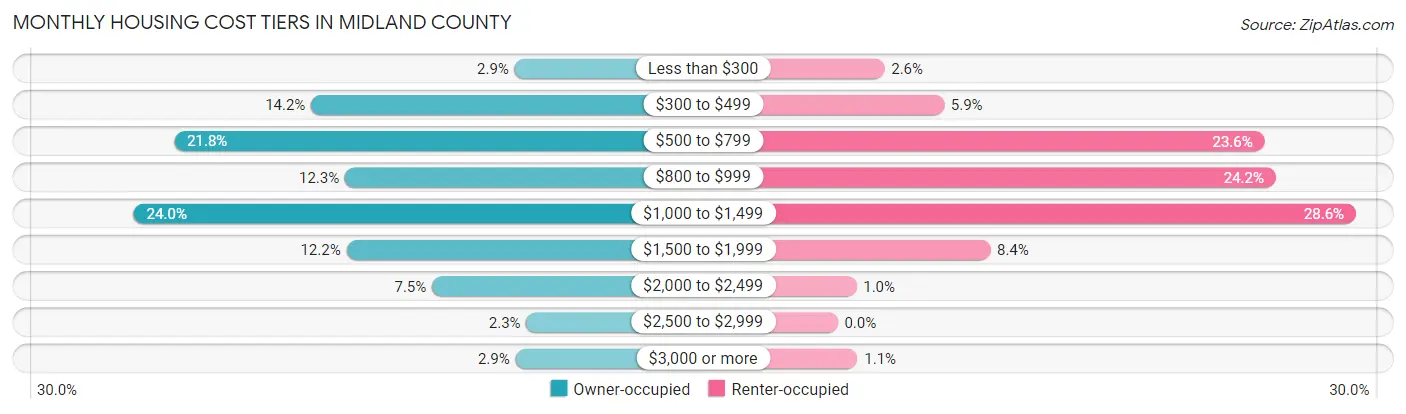
| Monthly Cost | Owner-occupied | Renter-occupied |
| Less than $300 | 785 (2.9%) | 196 (2.6%) |
| $300 to $499 | 3,794 (14.2%) | 445 (5.9%) |
| $500 to $799 | 5,823 (21.7%) | 1,785 (23.6%) |
| $800 to $999 | 3,292 (12.3%) | 1,832 (24.2%) |
| $1,000 to $1,499 | 6,420 (24.0%) | 2,167 (28.6%) |
| $1,500 to $1,999 | 3,270 (12.2%) | 638 (8.4%) |
| $2,000 to $2,499 | 2,005 (7.5%) | 79 (1.0%) |
| $2,500 to $2,999 | 609 (2.3%) | 0 (0.0%) |
| $3,000 or more | 771 (2.9%) | 83 (1.1%) |
| Total | 26,769 (100.0%) | 7,567 (100.0%) |
Physical Housing Characteristics in Midland County
Housing Structures in Midland County
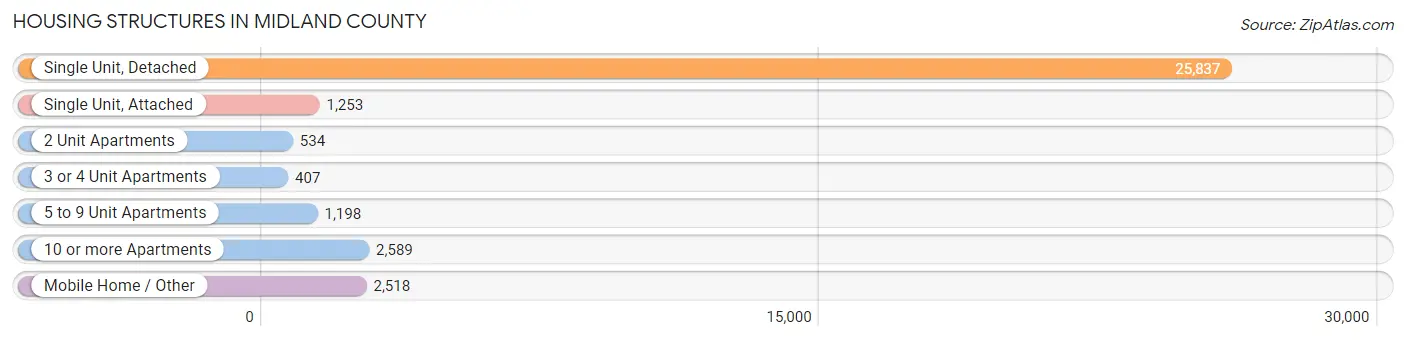
| Structure Type | # Housing Units | % Housing Units |
| Single Unit, Detached | 25,837 | 75.2% |
| Single Unit, Attached | 1,253 | 3.6% |
| 2 Unit Apartments | 534 | 1.6% |
| 3 or 4 Unit Apartments | 407 | 1.2% |
| 5 to 9 Unit Apartments | 1,198 | 3.5% |
| 10 or more Apartments | 2,589 | 7.5% |
| Mobile Home / Other | 2,518 | 7.3% |
| Total | 34,336 | 100.0% |
Housing Structures by Occupancy in Midland County
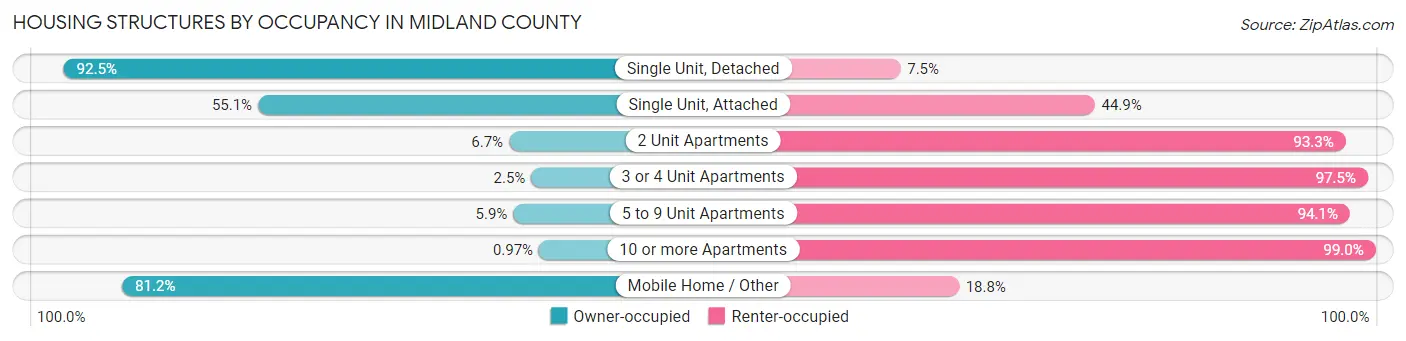
| Structure Type | Owner-occupied | Renter-occupied |
| Single Unit, Detached | 23,892 (92.5%) | 1,945 (7.5%) |
| Single Unit, Attached | 690 (55.1%) | 563 (44.9%) |
| 2 Unit Apartments | 36 (6.7%) | 498 (93.3%) |
| 3 or 4 Unit Apartments | 10 (2.5%) | 397 (97.5%) |
| 5 to 9 Unit Apartments | 71 (5.9%) | 1,127 (94.1%) |
| 10 or more Apartments | 25 (1.0%) | 2,564 (99.0%) |
| Mobile Home / Other | 2,045 (81.2%) | 473 (18.8%) |
| Total | 26,769 (78.0%) | 7,567 (22.0%) |
Housing Structures by Number of Rooms in Midland County
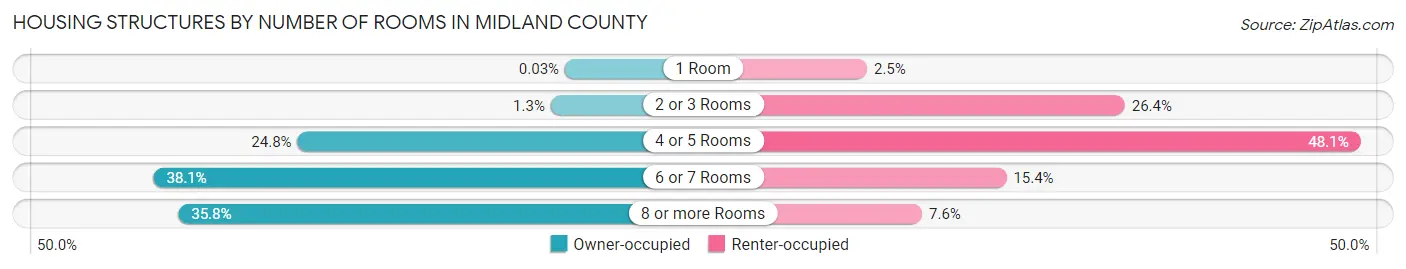
| Number of Rooms | Owner-occupied | Renter-occupied |
| 1 Room | 8 (0.0%) | 190 (2.5%) |
| 2 or 3 Rooms | 358 (1.3%) | 1,994 (26.4%) |
| 4 or 5 Rooms | 6,631 (24.8%) | 3,643 (48.1%) |
| 6 or 7 Rooms | 10,194 (38.1%) | 1,165 (15.4%) |
| 8 or more Rooms | 9,578 (35.8%) | 575 (7.6%) |
| Total | 26,769 (100.0%) | 7,567 (100.0%) |
Housing Structure by Heating Type in Midland County
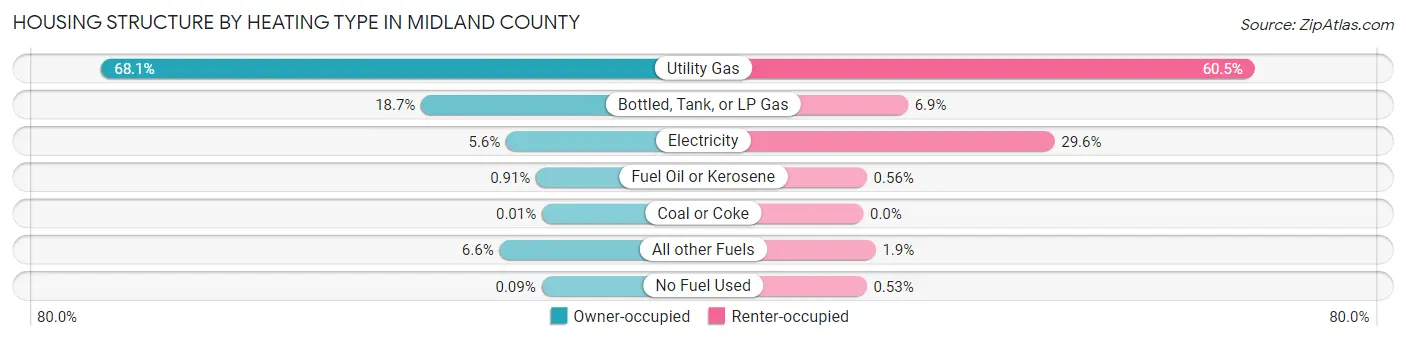
| Heating Type | Owner-occupied | Renter-occupied |
| Utility Gas | 18,241 (68.1%) | 4,581 (60.5%) |
| Bottled, Tank, or LP Gas | 5,003 (18.7%) | 522 (6.9%) |
| Electricity | 1,489 (5.6%) | 2,237 (29.6%) |
| Fuel Oil or Kerosene | 244 (0.9%) | 42 (0.6%) |
| Coal or Coke | 3 (0.0%) | 0 (0.0%) |
| All other Fuels | 1,764 (6.6%) | 145 (1.9%) |
| No Fuel Used | 25 (0.1%) | 40 (0.5%) |
| Total | 26,769 (100.0%) | 7,567 (100.0%) |
Household Vehicle Usage in Midland County
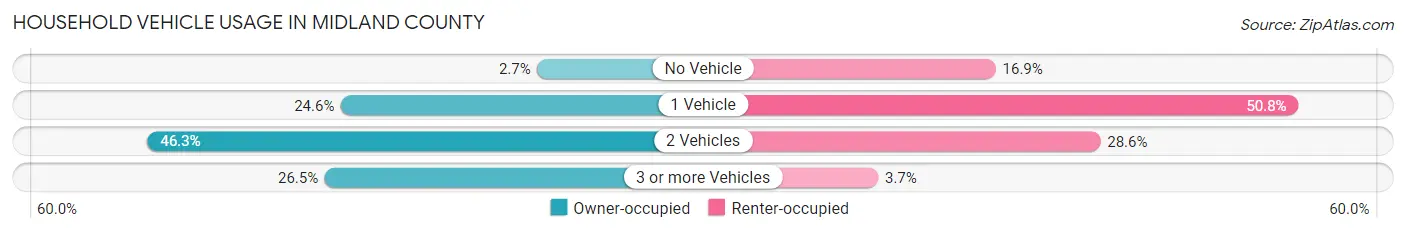
| Vehicles per Household | Owner-occupied | Renter-occupied |
| No Vehicle | 710 (2.6%) | 1,277 (16.9%) |
| 1 Vehicle | 6,596 (24.6%) | 3,844 (50.8%) |
| 2 Vehicles | 12,380 (46.3%) | 2,165 (28.6%) |
| 3 or more Vehicles | 7,083 (26.5%) | 281 (3.7%) |
| Total | 26,769 (100.0%) | 7,567 (100.0%) |
Real Estate & Mortgages in Midland County
Real Estate and Mortgage Overview in Midland County
| Characteristic | Without Mortgage | With Mortgage |
| Housing Units | 11,772 | 14,997 |
| Median Property Value | $160,000 | $181,200 |
| Median Household Income | $64,425 | $4,138 |
| Monthly Housing Costs | $574 | $727 |
| Real Estate Taxes | $2,657 | $429 |
Property Value by Mortgage Status in Midland County
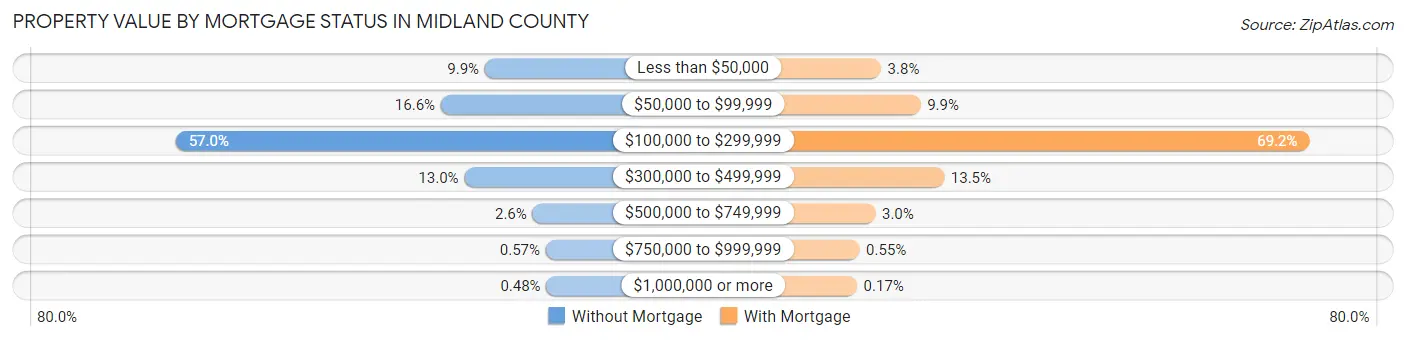
| Property Value | Without Mortgage | With Mortgage |
| Less than $50,000 | 1,160 (9.9%) | 575 (3.8%) |
| $50,000 to $99,999 | 1,950 (16.6%) | 1,479 (9.9%) |
| $100,000 to $299,999 | 6,706 (57.0%) | 10,371 (69.2%) |
| $300,000 to $499,999 | 1,528 (13.0%) | 2,019 (13.5%) |
| $500,000 to $749,999 | 305 (2.6%) | 445 (3.0%) |
| $750,000 to $999,999 | 67 (0.6%) | 82 (0.5%) |
| $1,000,000 or more | 56 (0.5%) | 26 (0.2%) |
| Total | 11,772 (100.0%) | 14,997 (100.0%) |
Household Income by Mortgage Status in Midland County
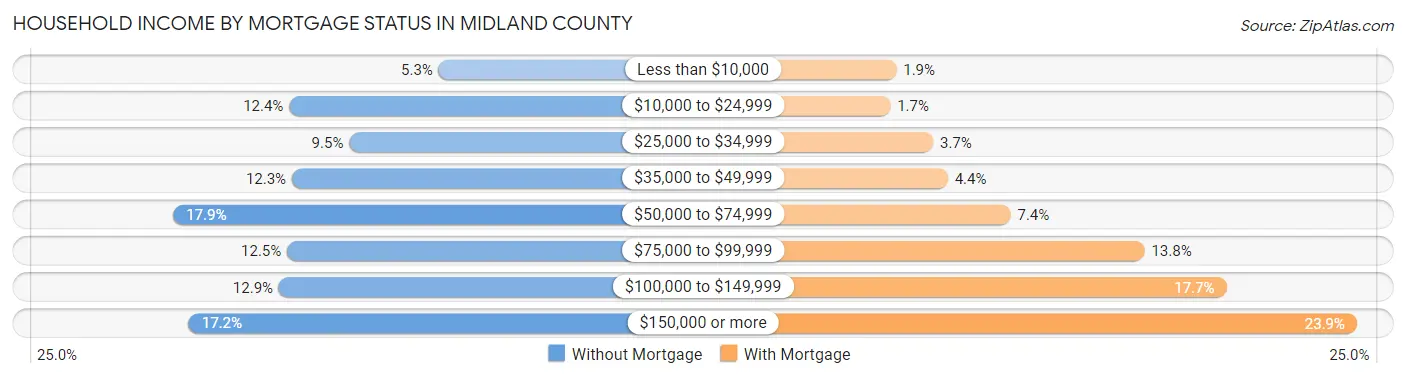
| Household Income | Without Mortgage | With Mortgage |
| Less than $10,000 | 622 (5.3%) | 291 (1.9%) |
| $10,000 to $24,999 | 1,460 (12.4%) | 247 (1.7%) |
| $25,000 to $34,999 | 1,123 (9.5%) | 553 (3.7%) |
| $35,000 to $49,999 | 1,445 (12.3%) | 659 (4.4%) |
| $50,000 to $74,999 | 2,110 (17.9%) | 1,107 (7.4%) |
| $75,000 to $99,999 | 1,472 (12.5%) | 2,064 (13.8%) |
| $100,000 to $149,999 | 1,517 (12.9%) | 2,649 (17.7%) |
| $150,000 or more | 2,023 (17.2%) | 3,580 (23.9%) |
| Total | 11,772 (100.0%) | 14,997 (100.0%) |
Property Value to Household Income Ratio in Midland County
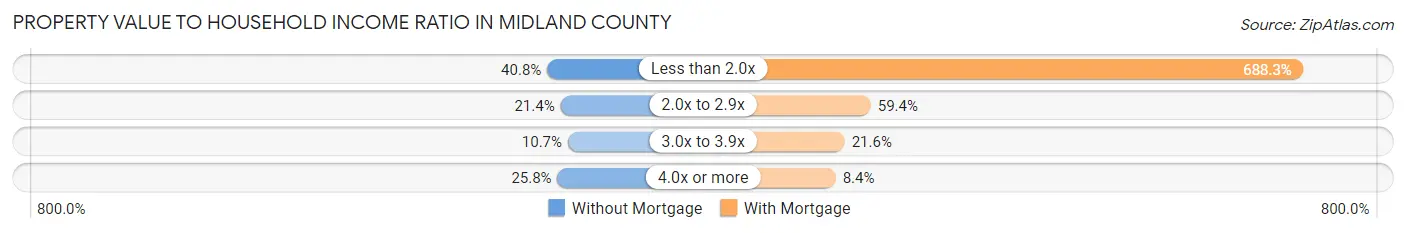
| Value-to-Income Ratio | Without Mortgage | With Mortgage |
| Less than 2.0x | 4,799 (40.8%) | 103,222 (688.3%) |
| 2.0x to 2.9x | 2,522 (21.4%) | 8,908 (59.4%) |
| 3.0x to 3.9x | 1,256 (10.7%) | 3,234 (21.6%) |
| 4.0x or more | 3,038 (25.8%) | 1,261 (8.4%) |
| Total | 11,772 (100.0%) | 14,997 (100.0%) |
Real Estate Taxes by Mortgage Status in Midland County
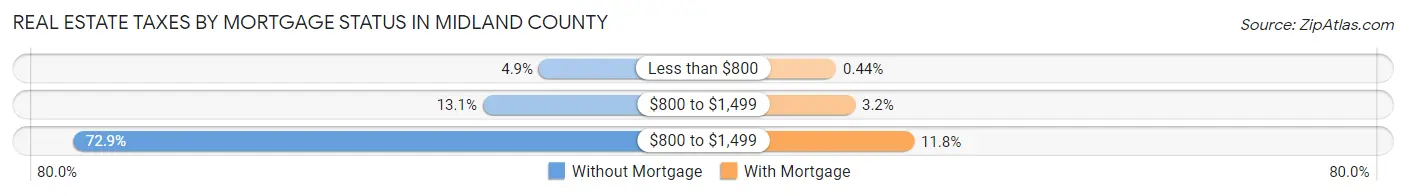
| Property Taxes | Without Mortgage | With Mortgage |
| Less than $800 | 572 (4.9%) | 66 (0.4%) |
| $800 to $1,499 | 1,538 (13.1%) | 482 (3.2%) |
| $800 to $1,499 | 8,586 (72.9%) | 1,776 (11.8%) |
| Total | 11,772 (100.0%) | 14,997 (100.0%) |
Health & Disability in Midland County
Health Insurance Coverage by Age in Midland County
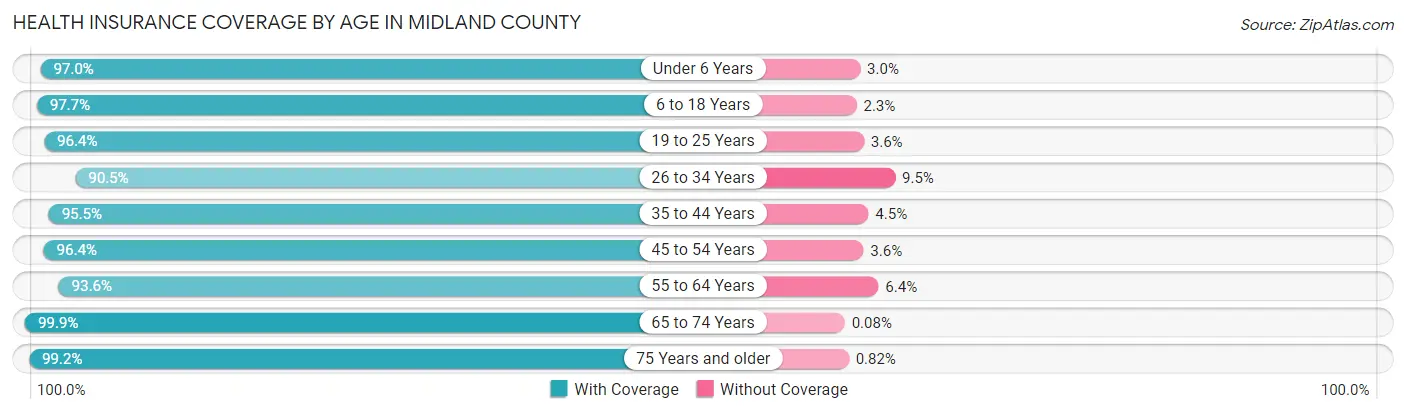
| Age Bracket | With Coverage | Without Coverage |
| Under 6 Years | 5,377 (97.0%) | 164 (3.0%) |
| 6 to 18 Years | 12,747 (97.7%) | 298 (2.3%) |
| 19 to 25 Years | 6,357 (96.4%) | 240 (3.6%) |
| 26 to 34 Years | 8,222 (90.5%) | 860 (9.5%) |
| 35 to 44 Years | 9,813 (95.5%) | 462 (4.5%) |
| 45 to 54 Years | 10,093 (96.4%) | 373 (3.6%) |
| 55 to 64 Years | 11,099 (93.6%) | 754 (6.4%) |
| 65 to 74 Years | 8,957 (99.9%) | 7 (0.1%) |
| 75 Years and older | 6,894 (99.2%) | 57 (0.8%) |
| Total | 79,559 (96.1%) | 3,215 (3.9%) |
Health Insurance Coverage by Citizenship Status in Midland County
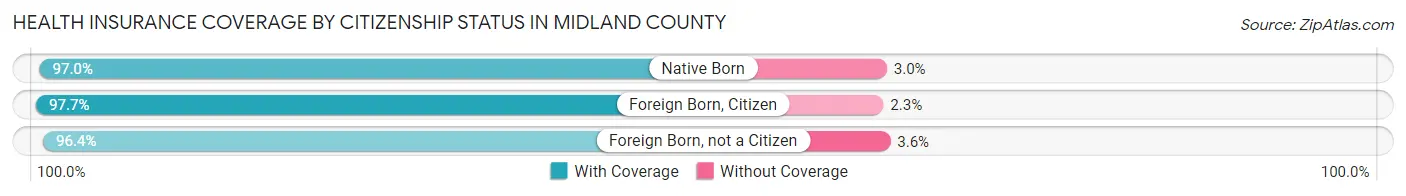
| Citizenship Status | With Coverage | Without Coverage |
| Native Born | 5,377 (97.0%) | 164 (3.0%) |
| Foreign Born, Citizen | 12,747 (97.7%) | 298 (2.3%) |
| Foreign Born, not a Citizen | 6,357 (96.4%) | 240 (3.6%) |
Health Insurance Coverage by Household Income in Midland County
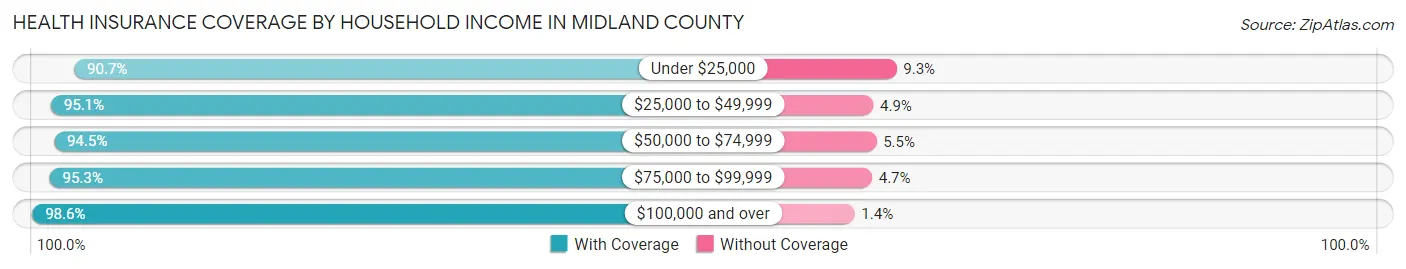
| Household Income | With Coverage | Without Coverage |
| Under $25,000 | 7,516 (90.7%) | 770 (9.3%) |
| $25,000 to $49,999 | 12,291 (95.1%) | 638 (4.9%) |
| $50,000 to $74,999 | 11,638 (94.5%) | 678 (5.5%) |
| $75,000 to $99,999 | 11,845 (95.3%) | 581 (4.7%) |
| $100,000 and over | 35,663 (98.6%) | 518 (1.4%) |
Public vs Private Health Insurance Coverage by Age in Midland County
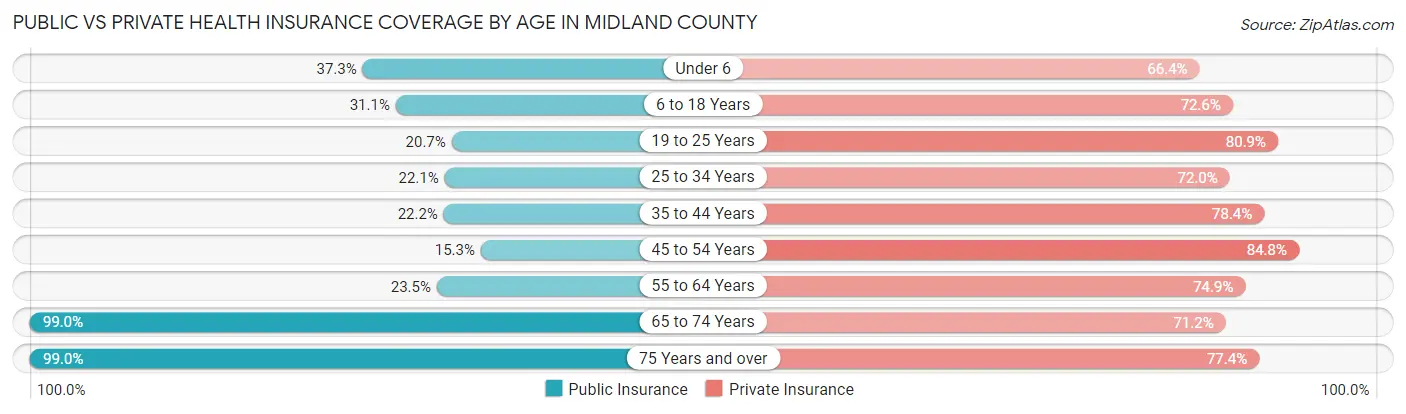
| Age Bracket | Public Insurance | Private Insurance |
| Under 6 | 2,065 (37.3%) | 3,678 (66.4%) |
| 6 to 18 Years | 4,058 (31.1%) | 9,466 (72.6%) |
| 19 to 25 Years | 1,368 (20.7%) | 5,339 (80.9%) |
| 25 to 34 Years | 2,003 (22.1%) | 6,537 (72.0%) |
| 35 to 44 Years | 2,282 (22.2%) | 8,054 (78.4%) |
| 45 to 54 Years | 1,603 (15.3%) | 8,877 (84.8%) |
| 55 to 64 Years | 2,784 (23.5%) | 8,876 (74.9%) |
| 65 to 74 Years | 8,877 (99.0%) | 6,383 (71.2%) |
| 75 Years and over | 6,880 (99.0%) | 5,382 (77.4%) |
| Total | 31,920 (38.6%) | 62,592 (75.6%) |
Disability Status by Sex by Age in Midland County
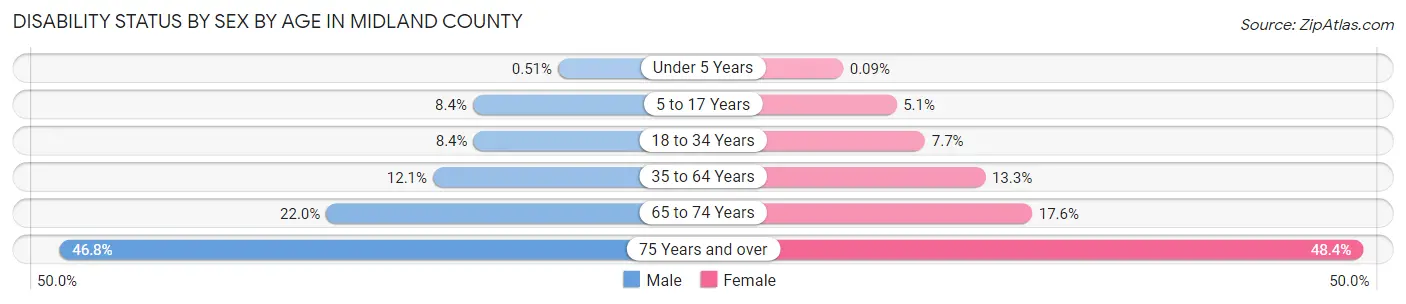
| Age Bracket | Male | Female |
| Under 5 Years | 12 (0.5%) | 2 (0.1%) |
| 5 to 17 Years | 570 (8.4%) | 321 (5.1%) |
| 18 to 34 Years | 711 (8.4%) | 628 (7.7%) |
| 35 to 64 Years | 1,990 (12.1%) | 2,148 (13.3%) |
| 65 to 74 Years | 930 (22.0%) | 836 (17.6%) |
| 75 Years and over | 1,345 (46.8%) | 1,971 (48.4%) |
Disability Class by Sex by Age in Midland County
Disability Class: Hearing Difficulty
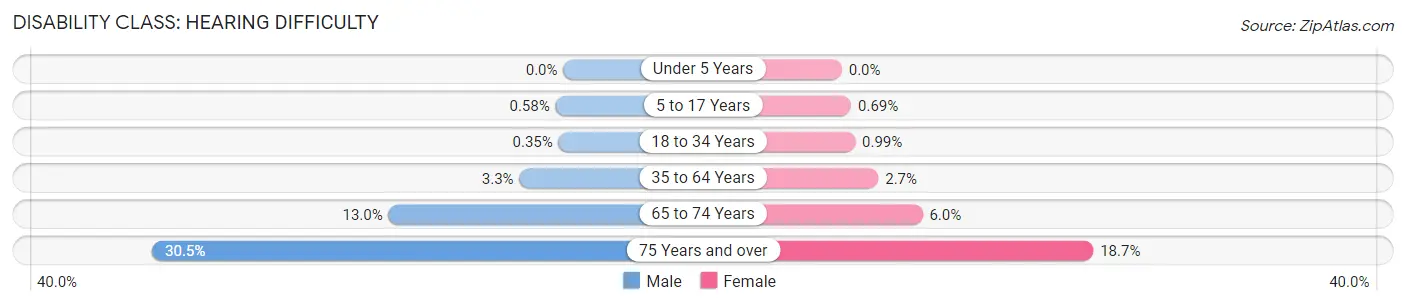
| Age Bracket | Male | Female |
| Under 5 Years | 0 (0.0%) | 0 (0.0%) |
| 5 to 17 Years | 39 (0.6%) | 44 (0.7%) |
| 18 to 34 Years | 30 (0.4%) | 81 (1.0%) |
| 35 to 64 Years | 536 (3.3%) | 438 (2.7%) |
| 65 to 74 Years | 548 (13.0%) | 284 (6.0%) |
| 75 Years and over | 878 (30.5%) | 761 (18.7%) |
Disability Class: Vision Difficulty
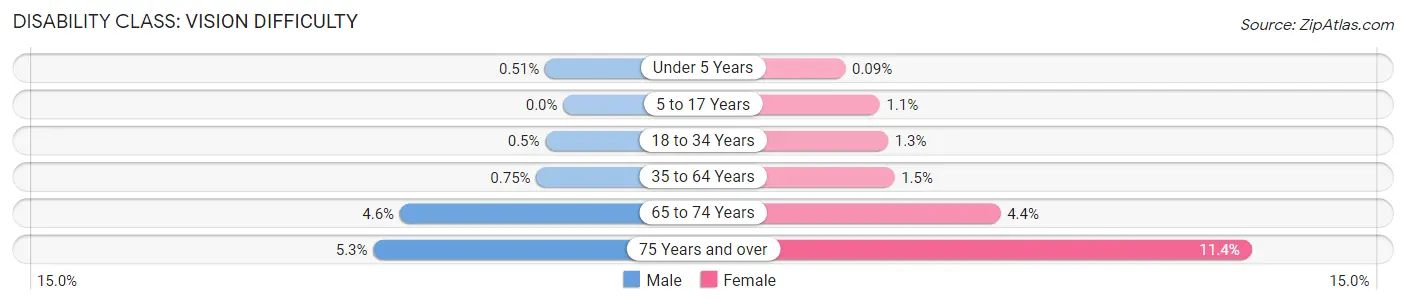
| Age Bracket | Male | Female |
| Under 5 Years | 12 (0.5%) | 2 (0.1%) |
| 5 to 17 Years | 0 (0.0%) | 67 (1.1%) |
| 18 to 34 Years | 43 (0.5%) | 104 (1.3%) |
| 35 to 64 Years | 123 (0.7%) | 236 (1.5%) |
| 65 to 74 Years | 192 (4.5%) | 209 (4.4%) |
| 75 Years and over | 152 (5.3%) | 465 (11.4%) |
Disability Class: Cognitive Difficulty
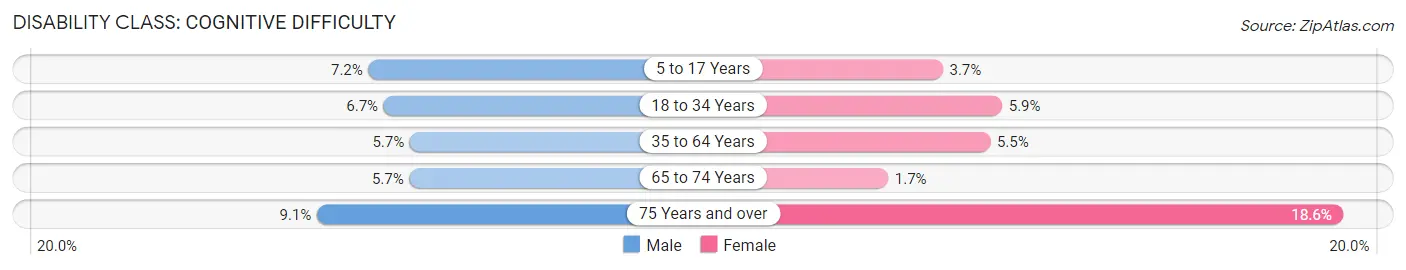
| Age Bracket | Male | Female |
| 5 to 17 Years | 490 (7.2%) | 238 (3.7%) |
| 18 to 34 Years | 567 (6.7%) | 484 (5.9%) |
| 35 to 64 Years | 935 (5.7%) | 890 (5.5%) |
| 65 to 74 Years | 241 (5.7%) | 81 (1.7%) |
| 75 Years and over | 263 (9.1%) | 759 (18.6%) |
Disability Class: Ambulatory Difficulty
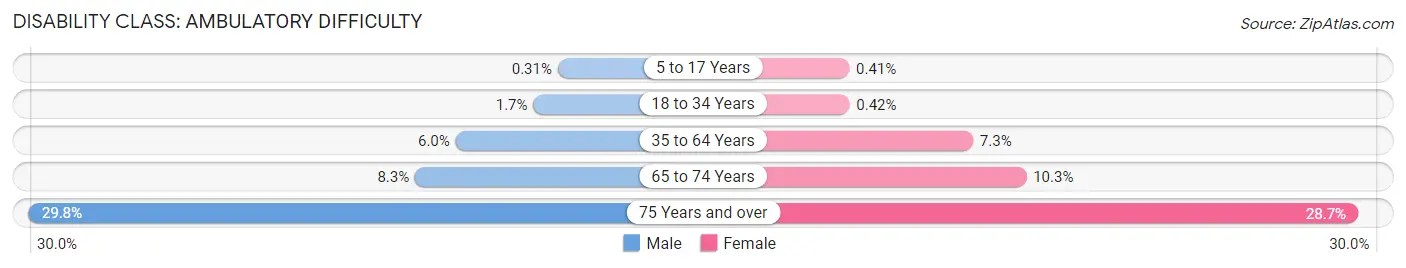
| Age Bracket | Male | Female |
| 5 to 17 Years | 21 (0.3%) | 26 (0.4%) |
| 18 to 34 Years | 142 (1.7%) | 34 (0.4%) |
| 35 to 64 Years | 986 (6.0%) | 1,180 (7.3%) |
| 65 to 74 Years | 349 (8.3%) | 487 (10.3%) |
| 75 Years and over | 856 (29.8%) | 1,171 (28.7%) |
Disability Class: Self-Care Difficulty
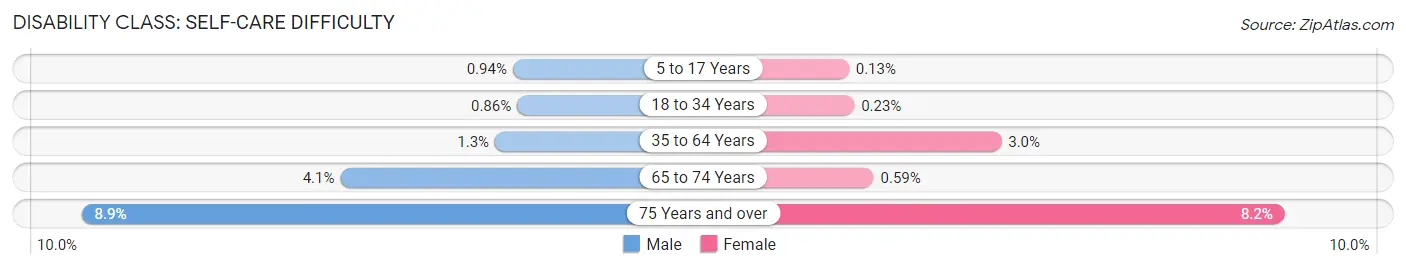
| Age Bracket | Male | Female |
| 5 to 17 Years | 64 (0.9%) | 8 (0.1%) |
| 18 to 34 Years | 73 (0.9%) | 19 (0.2%) |
| 35 to 64 Years | 208 (1.3%) | 479 (3.0%) |
| 65 to 74 Years | 175 (4.1%) | 28 (0.6%) |
| 75 Years and over | 257 (8.9%) | 335 (8.2%) |
Technology Access in Midland County
Computing Device Access in Midland County
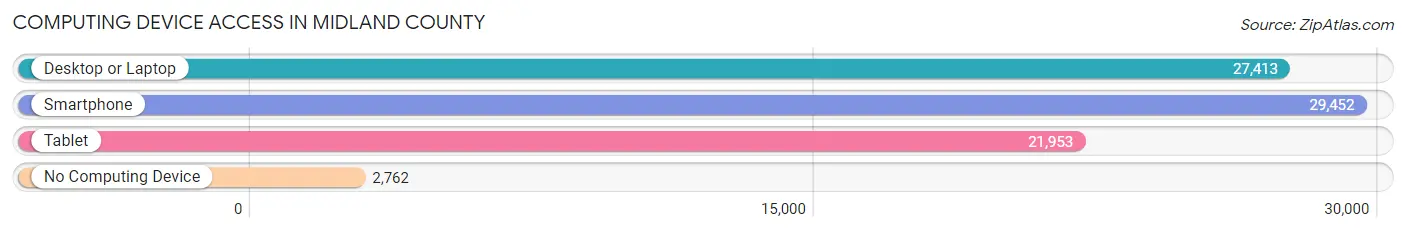
| Device Type | # Households | % Households |
| Desktop or Laptop | 27,413 | 79.8% |
| Smartphone | 29,452 | 85.8% |
| Tablet | 21,953 | 63.9% |
| No Computing Device | 2,762 | 8.0% |
| Total | 34,336 | 100.0% |
Internet Access in Midland County
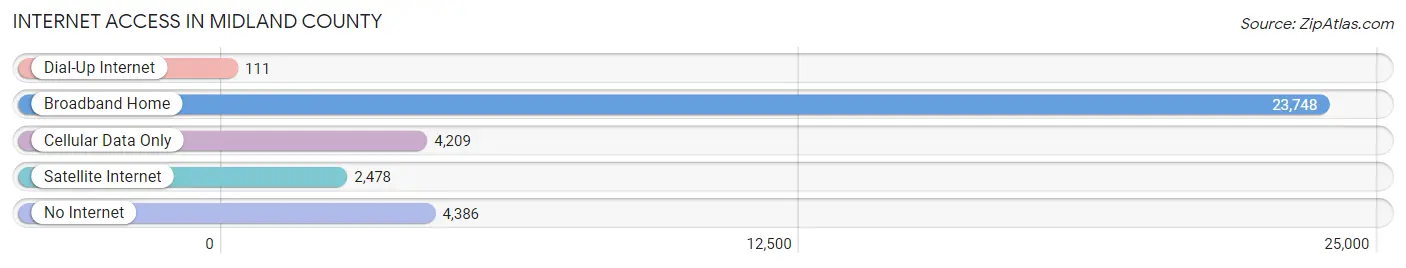
| Internet Type | # Households | % Households |
| Dial-Up Internet | 111 | 0.3% |
| Broadband Home | 23,748 | 69.2% |
| Cellular Data Only | 4,209 | 12.3% |
| Satellite Internet | 2,478 | 7.2% |
| No Internet | 4,386 | 12.8% |
| Total | 34,336 | 100.0% |
Midland County Summary
Midland County is located in the central region of Michigan’s Lower Peninsula. It is bordered by Bay, Isabella, Gladwin, and Saginaw counties. The county seat is the city of Midland, which is also the largest city in the county. Midland County has a total area of 576 square miles, of which 574 square miles is land and 2 square miles is water.
History
Midland County was established in 1831 and was originally part of Saginaw County. The county was named after the city of Midland, which was founded in 1858. The city was named after the Midland Railroad, which was built in the area in 1858.
The first settlers in the area were fur traders and missionaries. The first permanent settlers arrived in the area in 1831. The first industry in the area was lumbering, which was followed by farming and manufacturing.
The county experienced rapid growth in the late 19th and early 20th centuries due to the development of the oil and gas industry. The first oil well was drilled in Midland County in 1881. By the early 20th century, Midland County was one of the leading oil-producing counties in the United States.
Geography
Midland County is located in the central region of Michigan’s Lower Peninsula. It is bordered by Bay, Isabella, Gladwin, and Saginaw counties. The county has a total area of 576 square miles, of which 574 square miles is land and 2 square miles is water.
The terrain of Midland County is generally flat, with some rolling hills in the northern and western parts of the county. The Tittabawassee River flows through the county, and there are several lakes and ponds in the area. The county is also home to several state parks, including Sanford Lake Park, Midland City Forest, and Midland County Park.
Economy
Midland County’s economy is largely based on the oil and gas industry. The county is home to several major oil and gas companies, including Dow Chemical, Dow Corning, and The Dow Chemical Company. The county is also home to several manufacturing companies, including Midland Manufacturing, Midland Tool & Die, and Midland Plastics.
The county’s agricultural sector is also important to the local economy. The county is home to several farms, which produce a variety of crops, including corn, soybeans, wheat, and hay.
Demographics
As of the 2010 census, Midland County had a population of 83,629. The population was spread out, with 24.3% under the age of 18, 8.2% from 18 to 24, 28.2% from 25 to 44, 24.3% from 45 to 64, and 14.0% who were 65 years of age or older. The median age was 38.4 years.
The racial makeup of the county was 94.2% White, 1.7% African American, 0.5% Native American, 1.2% Asian, 0.1% Pacific Islander, 0.9% from other races, and 1.4% from two or more races. Hispanic or Latino of any race were 3.2% of the population.
The median income for a household in the county was $50,945, and the median income for a family was $62,945. The per capita income for the county was $25,945. About 8.2% of families and 11.2% of the population were below the poverty line, including 15.2% of those under age 18 and 6.2% of those age 65 or over.
Common Questions
What is the Total Population of Midland County?
Total Population of Midland County is 83,503.
What is the Total Male Population of Midland County?
Total Male Population of Midland County is 41,623.
What is the Total Female Population of Midland County?
Total Female Population of Midland County is 41,880.
What is the Ratio of Males per 100 Females in Midland County?
There are 99.39 Males per 100 Females in Midland County.
What is the Ratio of Females per 100 Males in Midland County?
There are 100.62 Females per 100 Males in Midland County.
What is the Median Population Age in Midland County?
Median Population Age in Midland County is 41.7 Years.
What is the Average Family Size in Midland County
Average Family Size in Midland County is 2.9 People.
What is the Average Household Size in Midland County
Average Household Size in Midland County is 2.4 People.
What is Per Capita Income in Midland County?
Per Capita income in Midland County is $41,594.
What is the Median Family Income in Midland County?
Median Family Income in Midland County is $91,778.
What is the Median Household income in Midland County?
Median Household Income in Midland County is $73,643.
What is Income or Wage Gap in Midland County?
Income or Wage Gap in Midland County is 34.1%.
Women in Midland County earn 65.9 cents for every dollar earned by a man.
What is Family Income Deficit in Midland County?
Family Income Deficit in Midland County is $11,878.
Families that are below poverty line in Midland County earn $11,878 less on average than the poverty threshold level.
What is Inequality or Gini Index in Midland County?
Inequality or Gini Index in Midland County is 0.46.
How Large is the Labor Force in Midland County?
There are 40,263 People in the Labor Forcein in Midland County.
What is the Percentage of People in the Labor Force in Midland County?
59.2% of People are in the Labor Force in Midland County.
What is the Unemployment Rate in Midland County?
Unemployment Rate in Midland County is 5.0%.