Mason County, MI
Mason County Map
Mason County Overview
29,178
TOTAL POPULATION
14,609
MALE POPULATION
14,569
FEMALE POPULATION
100.27
MALES / 100 FEMALES
99.73
FEMALES / 100 MALES
46.7
MEDIAN AGE
2.9
AVG FAMILY SIZE
2.3
AVG HOUSEHOLD SIZE
$34,386
PER CAPITA INCOME
$76,568
AVG FAMILY INCOME
$60,744
AVG HOUSEHOLD INCOME
31.8%
WAGE / INCOME GAP [ % ]
68.2¢/ $1
WAGE / INCOME GAP [ $ ]
$10,804
FAMILY INCOME DEFICIT
0.44
INEQUALITY / GINI INDEX
13,055
LABOR FORCE [ PEOPLE ]
54.5%
PERCENT IN LABOR FORCE
4.8%
UNEMPLOYMENT RATE
Mason County Area Codes
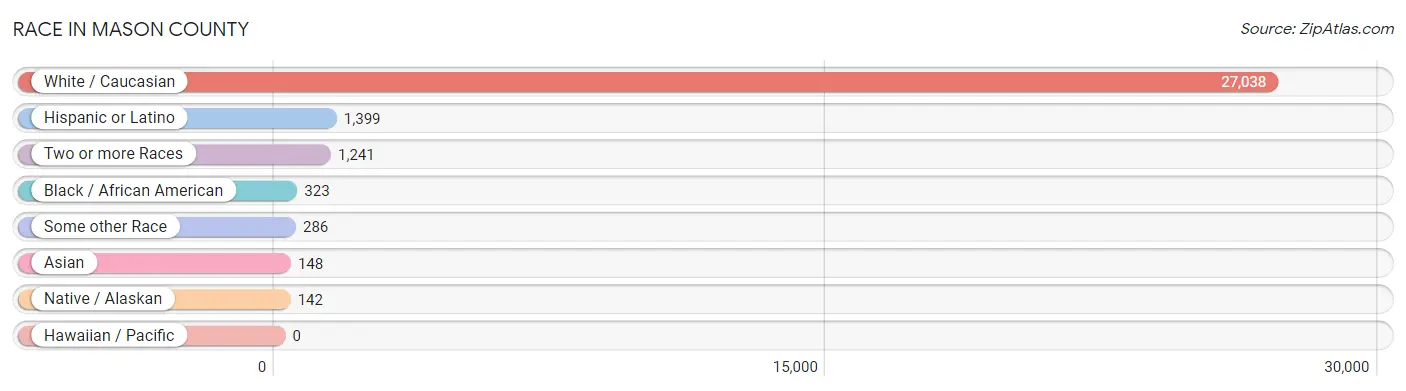
Race in Mason County
The most populous races in Mason County are White / Caucasian (27,038 | 92.7%), Hispanic or Latino (1,399 | 4.8%), and Two or more Races (1,241 | 4.3%).
| Race | # Population | % Population |
| Asian | 148 | 0.5% |
| Black / African American | 323 | 1.1% |
| Hawaiian / Pacific | 0 | 0.0% |
| Hispanic or Latino | 1,399 | 4.8% |
| Native / Alaskan | 142 | 0.5% |
| White / Caucasian | 27,038 | 92.7% |
| Two or more Races | 1,241 | 4.3% |
| Some other Race | 286 | 1.0% |
| Total | 29,178 | 100.0% |
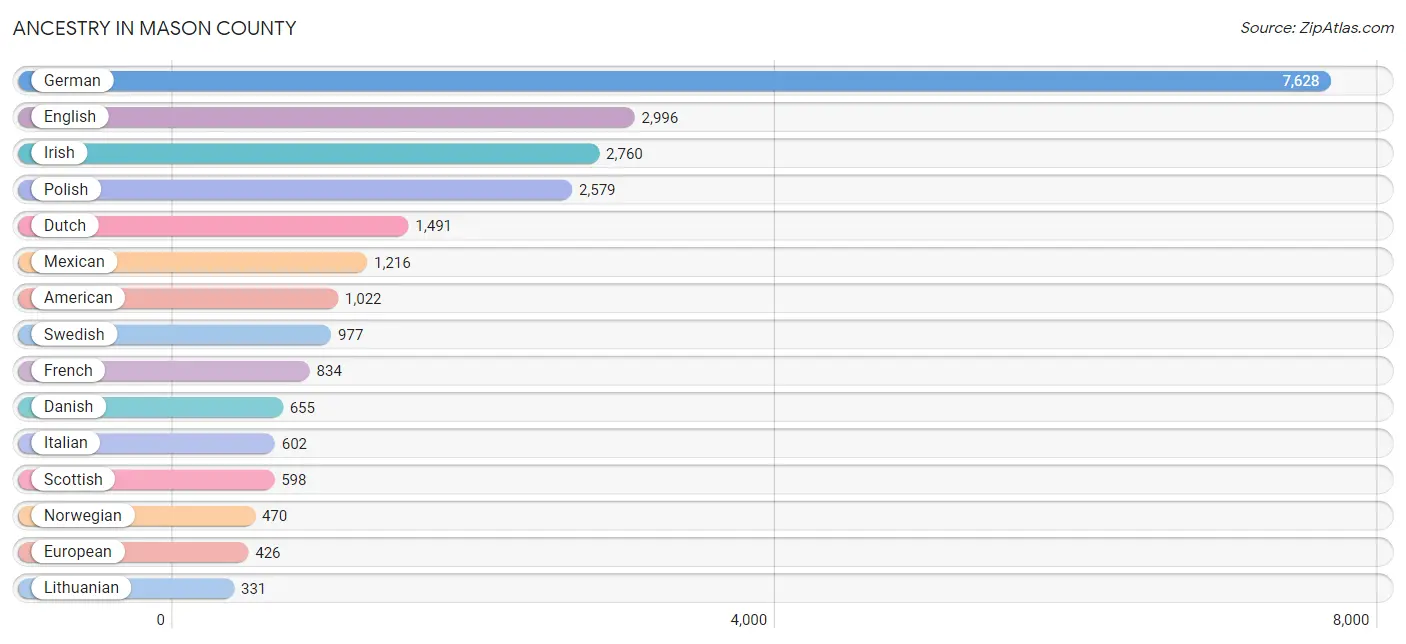
Ancestry in Mason County
The most populous ancestries reported in Mason County are German (7,628 | 26.1%), English (2,996 | 10.3%), Irish (2,760 | 9.5%), Polish (2,579 | 8.8%), and Dutch (1,491 | 5.1%), together accounting for 59.8% of all Mason County residents.
| Ancestry | # Population | % Population |
| African | 15 | 0.1% |
| Albanian | 18 | 0.1% |
| American | 1,022 | 3.5% |
| Arab | 23 | 0.1% |
| Australian | 6 | 0.0% |
| Austrian | 86 | 0.3% |
| Belgian | 94 | 0.3% |
| Bhutanese | 18 | 0.1% |
| Blackfeet | 5 | 0.0% |
| British | 157 | 0.5% |
| Burmese | 35 | 0.1% |
| Canadian | 55 | 0.2% |
| Central American | 13 | 0.0% |
| Central American Indian | 13 | 0.0% |
| Cherokee | 25 | 0.1% |
| Chippewa | 109 | 0.4% |
| Croatian | 26 | 0.1% |
| Czech | 254 | 0.9% |
| Czechoslovakian | 34 | 0.1% |
| Danish | 655 | 2.2% |
| Dutch | 1,491 | 5.1% |
| Eastern European | 45 | 0.2% |
| English | 2,996 | 10.3% |
| European | 426 | 1.5% |
| Finnish | 158 | 0.5% |
| French | 834 | 2.9% |
| French American Indian | 3 | 0.0% |
| French Canadian | 322 | 1.1% |
| German | 7,628 | 26.1% |
| Greek | 67 | 0.2% |
| Guatemalan | 13 | 0.0% |
| Hungarian | 161 | 0.5% |
| Indian (Asian) | 25 | 0.1% |
| Irish | 2,760 | 9.5% |
| Iroquois | 6 | 0.0% |
| Italian | 602 | 2.1% |
| Japanese | 3 | 0.0% |
| Jordanian | 11 | 0.0% |
| Korean | 178 | 0.6% |
| Laotian | 4 | 0.0% |
| Latvian | 15 | 0.1% |
| Lebanese | 12 | 0.0% |
| Lithuanian | 331 | 1.1% |
| Luxembourger | 10 | 0.0% |
| Macedonian | 5 | 0.0% |
| Maltese | 2 | 0.0% |
| Mexican | 1,216 | 4.2% |
| Native Hawaiian | 1 | 0.0% |
| Nigerian | 4 | 0.0% |
| Northern European | 19 | 0.1% |
| Norwegian | 470 | 1.6% |
| Ottawa | 176 | 0.6% |
| Pakistani | 9 | 0.0% |
| Polish | 2,579 | 8.8% |
| Potawatomi | 17 | 0.1% |
| Puerto Rican | 45 | 0.2% |
| Romanian | 2 | 0.0% |
| Russian | 95 | 0.3% |
| Scandinavian | 314 | 1.1% |
| Scotch-Irish | 245 | 0.8% |
| Scottish | 598 | 2.1% |
| Serbian | 1 | 0.0% |
| Sioux | 37 | 0.1% |
| Slavic | 27 | 0.1% |
| Slovak | 27 | 0.1% |
| Slovene | 8 | 0.0% |
| Spaniard | 53 | 0.2% |
| Spanish | 19 | 0.1% |
| Spanish American | 3 | 0.0% |
| Sri Lankan | 4 | 0.0% |
| Subsaharan African | 19 | 0.1% |
| Swedish | 977 | 3.4% |
| Swiss | 52 | 0.2% |
| Thai | 51 | 0.2% |
| Tohono O'Odham | 3 | 0.0% |
| Ukrainian | 45 | 0.2% |
| Ute | 1 | 0.0% |
| Welsh | 160 | 0.5% |
| Yugoslavian | 33 | 0.1% | View All 79 Rows |
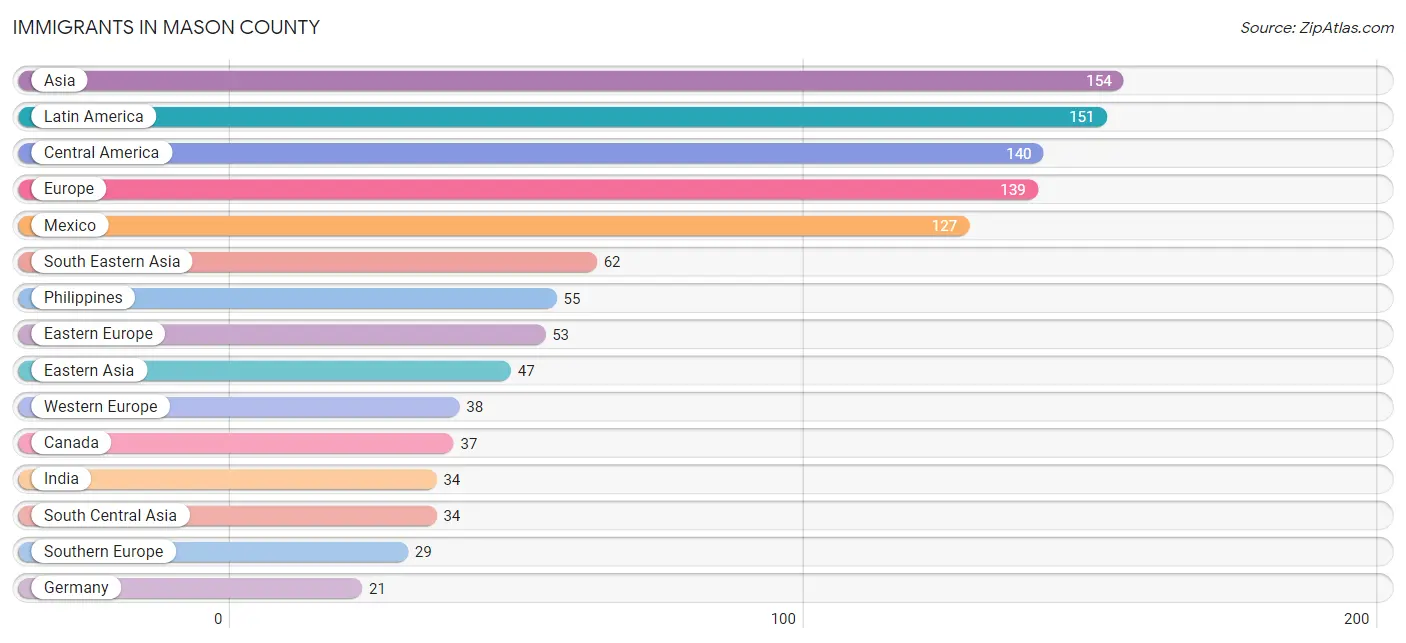
Immigrants in Mason County
The most numerous immigrant groups reported in Mason County came from Asia (154 | 0.5%), Latin America (151 | 0.5%), Central America (140 | 0.5%), Europe (139 | 0.5%), and Mexico (127 | 0.4%), together accounting for 2.4% of all Mason County residents.
| Immigration Origin | # Population | % Population |
| Asia | 154 | 0.5% |
| Belgium | 5 | 0.0% |
| Cambodia | 3 | 0.0% |
| Canada | 37 | 0.1% |
| Central America | 140 | 0.5% |
| China | 20 | 0.1% |
| Colombia | 11 | 0.0% |
| Eastern Asia | 47 | 0.2% |
| Eastern Europe | 53 | 0.2% |
| England | 10 | 0.0% |
| Europe | 139 | 0.5% |
| France | 12 | 0.0% |
| Germany | 21 | 0.1% |
| Greece | 19 | 0.1% |
| Guatemala | 13 | 0.0% |
| Hungary | 9 | 0.0% |
| India | 34 | 0.1% |
| Italy | 10 | 0.0% |
| Japan | 10 | 0.0% |
| Jordan | 11 | 0.0% |
| Korea | 17 | 0.1% |
| Latin America | 151 | 0.5% |
| Latvia | 15 | 0.1% |
| Mexico | 127 | 0.4% |
| Northern Europe | 19 | 0.1% |
| Oceania | 6 | 0.0% |
| Philippines | 55 | 0.2% |
| Russia | 17 | 0.1% |
| Scotland | 6 | 0.0% |
| South America | 11 | 0.0% |
| South Central Asia | 34 | 0.1% |
| South Eastern Asia | 62 | 0.2% |
| Southern Europe | 29 | 0.1% |
| Sweden | 3 | 0.0% |
| Ukraine | 3 | 0.0% |
| Vietnam | 4 | 0.0% |
| Western Asia | 11 | 0.0% |
| Western Europe | 38 | 0.1% | View All 38 Rows |
Sex and Age in Mason County
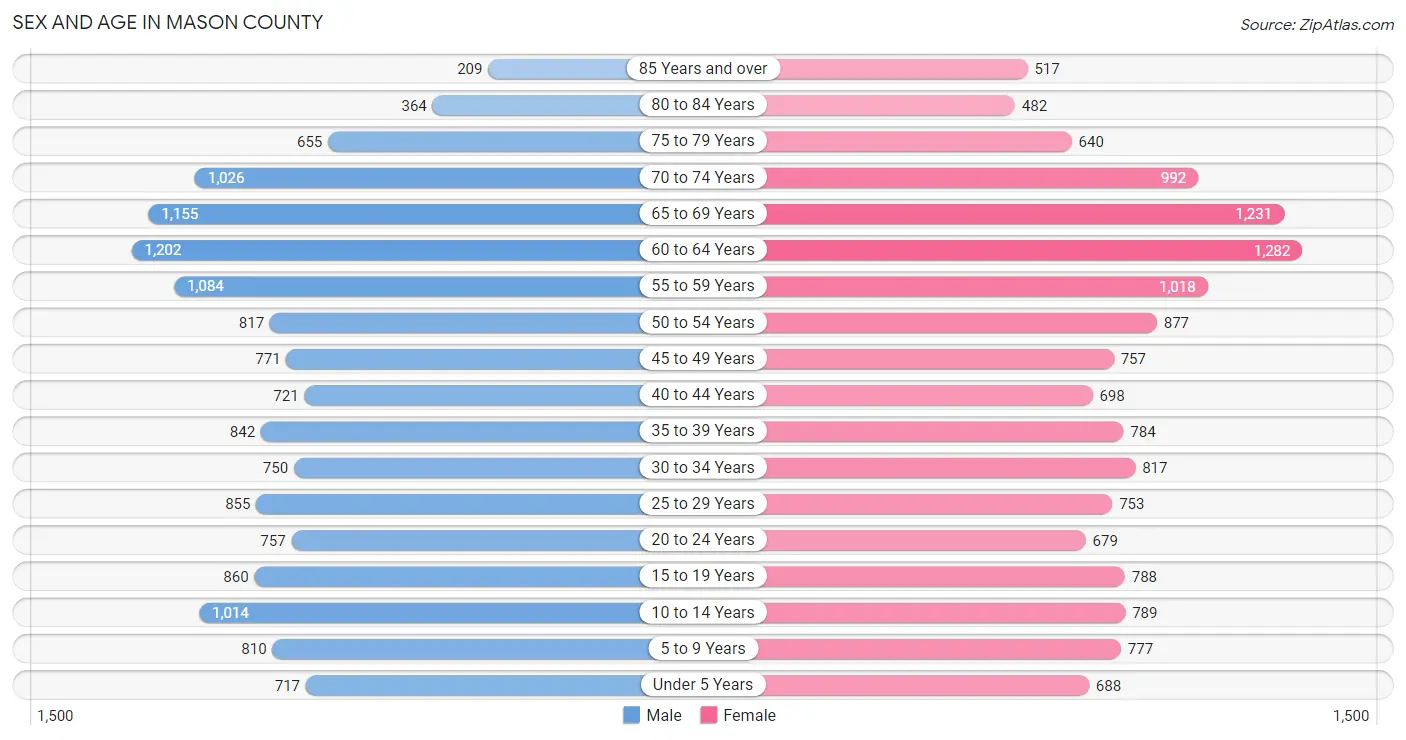
Sex and Age in Mason County
The most populous age groups in Mason County are 60 to 64 Years (1,202 | 8.2%) for men and 60 to 64 Years (1,282 | 8.8%) for women.
| Age Bracket | Male | Female |
| Under 5 Years | 717 (4.9%) | 688 (4.7%) |
| 5 to 9 Years | 810 (5.5%) | 777 (5.3%) |
| 10 to 14 Years | 1,014 (6.9%) | 789 (5.4%) |
| 15 to 19 Years | 860 (5.9%) | 788 (5.4%) |
| 20 to 24 Years | 757 (5.2%) | 679 (4.7%) |
| 25 to 29 Years | 855 (5.9%) | 753 (5.2%) |
| 30 to 34 Years | 750 (5.1%) | 817 (5.6%) |
| 35 to 39 Years | 842 (5.8%) | 784 (5.4%) |
| 40 to 44 Years | 721 (4.9%) | 698 (4.8%) |
| 45 to 49 Years | 771 (5.3%) | 757 (5.2%) |
| 50 to 54 Years | 817 (5.6%) | 877 (6.0%) |
| 55 to 59 Years | 1,084 (7.4%) | 1,018 (7.0%) |
| 60 to 64 Years | 1,202 (8.2%) | 1,282 (8.8%) |
| 65 to 69 Years | 1,155 (7.9%) | 1,231 (8.5%) |
| 70 to 74 Years | 1,026 (7.0%) | 992 (6.8%) |
| 75 to 79 Years | 655 (4.5%) | 640 (4.4%) |
| 80 to 84 Years | 364 (2.5%) | 482 (3.3%) |
| 85 Years and over | 209 (1.4%) | 517 (3.5%) |
| Total | 14,609 (100.0%) | 14,569 (100.0%) |
Families and Households in Mason County
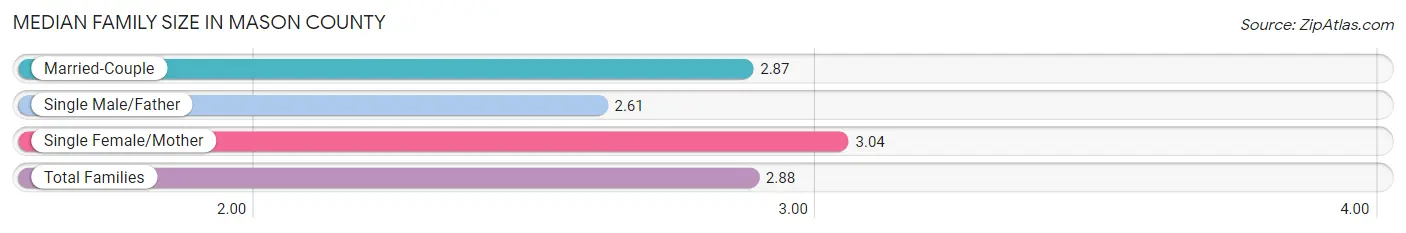
Median Family Size in Mason County
The median family size in Mason County is 2.88 persons per family, with single female/mother families (1,167 | 14.6%) accounting for the largest median family size of 3.04 persons per family. On the other hand, single male/father families (404 | 5.1%) represent the smallest median family size with 2.61 persons per family.
| Family Type | # Families | Family Size |
| Married-Couple | 6,413 (80.3%) | 2.87 |
| Single Male/Father | 404 (5.1%) | 2.61 |
| Single Female/Mother | 1,167 (14.6%) | 3.04 |
| Total Families | 7,984 (100.0%) | 2.88 |
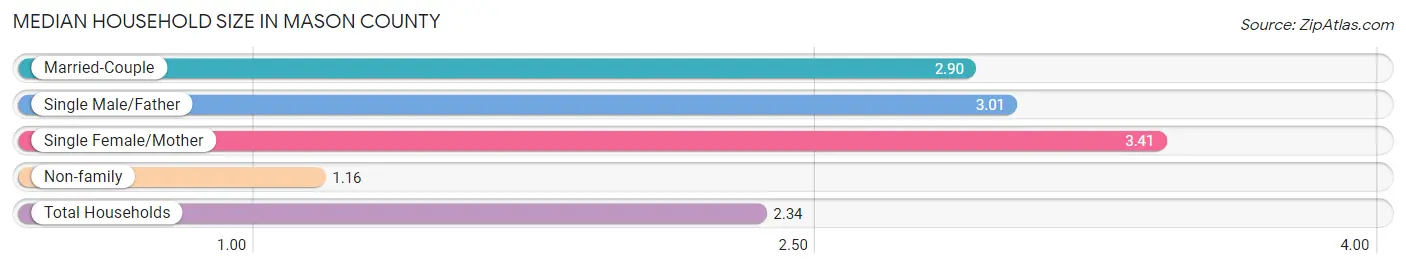
Median Household Size in Mason County
The median household size in Mason County is 2.34 persons per household, with single female/mother households (1,167 | 9.5%) accounting for the largest median household size of 3.41 persons per household. non-family households (4,312 | 35.1%) represent the smallest median household size with 1.16 persons per household.
| Household Type | # Households | Household Size |
| Married-Couple | 6,413 (52.2%) | 2.90 |
| Single Male/Father | 404 (3.3%) | 3.01 |
| Single Female/Mother | 1,167 (9.5%) | 3.41 |
| Non-family | 4,312 (35.1%) | 1.16 |
| Total Households | 12,296 (100.0%) | 2.34 |
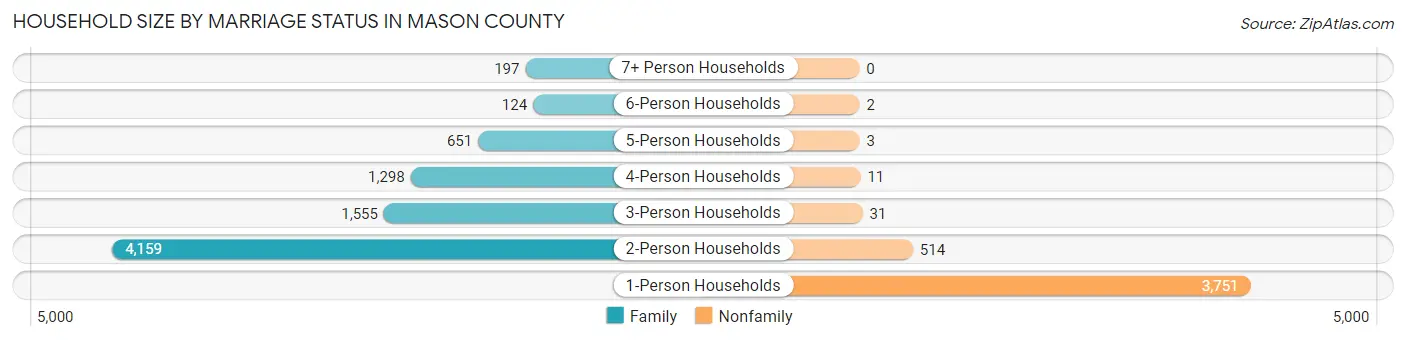
Household Size by Marriage Status in Mason County
Out of a total of 12,296 households in Mason County, 7,984 (64.9%) are family households, while 4,312 (35.1%) are nonfamily households. The most numerous type of family households are 2-person households, comprising 4,159, and the most common type of nonfamily households are 1-person households, comprising 3,751.
| Household Size | Family Households | Nonfamily Households |
| 1-Person Households | - | 3,751 (30.5%) |
| 2-Person Households | 4,159 (33.8%) | 514 (4.2%) |
| 3-Person Households | 1,555 (12.7%) | 31 (0.3%) |
| 4-Person Households | 1,298 (10.6%) | 11 (0.1%) |
| 5-Person Households | 651 (5.3%) | 3 (0.0%) |
| 6-Person Households | 124 (1.0%) | 2 (0.0%) |
| 7+ Person Households | 197 (1.6%) | 0 (0.0%) |
| Total | 7,984 (64.9%) | 4,312 (35.1%) |
Female Fertility in Mason County
Fertility by Age in Mason County
Average fertility rate in Mason County is 34.0 births per 1,000 women. Women in the age bracket of 20 to 34 years have the highest fertility rate with 71.0 births per 1,000 women. Women in the age bracket of 20 to 34 years acount for 87.4% of all women with births.

| Age Bracket | Women with Births | Births / 1,000 Women |
| 15 to 19 years | 4 (2.2%) | 5.0 |
| 20 to 34 years | 160 (87.4%) | 71.0 |
| 35 to 50 years | 19 (10.4%) | 8.0 |
| Total | 183 (100.0%) | 34.0 |
Fertility by Age by Marriage Status in Mason County
47.5% of women with births (183) in Mason County are married. The highest percentage of unmarried women with births falls into 15 to 19 years age bracket with 100.0% of them unmarried at the time of birth, while the lowest percentage of unmarried women with births belong to 35 to 50 years age bracket with 31.6% of them unmarried.
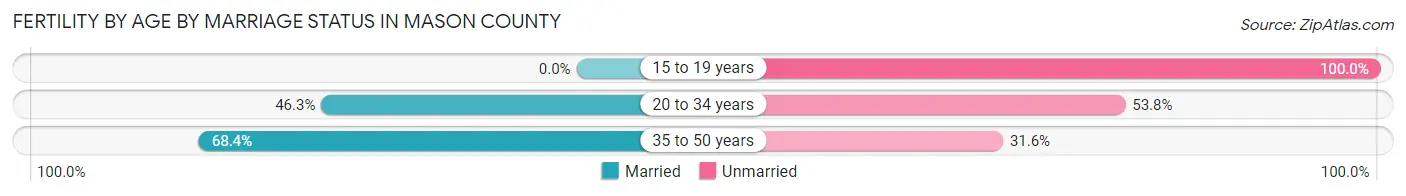
| Age Bracket | Married | Unmarried |
| 15 to 19 years | 0 (0.0%) | 4 (100.0%) |
| 20 to 34 years | 74 (46.3%) | 86 (53.7%) |
| 35 to 50 years | 13 (68.4%) | 6 (31.6%) |
| Total | 87 (47.5%) | 96 (52.5%) |
Fertility by Education in Mason County
Average fertility rate in Mason County is 34.0 births per 1,000 women. Women with the education attainment of college or associate's degree have the highest fertility rate of 49.0 births per 1,000 women, while women with the education attainment of bachelor's degree have the lowest fertility at 8.0 births per 1,000 women. Women with the education attainment of college or associate's degree represent 54.6% of all women with births.
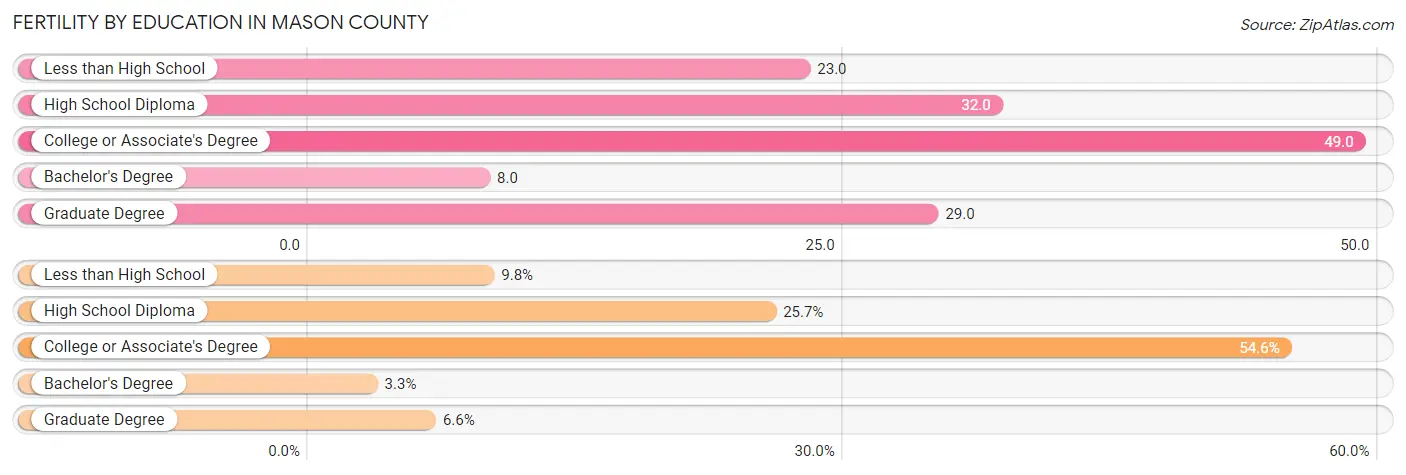
| Educational Attainment | Women with Births | Births / 1,000 Women |
| Less than High School | 18 (9.8%) | 23.0 |
| High School Diploma | 47 (25.7%) | 32.0 |
| College or Associate's Degree | 100 (54.6%) | 49.0 |
| Bachelor's Degree | 6 (3.3%) | 8.0 |
| Graduate Degree | 12 (6.6%) | 29.0 |
| Total | 183 (100.0%) | 34.0 |
Fertility by Education by Marriage Status in Mason County
52.5% of women with births in Mason County are unmarried. Women with the educational attainment of bachelor's degree are most likely to be married with 100.0% of them married at childbirth, while women with the educational attainment of college or associate's degree are least likely to be married with 68.0% of them unmarried at childbirth.
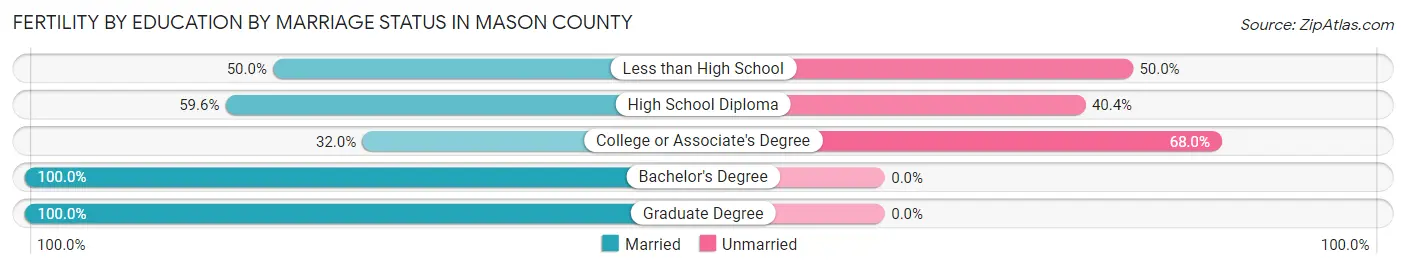
| Educational Attainment | Married | Unmarried |
| Less than High School | 9 (50.0%) | 9 (50.0%) |
| High School Diploma | 28 (59.6%) | 19 (40.4%) |
| College or Associate's Degree | 32 (32.0%) | 68 (68.0%) |
| Bachelor's Degree | 6 (100.0%) | 0 (0.0%) |
| Graduate Degree | 12 (100.0%) | 0 (0.0%) |
| Total | 87 (47.5%) | 96 (52.5%) |
Income in Mason County
Income Overview in Mason County
Per Capita Income in Mason County is $34,386, while median incomes of families and households are $76,568 and $60,744 respectively.
| Characteristic | Number | Measure |
| Per Capita Income | 29,178 | $34,386 |
| Median Family Income | 7,984 | $76,568 |
| Mean Family Income | 7,984 | $93,603 |
| Median Household Income | 12,296 | $60,744 |
| Mean Household Income | 12,296 | $79,695 |
| Income Deficit | 7,984 | $10,804 |
| Wage / Income Gap (%) | 29,178 | 31.81% |
| Wage / Income Gap ($) | 29,178 | 68.19¢ per $1 |
| Gini / Inequality Index | 29,178 | 0.44 |
Earnings by Sex in Mason County
Average Earnings in Mason County are $34,205, $41,446 for men and $28,260 for women, a difference of 31.8%.

| Sex | Number | Average Earnings |
| Male | 7,231 (52.0%) | $41,446 |
| Female | 6,671 (48.0%) | $28,260 |
| Total | 13,902 (100.0%) | $34,205 |
Earnings by Sex by Income Bracket in Mason County
The most common earnings brackets in Mason County are $100,000+ for men (814 | 11.3%) and $25,000 to $29,999 for women (712 | 10.7%).

| Income | Male | Female |
| $2,499 or less | 350 (4.8%) | 381 (5.7%) |
| $2,500 to $4,999 | 249 (3.4%) | 297 (4.4%) |
| $5,000 to $7,499 | 158 (2.2%) | 354 (5.3%) |
| $7,500 to $9,999 | 149 (2.1%) | 279 (4.2%) |
| $10,000 to $12,499 | 182 (2.5%) | 318 (4.8%) |
| $12,500 to $14,999 | 167 (2.3%) | 338 (5.1%) |
| $15,000 to $17,499 | 158 (2.2%) | 232 (3.5%) |
| $17,500 to $19,999 | 134 (1.8%) | 266 (4.0%) |
| $20,000 to $22,499 | 157 (2.2%) | 166 (2.5%) |
| $22,500 to $24,999 | 233 (3.2%) | 273 (4.1%) |
| $25,000 to $29,999 | 467 (6.5%) | 712 (10.7%) |
| $30,000 to $34,999 | 639 (8.8%) | 446 (6.7%) |
| $35,000 to $39,999 | 458 (6.3%) | 380 (5.7%) |
| $40,000 to $44,999 | 417 (5.8%) | 275 (4.1%) |
| $45,000 to $49,999 | 392 (5.4%) | 330 (5.0%) |
| $50,000 to $54,999 | 391 (5.4%) | 213 (3.2%) |
| $55,000 to $64,999 | 630 (8.7%) | 373 (5.6%) |
| $65,000 to $74,999 | 464 (6.4%) | 302 (4.5%) |
| $75,000 to $99,999 | 622 (8.6%) | 435 (6.5%) |
| $100,000+ | 814 (11.3%) | 301 (4.5%) |
| Total | 7,231 (100.0%) | 6,671 (100.0%) |
Earnings by Sex by Educational Attainment in Mason County
Average earnings in Mason County are $46,255 for men and $30,509 for women, a difference of 34.0%. Men with an educational attainment of graduate degree enjoy the highest average annual earnings of $80,000, while those with less than high school education earn the least with $31,611. Women with an educational attainment of graduate degree earn the most with the average annual earnings of $71,897, while those with less than high school education have the smallest earnings of $14,926.
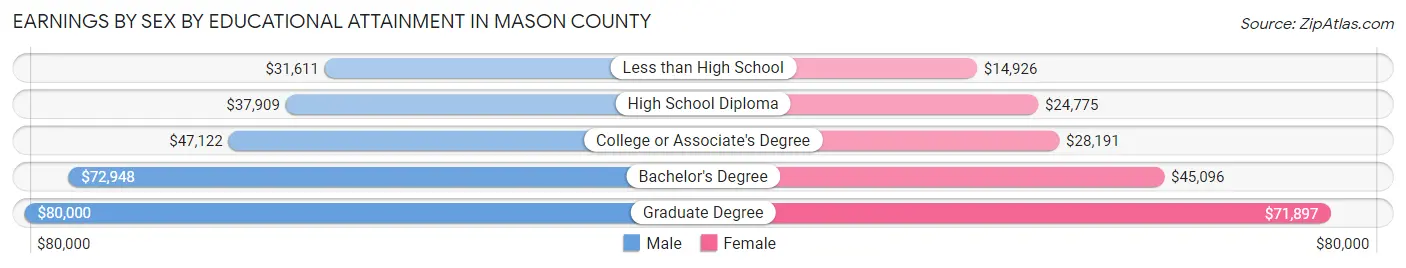
| Educational Attainment | Male Income | Female Income |
| Less than High School | $31,611 | $14,926 |
| High School Diploma | $37,909 | $24,775 |
| College or Associate's Degree | $47,122 | $28,191 |
| Bachelor's Degree | $72,948 | $45,096 |
| Graduate Degree | $80,000 | $71,897 |
| Total | $46,255 | $30,509 |
Family Income in Mason County
Family Income Brackets in Mason County
According to the Mason County family income data, there are 1,637 families falling into the $50,000 to $74,999 income range, which is the most common income bracket and makes up 20.5% of all families. Conversely, the $10,000 to $14,999 income bracket is the least frequent group with only 120 families (1.5%) belonging to this category.
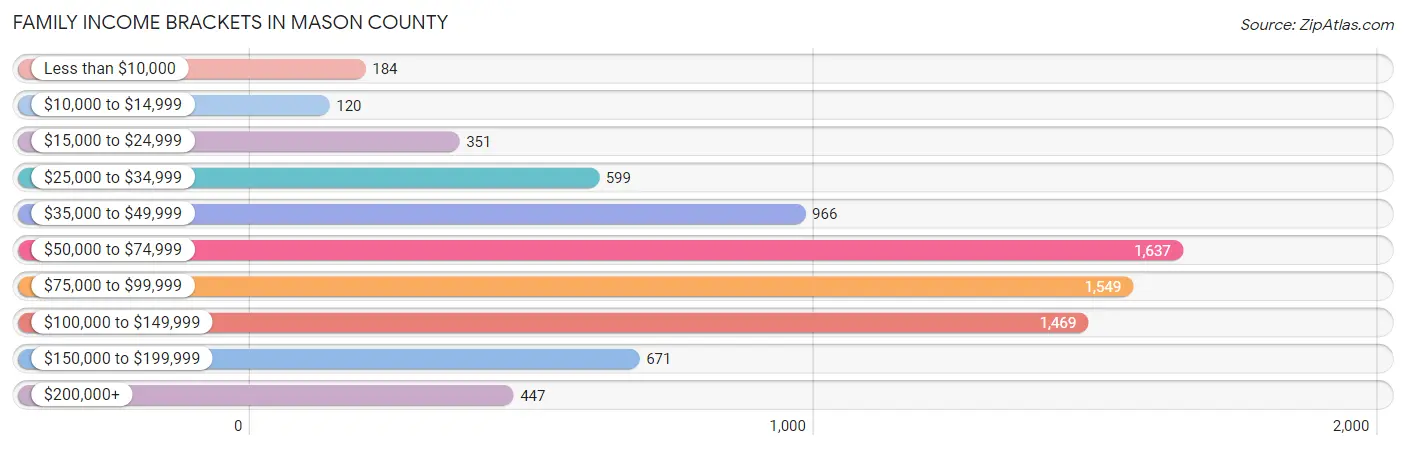
| Income Bracket | # Families | % Families |
| Less than $10,000 | 184 | 2.3% |
| $10,000 to $14,999 | 120 | 1.5% |
| $15,000 to $24,999 | 351 | 4.4% |
| $25,000 to $34,999 | 599 | 7.5% |
| $35,000 to $49,999 | 966 | 12.1% |
| $50,000 to $74,999 | 1,637 | 20.5% |
| $75,000 to $99,999 | 1,549 | 19.4% |
| $100,000 to $149,999 | 1,469 | 18.4% |
| $150,000 to $199,999 | 671 | 8.4% |
| $200,000+ | 447 | 5.6% |
Family Income by Famaliy Size in Mason County
5-person families (553 | 6.9%) account for the highest median family income in Mason County with $90,729 per family, while 2-person families (4,423 | 55.4%) have the highest median income of $35,576 per family member.

| Income Bracket | # Families | Median Income |
| 2-Person Families | 4,423 (55.4%) | $71,152 |
| 3-Person Families | 1,515 (19.0%) | $77,608 |
| 4-Person Families | 1,225 (15.3%) | $89,659 |
| 5-Person Families | 553 (6.9%) | $90,729 |
| 6-Person Families | 107 (1.3%) | $89,375 |
| 7+ Person Families | 161 (2.0%) | $0 |
| Total | 7,984 (100.0%) | $76,568 |
Family Income by Number of Earners in Mason County
The median family income in Mason County is $76,568, with families comprising 3+ earners (853) having the highest median family income of $121,250, while families with 1 earner (2,336) have the lowest median family income of $57,955, accounting for 10.7% and 29.3% of families, respectively.
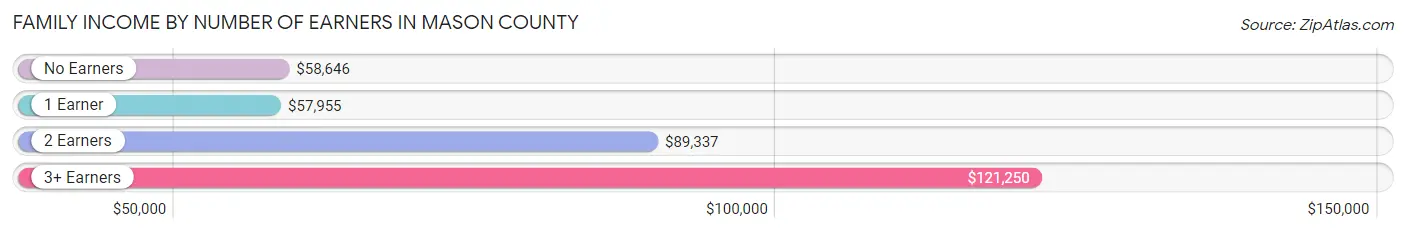
| Number of Earners | # Families | Median Income |
| No Earners | 1,887 (23.6%) | $58,646 |
| 1 Earner | 2,336 (29.3%) | $57,955 |
| 2 Earners | 2,908 (36.4%) | $89,337 |
| 3+ Earners | 853 (10.7%) | $121,250 |
| Total | 7,984 (100.0%) | $76,568 |
Household Income in Mason County
Household Income Brackets in Mason County
With 2,336 households falling in the category, the $50,000 to $74,999 income range is the most frequent in Mason County, accounting for 19.0% of all households. In contrast, only 492 households (4.0%) fall into the $10,000 to $14,999 income bracket, making it the least populous group.

| Income Bracket | # Households | % Households |
| Less than $10,000 | 504 | 4.1% |
| $10,000 to $14,999 | 492 | 4.0% |
| $15,000 to $24,999 | 1,045 | 8.5% |
| $25,000 to $34,999 | 1,303 | 10.6% |
| $35,000 to $49,999 | 1,734 | 14.1% |
| $50,000 to $74,999 | 2,336 | 19.0% |
| $75,000 to $99,999 | 1,906 | 15.5% |
| $100,000 to $149,999 | 1,685 | 13.7% |
| $150,000 to $199,999 | 738 | 6.0% |
| $200,000+ | 541 | 4.4% |
Household Income by Householder Age in Mason County
The median household income in Mason County is $60,744, with the highest median household income of $76,250 found in the 45 to 64 years age bracket for the primary householder. A total of 4,331 households (35.2%) fall into this category. Meanwhile, the 15 to 24 years age bracket for the primary householder has the lowest median household income of $40,795, with 313 households (2.5%) in this group.
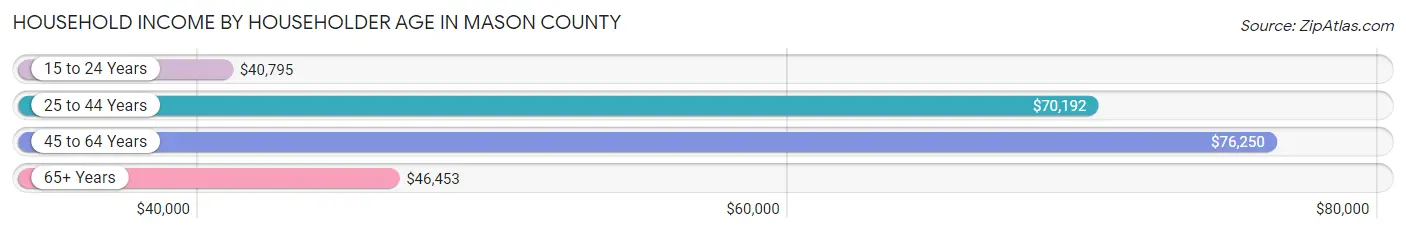
| Income Bracket | # Households | Median Income |
| 15 to 24 Years | 313 (2.5%) | $40,795 |
| 25 to 44 Years | 2,896 (23.5%) | $70,192 |
| 45 to 64 Years | 4,331 (35.2%) | $76,250 |
| 65+ Years | 4,756 (38.7%) | $46,453 |
| Total | 12,296 (100.0%) | $60,744 |
Poverty in Mason County
Income Below Poverty by Sex and Age in Mason County
With 12.1% poverty level for males and 15.3% for females among the residents of Mason County, 5 year old males and under 5 year old females are the most vulnerable to poverty, with 80 males (39.2%) and 231 females (35.0%) in their respective age groups living below the poverty level.
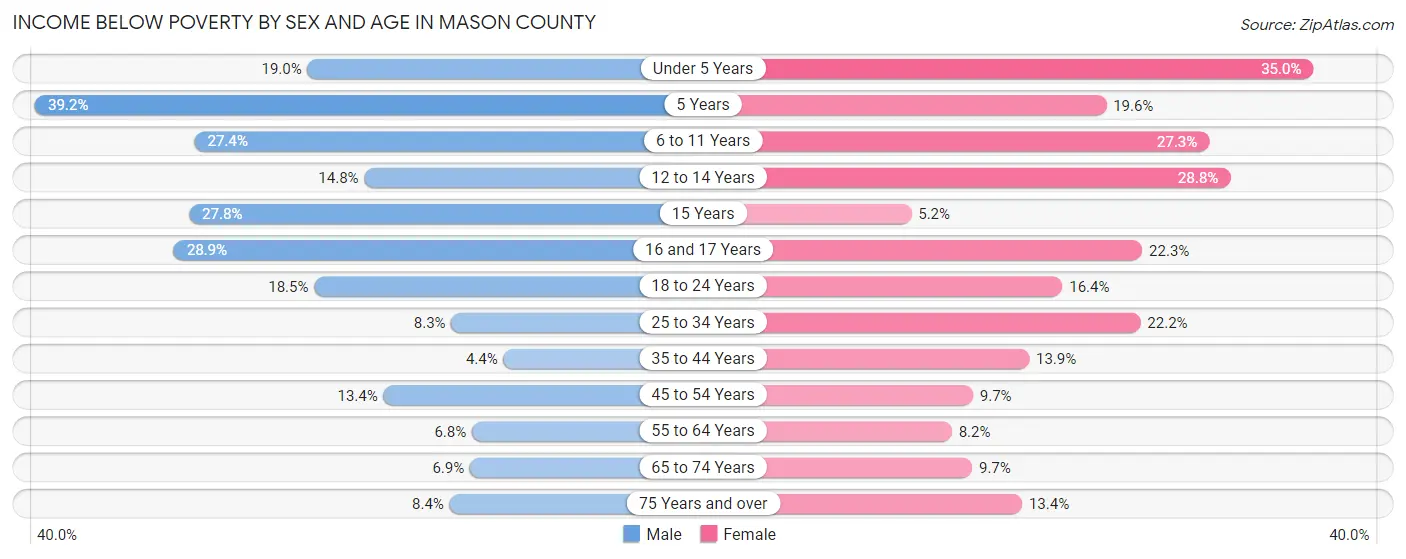
| Age Bracket | Male | Female |
| Under 5 Years | 132 (19.0%) | 231 (35.0%) |
| 5 Years | 80 (39.2%) | 32 (19.6%) |
| 6 to 11 Years | 290 (27.4%) | 252 (27.3%) |
| 12 to 14 Years | 79 (14.8%) | 128 (28.8%) |
| 15 Years | 60 (27.8%) | 11 (5.2%) |
| 16 and 17 Years | 94 (28.9%) | 68 (22.3%) |
| 18 to 24 Years | 199 (18.5%) | 154 (16.4%) |
| 25 to 34 Years | 132 (8.3%) | 346 (22.2%) |
| 35 to 44 Years | 69 (4.4%) | 205 (13.9%) |
| 45 to 54 Years | 212 (13.4%) | 159 (9.7%) |
| 55 to 64 Years | 155 (6.8%) | 187 (8.2%) |
| 65 to 74 Years | 151 (6.9%) | 212 (9.7%) |
| 75 Years and over | 99 (8.4%) | 207 (13.4%) |
| Total | 1,752 (12.1%) | 2,192 (15.3%) |
Income Above Poverty by Sex and Age in Mason County
According to the poverty statistics in Mason County, males aged 35 to 44 years and females aged 15 years are the age groups that are most secure financially, with 95.6% of males and 94.8% of females in these age groups living above the poverty line.

| Age Bracket | Male | Female |
| Under 5 Years | 563 (81.0%) | 429 (65.0%) |
| 5 Years | 124 (60.8%) | 131 (80.4%) |
| 6 to 11 Years | 769 (72.6%) | 672 (72.7%) |
| 12 to 14 Years | 456 (85.2%) | 316 (71.2%) |
| 15 Years | 156 (72.2%) | 202 (94.8%) |
| 16 and 17 Years | 231 (71.1%) | 237 (77.7%) |
| 18 to 24 Years | 877 (81.5%) | 787 (83.6%) |
| 25 to 34 Years | 1,457 (91.7%) | 1,215 (77.8%) |
| 35 to 44 Years | 1,485 (95.6%) | 1,270 (86.1%) |
| 45 to 54 Years | 1,376 (86.7%) | 1,475 (90.3%) |
| 55 to 64 Years | 2,130 (93.2%) | 2,105 (91.8%) |
| 65 to 74 Years | 2,029 (93.1%) | 1,980 (90.3%) |
| 75 Years and over | 1,074 (91.6%) | 1,340 (86.6%) |
| Total | 12,727 (87.9%) | 12,159 (84.7%) |
Income Below Poverty Among Married-Couple Families in Mason County
The poverty statistics for married-couple families in Mason County show that 4.5% or 292 of the total 6,413 families live below the poverty line. Families with 5 or more children have the highest poverty rate of 70.1%, comprising of 68 families. On the other hand, families with 1 or 2 children have the lowest poverty rate of 2.1%, which includes 31 families.
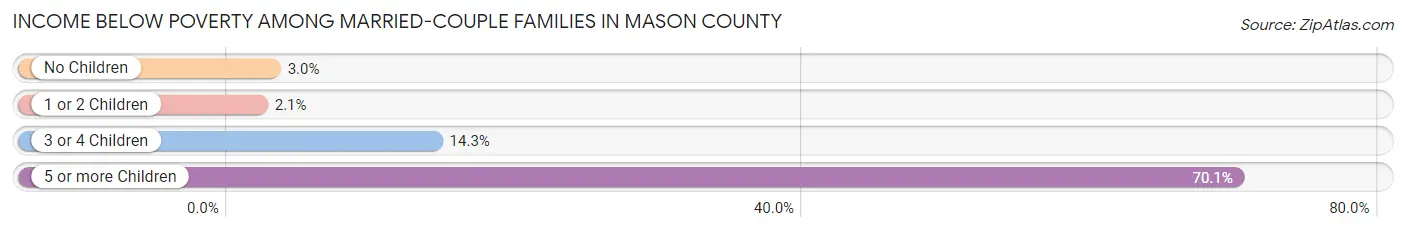
| Children | Above Poverty | Below Poverty |
| No Children | 4,243 (97.0%) | 130 (3.0%) |
| 1 or 2 Children | 1,470 (97.9%) | 31 (2.1%) |
| 3 or 4 Children | 379 (85.8%) | 63 (14.2%) |
| 5 or more Children | 29 (29.9%) | 68 (70.1%) |
| Total | 6,121 (95.5%) | 292 (4.5%) |
Income Below Poverty Among Single-Parent Households in Mason County
According to the poverty data in Mason County, 4.7% or 19 single-father households and 30.4% or 355 single-mother households are living below the poverty line. Among single-father households, those with 3 or 4 children have the highest poverty rate, with 4 households (16.7%) experiencing poverty. Likewise, among single-mother households, those with 3 or 4 children have the highest poverty rate, with 90 households (62.9%) falling below the poverty line.
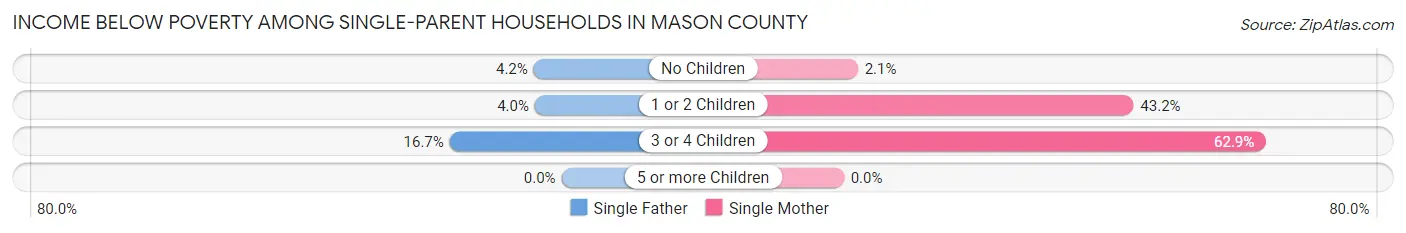
| Children | Single Father | Single Mother |
| No Children | 9 (4.2%) | 9 (2.1%) |
| 1 or 2 Children | 6 (4.0%) | 256 (43.2%) |
| 3 or 4 Children | 4 (16.7%) | 90 (62.9%) |
| 5 or more Children | 0 (0.0%) | 0 (0.0%) |
| Total | 19 (4.7%) | 355 (30.4%) |
Income Below Poverty Among Married-Couple vs Single-Parent Households in Mason County
The poverty data for Mason County shows that 292 of the married-couple family households (4.5%) and 374 of the single-parent households (23.8%) are living below the poverty level. Within the married-couple family households, those with 5 or more children have the highest poverty rate, with 68 households (70.1%) falling below the poverty line. Among the single-parent households, those with 3 or 4 children have the highest poverty rate, with 94 household (56.3%) living below poverty.
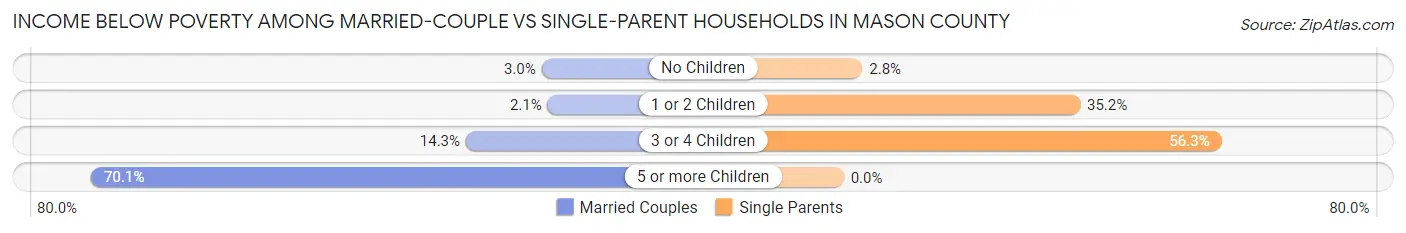
| Children | Married-Couple Families | Single-Parent Households |
| No Children | 130 (3.0%) | 18 (2.8%) |
| 1 or 2 Children | 31 (2.1%) | 262 (35.2%) |
| 3 or 4 Children | 63 (14.2%) | 94 (56.3%) |
| 5 or more Children | 68 (70.1%) | 0 (0.0%) |
| Total | 292 (4.5%) | 374 (23.8%) |
Employment Characteristics in Mason County
Employment by Class of Employer in Mason County
Among the 12,200 employed individuals in Mason County, private company employees (8,286 | 67.9%), local government employees (1,089 | 8.9%), and not-for-profit organizations (916 | 7.5%) make up the most common classes of employment.
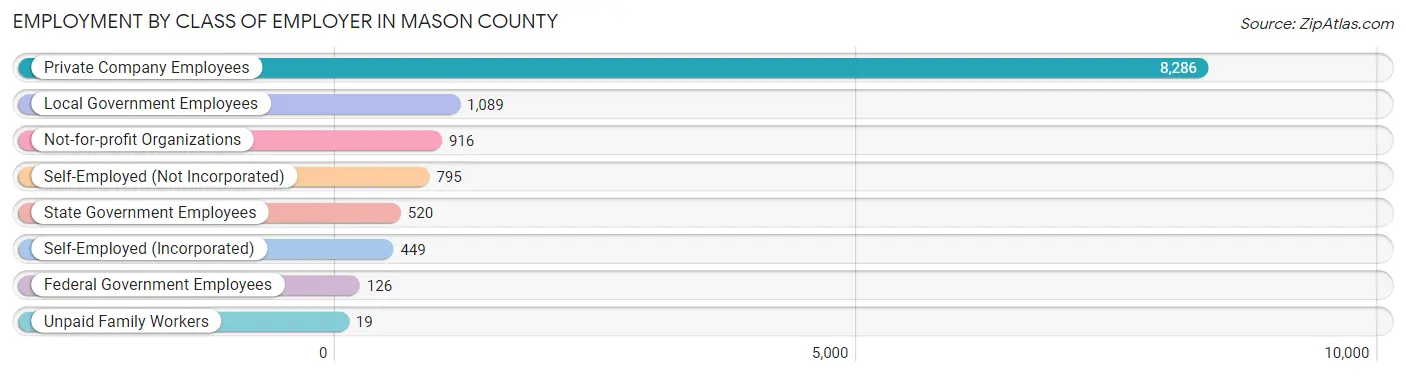
| Employer Class | # Employees | % Employees |
| Private Company Employees | 8,286 | 67.9% |
| Self-Employed (Incorporated) | 449 | 3.7% |
| Self-Employed (Not Incorporated) | 795 | 6.5% |
| Not-for-profit Organizations | 916 | 7.5% |
| Local Government Employees | 1,089 | 8.9% |
| State Government Employees | 520 | 4.3% |
| Federal Government Employees | 126 | 1.0% |
| Unpaid Family Workers | 19 | 0.2% |
| Total | 12,200 | 100.0% |
Employment Status by Age in Mason County
According to the labor force statistics for Mason County, out of the total population over 16 years of age (23,954), 54.5% or 13,055 individuals are in the labor force, with 4.8% or 627 of them unemployed. The age group with the highest labor force participation rate is 30 to 34 years, with 84.4% or 1,323 individuals in the labor force. Within the labor force, the 20 to 24 years age range has the highest percentage of unemployed individuals, with 10.0% or 112 of them being unemployed.

| Age Bracket | In Labor Force | Unemployed |
| 16 to 19 Years | 479 (39.3%) | 43 (9.0%) |
| 20 to 24 Years | 1,124 (78.3%) | 112 (10.0%) |
| 25 to 29 Years | 1,341 (83.4%) | 80 (6.0%) |
| 30 to 34 Years | 1,323 (84.4%) | 33 (2.5%) |
| 35 to 44 Years | 2,527 (83.0%) | 134 (5.3%) |
| 45 to 54 Years | 2,561 (79.5%) | 90 (3.5%) |
| 55 to 59 Years | 1,455 (69.2%) | 57 (3.9%) |
| 60 to 64 Years | 1,391 (56.0%) | 36 (2.6%) |
| 65 to 74 Years | 647 (14.7%) | 33 (5.1%) |
| 75 Years and over | 198 (6.9%) | 15 (7.6%) |
| Total | 13,055 (54.5%) | 627 (4.8%) |
Employment Status by Educational Attainment in Mason County
According to labor force statistics for Mason County, 75.5% of individuals (10,591) out of the total population between 25 and 64 years of age (14,028) are in the labor force, with 4.0% or 424 of them being unemployed. The group with the highest labor force participation rate are those with the educational attainment of bachelor's degree or higher, with 89.0% or 2,797 individuals in the labor force. Within the labor force, individuals with high school diploma education have the highest percentage of unemployment, with 7.6% or 243 of them being unemployed.

| Educational Attainment | In Labor Force | Unemployed |
| Less than High School | 452 (54.9%) | 53 (6.4%) |
| High School Diploma | 3,200 (65.8%) | 370 (7.6%) |
| College / Associate Degree | 4,144 (79.7%) | 109 (2.1%) |
| Bachelor's Degree or higher | 2,797 (89.0%) | 79 (2.5%) |
| Total | 10,591 (75.5%) | 561 (4.0%) |
Employment Occupations by Sex in Mason County
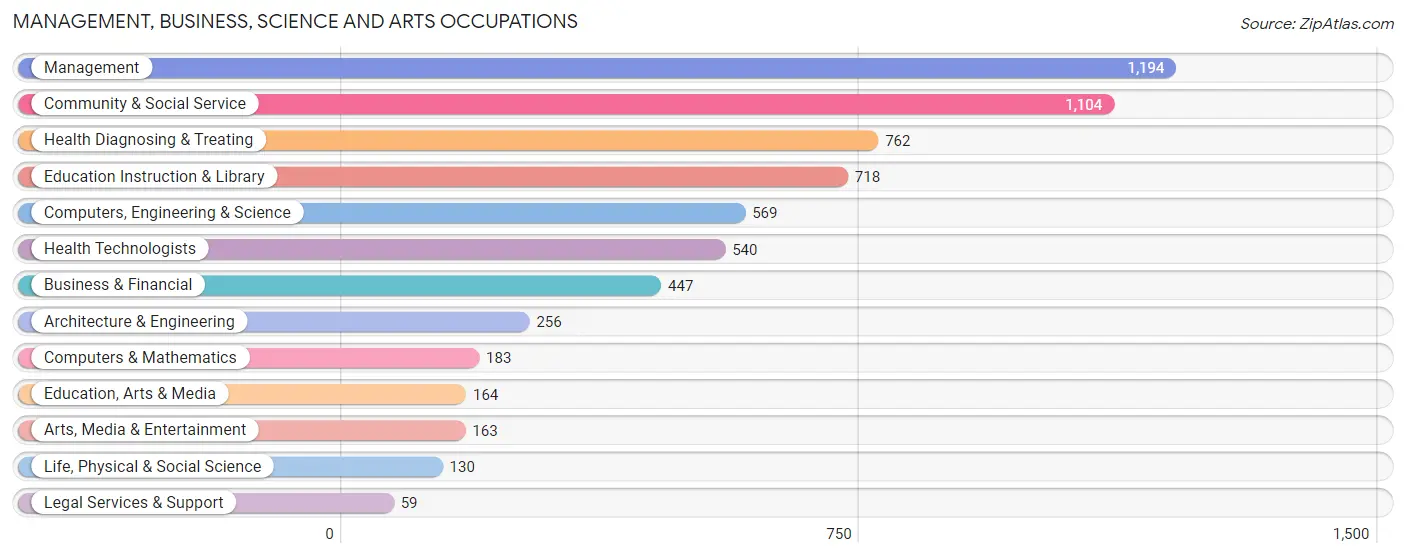
Management, Business, Science and Arts Occupations
The most common Management, Business, Science and Arts occupations in Mason County are Management (1,194 | 9.6%), Community & Social Service (1,104 | 8.9%), Health Diagnosing & Treating (762 | 6.1%), Education Instruction & Library (718 | 5.8%), and Computers, Engineering & Science (569 | 4.6%).
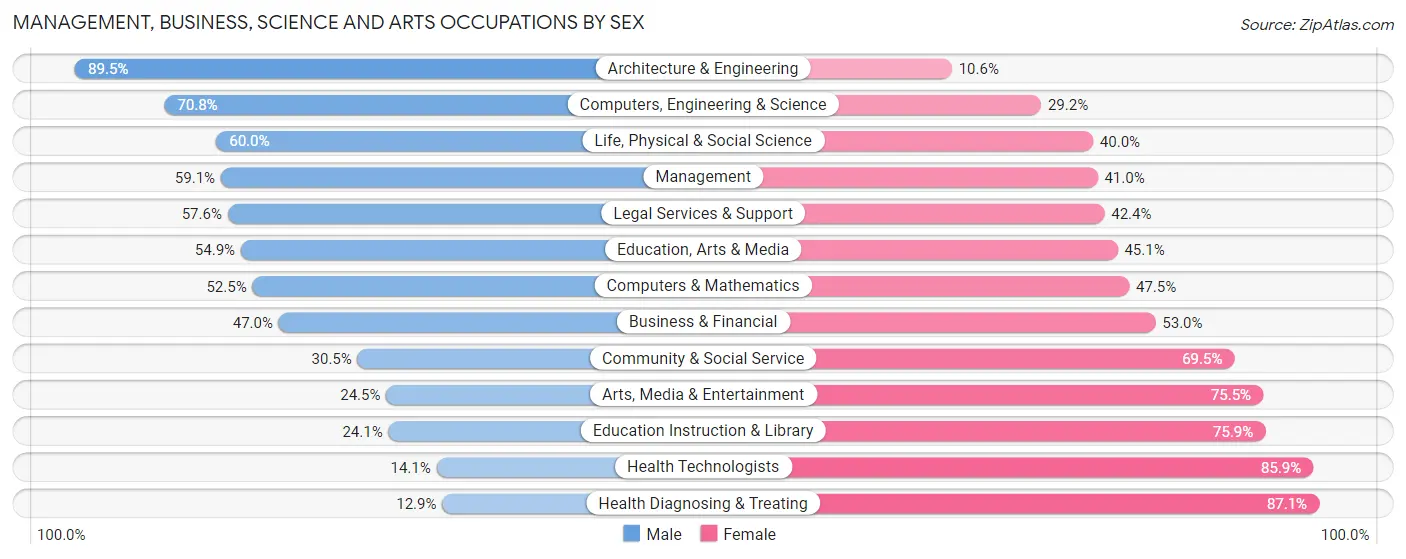
Management, Business, Science and Arts Occupations by Sex
Within the Management, Business, Science and Arts occupations in Mason County, the most male-oriented occupations are Architecture & Engineering (89.4%), Computers, Engineering & Science (70.8%), and Life, Physical & Social Science (60.0%), while the most female-oriented occupations are Health Diagnosing & Treating (87.1%), Health Technologists (85.9%), and Education Instruction & Library (75.9%).
| Occupation | Male | Female |
| Management | 705 (59.1%) | 489 (40.9%) |
| Business & Financial | 210 (47.0%) | 237 (53.0%) |
| Computers, Engineering & Science | 403 (70.8%) | 166 (29.2%) |
| Computers & Mathematics | 96 (52.5%) | 87 (47.5%) |
| Architecture & Engineering | 229 (89.4%) | 27 (10.5%) |
| Life, Physical & Social Science | 78 (60.0%) | 52 (40.0%) |
| Community & Social Service | 337 (30.5%) | 767 (69.5%) |
| Education, Arts & Media | 90 (54.9%) | 74 (45.1%) |
| Legal Services & Support | 34 (57.6%) | 25 (42.4%) |
| Education Instruction & Library | 173 (24.1%) | 545 (75.9%) |
| Arts, Media & Entertainment | 40 (24.5%) | 123 (75.5%) |
| Health Diagnosing & Treating | 98 (12.9%) | 664 (87.1%) |
| Health Technologists | 76 (14.1%) | 464 (85.9%) |
| Total (Category) | 1,753 (43.0%) | 2,323 (57.0%) |
| Total (Overall) | 6,498 (52.4%) | 5,912 (47.6%) |
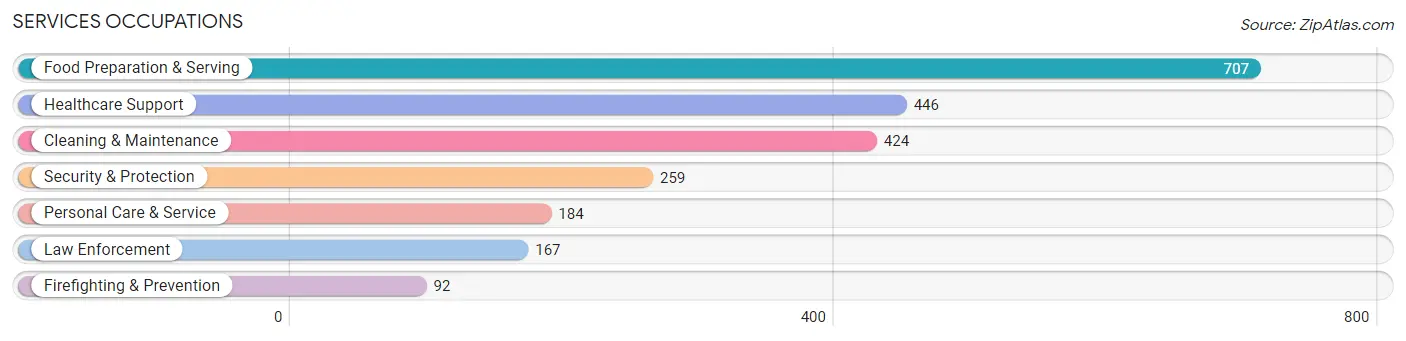
Services Occupations
The most common Services occupations in Mason County are Food Preparation & Serving (707 | 5.7%), Healthcare Support (446 | 3.6%), Cleaning & Maintenance (424 | 3.4%), Security & Protection (259 | 2.1%), and Personal Care & Service (184 | 1.5%).
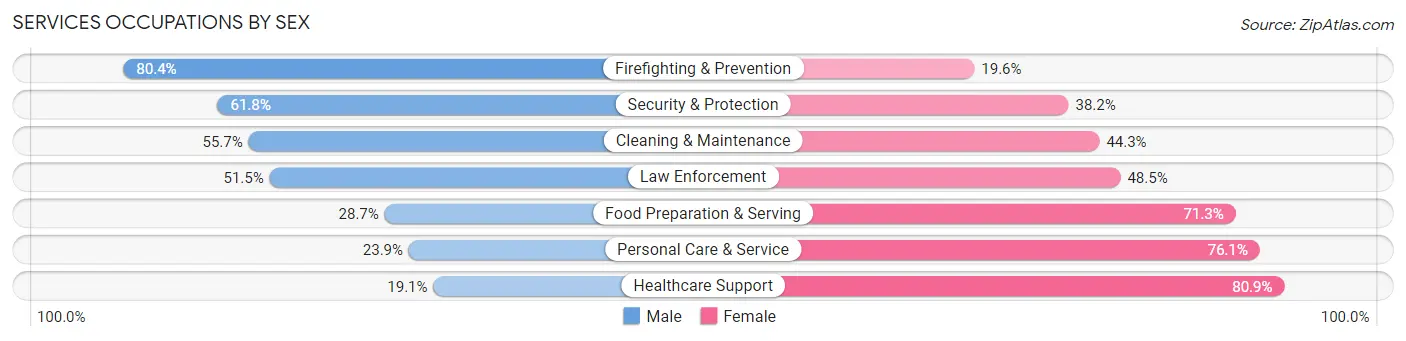
Services Occupations by Sex
Within the Services occupations in Mason County, the most male-oriented occupations are Firefighting & Prevention (80.4%), Security & Protection (61.8%), and Cleaning & Maintenance (55.7%), while the most female-oriented occupations are Healthcare Support (80.9%), Personal Care & Service (76.1%), and Food Preparation & Serving (71.3%).
| Occupation | Male | Female |
| Healthcare Support | 85 (19.1%) | 361 (80.9%) |
| Security & Protection | 160 (61.8%) | 99 (38.2%) |
| Firefighting & Prevention | 74 (80.4%) | 18 (19.6%) |
| Law Enforcement | 86 (51.5%) | 81 (48.5%) |
| Food Preparation & Serving | 203 (28.7%) | 504 (71.3%) |
| Cleaning & Maintenance | 236 (55.7%) | 188 (44.3%) |
| Personal Care & Service | 44 (23.9%) | 140 (76.1%) |
| Total (Category) | 728 (36.0%) | 1,292 (64.0%) |
| Total (Overall) | 6,498 (52.4%) | 5,912 (47.6%) |
Sales and Office Occupations
The most common Sales and Office occupations in Mason County are Office & Administration (1,399 | 11.3%), and Sales & Related (1,199 | 9.7%).

Sales and Office Occupations by Sex
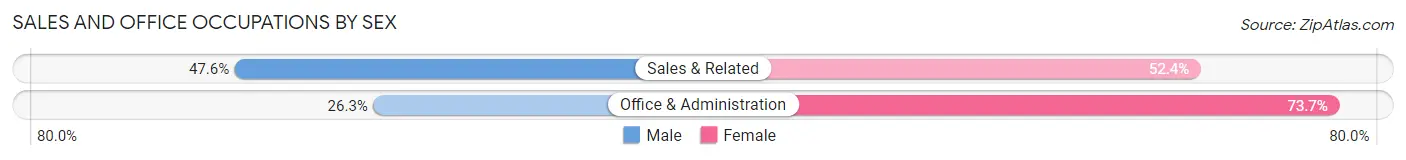
| Occupation | Male | Female |
| Sales & Related | 571 (47.6%) | 628 (52.4%) |
| Office & Administration | 368 (26.3%) | 1,031 (73.7%) |
| Total (Category) | 939 (36.1%) | 1,659 (63.9%) |
| Total (Overall) | 6,498 (52.4%) | 5,912 (47.6%) |
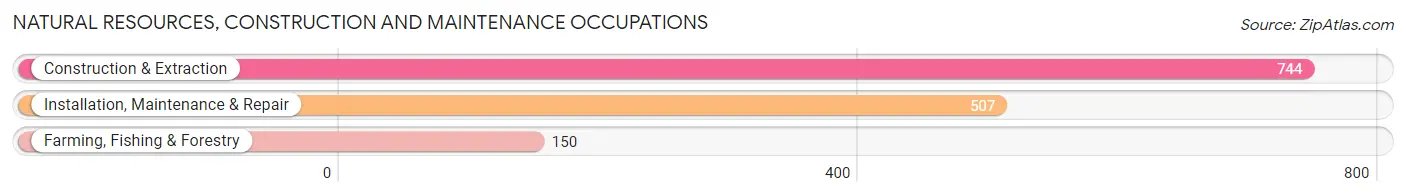
Natural Resources, Construction and Maintenance Occupations
The most common Natural Resources, Construction and Maintenance occupations in Mason County are Construction & Extraction (744 | 6.0%), Installation, Maintenance & Repair (507 | 4.1%), and Farming, Fishing & Forestry (150 | 1.2%).
Natural Resources, Construction and Maintenance Occupations by Sex
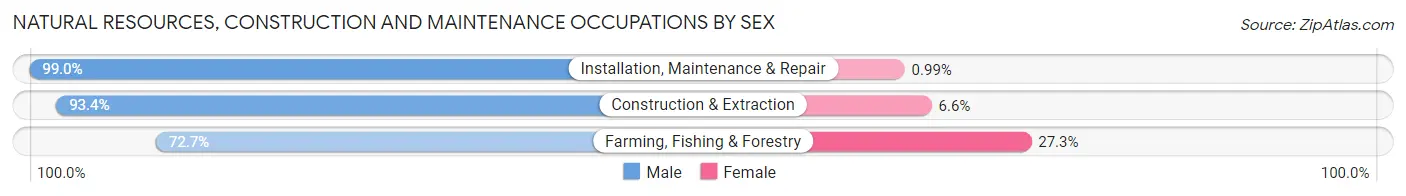
| Occupation | Male | Female |
| Farming, Fishing & Forestry | 109 (72.7%) | 41 (27.3%) |
| Construction & Extraction | 695 (93.4%) | 49 (6.6%) |
| Installation, Maintenance & Repair | 502 (99.0%) | 5 (1.0%) |
| Total (Category) | 1,306 (93.2%) | 95 (6.8%) |
| Total (Overall) | 6,498 (52.4%) | 5,912 (47.6%) |
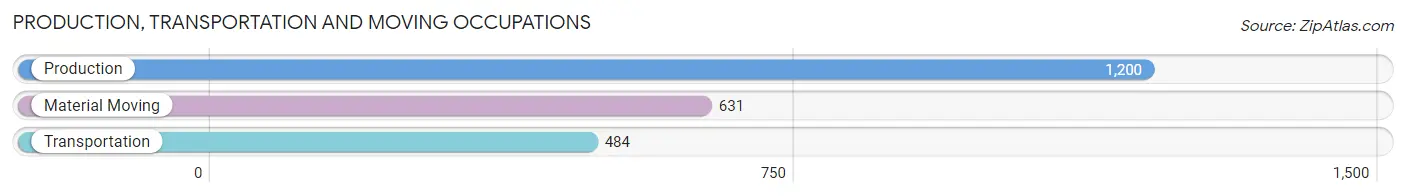
Production, Transportation and Moving Occupations
The most common Production, Transportation and Moving occupations in Mason County are Production (1,200 | 9.7%), Material Moving (631 | 5.1%), and Transportation (484 | 3.9%).
Production, Transportation and Moving Occupations by Sex
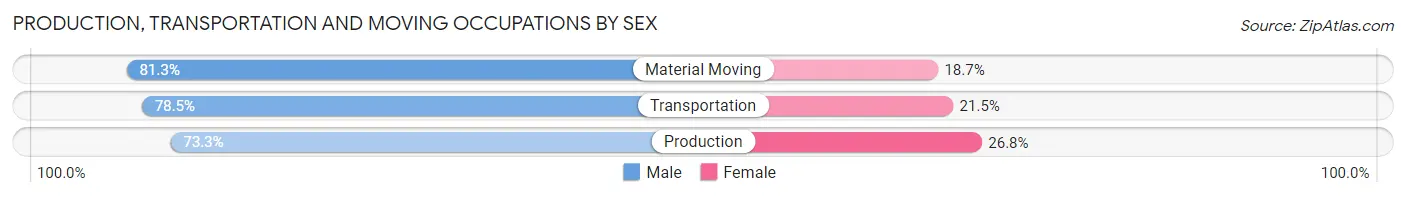
| Occupation | Male | Female |
| Production | 879 (73.3%) | 321 (26.8%) |
| Transportation | 380 (78.5%) | 104 (21.5%) |
| Material Moving | 513 (81.3%) | 118 (18.7%) |
| Total (Category) | 1,772 (76.5%) | 543 (23.5%) |
| Total (Overall) | 6,498 (52.4%) | 5,912 (47.6%) |
Employment Industries by Sex in Mason County
Employment Industries in Mason County
The major employment industries in Mason County include Manufacturing (2,099 | 16.9%), Retail Trade (1,743 | 14.1%), Health Care & Social Assistance (1,637 | 13.2%), Educational Services (1,008 | 8.1%), and Accommodation & Food Services (973 | 7.8%).

Employment Industries by Sex in Mason County
The Mason County industries that see more men than women are Utilities (98.7%), Construction (95.1%), and Agriculture, Fishing & Hunting (80.0%), whereas the industries that tend to have a higher number of women are Enterprise Management (100.0%), Health Care & Social Assistance (83.0%), and Information (77.2%).

| Industry | Male | Female |
| Agriculture, Fishing & Hunting | 224 (80.0%) | 56 (20.0%) |
| Mining, Quarrying, & Extraction | 122 (78.7%) | 33 (21.3%) |
| Construction | 788 (95.1%) | 41 (5.0%) |
| Manufacturing | 1,610 (76.7%) | 489 (23.3%) |
| Wholesale Trade | 110 (72.9%) | 41 (27.2%) |
| Retail Trade | 903 (51.8%) | 840 (48.2%) |
| Transportation & Warehousing | 297 (66.6%) | 149 (33.4%) |
| Utilities | 236 (98.7%) | 3 (1.3%) |
| Information | 34 (22.8%) | 115 (77.2%) |
| Finance & Insurance | 92 (30.8%) | 207 (69.2%) |
| Real Estate, Rental & Leasing | 85 (35.4%) | 155 (64.6%) |
| Professional & Scientific | 215 (45.9%) | 253 (54.1%) |
| Enterprise Management | 0 (0.0%) | 28 (100.0%) |
| Administrative & Support | 234 (58.7%) | 165 (41.3%) |
| Educational Services | 281 (27.9%) | 727 (72.1%) |
| Health Care & Social Assistance | 278 (17.0%) | 1,359 (83.0%) |
| Arts, Entertainment & Recreation | 184 (59.2%) | 127 (40.8%) |
| Accommodation & Food Services | 380 (39.1%) | 593 (61.0%) |
| Public Administration | 239 (42.7%) | 320 (57.3%) |
| Total | 6,498 (52.4%) | 5,912 (47.6%) |
Education in Mason County
School Enrollment in Mason County
The most common levels of schooling among the 5,473 students in Mason County are high school (1,373 | 25.1%), elementary school (1,372 | 25.1%), and middle school (1,222 | 22.3%).

| School Level | # Students | % Students |
| Nursery / Preschool | 321 | 5.9% |
| Kindergarten | 322 | 5.9% |
| Elementary School | 1,372 | 25.1% |
| Middle School | 1,222 | 22.3% |
| High School | 1,373 | 25.1% |
| College / Undergraduate | 740 | 13.5% |
| Graduate / Professional | 123 | 2.2% |
| Total | 5,473 | 100.0% |
School Enrollment by Age by Funding Source in Mason County
Out of a total of 5,473 students who are enrolled in schools in Mason County, 613 (11.2%) attend a private institution, while the remaining 4,860 (88.8%) are enrolled in public schools. The age group of 3 to 4 year olds has the highest likelihood of being enrolled in private schools, with 52 (23.3% in the age bracket) enrolled. Conversely, the age group of 18 to 19 year olds has the lowest likelihood of being enrolled in a private school, with 310 (99.4% in the age bracket) attending a public institution.
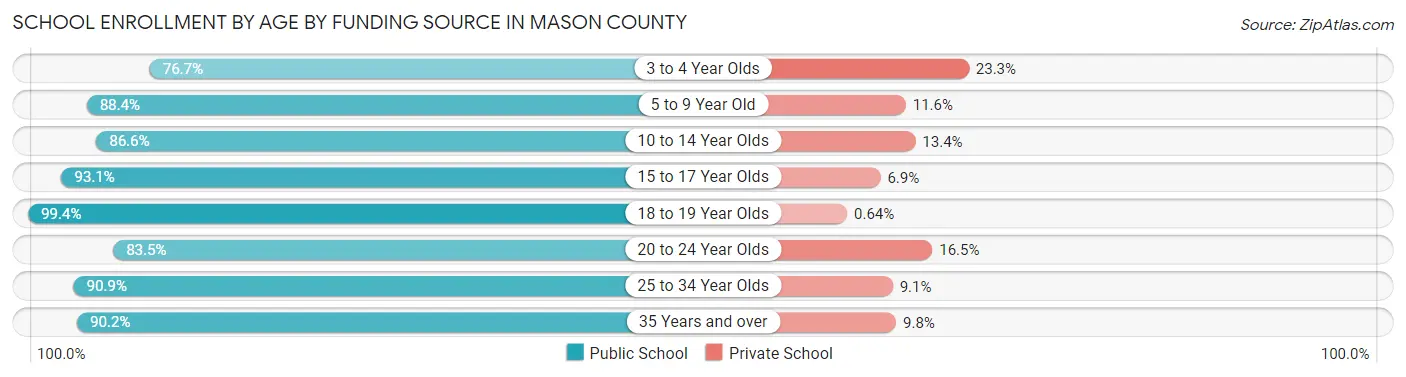
| Age Bracket | Public School | Private School |
| 3 to 4 Year Olds | 171 (76.7%) | 52 (23.3%) |
| 5 to 9 Year Old | 1,307 (88.4%) | 171 (11.6%) |
| 10 to 14 Year Olds | 1,478 (86.6%) | 228 (13.4%) |
| 15 to 17 Year Olds | 964 (93.1%) | 71 (6.9%) |
| 18 to 19 Year Olds | 310 (99.4%) | 2 (0.6%) |
| 20 to 24 Year Olds | 263 (83.5%) | 52 (16.5%) |
| 25 to 34 Year Olds | 209 (90.9%) | 21 (9.1%) |
| 35 Years and over | 157 (90.2%) | 17 (9.8%) |
| Total | 4,860 (88.8%) | 613 (11.2%) |
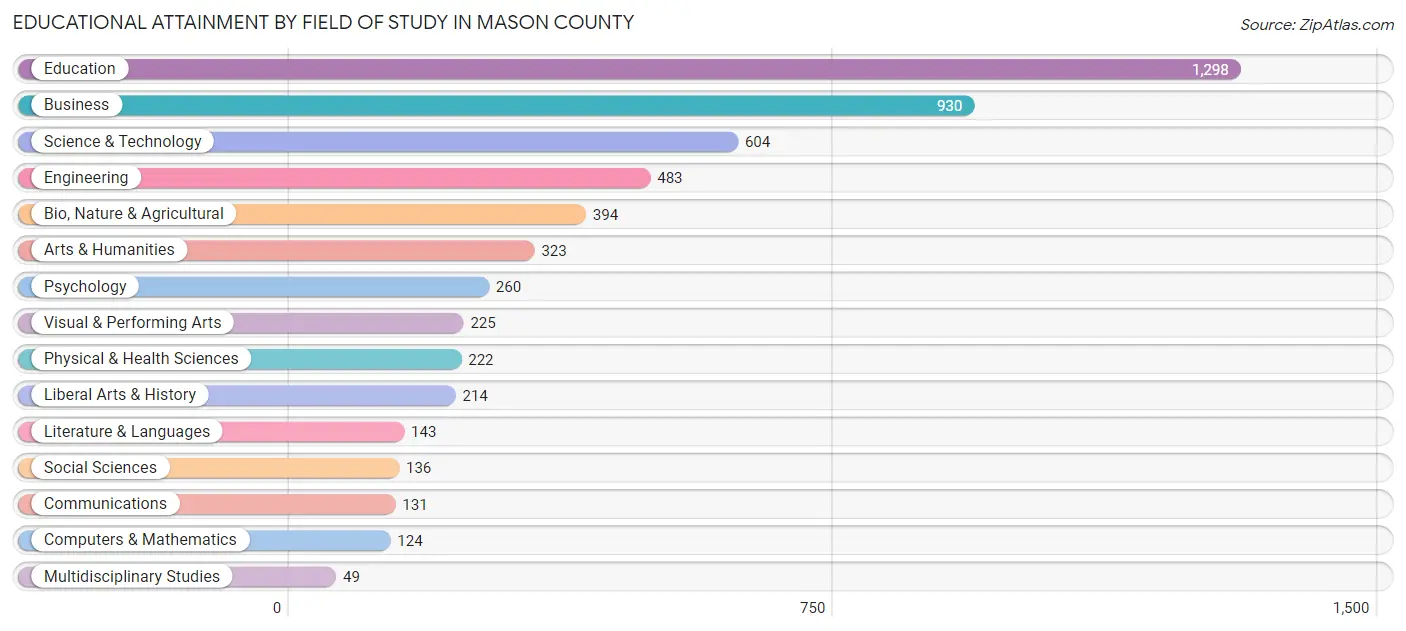
Educational Attainment by Field of Study in Mason County
Education (1,298 | 23.4%), business (930 | 16.8%), science & technology (604 | 10.9%), engineering (483 | 8.7%), and bio, nature & agricultural (394 | 7.1%) are the most common fields of study among 5,536 individuals in Mason County who have obtained a bachelor's degree or higher.
| Field of Study | # Graduates | % Graduates |
| Computers & Mathematics | 124 | 2.2% |
| Bio, Nature & Agricultural | 394 | 7.1% |
| Physical & Health Sciences | 222 | 4.0% |
| Psychology | 260 | 4.7% |
| Social Sciences | 136 | 2.5% |
| Engineering | 483 | 8.7% |
| Multidisciplinary Studies | 49 | 0.9% |
| Science & Technology | 604 | 10.9% |
| Business | 930 | 16.8% |
| Education | 1,298 | 23.4% |
| Literature & Languages | 143 | 2.6% |
| Liberal Arts & History | 214 | 3.9% |
| Visual & Performing Arts | 225 | 4.1% |
| Communications | 131 | 2.4% |
| Arts & Humanities | 323 | 5.8% |
| Total | 5,536 | 100.0% |
Transportation & Commute in Mason County
Vehicle Availability by Sex in Mason County
The most prevalent vehicle ownership categories in Mason County are males with 2 vehicles (2,876, accounting for 45.2%) and females with 2 vehicles (2,278, making up 49.5%).
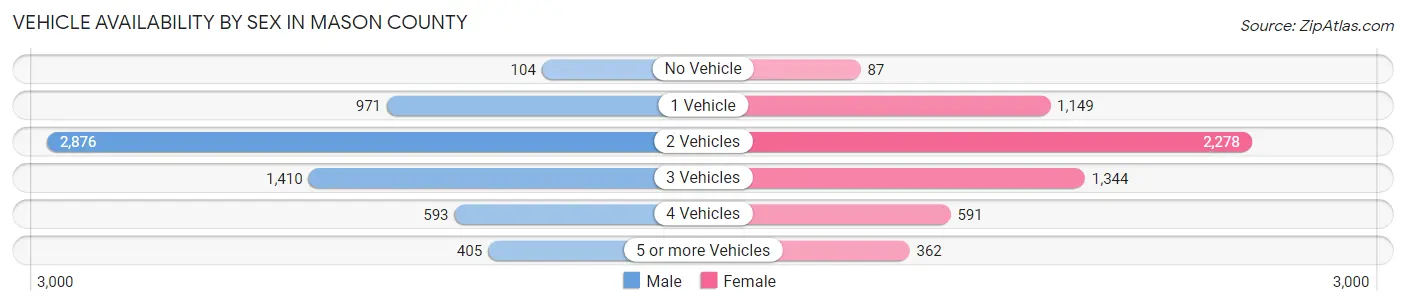
| Vehicles Available | Male | Female |
| No Vehicle | 104 (1.6%) | 87 (1.5%) |
| 1 Vehicle | 971 (15.3%) | 1,149 (19.8%) |
| 2 Vehicles | 2,876 (45.2%) | 2,278 (39.2%) |
| 3 Vehicles | 1,410 (22.2%) | 1,344 (23.1%) |
| 4 Vehicles | 593 (9.3%) | 591 (10.2%) |
| 5 or more Vehicles | 405 (6.4%) | 362 (6.2%) |
| Total | 6,359 (100.0%) | 5,811 (100.0%) |
Commute Time in Mason County
The most frequently occuring commute durations in Mason County are 15 to 19 minutes (2,323 commuters, 20.6%), 5 to 9 minutes (2,311 commuters, 20.5%), and 10 to 14 minutes (1,995 commuters, 17.7%).
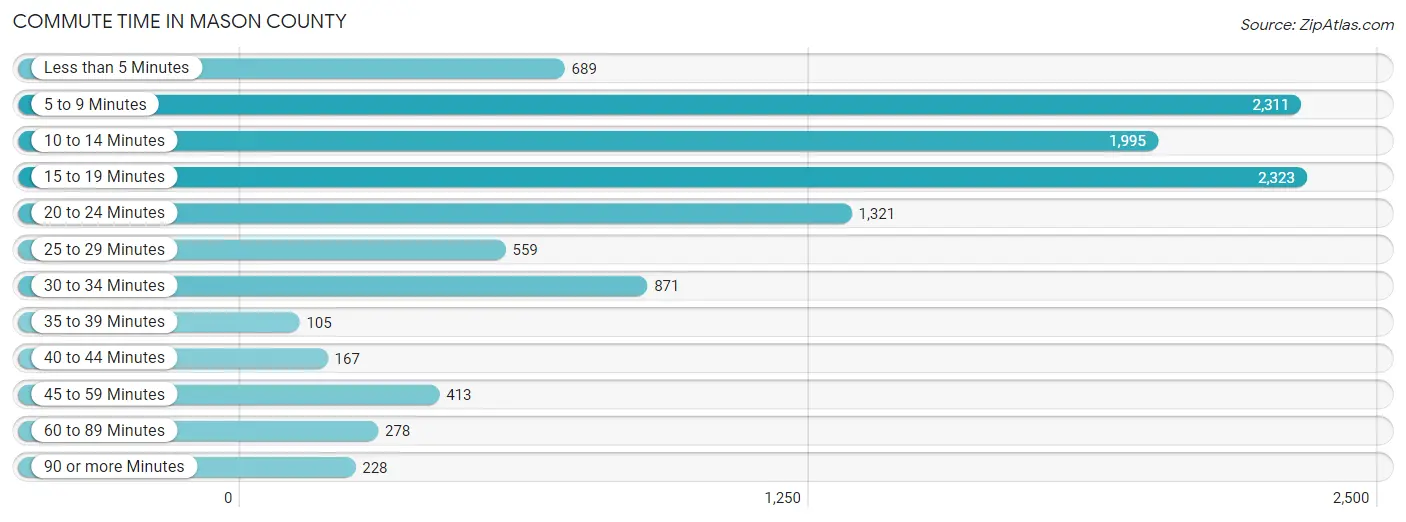
| Commute Time | # Commuters | % Commuters |
| Less than 5 Minutes | 689 | 6.1% |
| 5 to 9 Minutes | 2,311 | 20.5% |
| 10 to 14 Minutes | 1,995 | 17.7% |
| 15 to 19 Minutes | 2,323 | 20.6% |
| 20 to 24 Minutes | 1,321 | 11.7% |
| 25 to 29 Minutes | 559 | 5.0% |
| 30 to 34 Minutes | 871 | 7.7% |
| 35 to 39 Minutes | 105 | 0.9% |
| 40 to 44 Minutes | 167 | 1.5% |
| 45 to 59 Minutes | 413 | 3.7% |
| 60 to 89 Minutes | 278 | 2.5% |
| 90 or more Minutes | 228 | 2.0% |
Commute Time by Sex in Mason County
The most common commute times in Mason County are 15 to 19 minutes (1,355 commuters, 22.7%) for males and 5 to 9 minutes (1,109 commuters, 21.0%) for females.

| Commute Time | Male | Female |
| Less than 5 Minutes | 340 (5.7%) | 349 (6.6%) |
| 5 to 9 Minutes | 1,202 (20.1%) | 1,109 (21.0%) |
| 10 to 14 Minutes | 1,018 (17.1%) | 977 (18.5%) |
| 15 to 19 Minutes | 1,355 (22.7%) | 968 (18.3%) |
| 20 to 24 Minutes | 702 (11.8%) | 619 (11.7%) |
| 25 to 29 Minutes | 236 (4.0%) | 323 (6.1%) |
| 30 to 34 Minutes | 440 (7.4%) | 431 (8.2%) |
| 35 to 39 Minutes | 56 (0.9%) | 49 (0.9%) |
| 40 to 44 Minutes | 109 (1.8%) | 58 (1.1%) |
| 45 to 59 Minutes | 203 (3.4%) | 210 (4.0%) |
| 60 to 89 Minutes | 131 (2.2%) | 147 (2.8%) |
| 90 or more Minutes | 179 (3.0%) | 49 (0.9%) |
Time of Departure to Work by Sex in Mason County
The most frequent times of departure to work in Mason County are 6:30 AM to 6:59 AM (828, 13.9%) for males and 7:30 AM to 7:59 AM (1,006, 19.0%) for females.

| Time of Departure | Male | Female |
| 12:00 AM to 4:59 AM | 402 (6.7%) | 155 (2.9%) |
| 5:00 AM to 5:29 AM | 208 (3.5%) | 81 (1.5%) |
| 5:30 AM to 5:59 AM | 563 (9.4%) | 306 (5.8%) |
| 6:00 AM to 6:29 AM | 423 (7.1%) | 264 (5.0%) |
| 6:30 AM to 6:59 AM | 828 (13.9%) | 442 (8.4%) |
| 7:00 AM to 7:29 AM | 586 (9.8%) | 532 (10.1%) |
| 7:30 AM to 7:59 AM | 724 (12.1%) | 1,006 (19.0%) |
| 8:00 AM to 8:29 AM | 565 (9.5%) | 580 (11.0%) |
| 8:30 AM to 8:59 AM | 123 (2.1%) | 304 (5.8%) |
| 9:00 AM to 9:59 AM | 321 (5.4%) | 448 (8.5%) |
| 10:00 AM to 10:59 AM | 154 (2.6%) | 251 (4.8%) |
| 11:00 AM to 11:59 AM | 63 (1.1%) | 112 (2.1%) |
| 12:00 PM to 3:59 PM | 443 (7.4%) | 459 (8.7%) |
| 4:00 PM to 11:59 PM | 568 (9.5%) | 349 (6.6%) |
| Total | 5,971 (100.0%) | 5,289 (100.0%) |
Housing Occupancy in Mason County
Occupancy by Ownership in Mason County
Of the total 12,296 dwellings in Mason County, owner-occupied units account for 9,609 (78.1%), while renter-occupied units make up 2,687 (21.8%).
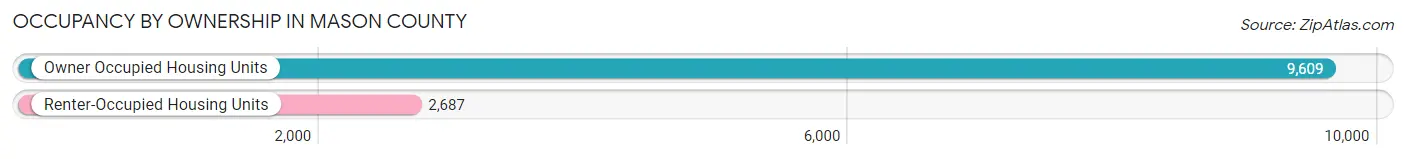
| Occupancy | # Housing Units | % Housing Units |
| Owner Occupied Housing Units | 9,609 | 78.1% |
| Renter-Occupied Housing Units | 2,687 | 21.8% |
| Total Occupied Housing Units | 12,296 | 100.0% |
Occupancy by Household Size in Mason County
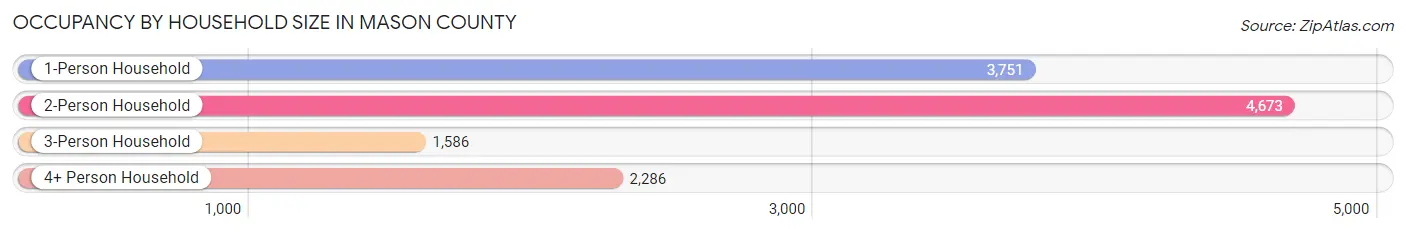
| Household Size | # Housing Units | % Housing Units |
| 1-Person Household | 3,751 | 30.5% |
| 2-Person Household | 4,673 | 38.0% |
| 3-Person Household | 1,586 | 12.9% |
| 4+ Person Household | 2,286 | 18.6% |
| Total Housing Units | 12,296 | 100.0% |
Occupancy by Ownership by Household Size in Mason County
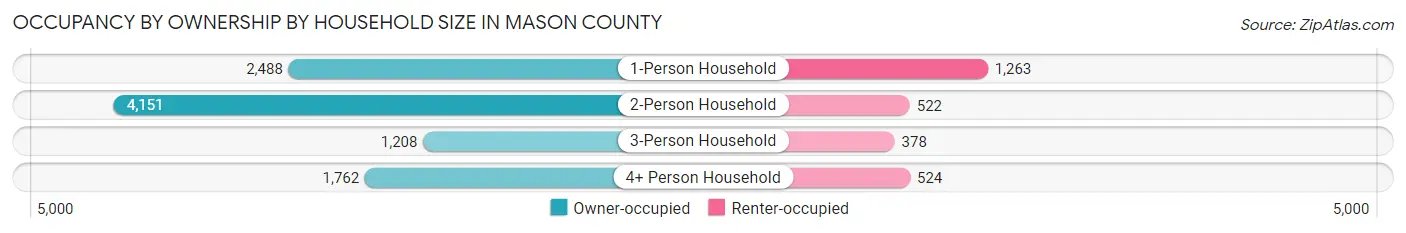
| Household Size | Owner-occupied | Renter-occupied |
| 1-Person Household | 2,488 (66.3%) | 1,263 (33.7%) |
| 2-Person Household | 4,151 (88.8%) | 522 (11.2%) |
| 3-Person Household | 1,208 (76.2%) | 378 (23.8%) |
| 4+ Person Household | 1,762 (77.1%) | 524 (22.9%) |
| Total Housing Units | 9,609 (78.1%) | 2,687 (21.8%) |
Occupancy by Educational Attainment in Mason County
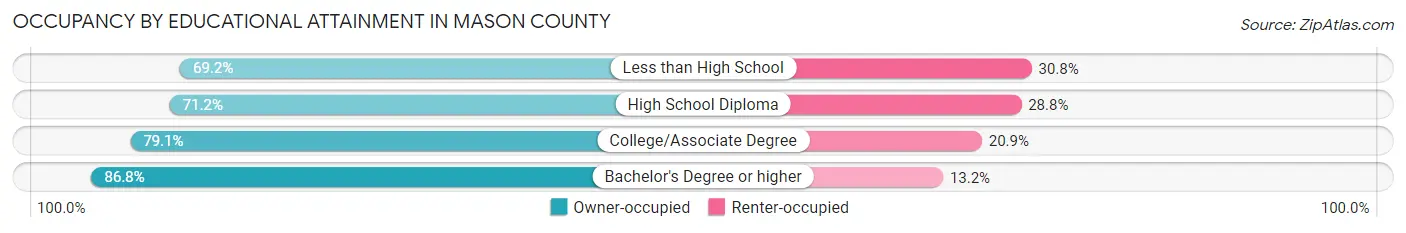
| Household Size | Owner-occupied | Renter-occupied |
| Less than High School | 467 (69.2%) | 208 (30.8%) |
| High School Diploma | 2,703 (71.2%) | 1,091 (28.8%) |
| College/Associate Degree | 3,614 (79.1%) | 957 (20.9%) |
| Bachelor's Degree or higher | 2,825 (86.8%) | 431 (13.2%) |
Occupancy by Age of Householder in Mason County
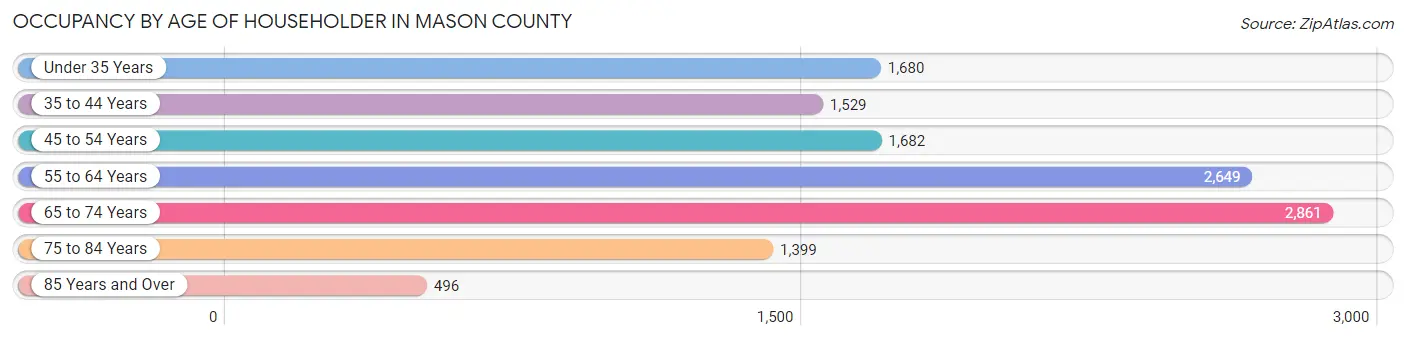
| Age Bracket | # Households | % Households |
| Under 35 Years | 1,680 | 13.7% |
| 35 to 44 Years | 1,529 | 12.4% |
| 45 to 54 Years | 1,682 | 13.7% |
| 55 to 64 Years | 2,649 | 21.5% |
| 65 to 74 Years | 2,861 | 23.3% |
| 75 to 84 Years | 1,399 | 11.4% |
| 85 Years and Over | 496 | 4.0% |
| Total | 12,296 | 100.0% |
Housing Finances in Mason County
Median Income by Occupancy in Mason County
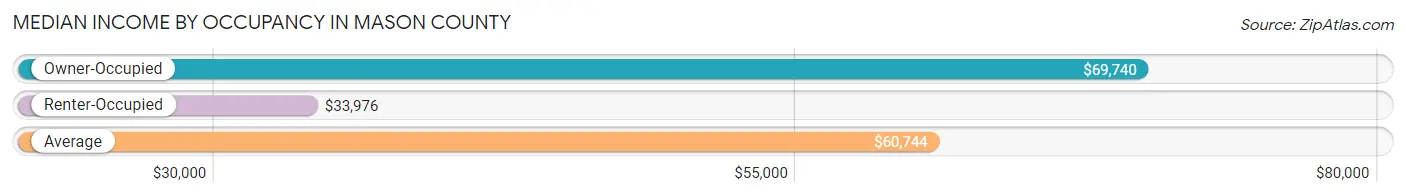
| Occupancy Type | # Households | Median Income |
| Owner-Occupied | 9,609 (78.1%) | $69,740 |
| Renter-Occupied | 2,687 (21.8%) | $33,976 |
| Average | 12,296 (100.0%) | $60,744 |
Occupancy by Householder Income Bracket in Mason County
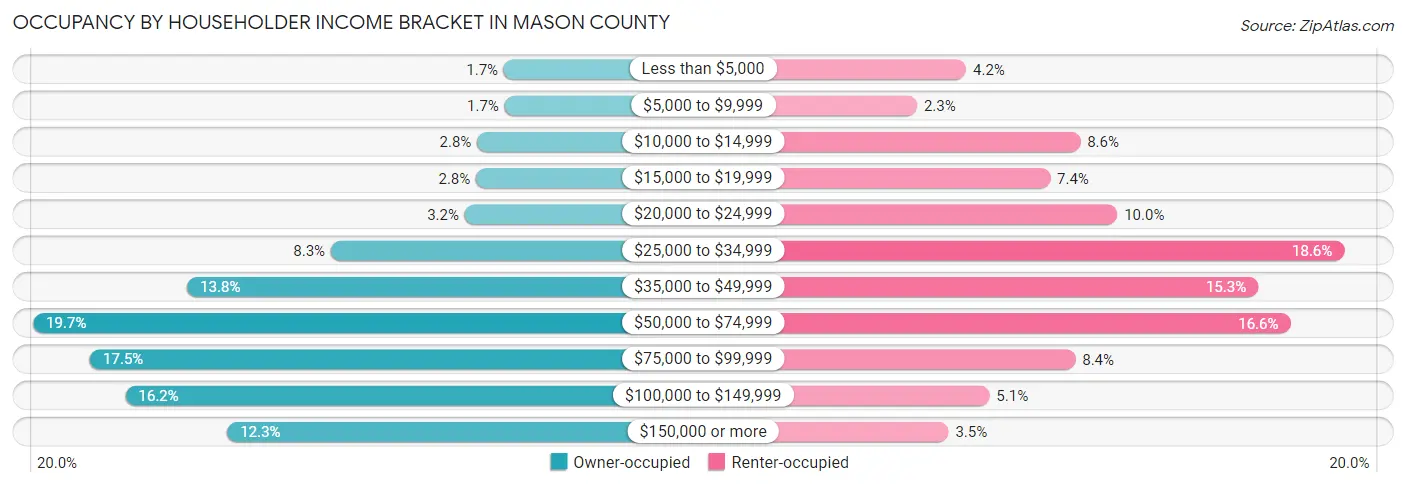
| Income Bracket | Owner-occupied | Renter-occupied |
| Less than $5,000 | 167 (1.7%) | 113 (4.2%) |
| $5,000 to $9,999 | 164 (1.7%) | 63 (2.3%) |
| $10,000 to $14,999 | 265 (2.8%) | 230 (8.6%) |
| $15,000 to $19,999 | 269 (2.8%) | 199 (7.4%) |
| $20,000 to $24,999 | 310 (3.2%) | 268 (10.0%) |
| $25,000 to $34,999 | 800 (8.3%) | 500 (18.6%) |
| $35,000 to $49,999 | 1,327 (13.8%) | 412 (15.3%) |
| $50,000 to $74,999 | 1,891 (19.7%) | 445 (16.6%) |
| $75,000 to $99,999 | 1,683 (17.5%) | 225 (8.4%) |
| $100,000 to $149,999 | 1,553 (16.2%) | 137 (5.1%) |
| $150,000 or more | 1,180 (12.3%) | 95 (3.5%) |
| Total | 9,609 (100.0%) | 2,687 (100.0%) |
Monthly Housing Cost Tiers in Mason County
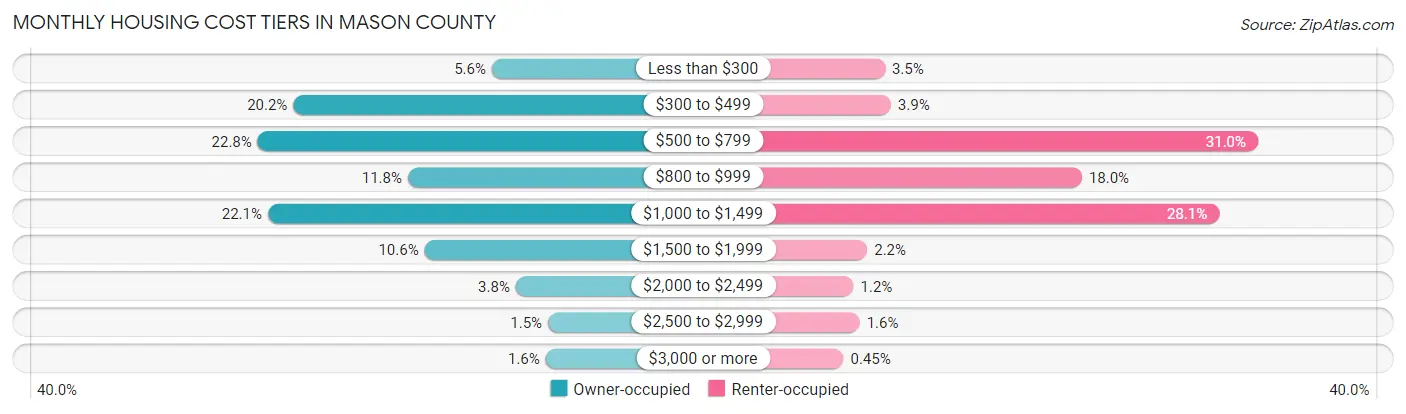
| Monthly Cost | Owner-occupied | Renter-occupied |
| Less than $300 | 537 (5.6%) | 94 (3.5%) |
| $300 to $499 | 1,943 (20.2%) | 106 (3.9%) |
| $500 to $799 | 2,195 (22.8%) | 832 (31.0%) |
| $800 to $999 | 1,132 (11.8%) | 484 (18.0%) |
| $1,000 to $1,499 | 2,123 (22.1%) | 755 (28.1%) |
| $1,500 to $1,999 | 1,014 (10.5%) | 59 (2.2%) |
| $2,000 to $2,499 | 368 (3.8%) | 32 (1.2%) |
| $2,500 to $2,999 | 140 (1.5%) | 44 (1.6%) |
| $3,000 or more | 157 (1.6%) | 12 (0.4%) |
| Total | 9,609 (100.0%) | 2,687 (100.0%) |
Physical Housing Characteristics in Mason County
Housing Structures in Mason County
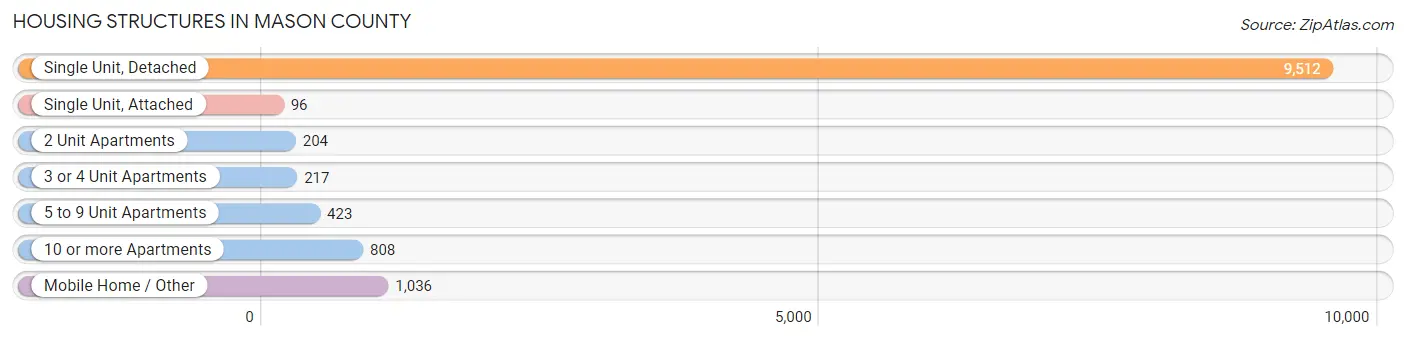
| Structure Type | # Housing Units | % Housing Units |
| Single Unit, Detached | 9,512 | 77.4% |
| Single Unit, Attached | 96 | 0.8% |
| 2 Unit Apartments | 204 | 1.7% |
| 3 or 4 Unit Apartments | 217 | 1.8% |
| 5 to 9 Unit Apartments | 423 | 3.4% |
| 10 or more Apartments | 808 | 6.6% |
| Mobile Home / Other | 1,036 | 8.4% |
| Total | 12,296 | 100.0% |
Housing Structures by Occupancy in Mason County
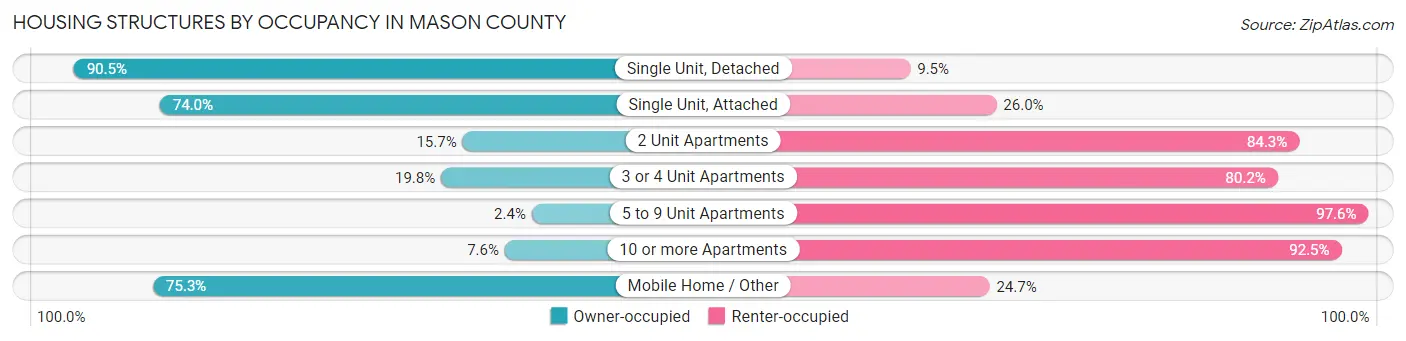
| Structure Type | Owner-occupied | Renter-occupied |
| Single Unit, Detached | 8,612 (90.5%) | 900 (9.5%) |
| Single Unit, Attached | 71 (74.0%) | 25 (26.0%) |
| 2 Unit Apartments | 32 (15.7%) | 172 (84.3%) |
| 3 or 4 Unit Apartments | 43 (19.8%) | 174 (80.2%) |
| 5 to 9 Unit Apartments | 10 (2.4%) | 413 (97.6%) |
| 10 or more Apartments | 61 (7.5%) | 747 (92.4%) |
| Mobile Home / Other | 780 (75.3%) | 256 (24.7%) |
| Total | 9,609 (78.1%) | 2,687 (21.8%) |
Housing Structures by Number of Rooms in Mason County
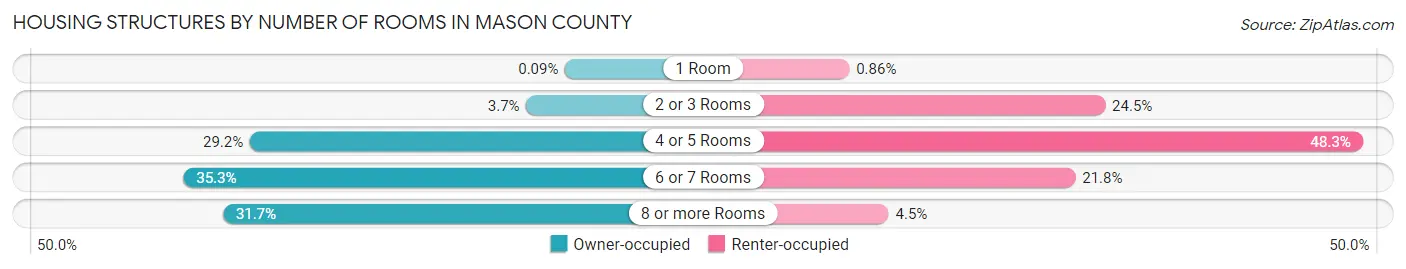
| Number of Rooms | Owner-occupied | Renter-occupied |
| 1 Room | 9 (0.1%) | 23 (0.9%) |
| 2 or 3 Rooms | 354 (3.7%) | 659 (24.5%) |
| 4 or 5 Rooms | 2,810 (29.2%) | 1,299 (48.3%) |
| 6 or 7 Rooms | 3,394 (35.3%) | 585 (21.8%) |
| 8 or more Rooms | 3,042 (31.7%) | 121 (4.5%) |
| Total | 9,609 (100.0%) | 2,687 (100.0%) |
Housing Structure by Heating Type in Mason County
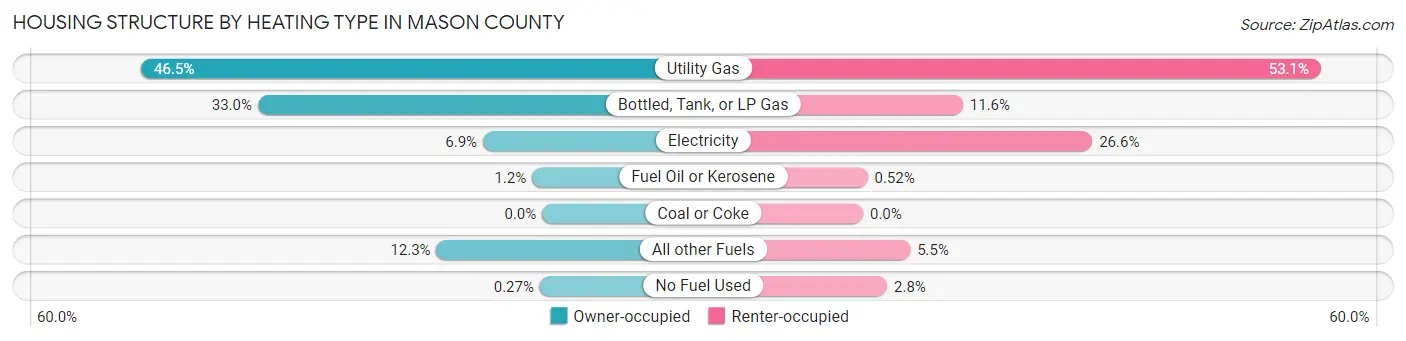
| Heating Type | Owner-occupied | Renter-occupied |
| Utility Gas | 4,468 (46.5%) | 1,426 (53.1%) |
| Bottled, Tank, or LP Gas | 3,167 (33.0%) | 311 (11.6%) |
| Electricity | 659 (6.9%) | 714 (26.6%) |
| Fuel Oil or Kerosene | 112 (1.2%) | 14 (0.5%) |
| Coal or Coke | 0 (0.0%) | 0 (0.0%) |
| All other Fuels | 1,177 (12.2%) | 147 (5.5%) |
| No Fuel Used | 26 (0.3%) | 75 (2.8%) |
| Total | 9,609 (100.0%) | 2,687 (100.0%) |
Household Vehicle Usage in Mason County

| Vehicles per Household | Owner-occupied | Renter-occupied |
| No Vehicle | 379 (3.9%) | 461 (17.2%) |
| 1 Vehicle | 2,554 (26.6%) | 1,281 (47.7%) |
| 2 Vehicles | 4,118 (42.9%) | 692 (25.8%) |
| 3 or more Vehicles | 2,558 (26.6%) | 253 (9.4%) |
| Total | 9,609 (100.0%) | 2,687 (100.0%) |
Real Estate & Mortgages in Mason County
Real Estate and Mortgage Overview in Mason County
| Characteristic | Without Mortgage | With Mortgage |
| Housing Units | 4,678 | 4,931 |
| Median Property Value | $171,900 | $189,300 |
| Median Household Income | $57,106 | $781 |
| Monthly Housing Costs | $493 | $151 |
| Real Estate Taxes | $1,946 | $232 |
Property Value by Mortgage Status in Mason County
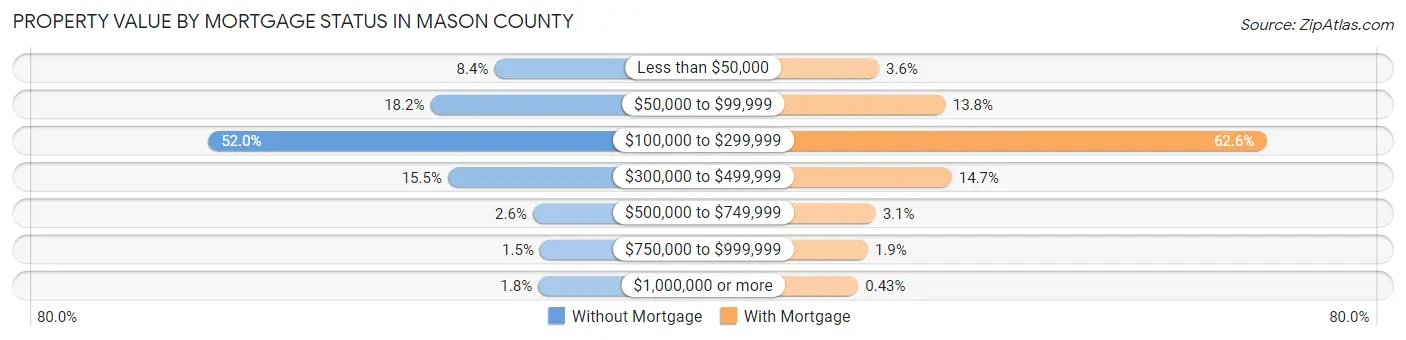
| Property Value | Without Mortgage | With Mortgage |
| Less than $50,000 | 395 (8.4%) | 177 (3.6%) |
| $50,000 to $99,999 | 851 (18.2%) | 678 (13.8%) |
| $100,000 to $299,999 | 2,433 (52.0%) | 3,086 (62.6%) |
| $300,000 to $499,999 | 726 (15.5%) | 724 (14.7%) |
| $500,000 to $749,999 | 120 (2.6%) | 152 (3.1%) |
| $750,000 to $999,999 | 70 (1.5%) | 93 (1.9%) |
| $1,000,000 or more | 83 (1.8%) | 21 (0.4%) |
| Total | 4,678 (100.0%) | 4,931 (100.0%) |
Household Income by Mortgage Status in Mason County
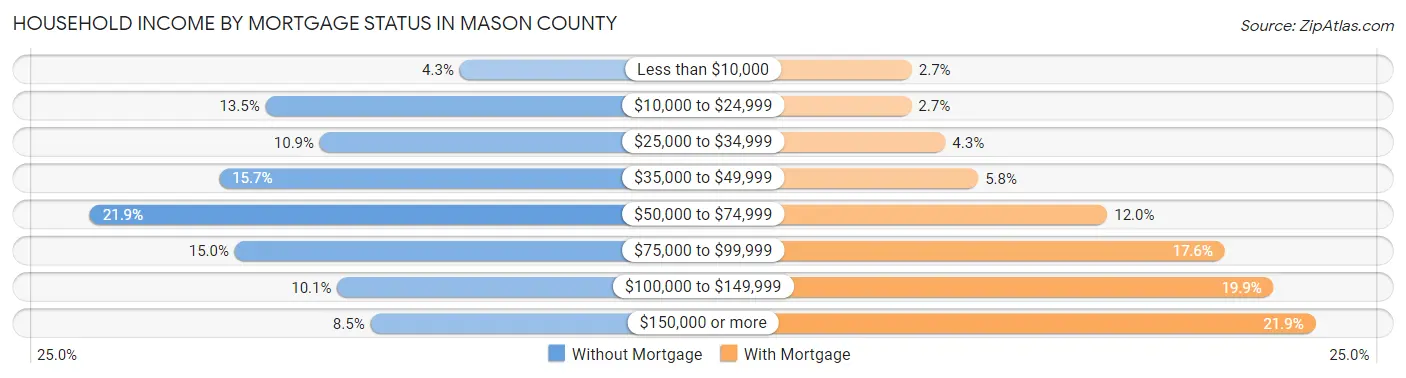
| Household Income | Without Mortgage | With Mortgage |
| Less than $10,000 | 200 (4.3%) | 132 (2.7%) |
| $10,000 to $24,999 | 633 (13.5%) | 131 (2.7%) |
| $25,000 to $34,999 | 512 (10.9%) | 211 (4.3%) |
| $35,000 to $49,999 | 736 (15.7%) | 288 (5.8%) |
| $50,000 to $74,999 | 1,024 (21.9%) | 591 (12.0%) |
| $75,000 to $99,999 | 701 (15.0%) | 867 (17.6%) |
| $100,000 to $149,999 | 473 (10.1%) | 982 (19.9%) |
| $150,000 or more | 399 (8.5%) | 1,080 (21.9%) |
| Total | 4,678 (100.0%) | 4,931 (100.0%) |
Property Value to Household Income Ratio in Mason County
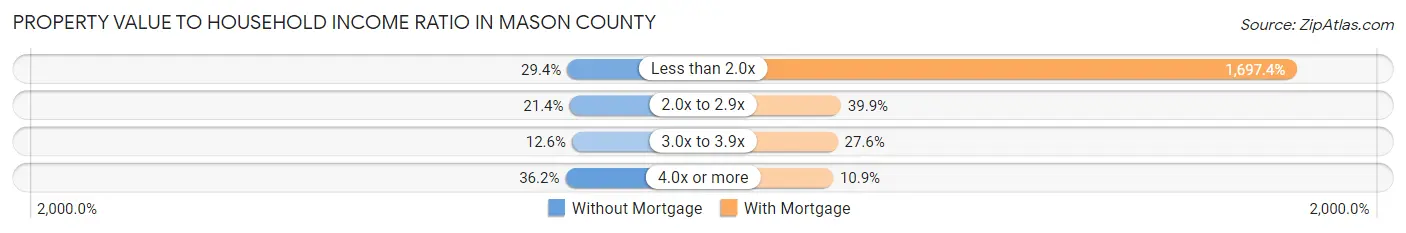
| Value-to-Income Ratio | Without Mortgage | With Mortgage |
| Less than 2.0x | 1,375 (29.4%) | 83,700 (1,697.4%) |
| 2.0x to 2.9x | 1,001 (21.4%) | 1,968 (39.9%) |
| 3.0x to 3.9x | 588 (12.6%) | 1,360 (27.6%) |
| 4.0x or more | 1,693 (36.2%) | 539 (10.9%) |
| Total | 4,678 (100.0%) | 4,931 (100.0%) |
Real Estate Taxes by Mortgage Status in Mason County
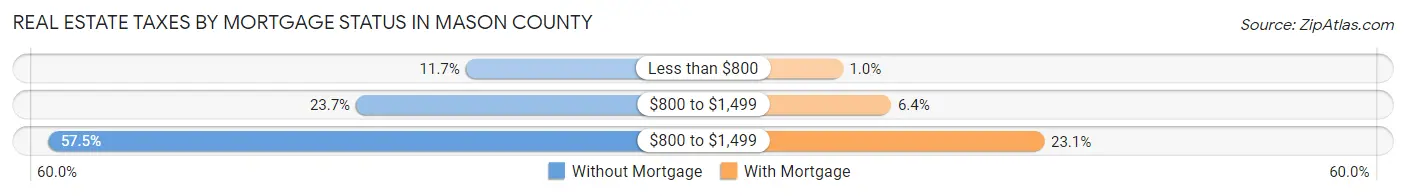
| Property Taxes | Without Mortgage | With Mortgage |
| Less than $800 | 546 (11.7%) | 51 (1.0%) |
| $800 to $1,499 | 1,108 (23.7%) | 313 (6.4%) |
| $800 to $1,499 | 2,688 (57.5%) | 1,140 (23.1%) |
| Total | 4,678 (100.0%) | 4,931 (100.0%) |
Health & Disability in Mason County
Health Insurance Coverage by Age in Mason County
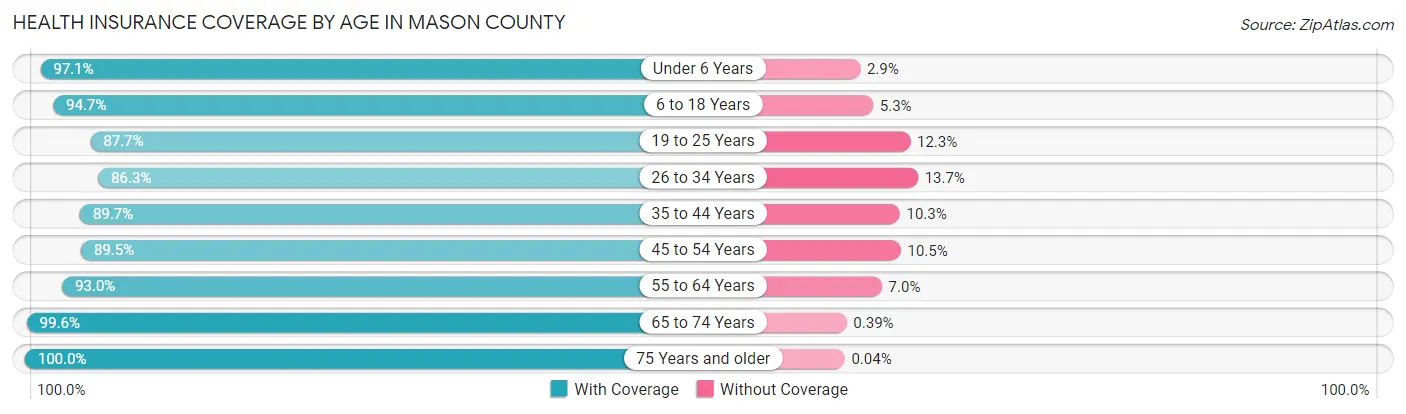
| Age Bracket | With Coverage | Without Coverage |
| Under 6 Years | 1,720 (97.1%) | 52 (2.9%) |
| 6 to 18 Years | 4,185 (94.7%) | 235 (5.3%) |
| 19 to 25 Years | 1,711 (87.7%) | 239 (12.3%) |
| 26 to 34 Years | 2,485 (86.3%) | 394 (13.7%) |
| 35 to 44 Years | 2,715 (89.7%) | 312 (10.3%) |
| 45 to 54 Years | 2,884 (89.5%) | 338 (10.5%) |
| 55 to 64 Years | 4,258 (93.0%) | 319 (7.0%) |
| 65 to 74 Years | 4,355 (99.6%) | 17 (0.4%) |
| 75 Years and older | 2,719 (100.0%) | 1 (0.0%) |
| Total | 27,032 (93.4%) | 1,907 (6.6%) |
Health Insurance Coverage by Citizenship Status in Mason County
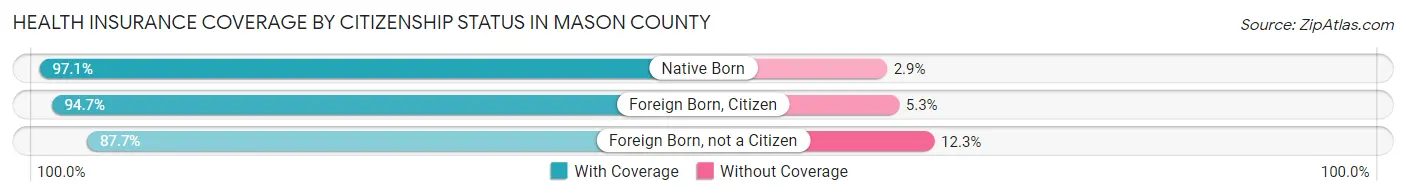
| Citizenship Status | With Coverage | Without Coverage |
| Native Born | 1,720 (97.1%) | 52 (2.9%) |
| Foreign Born, Citizen | 4,185 (94.7%) | 235 (5.3%) |
| Foreign Born, not a Citizen | 1,711 (87.7%) | 239 (12.3%) |
Health Insurance Coverage by Household Income in Mason County
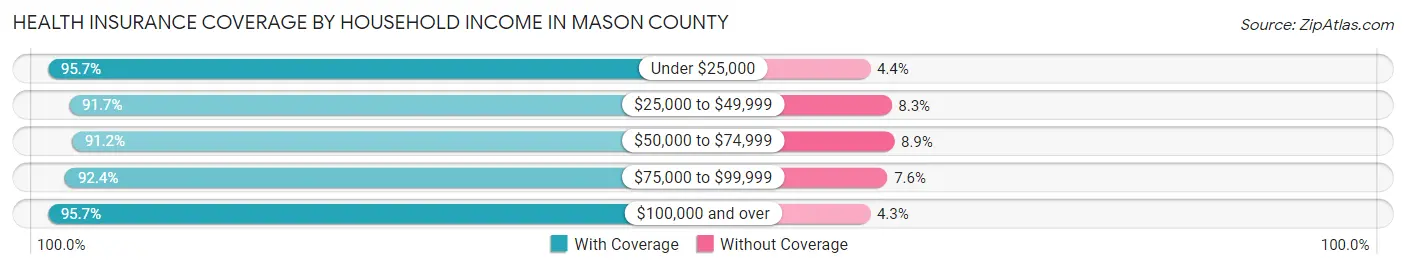
| Household Income | With Coverage | Without Coverage |
| Under $25,000 | 3,324 (95.7%) | 151 (4.3%) |
| $25,000 to $49,999 | 5,518 (91.7%) | 502 (8.3%) |
| $50,000 to $74,999 | 5,003 (91.1%) | 486 (8.8%) |
| $75,000 to $99,999 | 4,737 (92.4%) | 388 (7.6%) |
| $100,000 and over | 8,294 (95.7%) | 376 (4.3%) |
Public vs Private Health Insurance Coverage by Age in Mason County

| Age Bracket | Public Insurance | Private Insurance |
| Under 6 | 1,018 (57.5%) | 922 (52.0%) |
| 6 to 18 Years | 2,146 (48.5%) | 2,614 (59.1%) |
| 19 to 25 Years | 638 (32.7%) | 1,144 (58.7%) |
| 25 to 34 Years | 817 (28.4%) | 1,713 (59.5%) |
| 35 to 44 Years | 734 (24.2%) | 2,205 (72.8%) |
| 45 to 54 Years | 798 (24.8%) | 2,334 (72.4%) |
| 55 to 64 Years | 1,058 (23.1%) | 3,517 (76.8%) |
| 65 to 74 Years | 4,259 (97.4%) | 2,982 (68.2%) |
| 75 Years and over | 2,717 (99.9%) | 1,819 (66.9%) |
| Total | 14,185 (49.0%) | 19,250 (66.5%) |
Disability Status by Sex by Age in Mason County

| Age Bracket | Male | Female |
| Under 5 Years | 2 (0.3%) | 0 (0.0%) |
| 5 to 17 Years | 163 (6.9%) | 75 (3.6%) |
| 18 to 34 Years | 280 (10.5%) | 293 (11.7%) |
| 35 to 64 Years | 833 (15.3%) | 853 (15.8%) |
| 65 to 74 Years | 616 (28.3%) | 459 (20.9%) |
| 75 Years and over | 597 (50.9%) | 595 (38.5%) |
Disability Class by Sex by Age in Mason County
Disability Class: Hearing Difficulty

| Age Bracket | Male | Female |
| Under 5 Years | 2 (0.3%) | 0 (0.0%) |
| 5 to 17 Years | 10 (0.4%) | 5 (0.2%) |
| 18 to 34 Years | 59 (2.2%) | 6 (0.2%) |
| 35 to 64 Years | 200 (3.7%) | 106 (2.0%) |
| 65 to 74 Years | 261 (12.0%) | 136 (6.2%) |
| 75 Years and over | 321 (27.4%) | 215 (13.9%) |
Disability Class: Vision Difficulty
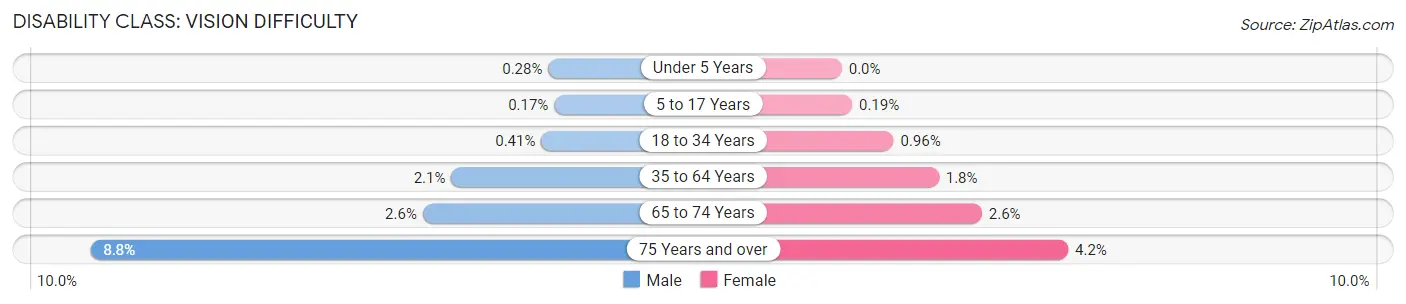
| Age Bracket | Male | Female |
| Under 5 Years | 2 (0.3%) | 0 (0.0%) |
| 5 to 17 Years | 4 (0.2%) | 4 (0.2%) |
| 18 to 34 Years | 11 (0.4%) | 24 (1.0%) |
| 35 to 64 Years | 113 (2.1%) | 97 (1.8%) |
| 65 to 74 Years | 57 (2.6%) | 57 (2.6%) |
| 75 Years and over | 103 (8.8%) | 65 (4.2%) |
Disability Class: Cognitive Difficulty

| Age Bracket | Male | Female |
| 5 to 17 Years | 125 (5.3%) | 60 (2.9%) |
| 18 to 34 Years | 182 (6.8%) | 220 (8.8%) |
| 35 to 64 Years | 244 (4.5%) | 390 (7.2%) |
| 65 to 74 Years | 197 (9.0%) | 108 (4.9%) |
| 75 Years and over | 164 (14.0%) | 187 (12.1%) |
Disability Class: Ambulatory Difficulty

| Age Bracket | Male | Female |
| 5 to 17 Years | 25 (1.1%) | 9 (0.4%) |
| 18 to 34 Years | 21 (0.8%) | 28 (1.1%) |
| 35 to 64 Years | 464 (8.6%) | 489 (9.0%) |
| 65 to 74 Years | 268 (12.3%) | 298 (13.6%) |
| 75 Years and over | 385 (32.8%) | 402 (26.0%) |
Disability Class: Self-Care Difficulty
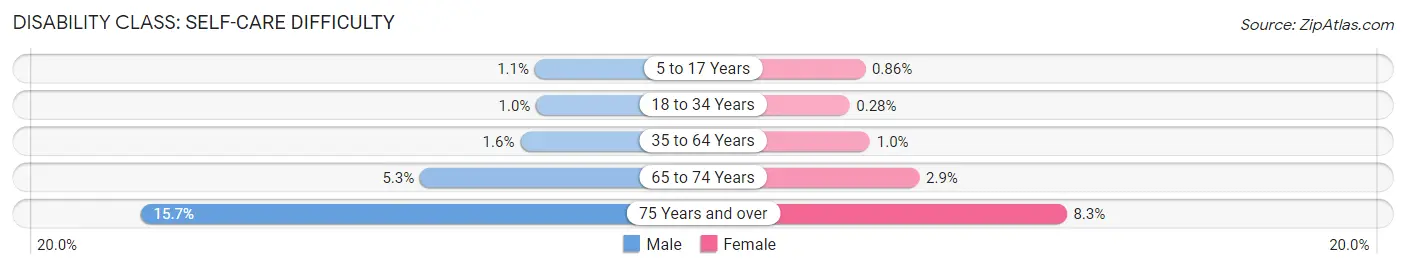
| Age Bracket | Male | Female |
| 5 to 17 Years | 25 (1.1%) | 18 (0.9%) |
| 18 to 34 Years | 27 (1.0%) | 7 (0.3%) |
| 35 to 64 Years | 87 (1.6%) | 56 (1.0%) |
| 65 to 74 Years | 116 (5.3%) | 63 (2.9%) |
| 75 Years and over | 184 (15.7%) | 129 (8.3%) |
Technology Access in Mason County
Computing Device Access in Mason County
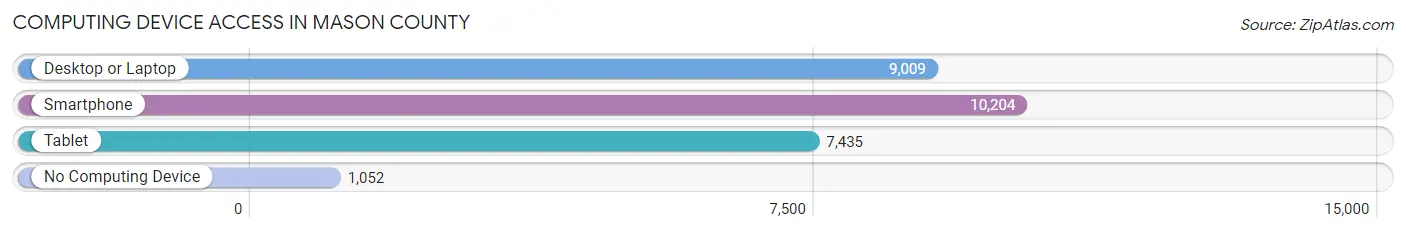
| Device Type | # Households | % Households |
| Desktop or Laptop | 9,009 | 73.3% |
| Smartphone | 10,204 | 83.0% |
| Tablet | 7,435 | 60.5% |
| No Computing Device | 1,052 | 8.6% |
| Total | 12,296 | 100.0% |
Internet Access in Mason County

| Internet Type | # Households | % Households |
| Dial-Up Internet | 39 | 0.3% |
| Broadband Home | 7,169 | 58.3% |
| Cellular Data Only | 1,652 | 13.4% |
| Satellite Internet | 1,454 | 11.8% |
| No Internet | 2,125 | 17.3% |
| Total | 12,296 | 100.0% |
Mason County Summary
Mason County is located in the western part of the Lower Peninsula of Michigan. It is bordered by Lake Michigan to the west, Manistee County to the north, Oceana County to the east, and Muskegon County to the south. The county seat is Ludington, which is also the largest city in the county. Mason County was established in 1855 and named after Stevens T. Mason, the first Governor of Michigan.
Geography
Mason County covers an area of 576 square miles and is located in the Northwestern Lower Peninsula of Michigan. The county is mostly rural, with a few small towns and villages scattered throughout. The terrain is mostly flat, with some rolling hills and small lakes. The highest point in the county is located in the northern part of the county, near the Manistee County border, and is 890 feet above sea level. The county is home to several state parks, including Ludington State Park, which is located on the shores of Lake Michigan.
The county is home to several rivers, including the Pere Marquette River, which flows through the county from north to south. The river is a popular destination for fishing, canoeing, and kayaking. The county is also home to several small lakes, including Hamlin Lake, which is located in the northern part of the county.
Economy
Mason County has a diverse economy, with a mix of manufacturing, agriculture, and tourism. The county is home to several manufacturing companies, including a paper mill, a steel mill, and a plastics plant. Agriculture is also an important part of the county’s economy, with dairy farming and fruit production being the main crops. Tourism is also an important part of the county’s economy, with Ludington State Park being a popular destination for visitors.
Demographics
As of the 2010 census, Mason County had a population of 28,705. The population is mostly white (94.3%), with small percentages of African American (2.2%), Native American (0.7%), Asian (0.5%), and Hispanic or Latino (1.3%) residents. The median household income in the county is $45,845, and the median home value is $133,400.
Mason County is home to several small towns and villages, including Ludington, which is the largest city in the county. Other towns and villages include Scottville, Custer, Free Soil, and Fountain. The county is also home to several unincorporated communities, including Amber, Branch, and Walhalla.
Mason County is a rural county with a diverse economy and a mix of cultures and backgrounds. The county is home to several state parks, rivers, and lakes, making it a popular destination for outdoor recreation. The county is also home to several small towns and villages, making it a great place to live and work.
Common Questions
What is the Total Population of Mason County?
Total Population of Mason County is 29,178.
What is the Total Male Population of Mason County?
Total Male Population of Mason County is 14,609.
What is the Total Female Population of Mason County?
Total Female Population of Mason County is 14,569.
What is the Ratio of Males per 100 Females in Mason County?
There are 100.27 Males per 100 Females in Mason County.
What is the Ratio of Females per 100 Males in Mason County?
There are 99.73 Females per 100 Males in Mason County.
What is the Median Population Age in Mason County?
Median Population Age in Mason County is 46.7 Years.
What is the Average Family Size in Mason County
Average Family Size in Mason County is 2.9 People.
What is the Average Household Size in Mason County
Average Household Size in Mason County is 2.3 People.
What is Per Capita Income in Mason County?
Per Capita income in Mason County is $34,386.
What is the Median Family Income in Mason County?
Median Family Income in Mason County is $76,568.
What is the Median Household income in Mason County?
Median Household Income in Mason County is $60,744.
What is Income or Wage Gap in Mason County?
Income or Wage Gap in Mason County is 31.8%.
Women in Mason County earn 68.2 cents for every dollar earned by a man.
What is Family Income Deficit in Mason County?
Family Income Deficit in Mason County is $10,804.
Families that are below poverty line in Mason County earn $10,804 less on average than the poverty threshold level.
What is Inequality or Gini Index in Mason County?
Inequality or Gini Index in Mason County is 0.44.
How Large is the Labor Force in Mason County?
There are 13,055 People in the Labor Forcein in Mason County.
What is the Percentage of People in the Labor Force in Mason County?
54.5% of People are in the Labor Force in Mason County.
What is the Unemployment Rate in Mason County?
Unemployment Rate in Mason County is 4.8%.