Marquette County, MI
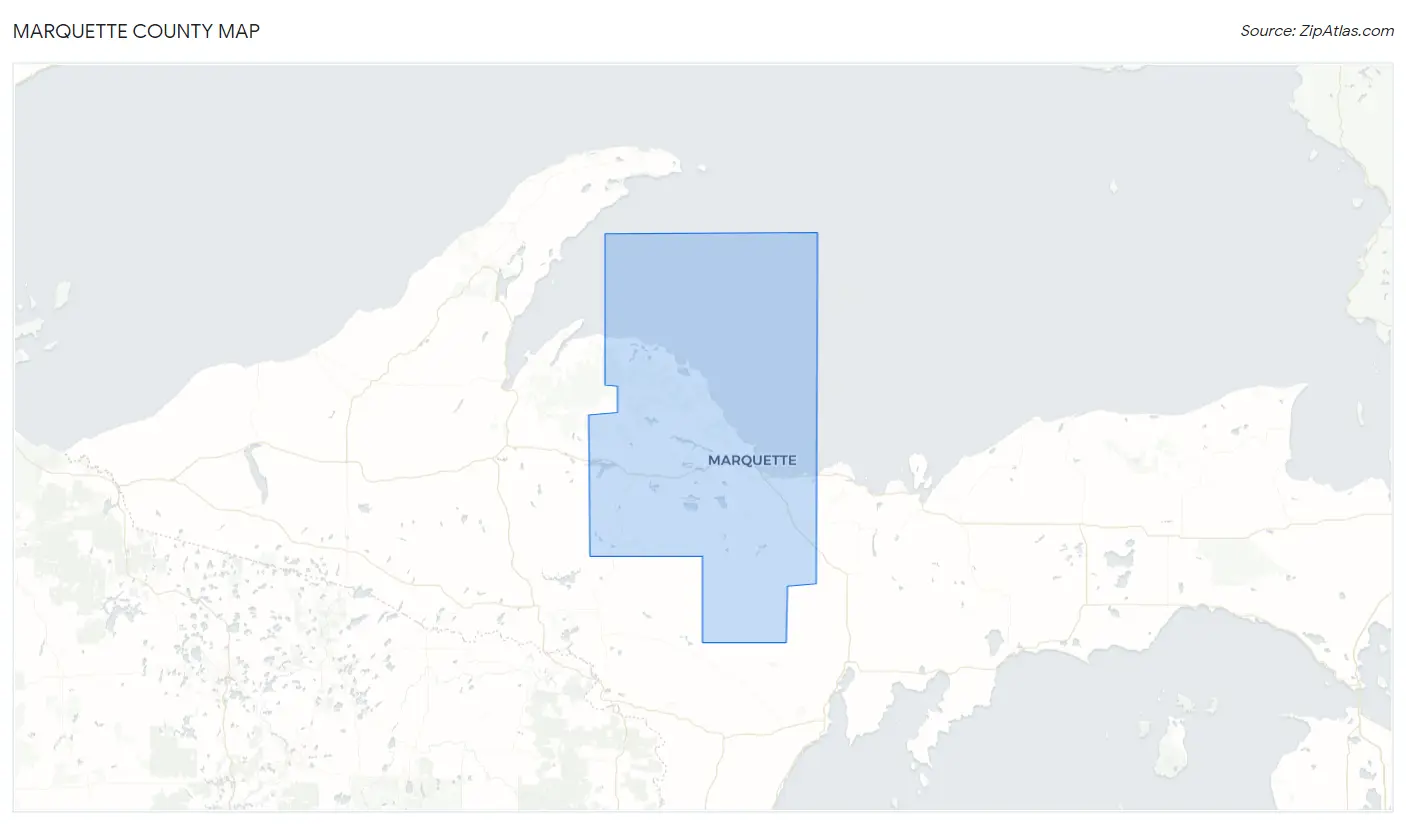
Marquette County Map
Marquette County Overview
66,376
TOTAL POPULATION
33,782
MALE POPULATION
32,594
FEMALE POPULATION
103.64
MALES / 100 FEMALES
96.48
FEMALES / 100 MALES
39.1
MEDIAN AGE
2.9
AVG FAMILY SIZE
2.3
AVG HOUSEHOLD SIZE
$32,711
PER CAPITA INCOME
$82,182
AVG FAMILY INCOME
$63,115
AVG HOUSEHOLD INCOME
40.1%
WAGE / INCOME GAP [ % ]
59.9¢/ $1
WAGE / INCOME GAP [ $ ]
$9,423
FAMILY INCOME DEFICIT
0.41
INEQUALITY / GINI INDEX
33,040
LABOR FORCE [ PEOPLE ]
59.2%
PERCENT IN LABOR FORCE
5.6%
UNEMPLOYMENT RATE
Marquette County Area Codes
Race in Marquette County
The most populous races in Marquette County are White / Caucasian (61,014 | 91.9%), Two or more Races (2,933 | 4.4%), and Hispanic or Latino (1,126 | 1.7%).
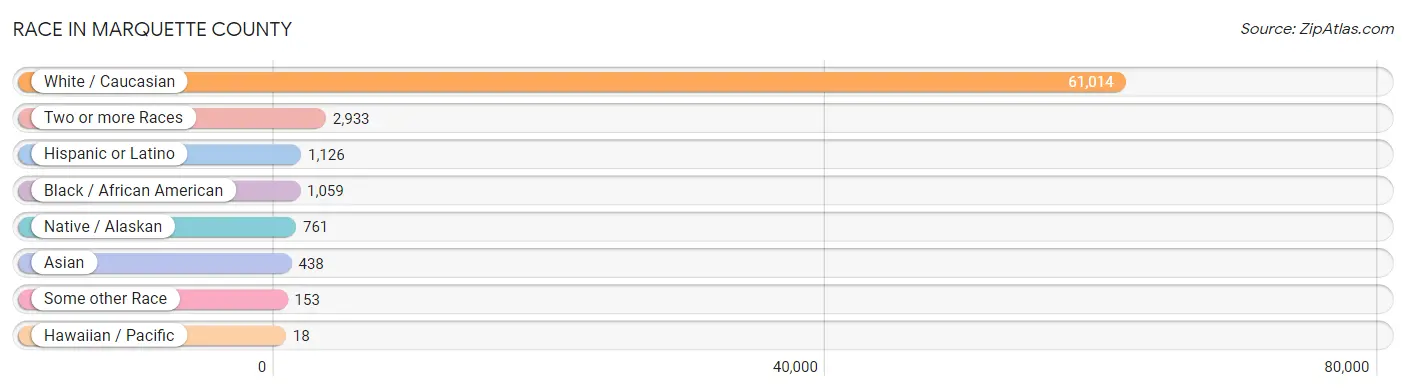
| Race | # Population | % Population |
| Asian | 438 | 0.7% |
| Black / African American | 1,059 | 1.6% |
| Hawaiian / Pacific | 18 | 0.0% |
| Hispanic or Latino | 1,126 | 1.7% |
| Native / Alaskan | 761 | 1.1% |
| White / Caucasian | 61,014 | 91.9% |
| Two or more Races | 2,933 | 4.4% |
| Some other Race | 153 | 0.2% |
| Total | 66,376 | 100.0% |
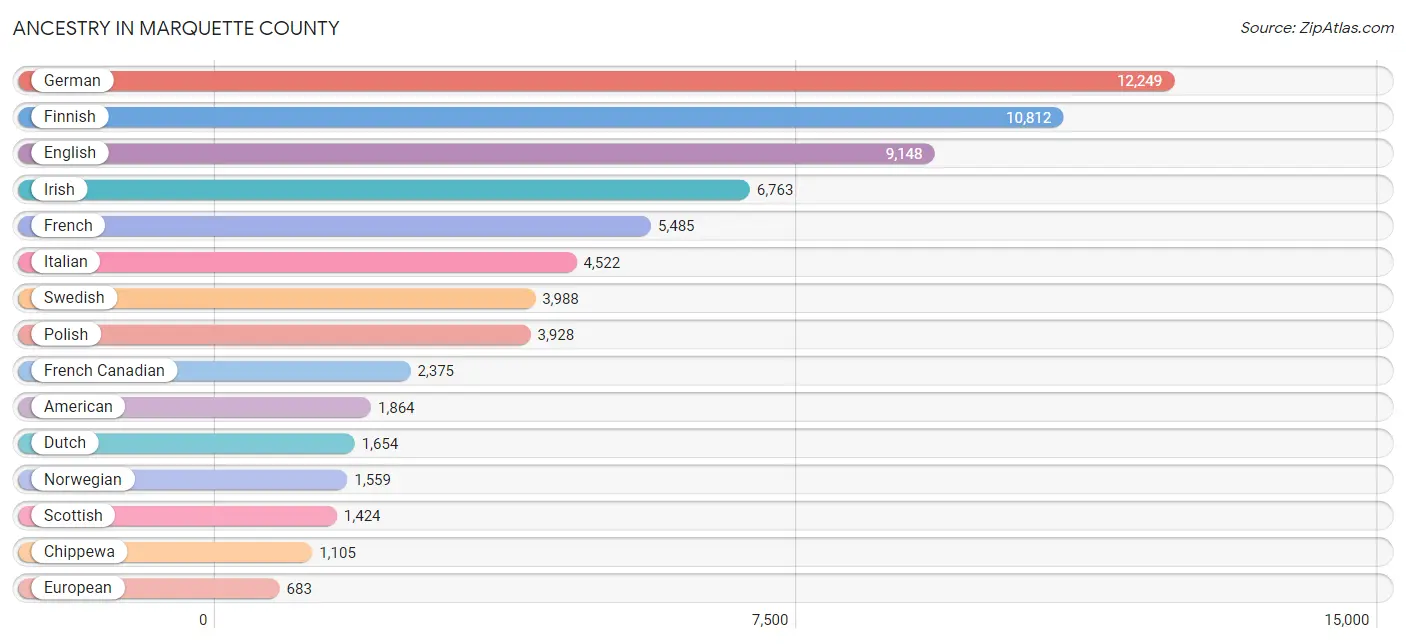
Ancestry in Marquette County
The most populous ancestries reported in Marquette County are German (12,249 | 18.4%), Finnish (10,812 | 16.3%), English (9,148 | 13.8%), Irish (6,763 | 10.2%), and French (5,485 | 8.3%), together accounting for 67.0% of all Marquette County residents.
| Ancestry | # Population | % Population |
| African | 71 | 0.1% |
| Albanian | 12 | 0.0% |
| American | 1,864 | 2.8% |
| Apache | 26 | 0.0% |
| Arab | 138 | 0.2% |
| Argentinean | 29 | 0.0% |
| Armenian | 33 | 0.1% |
| Assyrian / Chaldean / Syriac | 93 | 0.1% |
| Australian | 5 | 0.0% |
| Austrian | 217 | 0.3% |
| Belgian | 444 | 0.7% |
| Bhutanese | 96 | 0.1% |
| Blackfeet | 35 | 0.1% |
| Brazilian | 6 | 0.0% |
| British | 577 | 0.9% |
| Bulgarian | 33 | 0.1% |
| Burmese | 152 | 0.2% |
| Canadian | 50 | 0.1% |
| Central American | 136 | 0.2% |
| Central American Indian | 13 | 0.0% |
| Cherokee | 138 | 0.2% |
| Chickasaw | 20 | 0.0% |
| Chippewa | 1,105 | 1.7% |
| Choctaw | 2 | 0.0% |
| Colombian | 9 | 0.0% |
| Croatian | 225 | 0.3% |
| Crow | 2 | 0.0% |
| Cuban | 19 | 0.0% |
| Czech | 278 | 0.4% |
| Czechoslovakian | 80 | 0.1% |
| Danish | 339 | 0.5% |
| Dominican | 20 | 0.0% |
| Dutch | 1,654 | 2.5% |
| Eastern European | 113 | 0.2% |
| English | 9,148 | 13.8% |
| Estonian | 2 | 0.0% |
| Ethiopian | 6 | 0.0% |
| European | 683 | 1.0% |
| Fijian | 5 | 0.0% |
| Finnish | 10,812 | 16.3% |
| French | 5,485 | 8.3% |
| French American Indian | 27 | 0.0% |
| French Canadian | 2,375 | 3.6% |
| German | 12,249 | 18.4% |
| Greek | 286 | 0.4% |
| Guamanian / Chamorro | 3 | 0.0% |
| Guatemalan | 15 | 0.0% |
| Hungarian | 334 | 0.5% |
| Indian (Asian) | 177 | 0.3% |
| Iranian | 8 | 0.0% |
| Iraqi | 8 | 0.0% |
| Irish | 6,763 | 10.2% |
| Iroquois | 5 | 0.0% |
| Italian | 4,522 | 6.8% |
| Jamaican | 12 | 0.0% |
| Korean | 260 | 0.4% |
| Laotian | 36 | 0.1% |
| Latvian | 36 | 0.1% |
| Lebanese | 44 | 0.1% |
| Lithuanian | 130 | 0.2% |
| Luxembourger | 5 | 0.0% |
| Macedonian | 162 | 0.2% |
| Malaysian | 9 | 0.0% |
| Maltese | 3 | 0.0% |
| Menominee | 30 | 0.1% |
| Mexican | 657 | 1.0% |
| Mexican American Indian | 7 | 0.0% |
| Moroccan | 10 | 0.0% |
| Native Hawaiian | 26 | 0.0% |
| Nigerian | 1 | 0.0% |
| Northern European | 125 | 0.2% |
| Norwegian | 1,559 | 2.4% |
| Ottawa | 79 | 0.1% |
| Pakistani | 26 | 0.0% |
| Panamanian | 121 | 0.2% |
| Pennsylvania German | 4 | 0.0% |
| Peruvian | 3 | 0.0% |
| Polish | 3,928 | 5.9% |
| Portuguese | 80 | 0.1% |
| Potawatomi | 59 | 0.1% |
| Puerto Rican | 95 | 0.1% |
| Romanian | 46 | 0.1% |
| Russian | 240 | 0.4% |
| Samoan | 10 | 0.0% |
| Scandinavian | 616 | 0.9% |
| Scotch-Irish | 476 | 0.7% |
| Scottish | 1,424 | 2.1% |
| Serbian | 8 | 0.0% |
| Sioux | 4 | 0.0% |
| Slavic | 9 | 0.0% |
| Slovak | 154 | 0.2% |
| Slovene | 40 | 0.1% |
| South African | 10 | 0.0% |
| South American | 59 | 0.1% |
| Spaniard | 10 | 0.0% |
| Spanish | 86 | 0.1% |
| Spanish American | 11 | 0.0% |
| Sri Lankan | 53 | 0.1% |
| Subsaharan African | 102 | 0.2% |
| Swedish | 3,988 | 6.0% |
| Swiss | 125 | 0.2% |
| Thai | 146 | 0.2% |
| Turkish | 4 | 0.0% |
| Ukrainian | 309 | 0.5% |
| Uruguayan | 7 | 0.0% |
| Venezuelan | 11 | 0.0% |
| Welsh | 190 | 0.3% |
| Yaqui | 7 | 0.0% |
| Yugoslavian | 48 | 0.1% |
| Zimbabwean | 15 | 0.0% | View All 110 Rows |
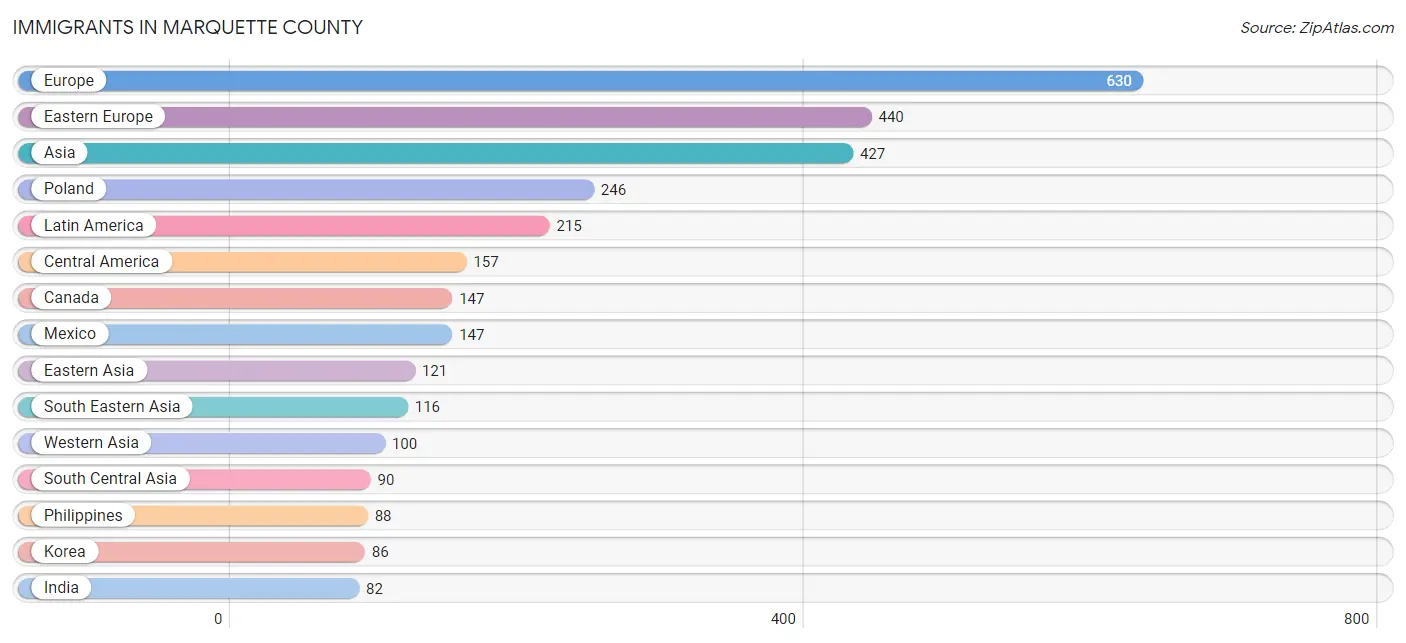
Immigrants in Marquette County
The most numerous immigrant groups reported in Marquette County came from Europe (630 | 0.9%), Eastern Europe (440 | 0.7%), Asia (427 | 0.6%), Poland (246 | 0.4%), and Latin America (215 | 0.3%), together accounting for 2.9% of all Marquette County residents.
| Immigration Origin | # Population | % Population |
| Africa | 48 | 0.1% |
| Albania | 10 | 0.0% |
| Argentina | 29 | 0.0% |
| Asia | 427 | 0.6% |
| Australia | 1 | 0.0% |
| Austria | 15 | 0.0% |
| Canada | 147 | 0.2% |
| Caribbean | 9 | 0.0% |
| Central America | 157 | 0.2% |
| China | 28 | 0.0% |
| Cuba | 9 | 0.0% |
| Eastern Africa | 10 | 0.0% |
| Eastern Asia | 121 | 0.2% |
| Eastern Europe | 440 | 0.7% |
| El Salvador | 10 | 0.0% |
| England | 20 | 0.0% |
| Ethiopia | 6 | 0.0% |
| Europe | 630 | 0.9% |
| Germany | 63 | 0.1% |
| Greece | 15 | 0.0% |
| Hungary | 7 | 0.0% |
| India | 82 | 0.1% |
| Iran | 8 | 0.0% |
| Iraq | 57 | 0.1% |
| Israel | 8 | 0.0% |
| Italy | 22 | 0.0% |
| Japan | 7 | 0.0% |
| Kenya | 4 | 0.0% |
| Korea | 86 | 0.1% |
| Laos | 2 | 0.0% |
| Latin America | 215 | 0.3% |
| Mexico | 147 | 0.2% |
| North Macedonia | 65 | 0.1% |
| Northern Europe | 56 | 0.1% |
| Oceania | 10 | 0.0% |
| Peru | 2 | 0.0% |
| Philippines | 88 | 0.1% |
| Poland | 246 | 0.4% |
| Russia | 58 | 0.1% |
| Scotland | 3 | 0.0% |
| South Africa | 38 | 0.1% |
| South America | 49 | 0.1% |
| South Central Asia | 90 | 0.1% |
| South Eastern Asia | 116 | 0.2% |
| Southern Europe | 56 | 0.1% |
| Spain | 19 | 0.0% |
| Syria | 13 | 0.0% |
| Taiwan | 14 | 0.0% |
| Thailand | 26 | 0.0% |
| Turkey | 8 | 0.0% |
| Ukraine | 54 | 0.1% |
| Uruguay | 7 | 0.0% |
| Venezuela | 11 | 0.0% |
| Western Asia | 100 | 0.2% |
| Western Europe | 78 | 0.1% |
| Yemen | 14 | 0.0% | View All 56 Rows |
Sex and Age in Marquette County
Sex and Age in Marquette County
The most populous age groups in Marquette County are 20 to 24 Years (3,707 | 11.0%) for men and 20 to 24 Years (3,736 | 11.5%) for women.
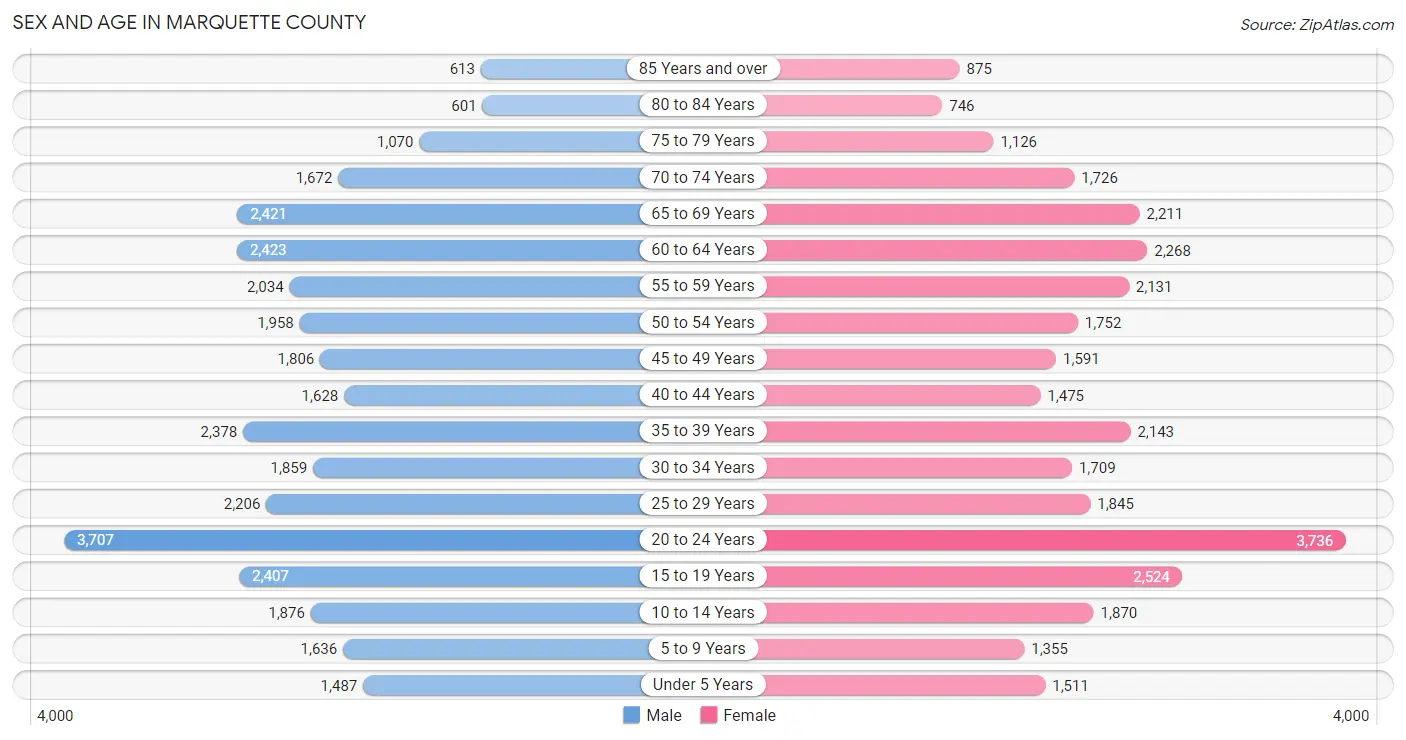
| Age Bracket | Male | Female |
| Under 5 Years | 1,487 (4.4%) | 1,511 (4.6%) |
| 5 to 9 Years | 1,636 (4.8%) | 1,355 (4.2%) |
| 10 to 14 Years | 1,876 (5.6%) | 1,870 (5.7%) |
| 15 to 19 Years | 2,407 (7.1%) | 2,524 (7.7%) |
| 20 to 24 Years | 3,707 (11.0%) | 3,736 (11.5%) |
| 25 to 29 Years | 2,206 (6.5%) | 1,845 (5.7%) |
| 30 to 34 Years | 1,859 (5.5%) | 1,709 (5.2%) |
| 35 to 39 Years | 2,378 (7.0%) | 2,143 (6.6%) |
| 40 to 44 Years | 1,628 (4.8%) | 1,475 (4.5%) |
| 45 to 49 Years | 1,806 (5.3%) | 1,591 (4.9%) |
| 50 to 54 Years | 1,958 (5.8%) | 1,752 (5.4%) |
| 55 to 59 Years | 2,034 (6.0%) | 2,131 (6.5%) |
| 60 to 64 Years | 2,423 (7.2%) | 2,268 (7.0%) |
| 65 to 69 Years | 2,421 (7.2%) | 2,211 (6.8%) |
| 70 to 74 Years | 1,672 (5.0%) | 1,726 (5.3%) |
| 75 to 79 Years | 1,070 (3.2%) | 1,126 (3.5%) |
| 80 to 84 Years | 601 (1.8%) | 746 (2.3%) |
| 85 Years and over | 613 (1.8%) | 875 (2.7%) |
| Total | 33,782 (100.0%) | 32,594 (100.0%) |
Families and Households in Marquette County
Median Family Size in Marquette County
The median family size in Marquette County is 2.87 persons per family, with single female/mother families (1,858 | 11.4%) accounting for the largest median family size of 2.99 persons per family. On the other hand, single male/father families (1,288 | 7.9%) represent the smallest median family size with 2.62 persons per family.
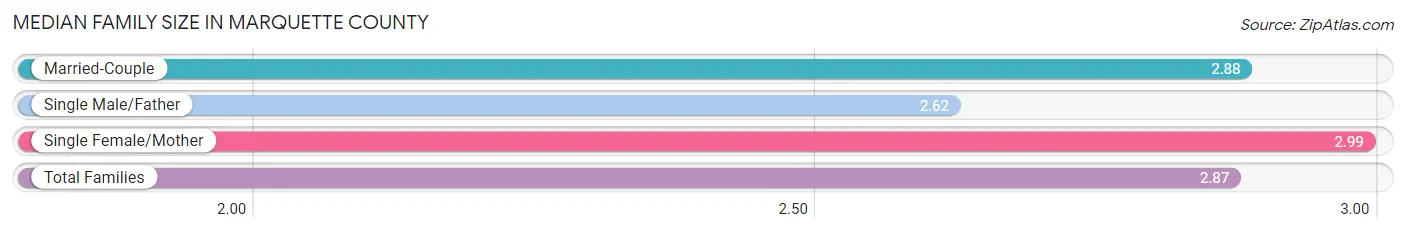
| Family Type | # Families | Family Size |
| Married-Couple | 13,123 (80.7%) | 2.88 |
| Single Male/Father | 1,288 (7.9%) | 2.62 |
| Single Female/Mother | 1,858 (11.4%) | 2.99 |
| Total Families | 16,269 (100.0%) | 2.87 |
Median Household Size in Marquette County
The median household size in Marquette County is 2.30 persons per household, with single female/mother households (1,858 | 6.8%) accounting for the largest median household size of 3.3 persons per household. non-family households (11,076 | 40.5%) represent the smallest median household size with 1.33 persons per household.
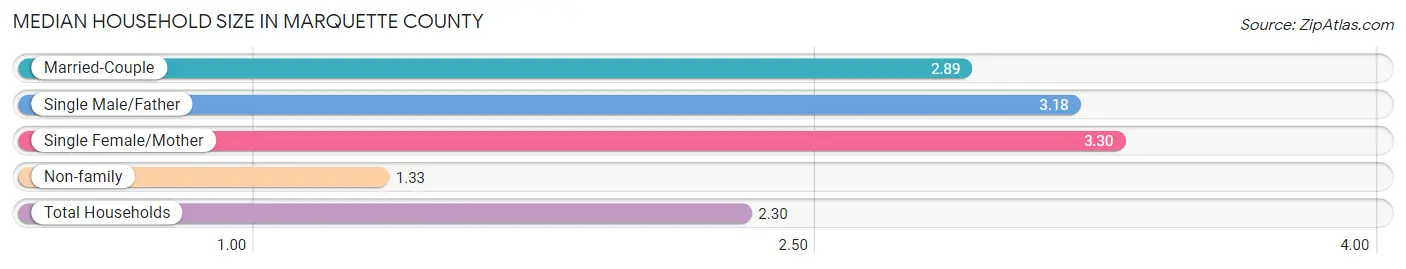
| Household Type | # Households | Household Size |
| Married-Couple | 13,123 (48.0%) | 2.89 |
| Single Male/Father | 1,288 (4.7%) | 3.18 |
| Single Female/Mother | 1,858 (6.8%) | 3.30 |
| Non-family | 11,076 (40.5%) | 1.33 |
| Total Households | 27,345 (100.0%) | 2.30 |
Household Size by Marriage Status in Marquette County
Out of a total of 27,345 households in Marquette County, 16,269 (59.5%) are family households, while 11,076 (40.5%) are nonfamily households. The most numerous type of family households are 2-person households, comprising 8,867, and the most common type of nonfamily households are 1-person households, comprising 8,459.
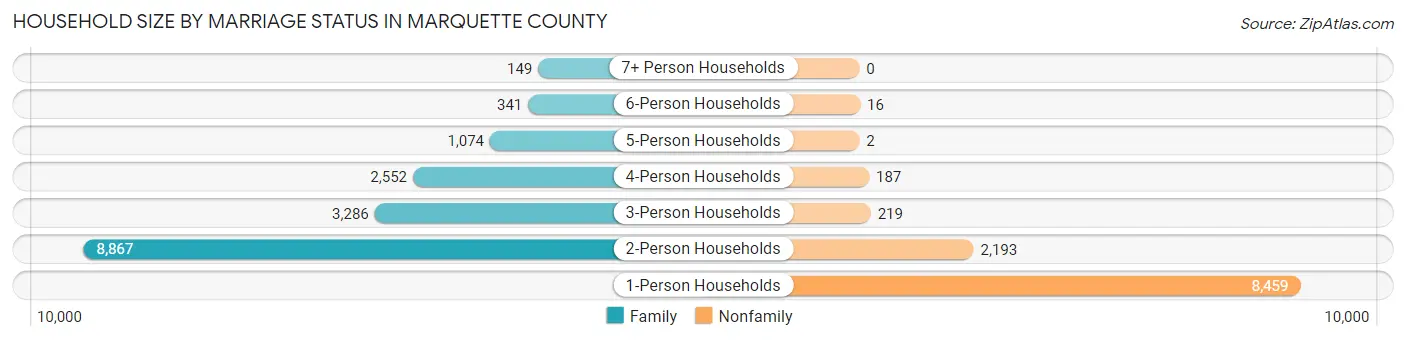
| Household Size | Family Households | Nonfamily Households |
| 1-Person Households | - | 8,459 (30.9%) |
| 2-Person Households | 8,867 (32.4%) | 2,193 (8.0%) |
| 3-Person Households | 3,286 (12.0%) | 219 (0.8%) |
| 4-Person Households | 2,552 (9.3%) | 187 (0.7%) |
| 5-Person Households | 1,074 (3.9%) | 2 (0.0%) |
| 6-Person Households | 341 (1.3%) | 16 (0.1%) |
| 7+ Person Households | 149 (0.5%) | 0 (0.0%) |
| Total | 16,269 (59.5%) | 11,076 (40.5%) |
Female Fertility in Marquette County
Fertility by Age in Marquette County
Average fertility rate in Marquette County is 32.0 births per 1,000 women. Women in the age bracket of 20 to 34 years have the highest fertility rate with 48.0 births per 1,000 women. Women in the age bracket of 20 to 34 years acount for 71.3% of all women with births.
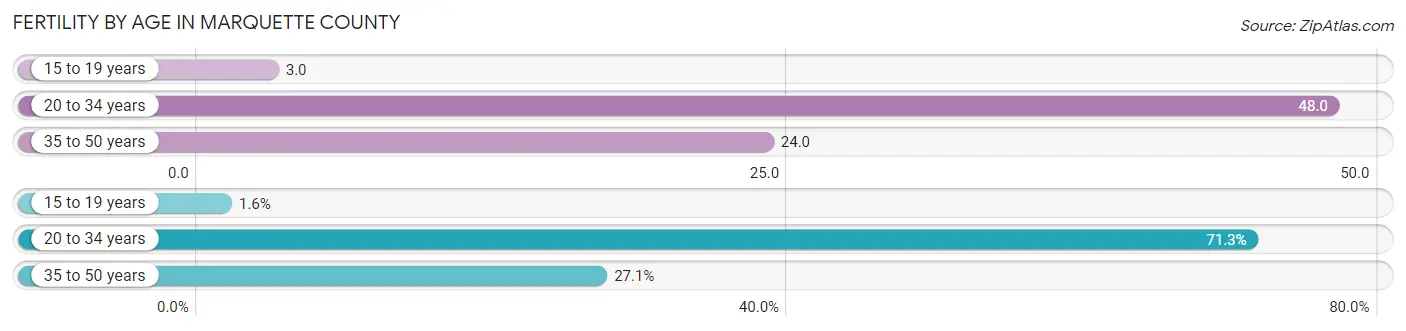
| Age Bracket | Women with Births | Births / 1,000 Women |
| 15 to 19 years | 8 (1.6%) | 3.0 |
| 20 to 34 years | 350 (71.3%) | 48.0 |
| 35 to 50 years | 133 (27.1%) | 24.0 |
| Total | 491 (100.0%) | 32.0 |
Fertility by Age by Marriage Status in Marquette County
89.8% of women with births (491) in Marquette County are married. The highest percentage of unmarried women with births falls into 15 to 19 years age bracket with 100.0% of them unmarried at the time of birth, while the lowest percentage of unmarried women with births belong to 35 to 50 years age bracket with 2.3% of them unmarried.
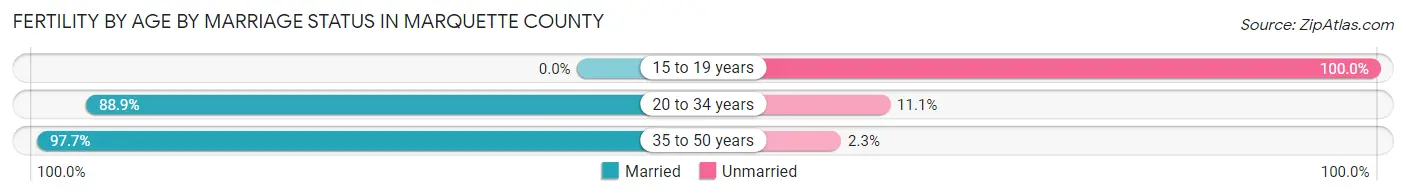
| Age Bracket | Married | Unmarried |
| 15 to 19 years | 0 (0.0%) | 8 (100.0%) |
| 20 to 34 years | 311 (88.9%) | 39 (11.1%) |
| 35 to 50 years | 130 (97.7%) | 3 (2.3%) |
| Total | 441 (89.8%) | 50 (10.2%) |
Fertility by Education in Marquette County
Average fertility rate in Marquette County is 32.0 births per 1,000 women. Women with the education attainment of graduate degree have the highest fertility rate of 46.0 births per 1,000 women, while women with the education attainment of less than high school have the lowest fertility at 18.0 births per 1,000 women. Women with the education attainment of college or associate's degree represent 33.4% of all women with births.
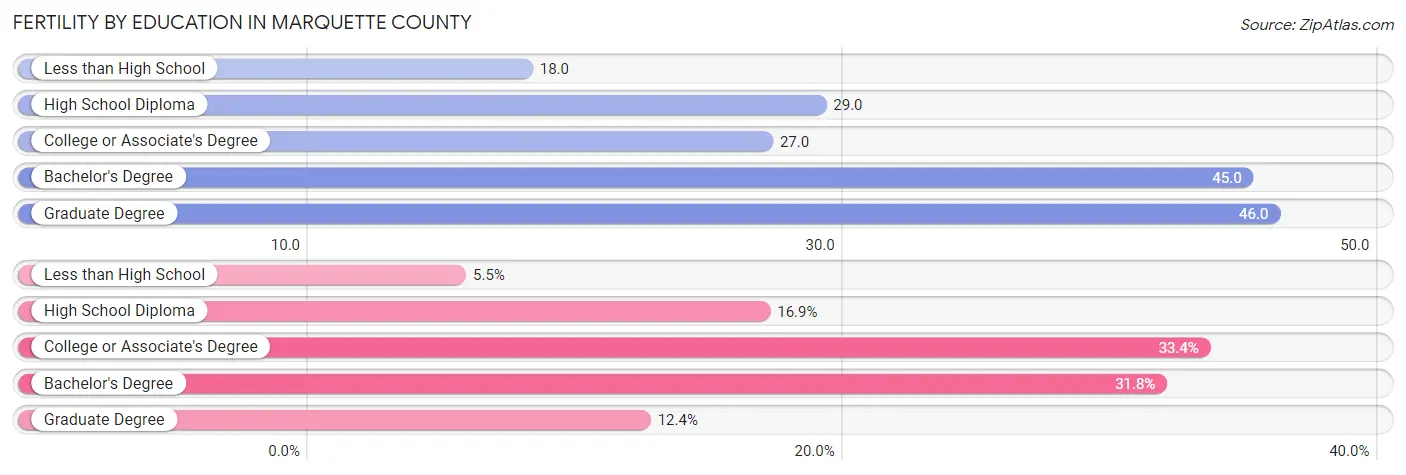
| Educational Attainment | Women with Births | Births / 1,000 Women |
| Less than High School | 27 (5.5%) | 18.0 |
| High School Diploma | 83 (16.9%) | 29.0 |
| College or Associate's Degree | 164 (33.4%) | 27.0 |
| Bachelor's Degree | 156 (31.8%) | 45.0 |
| Graduate Degree | 61 (12.4%) | 46.0 |
| Total | 491 (100.0%) | 32.0 |
Fertility by Education by Marriage Status in Marquette County
10.2% of women with births in Marquette County are unmarried. Women with the educational attainment of bachelor's degree are most likely to be married with 100.0% of them married at childbirth, while women with the educational attainment of less than high school are least likely to be married with 33.3% of them unmarried at childbirth.
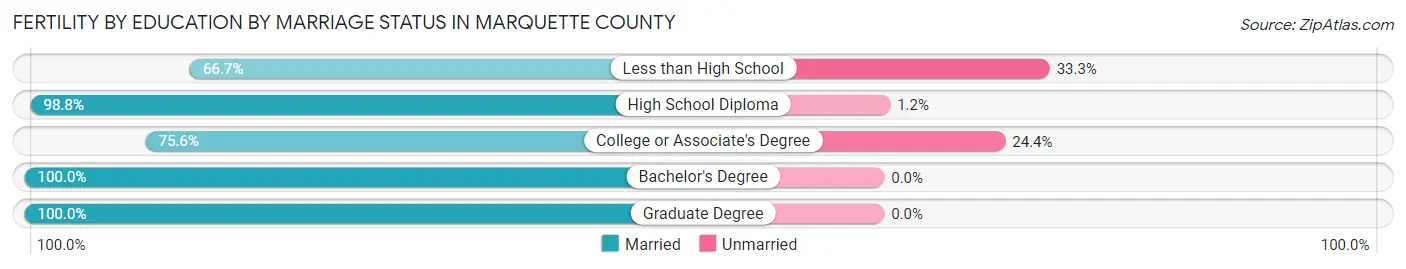
| Educational Attainment | Married | Unmarried |
| Less than High School | 18 (66.7%) | 9 (33.3%) |
| High School Diploma | 82 (98.8%) | 1 (1.2%) |
| College or Associate's Degree | 124 (75.6%) | 40 (24.4%) |
| Bachelor's Degree | 156 (100.0%) | 0 (0.0%) |
| Graduate Degree | 61 (100.0%) | 0 (0.0%) |
| Total | 441 (89.8%) | 50 (10.2%) |
Income in Marquette County
Income Overview in Marquette County
Per Capita Income in Marquette County is $32,711, while median incomes of families and households are $82,182 and $63,115 respectively.
| Characteristic | Number | Measure |
| Per Capita Income | 66,376 | $32,711 |
| Median Family Income | 16,269 | $82,182 |
| Mean Family Income | 16,269 | $96,133 |
| Median Household Income | 27,345 | $63,115 |
| Mean Household Income | 27,345 | $77,317 |
| Income Deficit | 16,269 | $9,423 |
| Wage / Income Gap (%) | 66,376 | 40.10% |
| Wage / Income Gap ($) | 66,376 | 59.90¢ per $1 |
| Gini / Inequality Index | 66,376 | 0.41 |
Earnings by Sex in Marquette County
Average Earnings in Marquette County are $29,948, $38,881 for men and $23,291 for women, a difference of 40.1%.
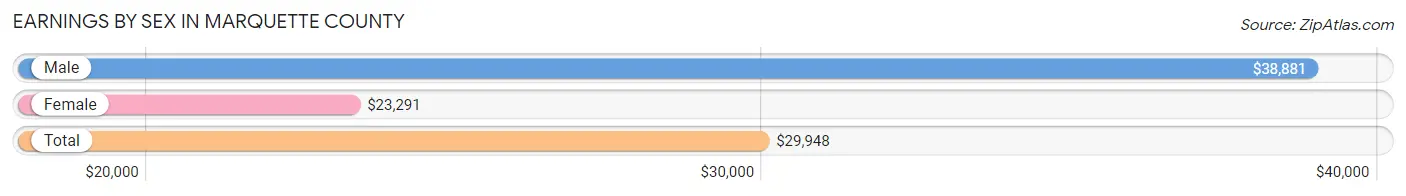
| Sex | Number | Average Earnings |
| Male | 18,471 (51.9%) | $38,881 |
| Female | 17,128 (48.1%) | $23,291 |
| Total | 35,599 (100.0%) | $29,948 |
Earnings by Sex by Income Bracket in Marquette County
The most common earnings brackets in Marquette County are $100,000+ for men (1,993 | 10.8%) and $5,000 to $7,499 for women (1,268 | 7.4%).
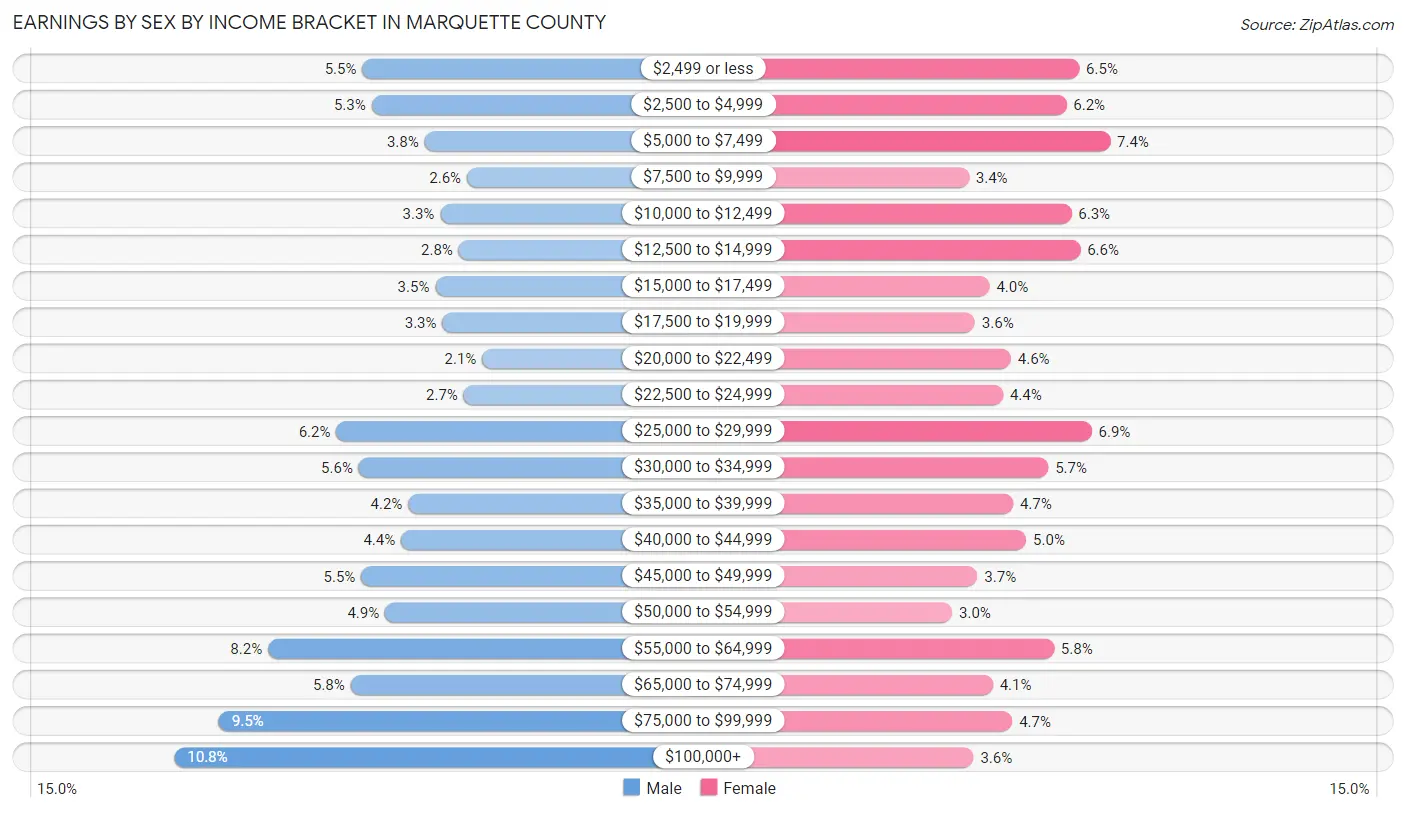
| Income | Male | Female |
| $2,499 or less | 1,018 (5.5%) | 1,118 (6.5%) |
| $2,500 to $4,999 | 970 (5.2%) | 1,057 (6.2%) |
| $5,000 to $7,499 | 695 (3.8%) | 1,268 (7.4%) |
| $7,500 to $9,999 | 475 (2.6%) | 587 (3.4%) |
| $10,000 to $12,499 | 614 (3.3%) | 1,080 (6.3%) |
| $12,500 to $14,999 | 518 (2.8%) | 1,123 (6.6%) |
| $15,000 to $17,499 | 640 (3.5%) | 687 (4.0%) |
| $17,500 to $19,999 | 602 (3.3%) | 616 (3.6%) |
| $20,000 to $22,499 | 396 (2.1%) | 790 (4.6%) |
| $22,500 to $24,999 | 492 (2.7%) | 752 (4.4%) |
| $25,000 to $29,999 | 1,153 (6.2%) | 1,178 (6.9%) |
| $30,000 to $34,999 | 1,036 (5.6%) | 969 (5.7%) |
| $35,000 to $39,999 | 780 (4.2%) | 800 (4.7%) |
| $40,000 to $44,999 | 816 (4.4%) | 863 (5.0%) |
| $45,000 to $49,999 | 1,023 (5.5%) | 628 (3.7%) |
| $50,000 to $54,999 | 900 (4.9%) | 507 (3.0%) |
| $55,000 to $64,999 | 1,508 (8.2%) | 997 (5.8%) |
| $65,000 to $74,999 | 1,079 (5.8%) | 703 (4.1%) |
| $75,000 to $99,999 | 1,763 (9.5%) | 796 (4.6%) |
| $100,000+ | 1,993 (10.8%) | 609 (3.6%) |
| Total | 18,471 (100.0%) | 17,128 (100.0%) |
Earnings by Sex by Educational Attainment in Marquette County
Average earnings in Marquette County are $47,837 for men and $32,208 for women, a difference of 32.7%. Men with an educational attainment of graduate degree enjoy the highest average annual earnings of $81,607, while those with less than high school education earn the least with $33,750. Women with an educational attainment of graduate degree earn the most with the average annual earnings of $59,222, while those with less than high school education have the smallest earnings of $19,250.
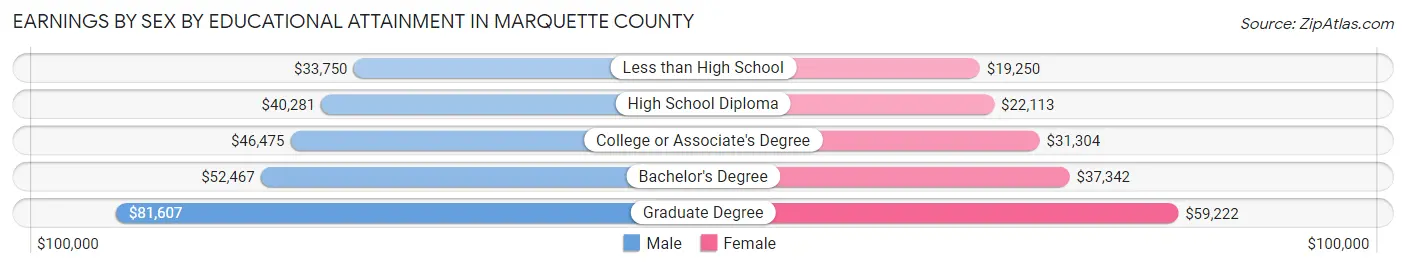
| Educational Attainment | Male Income | Female Income |
| Less than High School | $33,750 | $19,250 |
| High School Diploma | $40,281 | $22,113 |
| College or Associate's Degree | $46,475 | $31,304 |
| Bachelor's Degree | $52,467 | $37,342 |
| Graduate Degree | $81,607 | $59,222 |
| Total | $47,837 | $32,208 |
Family Income in Marquette County
Family Income Brackets in Marquette County
According to the Marquette County family income data, there are 3,807 families falling into the $100,000 to $149,999 income range, which is the most common income bracket and makes up 23.4% of all families. Conversely, the $10,000 to $14,999 income bracket is the least frequent group with only 228 families (1.4%) belonging to this category.
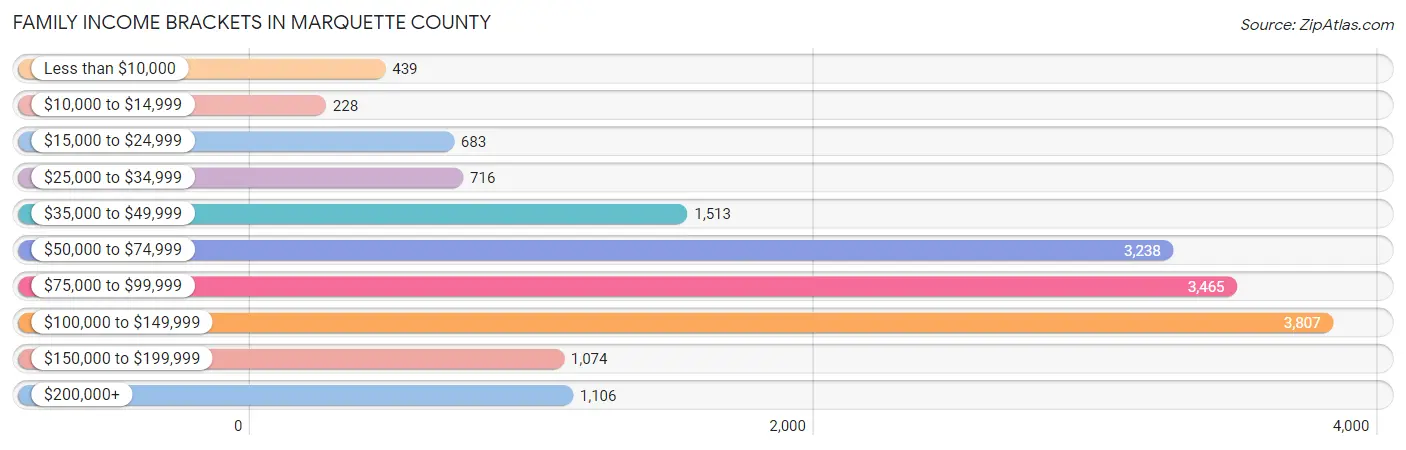
| Income Bracket | # Families | % Families |
| Less than $10,000 | 439 | 2.7% |
| $10,000 to $14,999 | 228 | 1.4% |
| $15,000 to $24,999 | 683 | 4.2% |
| $25,000 to $34,999 | 716 | 4.4% |
| $35,000 to $49,999 | 1,513 | 9.3% |
| $50,000 to $74,999 | 3,238 | 19.9% |
| $75,000 to $99,999 | 3,465 | 21.3% |
| $100,000 to $149,999 | 3,807 | 23.4% |
| $150,000 to $199,999 | 1,074 | 6.6% |
| $200,000+ | 1,106 | 6.8% |
Family Income by Famaliy Size in Marquette County
7+ person families (149 | 0.9%) account for the highest median family income in Marquette County with $134,750 per family, while 2-person families (9,427 | 57.9%) have the highest median income of $38,372 per family member.
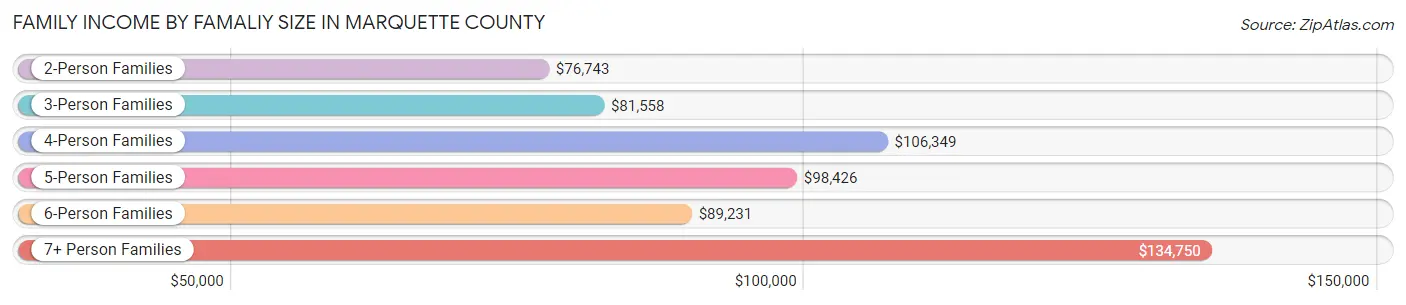
| Income Bracket | # Families | Median Income |
| 2-Person Families | 9,427 (57.9%) | $76,743 |
| 3-Person Families | 3,190 (19.6%) | $81,558 |
| 4-Person Families | 2,293 (14.1%) | $106,349 |
| 5-Person Families | 918 (5.6%) | $98,426 |
| 6-Person Families | 292 (1.8%) | $89,231 |
| 7+ Person Families | 149 (0.9%) | $134,750 |
| Total | 16,269 (100.0%) | $82,182 |
Family Income by Number of Earners in Marquette County
The median family income in Marquette County is $82,182, with families comprising 3+ earners (1,292) having the highest median family income of $123,788, while families with 1 earner (4,539) have the lowest median family income of $65,399, accounting for 7.9% and 27.9% of families, respectively.
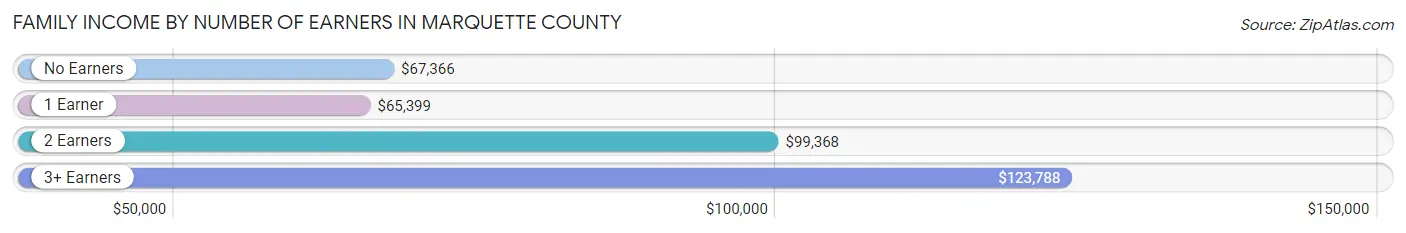
| Number of Earners | # Families | Median Income |
| No Earners | 3,847 (23.6%) | $67,366 |
| 1 Earner | 4,539 (27.9%) | $65,399 |
| 2 Earners | 6,591 (40.5%) | $99,368 |
| 3+ Earners | 1,292 (7.9%) | $123,788 |
| Total | 16,269 (100.0%) | $82,182 |
Household Income in Marquette County
Household Income Brackets in Marquette County
With 5,223 households falling in the category, the $50,000 to $74,999 income range is the most frequent in Marquette County, accounting for 19.1% of all households. In contrast, only 1,094 households (4.0%) fall into the $10,000 to $14,999 income bracket, making it the least populous group.
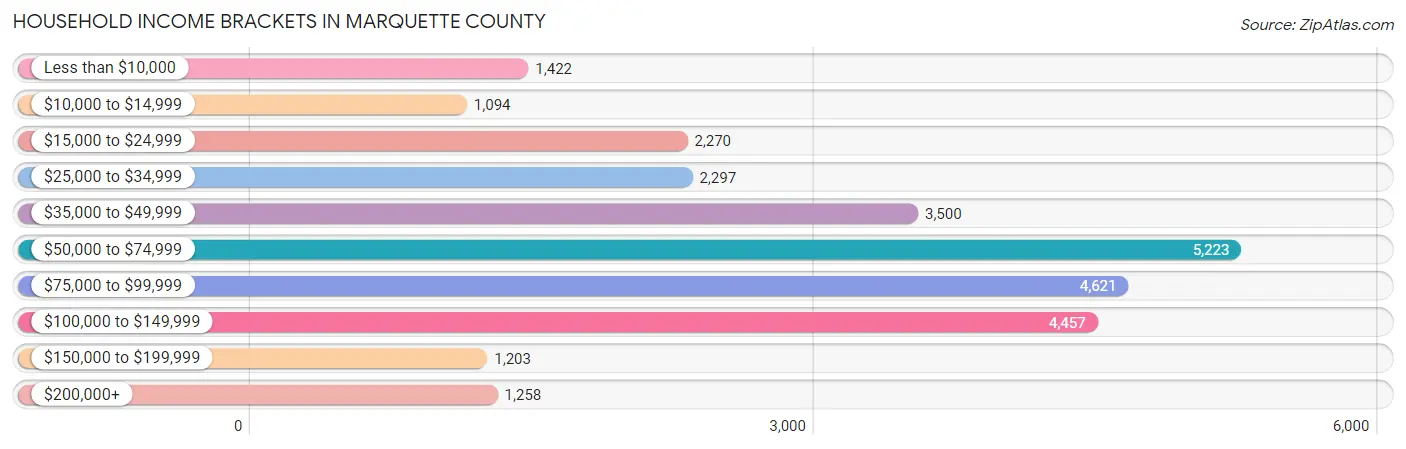
| Income Bracket | # Households | % Households |
| Less than $10,000 | 1,422 | 5.2% |
| $10,000 to $14,999 | 1,094 | 4.0% |
| $15,000 to $24,999 | 2,270 | 8.3% |
| $25,000 to $34,999 | 2,297 | 8.4% |
| $35,000 to $49,999 | 3,500 | 12.8% |
| $50,000 to $74,999 | 5,223 | 19.1% |
| $75,000 to $99,999 | 4,621 | 16.9% |
| $100,000 to $149,999 | 4,457 | 16.3% |
| $150,000 to $199,999 | 1,203 | 4.4% |
| $200,000+ | 1,258 | 4.6% |
Household Income by Householder Age in Marquette County
The median household income in Marquette County is $63,115, with the highest median household income of $76,865 found in the 25 to 44 years age bracket for the primary householder. A total of 7,568 households (27.7%) fall into this category. Meanwhile, the 15 to 24 years age bracket for the primary householder has the lowest median household income of $32,398, with 2,567 households (9.4%) in this group.
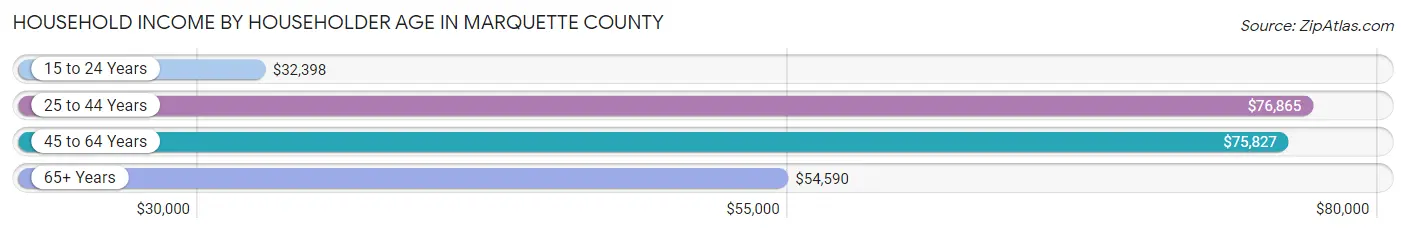
| Income Bracket | # Households | Median Income |
| 15 to 24 Years | 2,567 (9.4%) | $32,398 |
| 25 to 44 Years | 7,568 (27.7%) | $76,865 |
| 45 to 64 Years | 8,856 (32.4%) | $75,827 |
| 65+ Years | 8,354 (30.5%) | $54,590 |
| Total | 27,345 (100.0%) | $63,115 |
Poverty in Marquette County
Income Below Poverty by Sex and Age in Marquette County
With 11.9% poverty level for males and 15.2% for females among the residents of Marquette County, 18 to 24 year old males and 18 to 24 year old females are the most vulnerable to poverty, with 1,246 males (29.9%) and 1,732 females (38.5%) in their respective age groups living below the poverty level.
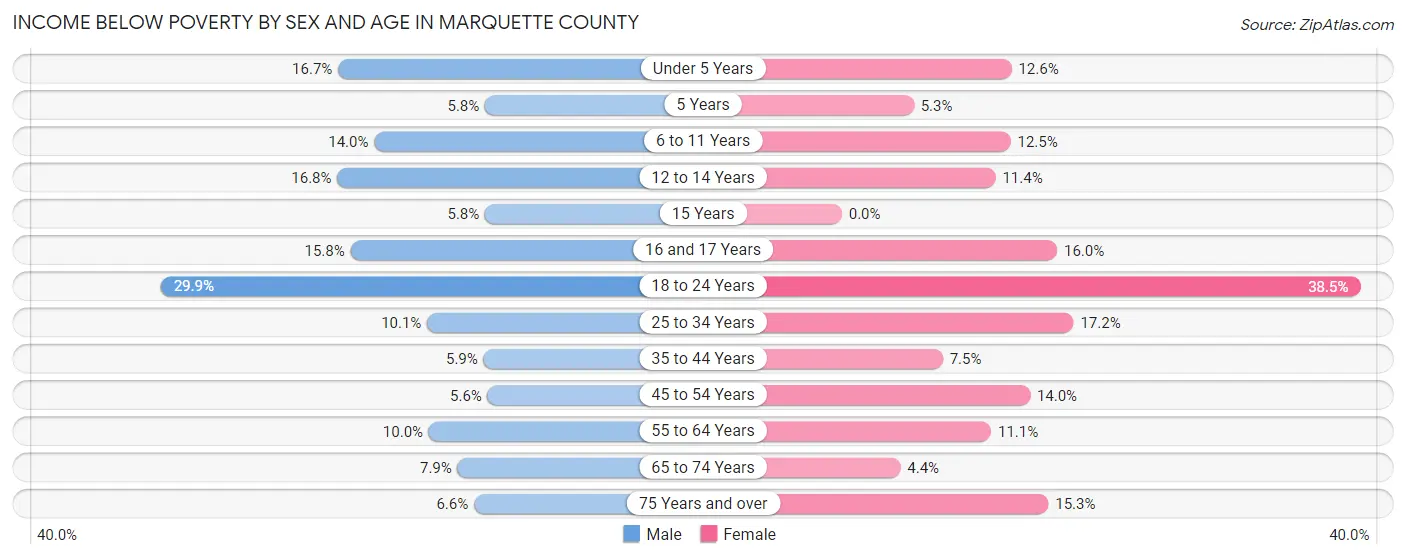
| Age Bracket | Male | Female |
| Under 5 Years | 247 (16.7%) | 189 (12.6%) |
| 5 Years | 20 (5.8%) | 14 (5.3%) |
| 6 to 11 Years | 300 (14.0%) | 233 (12.5%) |
| 12 to 14 Years | 149 (16.8%) | 116 (11.4%) |
| 15 Years | 28 (5.8%) | 0 (0.0%) |
| 16 and 17 Years | 85 (15.8%) | 101 (16.0%) |
| 18 to 24 Years | 1,246 (29.9%) | 1,732 (38.5%) |
| 25 to 34 Years | 375 (10.1%) | 609 (17.2%) |
| 35 to 44 Years | 229 (5.9%) | 271 (7.5%) |
| 45 to 54 Years | 196 (5.6%) | 466 (14.0%) |
| 55 to 64 Years | 432 (10.0%) | 478 (11.1%) |
| 65 to 74 Years | 316 (7.9%) | 168 (4.3%) |
| 75 Years and over | 139 (6.6%) | 396 (15.3%) |
| Total | 3,762 (11.9%) | 4,773 (15.2%) |
Income Above Poverty by Sex and Age in Marquette County
According to the poverty statistics in Marquette County, males aged 45 to 54 years and females aged 15 years are the age groups that are most secure financially, with 94.4% of males and 100.0% of females in these age groups living above the poverty line.
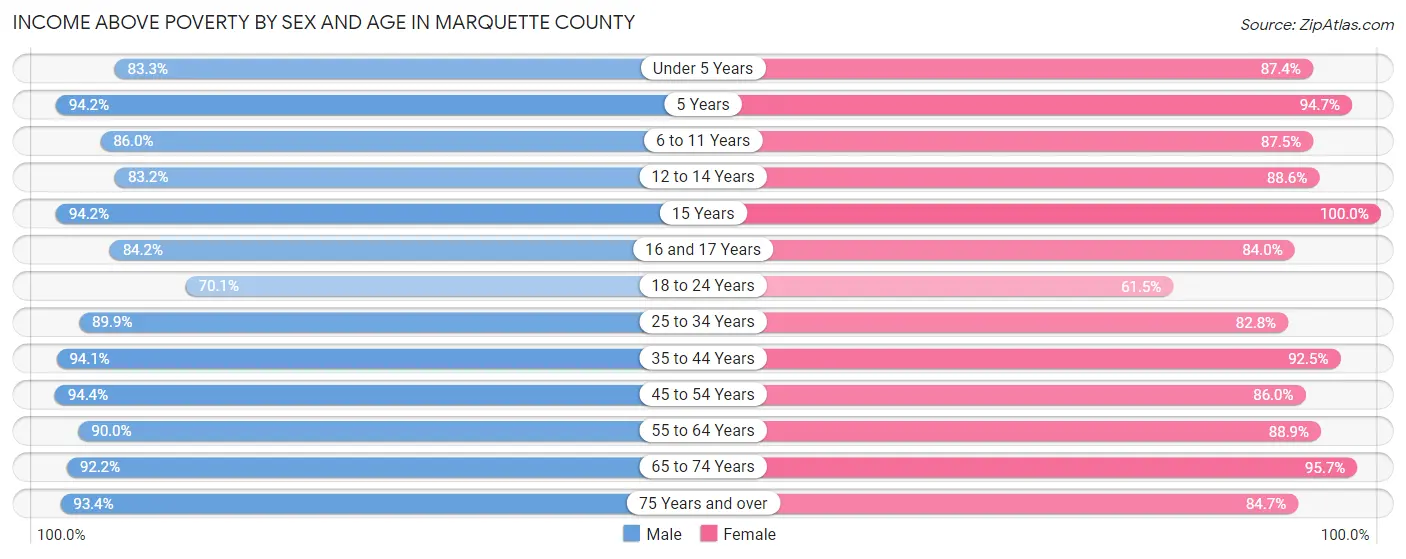
| Age Bracket | Male | Female |
| Under 5 Years | 1,230 (83.3%) | 1,311 (87.4%) |
| 5 Years | 324 (94.2%) | 248 (94.7%) |
| 6 to 11 Years | 1,836 (86.0%) | 1,627 (87.5%) |
| 12 to 14 Years | 739 (83.2%) | 901 (88.6%) |
| 15 Years | 454 (94.2%) | 346 (100.0%) |
| 16 and 17 Years | 453 (84.2%) | 531 (84.0%) |
| 18 to 24 Years | 2,923 (70.1%) | 2,768 (61.5%) |
| 25 to 34 Years | 3,334 (89.9%) | 2,931 (82.8%) |
| 35 to 44 Years | 3,638 (94.1%) | 3,347 (92.5%) |
| 45 to 54 Years | 3,291 (94.4%) | 2,870 (86.0%) |
| 55 to 64 Years | 3,896 (90.0%) | 3,838 (88.9%) |
| 65 to 74 Years | 3,709 (92.1%) | 3,693 (95.7%) |
| 75 Years and over | 1,958 (93.4%) | 2,188 (84.7%) |
| Total | 27,785 (88.1%) | 26,599 (84.8%) |
Income Below Poverty Among Married-Couple Families in Marquette County
The poverty statistics for married-couple families in Marquette County show that 3.6% or 467 of the total 13,123 families live below the poverty line. Families with 5 or more children have the highest poverty rate of 34.7%, comprising of 17 families. On the other hand, families with no children have the lowest poverty rate of 3.0%, which includes 268 families.
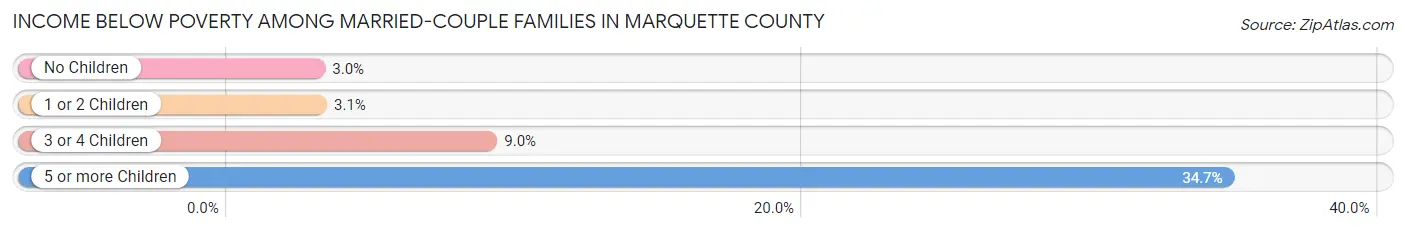
| Children | Above Poverty | Below Poverty |
| No Children | 8,542 (97.0%) | 268 (3.0%) |
| 1 or 2 Children | 3,316 (96.9%) | 106 (3.1%) |
| 3 or 4 Children | 766 (91.0%) | 76 (9.0%) |
| 5 or more Children | 32 (65.3%) | 17 (34.7%) |
| Total | 12,656 (96.4%) | 467 (3.6%) |
Income Below Poverty Among Single-Parent Households in Marquette County
According to the poverty data in Marquette County, 12.7% or 163 single-father households and 30.4% or 564 single-mother households are living below the poverty line. Among single-father households, those with 3 or 4 children have the highest poverty rate, with 20 households (38.5%) experiencing poverty. Likewise, among single-mother households, those with 1 or 2 children have the highest poverty rate, with 429 households (44.6%) falling below the poverty line.
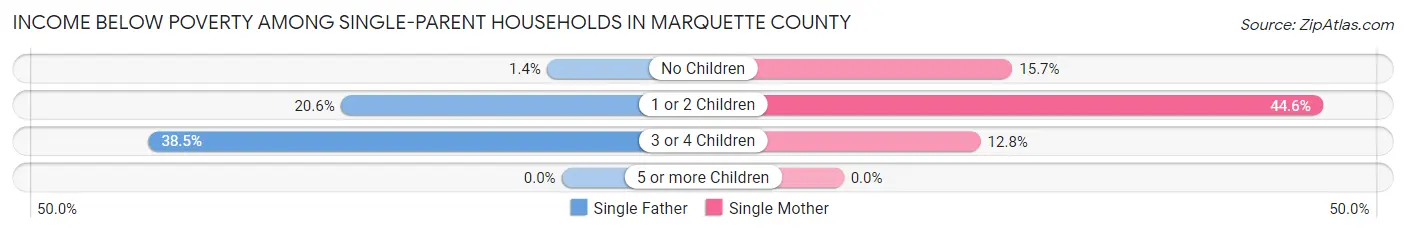
| Children | Single Father | Single Mother |
| No Children | 8 (1.4%) | 110 (15.7%) |
| 1 or 2 Children | 135 (20.6%) | 429 (44.6%) |
| 3 or 4 Children | 20 (38.5%) | 25 (12.8%) |
| 5 or more Children | 0 (0.0%) | 0 (0.0%) |
| Total | 163 (12.7%) | 564 (30.4%) |
Income Below Poverty Among Married-Couple vs Single-Parent Households in Marquette County
The poverty data for Marquette County shows that 467 of the married-couple family households (3.6%) and 727 of the single-parent households (23.1%) are living below the poverty level. Within the married-couple family households, those with 5 or more children have the highest poverty rate, with 17 households (34.7%) falling below the poverty line. Among the single-parent households, those with 1 or 2 children have the highest poverty rate, with 564 household (34.9%) living below poverty.
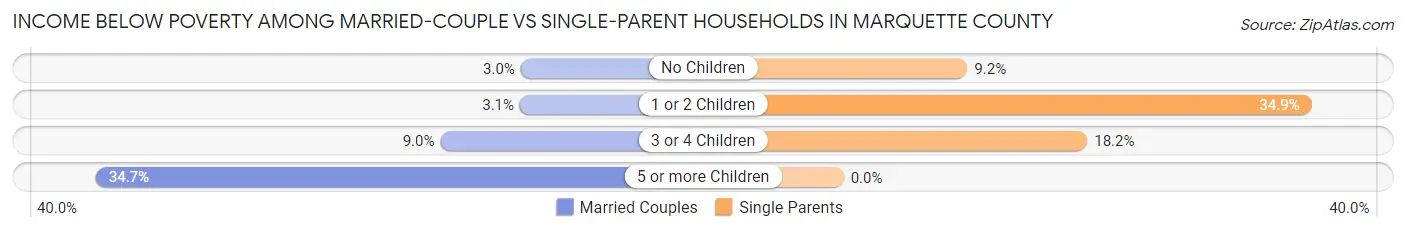
| Children | Married-Couple Families | Single-Parent Households |
| No Children | 268 (3.0%) | 118 (9.2%) |
| 1 or 2 Children | 106 (3.1%) | 564 (34.9%) |
| 3 or 4 Children | 76 (9.0%) | 45 (18.1%) |
| 5 or more Children | 17 (34.7%) | 0 (0.0%) |
| Total | 467 (3.6%) | 727 (23.1%) |
Employment Characteristics in Marquette County
Employment by Class of Employer in Marquette County
Among the 30,498 employed individuals in Marquette County, private company employees (20,603 | 67.6%), not-for-profit organizations (2,299 | 7.5%), and state government employees (2,242 | 7.3%) make up the most common classes of employment.
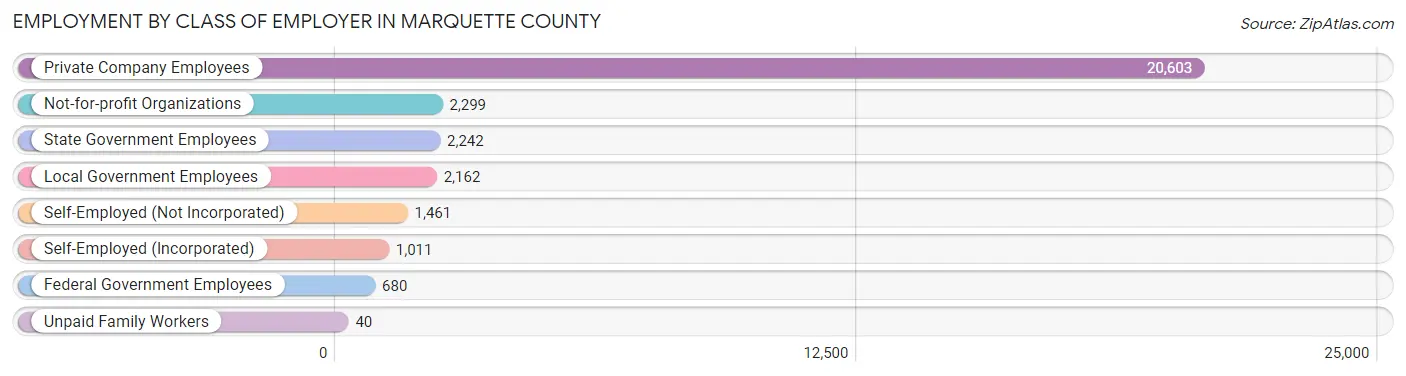
| Employer Class | # Employees | % Employees |
| Private Company Employees | 20,603 | 67.6% |
| Self-Employed (Incorporated) | 1,011 | 3.3% |
| Self-Employed (Not Incorporated) | 1,461 | 4.8% |
| Not-for-profit Organizations | 2,299 | 7.5% |
| Local Government Employees | 2,162 | 7.1% |
| State Government Employees | 2,242 | 7.3% |
| Federal Government Employees | 680 | 2.2% |
| Unpaid Family Workers | 40 | 0.1% |
| Total | 30,498 | 100.0% |
Employment Status by Age in Marquette County
According to the labor force statistics for Marquette County, out of the total population over 16 years of age (55,811), 59.2% or 33,040 individuals are in the labor force, with 5.6% or 1,850 of them unemployed. The age group with the highest labor force participation rate is 35 to 44 years, with 86.4% or 6,587 individuals in the labor force. Within the labor force, the 16 to 19 years age range has the highest percentage of unemployed individuals, with 11.4% or 252 of them being unemployed.
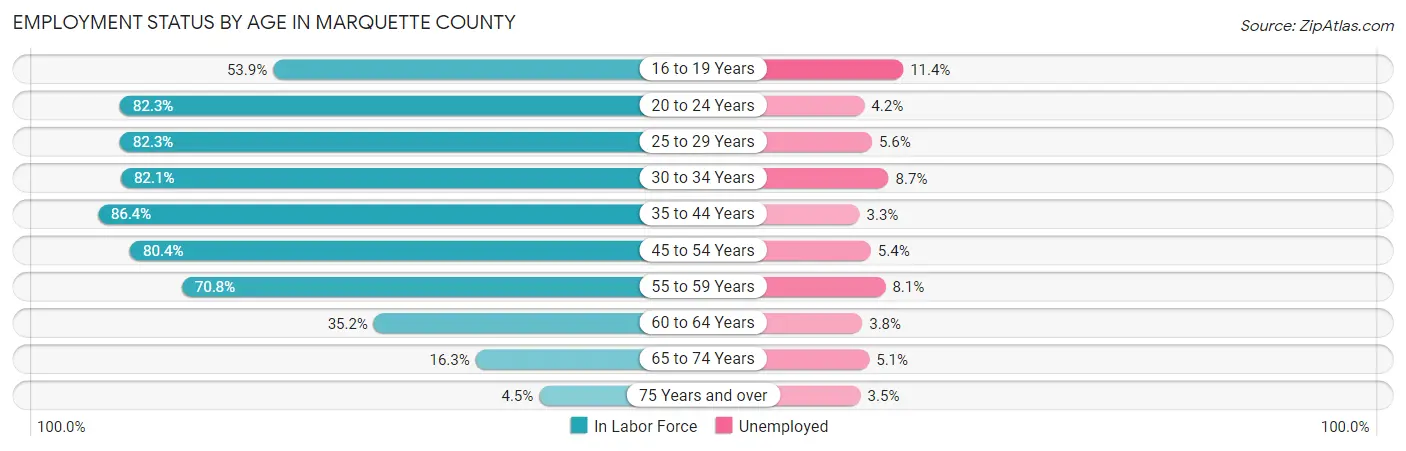
| Age Bracket | In Labor Force | Unemployed |
| 16 to 19 Years | 2,210 (53.9%) | 252 (11.4%) |
| 20 to 24 Years | 6,126 (82.3%) | 257 (4.2%) |
| 25 to 29 Years | 3,334 (82.3%) | 187 (5.6%) |
| 30 to 34 Years | 2,929 (82.1%) | 255 (8.7%) |
| 35 to 44 Years | 6,587 (86.4%) | 217 (3.3%) |
| 45 to 54 Years | 5,714 (80.4%) | 309 (5.4%) |
| 55 to 59 Years | 2,949 (70.8%) | 239 (8.1%) |
| 60 to 64 Years | 1,651 (35.2%) | 63 (3.8%) |
| 65 to 74 Years | 1,309 (16.3%) | 67 (5.1%) |
| 75 Years and over | 226 (4.5%) | 8 (3.5%) |
| Total | 33,040 (59.2%) | 1,850 (5.6%) |
Employment Status by Educational Attainment in Marquette County
According to labor force statistics for Marquette County, 74.2% of individuals (23,155) out of the total population between 25 and 64 years of age (31,206) are in the labor force, with 5.5% or 1,274 of them being unemployed. The group with the highest labor force participation rate are those with the educational attainment of bachelor's degree or higher, with 83.9% or 9,560 individuals in the labor force. Within the labor force, individuals with less than high school education have the highest percentage of unemployment, with 11.4% or 77 of them being unemployed.
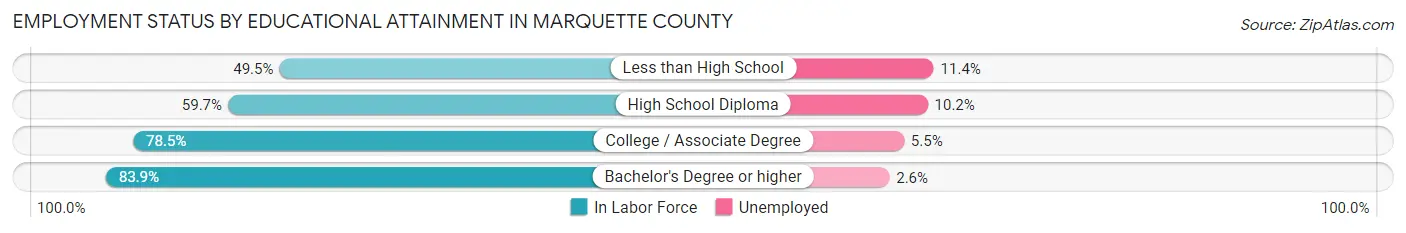
| Educational Attainment | In Labor Force | Unemployed |
| Less than High School | 676 (49.5%) | 156 (11.4%) |
| High School Diploma | 4,924 (59.7%) | 841 (10.2%) |
| College / Associate Degree | 8,005 (78.5%) | 561 (5.5%) |
| Bachelor's Degree or higher | 9,560 (83.9%) | 296 (2.6%) |
| Total | 23,155 (74.2%) | 1,716 (5.5%) |
Employment Occupations by Sex in Marquette County
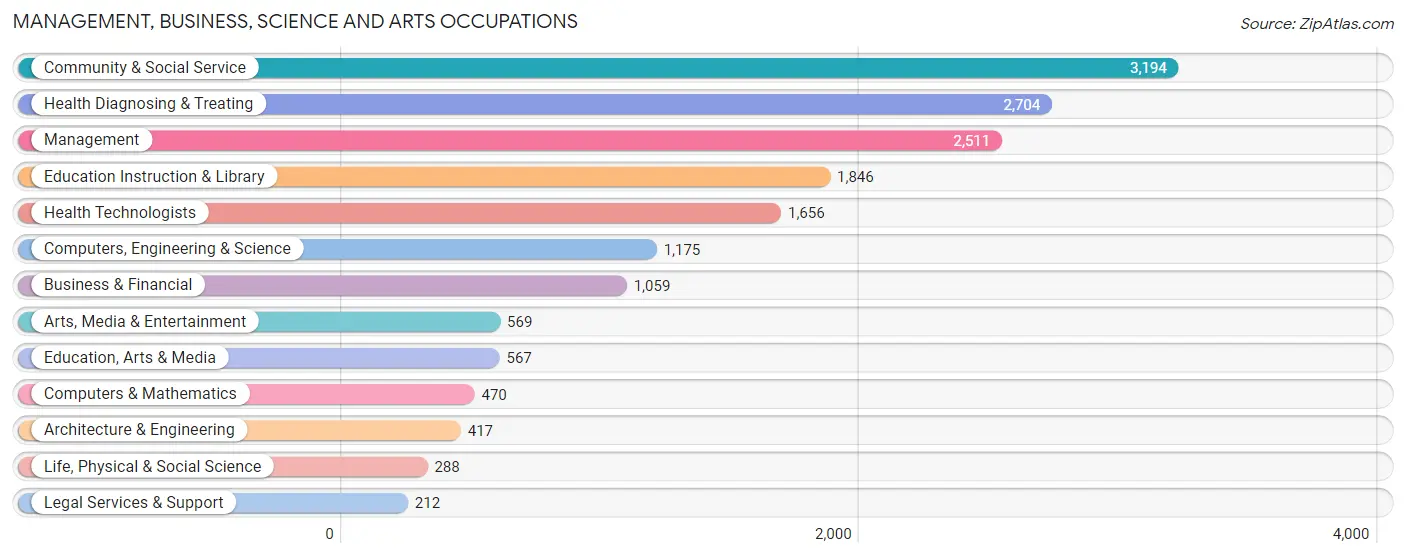
Management, Business, Science and Arts Occupations
The most common Management, Business, Science and Arts occupations in Marquette County are Community & Social Service (3,194 | 10.3%), Health Diagnosing & Treating (2,704 | 8.7%), Management (2,511 | 8.1%), Education Instruction & Library (1,846 | 5.9%), and Health Technologists (1,656 | 5.3%).
Management, Business, Science and Arts Occupations by Sex
Within the Management, Business, Science and Arts occupations in Marquette County, the most male-oriented occupations are Architecture & Engineering (86.1%), Computers, Engineering & Science (74.5%), and Computers & Mathematics (70.9%), while the most female-oriented occupations are Health Diagnosing & Treating (75.7%), Health Technologists (71.7%), and Legal Services & Support (67.4%).
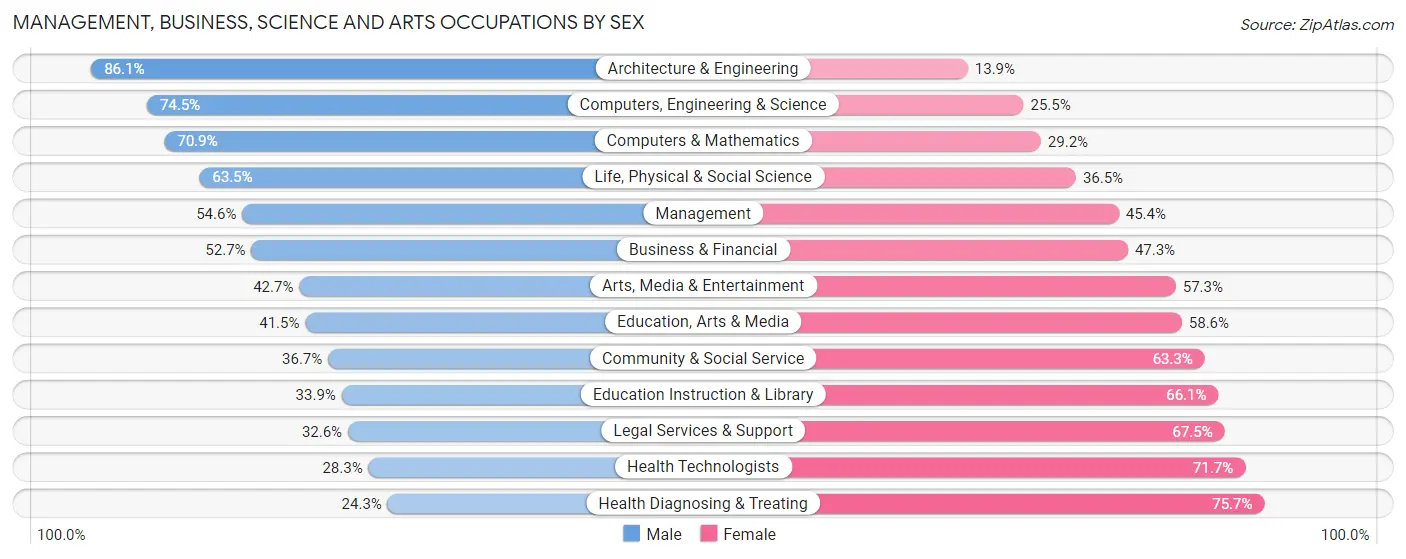
| Occupation | Male | Female |
| Management | 1,371 (54.6%) | 1,140 (45.4%) |
| Business & Financial | 558 (52.7%) | 501 (47.3%) |
| Computers, Engineering & Science | 875 (74.5%) | 300 (25.5%) |
| Computers & Mathematics | 333 (70.9%) | 137 (29.1%) |
| Architecture & Engineering | 359 (86.1%) | 58 (13.9%) |
| Life, Physical & Social Science | 183 (63.5%) | 105 (36.5%) |
| Community & Social Service | 1,172 (36.7%) | 2,022 (63.3%) |
| Education, Arts & Media | 235 (41.4%) | 332 (58.6%) |
| Legal Services & Support | 69 (32.6%) | 143 (67.4%) |
| Education Instruction & Library | 625 (33.9%) | 1,221 (66.1%) |
| Arts, Media & Entertainment | 243 (42.7%) | 326 (57.3%) |
| Health Diagnosing & Treating | 656 (24.3%) | 2,048 (75.7%) |
| Health Technologists | 468 (28.3%) | 1,188 (71.7%) |
| Total (Category) | 4,632 (43.5%) | 6,011 (56.5%) |
| Total (Overall) | 15,738 (50.6%) | 15,353 (49.4%) |
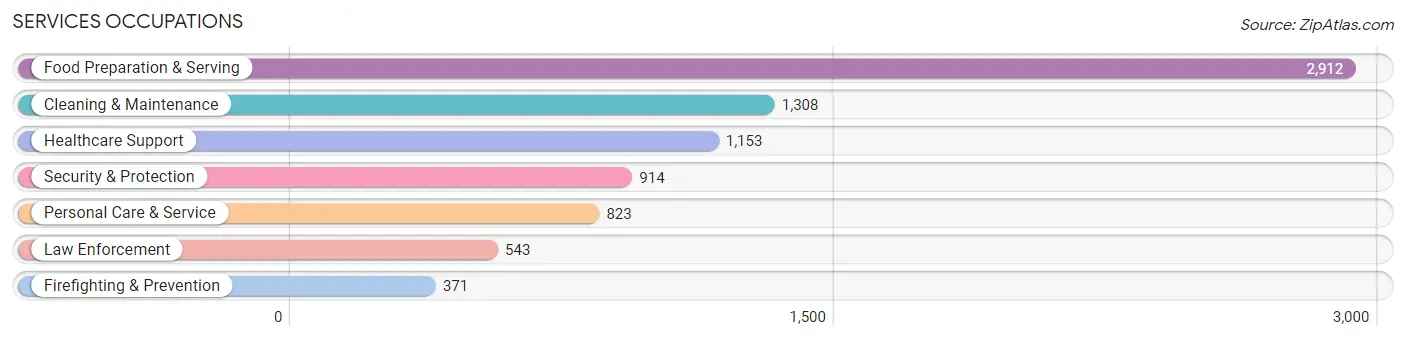
Services Occupations
The most common Services occupations in Marquette County are Food Preparation & Serving (2,912 | 9.4%), Cleaning & Maintenance (1,308 | 4.2%), Healthcare Support (1,153 | 3.7%), Security & Protection (914 | 2.9%), and Personal Care & Service (823 | 2.6%).
Services Occupations by Sex
Within the Services occupations in Marquette County, the most male-oriented occupations are Law Enforcement (96.9%), Security & Protection (92.3%), and Firefighting & Prevention (85.7%), while the most female-oriented occupations are Healthcare Support (87.9%), Personal Care & Service (73.4%), and Food Preparation & Serving (55.2%).
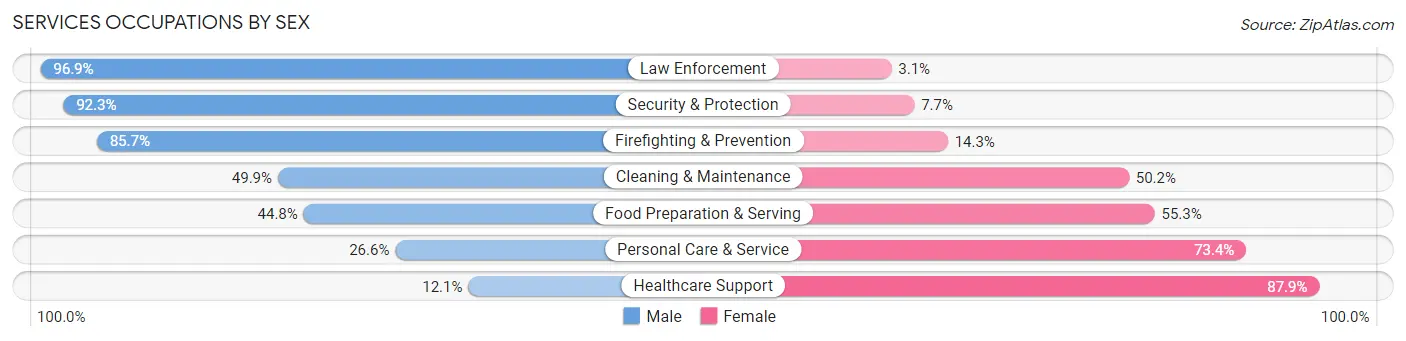
| Occupation | Male | Female |
| Healthcare Support | 140 (12.1%) | 1,013 (87.9%) |
| Security & Protection | 844 (92.3%) | 70 (7.7%) |
| Firefighting & Prevention | 318 (85.7%) | 53 (14.3%) |
| Law Enforcement | 526 (96.9%) | 17 (3.1%) |
| Food Preparation & Serving | 1,303 (44.8%) | 1,609 (55.2%) |
| Cleaning & Maintenance | 652 (49.8%) | 656 (50.1%) |
| Personal Care & Service | 219 (26.6%) | 604 (73.4%) |
| Total (Category) | 3,158 (44.4%) | 3,952 (55.6%) |
| Total (Overall) | 15,738 (50.6%) | 15,353 (49.4%) |
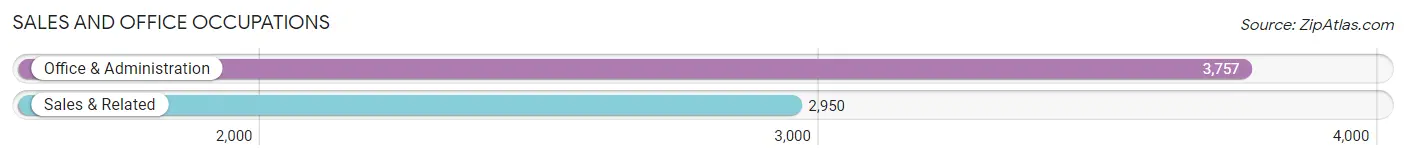
Sales and Office Occupations
The most common Sales and Office occupations in Marquette County are Office & Administration (3,757 | 12.1%), and Sales & Related (2,950 | 9.5%).
Sales and Office Occupations by Sex
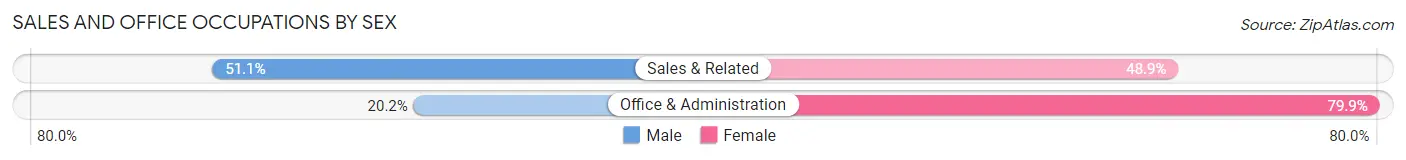
| Occupation | Male | Female |
| Sales & Related | 1,508 (51.1%) | 1,442 (48.9%) |
| Office & Administration | 757 (20.2%) | 3,000 (79.8%) |
| Total (Category) | 2,265 (33.8%) | 4,442 (66.2%) |
| Total (Overall) | 15,738 (50.6%) | 15,353 (49.4%) |
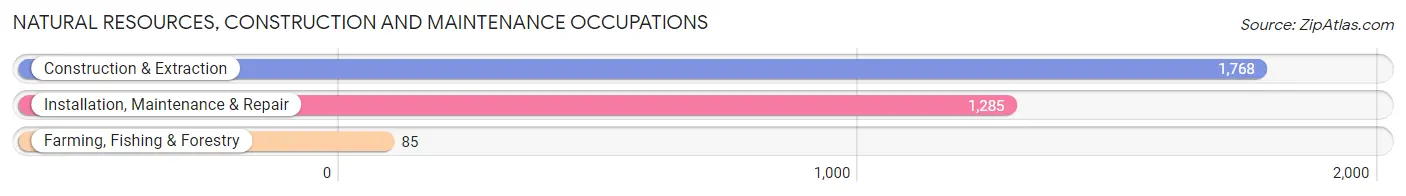
Natural Resources, Construction and Maintenance Occupations
The most common Natural Resources, Construction and Maintenance occupations in Marquette County are Construction & Extraction (1,768 | 5.7%), Installation, Maintenance & Repair (1,285 | 4.1%), and Farming, Fishing & Forestry (85 | 0.3%).
Natural Resources, Construction and Maintenance Occupations by Sex
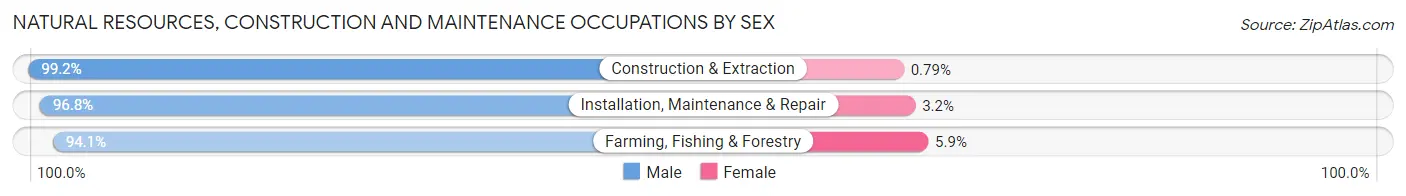
| Occupation | Male | Female |
| Farming, Fishing & Forestry | 80 (94.1%) | 5 (5.9%) |
| Construction & Extraction | 1,754 (99.2%) | 14 (0.8%) |
| Installation, Maintenance & Repair | 1,244 (96.8%) | 41 (3.2%) |
| Total (Category) | 3,078 (98.1%) | 60 (1.9%) |
| Total (Overall) | 15,738 (50.6%) | 15,353 (49.4%) |
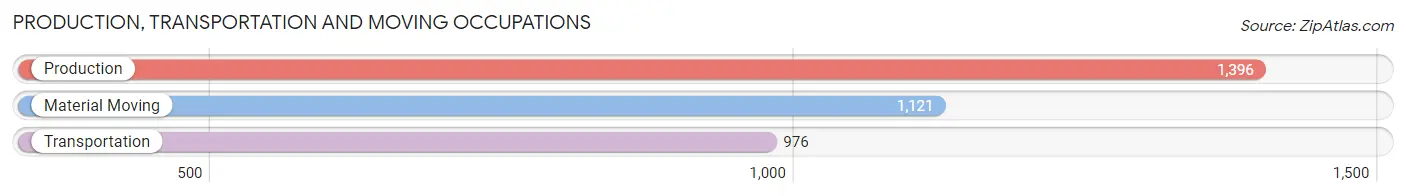
Production, Transportation and Moving Occupations
The most common Production, Transportation and Moving occupations in Marquette County are Production (1,396 | 4.5%), Material Moving (1,121 | 3.6%), and Transportation (976 | 3.1%).
Production, Transportation and Moving Occupations by Sex
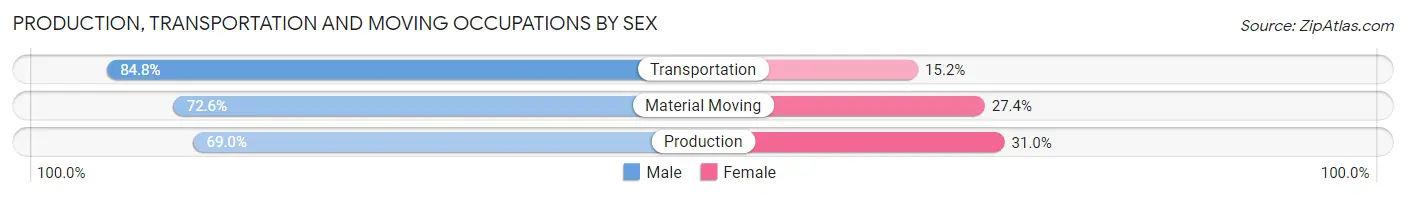
| Occupation | Male | Female |
| Production | 963 (69.0%) | 433 (31.0%) |
| Transportation | 828 (84.8%) | 148 (15.2%) |
| Material Moving | 814 (72.6%) | 307 (27.4%) |
| Total (Category) | 2,605 (74.6%) | 888 (25.4%) |
| Total (Overall) | 15,738 (50.6%) | 15,353 (49.4%) |
Employment Industries by Sex in Marquette County
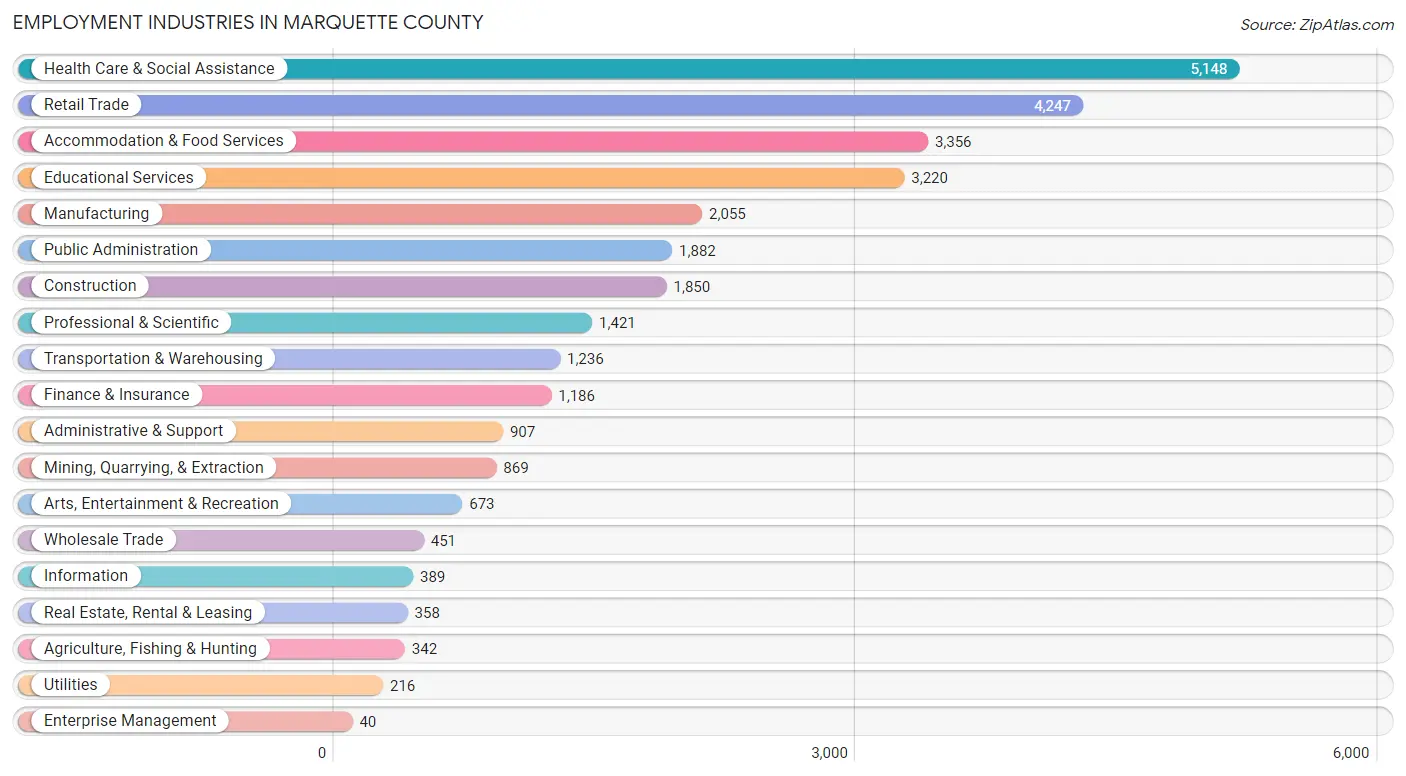
Employment Industries in Marquette County
The major employment industries in Marquette County include Health Care & Social Assistance (5,148 | 16.6%), Retail Trade (4,247 | 13.7%), Accommodation & Food Services (3,356 | 10.8%), Educational Services (3,220 | 10.4%), and Manufacturing (2,055 | 6.6%).
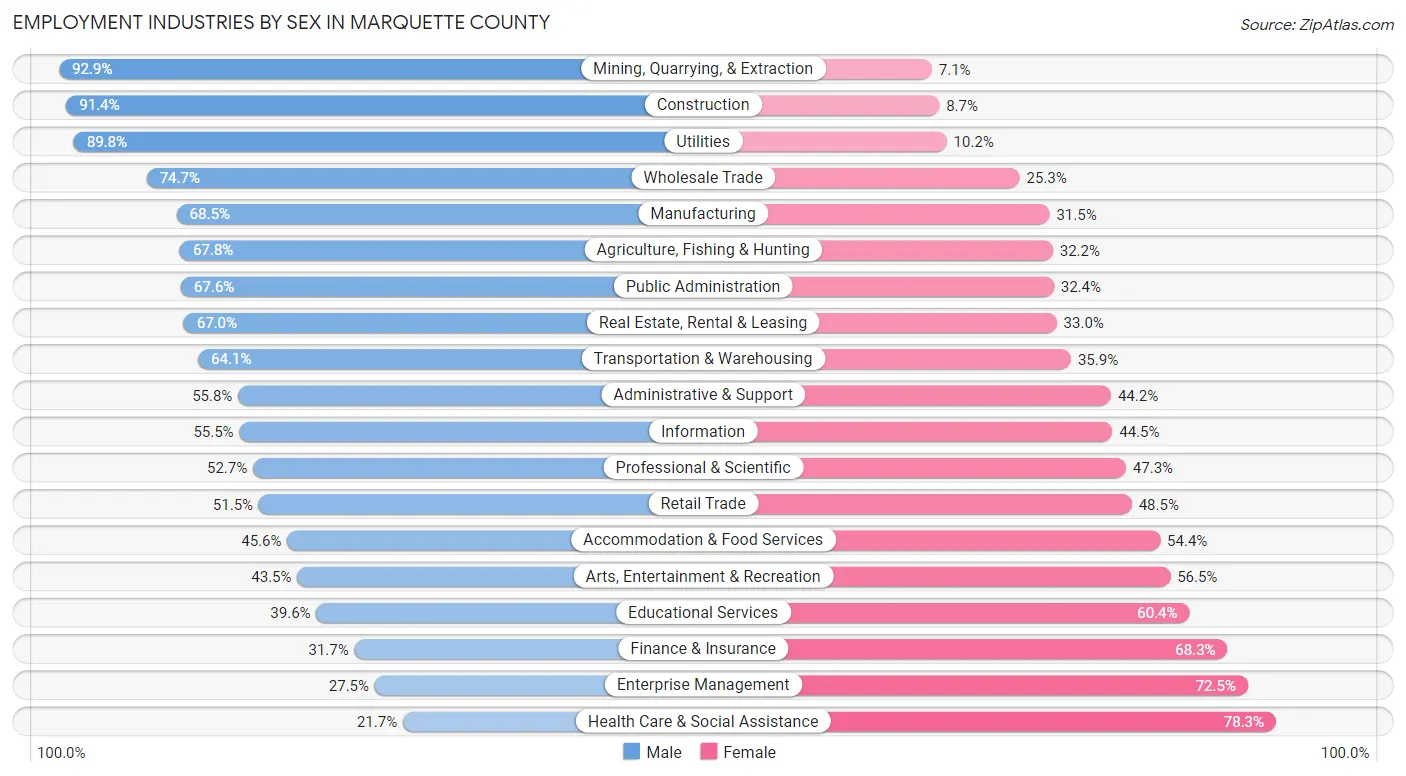
Employment Industries by Sex in Marquette County
The Marquette County industries that see more men than women are Mining, Quarrying, & Extraction (92.9%), Construction (91.3%), and Utilities (89.8%), whereas the industries that tend to have a higher number of women are Health Care & Social Assistance (78.3%), Enterprise Management (72.5%), and Finance & Insurance (68.3%).
| Industry | Male | Female |
| Agriculture, Fishing & Hunting | 232 (67.8%) | 110 (32.2%) |
| Mining, Quarrying, & Extraction | 807 (92.9%) | 62 (7.1%) |
| Construction | 1,690 (91.3%) | 160 (8.6%) |
| Manufacturing | 1,408 (68.5%) | 647 (31.5%) |
| Wholesale Trade | 337 (74.7%) | 114 (25.3%) |
| Retail Trade | 2,187 (51.5%) | 2,060 (48.5%) |
| Transportation & Warehousing | 792 (64.1%) | 444 (35.9%) |
| Utilities | 194 (89.8%) | 22 (10.2%) |
| Information | 216 (55.5%) | 173 (44.5%) |
| Finance & Insurance | 376 (31.7%) | 810 (68.3%) |
| Real Estate, Rental & Leasing | 240 (67.0%) | 118 (33.0%) |
| Professional & Scientific | 749 (52.7%) | 672 (47.3%) |
| Enterprise Management | 11 (27.5%) | 29 (72.5%) |
| Administrative & Support | 506 (55.8%) | 401 (44.2%) |
| Educational Services | 1,275 (39.6%) | 1,945 (60.4%) |
| Health Care & Social Assistance | 1,116 (21.7%) | 4,032 (78.3%) |
| Arts, Entertainment & Recreation | 293 (43.5%) | 380 (56.5%) |
| Accommodation & Food Services | 1,531 (45.6%) | 1,825 (54.4%) |
| Public Administration | 1,273 (67.6%) | 609 (32.4%) |
| Total | 15,738 (50.6%) | 15,353 (49.4%) |
Education in Marquette County
School Enrollment in Marquette County
The most common levels of schooling among the 16,884 students in Marquette County are college / undergraduate (6,198 | 36.7%), middle school (3,013 | 17.8%), and high school (2,756 | 16.3%).
| School Level | # Students | % Students |
| Nursery / Preschool | 837 | 5.0% |
| Kindergarten | 672 | 4.0% |
| Elementary School | 2,387 | 14.1% |
| Middle School | 3,013 | 17.8% |
| High School | 2,756 | 16.3% |
| College / Undergraduate | 6,198 | 36.7% |
| Graduate / Professional | 1,021 | 6.0% |
| Total | 16,884 | 100.0% |
School Enrollment by Age by Funding Source in Marquette County
Out of a total of 16,884 students who are enrolled in schools in Marquette County, 1,469 (8.7%) attend a private institution, while the remaining 15,415 (91.3%) are enrolled in public schools. The age group of 3 to 4 year olds has the highest likelihood of being enrolled in private schools, with 302 (45.6% in the age bracket) enrolled. Conversely, the age group of 25 to 34 year olds has the lowest likelihood of being enrolled in a private school, with 853 (97.3% in the age bracket) attending a public institution.
| Age Bracket | Public School | Private School |
| 3 to 4 Year Olds | 361 (54.4%) | 302 (45.6%) |
| 5 to 9 Year Old | 2,480 (88.6%) | 318 (11.4%) |
| 10 to 14 Year Olds | 3,439 (94.0%) | 219 (6.0%) |
| 15 to 17 Year Olds | 1,924 (96.4%) | 72 (3.6%) |
| 18 to 19 Year Olds | 2,044 (93.6%) | 139 (6.4%) |
| 20 to 24 Year Olds | 3,760 (95.3%) | 184 (4.7%) |
| 25 to 34 Year Olds | 853 (97.3%) | 24 (2.7%) |
| 35 Years and over | 552 (72.2%) | 213 (27.8%) |
| Total | 15,415 (91.3%) | 1,469 (8.7%) |
Educational Attainment by Field of Study in Marquette County
Education (2,658 | 15.9%), business (2,487 | 14.9%), science & technology (2,039 | 12.2%), arts & humanities (1,599 | 9.6%), and bio, nature & agricultural (1,335 | 8.0%) are the most common fields of study among 16,700 individuals in Marquette County who have obtained a bachelor's degree or higher.
| Field of Study | # Graduates | % Graduates |
| Computers & Mathematics | 442 | 2.6% |
| Bio, Nature & Agricultural | 1,335 | 8.0% |
| Physical & Health Sciences | 669 | 4.0% |
| Psychology | 775 | 4.6% |
| Social Sciences | 1,069 | 6.4% |
| Engineering | 702 | 4.2% |
| Multidisciplinary Studies | 219 | 1.3% |
| Science & Technology | 2,039 | 12.2% |
| Business | 2,487 | 14.9% |
| Education | 2,658 | 15.9% |
| Literature & Languages | 683 | 4.1% |
| Liberal Arts & History | 642 | 3.8% |
| Visual & Performing Arts | 722 | 4.3% |
| Communications | 659 | 4.0% |
| Arts & Humanities | 1,599 | 9.6% |
| Total | 16,700 | 100.0% |
Transportation & Commute in Marquette County
Vehicle Availability by Sex in Marquette County
The most prevalent vehicle ownership categories in Marquette County are males with 2 vehicles (6,960, accounting for 46.1%) and females with 2 vehicles (6,506, making up 47.7%).
| Vehicles Available | Male | Female |
| No Vehicle | 441 (2.9%) | 532 (3.6%) |
| 1 Vehicle | 2,646 (17.5%) | 2,760 (18.9%) |
| 2 Vehicles | 6,960 (46.1%) | 6,506 (44.6%) |
| 3 Vehicles | 3,413 (22.6%) | 2,719 (18.6%) |
| 4 Vehicles | 1,368 (9.1%) | 1,467 (10.1%) |
| 5 or more Vehicles | 268 (1.8%) | 619 (4.2%) |
| Total | 15,096 (100.0%) | 14,603 (100.0%) |
Commute Time in Marquette County
The most frequently occuring commute durations in Marquette County are 5 to 9 minutes (6,678 commuters, 23.2%), 10 to 14 minutes (6,126 commuters, 21.3%), and 20 to 24 minutes (3,927 commuters, 13.6%).
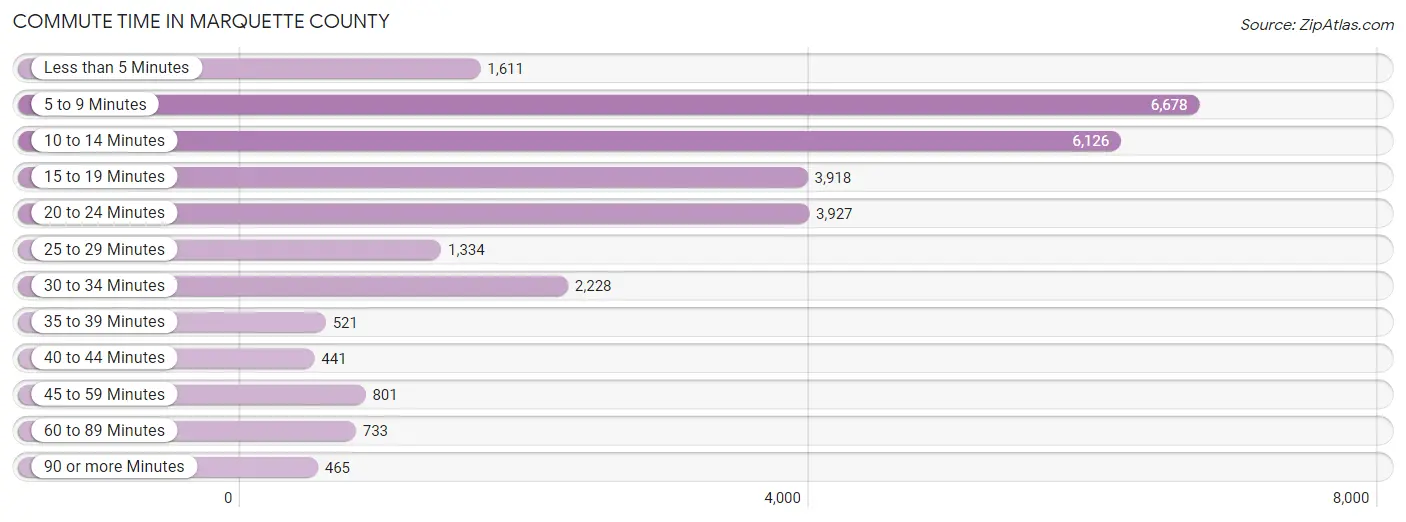
| Commute Time | # Commuters | % Commuters |
| Less than 5 Minutes | 1,611 | 5.6% |
| 5 to 9 Minutes | 6,678 | 23.2% |
| 10 to 14 Minutes | 6,126 | 21.3% |
| 15 to 19 Minutes | 3,918 | 13.6% |
| 20 to 24 Minutes | 3,927 | 13.6% |
| 25 to 29 Minutes | 1,334 | 4.6% |
| 30 to 34 Minutes | 2,228 | 7.7% |
| 35 to 39 Minutes | 521 | 1.8% |
| 40 to 44 Minutes | 441 | 1.5% |
| 45 to 59 Minutes | 801 | 2.8% |
| 60 to 89 Minutes | 733 | 2.5% |
| 90 or more Minutes | 465 | 1.6% |
Commute Time by Sex in Marquette County
The most common commute times in Marquette County are 10 to 14 minutes (2,941 commuters, 20.1%) for males and 5 to 9 minutes (3,796 commuters, 26.8%) for females.
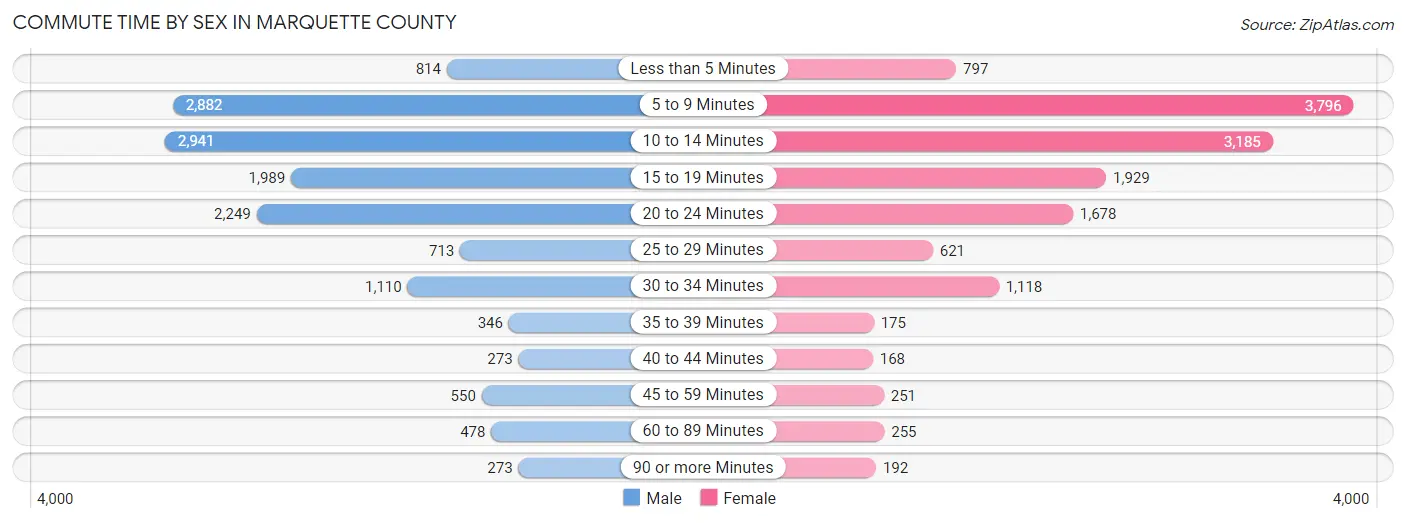
| Commute Time | Male | Female |
| Less than 5 Minutes | 814 (5.6%) | 797 (5.6%) |
| 5 to 9 Minutes | 2,882 (19.7%) | 3,796 (26.8%) |
| 10 to 14 Minutes | 2,941 (20.1%) | 3,185 (22.5%) |
| 15 to 19 Minutes | 1,989 (13.6%) | 1,929 (13.6%) |
| 20 to 24 Minutes | 2,249 (15.4%) | 1,678 (11.8%) |
| 25 to 29 Minutes | 713 (4.9%) | 621 (4.4%) |
| 30 to 34 Minutes | 1,110 (7.6%) | 1,118 (7.9%) |
| 35 to 39 Minutes | 346 (2.4%) | 175 (1.2%) |
| 40 to 44 Minutes | 273 (1.9%) | 168 (1.2%) |
| 45 to 59 Minutes | 550 (3.8%) | 251 (1.8%) |
| 60 to 89 Minutes | 478 (3.3%) | 255 (1.8%) |
| 90 or more Minutes | 273 (1.9%) | 192 (1.4%) |
Time of Departure to Work by Sex in Marquette County
The most frequent times of departure to work in Marquette County are 7:30 AM to 7:59 AM (2,100, 14.4%) for males and 7:30 AM to 7:59 AM (2,505, 17.7%) for females.
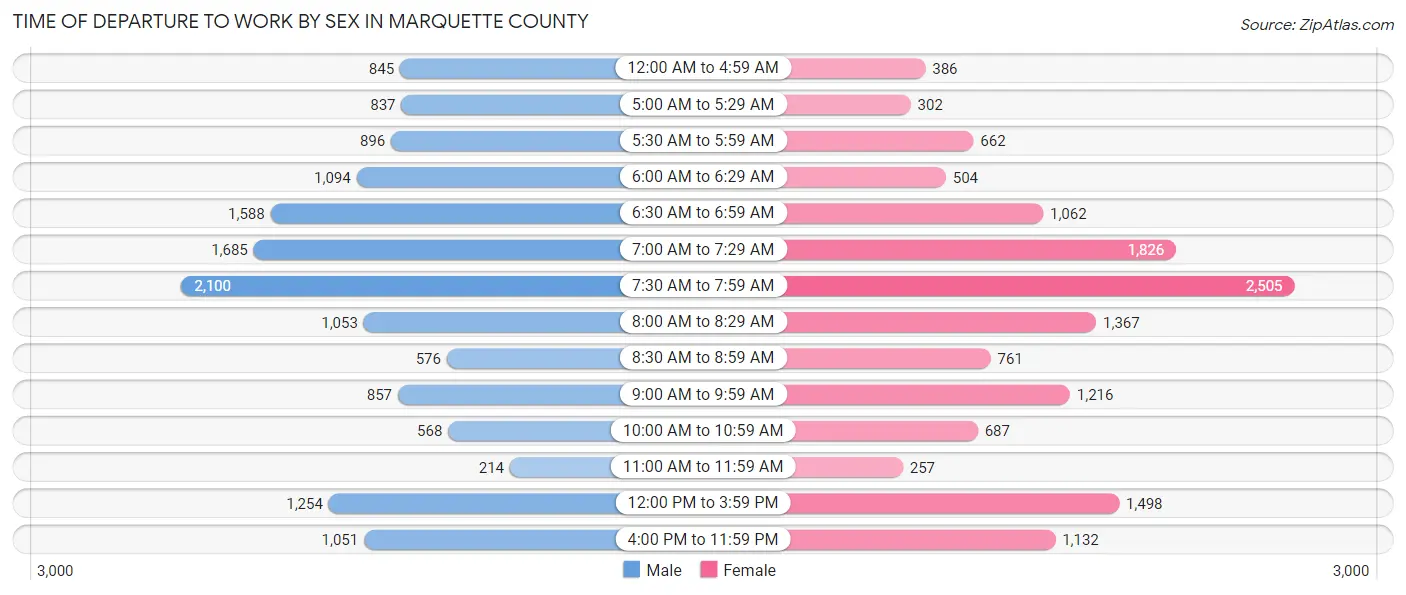
| Time of Departure | Male | Female |
| 12:00 AM to 4:59 AM | 845 (5.8%) | 386 (2.7%) |
| 5:00 AM to 5:29 AM | 837 (5.7%) | 302 (2.1%) |
| 5:30 AM to 5:59 AM | 896 (6.1%) | 662 (4.7%) |
| 6:00 AM to 6:29 AM | 1,094 (7.5%) | 504 (3.6%) |
| 6:30 AM to 6:59 AM | 1,588 (10.9%) | 1,062 (7.5%) |
| 7:00 AM to 7:29 AM | 1,685 (11.5%) | 1,826 (12.9%) |
| 7:30 AM to 7:59 AM | 2,100 (14.4%) | 2,505 (17.7%) |
| 8:00 AM to 8:29 AM | 1,053 (7.2%) | 1,367 (9.7%) |
| 8:30 AM to 8:59 AM | 576 (3.9%) | 761 (5.4%) |
| 9:00 AM to 9:59 AM | 857 (5.9%) | 1,216 (8.6%) |
| 10:00 AM to 10:59 AM | 568 (3.9%) | 687 (4.9%) |
| 11:00 AM to 11:59 AM | 214 (1.5%) | 257 (1.8%) |
| 12:00 PM to 3:59 PM | 1,254 (8.6%) | 1,498 (10.6%) |
| 4:00 PM to 11:59 PM | 1,051 (7.2%) | 1,132 (8.0%) |
| Total | 14,618 (100.0%) | 14,165 (100.0%) |
Housing Occupancy in Marquette County
Occupancy by Ownership in Marquette County
Of the total 27,345 dwellings in Marquette County, owner-occupied units account for 19,473 (71.2%), while renter-occupied units make up 7,872 (28.8%).
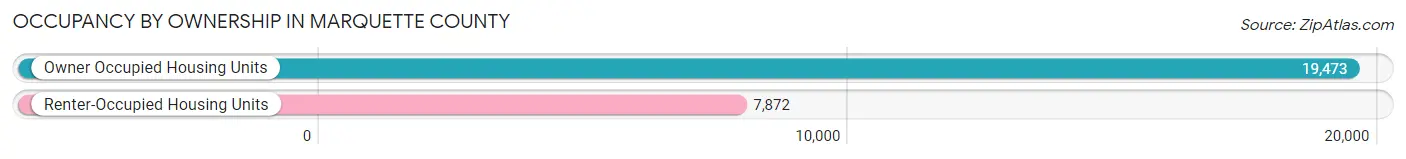
| Occupancy | # Housing Units | % Housing Units |
| Owner Occupied Housing Units | 19,473 | 71.2% |
| Renter-Occupied Housing Units | 7,872 | 28.8% |
| Total Occupied Housing Units | 27,345 | 100.0% |
Occupancy by Household Size in Marquette County
| Household Size | # Housing Units | % Housing Units |
| 1-Person Household | 8,459 | 30.9% |
| 2-Person Household | 11,060 | 40.5% |
| 3-Person Household | 3,505 | 12.8% |
| 4+ Person Household | 4,321 | 15.8% |
| Total Housing Units | 27,345 | 100.0% |
Occupancy by Ownership by Household Size in Marquette County
| Household Size | Owner-occupied | Renter-occupied |
| 1-Person Household | 4,397 (52.0%) | 4,062 (48.0%) |
| 2-Person Household | 8,796 (79.5%) | 2,264 (20.5%) |
| 3-Person Household | 2,637 (75.2%) | 868 (24.8%) |
| 4+ Person Household | 3,643 (84.3%) | 678 (15.7%) |
| Total Housing Units | 19,473 (71.2%) | 7,872 (28.8%) |
Occupancy by Educational Attainment in Marquette County
| Household Size | Owner-occupied | Renter-occupied |
| Less than High School | 524 (48.4%) | 559 (51.6%) |
| High School Diploma | 4,968 (73.7%) | 1,771 (26.3%) |
| College/Associate Degree | 6,493 (66.4%) | 3,290 (33.6%) |
| Bachelor's Degree or higher | 7,488 (76.9%) | 2,252 (23.1%) |
Occupancy by Age of Householder in Marquette County
| Age Bracket | # Households | % Households |
| Under 35 Years | 6,056 | 22.2% |
| 35 to 44 Years | 4,079 | 14.9% |
| 45 to 54 Years | 3,730 | 13.6% |
| 55 to 64 Years | 5,126 | 18.8% |
| 65 to 74 Years | 4,986 | 18.2% |
| 75 to 84 Years | 2,224 | 8.1% |
| 85 Years and Over | 1,144 | 4.2% |
| Total | 27,345 | 100.0% |
Housing Finances in Marquette County
Median Income by Occupancy in Marquette County
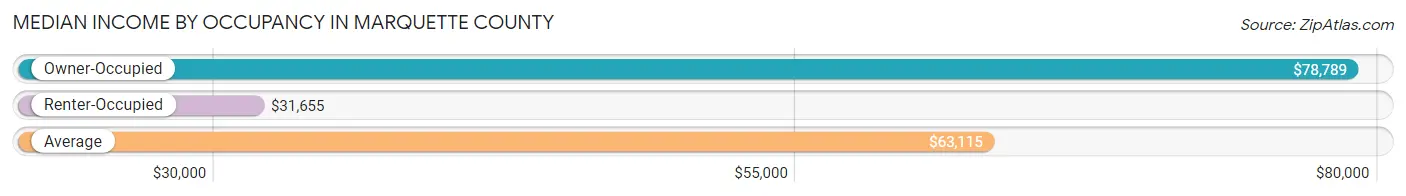
| Occupancy Type | # Households | Median Income |
| Owner-Occupied | 19,473 (71.2%) | $78,789 |
| Renter-Occupied | 7,872 (28.8%) | $31,655 |
| Average | 27,345 (100.0%) | $63,115 |
Occupancy by Householder Income Bracket in Marquette County
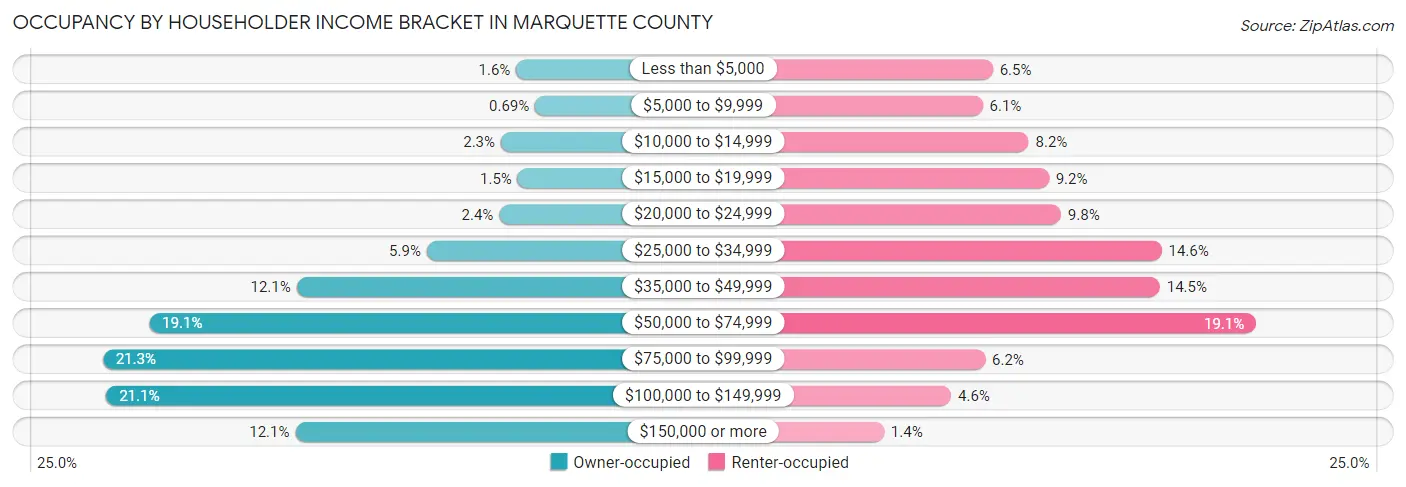
| Income Bracket | Owner-occupied | Renter-occupied |
| Less than $5,000 | 310 (1.6%) | 514 (6.5%) |
| $5,000 to $9,999 | 135 (0.7%) | 476 (6.0%) |
| $10,000 to $14,999 | 452 (2.3%) | 649 (8.2%) |
| $15,000 to $19,999 | 296 (1.5%) | 724 (9.2%) |
| $20,000 to $24,999 | 468 (2.4%) | 770 (9.8%) |
| $25,000 to $34,999 | 1,139 (5.9%) | 1,147 (14.6%) |
| $35,000 to $49,999 | 2,347 (12.0%) | 1,141 (14.5%) |
| $50,000 to $74,999 | 3,713 (19.1%) | 1,501 (19.1%) |
| $75,000 to $99,999 | 4,144 (21.3%) | 486 (6.2%) |
| $100,000 to $149,999 | 4,110 (21.1%) | 358 (4.5%) |
| $150,000 or more | 2,359 (12.1%) | 106 (1.3%) |
| Total | 19,473 (100.0%) | 7,872 (100.0%) |
Monthly Housing Cost Tiers in Marquette County
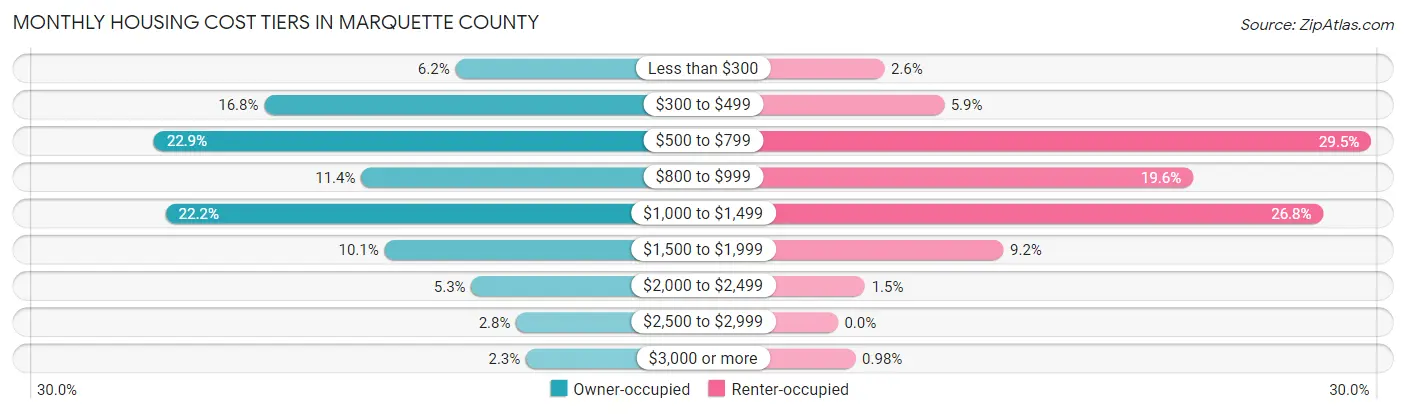
| Monthly Cost | Owner-occupied | Renter-occupied |
| Less than $300 | 1,207 (6.2%) | 202 (2.6%) |
| $300 to $499 | 3,264 (16.8%) | 462 (5.9%) |
| $500 to $799 | 4,452 (22.9%) | 2,321 (29.5%) |
| $800 to $999 | 2,220 (11.4%) | 1,546 (19.6%) |
| $1,000 to $1,499 | 4,324 (22.2%) | 2,113 (26.8%) |
| $1,500 to $1,999 | 1,970 (10.1%) | 720 (9.1%) |
| $2,000 to $2,499 | 1,035 (5.3%) | 119 (1.5%) |
| $2,500 to $2,999 | 553 (2.8%) | 0 (0.0%) |
| $3,000 or more | 448 (2.3%) | 77 (1.0%) |
| Total | 19,473 (100.0%) | 7,872 (100.0%) |
Physical Housing Characteristics in Marquette County
Housing Structures in Marquette County
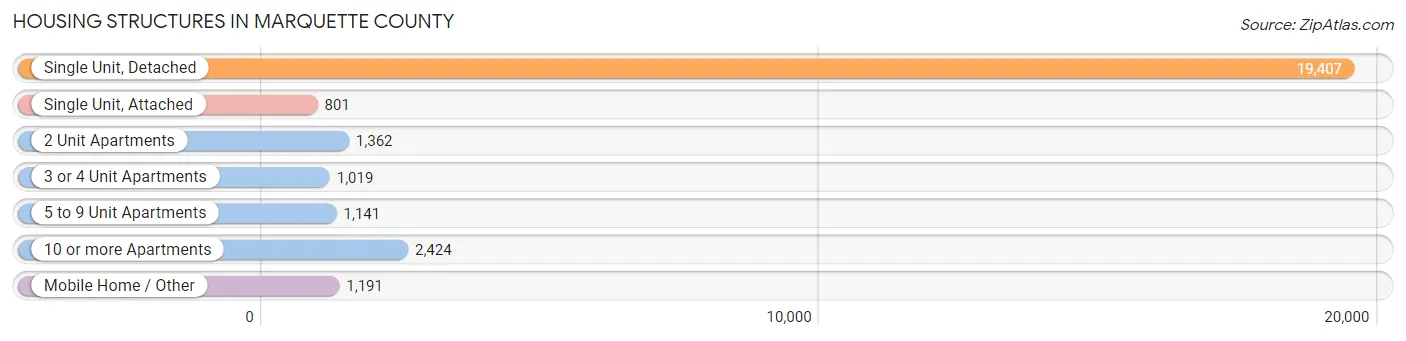
| Structure Type | # Housing Units | % Housing Units |
| Single Unit, Detached | 19,407 | 71.0% |
| Single Unit, Attached | 801 | 2.9% |
| 2 Unit Apartments | 1,362 | 5.0% |
| 3 or 4 Unit Apartments | 1,019 | 3.7% |
| 5 to 9 Unit Apartments | 1,141 | 4.2% |
| 10 or more Apartments | 2,424 | 8.9% |
| Mobile Home / Other | 1,191 | 4.4% |
| Total | 27,345 | 100.0% |
Housing Structures by Occupancy in Marquette County
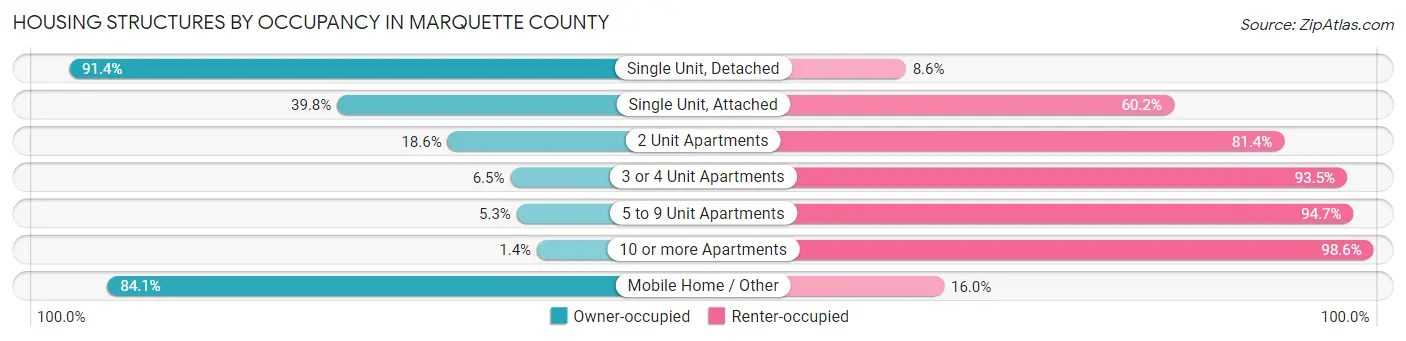
| Structure Type | Owner-occupied | Renter-occupied |
| Single Unit, Detached | 17,741 (91.4%) | 1,666 (8.6%) |
| Single Unit, Attached | 319 (39.8%) | 482 (60.2%) |
| 2 Unit Apartments | 253 (18.6%) | 1,109 (81.4%) |
| 3 or 4 Unit Apartments | 66 (6.5%) | 953 (93.5%) |
| 5 to 9 Unit Apartments | 60 (5.3%) | 1,081 (94.7%) |
| 10 or more Apartments | 33 (1.4%) | 2,391 (98.6%) |
| Mobile Home / Other | 1,001 (84.1%) | 190 (16.0%) |
| Total | 19,473 (71.2%) | 7,872 (28.8%) |
Housing Structures by Number of Rooms in Marquette County
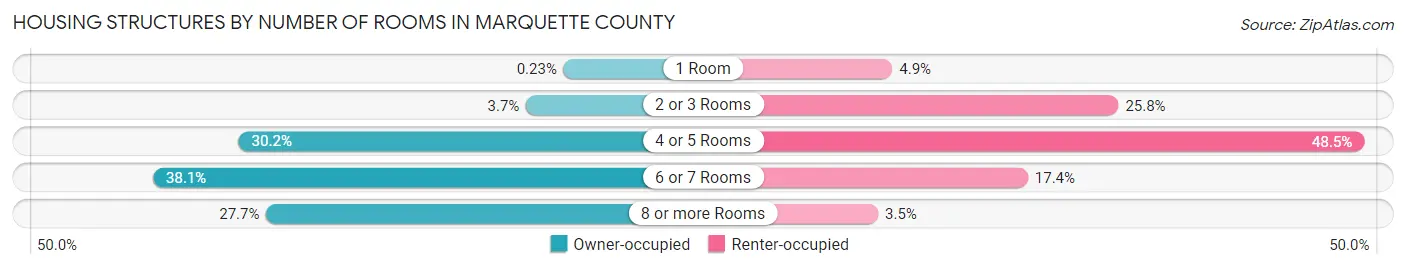
| Number of Rooms | Owner-occupied | Renter-occupied |
| 1 Room | 45 (0.2%) | 382 (4.9%) |
| 2 or 3 Rooms | 721 (3.7%) | 2,028 (25.8%) |
| 4 or 5 Rooms | 5,880 (30.2%) | 3,816 (48.5%) |
| 6 or 7 Rooms | 7,425 (38.1%) | 1,368 (17.4%) |
| 8 or more Rooms | 5,402 (27.7%) | 278 (3.5%) |
| Total | 19,473 (100.0%) | 7,872 (100.0%) |
Housing Structure by Heating Type in Marquette County
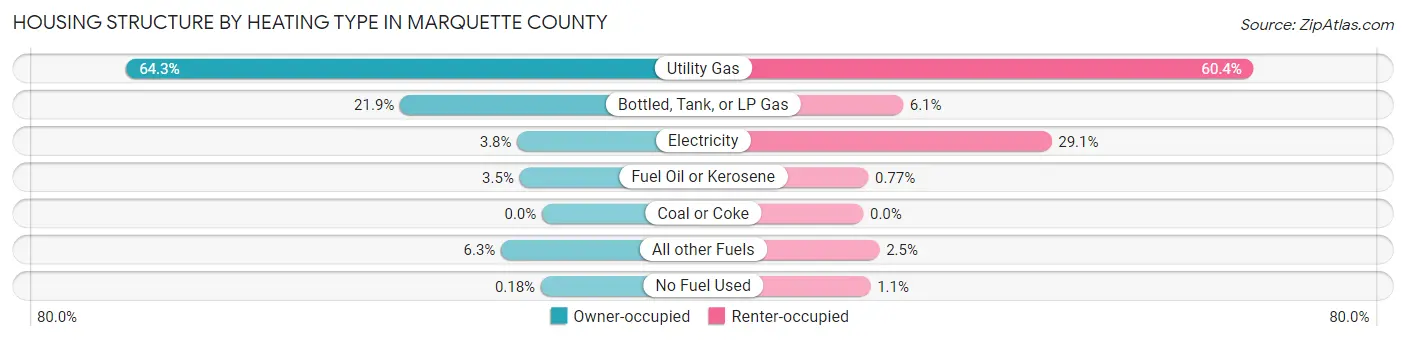
| Heating Type | Owner-occupied | Renter-occupied |
| Utility Gas | 12,518 (64.3%) | 4,753 (60.4%) |
| Bottled, Tank, or LP Gas | 4,273 (21.9%) | 483 (6.1%) |
| Electricity | 743 (3.8%) | 2,291 (29.1%) |
| Fuel Oil or Kerosene | 673 (3.5%) | 61 (0.8%) |
| Coal or Coke | 0 (0.0%) | 0 (0.0%) |
| All other Fuels | 1,231 (6.3%) | 197 (2.5%) |
| No Fuel Used | 35 (0.2%) | 87 (1.1%) |
| Total | 19,473 (100.0%) | 7,872 (100.0%) |
Household Vehicle Usage in Marquette County
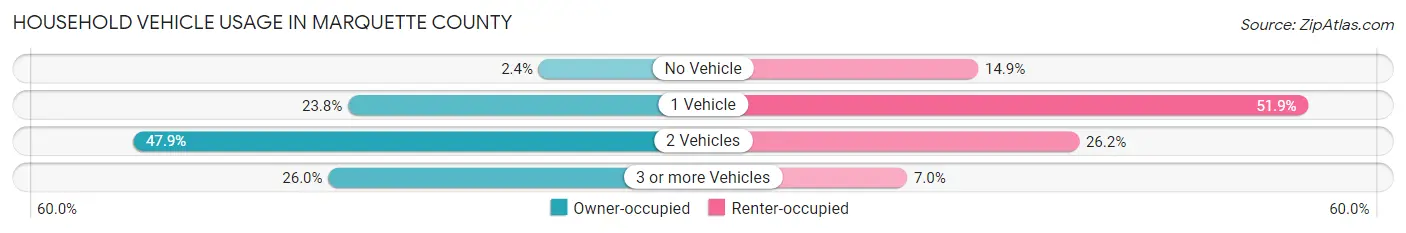
| Vehicles per Household | Owner-occupied | Renter-occupied |
| No Vehicle | 467 (2.4%) | 1,174 (14.9%) |
| 1 Vehicle | 4,628 (23.8%) | 4,087 (51.9%) |
| 2 Vehicles | 9,320 (47.9%) | 2,064 (26.2%) |
| 3 or more Vehicles | 5,058 (26.0%) | 547 (7.0%) |
| Total | 19,473 (100.0%) | 7,872 (100.0%) |
Real Estate & Mortgages in Marquette County
Real Estate and Mortgage Overview in Marquette County
| Characteristic | Without Mortgage | With Mortgage |
| Housing Units | 8,495 | 10,978 |
| Median Property Value | $169,500 | $194,600 |
| Median Household Income | $67,689 | $1,614 |
| Monthly Housing Costs | $494 | $423 |
| Real Estate Taxes | $1,728 | $405 |
Property Value by Mortgage Status in Marquette County
| Property Value | Without Mortgage | With Mortgage |
| Less than $50,000 | 1,082 (12.7%) | 595 (5.4%) |
| $50,000 to $99,999 | 1,179 (13.9%) | 1,557 (14.2%) |
| $100,000 to $299,999 | 4,808 (56.6%) | 6,255 (57.0%) |
| $300,000 to $499,999 | 1,028 (12.1%) | 1,840 (16.8%) |
| $500,000 to $749,999 | 243 (2.9%) | 549 (5.0%) |
| $750,000 to $999,999 | 81 (0.9%) | 82 (0.7%) |
| $1,000,000 or more | 74 (0.9%) | 100 (0.9%) |
| Total | 8,495 (100.0%) | 10,978 (100.0%) |
Household Income by Mortgage Status in Marquette County
| Household Income | Without Mortgage | With Mortgage |
| Less than $10,000 | 231 (2.7%) | 262 (2.4%) |
| $10,000 to $24,999 | 717 (8.4%) | 214 (1.9%) |
| $25,000 to $34,999 | 671 (7.9%) | 499 (4.5%) |
| $35,000 to $49,999 | 1,191 (14.0%) | 468 (4.3%) |
| $50,000 to $74,999 | 1,939 (22.8%) | 1,156 (10.5%) |
| $75,000 to $99,999 | 1,630 (19.2%) | 1,774 (16.2%) |
| $100,000 to $149,999 | 1,371 (16.1%) | 2,514 (22.9%) |
| $150,000 or more | 745 (8.8%) | 2,739 (24.9%) |
| Total | 8,495 (100.0%) | 10,978 (100.0%) |
Property Value to Household Income Ratio in Marquette County
| Value-to-Income Ratio | Without Mortgage | With Mortgage |
| Less than 2.0x | 3,320 (39.1%) | 87,230 (794.6%) |
| 2.0x to 2.9x | 1,667 (19.6%) | 4,790 (43.6%) |
| 3.0x to 3.9x | 1,403 (16.5%) | 2,777 (25.3%) |
| 4.0x or more | 2,084 (24.5%) | 1,244 (11.3%) |
| Total | 8,495 (100.0%) | 10,978 (100.0%) |
Real Estate Taxes by Mortgage Status in Marquette County
| Property Taxes | Without Mortgage | With Mortgage |
| Less than $800 | 1,317 (15.5%) | 31 (0.3%) |
| $800 to $1,499 | 2,208 (26.0%) | 916 (8.3%) |
| $800 to $1,499 | 4,495 (52.9%) | 2,405 (21.9%) |
| Total | 8,495 (100.0%) | 10,978 (100.0%) |
Health & Disability in Marquette County
Health Insurance Coverage by Age in Marquette County
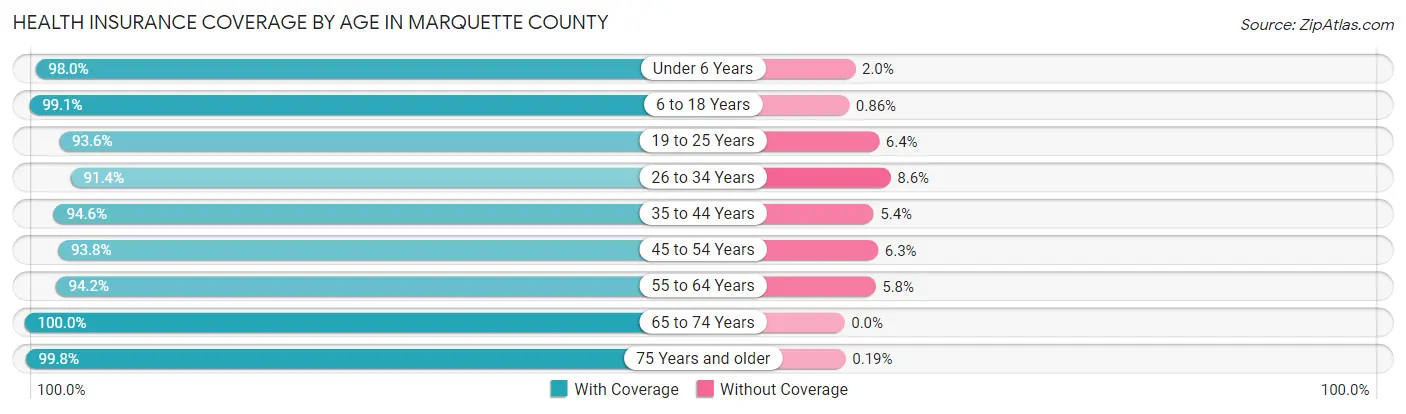
| Age Bracket | With Coverage | Without Coverage |
| Under 6 Years | 3,536 (98.0%) | 72 (2.0%) |
| 6 to 18 Years | 9,337 (99.1%) | 81 (0.9%) |
| 19 to 25 Years | 8,901 (93.6%) | 613 (6.4%) |
| 26 to 34 Years | 6,116 (91.4%) | 575 (8.6%) |
| 35 to 44 Years | 7,033 (94.6%) | 403 (5.4%) |
| 45 to 54 Years | 6,385 (93.8%) | 426 (6.2%) |
| 55 to 64 Years | 8,144 (94.2%) | 500 (5.8%) |
| 65 to 74 Years | 7,886 (100.0%) | 0 (0.0%) |
| 75 Years and older | 4,672 (99.8%) | 9 (0.2%) |
| Total | 62,010 (95.9%) | 2,679 (4.1%) |
Health Insurance Coverage by Citizenship Status in Marquette County
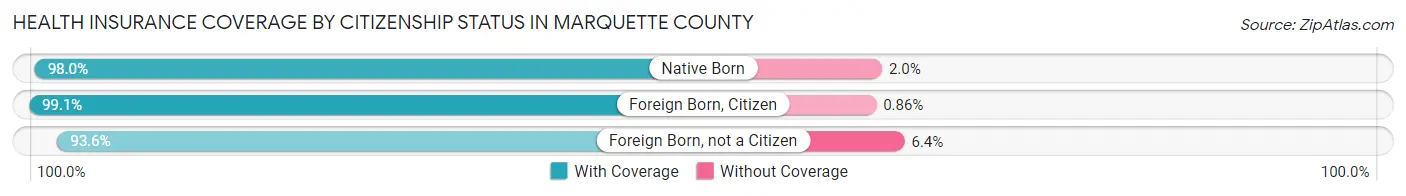
| Citizenship Status | With Coverage | Without Coverage |
| Native Born | 3,536 (98.0%) | 72 (2.0%) |
| Foreign Born, Citizen | 9,337 (99.1%) | 81 (0.9%) |
| Foreign Born, not a Citizen | 8,901 (93.6%) | 613 (6.4%) |
Health Insurance Coverage by Household Income in Marquette County
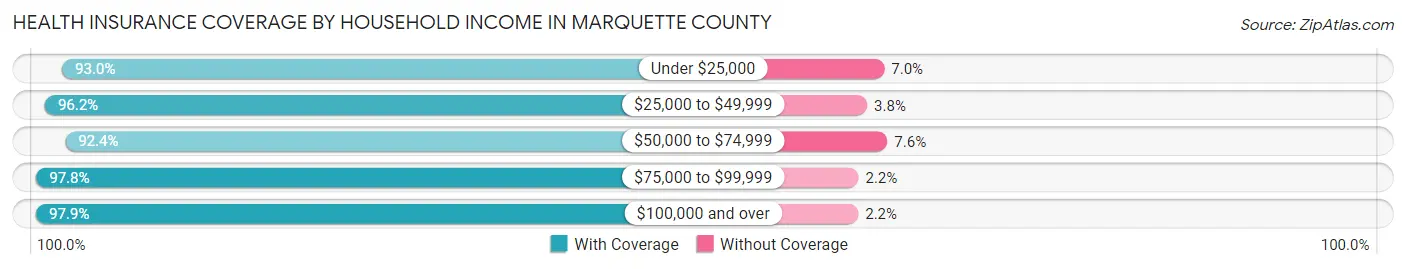
| Household Income | With Coverage | Without Coverage |
| Under $25,000 | 6,918 (93.0%) | 524 (7.0%) |
| $25,000 to $49,999 | 10,255 (96.2%) | 407 (3.8%) |
| $50,000 to $74,999 | 11,017 (92.4%) | 908 (7.6%) |
| $75,000 to $99,999 | 11,444 (97.8%) | 258 (2.2%) |
| $100,000 and over | 20,571 (97.9%) | 452 (2.1%) |
Public vs Private Health Insurance Coverage by Age in Marquette County
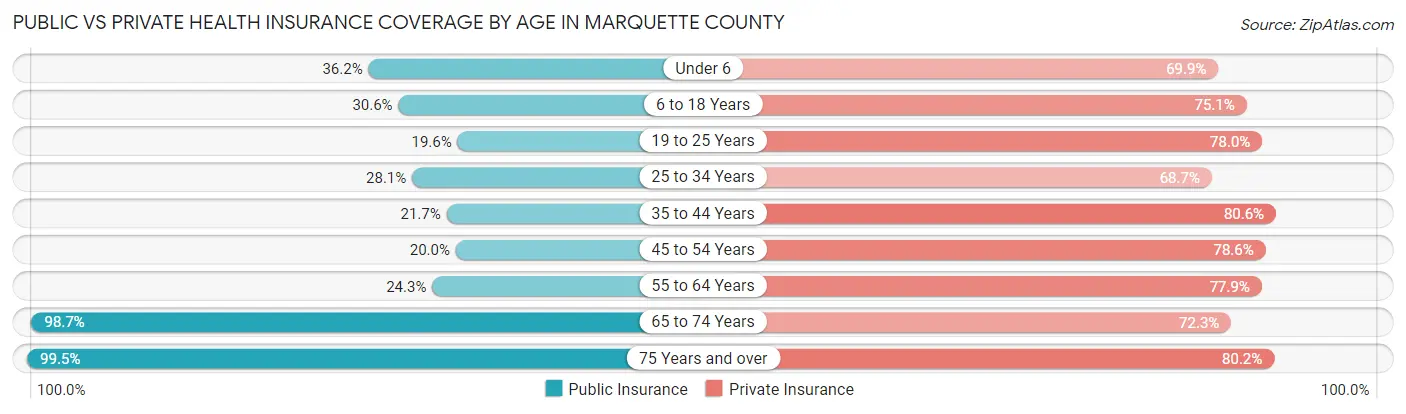
| Age Bracket | Public Insurance | Private Insurance |
| Under 6 | 1,305 (36.2%) | 2,521 (69.9%) |
| 6 to 18 Years | 2,883 (30.6%) | 7,077 (75.1%) |
| 19 to 25 Years | 1,869 (19.6%) | 7,423 (78.0%) |
| 25 to 34 Years | 1,878 (28.1%) | 4,594 (68.7%) |
| 35 to 44 Years | 1,612 (21.7%) | 5,992 (80.6%) |
| 45 to 54 Years | 1,360 (20.0%) | 5,356 (78.6%) |
| 55 to 64 Years | 2,104 (24.3%) | 6,736 (77.9%) |
| 65 to 74 Years | 7,786 (98.7%) | 5,699 (72.3%) |
| 75 Years and over | 4,659 (99.5%) | 3,756 (80.2%) |
| Total | 25,456 (39.4%) | 49,154 (76.0%) |
Disability Status by Sex by Age in Marquette County
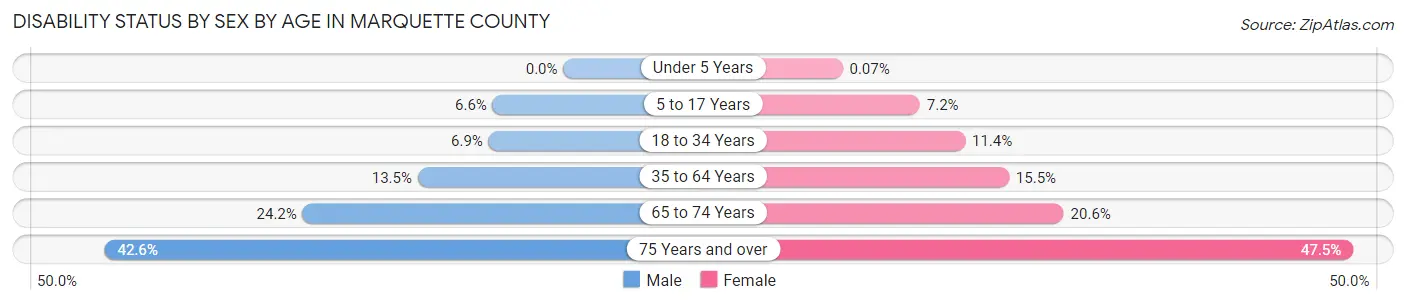
| Age Bracket | Male | Female |
| Under 5 Years | 0 (0.0%) | 1 (0.1%) |
| 5 to 17 Years | 297 (6.6%) | 304 (7.2%) |
| 18 to 34 Years | 603 (6.9%) | 1,007 (11.4%) |
| 35 to 64 Years | 1,571 (13.5%) | 1,747 (15.5%) |
| 65 to 74 Years | 974 (24.2%) | 795 (20.6%) |
| 75 Years and over | 893 (42.6%) | 1,226 (47.4%) |
Disability Class by Sex by Age in Marquette County
Disability Class: Hearing Difficulty
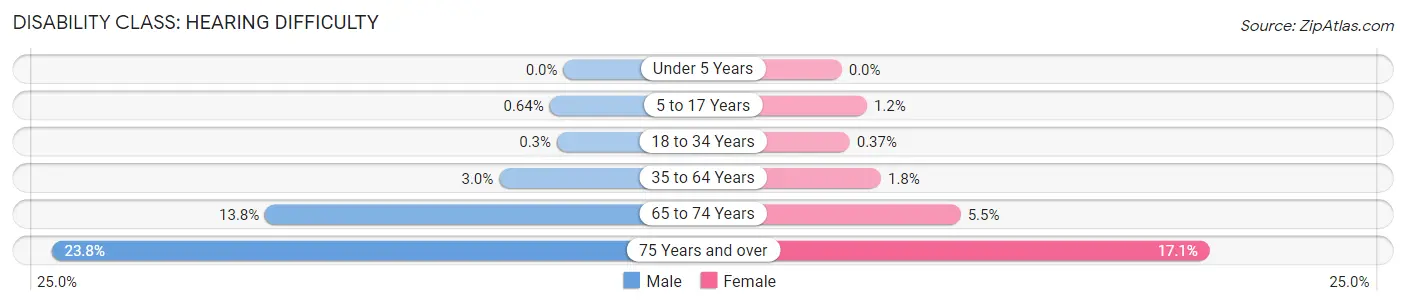
| Age Bracket | Male | Female |
| Under 5 Years | 0 (0.0%) | 0 (0.0%) |
| 5 to 17 Years | 29 (0.6%) | 49 (1.2%) |
| 18 to 34 Years | 26 (0.3%) | 33 (0.4%) |
| 35 to 64 Years | 347 (3.0%) | 205 (1.8%) |
| 65 to 74 Years | 557 (13.8%) | 213 (5.5%) |
| 75 Years and over | 498 (23.7%) | 441 (17.1%) |
Disability Class: Vision Difficulty
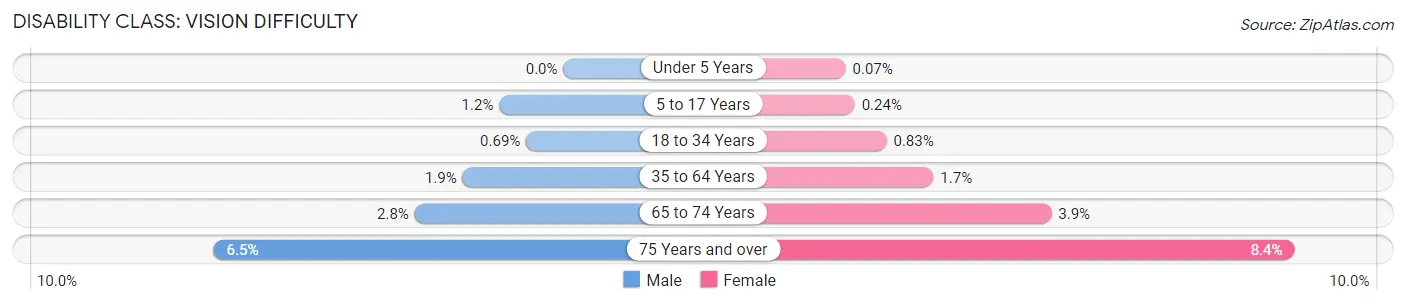
| Age Bracket | Male | Female |
| Under 5 Years | 0 (0.0%) | 1 (0.1%) |
| 5 to 17 Years | 54 (1.2%) | 10 (0.2%) |
| 18 to 34 Years | 60 (0.7%) | 73 (0.8%) |
| 35 to 64 Years | 217 (1.9%) | 192 (1.7%) |
| 65 to 74 Years | 111 (2.8%) | 150 (3.9%) |
| 75 Years and over | 136 (6.5%) | 217 (8.4%) |
Disability Class: Cognitive Difficulty
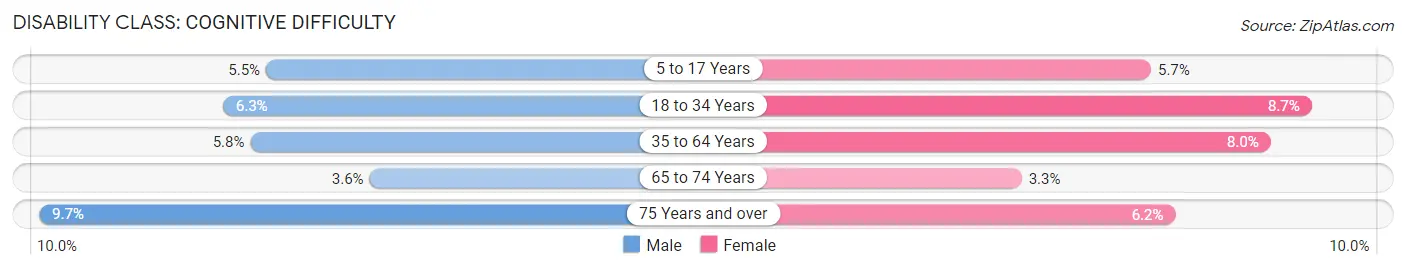
| Age Bracket | Male | Female |
| 5 to 17 Years | 250 (5.5%) | 241 (5.7%) |
| 18 to 34 Years | 550 (6.3%) | 768 (8.7%) |
| 35 to 64 Years | 675 (5.8%) | 897 (8.0%) |
| 65 to 74 Years | 145 (3.6%) | 129 (3.3%) |
| 75 Years and over | 204 (9.7%) | 160 (6.2%) |
Disability Class: Ambulatory Difficulty
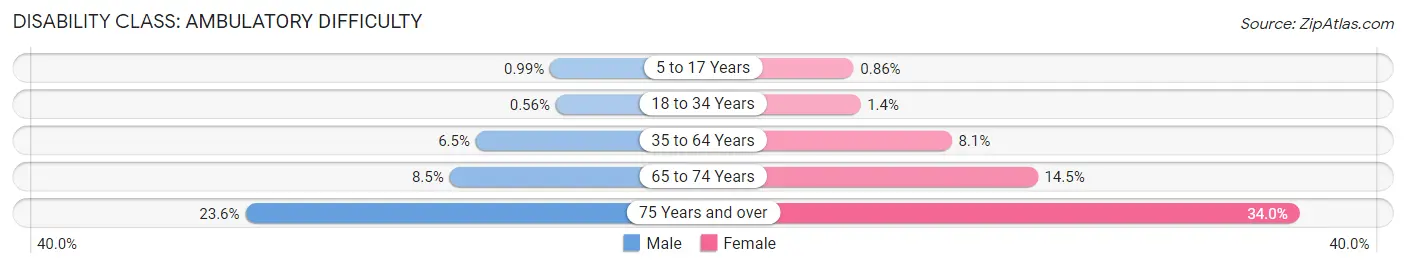
| Age Bracket | Male | Female |
| 5 to 17 Years | 45 (1.0%) | 36 (0.9%) |
| 18 to 34 Years | 49 (0.6%) | 121 (1.4%) |
| 35 to 64 Years | 756 (6.5%) | 917 (8.1%) |
| 65 to 74 Years | 340 (8.5%) | 561 (14.5%) |
| 75 Years and over | 495 (23.6%) | 878 (34.0%) |
Disability Class: Self-Care Difficulty
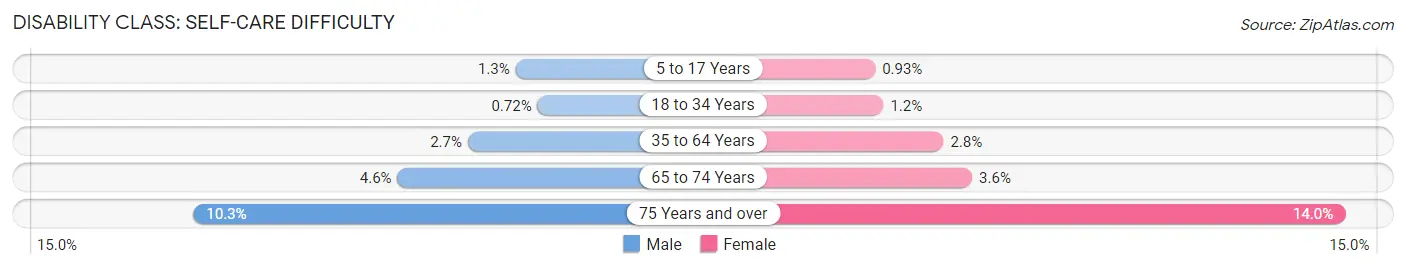
| Age Bracket | Male | Female |
| 5 to 17 Years | 60 (1.3%) | 39 (0.9%) |
| 18 to 34 Years | 63 (0.7%) | 102 (1.2%) |
| 35 to 64 Years | 309 (2.7%) | 319 (2.8%) |
| 65 to 74 Years | 186 (4.6%) | 140 (3.6%) |
| 75 Years and over | 216 (10.3%) | 362 (14.0%) |
Technology Access in Marquette County
Computing Device Access in Marquette County
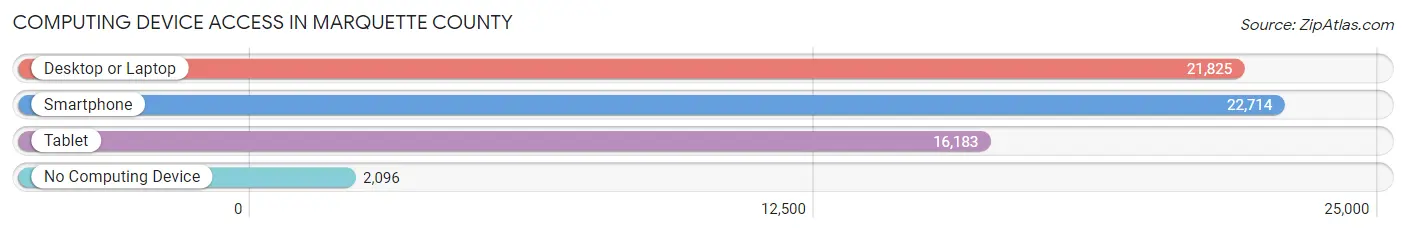
| Device Type | # Households | % Households |
| Desktop or Laptop | 21,825 | 79.8% |
| Smartphone | 22,714 | 83.1% |
| Tablet | 16,183 | 59.2% |
| No Computing Device | 2,096 | 7.7% |
| Total | 27,345 | 100.0% |
Internet Access in Marquette County
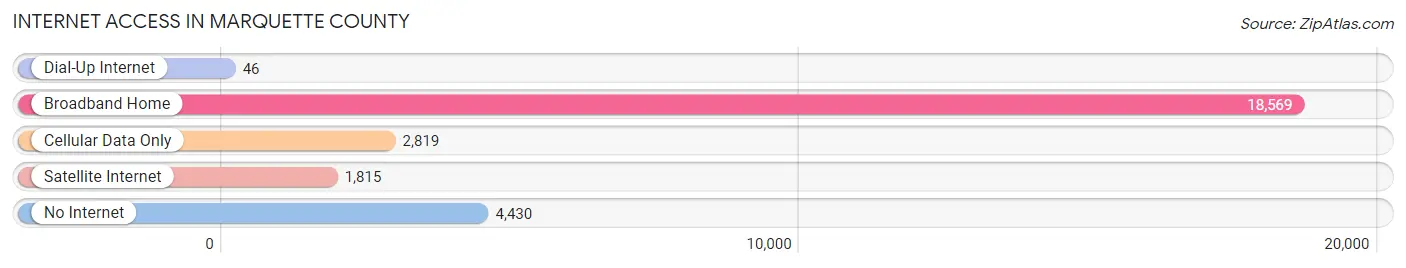
| Internet Type | # Households | % Households |
| Dial-Up Internet | 46 | 0.2% |
| Broadband Home | 18,569 | 67.9% |
| Cellular Data Only | 2,819 | 10.3% |
| Satellite Internet | 1,815 | 6.6% |
| No Internet | 4,430 | 16.2% |
| Total | 27,345 | 100.0% |
Marquette County Summary
Marquette County is located in the Upper Peninsula of Michigan, and is bordered by Lake Superior to the north, Alger County to the east, Baraga County to the south, and Iron County to the west. The county seat is Marquette, which is also the largest city in the county. The county was established in 1843 and named after Father Jacques Marquette, a French explorer who was the first European to explore the area.
Geography
Marquette County covers an area of 1,902 square miles, making it the largest county in Michigan. The terrain is mostly hilly and forested, with some areas of flat land along the shore of Lake Superior. The highest point in the county is Mount Arvon, which has an elevation of 1,979 feet. The county is home to several rivers, including the Dead River, the Escanaba River, and the Fox River. The county also contains several lakes, including Lake Michigamme, Lake Independence, and Lake Superior.
Climate
Marquette County has a humid continental climate, with cold winters and warm summers. The average annual temperature is around 40°F, with temperatures ranging from an average low of around 20°F in the winter to an average high of around 60°F in the summer. The average annual precipitation is around 30 inches, with most of the precipitation falling in the form of snow.
Demographics
As of the 2010 census, there were 67,077 people, 27,845 households, and 17,845 families living in Marquette County. The population density was 35.3 people per square mile. The racial makeup of the county was 94.2% White, 1.3% African American, 0.7% Native American, 0.9% Asian, 0.1% Pacific Islander, 1.2% from other races, and 1.6% from two or more races. Hispanic or Latino of any race were 3.2% of the population.
Economy
Marquette County's economy is largely based on tourism, manufacturing, and healthcare. The county is home to several tourist attractions, including the Marquette Maritime Museum, the Marquette Harbor Lighthouse, and the Presque Isle Park. The county is also home to several manufacturing companies, including the Cliffs Natural Resources iron ore mining company, the Eagle Mine, and the U.P. Paper Company. The healthcare industry is also a major employer in the county, with the Marquette General Hospital and the UP Health System being the largest employers.
Marquette County also has a large agricultural sector, with the county being home to several farms and orchards. The county is also home to several wineries, breweries, and distilleries.
Conclusion
Marquette County is a large county located in the Upper Peninsula of Michigan. The county is home to a diverse economy, with tourism, manufacturing, healthcare, and agriculture being the main industries. The county is also home to several tourist attractions, as well as several wineries, breweries, and distilleries. The county has a humid continental climate, with cold winters and warm summers. As of the 2010 census, the population of the county was 67,077.
Common Questions
What is the Total Population of Marquette County?
Total Population of Marquette County is 66,376.
What is the Total Male Population of Marquette County?
Total Male Population of Marquette County is 33,782.
What is the Total Female Population of Marquette County?
Total Female Population of Marquette County is 32,594.
What is the Ratio of Males per 100 Females in Marquette County?
There are 103.64 Males per 100 Females in Marquette County.
What is the Ratio of Females per 100 Males in Marquette County?
There are 96.48 Females per 100 Males in Marquette County.
What is the Median Population Age in Marquette County?
Median Population Age in Marquette County is 39.1 Years.
What is the Average Family Size in Marquette County
Average Family Size in Marquette County is 2.9 People.
What is the Average Household Size in Marquette County
Average Household Size in Marquette County is 2.3 People.
What is Per Capita Income in Marquette County?
Per Capita income in Marquette County is $32,711.
What is the Median Family Income in Marquette County?
Median Family Income in Marquette County is $82,182.
What is the Median Household income in Marquette County?
Median Household Income in Marquette County is $63,115.
What is Income or Wage Gap in Marquette County?
Income or Wage Gap in Marquette County is 40.1%.
Women in Marquette County earn 59.9 cents for every dollar earned by a man.
What is Family Income Deficit in Marquette County?
Family Income Deficit in Marquette County is $9,423.
Families that are below poverty line in Marquette County earn $9,423 less on average than the poverty threshold level.
What is Inequality or Gini Index in Marquette County?
Inequality or Gini Index in Marquette County is 0.41.
How Large is the Labor Force in Marquette County?
There are 33,040 People in the Labor Forcein in Marquette County.
What is the Percentage of People in the Labor Force in Marquette County?
59.2% of People are in the Labor Force in Marquette County.
What is the Unemployment Rate in Marquette County?
Unemployment Rate in Marquette County is 5.6%.