Luce County, MI
Luce County Map
Luce County Overview
5,442
TOTAL POPULATION
2,865
MALE POPULATION
2,577
FEMALE POPULATION
111.18
MALES / 100 FEMALES
89.95
FEMALES / 100 MALES
47.7
MEDIAN AGE
2.5
AVG FAMILY SIZE
2.1
AVG HOUSEHOLD SIZE
$23,599
PER CAPITA INCOME
$65,966
AVG FAMILY INCOME
$51,015
AVG HOUSEHOLD INCOME
14.5%
WAGE / INCOME GAP [ % ]
85.5¢/ $1
WAGE / INCOME GAP [ $ ]
$8,748
FAMILY INCOME DEFICIT
0.41
INEQUALITY / GINI INDEX
1,589
LABOR FORCE [ PEOPLE ]
34.9%
PERCENT IN LABOR FORCE
8.3%
UNEMPLOYMENT RATE
Luce County Area Codes
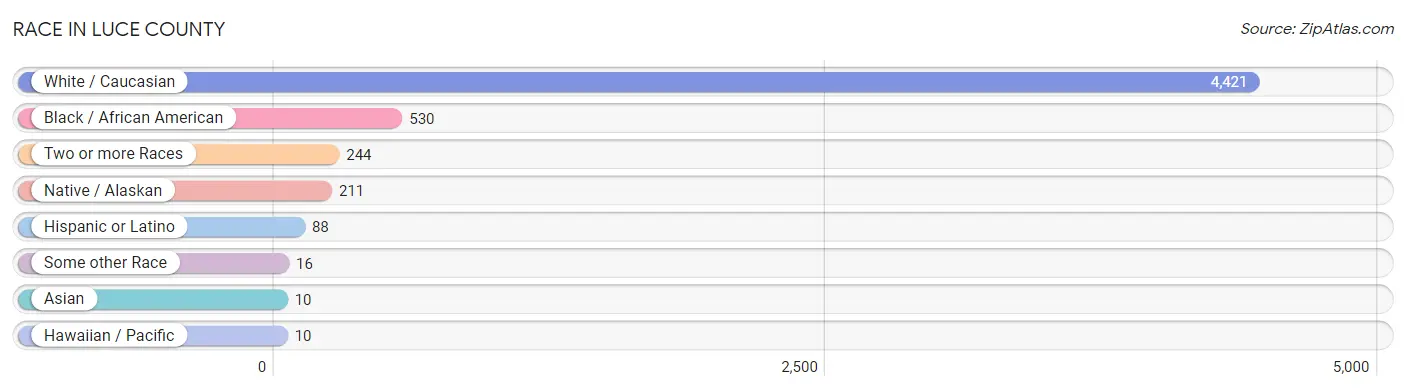
Race in Luce County
The most populous races in Luce County are White / Caucasian (4,421 | 81.2%), Black / African American (530 | 9.7%), and Two or more Races (244 | 4.5%).
| Race | # Population | % Population |
| Asian | 10 | 0.2% |
| Black / African American | 530 | 9.7% |
| Hawaiian / Pacific | 10 | 0.2% |
| Hispanic or Latino | 88 | 1.6% |
| Native / Alaskan | 211 | 3.9% |
| White / Caucasian | 4,421 | 81.2% |
| Two or more Races | 244 | 4.5% |
| Some other Race | 16 | 0.3% |
| Total | 5,442 | 100.0% |
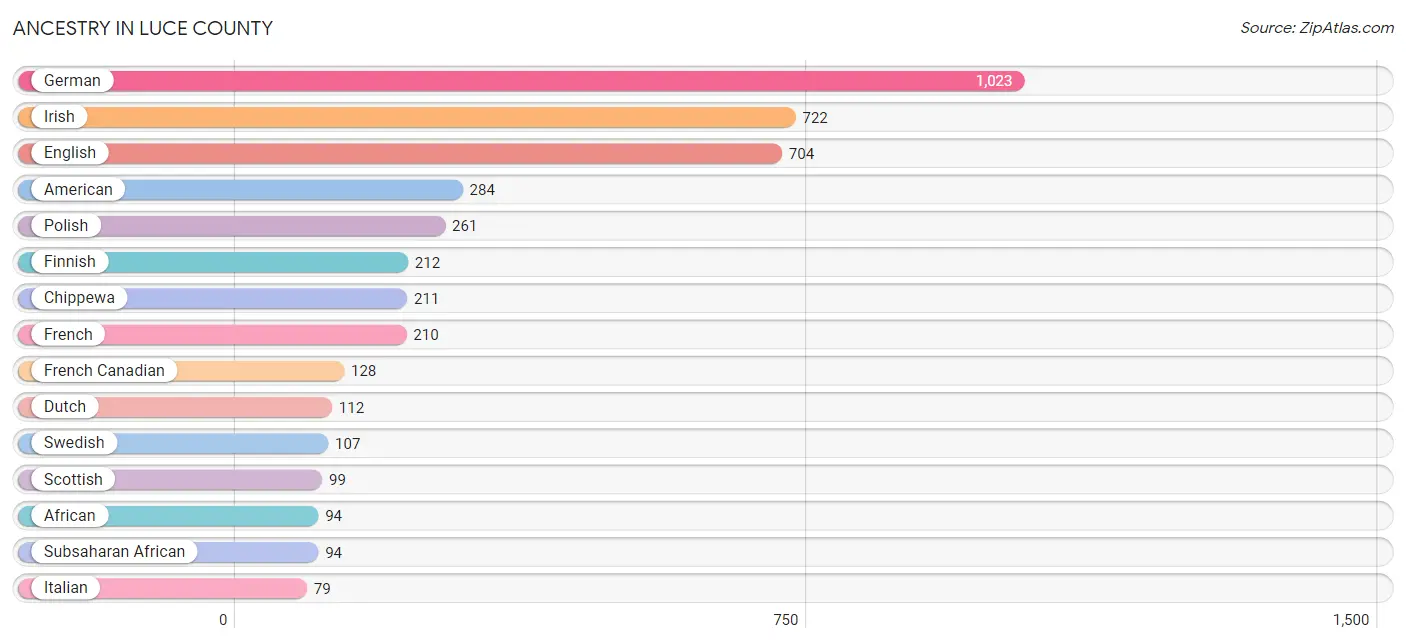
Ancestry in Luce County
The most populous ancestries reported in Luce County are German (1,023 | 18.8%), Irish (722 | 13.3%), English (704 | 12.9%), American (284 | 5.2%), and Polish (261 | 4.8%), together accounting for 55.0% of all Luce County residents.
| Ancestry | # Population | % Population |
| African | 94 | 1.7% |
| Alsatian | 1 | 0.0% |
| American | 284 | 5.2% |
| Arab | 22 | 0.4% |
| Austrian | 8 | 0.2% |
| Belgian | 5 | 0.1% |
| Bhutanese | 1 | 0.0% |
| Blackfeet | 6 | 0.1% |
| Cajun | 2 | 0.0% |
| Canadian | 16 | 0.3% |
| Cherokee | 11 | 0.2% |
| Chippewa | 211 | 3.9% |
| Croatian | 12 | 0.2% |
| Czech | 29 | 0.5% |
| Danish | 3 | 0.1% |
| Dutch | 112 | 2.1% |
| Eastern European | 6 | 0.1% |
| English | 704 | 12.9% |
| European | 24 | 0.4% |
| Finnish | 212 | 3.9% |
| French | 210 | 3.9% |
| French American Indian | 5 | 0.1% |
| French Canadian | 128 | 2.4% |
| German | 1,023 | 18.8% |
| Greek | 6 | 0.1% |
| Haitian | 4 | 0.1% |
| Hungarian | 11 | 0.2% |
| Indian (Asian) | 2 | 0.0% |
| Iranian | 9 | 0.2% |
| Irish | 722 | 13.3% |
| Italian | 79 | 1.5% |
| Korean | 5 | 0.1% |
| Lithuanian | 7 | 0.1% |
| Maltese | 31 | 0.6% |
| Mexican | 74 | 1.4% |
| Mexican American Indian | 11 | 0.2% |
| Moroccan | 22 | 0.4% |
| Norwegian | 61 | 1.1% |
| Ottawa | 11 | 0.2% |
| Pennsylvania German | 3 | 0.1% |
| Polish | 261 | 4.8% |
| Portuguese | 3 | 0.1% |
| Puerto Rican | 11 | 0.2% |
| Russian | 35 | 0.6% |
| Scandinavian | 34 | 0.6% |
| Scotch-Irish | 28 | 0.5% |
| Scottish | 99 | 1.8% |
| Sioux | 20 | 0.4% |
| Slovak | 1 | 0.0% |
| Spanish | 2 | 0.0% |
| Subsaharan African | 94 | 1.7% |
| Swedish | 107 | 2.0% |
| Swiss | 23 | 0.4% |
| Welsh | 44 | 0.8% | View All 54 Rows |
Immigrants in Luce County
The most numerous immigrant groups reported in Luce County came from Canada (9 | 0.2%), Asia (4 | 0.1%), Central America (4 | 0.1%), Eastern Europe (4 | 0.1%), and Europe (4 | 0.1%), together accounting for 0.4% of all Luce County residents.

| Immigration Origin | # Population | % Population |
| Asia | 4 | 0.1% |
| Canada | 9 | 0.2% |
| Central America | 4 | 0.1% |
| Eastern Asia | 1 | 0.0% |
| Eastern Europe | 4 | 0.1% |
| Europe | 4 | 0.1% |
| Japan | 1 | 0.0% |
| Latin America | 4 | 0.1% |
| Mexico | 4 | 0.1% |
| Philippines | 3 | 0.1% |
| Poland | 3 | 0.1% |
| Russia | 1 | 0.0% |
| South Eastern Asia | 3 | 0.1% | View All 13 Rows |
Sex and Age in Luce County
Sex and Age in Luce County
The most populous age groups in Luce County are 60 to 64 Years (240 | 8.4%) for men and 60 to 64 Years (262 | 10.2%) for women.

| Age Bracket | Male | Female |
| Under 5 Years | 146 (5.1%) | 120 (4.7%) |
| 5 to 9 Years | 108 (3.8%) | 154 (6.0%) |
| 10 to 14 Years | 195 (6.8%) | 114 (4.4%) |
| 15 to 19 Years | 165 (5.8%) | 107 (4.2%) |
| 20 to 24 Years | 69 (2.4%) | 139 (5.4%) |
| 25 to 29 Years | 174 (6.1%) | 137 (5.3%) |
| 30 to 34 Years | 156 (5.4%) | 126 (4.9%) |
| 35 to 39 Years | 225 (7.9%) | 130 (5.0%) |
| 40 to 44 Years | 210 (7.3%) | 128 (5.0%) |
| 45 to 49 Years | 103 (3.6%) | 143 (5.6%) |
| 50 to 54 Years | 154 (5.4%) | 149 (5.8%) |
| 55 to 59 Years | 222 (7.7%) | 164 (6.4%) |
| 60 to 64 Years | 240 (8.4%) | 262 (10.2%) |
| 65 to 69 Years | 230 (8.0%) | 217 (8.4%) |
| 70 to 74 Years | 187 (6.5%) | 148 (5.7%) |
| 75 to 79 Years | 169 (5.9%) | 183 (7.1%) |
| 80 to 84 Years | 64 (2.2%) | 87 (3.4%) |
| 85 Years and over | 48 (1.7%) | 69 (2.7%) |
| Total | 2,865 (100.0%) | 2,577 (100.0%) |
Families and Households in Luce County
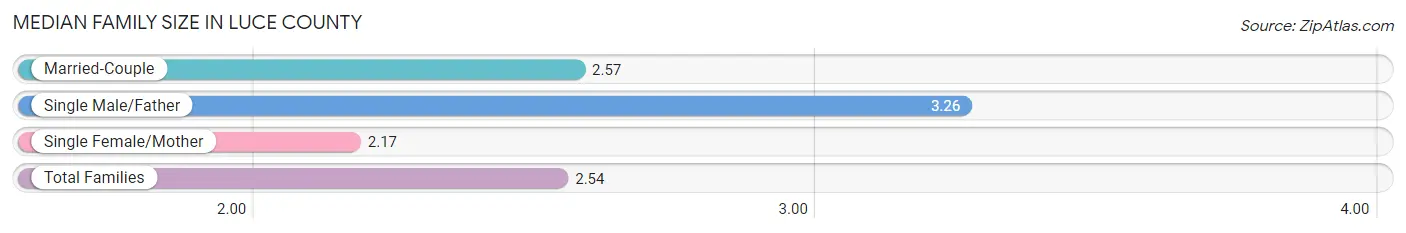
Median Family Size in Luce County
The median family size in Luce County is 2.54 persons per family, with single male/father families (58 | 4.3%) accounting for the largest median family size of 3.26 persons per family. On the other hand, single female/mother families (218 | 16.4%) represent the smallest median family size with 2.17 persons per family.
| Family Type | # Families | Family Size |
| Married-Couple | 1,057 (79.3%) | 2.57 |
| Single Male/Father | 58 (4.3%) | 3.26 |
| Single Female/Mother | 218 (16.4%) | 2.17 |
| Total Families | 1,333 (100.0%) | 2.54 |
Median Household Size in Luce County
The median household size in Luce County is 2.12 persons per household, with single male/father households (58 | 2.8%) accounting for the largest median household size of 4.38 persons per household. non-family households (732 | 35.4%) represent the smallest median household size with 1.23 persons per household.
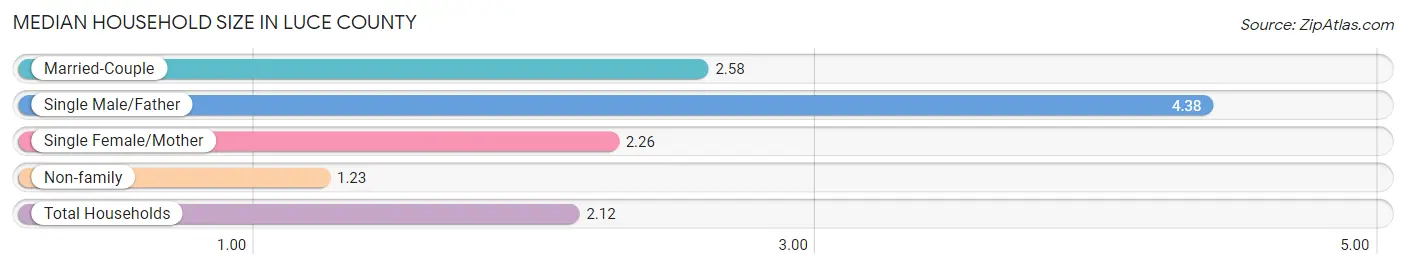
| Household Type | # Households | Household Size |
| Married-Couple | 1,057 (51.2%) | 2.58 |
| Single Male/Father | 58 (2.8%) | 4.38 |
| Single Female/Mother | 218 (10.6%) | 2.26 |
| Non-family | 732 (35.4%) | 1.23 |
| Total Households | 2,065 (100.0%) | 2.12 |
Household Size by Marriage Status in Luce County
Out of a total of 2,065 households in Luce County, 1,333 (64.5%) are family households, while 732 (35.4%) are nonfamily households. The most numerous type of family households are 2-person households, comprising 900, and the most common type of nonfamily households are 1-person households, comprising 609.
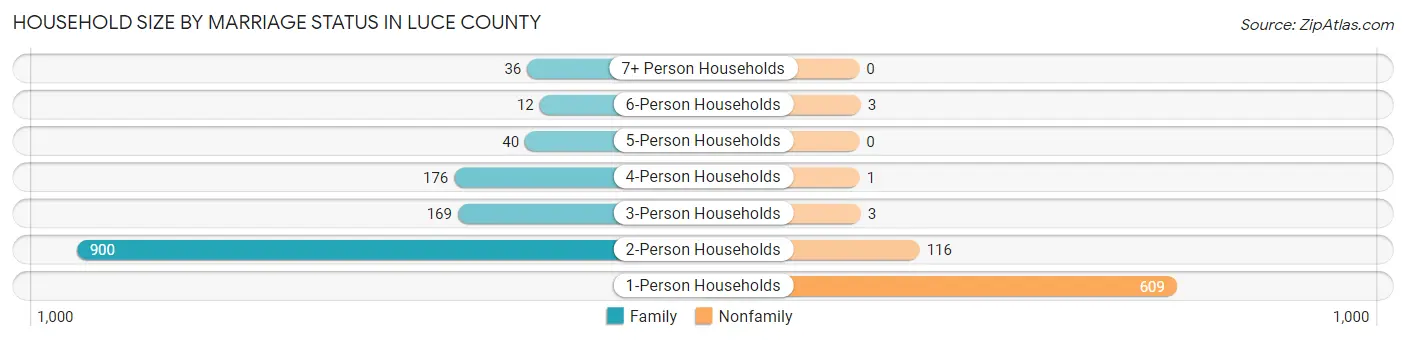
| Household Size | Family Households | Nonfamily Households |
| 1-Person Households | - | 609 (29.5%) |
| 2-Person Households | 900 (43.6%) | 116 (5.6%) |
| 3-Person Households | 169 (8.2%) | 3 (0.2%) |
| 4-Person Households | 176 (8.5%) | 1 (0.1%) |
| 5-Person Households | 40 (1.9%) | 0 (0.0%) |
| 6-Person Households | 12 (0.6%) | 3 (0.2%) |
| 7+ Person Households | 36 (1.7%) | 0 (0.0%) |
| Total | 1,333 (64.5%) | 732 (35.4%) |
Female Fertility in Luce County
Fertility by Age in Luce County
Average fertility rate in Luce County is 97.0 births per 1,000 women. Women in the age bracket of 20 to 34 years have the highest fertility rate with 219.0 births per 1,000 women. Women in the age bracket of 20 to 34 years acount for 95.7% of all women with births.

| Age Bracket | Women with Births | Births / 1,000 Women |
| 15 to 19 years | 3 (3.3%) | 28.0 |
| 20 to 34 years | 88 (95.7%) | 219.0 |
| 35 to 50 years | 1 (1.1%) | 2.0 |
| Total | 92 (100.0%) | 97.0 |
Fertility by Age by Marriage Status in Luce County
64.1% of women with births (92) in Luce County are married. The highest percentage of unmarried women with births falls into 35 to 50 years age bracket with 100.0% of them unmarried at the time of birth, while the lowest percentage of unmarried women with births belong to 15 to 19 years age bracket with 0.0% of them unmarried.
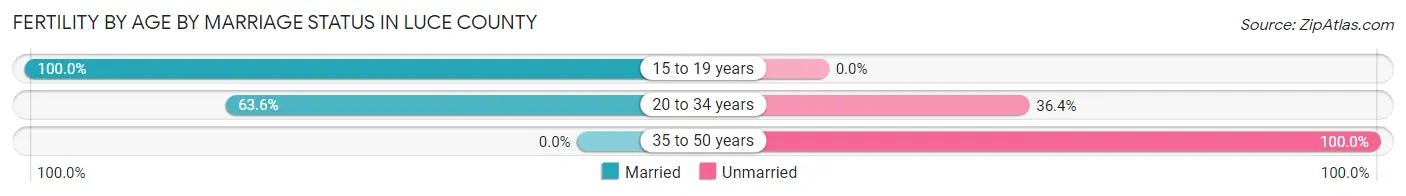
| Age Bracket | Married | Unmarried |
| 15 to 19 years | 3 (100.0%) | 0 (0.0%) |
| 20 to 34 years | 56 (63.6%) | 32 (36.4%) |
| 35 to 50 years | 0 (0.0%) | 1 (100.0%) |
| Total | 59 (64.1%) | 33 (35.9%) |
Fertility by Education in Luce County
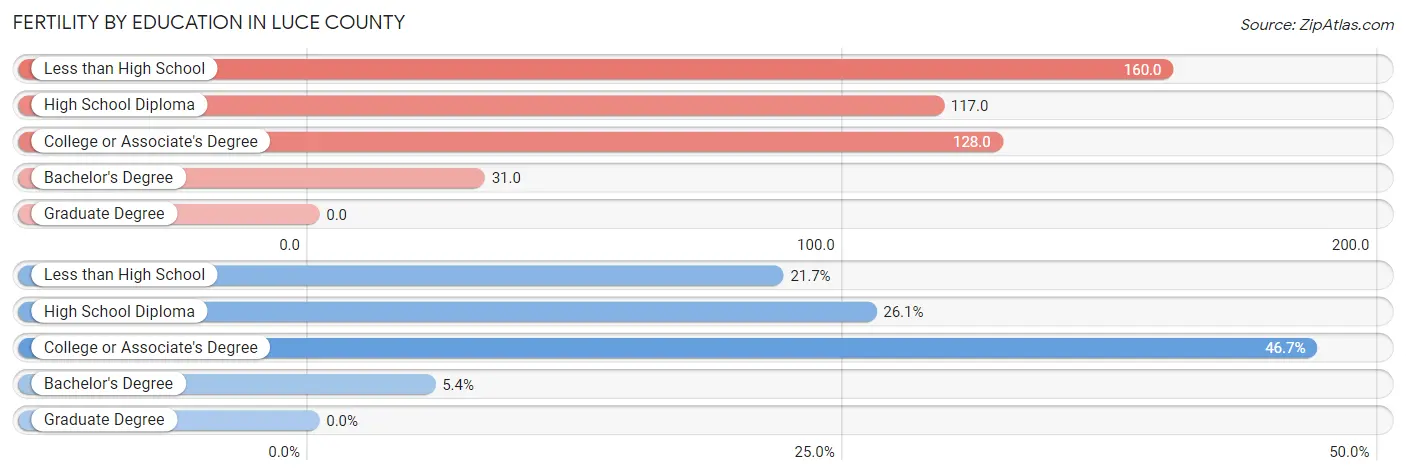
| Educational Attainment | Women with Births | Births / 1,000 Women |
| Less than High School | 20 (21.7%) | 160.0 |
| High School Diploma | 24 (26.1%) | 117.0 |
| College or Associate's Degree | 43 (46.7%) | 128.0 |
| Bachelor's Degree | 5 (5.4%) | 31.0 |
| Graduate Degree | 0 (0.0%) | 0.0 |
| Total | 92 (100.0%) | 97.0 |
Fertility by Education by Marriage Status in Luce County
35.9% of women with births in Luce County are unmarried. Women with the educational attainment of bachelor's degree are most likely to be married with 100.0% of them married at childbirth, while women with the educational attainment of high school diploma are least likely to be married with 100.0% of them unmarried at childbirth.

| Educational Attainment | Married | Unmarried |
| Less than High School | 19 (95.0%) | 1 (5.0%) |
| High School Diploma | 0 (0.0%) | 24 (100.0%) |
| College or Associate's Degree | 35 (81.4%) | 8 (18.6%) |
| Bachelor's Degree | 5 (100.0%) | 0 (0.0%) |
| Graduate Degree | 0 (0.0%) | 0 (0.0%) |
| Total | 59 (64.1%) | 33 (35.9%) |
Income in Luce County
Income Overview in Luce County
Per Capita Income in Luce County is $23,599, while median incomes of families and households are $65,966 and $51,015 respectively.
| Characteristic | Number | Measure |
| Per Capita Income | 5,442 | $23,599 |
| Median Family Income | 1,333 | $65,966 |
| Mean Family Income | 1,333 | $76,374 |
| Median Household Income | 2,065 | $51,015 |
| Mean Household Income | 2,065 | $63,279 |
| Income Deficit | 1,333 | $8,748 |
| Wage / Income Gap (%) | 5,442 | 14.54% |
| Wage / Income Gap ($) | 5,442 | 85.46¢ per $1 |
| Gini / Inequality Index | 5,442 | 0.41 |
Earnings by Sex in Luce County
Average Earnings in Luce County are $25,853, $23,152 for men and $27,091 for women, a difference of 14.5%.
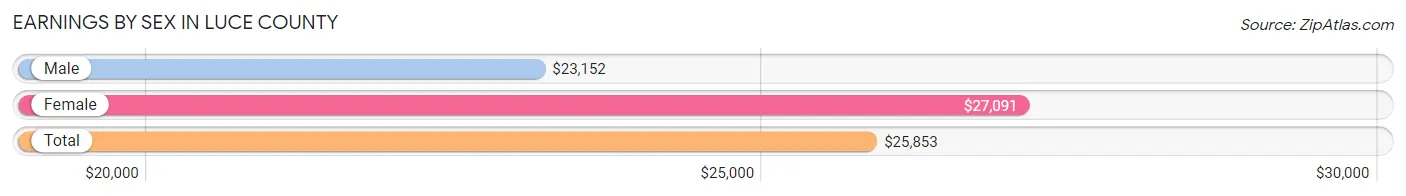
| Sex | Number | Average Earnings |
| Male | 910 (44.4%) | $23,152 |
| Female | 1,140 (55.6%) | $27,091 |
| Total | 2,050 (100.0%) | $25,853 |
Earnings by Sex by Income Bracket in Luce County
The most common earnings brackets in Luce County are $2,500 to $4,999 for men (122 | 13.4%) and $55,000 to $64,999 for women (131 | 11.5%).
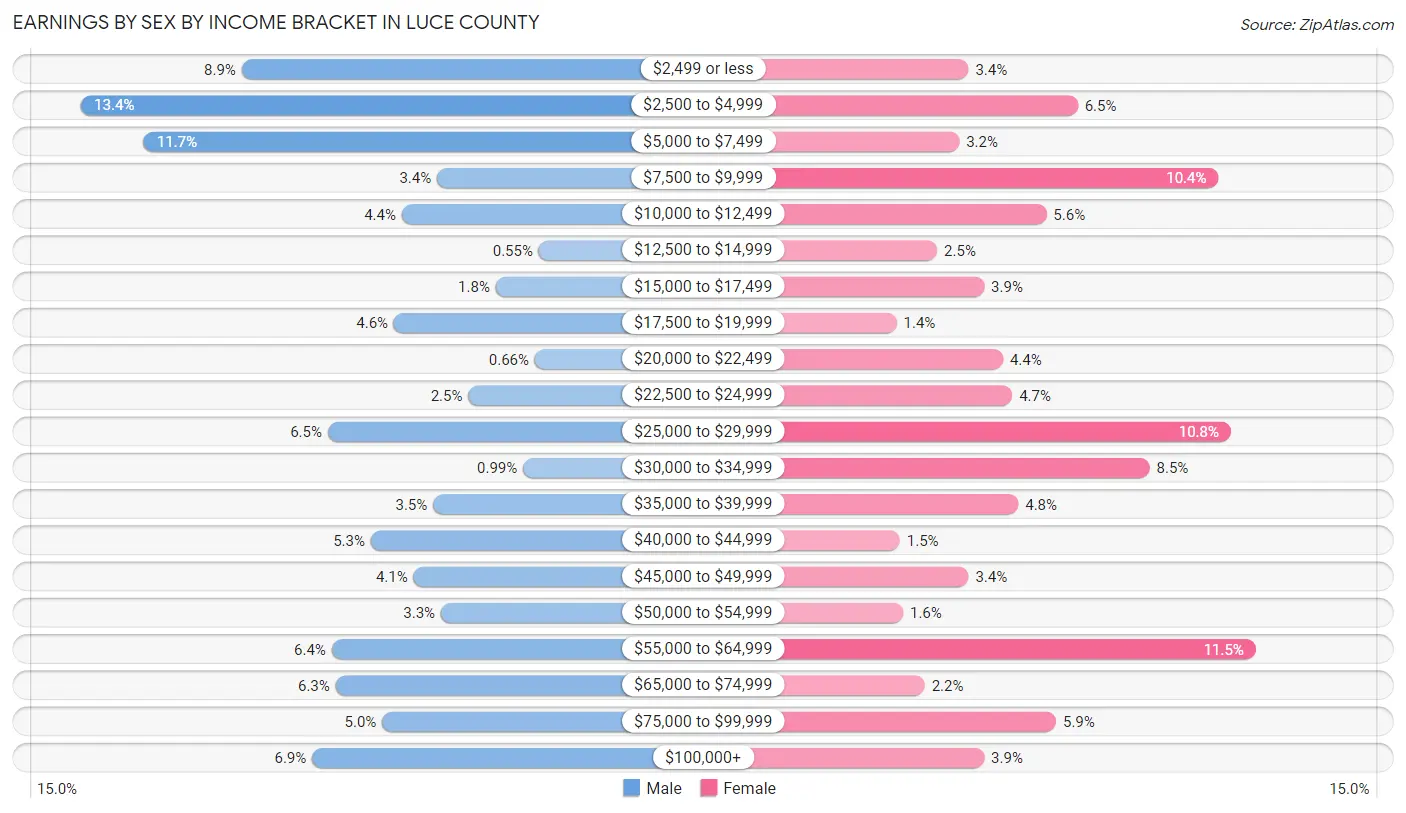
| Income | Male | Female |
| $2,499 or less | 81 (8.9%) | 39 (3.4%) |
| $2,500 to $4,999 | 122 (13.4%) | 74 (6.5%) |
| $5,000 to $7,499 | 106 (11.7%) | 36 (3.2%) |
| $7,500 to $9,999 | 31 (3.4%) | 119 (10.4%) |
| $10,000 to $12,499 | 40 (4.4%) | 64 (5.6%) |
| $12,500 to $14,999 | 5 (0.5%) | 29 (2.5%) |
| $15,000 to $17,499 | 16 (1.8%) | 44 (3.9%) |
| $17,500 to $19,999 | 42 (4.6%) | 16 (1.4%) |
| $20,000 to $22,499 | 6 (0.7%) | 50 (4.4%) |
| $22,500 to $24,999 | 23 (2.5%) | 53 (4.6%) |
| $25,000 to $29,999 | 59 (6.5%) | 123 (10.8%) |
| $30,000 to $34,999 | 9 (1.0%) | 97 (8.5%) |
| $35,000 to $39,999 | 32 (3.5%) | 55 (4.8%) |
| $40,000 to $44,999 | 48 (5.3%) | 17 (1.5%) |
| $45,000 to $49,999 | 37 (4.1%) | 39 (3.4%) |
| $50,000 to $54,999 | 30 (3.3%) | 18 (1.6%) |
| $55,000 to $64,999 | 58 (6.4%) | 131 (11.5%) |
| $65,000 to $74,999 | 57 (6.3%) | 25 (2.2%) |
| $75,000 to $99,999 | 45 (5.0%) | 67 (5.9%) |
| $100,000+ | 63 (6.9%) | 44 (3.9%) |
| Total | 910 (100.0%) | 1,140 (100.0%) |
Earnings by Sex by Educational Attainment in Luce County
Average earnings in Luce County are $27,455 for men and $30,531 for women, a difference of 10.1%. Men with an educational attainment of graduate degree enjoy the highest average annual earnings of $65,625, while those with high school diploma education earn the least with $24,583. Women with an educational attainment of graduate degree earn the most with the average annual earnings of $56,619, while those with less than high school education have the smallest earnings of $9,609.
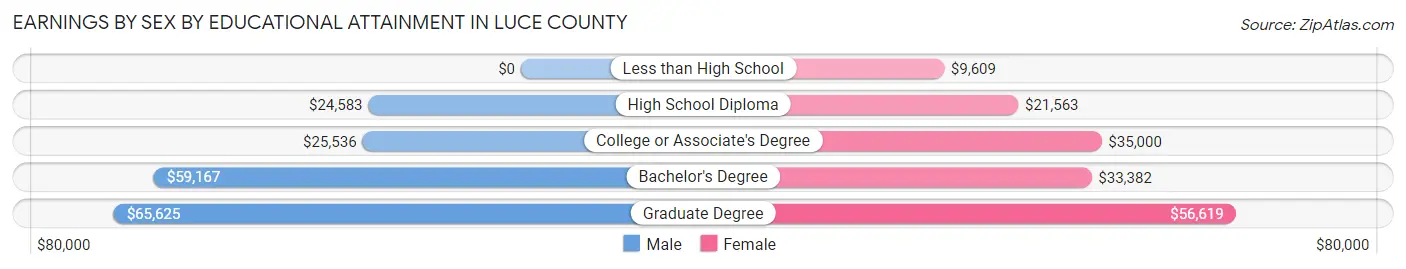
| Educational Attainment | Male Income | Female Income |
| Less than High School | - | - |
| High School Diploma | $24,583 | $21,563 |
| College or Associate's Degree | $25,536 | $35,000 |
| Bachelor's Degree | $59,167 | $33,382 |
| Graduate Degree | $65,625 | $56,619 |
| Total | $27,455 | $30,531 |
Family Income in Luce County
Family Income Brackets in Luce County
According to the Luce County family income data, there are 287 families falling into the $75,000 to $99,999 income range, which is the most common income bracket and makes up 21.5% of all families. Conversely, the $10,000 to $14,999 income bracket is the least frequent group with only 27 families (2.0%) belonging to this category.
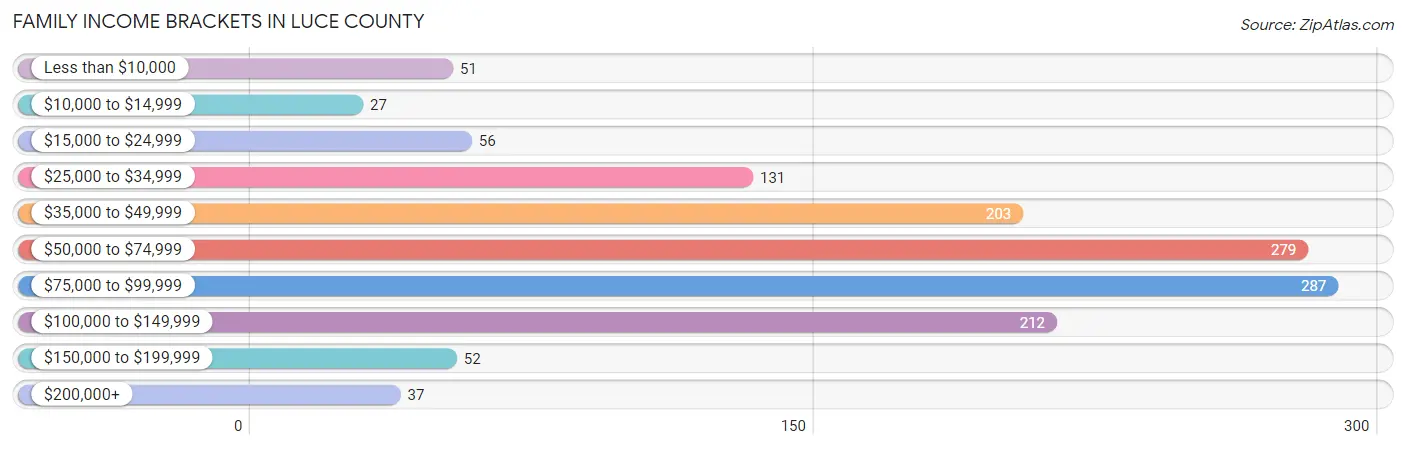
| Income Bracket | # Families | % Families |
| Less than $10,000 | 51 | 3.8% |
| $10,000 to $14,999 | 27 | 2.0% |
| $15,000 to $24,999 | 56 | 4.2% |
| $25,000 to $34,999 | 131 | 9.8% |
| $35,000 to $49,999 | 203 | 15.2% |
| $50,000 to $74,999 | 279 | 20.9% |
| $75,000 to $99,999 | 287 | 21.5% |
| $100,000 to $149,999 | 212 | 15.9% |
| $150,000 to $199,999 | 52 | 3.9% |
| $200,000+ | 37 | 2.8% |
Family Income by Famaliy Size in Luce County
3-person families (164 | 12.3%) account for the highest median family income in Luce County with $87,283 per family, while 2-person families (937 | 70.3%) have the highest median income of $31,875 per family member.

| Income Bracket | # Families | Median Income |
| 2-Person Families | 937 (70.3%) | $63,750 |
| 3-Person Families | 164 (12.3%) | $87,283 |
| 4-Person Families | 157 (11.8%) | $76,250 |
| 5-Person Families | 31 (2.3%) | $50,938 |
| 6-Person Families | 8 (0.6%) | $0 |
| 7+ Person Families | 36 (2.7%) | $47,031 |
| Total | 1,333 (100.0%) | $65,966 |
Family Income by Number of Earners in Luce County
The median family income in Luce County is $65,966, with families comprising 3+ earners (92) having the highest median family income of $135,313, while families with no earners (431) have the lowest median family income of $51,595, accounting for 6.9% and 32.3% of families, respectively.
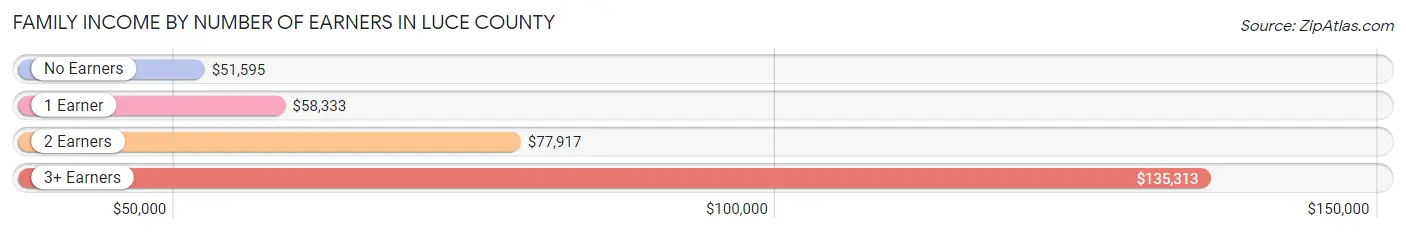
| Number of Earners | # Families | Median Income |
| No Earners | 431 (32.3%) | $51,595 |
| 1 Earner | 384 (28.8%) | $58,333 |
| 2 Earners | 426 (32.0%) | $77,917 |
| 3+ Earners | 92 (6.9%) | $135,313 |
| Total | 1,333 (100.0%) | $65,966 |
Household Income in Luce County
Household Income Brackets in Luce County
With 388 households falling in the category, the $50,000 to $74,999 income range is the most frequent in Luce County, accounting for 18.8% of all households. In contrast, only 37 households (1.8%) fall into the $200,000+ income bracket, making it the least populous group.
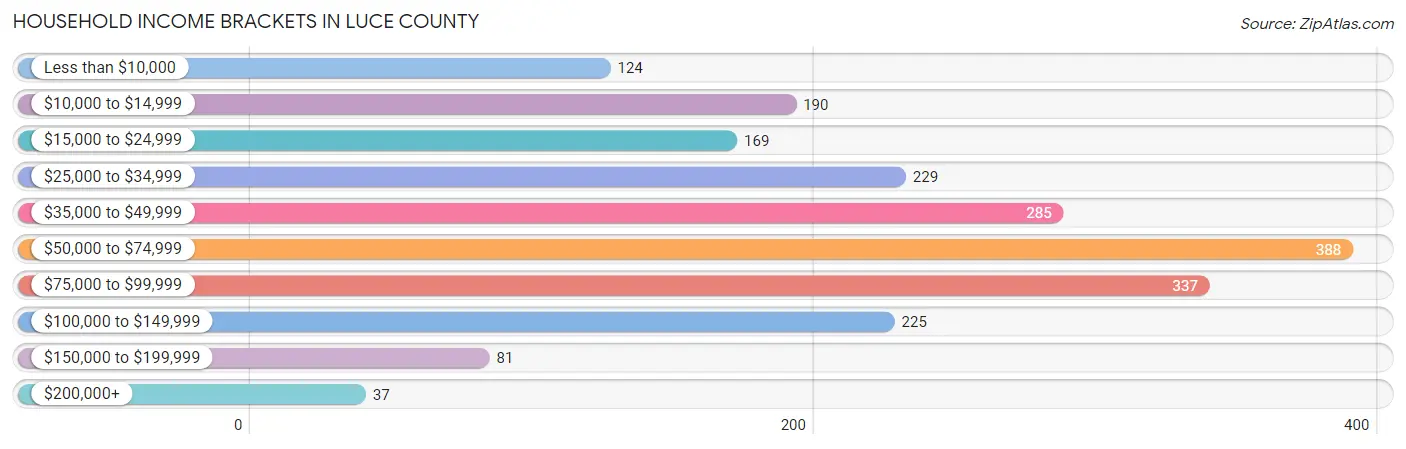
| Income Bracket | # Households | % Households |
| Less than $10,000 | 124 | 6.0% |
| $10,000 to $14,999 | 190 | 9.2% |
| $15,000 to $24,999 | 169 | 8.2% |
| $25,000 to $34,999 | 229 | 11.1% |
| $35,000 to $49,999 | 285 | 13.8% |
| $50,000 to $74,999 | 388 | 18.8% |
| $75,000 to $99,999 | 337 | 16.3% |
| $100,000 to $149,999 | 225 | 10.9% |
| $150,000 to $199,999 | 81 | 3.9% |
| $200,000+ | 37 | 1.8% |
Household Income by Householder Age in Luce County
The median household income in Luce County is $51,015, with the highest median household income of $76,750 found in the 25 to 44 years age bracket for the primary householder. A total of 361 households (17.5%) fall into this category. Meanwhile, the 15 to 24 years age bracket for the primary householder has the lowest median household income of $32,863, with 103 households (5.0%) in this group.

| Income Bracket | # Households | Median Income |
| 15 to 24 Years | 103 (5.0%) | $32,863 |
| 25 to 44 Years | 361 (17.5%) | $76,750 |
| 45 to 64 Years | 777 (37.6%) | $51,595 |
| 65+ Years | 824 (39.9%) | $45,341 |
| Total | 2,065 (100.0%) | $51,015 |
Poverty in Luce County
Income Below Poverty by Sex and Age in Luce County
With 19.9% poverty level for males and 17.1% for females among the residents of Luce County, 15 year old males and 12 to 14 year old females are the most vulnerable to poverty, with 17 males (73.9%) and 32 females (64.0%) in their respective age groups living below the poverty level.
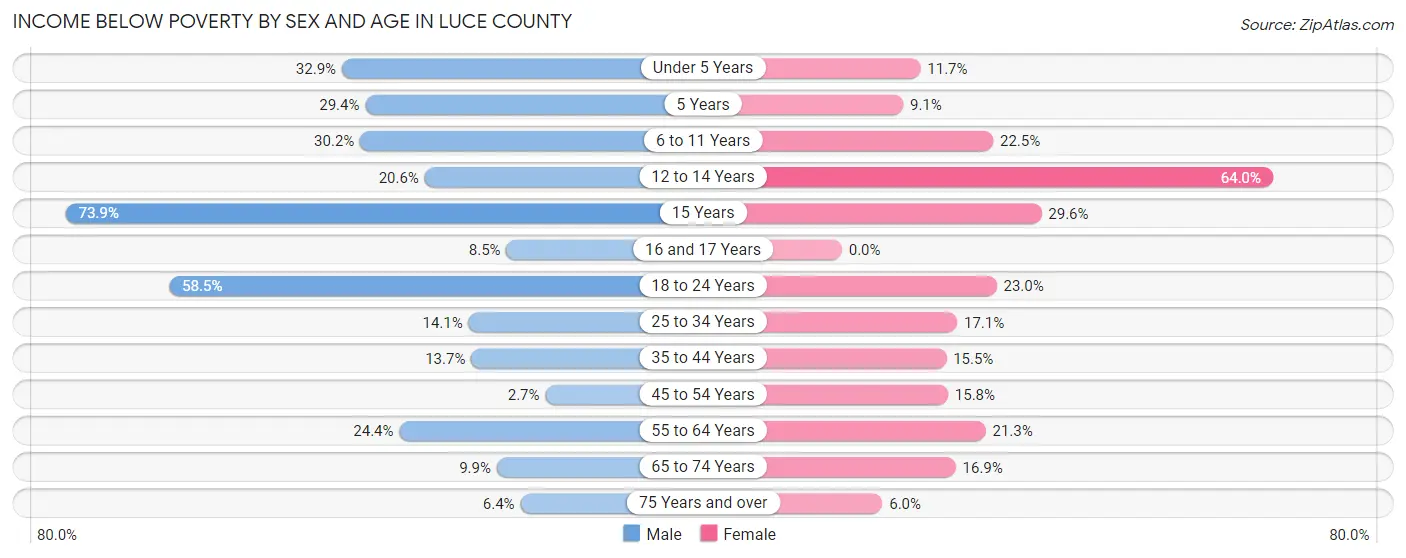
| Age Bracket | Male | Female |
| Under 5 Years | 48 (32.9%) | 14 (11.7%) |
| 5 Years | 5 (29.4%) | 2 (9.1%) |
| 6 to 11 Years | 54 (30.2%) | 42 (22.5%) |
| 12 to 14 Years | 21 (20.6%) | 32 (64.0%) |
| 15 Years | 17 (73.9%) | 8 (29.6%) |
| 16 and 17 Years | 6 (8.5%) | 0 (0.0%) |
| 18 to 24 Years | 48 (58.5%) | 37 (23.0%) |
| 25 to 34 Years | 10 (14.1%) | 45 (17.1%) |
| 35 to 44 Years | 13 (13.7%) | 40 (15.5%) |
| 45 to 54 Years | 2 (2.7%) | 46 (15.8%) |
| 55 to 64 Years | 94 (24.3%) | 89 (21.3%) |
| 65 to 74 Years | 34 (9.9%) | 60 (16.9%) |
| 75 Years and over | 17 (6.4%) | 20 (6.0%) |
| Total | 369 (19.9%) | 435 (17.1%) |
Income Above Poverty by Sex and Age in Luce County
According to the poverty statistics in Luce County, males aged 45 to 54 years and females aged 16 and 17 years are the age groups that are most secure financially, with 97.3% of males and 100.0% of females in these age groups living above the poverty line.
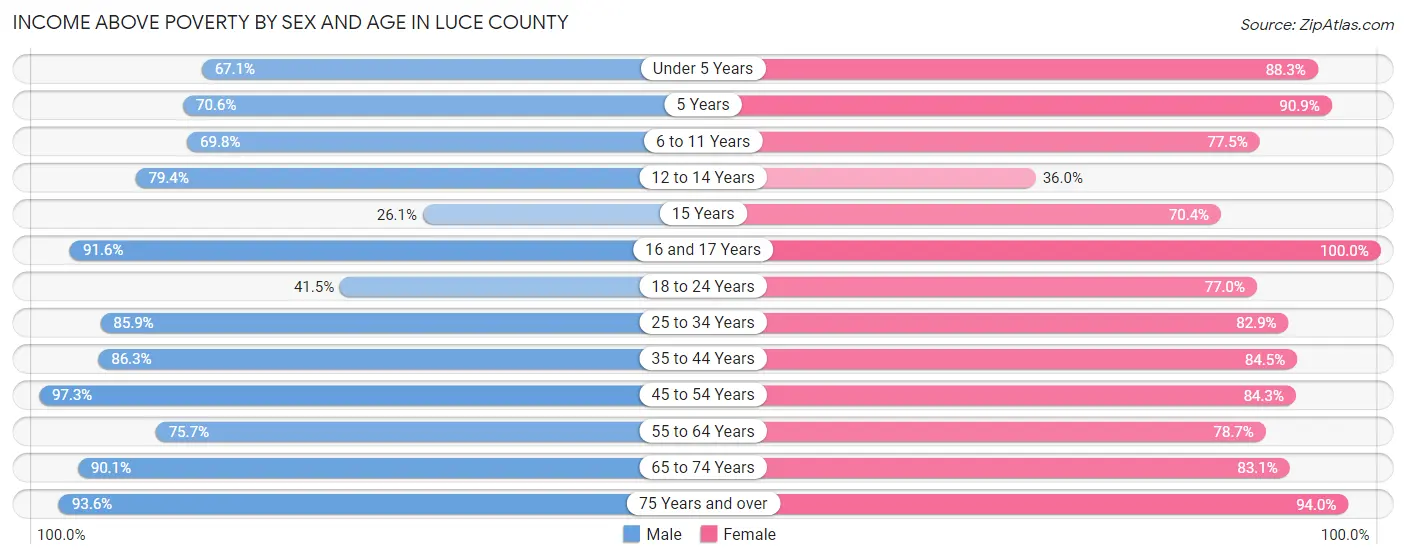
| Age Bracket | Male | Female |
| Under 5 Years | 98 (67.1%) | 106 (88.3%) |
| 5 Years | 12 (70.6%) | 20 (90.9%) |
| 6 to 11 Years | 125 (69.8%) | 145 (77.5%) |
| 12 to 14 Years | 81 (79.4%) | 18 (36.0%) |
| 15 Years | 6 (26.1%) | 19 (70.4%) |
| 16 and 17 Years | 65 (91.5%) | 58 (100.0%) |
| 18 to 24 Years | 34 (41.5%) | 124 (77.0%) |
| 25 to 34 Years | 61 (85.9%) | 218 (82.9%) |
| 35 to 44 Years | 82 (86.3%) | 218 (84.5%) |
| 45 to 54 Years | 73 (97.3%) | 246 (84.3%) |
| 55 to 64 Years | 292 (75.6%) | 328 (78.7%) |
| 65 to 74 Years | 310 (90.1%) | 295 (83.1%) |
| 75 Years and over | 250 (93.6%) | 313 (94.0%) |
| Total | 1,489 (80.1%) | 2,108 (82.9%) |
Income Below Poverty Among Married-Couple Families in Luce County
The poverty statistics for married-couple families in Luce County show that 5.9% or 62 of the total 1,057 families live below the poverty line. Families with 3 or 4 children have the highest poverty rate of 25.0%, comprising of 10 families. On the other hand, families with 5 or more children have the lowest poverty rate of 0.0%, which includes 0 families.
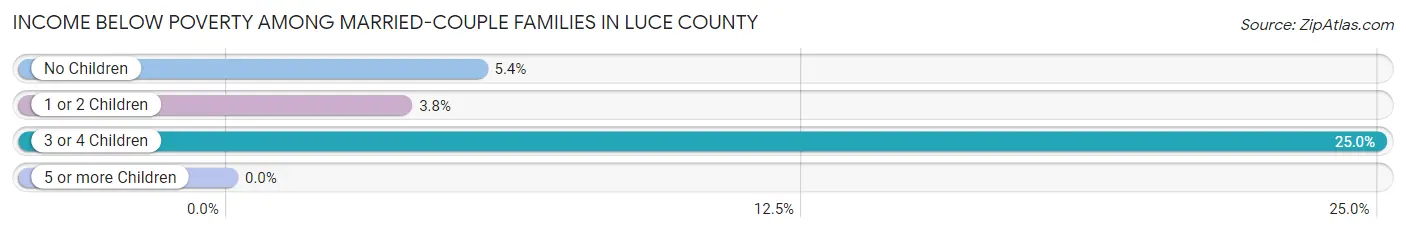
| Children | Above Poverty | Below Poverty |
| No Children | 819 (94.6%) | 47 (5.4%) |
| 1 or 2 Children | 127 (96.2%) | 5 (3.8%) |
| 3 or 4 Children | 30 (75.0%) | 10 (25.0%) |
| 5 or more Children | 19 (100.0%) | 0 (0.0%) |
| Total | 995 (94.1%) | 62 (5.9%) |
Income Below Poverty Among Single-Parent Households in Luce County
According to the poverty data in Luce County, 8.6% or 5 single-father households and 28.9% or 63 single-mother households are living below the poverty line. Among single-father households, those with 3 or 4 children have the highest poverty rate, with 3 households (75.0%) experiencing poverty. Likewise, among single-mother households, those with 5 or more children have the highest poverty rate, with 5 households (100.0%) falling below the poverty line.

| Children | Single Father | Single Mother |
| No Children | 1 (3.1%) | 10 (10.3%) |
| 1 or 2 Children | 1 (4.5%) | 31 (31.6%) |
| 3 or 4 Children | 3 (75.0%) | 17 (94.4%) |
| 5 or more Children | 0 (0.0%) | 5 (100.0%) |
| Total | 5 (8.6%) | 63 (28.9%) |
Income Below Poverty Among Married-Couple vs Single-Parent Households in Luce County
The poverty data for Luce County shows that 62 of the married-couple family households (5.9%) and 68 of the single-parent households (24.6%) are living below the poverty level. Within the married-couple family households, those with 3 or 4 children have the highest poverty rate, with 10 households (25.0%) falling below the poverty line. Among the single-parent households, those with 5 or more children have the highest poverty rate, with 5 household (100.0%) living below poverty.
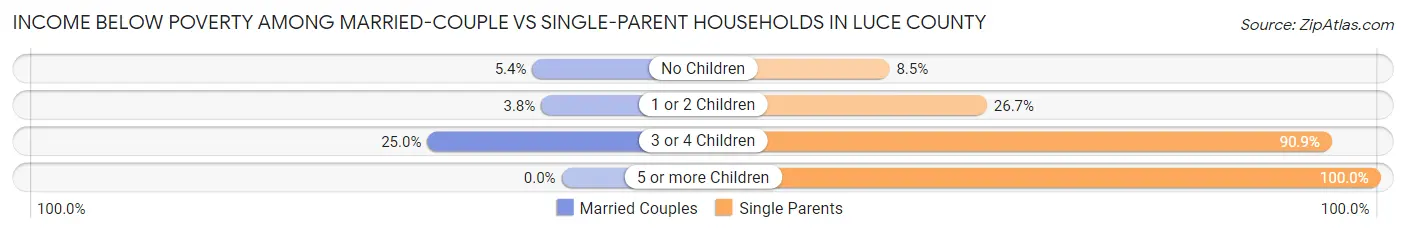
| Children | Married-Couple Families | Single-Parent Households |
| No Children | 47 (5.4%) | 11 (8.5%) |
| 1 or 2 Children | 5 (3.8%) | 32 (26.7%) |
| 3 or 4 Children | 10 (25.0%) | 20 (90.9%) |
| 5 or more Children | 0 (0.0%) | 5 (100.0%) |
| Total | 62 (5.9%) | 68 (24.6%) |
Employment Characteristics in Luce County
Employment by Class of Employer in Luce County
Among the 1,417 employed individuals in Luce County, private company employees (839 | 59.2%), not-for-profit organizations (163 | 11.5%), and local government employees (143 | 10.1%) make up the most common classes of employment.
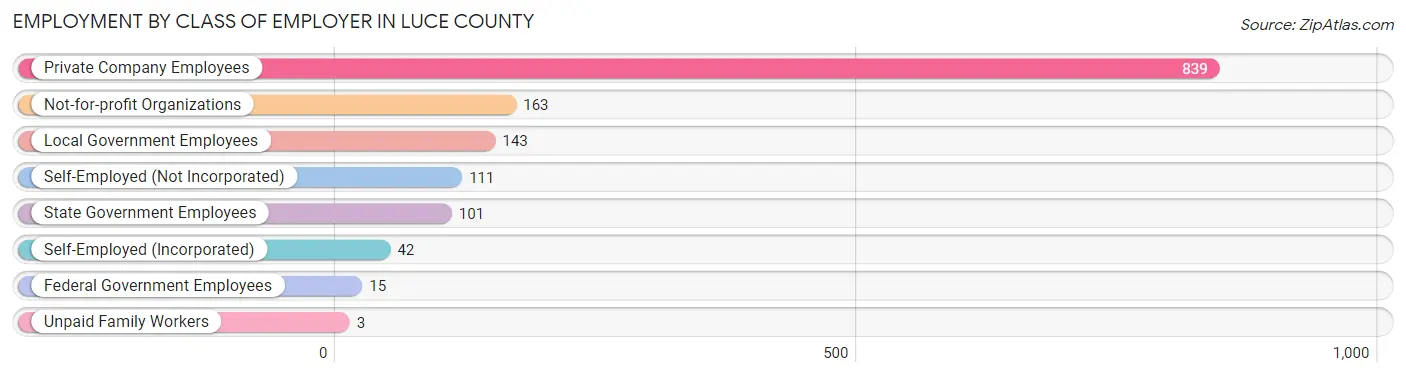
| Employer Class | # Employees | % Employees |
| Private Company Employees | 839 | 59.2% |
| Self-Employed (Incorporated) | 42 | 3.0% |
| Self-Employed (Not Incorporated) | 111 | 7.8% |
| Not-for-profit Organizations | 163 | 11.5% |
| Local Government Employees | 143 | 10.1% |
| State Government Employees | 101 | 7.1% |
| Federal Government Employees | 15 | 1.1% |
| Unpaid Family Workers | 3 | 0.2% |
| Total | 1,417 | 100.0% |
Employment Status by Age in Luce County
According to the labor force statistics for Luce County, out of the total population over 16 years of age (4,554), 34.9% or 1,589 individuals are in the labor force, with 8.3% or 132 of them unemployed. The age group with the highest labor force participation rate is 16 to 19 years, with 73.8% or 163 individuals in the labor force. Within the labor force, the 20 to 24 years age range has the highest percentage of unemployed individuals, with 28.7% or 43 of them being unemployed.

| Age Bracket | In Labor Force | Unemployed |
| 16 to 19 Years | 163 (73.8%) | 32 (19.6%) |
| 20 to 24 Years | 150 (72.1%) | 43 (28.7%) |
| 25 to 29 Years | 141 (45.3%) | 1 (0.7%) |
| 30 to 34 Years | 143 (50.7%) | 6 (4.2%) |
| 35 to 44 Years | 253 (36.5%) | 6 (2.4%) |
| 45 to 54 Years | 283 (51.5%) | 1 (0.4%) |
| 55 to 59 Years | 197 (51.0%) | 37 (18.8%) |
| 60 to 64 Years | 152 (30.3%) | 2 (1.3%) |
| 65 to 74 Years | 80 (10.2%) | 4 (5.0%) |
| 75 Years and over | 29 (4.7%) | 0 (0.0%) |
| Total | 1,589 (34.9%) | 132 (8.3%) |
Employment Status by Educational Attainment in Luce County
According to labor force statistics for Luce County, 42.9% of individuals (1,168) out of the total population between 25 and 64 years of age (2,723) are in the labor force, with 4.5% or 53 of them being unemployed. The group with the highest labor force participation rate are those with the educational attainment of bachelor's degree or higher, with 80.0% or 341 individuals in the labor force. Within the labor force, individuals with high school diploma education have the highest percentage of unemployment, with 11.7% or 41 of them being unemployed.
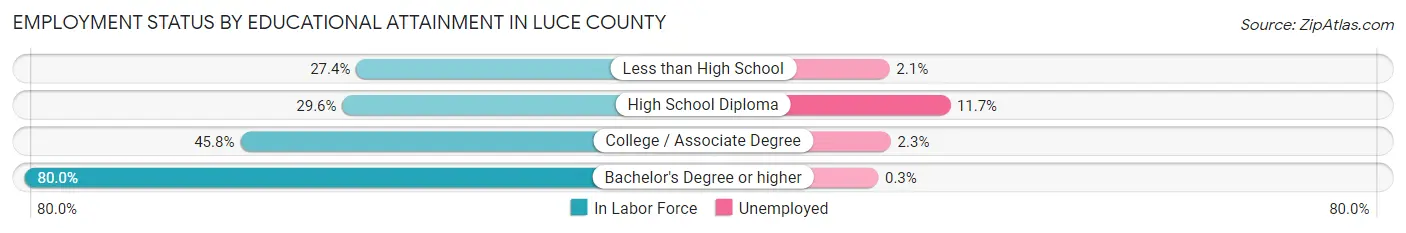
| Educational Attainment | In Labor Force | Unemployed |
| Less than High School | 48 (27.4%) | 4 (2.1%) |
| High School Diploma | 349 (29.6%) | 138 (11.7%) |
| College / Associate Degree | 431 (45.8%) | 22 (2.3%) |
| Bachelor's Degree or higher | 341 (80.0%) | 1 (0.3%) |
| Total | 1,168 (42.9%) | 123 (4.5%) |
Employment Occupations by Sex in Luce County
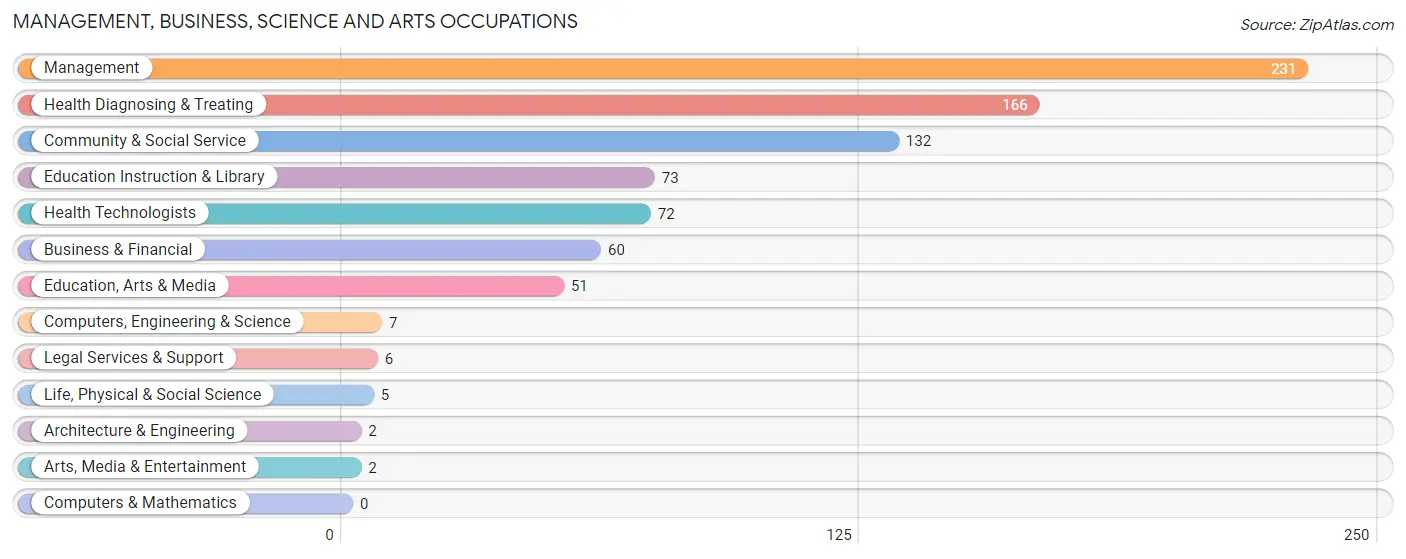
Management, Business, Science and Arts Occupations
The most common Management, Business, Science and Arts occupations in Luce County are Management (231 | 15.8%), Health Diagnosing & Treating (166 | 11.4%), Community & Social Service (132 | 9.0%), Education Instruction & Library (73 | 5.0%), and Health Technologists (72 | 4.9%).
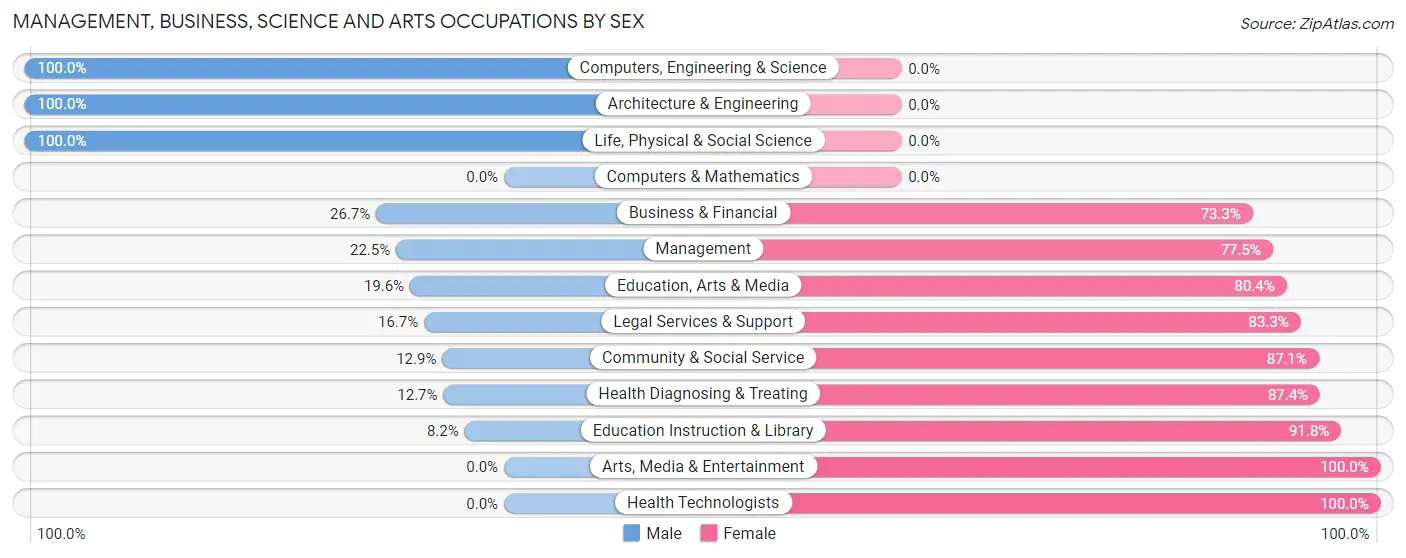
Management, Business, Science and Arts Occupations by Sex
Within the Management, Business, Science and Arts occupations in Luce County, the most male-oriented occupations are Computers, Engineering & Science (100.0%), Architecture & Engineering (100.0%), and Life, Physical & Social Science (100.0%), while the most female-oriented occupations are Arts, Media & Entertainment (100.0%), Health Technologists (100.0%), and Education Instruction & Library (91.8%).
| Occupation | Male | Female |
| Management | 52 (22.5%) | 179 (77.5%) |
| Business & Financial | 16 (26.7%) | 44 (73.3%) |
| Computers, Engineering & Science | 7 (100.0%) | 0 (0.0%) |
| Computers & Mathematics | 0 (0.0%) | 0 (0.0%) |
| Architecture & Engineering | 2 (100.0%) | 0 (0.0%) |
| Life, Physical & Social Science | 5 (100.0%) | 0 (0.0%) |
| Community & Social Service | 17 (12.9%) | 115 (87.1%) |
| Education, Arts & Media | 10 (19.6%) | 41 (80.4%) |
| Legal Services & Support | 1 (16.7%) | 5 (83.3%) |
| Education Instruction & Library | 6 (8.2%) | 67 (91.8%) |
| Arts, Media & Entertainment | 0 (0.0%) | 2 (100.0%) |
| Health Diagnosing & Treating | 21 (12.7%) | 145 (87.4%) |
| Health Technologists | 0 (0.0%) | 72 (100.0%) |
| Total (Category) | 113 (19.0%) | 483 (81.0%) |
| Total (Overall) | 479 (32.8%) | 980 (67.2%) |
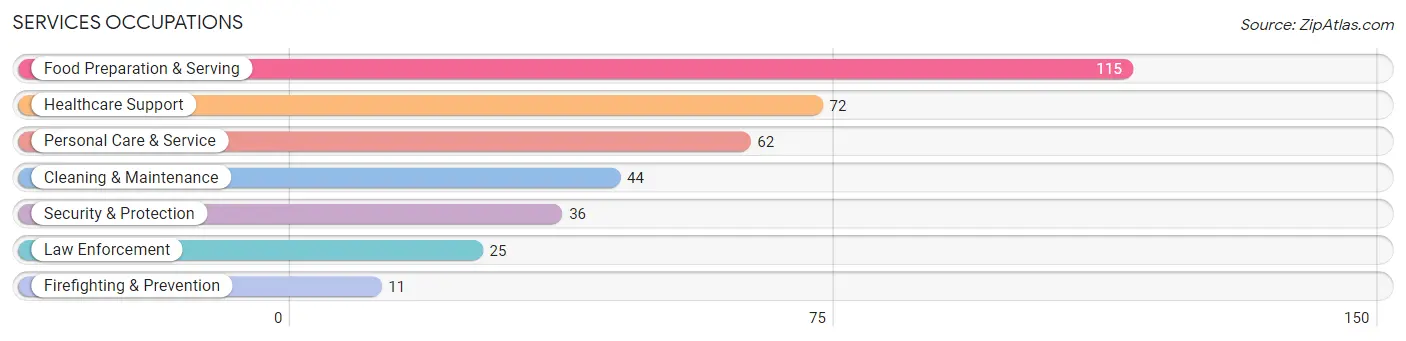
Services Occupations
The most common Services occupations in Luce County are Food Preparation & Serving (115 | 7.9%), Healthcare Support (72 | 4.9%), Personal Care & Service (62 | 4.3%), Cleaning & Maintenance (44 | 3.0%), and Security & Protection (36 | 2.5%).
Services Occupations by Sex
Within the Services occupations in Luce County, the most male-oriented occupations are Law Enforcement (100.0%), Security & Protection (80.6%), and Cleaning & Maintenance (79.5%), while the most female-oriented occupations are Healthcare Support (98.6%), Personal Care & Service (87.1%), and Food Preparation & Serving (73.9%).

| Occupation | Male | Female |
| Healthcare Support | 1 (1.4%) | 71 (98.6%) |
| Security & Protection | 29 (80.6%) | 7 (19.4%) |
| Firefighting & Prevention | 4 (36.4%) | 7 (63.6%) |
| Law Enforcement | 25 (100.0%) | 0 (0.0%) |
| Food Preparation & Serving | 30 (26.1%) | 85 (73.9%) |
| Cleaning & Maintenance | 35 (79.5%) | 9 (20.4%) |
| Personal Care & Service | 8 (12.9%) | 54 (87.1%) |
| Total (Category) | 103 (31.3%) | 226 (68.7%) |
| Total (Overall) | 479 (32.8%) | 980 (67.2%) |
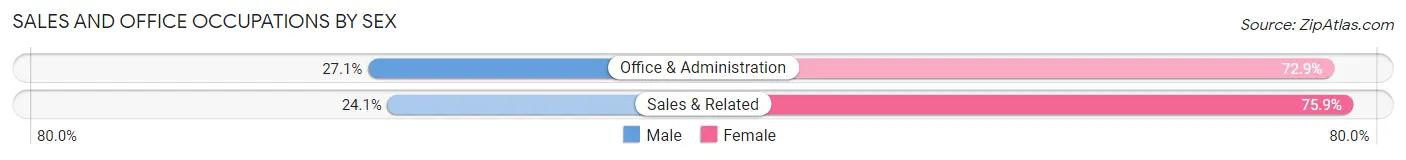
Sales and Office Occupations
The most common Sales and Office occupations in Luce County are Office & Administration (210 | 14.4%), and Sales & Related (116 | 8.0%).

Sales and Office Occupations by Sex
| Occupation | Male | Female |
| Sales & Related | 28 (24.1%) | 88 (75.9%) |
| Office & Administration | 57 (27.1%) | 153 (72.9%) |
| Total (Category) | 85 (26.1%) | 241 (73.9%) |
| Total (Overall) | 479 (32.8%) | 980 (67.2%) |
Natural Resources, Construction and Maintenance Occupations
The most common Natural Resources, Construction and Maintenance occupations in Luce County are Farming, Fishing & Forestry (46 | 3.2%), Construction & Extraction (44 | 3.0%), and Installation, Maintenance & Repair (21 | 1.4%).

Natural Resources, Construction and Maintenance Occupations by Sex

| Occupation | Male | Female |
| Farming, Fishing & Forestry | 43 (93.5%) | 3 (6.5%) |
| Construction & Extraction | 44 (100.0%) | 0 (0.0%) |
| Installation, Maintenance & Repair | 21 (100.0%) | 0 (0.0%) |
| Total (Category) | 108 (97.3%) | 3 (2.7%) |
| Total (Overall) | 479 (32.8%) | 980 (67.2%) |
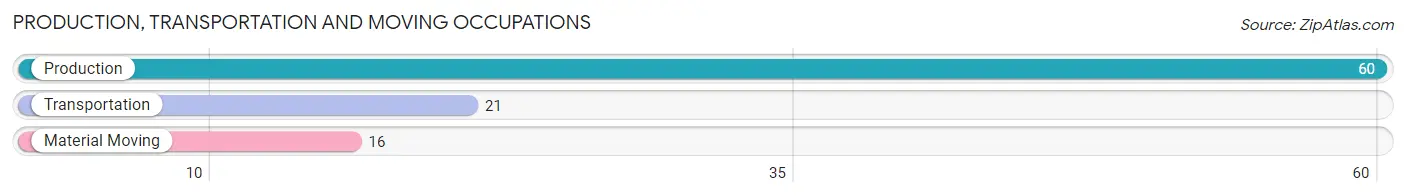
Production, Transportation and Moving Occupations
The most common Production, Transportation and Moving occupations in Luce County are Production (60 | 4.1%), Transportation (21 | 1.4%), and Material Moving (16 | 1.1%).
Production, Transportation and Moving Occupations by Sex
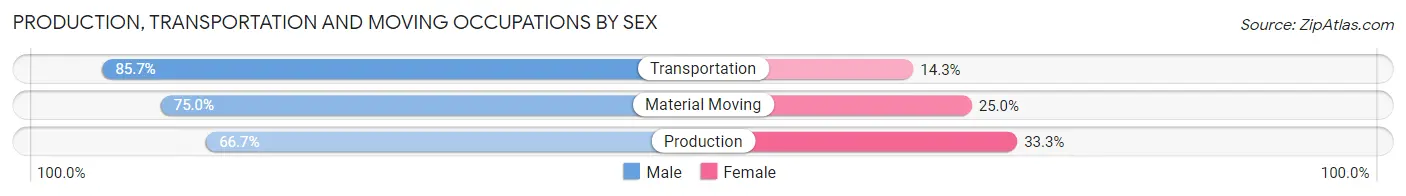
| Occupation | Male | Female |
| Production | 40 (66.7%) | 20 (33.3%) |
| Transportation | 18 (85.7%) | 3 (14.3%) |
| Material Moving | 12 (75.0%) | 4 (25.0%) |
| Total (Category) | 70 (72.2%) | 27 (27.8%) |
| Total (Overall) | 479 (32.8%) | 980 (67.2%) |
Employment Industries by Sex in Luce County
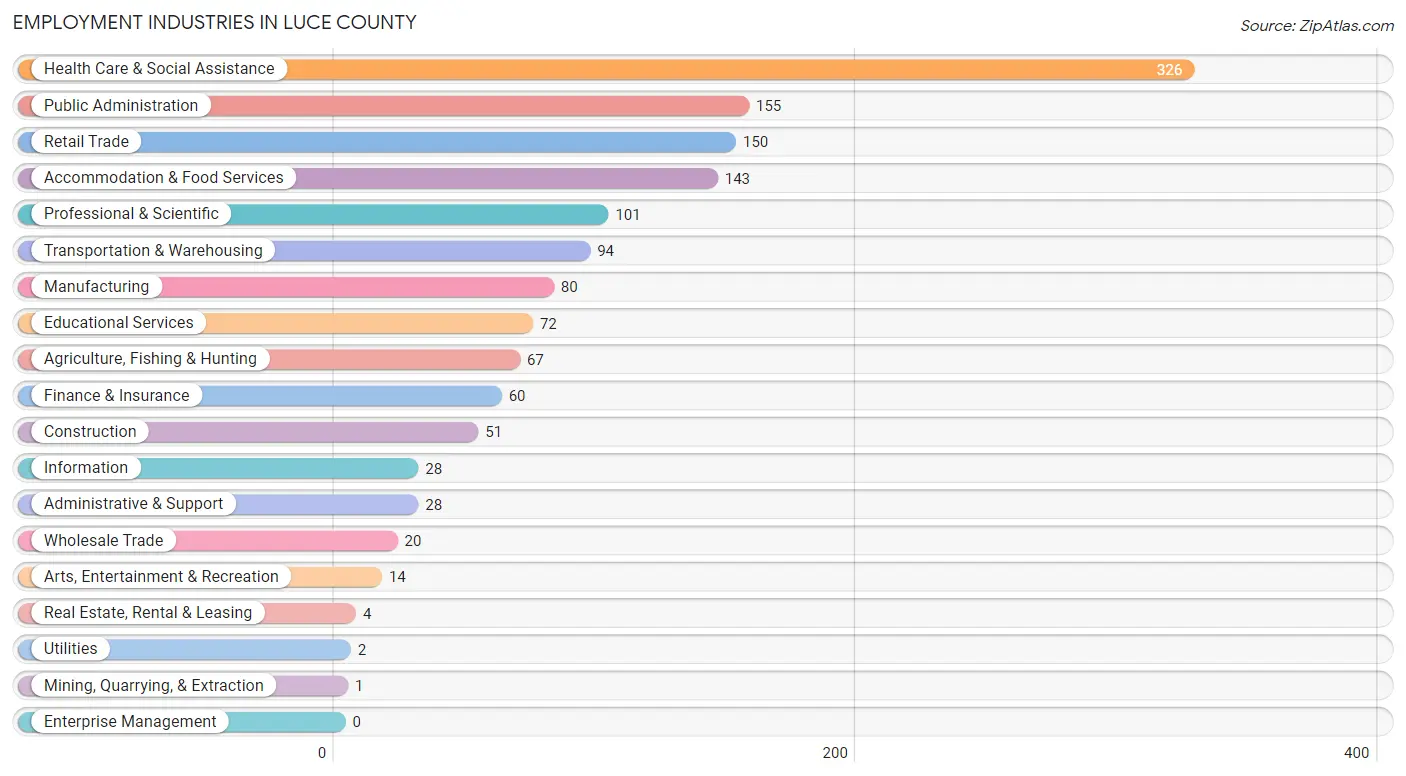
Employment Industries in Luce County
The major employment industries in Luce County include Health Care & Social Assistance (326 | 22.3%), Public Administration (155 | 10.6%), Retail Trade (150 | 10.3%), Accommodation & Food Services (143 | 9.8%), and Professional & Scientific (101 | 6.9%).
Employment Industries by Sex in Luce County
The Luce County industries that see more men than women are Mining, Quarrying, & Extraction (100.0%), Utilities (100.0%), and Transportation & Warehousing (88.3%), whereas the industries that tend to have a higher number of women are Professional & Scientific (96.0%), Health Care & Social Assistance (91.7%), and Educational Services (91.7%).

| Industry | Male | Female |
| Agriculture, Fishing & Hunting | 55 (82.1%) | 12 (17.9%) |
| Mining, Quarrying, & Extraction | 1 (100.0%) | 0 (0.0%) |
| Construction | 44 (86.3%) | 7 (13.7%) |
| Manufacturing | 60 (75.0%) | 20 (25.0%) |
| Wholesale Trade | 4 (20.0%) | 16 (80.0%) |
| Retail Trade | 33 (22.0%) | 117 (78.0%) |
| Transportation & Warehousing | 83 (88.3%) | 11 (11.7%) |
| Utilities | 2 (100.0%) | 0 (0.0%) |
| Information | 11 (39.3%) | 17 (60.7%) |
| Finance & Insurance | 10 (16.7%) | 50 (83.3%) |
| Real Estate, Rental & Leasing | 1 (25.0%) | 3 (75.0%) |
| Professional & Scientific | 4 (4.0%) | 97 (96.0%) |
| Enterprise Management | 0 (0.0%) | 0 (0.0%) |
| Administrative & Support | 13 (46.4%) | 15 (53.6%) |
| Educational Services | 6 (8.3%) | 66 (91.7%) |
| Health Care & Social Assistance | 27 (8.3%) | 299 (91.7%) |
| Arts, Entertainment & Recreation | 6 (42.9%) | 8 (57.1%) |
| Accommodation & Food Services | 36 (25.2%) | 107 (74.8%) |
| Public Administration | 68 (43.9%) | 87 (56.1%) |
| Total | 479 (32.8%) | 980 (67.2%) |
Education in Luce County
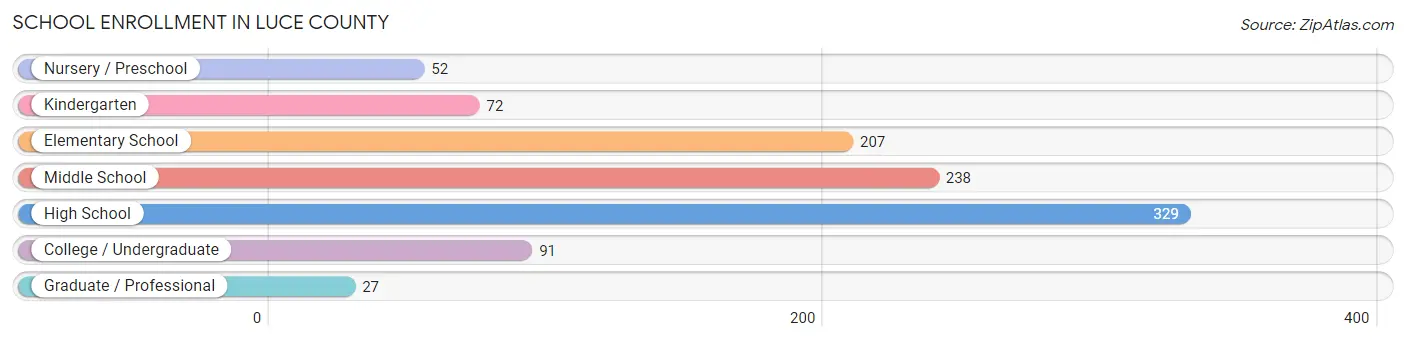
School Enrollment in Luce County
The most common levels of schooling among the 1,016 students in Luce County are high school (329 | 32.4%), middle school (238 | 23.4%), and elementary school (207 | 20.4%).
| School Level | # Students | % Students |
| Nursery / Preschool | 52 | 5.1% |
| Kindergarten | 72 | 7.1% |
| Elementary School | 207 | 20.4% |
| Middle School | 238 | 23.4% |
| High School | 329 | 32.4% |
| College / Undergraduate | 91 | 9.0% |
| Graduate / Professional | 27 | 2.7% |
| Total | 1,016 | 100.0% |
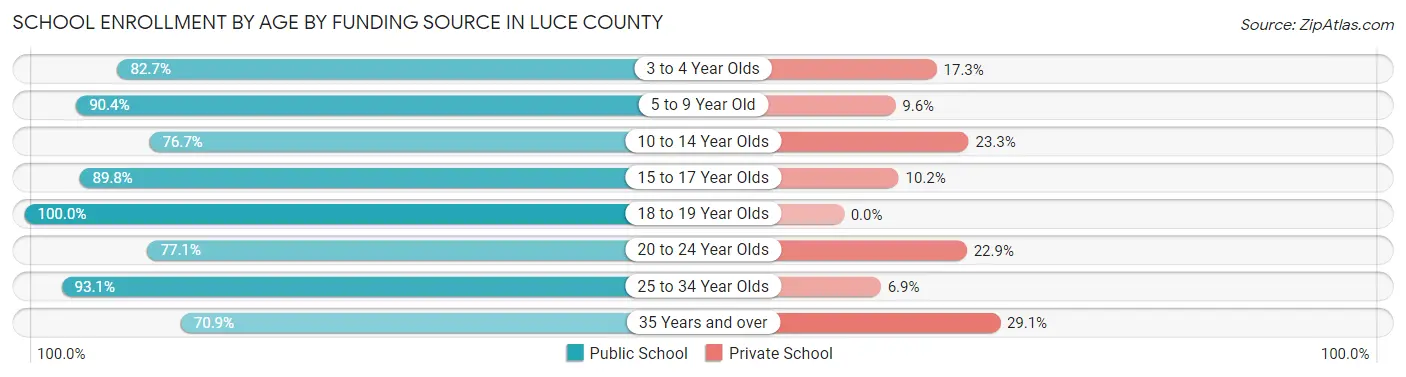
School Enrollment by Age by Funding Source in Luce County
Out of a total of 1,016 students who are enrolled in schools in Luce County, 157 (15.5%) attend a private institution, while the remaining 859 (84.5%) are enrolled in public schools. The age group of 35 years and over has the highest likelihood of being enrolled in private schools, with 23 (29.1% in the age bracket) enrolled. Conversely, the age group of 18 to 19 year olds has the lowest likelihood of being enrolled in a private school, with 82 (100.0% in the age bracket) attending a public institution.
| Age Bracket | Public School | Private School |
| 3 to 4 Year Olds | 43 (82.7%) | 9 (17.3%) |
| 5 to 9 Year Old | 216 (90.4%) | 23 (9.6%) |
| 10 to 14 Year Olds | 231 (76.7%) | 70 (23.3%) |
| 15 to 17 Year Olds | 167 (89.8%) | 19 (10.2%) |
| 18 to 19 Year Olds | 82 (100.0%) | 0 (0.0%) |
| 20 to 24 Year Olds | 37 (77.1%) | 11 (22.9%) |
| 25 to 34 Year Olds | 27 (93.1%) | 2 (6.9%) |
| 35 Years and over | 56 (70.9%) | 23 (29.1%) |
| Total | 859 (84.5%) | 157 (15.5%) |
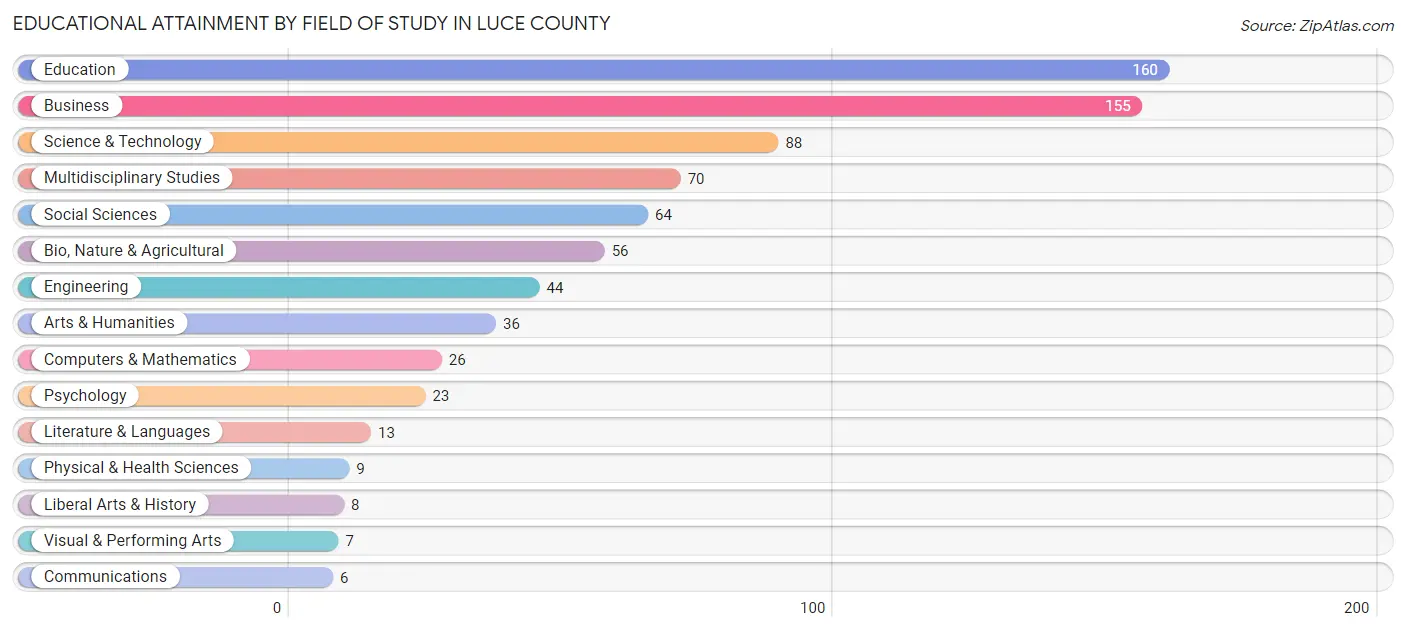
Educational Attainment by Field of Study in Luce County
Education (160 | 20.9%), business (155 | 20.3%), science & technology (88 | 11.5%), multidisciplinary studies (70 | 9.1%), and social sciences (64 | 8.4%) are the most common fields of study among 765 individuals in Luce County who have obtained a bachelor's degree or higher.
| Field of Study | # Graduates | % Graduates |
| Computers & Mathematics | 26 | 3.4% |
| Bio, Nature & Agricultural | 56 | 7.3% |
| Physical & Health Sciences | 9 | 1.2% |
| Psychology | 23 | 3.0% |
| Social Sciences | 64 | 8.4% |
| Engineering | 44 | 5.8% |
| Multidisciplinary Studies | 70 | 9.1% |
| Science & Technology | 88 | 11.5% |
| Business | 155 | 20.3% |
| Education | 160 | 20.9% |
| Literature & Languages | 13 | 1.7% |
| Liberal Arts & History | 8 | 1.1% |
| Visual & Performing Arts | 7 | 0.9% |
| Communications | 6 | 0.8% |
| Arts & Humanities | 36 | 4.7% |
| Total | 765 | 100.0% |
Transportation & Commute in Luce County
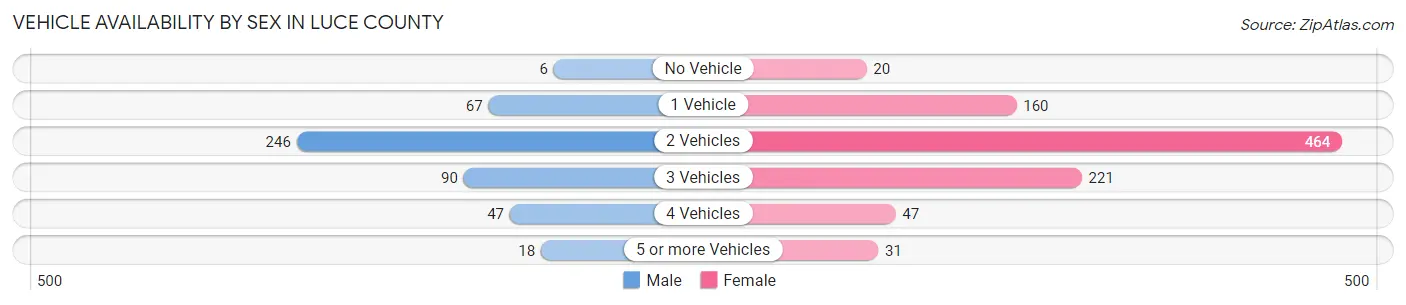
Vehicle Availability by Sex in Luce County
The most prevalent vehicle ownership categories in Luce County are males with 2 vehicles (246, accounting for 51.9%) and females with 2 vehicles (464, making up 26.1%).
| Vehicles Available | Male | Female |
| No Vehicle | 6 (1.3%) | 20 (2.1%) |
| 1 Vehicle | 67 (14.1%) | 160 (17.0%) |
| 2 Vehicles | 246 (51.9%) | 464 (49.2%) |
| 3 Vehicles | 90 (19.0%) | 221 (23.4%) |
| 4 Vehicles | 47 (9.9%) | 47 (5.0%) |
| 5 or more Vehicles | 18 (3.8%) | 31 (3.3%) |
| Total | 474 (100.0%) | 943 (100.0%) |
Commute Time in Luce County
The most frequently occuring commute durations in Luce County are 5 to 9 minutes (369 commuters, 28.3%), 10 to 14 minutes (289 commuters, 22.2%), and less than 5 minutes (191 commuters, 14.7%).

| Commute Time | # Commuters | % Commuters |
| Less than 5 Minutes | 191 | 14.7% |
| 5 to 9 Minutes | 369 | 28.3% |
| 10 to 14 Minutes | 289 | 22.2% |
| 15 to 19 Minutes | 139 | 10.7% |
| 20 to 24 Minutes | 90 | 6.9% |
| 25 to 29 Minutes | 46 | 3.5% |
| 30 to 34 Minutes | 49 | 3.8% |
| 35 to 39 Minutes | 9 | 0.7% |
| 40 to 44 Minutes | 3 | 0.2% |
| 45 to 59 Minutes | 38 | 2.9% |
| 60 to 89 Minutes | 65 | 5.0% |
| 90 or more Minutes | 14 | 1.1% |
Commute Time by Sex in Luce County
The most common commute times in Luce County are 5 to 9 minutes (112 commuters, 25.1%) for males and 5 to 9 minutes (257 commuters, 30.0%) for females.

| Commute Time | Male | Female |
| Less than 5 Minutes | 45 (10.1%) | 146 (17.1%) |
| 5 to 9 Minutes | 112 (25.1%) | 257 (30.0%) |
| 10 to 14 Minutes | 96 (21.5%) | 193 (22.6%) |
| 15 to 19 Minutes | 81 (18.2%) | 58 (6.8%) |
| 20 to 24 Minutes | 31 (7.0%) | 59 (6.9%) |
| 25 to 29 Minutes | 10 (2.2%) | 36 (4.2%) |
| 30 to 34 Minutes | 10 (2.2%) | 39 (4.6%) |
| 35 to 39 Minutes | 3 (0.7%) | 6 (0.7%) |
| 40 to 44 Minutes | 0 (0.0%) | 3 (0.4%) |
| 45 to 59 Minutes | 27 (6.0%) | 11 (1.3%) |
| 60 to 89 Minutes | 24 (5.4%) | 41 (4.8%) |
| 90 or more Minutes | 7 (1.6%) | 7 (0.8%) |
Time of Departure to Work by Sex in Luce County
The most frequent times of departure to work in Luce County are 6:30 AM to 6:59 AM (107, 24.0%) for males and 7:30 AM to 7:59 AM (238, 27.8%) for females.

| Time of Departure | Male | Female |
| 12:00 AM to 4:59 AM | 47 (10.5%) | 17 (2.0%) |
| 5:00 AM to 5:29 AM | 15 (3.4%) | 3 (0.4%) |
| 5:30 AM to 5:59 AM | 38 (8.5%) | 16 (1.9%) |
| 6:00 AM to 6:29 AM | 21 (4.7%) | 30 (3.5%) |
| 6:30 AM to 6:59 AM | 107 (24.0%) | 85 (9.9%) |
| 7:00 AM to 7:29 AM | 36 (8.1%) | 116 (13.6%) |
| 7:30 AM to 7:59 AM | 57 (12.8%) | 238 (27.8%) |
| 8:00 AM to 8:29 AM | 20 (4.5%) | 100 (11.7%) |
| 8:30 AM to 8:59 AM | 14 (3.1%) | 37 (4.3%) |
| 9:00 AM to 9:59 AM | 15 (3.4%) | 53 (6.2%) |
| 10:00 AM to 10:59 AM | 2 (0.4%) | 29 (3.4%) |
| 11:00 AM to 11:59 AM | 0 (0.0%) | 22 (2.6%) |
| 12:00 PM to 3:59 PM | 48 (10.8%) | 55 (6.4%) |
| 4:00 PM to 11:59 PM | 26 (5.8%) | 55 (6.4%) |
| Total | 446 (100.0%) | 856 (100.0%) |
Housing Occupancy in Luce County
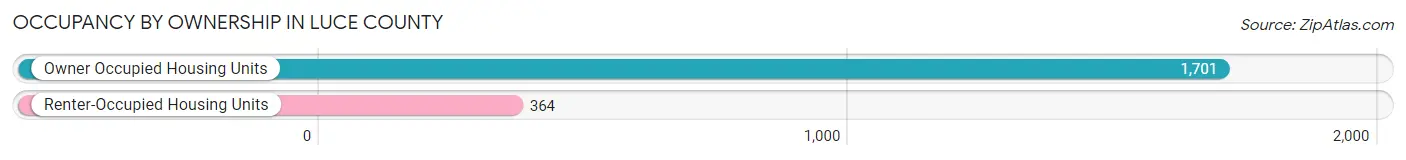
Occupancy by Ownership in Luce County
Of the total 2,065 dwellings in Luce County, owner-occupied units account for 1,701 (82.4%), while renter-occupied units make up 364 (17.6%).
| Occupancy | # Housing Units | % Housing Units |
| Owner Occupied Housing Units | 1,701 | 82.4% |
| Renter-Occupied Housing Units | 364 | 17.6% |
| Total Occupied Housing Units | 2,065 | 100.0% |
Occupancy by Household Size in Luce County
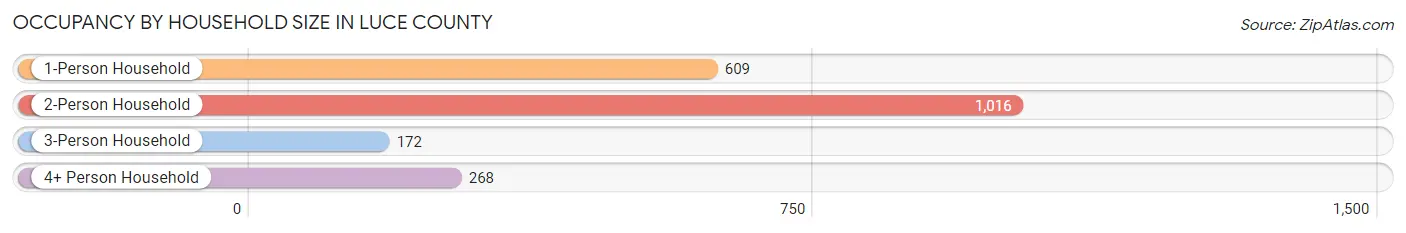
| Household Size | # Housing Units | % Housing Units |
| 1-Person Household | 609 | 29.5% |
| 2-Person Household | 1,016 | 49.2% |
| 3-Person Household | 172 | 8.3% |
| 4+ Person Household | 268 | 13.0% |
| Total Housing Units | 2,065 | 100.0% |
Occupancy by Ownership by Household Size in Luce County
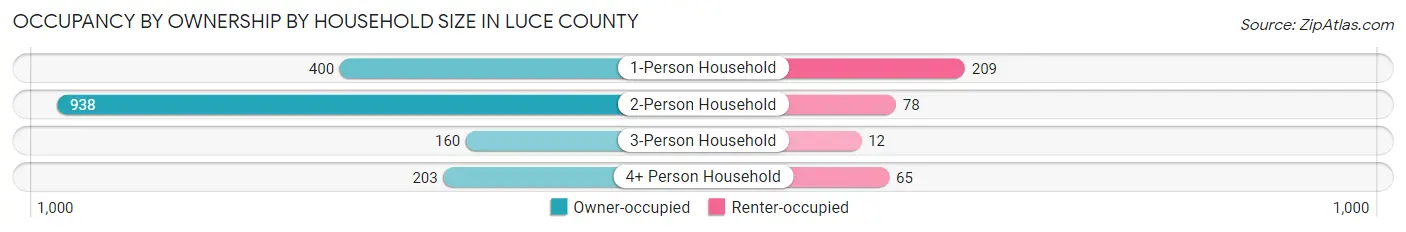
| Household Size | Owner-occupied | Renter-occupied |
| 1-Person Household | 400 (65.7%) | 209 (34.3%) |
| 2-Person Household | 938 (92.3%) | 78 (7.7%) |
| 3-Person Household | 160 (93.0%) | 12 (7.0%) |
| 4+ Person Household | 203 (75.7%) | 65 (24.2%) |
| Total Housing Units | 1,701 (82.4%) | 364 (17.6%) |
Occupancy by Educational Attainment in Luce County

| Household Size | Owner-occupied | Renter-occupied |
| Less than High School | 114 (83.2%) | 23 (16.8%) |
| High School Diploma | 470 (71.1%) | 191 (28.9%) |
| College/Associate Degree | 713 (85.6%) | 120 (14.4%) |
| Bachelor's Degree or higher | 404 (93.1%) | 30 (6.9%) |
Occupancy by Age of Householder in Luce County
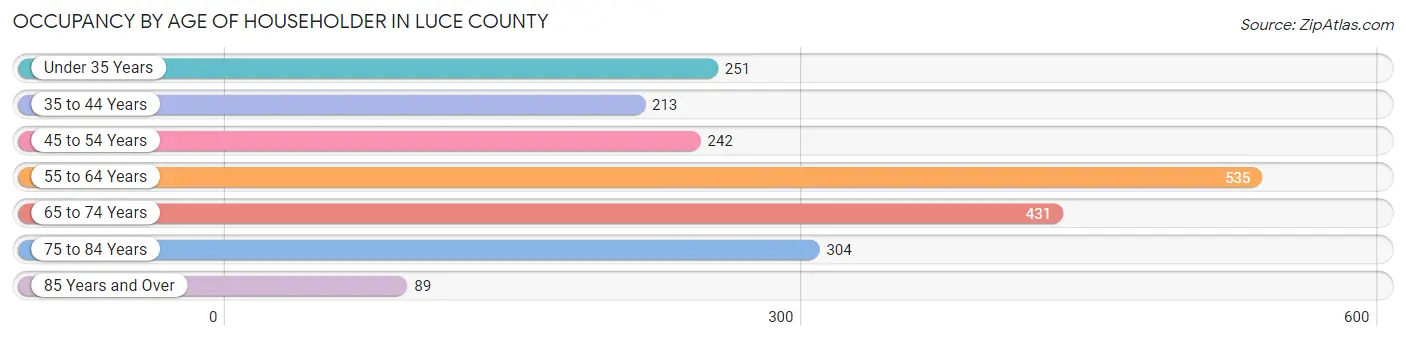
| Age Bracket | # Households | % Households |
| Under 35 Years | 251 | 12.1% |
| 35 to 44 Years | 213 | 10.3% |
| 45 to 54 Years | 242 | 11.7% |
| 55 to 64 Years | 535 | 25.9% |
| 65 to 74 Years | 431 | 20.9% |
| 75 to 84 Years | 304 | 14.7% |
| 85 Years and Over | 89 | 4.3% |
| Total | 2,065 | 100.0% |
Housing Finances in Luce County
Median Income by Occupancy in Luce County
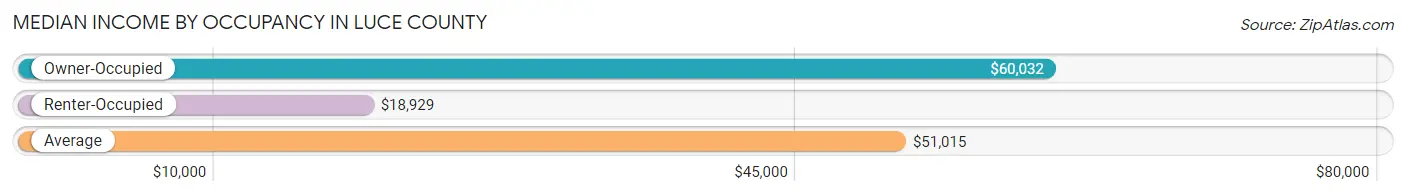
| Occupancy Type | # Households | Median Income |
| Owner-Occupied | 1,701 (82.4%) | $60,032 |
| Renter-Occupied | 364 (17.6%) | $18,929 |
| Average | 2,065 (100.0%) | $51,015 |
Occupancy by Householder Income Bracket in Luce County
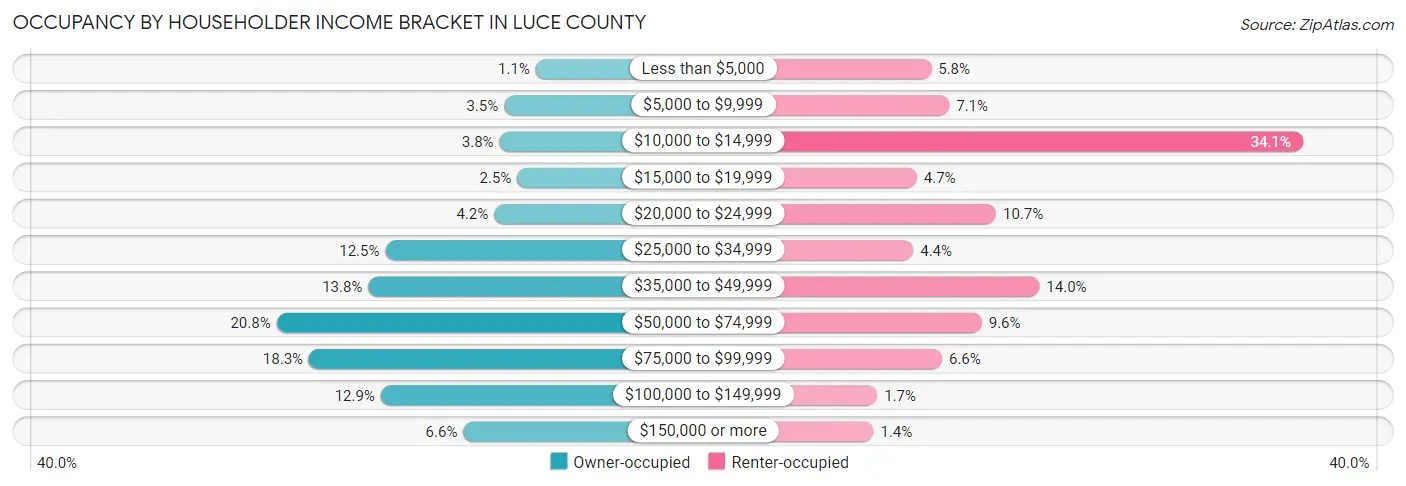
| Income Bracket | Owner-occupied | Renter-occupied |
| Less than $5,000 | 18 (1.1%) | 21 (5.8%) |
| $5,000 to $9,999 | 59 (3.5%) | 26 (7.1%) |
| $10,000 to $14,999 | 65 (3.8%) | 124 (34.1%) |
| $15,000 to $19,999 | 42 (2.5%) | 17 (4.7%) |
| $20,000 to $24,999 | 72 (4.2%) | 39 (10.7%) |
| $25,000 to $34,999 | 213 (12.5%) | 16 (4.4%) |
| $35,000 to $49,999 | 235 (13.8%) | 51 (14.0%) |
| $50,000 to $74,999 | 354 (20.8%) | 35 (9.6%) |
| $75,000 to $99,999 | 312 (18.3%) | 24 (6.6%) |
| $100,000 to $149,999 | 219 (12.9%) | 6 (1.7%) |
| $150,000 or more | 112 (6.6%) | 5 (1.4%) |
| Total | 1,701 (100.0%) | 364 (100.0%) |
Monthly Housing Cost Tiers in Luce County
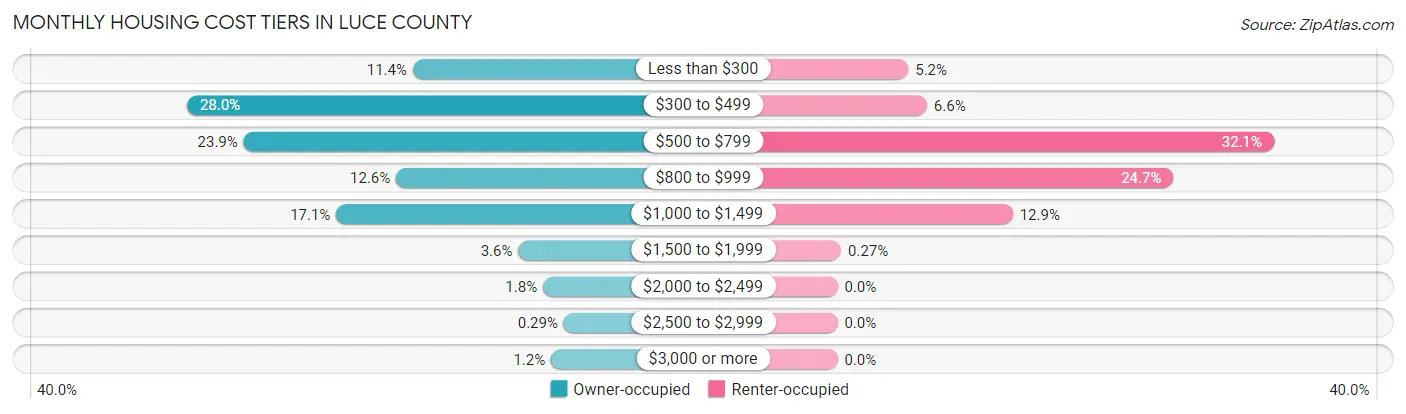
| Monthly Cost | Owner-occupied | Renter-occupied |
| Less than $300 | 194 (11.4%) | 19 (5.2%) |
| $300 to $499 | 477 (28.0%) | 24 (6.6%) |
| $500 to $799 | 406 (23.9%) | 117 (32.1%) |
| $800 to $999 | 215 (12.6%) | 90 (24.7%) |
| $1,000 to $1,499 | 290 (17.1%) | 47 (12.9%) |
| $1,500 to $1,999 | 62 (3.6%) | 1 (0.3%) |
| $2,000 to $2,499 | 31 (1.8%) | 0 (0.0%) |
| $2,500 to $2,999 | 5 (0.3%) | 0 (0.0%) |
| $3,000 or more | 21 (1.2%) | 0 (0.0%) |
| Total | 1,701 (100.0%) | 364 (100.0%) |
Physical Housing Characteristics in Luce County
Housing Structures in Luce County
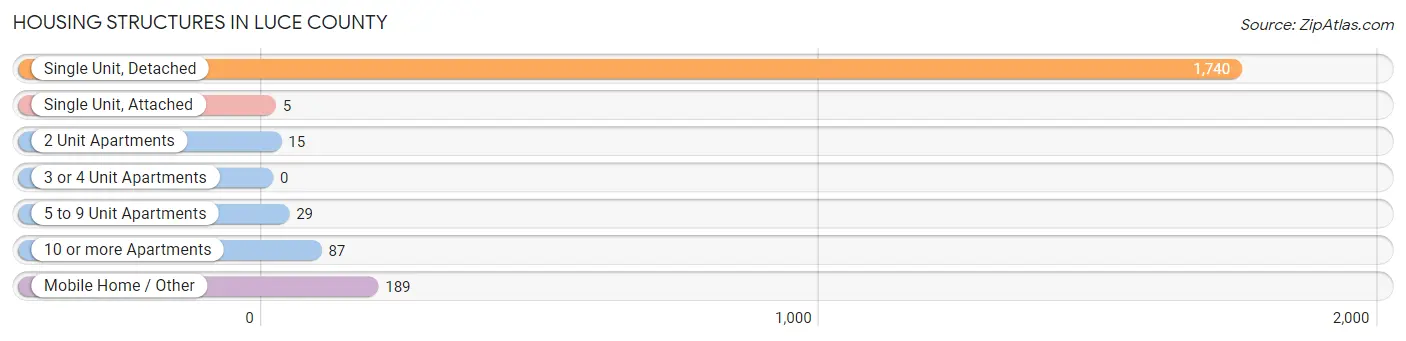
| Structure Type | # Housing Units | % Housing Units |
| Single Unit, Detached | 1,740 | 84.3% |
| Single Unit, Attached | 5 | 0.2% |
| 2 Unit Apartments | 15 | 0.7% |
| 3 or 4 Unit Apartments | 0 | 0.0% |
| 5 to 9 Unit Apartments | 29 | 1.4% |
| 10 or more Apartments | 87 | 4.2% |
| Mobile Home / Other | 189 | 9.1% |
| Total | 2,065 | 100.0% |
Housing Structures by Occupancy in Luce County

| Structure Type | Owner-occupied | Renter-occupied |
| Single Unit, Detached | 1,563 (89.8%) | 177 (10.2%) |
| Single Unit, Attached | 5 (100.0%) | 0 (0.0%) |
| 2 Unit Apartments | 0 (0.0%) | 15 (100.0%) |
| 3 or 4 Unit Apartments | 0 (0.0%) | 0 (0.0%) |
| 5 to 9 Unit Apartments | 0 (0.0%) | 29 (100.0%) |
| 10 or more Apartments | 0 (0.0%) | 87 (100.0%) |
| Mobile Home / Other | 133 (70.4%) | 56 (29.6%) |
| Total | 1,701 (82.4%) | 364 (17.6%) |
Housing Structures by Number of Rooms in Luce County
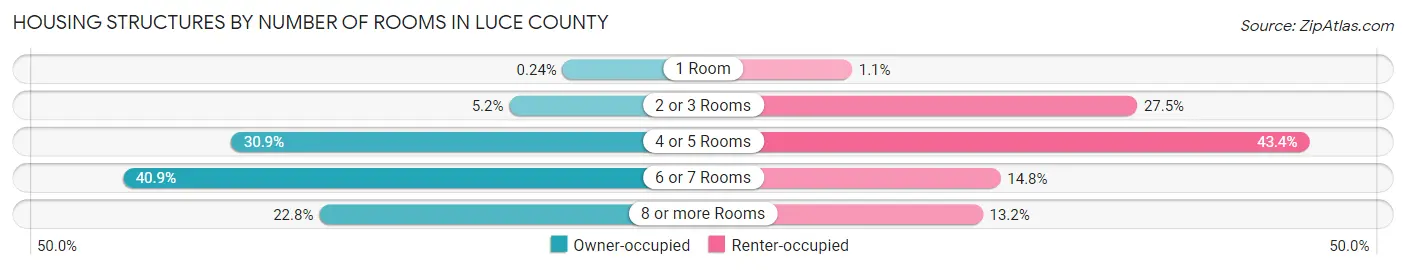
| Number of Rooms | Owner-occupied | Renter-occupied |
| 1 Room | 4 (0.2%) | 4 (1.1%) |
| 2 or 3 Rooms | 88 (5.2%) | 100 (27.5%) |
| 4 or 5 Rooms | 526 (30.9%) | 158 (43.4%) |
| 6 or 7 Rooms | 696 (40.9%) | 54 (14.8%) |
| 8 or more Rooms | 387 (22.8%) | 48 (13.2%) |
| Total | 1,701 (100.0%) | 364 (100.0%) |
Housing Structure by Heating Type in Luce County
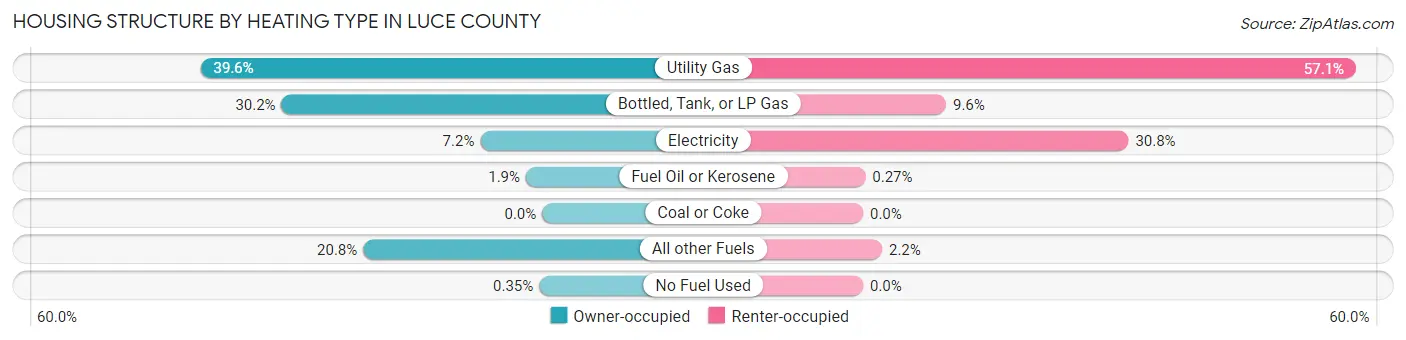
| Heating Type | Owner-occupied | Renter-occupied |
| Utility Gas | 674 (39.6%) | 208 (57.1%) |
| Bottled, Tank, or LP Gas | 514 (30.2%) | 35 (9.6%) |
| Electricity | 122 (7.2%) | 112 (30.8%) |
| Fuel Oil or Kerosene | 32 (1.9%) | 1 (0.3%) |
| Coal or Coke | 0 (0.0%) | 0 (0.0%) |
| All other Fuels | 353 (20.7%) | 8 (2.2%) |
| No Fuel Used | 6 (0.4%) | 0 (0.0%) |
| Total | 1,701 (100.0%) | 364 (100.0%) |
Household Vehicle Usage in Luce County
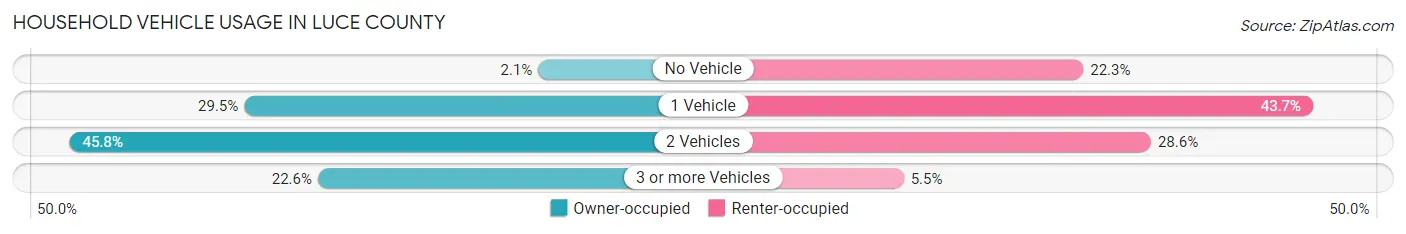
| Vehicles per Household | Owner-occupied | Renter-occupied |
| No Vehicle | 35 (2.1%) | 81 (22.3%) |
| 1 Vehicle | 502 (29.5%) | 159 (43.7%) |
| 2 Vehicles | 779 (45.8%) | 104 (28.6%) |
| 3 or more Vehicles | 385 (22.6%) | 20 (5.5%) |
| Total | 1,701 (100.0%) | 364 (100.0%) |
Real Estate & Mortgages in Luce County
Real Estate and Mortgage Overview in Luce County
| Characteristic | Without Mortgage | With Mortgage |
| Housing Units | 933 | 768 |
| Median Property Value | $98,000 | $112,000 |
| Median Household Income | $51,551 | $78 |
| Monthly Housing Costs | $411 | $21 |
| Real Estate Taxes | $988 | $39 |
Property Value by Mortgage Status in Luce County
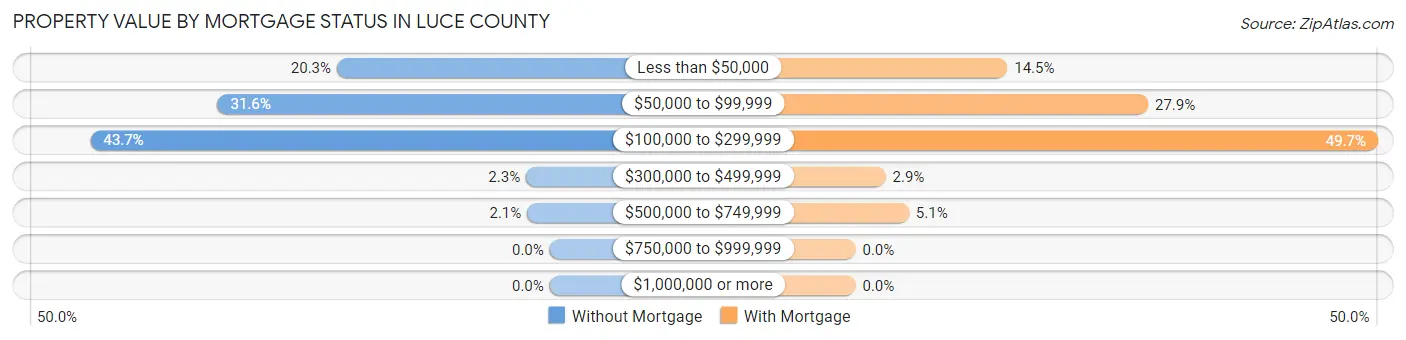
| Property Value | Without Mortgage | With Mortgage |
| Less than $50,000 | 189 (20.3%) | 111 (14.4%) |
| $50,000 to $99,999 | 295 (31.6%) | 214 (27.9%) |
| $100,000 to $299,999 | 408 (43.7%) | 382 (49.7%) |
| $300,000 to $499,999 | 21 (2.2%) | 22 (2.9%) |
| $500,000 to $749,999 | 20 (2.1%) | 39 (5.1%) |
| $750,000 to $999,999 | 0 (0.0%) | 0 (0.0%) |
| $1,000,000 or more | 0 (0.0%) | 0 (0.0%) |
| Total | 933 (100.0%) | 768 (100.0%) |
Household Income by Mortgage Status in Luce County
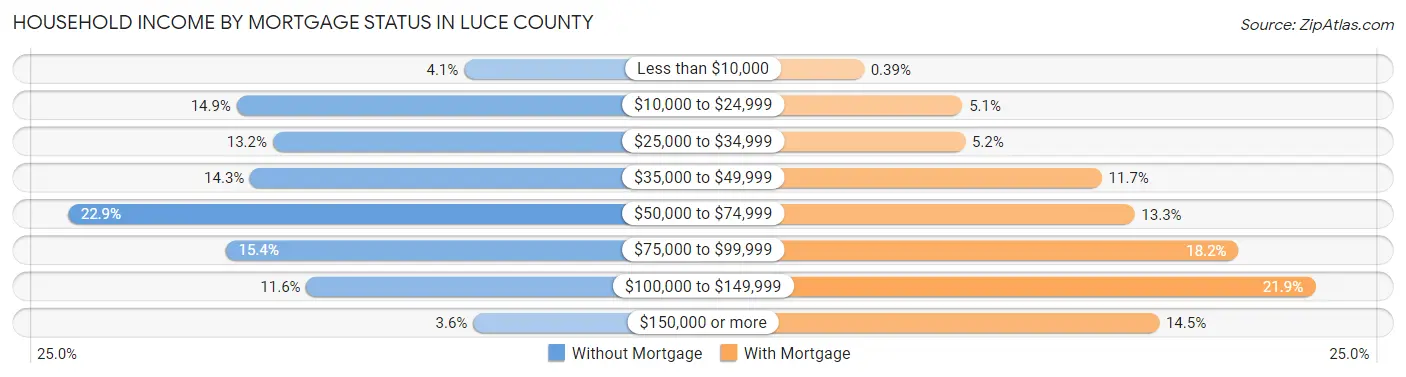
| Household Income | Without Mortgage | With Mortgage |
| Less than $10,000 | 38 (4.1%) | 3 (0.4%) |
| $10,000 to $24,999 | 139 (14.9%) | 39 (5.1%) |
| $25,000 to $34,999 | 123 (13.2%) | 40 (5.2%) |
| $35,000 to $49,999 | 133 (14.3%) | 90 (11.7%) |
| $50,000 to $74,999 | 214 (22.9%) | 102 (13.3%) |
| $75,000 to $99,999 | 144 (15.4%) | 140 (18.2%) |
| $100,000 to $149,999 | 108 (11.6%) | 168 (21.9%) |
| $150,000 or more | 34 (3.6%) | 111 (14.4%) |
| Total | 933 (100.0%) | 768 (100.0%) |
Property Value to Household Income Ratio in Luce County
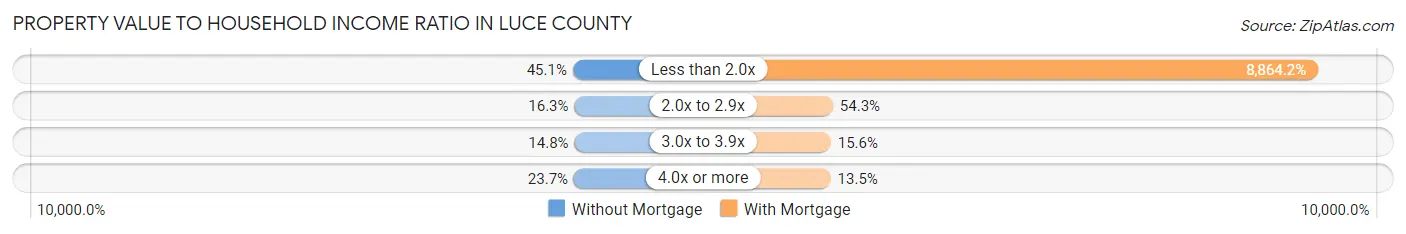
| Value-to-Income Ratio | Without Mortgage | With Mortgage |
| Less than 2.0x | 421 (45.1%) | 68,077 (8,864.2%) |
| 2.0x to 2.9x | 152 (16.3%) | 417 (54.3%) |
| 3.0x to 3.9x | 138 (14.8%) | 120 (15.6%) |
| 4.0x or more | 221 (23.7%) | 104 (13.5%) |
| Total | 933 (100.0%) | 768 (100.0%) |
Real Estate Taxes by Mortgage Status in Luce County
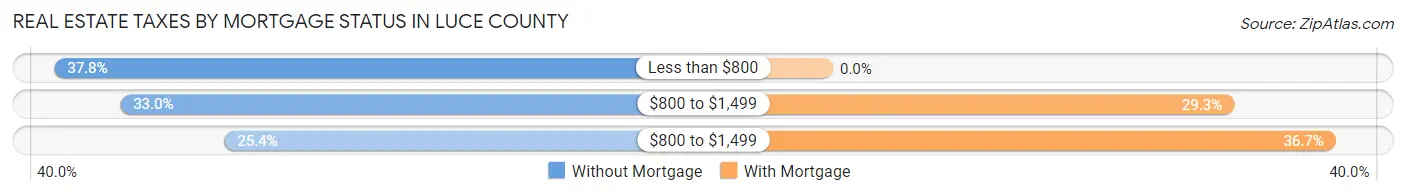
| Property Taxes | Without Mortgage | With Mortgage |
| Less than $800 | 353 (37.8%) | 0 (0.0%) |
| $800 to $1,499 | 308 (33.0%) | 225 (29.3%) |
| $800 to $1,499 | 237 (25.4%) | 282 (36.7%) |
| Total | 933 (100.0%) | 768 (100.0%) |
Health & Disability in Luce County
Health Insurance Coverage by Age in Luce County
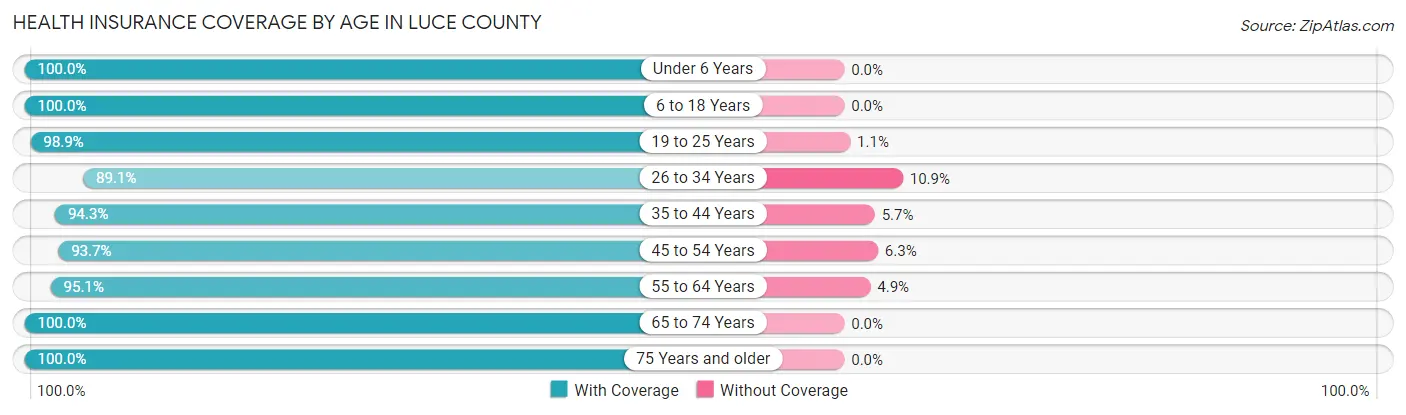
| Age Bracket | With Coverage | Without Coverage |
| Under 6 Years | 305 (100.0%) | 0 (0.0%) |
| 6 to 18 Years | 732 (100.0%) | 0 (0.0%) |
| 19 to 25 Years | 273 (98.9%) | 3 (1.1%) |
| 26 to 34 Years | 245 (89.1%) | 30 (10.9%) |
| 35 to 44 Years | 333 (94.3%) | 20 (5.7%) |
| 45 to 54 Years | 344 (93.7%) | 23 (6.3%) |
| 55 to 64 Years | 764 (95.1%) | 39 (4.9%) |
| 65 to 74 Years | 699 (100.0%) | 0 (0.0%) |
| 75 Years and older | 600 (100.0%) | 0 (0.0%) |
| Total | 4,295 (97.4%) | 115 (2.6%) |
Health Insurance Coverage by Citizenship Status in Luce County

| Citizenship Status | With Coverage | Without Coverage |
| Native Born | 305 (100.0%) | 0 (0.0%) |
| Foreign Born, Citizen | 732 (100.0%) | 0 (0.0%) |
| Foreign Born, not a Citizen | 273 (98.9%) | 3 (1.1%) |
Health Insurance Coverage by Household Income in Luce County
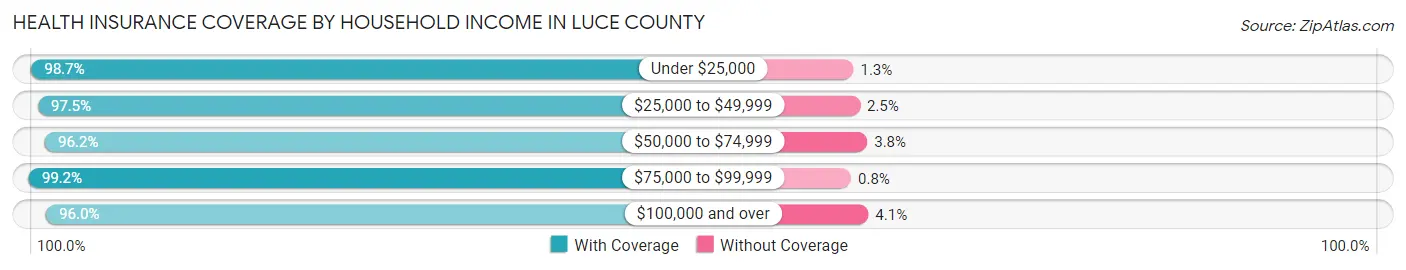
| Household Income | With Coverage | Without Coverage |
| Under $25,000 | 705 (98.7%) | 9 (1.3%) |
| $25,000 to $49,999 | 983 (97.5%) | 25 (2.5%) |
| $50,000 to $74,999 | 876 (96.2%) | 35 (3.8%) |
| $75,000 to $99,999 | 748 (99.2%) | 6 (0.8%) |
| $100,000 and over | 948 (96.0%) | 40 (4.1%) |
Public vs Private Health Insurance Coverage by Age in Luce County
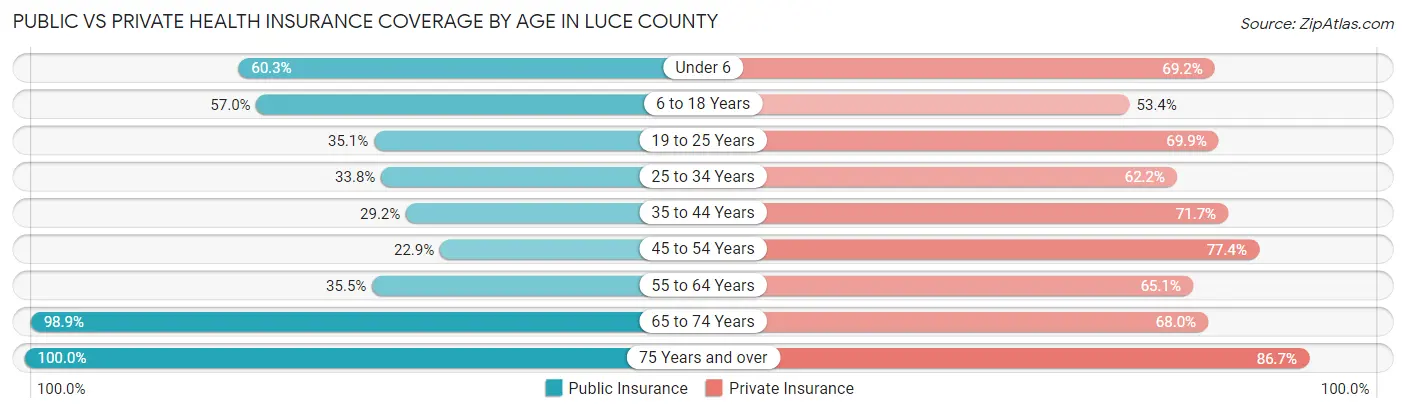
| Age Bracket | Public Insurance | Private Insurance |
| Under 6 | 184 (60.3%) | 211 (69.2%) |
| 6 to 18 Years | 417 (57.0%) | 391 (53.4%) |
| 19 to 25 Years | 97 (35.1%) | 193 (69.9%) |
| 25 to 34 Years | 93 (33.8%) | 171 (62.2%) |
| 35 to 44 Years | 103 (29.2%) | 253 (71.7%) |
| 45 to 54 Years | 84 (22.9%) | 284 (77.4%) |
| 55 to 64 Years | 285 (35.5%) | 523 (65.1%) |
| 65 to 74 Years | 691 (98.9%) | 475 (67.9%) |
| 75 Years and over | 600 (100.0%) | 520 (86.7%) |
| Total | 2,554 (57.9%) | 3,021 (68.5%) |
Disability Status by Sex by Age in Luce County

| Age Bracket | Male | Female |
| Under 5 Years | 0 (0.0%) | 0 (0.0%) |
| 5 to 17 Years | 113 (28.8%) | 23 (6.5%) |
| 18 to 34 Years | 25 (16.3%) | 17 (4.0%) |
| 35 to 64 Years | 112 (20.1%) | 229 (23.7%) |
| 65 to 74 Years | 145 (42.1%) | 156 (43.9%) |
| 75 Years and over | 85 (31.8%) | 177 (53.1%) |
Disability Class by Sex by Age in Luce County
Disability Class: Hearing Difficulty
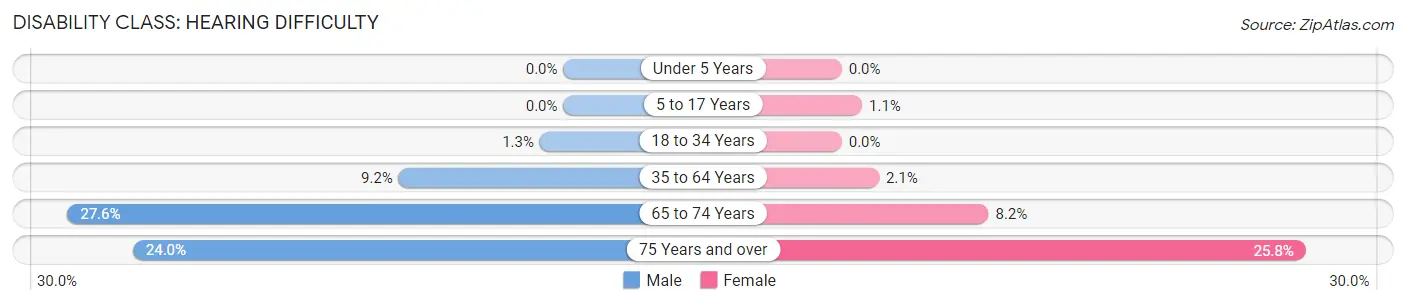
| Age Bracket | Male | Female |
| Under 5 Years | 0 (0.0%) | 0 (0.0%) |
| 5 to 17 Years | 0 (0.0%) | 4 (1.1%) |
| 18 to 34 Years | 2 (1.3%) | 0 (0.0%) |
| 35 to 64 Years | 51 (9.2%) | 20 (2.1%) |
| 65 to 74 Years | 95 (27.6%) | 29 (8.2%) |
| 75 Years and over | 64 (24.0%) | 86 (25.8%) |
Disability Class: Vision Difficulty

| Age Bracket | Male | Female |
| Under 5 Years | 0 (0.0%) | 0 (0.0%) |
| 5 to 17 Years | 27 (6.9%) | 5 (1.4%) |
| 18 to 34 Years | 7 (4.6%) | 0 (0.0%) |
| 35 to 64 Years | 10 (1.8%) | 71 (7.3%) |
| 65 to 74 Years | 3 (0.9%) | 10 (2.8%) |
| 75 Years and over | 27 (10.1%) | 25 (7.5%) |
Disability Class: Cognitive Difficulty

| Age Bracket | Male | Female |
| 5 to 17 Years | 99 (25.3%) | 14 (4.0%) |
| 18 to 34 Years | 20 (13.1%) | 17 (4.0%) |
| 35 to 64 Years | 28 (5.0%) | 93 (9.6%) |
| 65 to 74 Years | 17 (4.9%) | 37 (10.4%) |
| 75 Years and over | 11 (4.1%) | 65 (19.5%) |
Disability Class: Ambulatory Difficulty
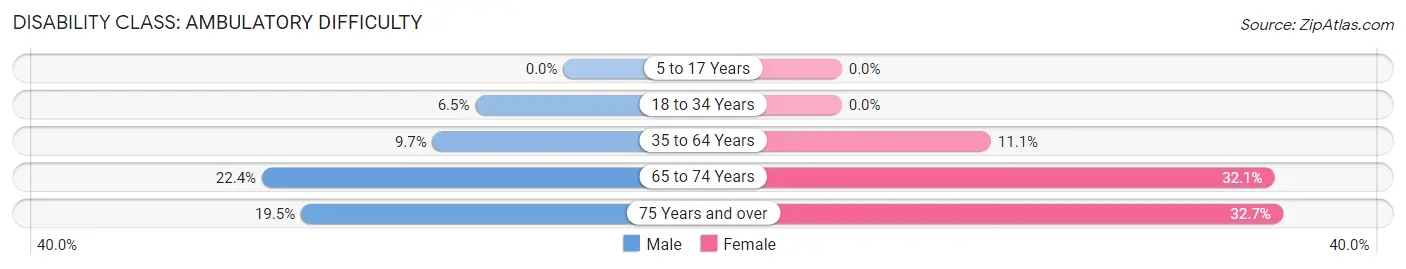
| Age Bracket | Male | Female |
| 5 to 17 Years | 0 (0.0%) | 0 (0.0%) |
| 18 to 34 Years | 10 (6.5%) | 0 (0.0%) |
| 35 to 64 Years | 54 (9.7%) | 107 (11.1%) |
| 65 to 74 Years | 77 (22.4%) | 114 (32.1%) |
| 75 Years and over | 52 (19.5%) | 109 (32.7%) |
Disability Class: Self-Care Difficulty
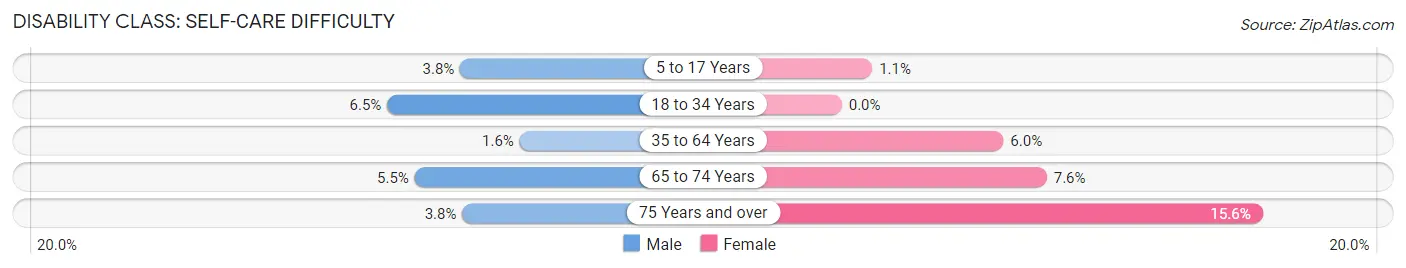
| Age Bracket | Male | Female |
| 5 to 17 Years | 15 (3.8%) | 4 (1.1%) |
| 18 to 34 Years | 10 (6.5%) | 0 (0.0%) |
| 35 to 64 Years | 9 (1.6%) | 58 (6.0%) |
| 65 to 74 Years | 19 (5.5%) | 27 (7.6%) |
| 75 Years and over | 10 (3.7%) | 52 (15.6%) |
Technology Access in Luce County
Computing Device Access in Luce County
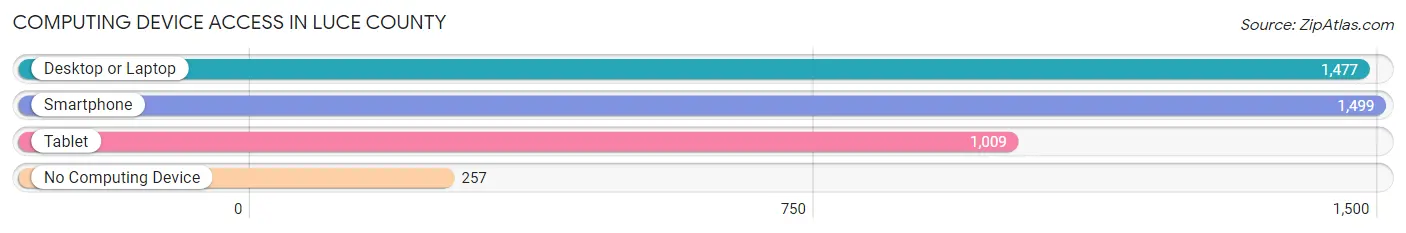
| Device Type | # Households | % Households |
| Desktop or Laptop | 1,477 | 71.5% |
| Smartphone | 1,499 | 72.6% |
| Tablet | 1,009 | 48.9% |
| No Computing Device | 257 | 12.4% |
| Total | 2,065 | 100.0% |
Internet Access in Luce County
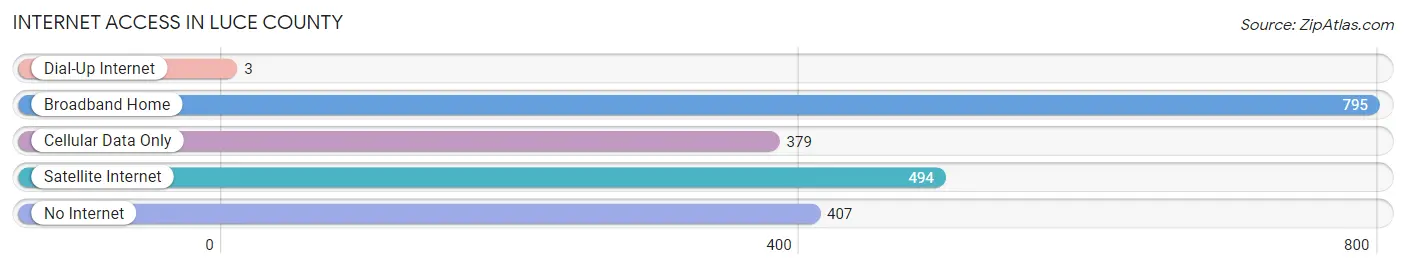
| Internet Type | # Households | % Households |
| Dial-Up Internet | 3 | 0.2% |
| Broadband Home | 795 | 38.5% |
| Cellular Data Only | 379 | 18.3% |
| Satellite Internet | 494 | 23.9% |
| No Internet | 407 | 19.7% |
| Total | 2,065 | 100.0% |
Luce County Summary
Luce County is located in the Upper Peninsula of Michigan, and is bordered by Chippewa County to the north, Mackinac County to the east, Alger County to the south, and Schoolcraft County to the west. The county seat is Newberry, and the county has a total area of 1,845 square miles, of which 1,843 square miles is land and 2 square miles is water. As of the 2010 census, the population of Luce County was 6,631, making it the second least populous county in Michigan.
History
Luce County was established in 1887 and was named after Michigan Governor Cyrus G. Luce. The county was originally part of Mackinac County, and was created from parts of Mackinac, Chippewa, and Schoolcraft counties. The county was organized in 1889, and the first county seat was in Newberry.
Geography
Luce County is located in the Upper Peninsula of Michigan, and is bordered by Chippewa County to the north, Mackinac County to the east, Alger County to the south, and Schoolcraft County to the west. The county has a total area of 1,845 square miles, of which 1,843 square miles is land and 2 square miles is water. The county is mostly covered by forests, and is home to the Seney National Wildlife Refuge. The county is also home to the Tahquamenon Falls State Park, which is one of the largest waterfalls east of the Mississippi River.
Economy
The economy of Luce County is largely based on tourism, forestry, and agriculture. The county is home to several state parks and forests, which attract visitors from all over the country. The county is also home to several logging and lumber companies, which provide jobs for many of the county's residents. Agriculture is also an important part of the county's economy, with many farmers growing crops such as corn, soybeans, and wheat.
Demographics
As of the 2010 census, the population of Luce County was 6,631, with a population density of 3.6 people per square mile. The racial makeup of the county was 94.2% White, 0.7% African American, 1.3% Native American, 0.3% Asian, 0.1% Pacific Islander, 1.2% from other races, and 2.3% from two or more races. Hispanic or Latino of any race were 2.7% of the population.
The median income for a household in the county was $35,938, and the median income for a family was $41,944. The per capita income for the county was $17,845. About 16.2% of the population was below the poverty line.
Common Questions
What is the Total Population of Luce County?
Total Population of Luce County is 5,442.
What is the Total Male Population of Luce County?
Total Male Population of Luce County is 2,865.
What is the Total Female Population of Luce County?
Total Female Population of Luce County is 2,577.
What is the Ratio of Males per 100 Females in Luce County?
There are 111.18 Males per 100 Females in Luce County.
What is the Ratio of Females per 100 Males in Luce County?
There are 89.95 Females per 100 Males in Luce County.
What is the Median Population Age in Luce County?
Median Population Age in Luce County is 47.7 Years.
What is the Average Family Size in Luce County
Average Family Size in Luce County is 2.5 People.
What is the Average Household Size in Luce County
Average Household Size in Luce County is 2.1 People.
What is Per Capita Income in Luce County?
Per Capita income in Luce County is $23,599.
What is the Median Family Income in Luce County?
Median Family Income in Luce County is $65,966.
What is the Median Household income in Luce County?
Median Household Income in Luce County is $51,015.
What is Income or Wage Gap in Luce County?
Income or Wage Gap in Luce County is 14.5%.
Women in Luce County earn 85.5 cents for every dollar earned by a man.
What is Family Income Deficit in Luce County?
Family Income Deficit in Luce County is $8,748.
Families that are below poverty line in Luce County earn $8,748 less on average than the poverty threshold level.
What is Inequality or Gini Index in Luce County?
Inequality or Gini Index in Luce County is 0.41.
How Large is the Labor Force in Luce County?
There are 1,589 People in the Labor Forcein in Luce County.
What is the Percentage of People in the Labor Force in Luce County?
34.9% of People are in the Labor Force in Luce County.
What is the Unemployment Rate in Luce County?
Unemployment Rate in Luce County is 8.3%.