Livingston County, MI
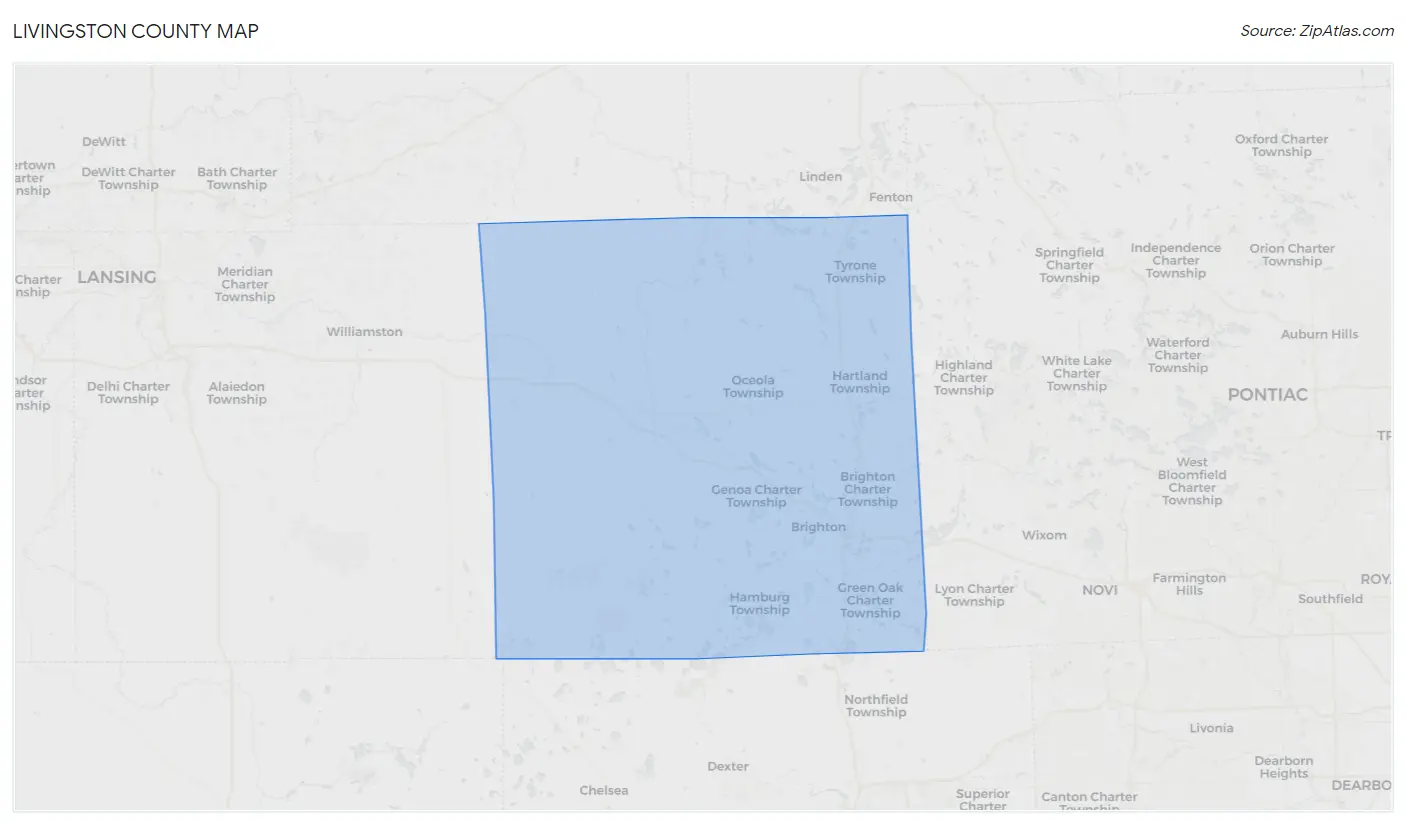
Livingston County Map
Livingston County Overview
194,302
TOTAL POPULATION
98,266
MALE POPULATION
96,036
FEMALE POPULATION
102.32
MALES / 100 FEMALES
97.73
FEMALES / 100 MALES
43.6
MEDIAN AGE
3.0
AVG FAMILY SIZE
2.6
AVG HOUSEHOLD SIZE
$47,253
PER CAPITA INCOME
$113,824
AVG FAMILY INCOME
$96,135
AVG HOUSEHOLD INCOME
38.9%
WAGE / INCOME GAP [ % ]
61.1¢/ $1
WAGE / INCOME GAP [ $ ]
$10,723
FAMILY INCOME DEFICIT
0.41
INEQUALITY / GINI INDEX
102,707
LABOR FORCE [ PEOPLE ]
64.4%
PERCENT IN LABOR FORCE
4.0%
UNEMPLOYMENT RATE
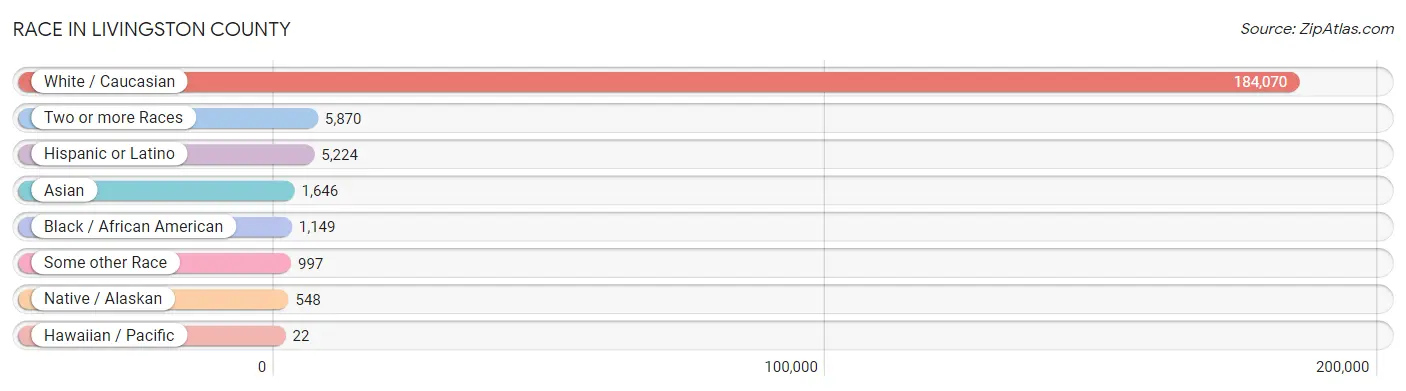
Race in Livingston County
The most populous races in Livingston County are White / Caucasian (184,070 | 94.7%), Two or more Races (5,870 | 3.0%), and Hispanic or Latino (5,224 | 2.7%).
| Race | # Population | % Population |
| Asian | 1,646 | 0.9% |
| Black / African American | 1,149 | 0.6% |
| Hawaiian / Pacific | 22 | 0.0% |
| Hispanic or Latino | 5,224 | 2.7% |
| Native / Alaskan | 548 | 0.3% |
| White / Caucasian | 184,070 | 94.7% |
| Two or more Races | 5,870 | 3.0% |
| Some other Race | 997 | 0.5% |
| Total | 194,302 | 100.0% |
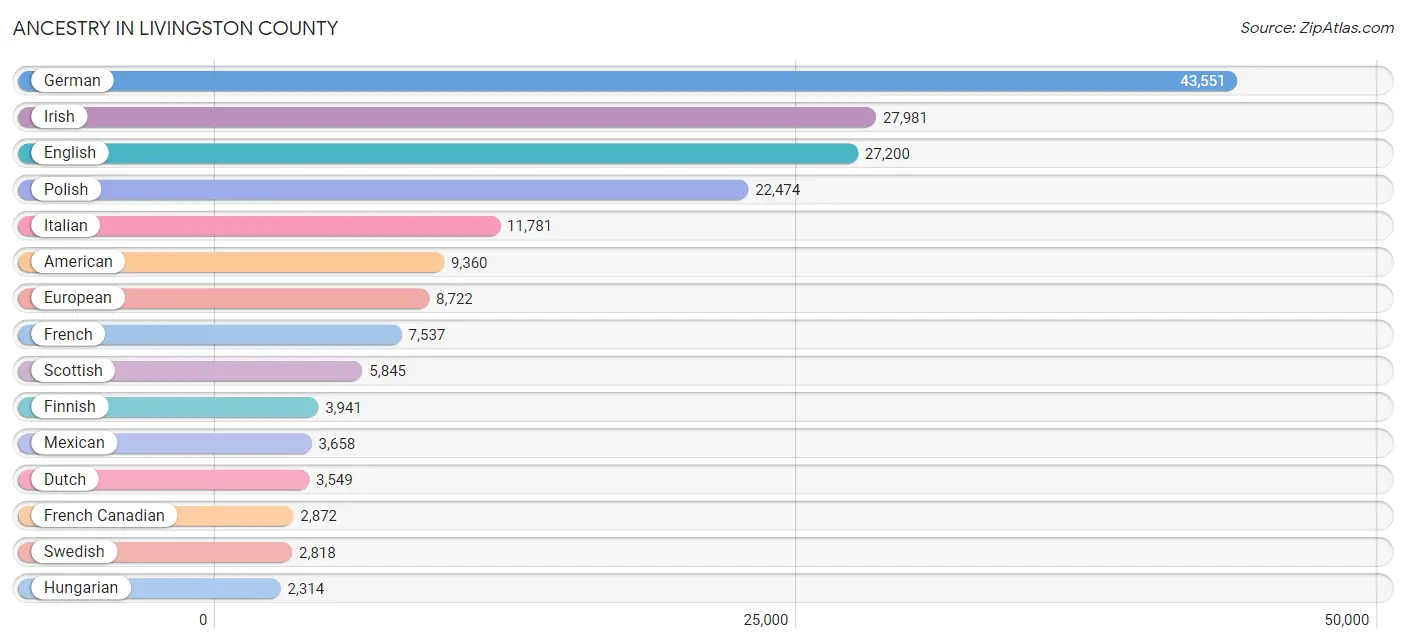
Ancestry in Livingston County
The most populous ancestries reported in Livingston County are German (43,551 | 22.4%), Irish (27,981 | 14.4%), English (27,200 | 14.0%), Polish (22,474 | 11.6%), and Italian (11,781 | 6.1%), together accounting for 68.4% of all Livingston County residents.
| Ancestry | # Population | % Population |
| African | 138 | 0.1% |
| Albanian | 248 | 0.1% |
| American | 9,360 | 4.8% |
| Apache | 140 | 0.1% |
| Arab | 1,359 | 0.7% |
| Armenian | 356 | 0.2% |
| Assyrian / Chaldean / Syriac | 120 | 0.1% |
| Australian | 29 | 0.0% |
| Austrian | 430 | 0.2% |
| Bangladeshi | 90 | 0.1% |
| Basque | 31 | 0.0% |
| Belgian | 631 | 0.3% |
| Belizean | 17 | 0.0% |
| Bhutanese | 298 | 0.2% |
| Blackfeet | 27 | 0.0% |
| Bolivian | 16 | 0.0% |
| Brazilian | 200 | 0.1% |
| British | 1,168 | 0.6% |
| Bulgarian | 50 | 0.0% |
| Burmese | 381 | 0.2% |
| Canadian | 1,364 | 0.7% |
| Celtic | 44 | 0.0% |
| Central American | 83 | 0.0% |
| Central American Indian | 10 | 0.0% |
| Cherokee | 391 | 0.2% |
| Chickasaw | 27 | 0.0% |
| Chilean | 29 | 0.0% |
| Chippewa | 398 | 0.2% |
| Choctaw | 19 | 0.0% |
| Colombian | 78 | 0.0% |
| Costa Rican | 9 | 0.0% |
| Cree | 3 | 0.0% |
| Croatian | 469 | 0.2% |
| Crow | 18 | 0.0% |
| Cuban | 56 | 0.0% |
| Czech | 1,063 | 0.5% |
| Czechoslovakian | 206 | 0.1% |
| Danish | 468 | 0.2% |
| Delaware | 2 | 0.0% |
| Dominican | 209 | 0.1% |
| Dutch | 3,549 | 1.8% |
| Eastern European | 835 | 0.4% |
| Ecuadorian | 46 | 0.0% |
| Egyptian | 21 | 0.0% |
| English | 27,200 | 14.0% |
| Estonian | 13 | 0.0% |
| European | 8,722 | 4.5% |
| Filipino | 6 | 0.0% |
| Finnish | 3,941 | 2.0% |
| French | 7,537 | 3.9% |
| French American Indian | 58 | 0.0% |
| French Canadian | 2,872 | 1.5% |
| German | 43,551 | 22.4% |
| Greek | 915 | 0.5% |
| Guamanian / Chamorro | 65 | 0.0% |
| Guatemalan | 14 | 0.0% |
| Honduran | 36 | 0.0% |
| Hungarian | 2,314 | 1.2% |
| Indian (Asian) | 575 | 0.3% |
| Inupiat | 2 | 0.0% |
| Iranian | 37 | 0.0% |
| Iraqi | 152 | 0.1% |
| Irish | 27,981 | 14.4% |
| Iroquois | 58 | 0.0% |
| Italian | 11,781 | 6.1% |
| Jamaican | 6 | 0.0% |
| Japanese | 4 | 0.0% |
| Jordanian | 40 | 0.0% |
| Korean | 610 | 0.3% |
| Latvian | 43 | 0.0% |
| Lebanese | 636 | 0.3% |
| Lithuanian | 824 | 0.4% |
| Luxembourger | 31 | 0.0% |
| Macedonian | 301 | 0.2% |
| Maltese | 693 | 0.4% |
| Mexican | 3,658 | 1.9% |
| Mexican American Indian | 94 | 0.1% |
| Moroccan | 71 | 0.0% |
| Native Hawaiian | 78 | 0.0% |
| Navajo | 43 | 0.0% |
| Nepalese | 8 | 0.0% |
| Nigerian | 25 | 0.0% |
| Northern European | 237 | 0.1% |
| Norwegian | 1,732 | 0.9% |
| Ottawa | 29 | 0.0% |
| Paiute | 4 | 0.0% |
| Pakistani | 105 | 0.1% |
| Palestinian | 55 | 0.0% |
| Panamanian | 6 | 0.0% |
| Pennsylvania German | 50 | 0.0% |
| Peruvian | 67 | 0.0% |
| Polish | 22,474 | 11.6% |
| Portuguese | 104 | 0.1% |
| Potawatomi | 29 | 0.0% |
| Pueblo | 16 | 0.0% |
| Puerto Rican | 486 | 0.3% |
| Romanian | 868 | 0.4% |
| Russian | 1,274 | 0.7% |
| Salvadoran | 18 | 0.0% |
| Samoan | 22 | 0.0% |
| Scandinavian | 1,141 | 0.6% |
| Scotch-Irish | 1,488 | 0.8% |
| Scottish | 5,845 | 3.0% |
| Seminole | 5 | 0.0% |
| Serbian | 148 | 0.1% |
| Sioux | 31 | 0.0% |
| Slavic | 148 | 0.1% |
| Slovak | 510 | 0.3% |
| Slovene | 119 | 0.1% |
| South American | 236 | 0.1% |
| Spaniard | 132 | 0.1% |
| Spanish | 234 | 0.1% |
| Sri Lankan | 147 | 0.1% |
| Subsaharan African | 166 | 0.1% |
| Swedish | 2,818 | 1.5% |
| Swiss | 533 | 0.3% |
| Syrian | 106 | 0.1% |
| Thai | 423 | 0.2% |
| Trinidadian and Tobagonian | 18 | 0.0% |
| Turkish | 26 | 0.0% |
| Ukrainian | 1,184 | 0.6% |
| Vietnamese | 56 | 0.0% |
| Welsh | 1,241 | 0.6% |
| West Indian | 8 | 0.0% |
| Yugoslavian | 166 | 0.1% | View All 125 Rows |
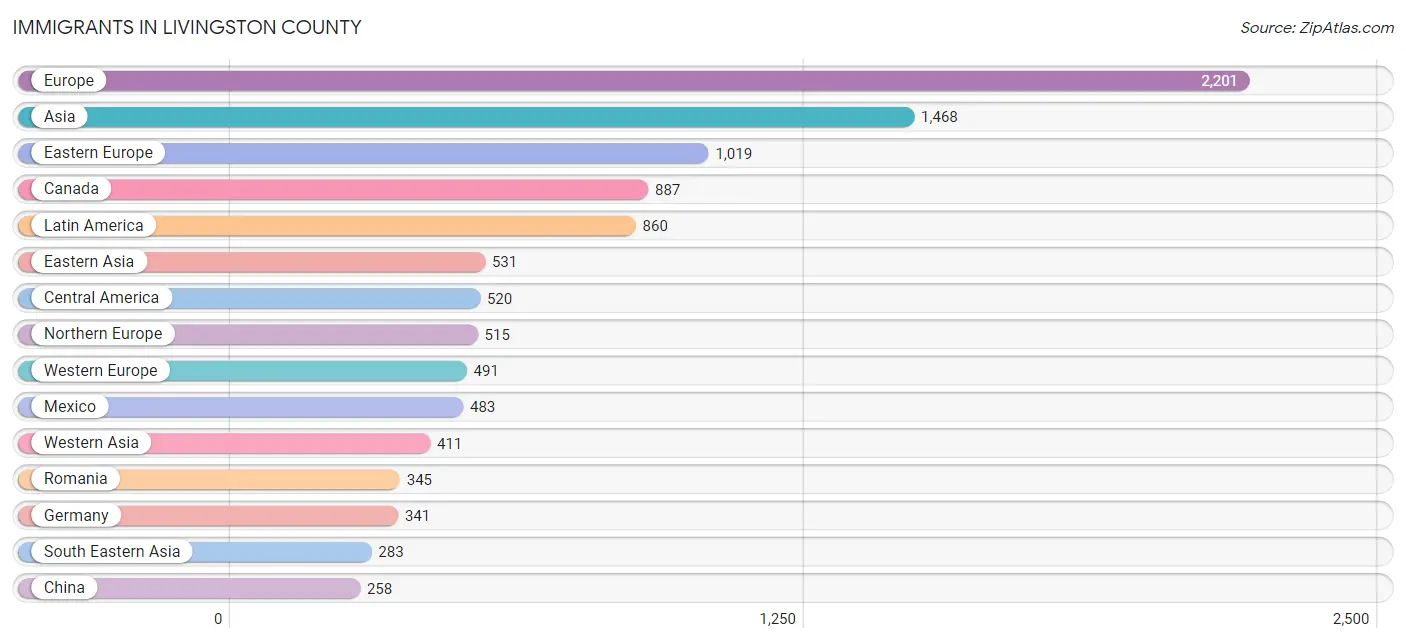
Immigrants in Livingston County
The most numerous immigrant groups reported in Livingston County came from Europe (2,201 | 1.1%), Asia (1,468 | 0.8%), Eastern Europe (1,019 | 0.5%), Canada (887 | 0.5%), and Latin America (860 | 0.4%), together accounting for 3.3% of all Livingston County residents.
| Immigration Origin | # Population | % Population |
| Africa | 95 | 0.1% |
| Albania | 61 | 0.0% |
| Asia | 1,468 | 0.8% |
| Australia | 29 | 0.0% |
| Austria | 39 | 0.0% |
| Bangladesh | 20 | 0.0% |
| Belarus | 26 | 0.0% |
| Belgium | 27 | 0.0% |
| Belize | 3 | 0.0% |
| Brazil | 27 | 0.0% |
| Bulgaria | 15 | 0.0% |
| Cambodia | 4 | 0.0% |
| Canada | 887 | 0.5% |
| Caribbean | 211 | 0.1% |
| Central America | 520 | 0.3% |
| Chile | 13 | 0.0% |
| China | 258 | 0.1% |
| Colombia | 76 | 0.0% |
| Costa Rica | 9 | 0.0% |
| Cuba | 56 | 0.0% |
| Czechoslovakia | 28 | 0.0% |
| Dominican Republic | 150 | 0.1% |
| Eastern Africa | 6 | 0.0% |
| Eastern Asia | 531 | 0.3% |
| Eastern Europe | 1,019 | 0.5% |
| Ecuador | 5 | 0.0% |
| Egypt | 8 | 0.0% |
| El Salvador | 11 | 0.0% |
| England | 234 | 0.1% |
| Europe | 2,201 | 1.1% |
| France | 22 | 0.0% |
| Germany | 341 | 0.2% |
| Greece | 32 | 0.0% |
| Honduras | 8 | 0.0% |
| Hong Kong | 17 | 0.0% |
| Hungary | 7 | 0.0% |
| India | 138 | 0.1% |
| Iran | 26 | 0.0% |
| Iraq | 196 | 0.1% |
| Ireland | 33 | 0.0% |
| Israel | 52 | 0.0% |
| Italy | 85 | 0.0% |
| Jamaica | 2 | 0.0% |
| Japan | 45 | 0.0% |
| Jordan | 10 | 0.0% |
| Korea | 228 | 0.1% |
| Laos | 25 | 0.0% |
| Latin America | 860 | 0.4% |
| Latvia | 7 | 0.0% |
| Lebanon | 30 | 0.0% |
| Mexico | 483 | 0.3% |
| Morocco | 43 | 0.0% |
| Netherlands | 50 | 0.0% |
| Nigeria | 8 | 0.0% |
| North Macedonia | 55 | 0.0% |
| Northern Africa | 56 | 0.0% |
| Northern Europe | 515 | 0.3% |
| Oceania | 42 | 0.0% |
| Pakistan | 16 | 0.0% |
| Panama | 6 | 0.0% |
| Peru | 8 | 0.0% |
| Philippines | 145 | 0.1% |
| Poland | 142 | 0.1% |
| Romania | 345 | 0.2% |
| Russia | 164 | 0.1% |
| Scotland | 44 | 0.0% |
| South America | 129 | 0.1% |
| South Central Asia | 207 | 0.1% |
| South Eastern Asia | 283 | 0.2% |
| Southern Europe | 176 | 0.1% |
| Sweden | 25 | 0.0% |
| Switzerland | 12 | 0.0% |
| Syria | 31 | 0.0% |
| Taiwan | 6 | 0.0% |
| Thailand | 45 | 0.0% |
| Trinidad and Tobago | 3 | 0.0% |
| Turkey | 26 | 0.0% |
| Uganda | 6 | 0.0% |
| Ukraine | 110 | 0.1% |
| Vietnam | 64 | 0.0% |
| Western Africa | 33 | 0.0% |
| Western Asia | 411 | 0.2% |
| Western Europe | 491 | 0.3% |
| Yemen | 30 | 0.0% | View All 84 Rows |
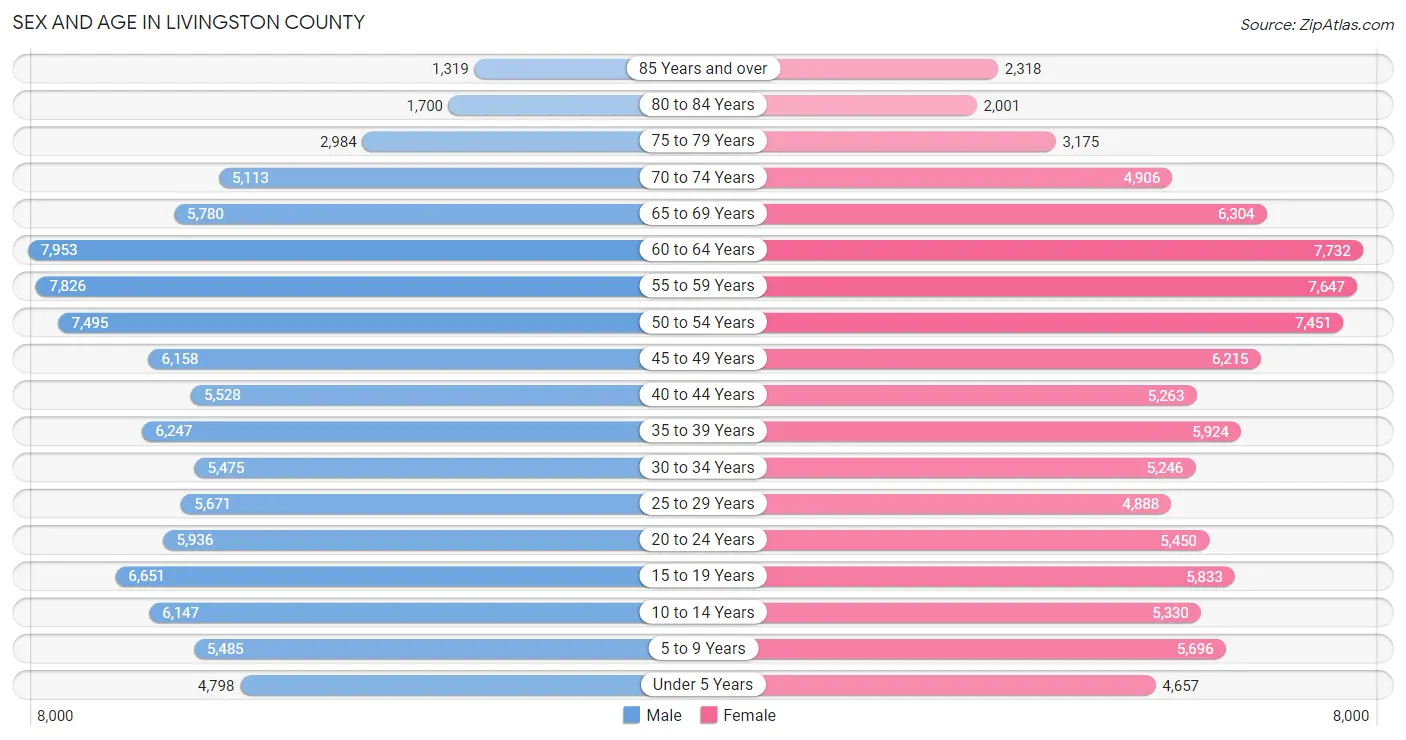
Sex and Age in Livingston County
Sex and Age in Livingston County
The most populous age groups in Livingston County are 60 to 64 Years (7,953 | 8.1%) for men and 60 to 64 Years (7,732 | 8.1%) for women.
| Age Bracket | Male | Female |
| Under 5 Years | 4,798 (4.9%) | 4,657 (4.9%) |
| 5 to 9 Years | 5,485 (5.6%) | 5,696 (5.9%) |
| 10 to 14 Years | 6,147 (6.3%) | 5,330 (5.6%) |
| 15 to 19 Years | 6,651 (6.8%) | 5,833 (6.1%) |
| 20 to 24 Years | 5,936 (6.0%) | 5,450 (5.7%) |
| 25 to 29 Years | 5,671 (5.8%) | 4,888 (5.1%) |
| 30 to 34 Years | 5,475 (5.6%) | 5,246 (5.5%) |
| 35 to 39 Years | 6,247 (6.4%) | 5,924 (6.2%) |
| 40 to 44 Years | 5,528 (5.6%) | 5,263 (5.5%) |
| 45 to 49 Years | 6,158 (6.3%) | 6,215 (6.5%) |
| 50 to 54 Years | 7,495 (7.6%) | 7,451 (7.8%) |
| 55 to 59 Years | 7,826 (8.0%) | 7,647 (8.0%) |
| 60 to 64 Years | 7,953 (8.1%) | 7,732 (8.1%) |
| 65 to 69 Years | 5,780 (5.9%) | 6,304 (6.6%) |
| 70 to 74 Years | 5,113 (5.2%) | 4,906 (5.1%) |
| 75 to 79 Years | 2,984 (3.0%) | 3,175 (3.3%) |
| 80 to 84 Years | 1,700 (1.7%) | 2,001 (2.1%) |
| 85 Years and over | 1,319 (1.3%) | 2,318 (2.4%) |
| Total | 98,266 (100.0%) | 96,036 (100.0%) |
Families and Households in Livingston County
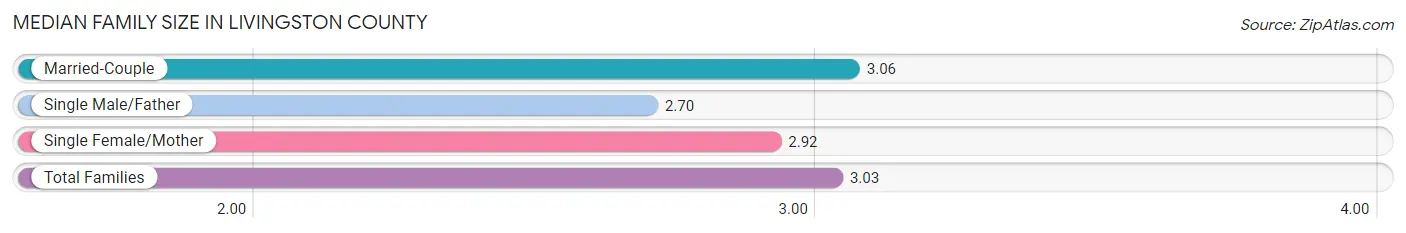
Median Family Size in Livingston County
The median family size in Livingston County is 3.03 persons per family, with married-couple families (45,500 | 84.3%) accounting for the largest median family size of 3.06 persons per family. On the other hand, single male/father families (3,301 | 6.1%) represent the smallest median family size with 2.70 persons per family.
| Family Type | # Families | Family Size |
| Married-Couple | 45,500 (84.3%) | 3.06 |
| Single Male/Father | 3,301 (6.1%) | 2.70 |
| Single Female/Mother | 5,205 (9.6%) | 2.92 |
| Total Families | 54,006 (100.0%) | 3.03 |
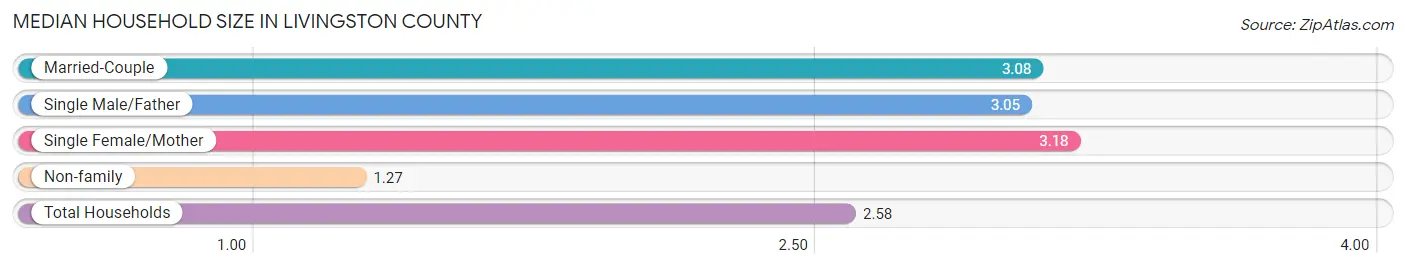
Median Household Size in Livingston County
The median household size in Livingston County is 2.58 persons per household, with single female/mother households (5,205 | 7.0%) accounting for the largest median household size of 3.18 persons per household. non-family households (20,835 | 27.8%) represent the smallest median household size with 1.27 persons per household.
| Household Type | # Households | Household Size |
| Married-Couple | 45,500 (60.8%) | 3.08 |
| Single Male/Father | 3,301 (4.4%) | 3.05 |
| Single Female/Mother | 5,205 (7.0%) | 3.18 |
| Non-family | 20,835 (27.8%) | 1.27 |
| Total Households | 74,841 (100.0%) | 2.58 |
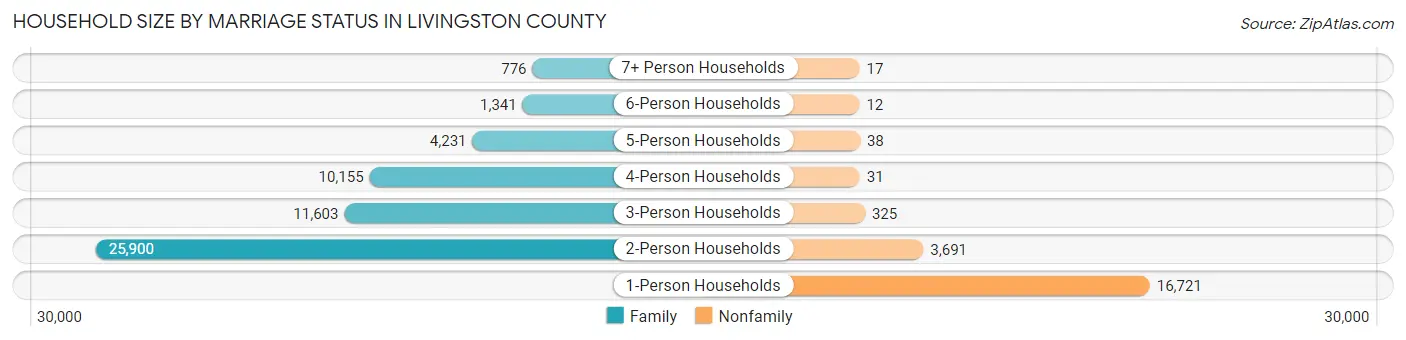
Household Size by Marriage Status in Livingston County
Out of a total of 74,841 households in Livingston County, 54,006 (72.2%) are family households, while 20,835 (27.8%) are nonfamily households. The most numerous type of family households are 2-person households, comprising 25,900, and the most common type of nonfamily households are 1-person households, comprising 16,721.
| Household Size | Family Households | Nonfamily Households |
| 1-Person Households | - | 16,721 (22.3%) |
| 2-Person Households | 25,900 (34.6%) | 3,691 (4.9%) |
| 3-Person Households | 11,603 (15.5%) | 325 (0.4%) |
| 4-Person Households | 10,155 (13.6%) | 31 (0.0%) |
| 5-Person Households | 4,231 (5.7%) | 38 (0.1%) |
| 6-Person Households | 1,341 (1.8%) | 12 (0.0%) |
| 7+ Person Households | 776 (1.0%) | 17 (0.0%) |
| Total | 54,006 (72.2%) | 20,835 (27.8%) |
Female Fertility in Livingston County
Fertility by Age in Livingston County
Average fertility rate in Livingston County is 60.0 births per 1,000 women. Women in the age bracket of 20 to 34 years have the highest fertility rate with 109.0 births per 1,000 women. Women in the age bracket of 20 to 34 years acount for 70.7% of all women with births.
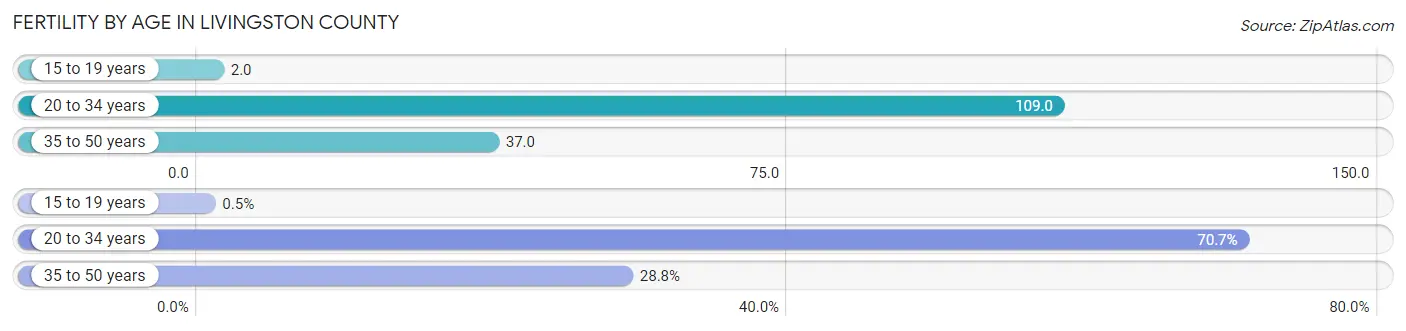
| Age Bracket | Women with Births | Births / 1,000 Women |
| 15 to 19 years | 12 (0.5%) | 2.0 |
| 20 to 34 years | 1,696 (70.7%) | 109.0 |
| 35 to 50 years | 692 (28.8%) | 37.0 |
| Total | 2,400 (100.0%) | 60.0 |
Fertility by Age by Marriage Status in Livingston County
75.9% of women with births (2,400) in Livingston County are married. The highest percentage of unmarried women with births falls into 15 to 19 years age bracket with 100.0% of them unmarried at the time of birth, while the lowest percentage of unmarried women with births belong to 35 to 50 years age bracket with 16.3% of them unmarried.
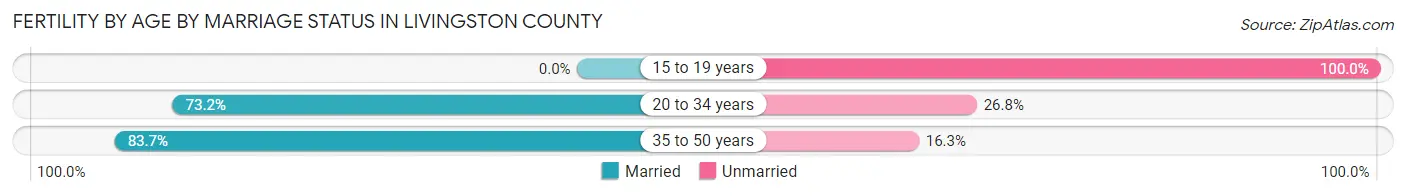
| Age Bracket | Married | Unmarried |
| 15 to 19 years | 0 (0.0%) | 12 (100.0%) |
| 20 to 34 years | 1,241 (73.2%) | 455 (26.8%) |
| 35 to 50 years | 579 (83.7%) | 113 (16.3%) |
| Total | 1,822 (75.9%) | 578 (24.1%) |
Fertility by Education in Livingston County
Average fertility rate in Livingston County is 60.0 births per 1,000 women. Women with the education attainment of graduate degree have the highest fertility rate of 94.0 births per 1,000 women, while women with the education attainment of less than high school have the lowest fertility at 20.0 births per 1,000 women. Women with the education attainment of bachelor's degree represent 36.0% of all women with births.
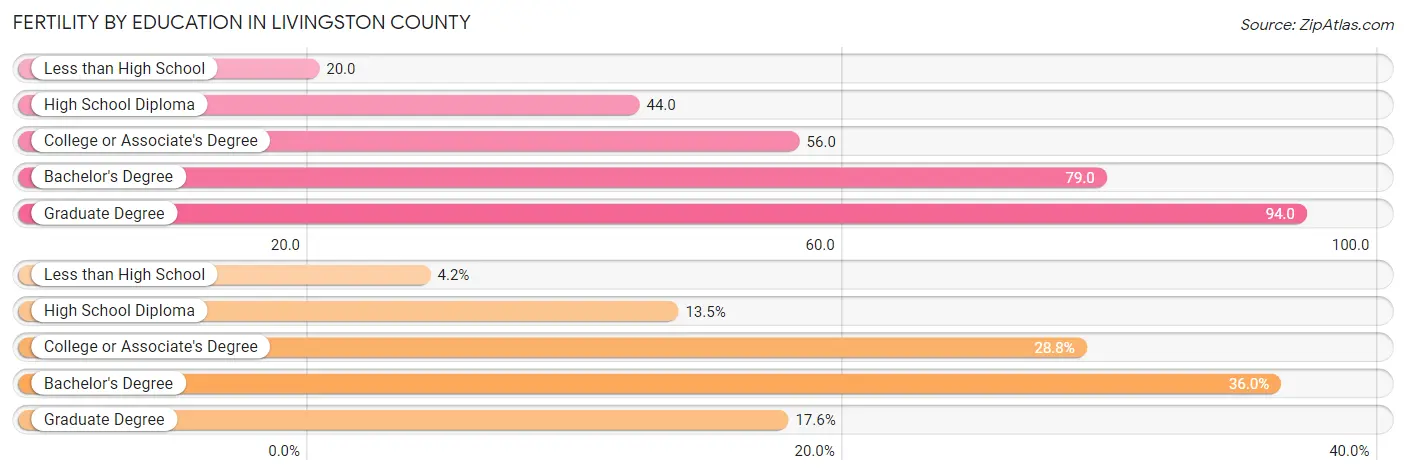
| Educational Attainment | Women with Births | Births / 1,000 Women |
| Less than High School | 100 (4.2%) | 20.0 |
| High School Diploma | 323 (13.5%) | 44.0 |
| College or Associate's Degree | 690 (28.7%) | 56.0 |
| Bachelor's Degree | 865 (36.0%) | 79.0 |
| Graduate Degree | 422 (17.6%) | 94.0 |
| Total | 2,400 (100.0%) | 60.0 |
Fertility by Education by Marriage Status in Livingston County
24.1% of women with births in Livingston County are unmarried. Women with the educational attainment of graduate degree are most likely to be married with 95.5% of them married at childbirth, while women with the educational attainment of less than high school are least likely to be married with 83.0% of them unmarried at childbirth.
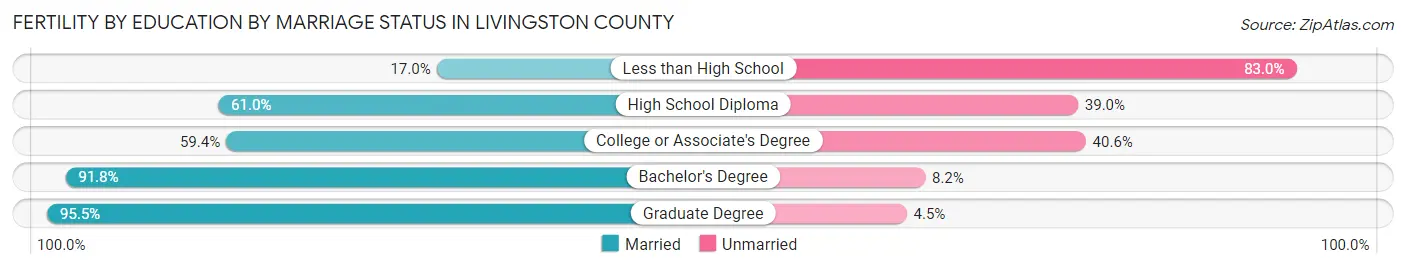
| Educational Attainment | Married | Unmarried |
| Less than High School | 17 (17.0%) | 83 (83.0%) |
| High School Diploma | 197 (61.0%) | 126 (39.0%) |
| College or Associate's Degree | 410 (59.4%) | 280 (40.6%) |
| Bachelor's Degree | 794 (91.8%) | 71 (8.2%) |
| Graduate Degree | 403 (95.5%) | 19 (4.5%) |
| Total | 1,822 (75.9%) | 578 (24.1%) |
Income in Livingston County
Income Overview in Livingston County
Per Capita Income in Livingston County is $47,253, while median incomes of families and households are $113,824 and $96,135 respectively.
| Characteristic | Number | Measure |
| Per Capita Income | 194,302 | $47,253 |
| Median Family Income | 54,006 | $113,824 |
| Mean Family Income | 54,006 | $138,076 |
| Median Household Income | 74,841 | $96,135 |
| Mean Household Income | 74,841 | $119,911 |
| Income Deficit | 54,006 | $10,723 |
| Wage / Income Gap (%) | 194,302 | 38.93% |
| Wage / Income Gap ($) | 194,302 | 61.07¢ per $1 |
| Gini / Inequality Index | 194,302 | 0.41 |
Earnings by Sex in Livingston County
Average Earnings in Livingston County are $49,274, $61,439 for men and $37,518 for women, a difference of 38.9%.
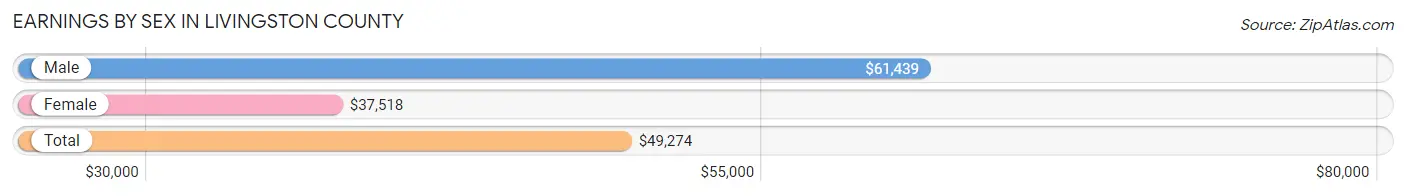
| Sex | Number | Average Earnings |
| Male | 59,137 (54.6%) | $61,439 |
| Female | 49,239 (45.4%) | $37,518 |
| Total | 108,376 (100.0%) | $49,274 |
Earnings by Sex by Income Bracket in Livingston County
The most common earnings brackets in Livingston County are $100,000+ for men (16,240 | 27.5%) and $75,000 to $99,999 for women (5,458 | 11.1%).
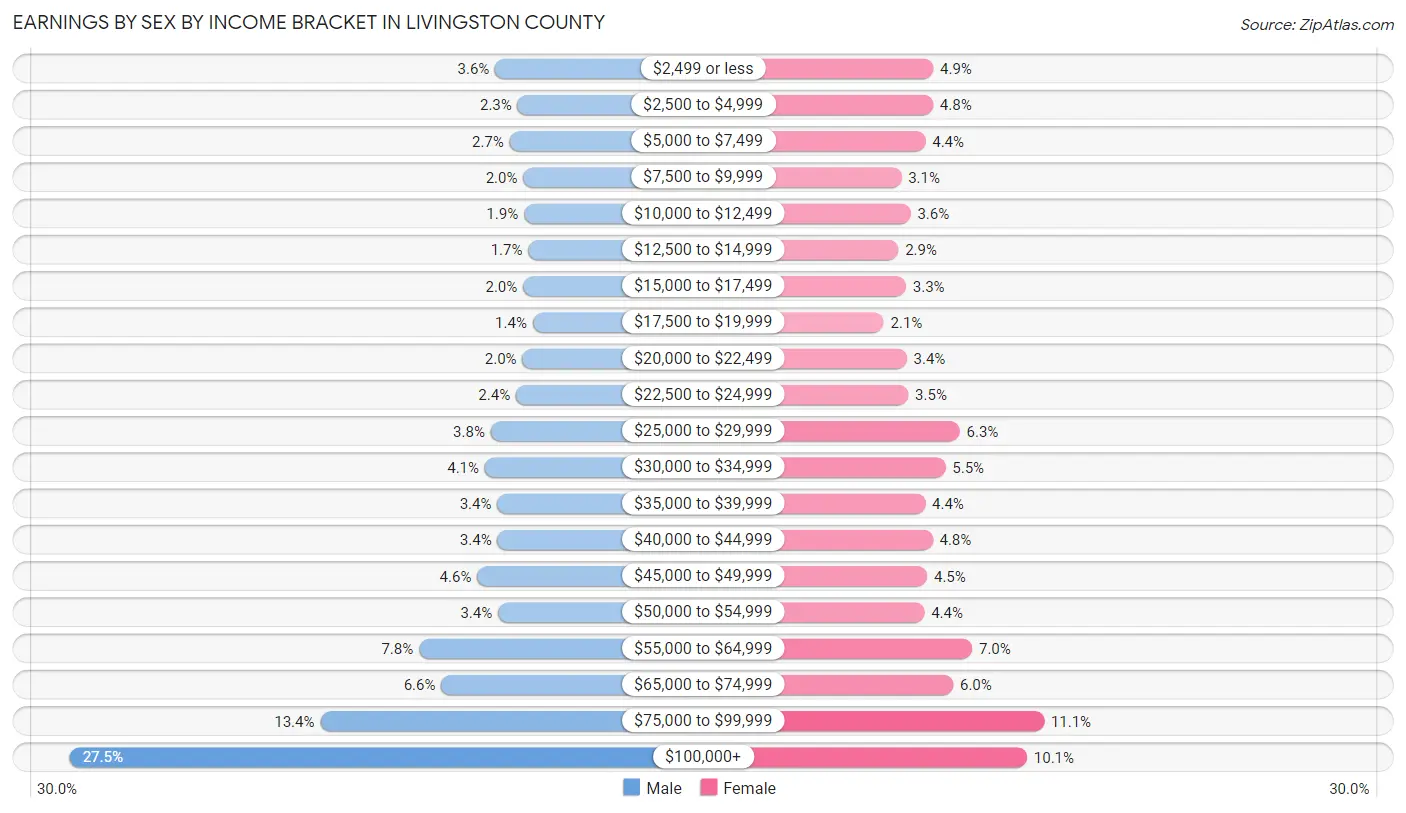
| Income | Male | Female |
| $2,499 or less | 2,098 (3.5%) | 2,387 (4.9%) |
| $2,500 to $4,999 | 1,357 (2.3%) | 2,382 (4.8%) |
| $5,000 to $7,499 | 1,622 (2.7%) | 2,169 (4.4%) |
| $7,500 to $9,999 | 1,167 (2.0%) | 1,505 (3.1%) |
| $10,000 to $12,499 | 1,143 (1.9%) | 1,764 (3.6%) |
| $12,500 to $14,999 | 997 (1.7%) | 1,422 (2.9%) |
| $15,000 to $17,499 | 1,172 (2.0%) | 1,635 (3.3%) |
| $17,500 to $19,999 | 851 (1.4%) | 1,020 (2.1%) |
| $20,000 to $22,499 | 1,197 (2.0%) | 1,653 (3.4%) |
| $22,500 to $24,999 | 1,410 (2.4%) | 1,701 (3.5%) |
| $25,000 to $29,999 | 2,249 (3.8%) | 3,120 (6.3%) |
| $30,000 to $34,999 | 2,440 (4.1%) | 2,728 (5.5%) |
| $35,000 to $39,999 | 2,029 (3.4%) | 2,167 (4.4%) |
| $40,000 to $44,999 | 2,025 (3.4%) | 2,372 (4.8%) |
| $45,000 to $49,999 | 2,699 (4.6%) | 2,223 (4.5%) |
| $50,000 to $54,999 | 2,006 (3.4%) | 2,143 (4.3%) |
| $55,000 to $64,999 | 4,632 (7.8%) | 3,465 (7.0%) |
| $65,000 to $74,999 | 3,892 (6.6%) | 2,941 (6.0%) |
| $75,000 to $99,999 | 7,911 (13.4%) | 5,458 (11.1%) |
| $100,000+ | 16,240 (27.5%) | 4,984 (10.1%) |
| Total | 59,137 (100.0%) | 49,239 (100.0%) |
Earnings by Sex by Educational Attainment in Livingston County
Average earnings in Livingston County are $70,650 for men and $44,943 for women, a difference of 36.4%. Men with an educational attainment of graduate degree enjoy the highest average annual earnings of $113,911, while those with less than high school education earn the least with $36,864. Women with an educational attainment of graduate degree earn the most with the average annual earnings of $76,336, while those with less than high school education have the smallest earnings of $21,762.
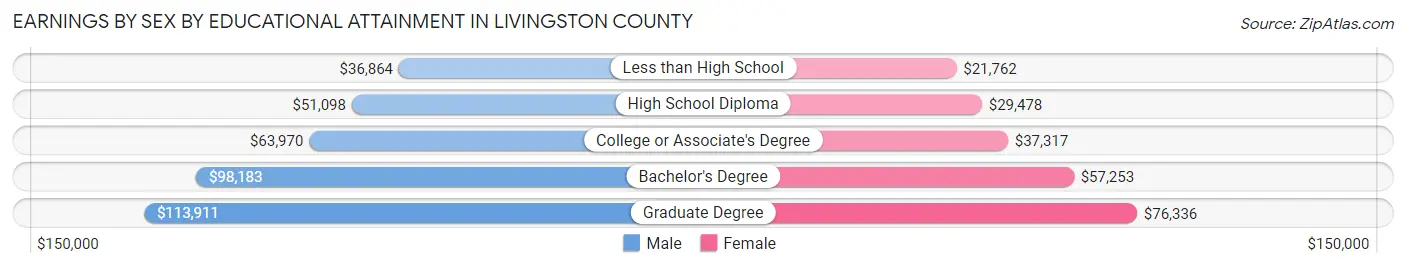
| Educational Attainment | Male Income | Female Income |
| Less than High School | $36,864 | $21,762 |
| High School Diploma | $51,098 | $29,478 |
| College or Associate's Degree | $63,970 | $37,317 |
| Bachelor's Degree | $98,183 | $57,253 |
| Graduate Degree | $113,911 | $76,336 |
| Total | $70,650 | $44,943 |
Family Income in Livingston County
Family Income Brackets in Livingston County
According to the Livingston County family income data, there are 13,339 families falling into the $100,000 to $149,999 income range, which is the most common income bracket and makes up 24.7% of all families. Conversely, the $10,000 to $14,999 income bracket is the least frequent group with only 378 families (0.7%) belonging to this category.
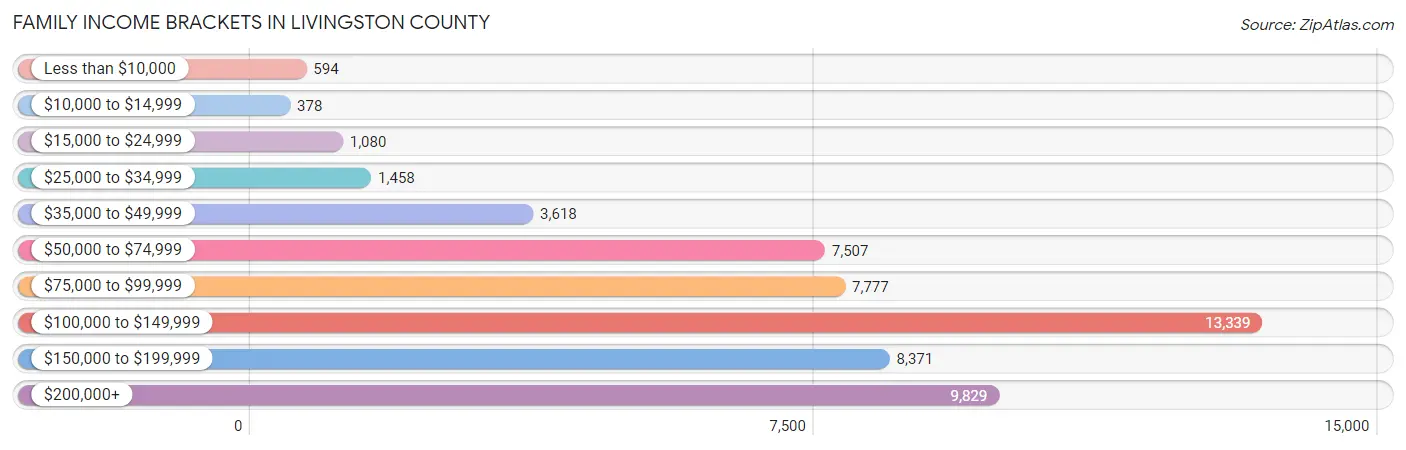
| Income Bracket | # Families | % Families |
| Less than $10,000 | 594 | 1.1% |
| $10,000 to $14,999 | 378 | 0.7% |
| $15,000 to $24,999 | 1,080 | 2.0% |
| $25,000 to $34,999 | 1,458 | 2.7% |
| $35,000 to $49,999 | 3,618 | 6.7% |
| $50,000 to $74,999 | 7,507 | 13.9% |
| $75,000 to $99,999 | 7,777 | 14.4% |
| $100,000 to $149,999 | 13,339 | 24.7% |
| $150,000 to $199,999 | 8,371 | 15.5% |
| $200,000+ | 9,829 | 18.2% |
Family Income by Famaliy Size in Livingston County
5-person families (3,927 | 7.3%) account for the highest median family income in Livingston County with $145,827 per family, while 2-person families (27,042 | 50.1%) have the highest median income of $46,728 per family member.
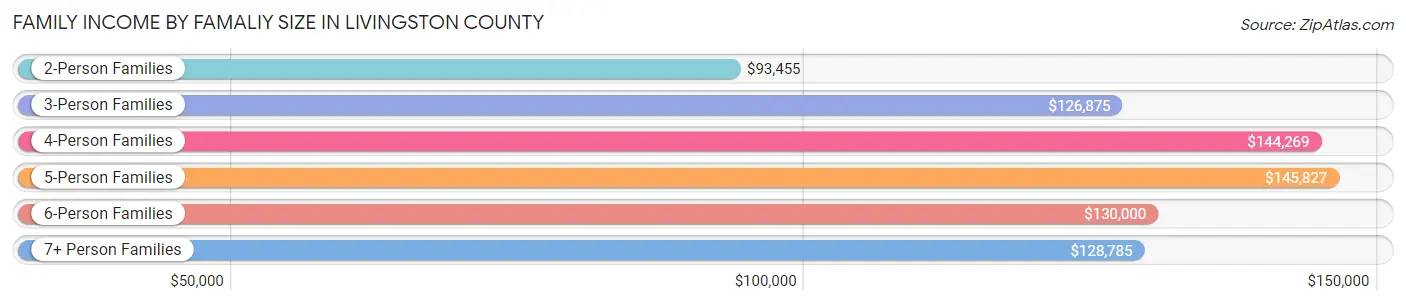
| Income Bracket | # Families | Median Income |
| 2-Person Families | 27,042 (50.1%) | $93,455 |
| 3-Person Families | 11,450 (21.2%) | $126,875 |
| 4-Person Families | 9,618 (17.8%) | $144,269 |
| 5-Person Families | 3,927 (7.3%) | $145,827 |
| 6-Person Families | 1,350 (2.5%) | $130,000 |
| 7+ Person Families | 619 (1.1%) | $128,785 |
| Total | 54,006 (100.0%) | $113,824 |
Family Income by Number of Earners in Livingston County
The median family income in Livingston County is $113,824, with families comprising 3+ earners (7,160) having the highest median family income of $173,077, while families with no earners (9,012) have the lowest median family income of $66,972, accounting for 13.3% and 16.7% of families, respectively.
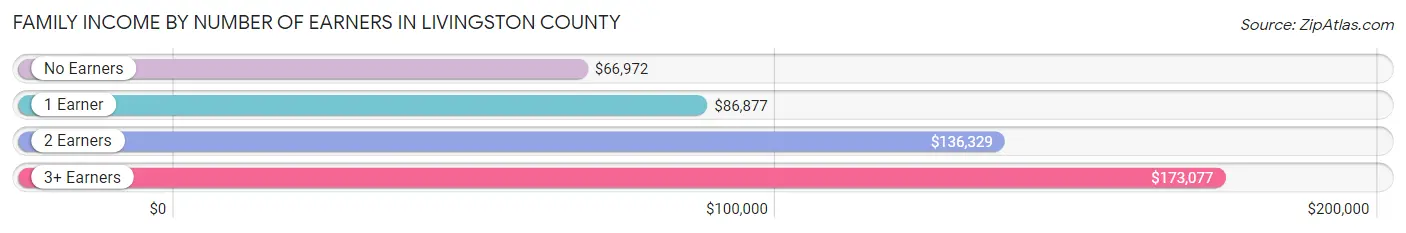
| Number of Earners | # Families | Median Income |
| No Earners | 9,012 (16.7%) | $66,972 |
| 1 Earner | 14,503 (26.9%) | $86,877 |
| 2 Earners | 23,331 (43.2%) | $136,329 |
| 3+ Earners | 7,160 (13.3%) | $173,077 |
| Total | 54,006 (100.0%) | $113,824 |
Household Income in Livingston County
Household Income Brackets in Livingston County
With 15,866 households falling in the category, the $100,000 to $149,999 income range is the most frequent in Livingston County, accounting for 21.2% of all households. In contrast, only 1,272 households (1.7%) fall into the $10,000 to $14,999 income bracket, making it the least populous group.
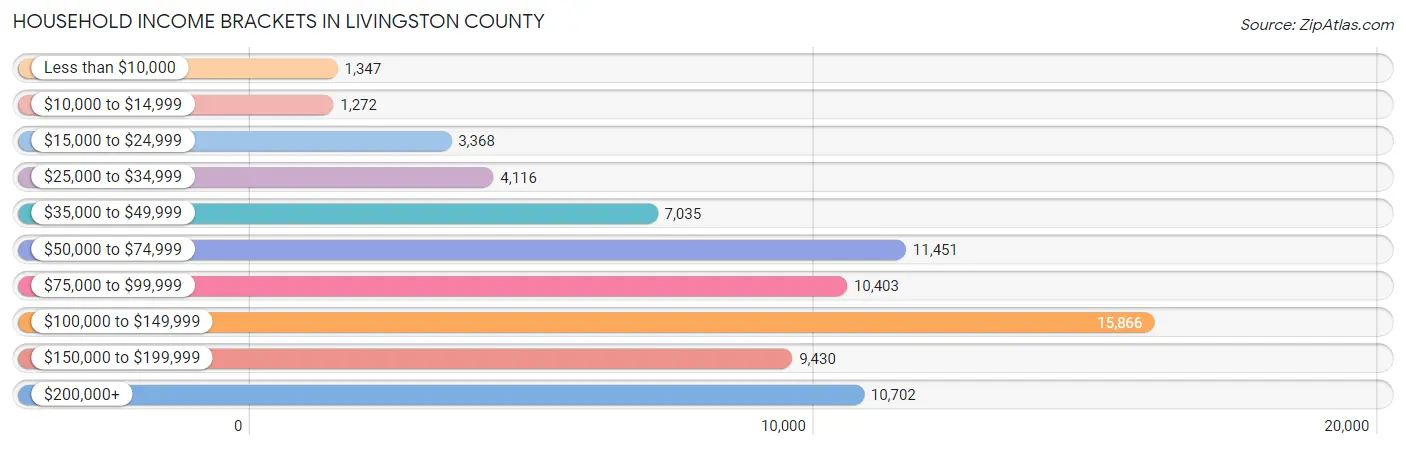
| Income Bracket | # Households | % Households |
| Less than $10,000 | 1,347 | 1.8% |
| $10,000 to $14,999 | 1,272 | 1.7% |
| $15,000 to $24,999 | 3,368 | 4.5% |
| $25,000 to $34,999 | 4,116 | 5.5% |
| $35,000 to $49,999 | 7,035 | 9.4% |
| $50,000 to $74,999 | 11,451 | 15.3% |
| $75,000 to $99,999 | 10,403 | 13.9% |
| $100,000 to $149,999 | 15,866 | 21.2% |
| $150,000 to $199,999 | 9,430 | 12.6% |
| $200,000+ | 10,702 | 14.3% |
Household Income by Householder Age in Livingston County
The median household income in Livingston County is $96,135, with the highest median household income of $115,322 found in the 45 to 64 years age bracket for the primary householder. A total of 31,955 households (42.7%) fall into this category. Meanwhile, the 15 to 24 years age bracket for the primary householder has the lowest median household income of $56,139, with 1,611 households (2.1%) in this group.
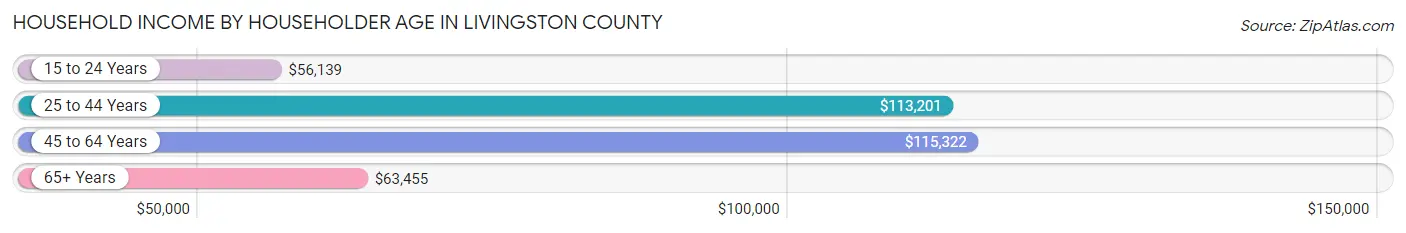
| Income Bracket | # Households | Median Income |
| 15 to 24 Years | 1,611 (2.1%) | $56,139 |
| 25 to 44 Years | 19,445 (26.0%) | $113,201 |
| 45 to 64 Years | 31,955 (42.7%) | $115,322 |
| 65+ Years | 21,830 (29.2%) | $63,455 |
| Total | 74,841 (100.0%) | $96,135 |
Poverty in Livingston County
Income Below Poverty by Sex and Age in Livingston County
With 4.2% poverty level for males and 5.6% for females among the residents of Livingston County, 15 year old males and 18 to 24 year old females are the most vulnerable to poverty, with 178 males (12.1%) and 801 females (10.7%) in their respective age groups living below the poverty level.
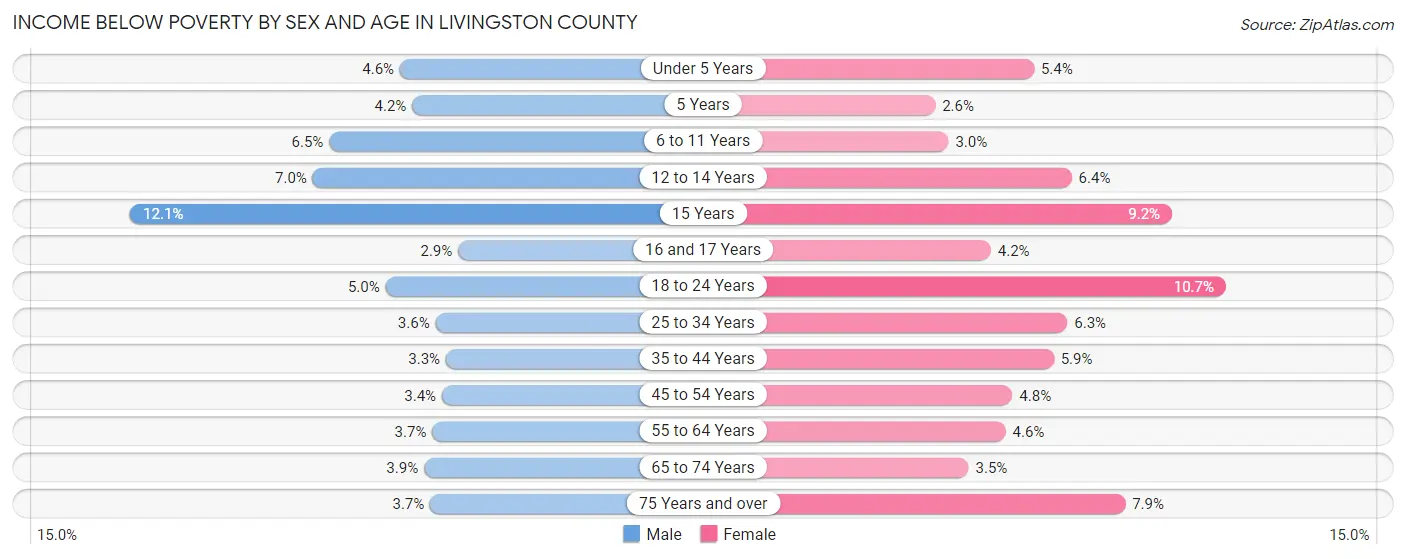
| Age Bracket | Male | Female |
| Under 5 Years | 212 (4.5%) | 247 (5.3%) |
| 5 Years | 60 (4.2%) | 27 (2.6%) |
| 6 to 11 Years | 410 (6.5%) | 195 (3.0%) |
| 12 to 14 Years | 259 (7.0%) | 203 (6.4%) |
| 15 Years | 178 (12.1%) | 113 (9.2%) |
| 16 and 17 Years | 80 (2.9%) | 106 (4.2%) |
| 18 to 24 Years | 413 (5.0%) | 801 (10.7%) |
| 25 to 34 Years | 393 (3.6%) | 636 (6.3%) |
| 35 to 44 Years | 379 (3.3%) | 659 (5.9%) |
| 45 to 54 Years | 458 (3.4%) | 648 (4.8%) |
| 55 to 64 Years | 573 (3.6%) | 700 (4.6%) |
| 65 to 74 Years | 422 (3.9%) | 394 (3.5%) |
| 75 Years and over | 220 (3.7%) | 576 (7.9%) |
| Total | 4,057 (4.2%) | 5,305 (5.6%) |
Income Above Poverty by Sex and Age in Livingston County
According to the poverty statistics in Livingston County, males aged 16 and 17 years and females aged 5 years are the age groups that are most secure financially, with 97.1% of males and 97.4% of females in these age groups living above the poverty line.
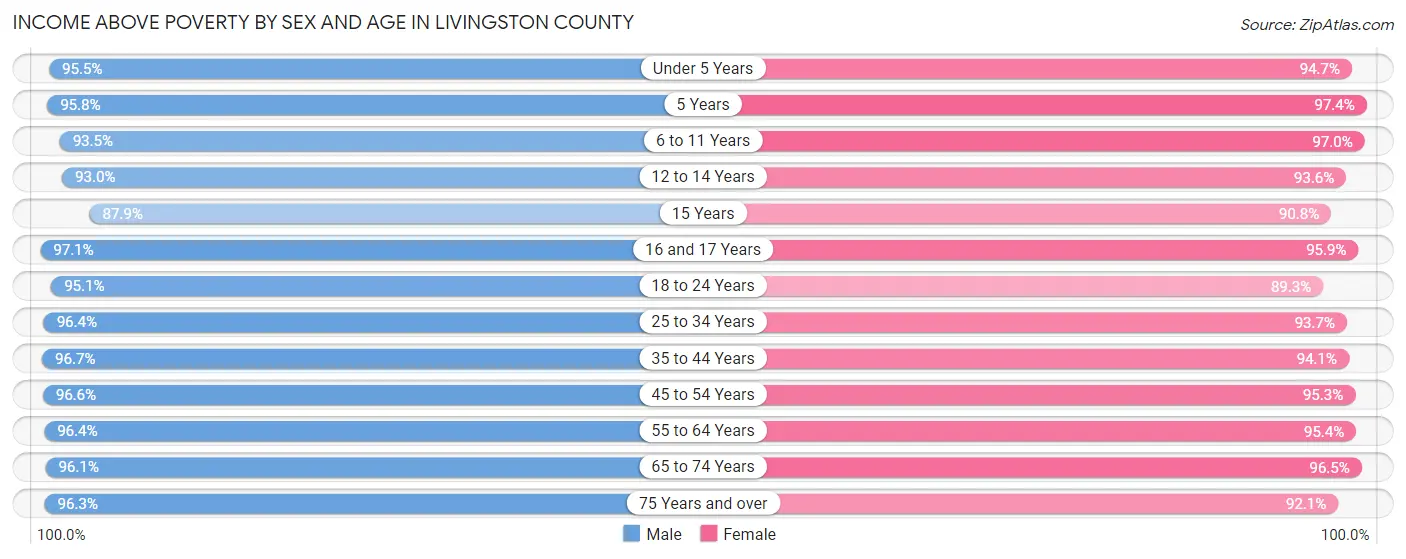
| Age Bracket | Male | Female |
| Under 5 Years | 4,452 (95.5%) | 4,369 (94.7%) |
| 5 Years | 1,364 (95.8%) | 1,010 (97.4%) |
| 6 to 11 Years | 5,878 (93.5%) | 6,364 (97.0%) |
| 12 to 14 Years | 3,449 (93.0%) | 2,971 (93.6%) |
| 15 Years | 1,298 (87.9%) | 1,116 (90.8%) |
| 16 and 17 Years | 2,648 (97.1%) | 2,449 (95.9%) |
| 18 to 24 Years | 7,924 (95.1%) | 6,691 (89.3%) |
| 25 to 34 Years | 10,633 (96.4%) | 9,493 (93.7%) |
| 35 to 44 Years | 11,225 (96.7%) | 10,504 (94.1%) |
| 45 to 54 Years | 13,102 (96.6%) | 12,986 (95.3%) |
| 55 to 64 Years | 15,146 (96.4%) | 14,663 (95.4%) |
| 65 to 74 Years | 10,441 (96.1%) | 10,766 (96.5%) |
| 75 Years and over | 5,716 (96.3%) | 6,726 (92.1%) |
| Total | 93,276 (95.8%) | 90,108 (94.4%) |
Income Below Poverty Among Married-Couple Families in Livingston County
The poverty statistics for married-couple families in Livingston County show that 1.7% or 771 of the total 45,500 families live below the poverty line. Families with 3 or 4 children have the highest poverty rate of 4.4%, comprising of 153 families. On the other hand, families with 5 or more children have the lowest poverty rate of 0.0%, which includes 0 families.
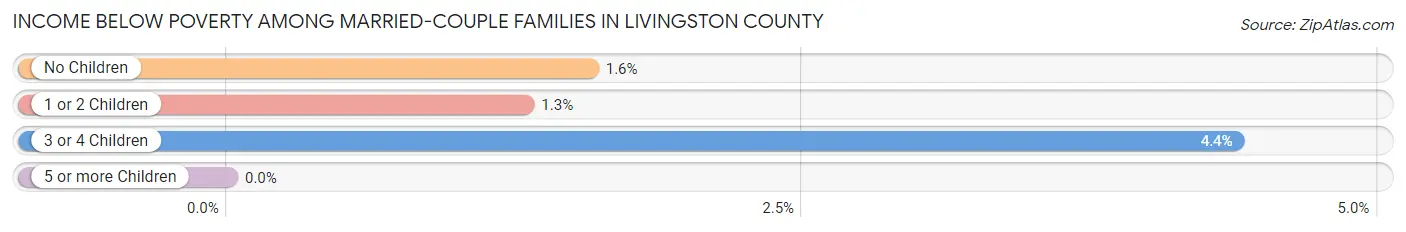
| Children | Above Poverty | Below Poverty |
| No Children | 27,836 (98.4%) | 444 (1.6%) |
| 1 or 2 Children | 13,268 (98.7%) | 174 (1.3%) |
| 3 or 4 Children | 3,344 (95.6%) | 153 (4.4%) |
| 5 or more Children | 281 (100.0%) | 0 (0.0%) |
| Total | 44,729 (98.3%) | 771 (1.7%) |
Income Below Poverty Among Single-Parent Households in Livingston County
According to the poverty data in Livingston County, 5.2% or 171 single-father households and 12.2% or 633 single-mother households are living below the poverty line. Among single-father households, those with 3 or 4 children have the highest poverty rate, with 16 households (14.3%) experiencing poverty. Likewise, among single-mother households, those with 5 or more children have the highest poverty rate, with 28 households (56.0%) falling below the poverty line.
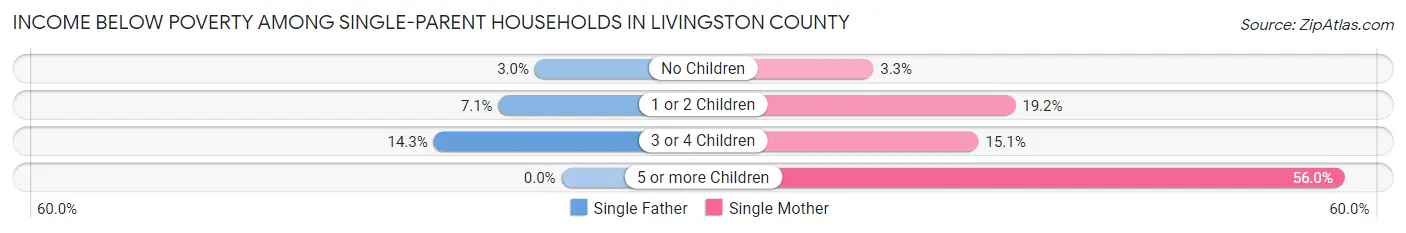
| Children | Single Father | Single Mother |
| No Children | 51 (3.0%) | 77 (3.3%) |
| 1 or 2 Children | 104 (7.0%) | 473 (19.2%) |
| 3 or 4 Children | 16 (14.3%) | 55 (15.1%) |
| 5 or more Children | 0 (0.0%) | 28 (56.0%) |
| Total | 171 (5.2%) | 633 (12.2%) |
Income Below Poverty Among Married-Couple vs Single-Parent Households in Livingston County
The poverty data for Livingston County shows that 771 of the married-couple family households (1.7%) and 804 of the single-parent households (9.5%) are living below the poverty level. Within the married-couple family households, those with 3 or 4 children have the highest poverty rate, with 153 households (4.4%) falling below the poverty line. Among the single-parent households, those with 5 or more children have the highest poverty rate, with 28 household (56.0%) living below poverty.
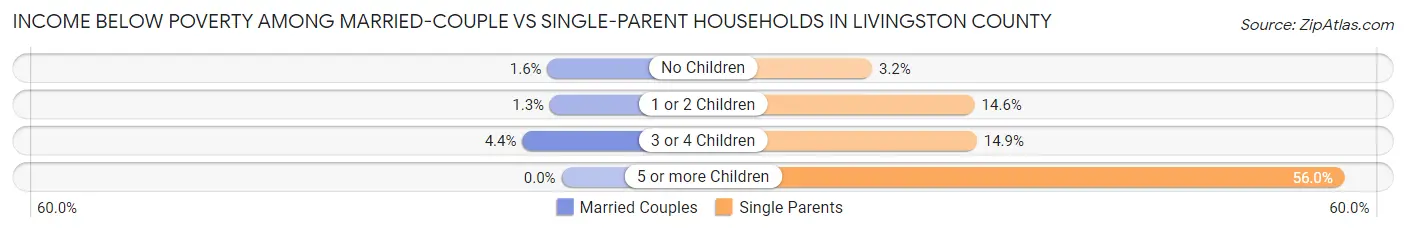
| Children | Married-Couple Families | Single-Parent Households |
| No Children | 444 (1.6%) | 128 (3.2%) |
| 1 or 2 Children | 174 (1.3%) | 577 (14.6%) |
| 3 or 4 Children | 153 (4.4%) | 71 (14.9%) |
| 5 or more Children | 0 (0.0%) | 28 (56.0%) |
| Total | 771 (1.7%) | 804 (9.5%) |
Employment Characteristics in Livingston County
Employment by Class of Employer in Livingston County
Among the 97,209 employed individuals in Livingston County, private company employees (71,466 | 73.5%), not-for-profit organizations (7,050 | 7.2%), and self-employed (not incorporated) (4,761 | 4.9%) make up the most common classes of employment.
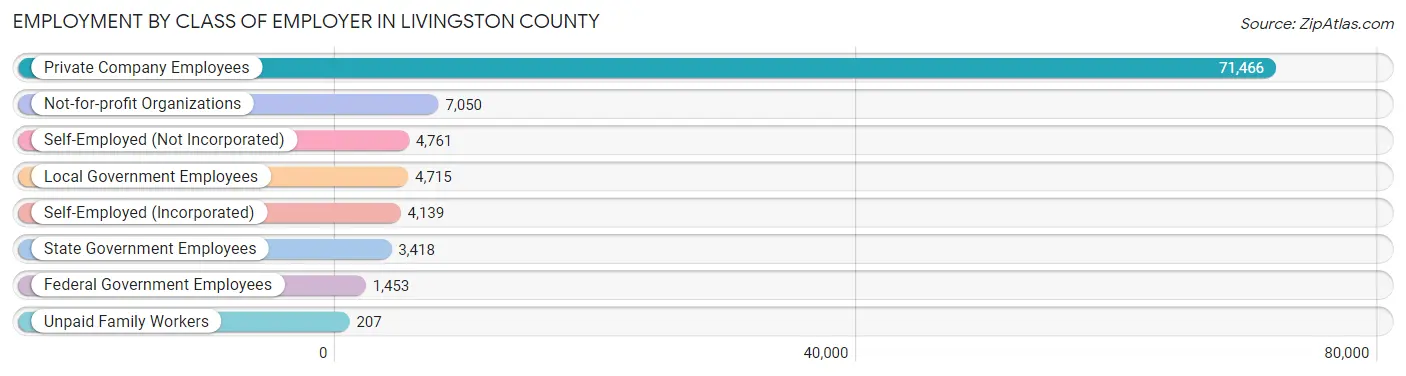
| Employer Class | # Employees | % Employees |
| Private Company Employees | 71,466 | 73.5% |
| Self-Employed (Incorporated) | 4,139 | 4.3% |
| Self-Employed (Not Incorporated) | 4,761 | 4.9% |
| Not-for-profit Organizations | 7,050 | 7.2% |
| Local Government Employees | 4,715 | 4.9% |
| State Government Employees | 3,418 | 3.5% |
| Federal Government Employees | 1,453 | 1.5% |
| Unpaid Family Workers | 207 | 0.2% |
| Total | 97,209 | 100.0% |
Employment Status by Age in Livingston County
According to the labor force statistics for Livingston County, out of the total population over 16 years of age (159,483), 64.4% or 102,707 individuals are in the labor force, with 4.0% or 4,108 of them unemployed. The age group with the highest labor force participation rate is 25 to 29 years, with 87.7% or 9,260 individuals in the labor force. Within the labor force, the 16 to 19 years age range has the highest percentage of unemployed individuals, with 11.9% or 618 of them being unemployed.
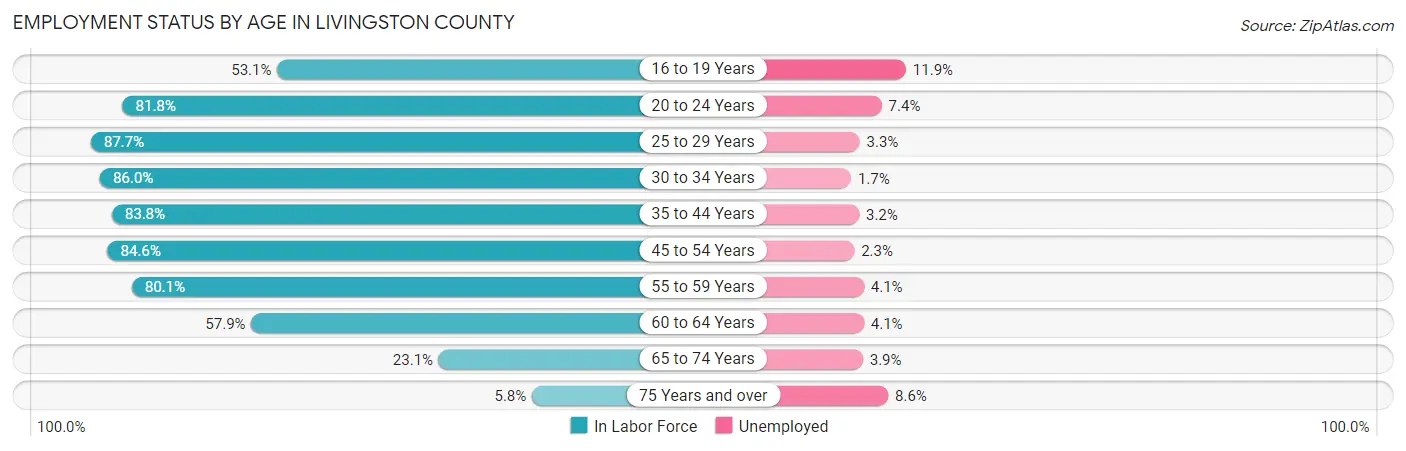
| Age Bracket | In Labor Force | Unemployed |
| 16 to 19 Years | 5,192 (53.1%) | 618 (11.9%) |
| 20 to 24 Years | 9,314 (81.8%) | 689 (7.4%) |
| 25 to 29 Years | 9,260 (87.7%) | 306 (3.3%) |
| 30 to 34 Years | 9,220 (86.0%) | 157 (1.7%) |
| 35 to 44 Years | 19,242 (83.8%) | 616 (3.2%) |
| 45 to 54 Years | 23,112 (84.6%) | 532 (2.3%) |
| 55 to 59 Years | 12,394 (80.1%) | 508 (4.1%) |
| 60 to 64 Years | 9,082 (57.9%) | 372 (4.1%) |
| 65 to 74 Years | 5,106 (23.1%) | 199 (3.9%) |
| 75 Years and over | 783 (5.8%) | 67 (8.6%) |
| Total | 102,707 (64.4%) | 4,108 (4.0%) |
Employment Status by Educational Attainment in Livingston County
According to labor force statistics for Livingston County, 80.1% of individuals (82,278) out of the total population between 25 and 64 years of age (102,719) are in the labor force, with 3.0% or 2,468 of them being unemployed. The group with the highest labor force participation rate are those with the educational attainment of bachelor's degree or higher, with 86.1% or 36,394 individuals in the labor force. Within the labor force, individuals with less than high school education have the highest percentage of unemployment, with 8.2% or 160 of them being unemployed.
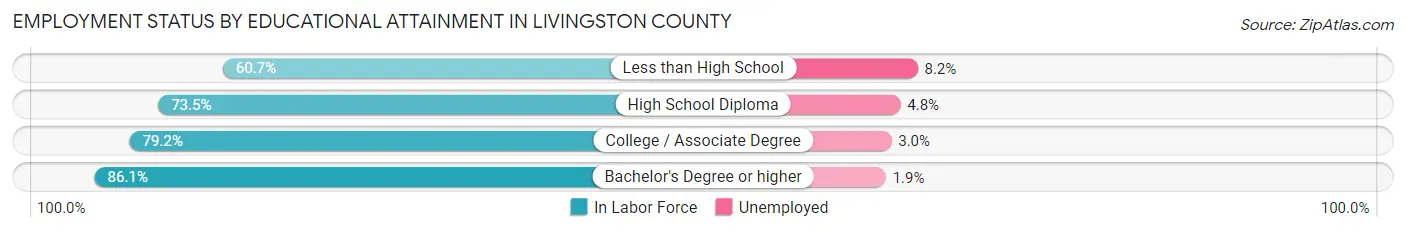
| Educational Attainment | In Labor Force | Unemployed |
| Less than High School | 1,953 (60.7%) | 264 (8.2%) |
| High School Diploma | 17,354 (73.5%) | 1,133 (4.8%) |
| College / Associate Degree | 26,629 (79.2%) | 1,009 (3.0%) |
| Bachelor's Degree or higher | 36,394 (86.1%) | 803 (1.9%) |
| Total | 82,278 (80.1%) | 3,082 (3.0%) |
Employment Occupations by Sex in Livingston County
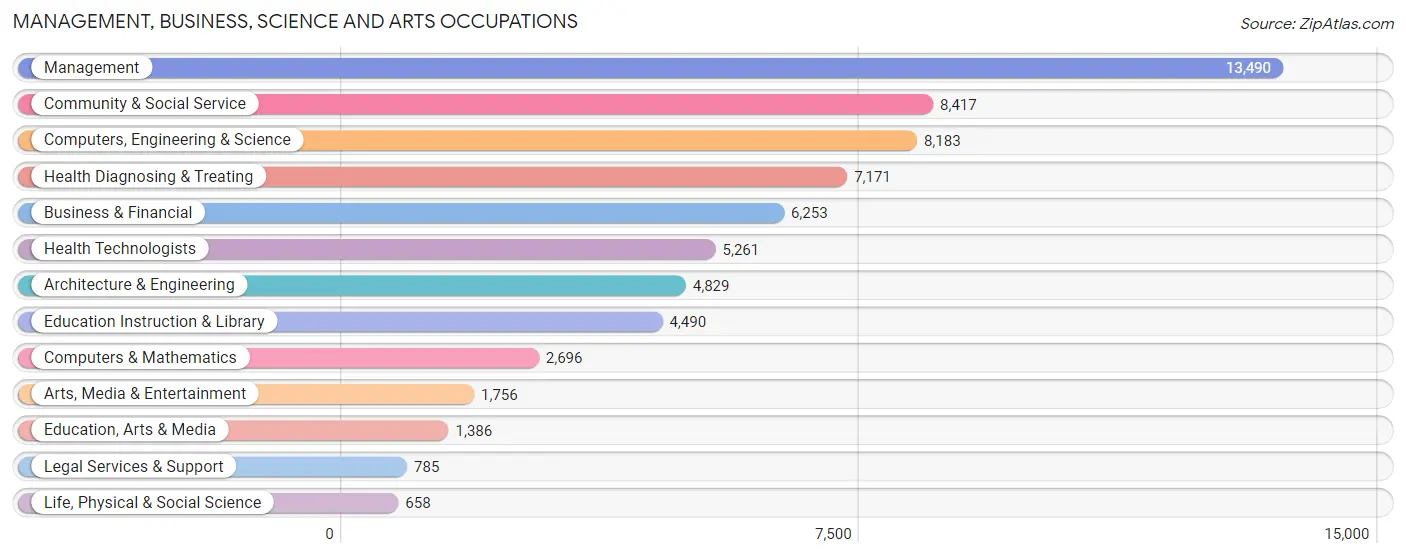
Management, Business, Science and Arts Occupations
The most common Management, Business, Science and Arts occupations in Livingston County are Management (13,490 | 13.7%), Community & Social Service (8,417 | 8.5%), Computers, Engineering & Science (8,183 | 8.3%), Health Diagnosing & Treating (7,171 | 7.3%), and Business & Financial (6,253 | 6.4%).
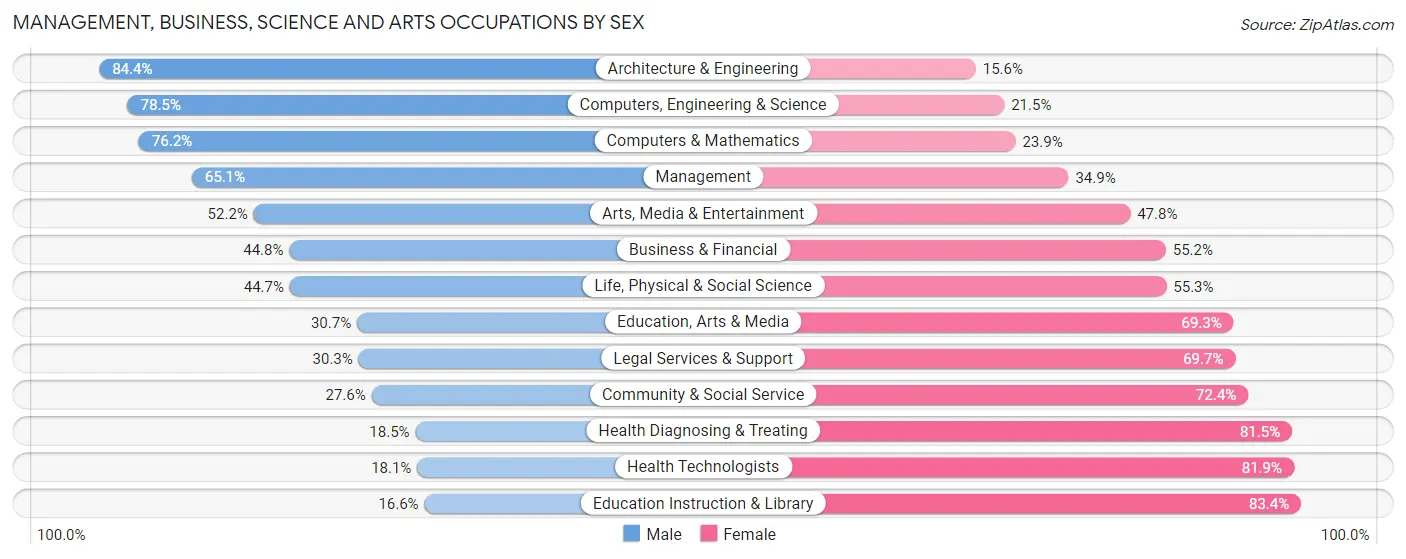
Management, Business, Science and Arts Occupations by Sex
Within the Management, Business, Science and Arts occupations in Livingston County, the most male-oriented occupations are Architecture & Engineering (84.4%), Computers, Engineering & Science (78.5%), and Computers & Mathematics (76.1%), while the most female-oriented occupations are Education Instruction & Library (83.4%), Health Technologists (81.9%), and Health Diagnosing & Treating (81.5%).
| Occupation | Male | Female |
| Management | 8,782 (65.1%) | 4,708 (34.9%) |
| Business & Financial | 2,801 (44.8%) | 3,452 (55.2%) |
| Computers, Engineering & Science | 6,424 (78.5%) | 1,759 (21.5%) |
| Computers & Mathematics | 2,053 (76.1%) | 643 (23.8%) |
| Architecture & Engineering | 4,077 (84.4%) | 752 (15.6%) |
| Life, Physical & Social Science | 294 (44.7%) | 364 (55.3%) |
| Community & Social Service | 2,325 (27.6%) | 6,092 (72.4%) |
| Education, Arts & Media | 425 (30.7%) | 961 (69.3%) |
| Legal Services & Support | 238 (30.3%) | 547 (69.7%) |
| Education Instruction & Library | 745 (16.6%) | 3,745 (83.4%) |
| Arts, Media & Entertainment | 917 (52.2%) | 839 (47.8%) |
| Health Diagnosing & Treating | 1,325 (18.5%) | 5,846 (81.5%) |
| Health Technologists | 952 (18.1%) | 4,309 (81.9%) |
| Total (Category) | 21,657 (49.8%) | 21,857 (50.2%) |
| Total (Overall) | 53,547 (54.3%) | 44,987 (45.7%) |
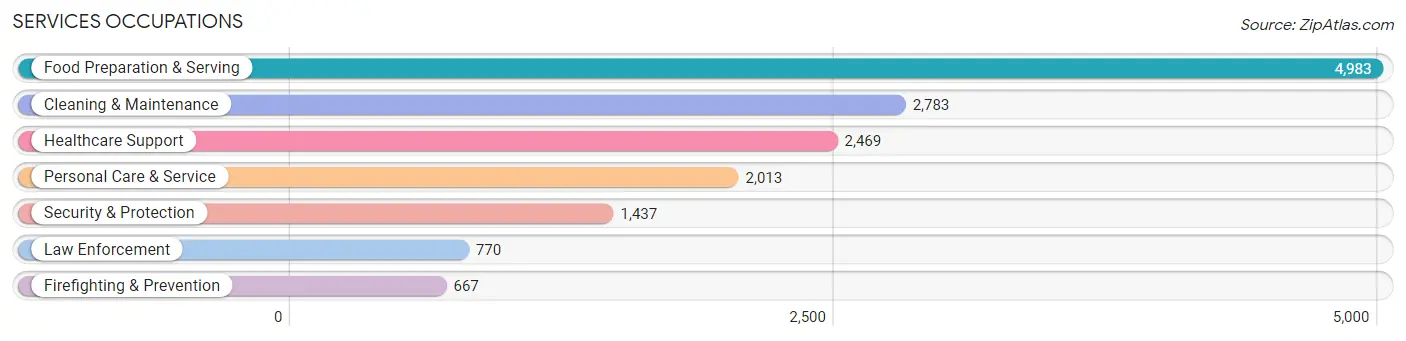
Services Occupations
The most common Services occupations in Livingston County are Food Preparation & Serving (4,983 | 5.1%), Cleaning & Maintenance (2,783 | 2.8%), Healthcare Support (2,469 | 2.5%), Personal Care & Service (2,013 | 2.0%), and Security & Protection (1,437 | 1.5%).
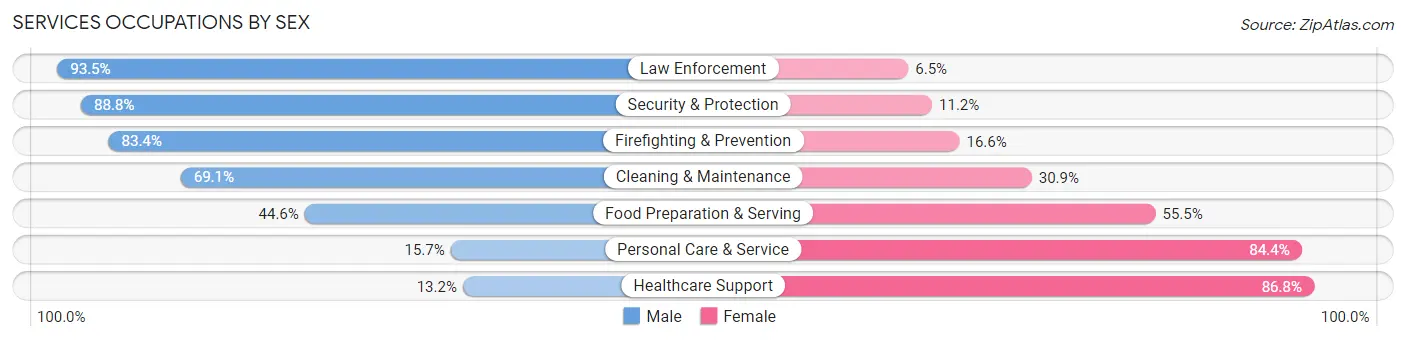
Services Occupations by Sex
Within the Services occupations in Livingston County, the most male-oriented occupations are Law Enforcement (93.5%), Security & Protection (88.8%), and Firefighting & Prevention (83.4%), while the most female-oriented occupations are Healthcare Support (86.8%), Personal Care & Service (84.4%), and Food Preparation & Serving (55.4%).
| Occupation | Male | Female |
| Healthcare Support | 327 (13.2%) | 2,142 (86.8%) |
| Security & Protection | 1,276 (88.8%) | 161 (11.2%) |
| Firefighting & Prevention | 556 (83.4%) | 111 (16.6%) |
| Law Enforcement | 720 (93.5%) | 50 (6.5%) |
| Food Preparation & Serving | 2,220 (44.6%) | 2,763 (55.4%) |
| Cleaning & Maintenance | 1,922 (69.1%) | 861 (30.9%) |
| Personal Care & Service | 315 (15.7%) | 1,698 (84.4%) |
| Total (Category) | 6,060 (44.3%) | 7,625 (55.7%) |
| Total (Overall) | 53,547 (54.3%) | 44,987 (45.7%) |
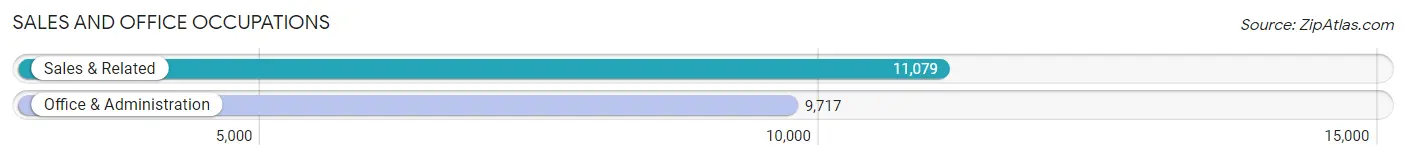
Sales and Office Occupations
The most common Sales and Office occupations in Livingston County are Sales & Related (11,079 | 11.2%), and Office & Administration (9,717 | 9.9%).
Sales and Office Occupations by Sex
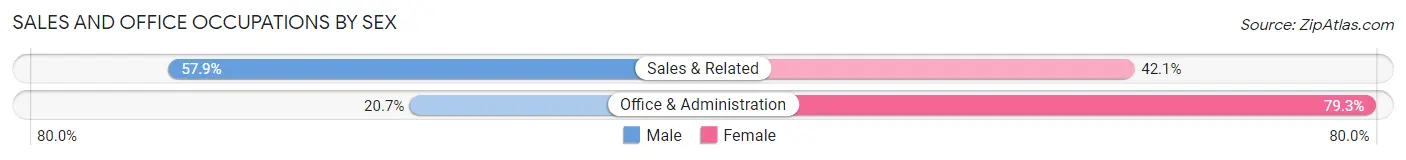
| Occupation | Male | Female |
| Sales & Related | 6,413 (57.9%) | 4,666 (42.1%) |
| Office & Administration | 2,009 (20.7%) | 7,708 (79.3%) |
| Total (Category) | 8,422 (40.5%) | 12,374 (59.5%) |
| Total (Overall) | 53,547 (54.3%) | 44,987 (45.7%) |
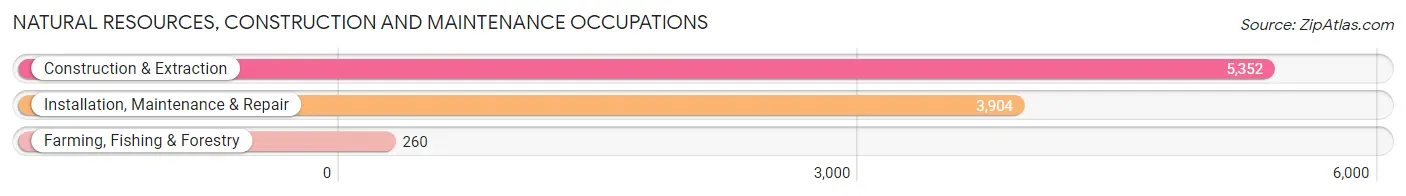
Natural Resources, Construction and Maintenance Occupations
The most common Natural Resources, Construction and Maintenance occupations in Livingston County are Construction & Extraction (5,352 | 5.4%), Installation, Maintenance & Repair (3,904 | 4.0%), and Farming, Fishing & Forestry (260 | 0.3%).
Natural Resources, Construction and Maintenance Occupations by Sex
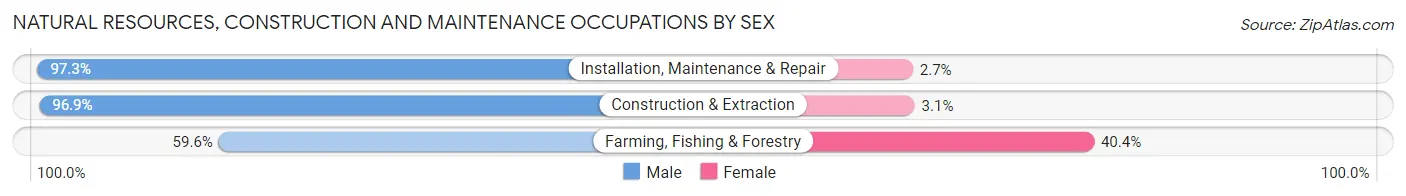
| Occupation | Male | Female |
| Farming, Fishing & Forestry | 155 (59.6%) | 105 (40.4%) |
| Construction & Extraction | 5,188 (96.9%) | 164 (3.1%) |
| Installation, Maintenance & Repair | 3,799 (97.3%) | 105 (2.7%) |
| Total (Category) | 9,142 (96.1%) | 374 (3.9%) |
| Total (Overall) | 53,547 (54.3%) | 44,987 (45.7%) |
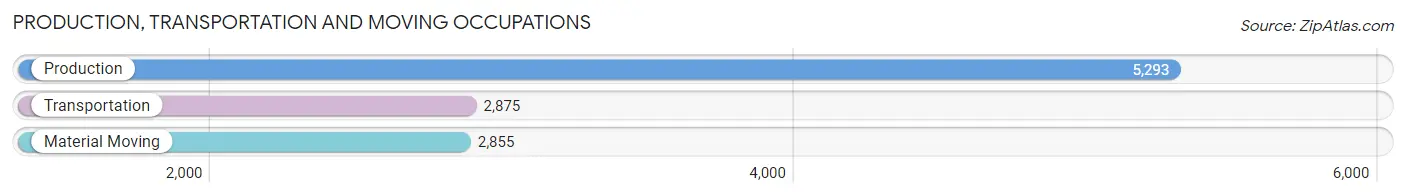
Production, Transportation and Moving Occupations
The most common Production, Transportation and Moving occupations in Livingston County are Production (5,293 | 5.4%), Transportation (2,875 | 2.9%), and Material Moving (2,855 | 2.9%).
Production, Transportation and Moving Occupations by Sex
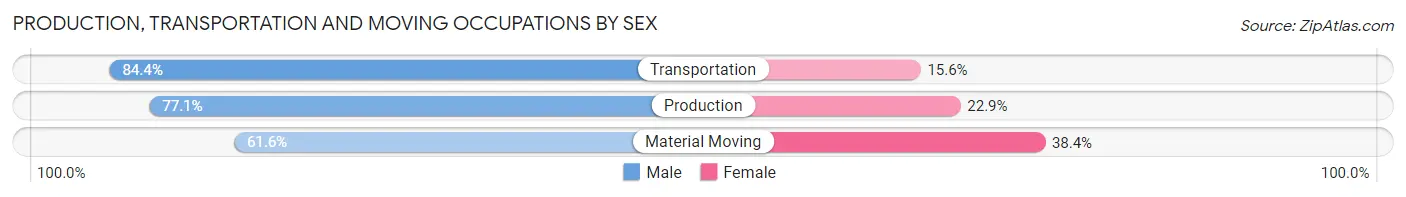
| Occupation | Male | Female |
| Production | 4,081 (77.1%) | 1,212 (22.9%) |
| Transportation | 2,427 (84.4%) | 448 (15.6%) |
| Material Moving | 1,758 (61.6%) | 1,097 (38.4%) |
| Total (Category) | 8,266 (75.0%) | 2,757 (25.0%) |
| Total (Overall) | 53,547 (54.3%) | 44,987 (45.7%) |
Employment Industries by Sex in Livingston County
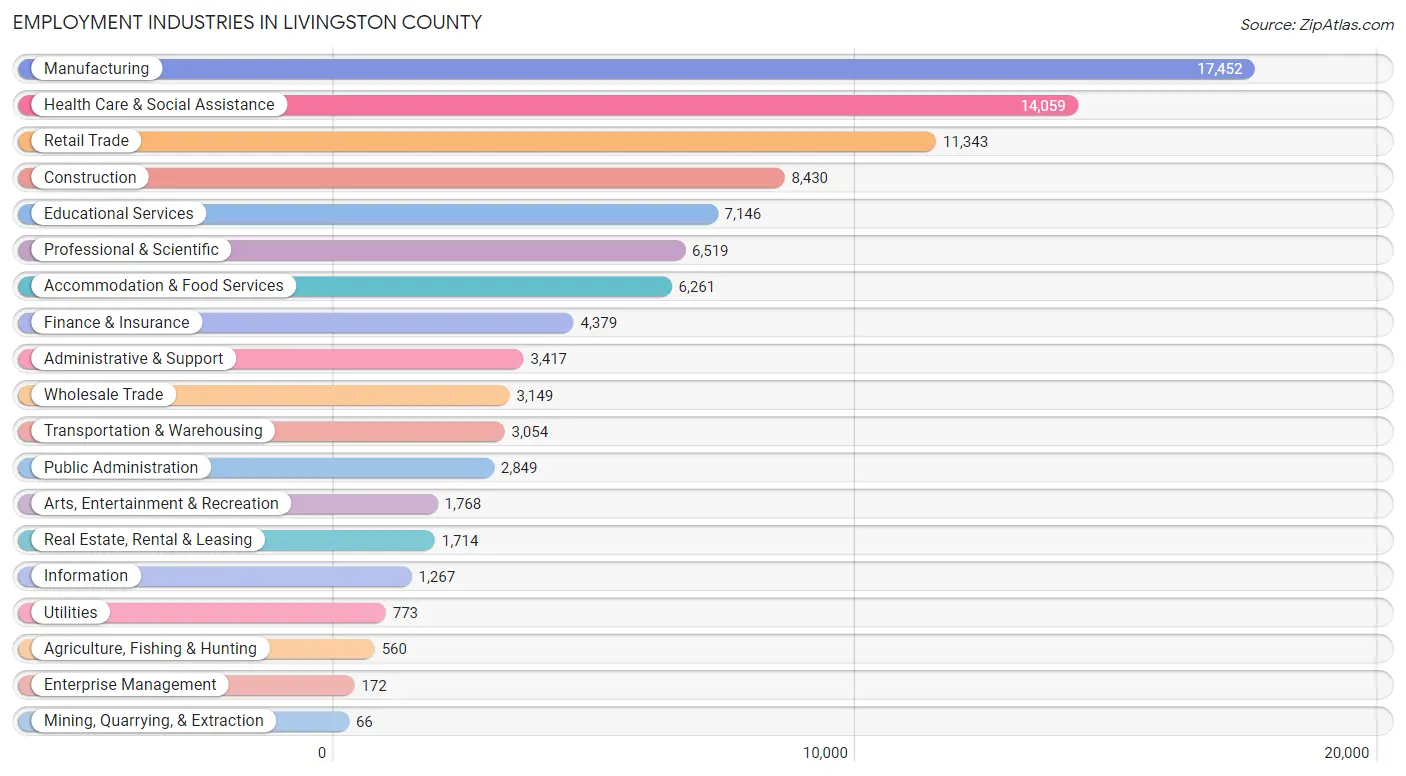
Employment Industries in Livingston County
The major employment industries in Livingston County include Manufacturing (17,452 | 17.7%), Health Care & Social Assistance (14,059 | 14.3%), Retail Trade (11,343 | 11.5%), Construction (8,430 | 8.6%), and Educational Services (7,146 | 7.2%).
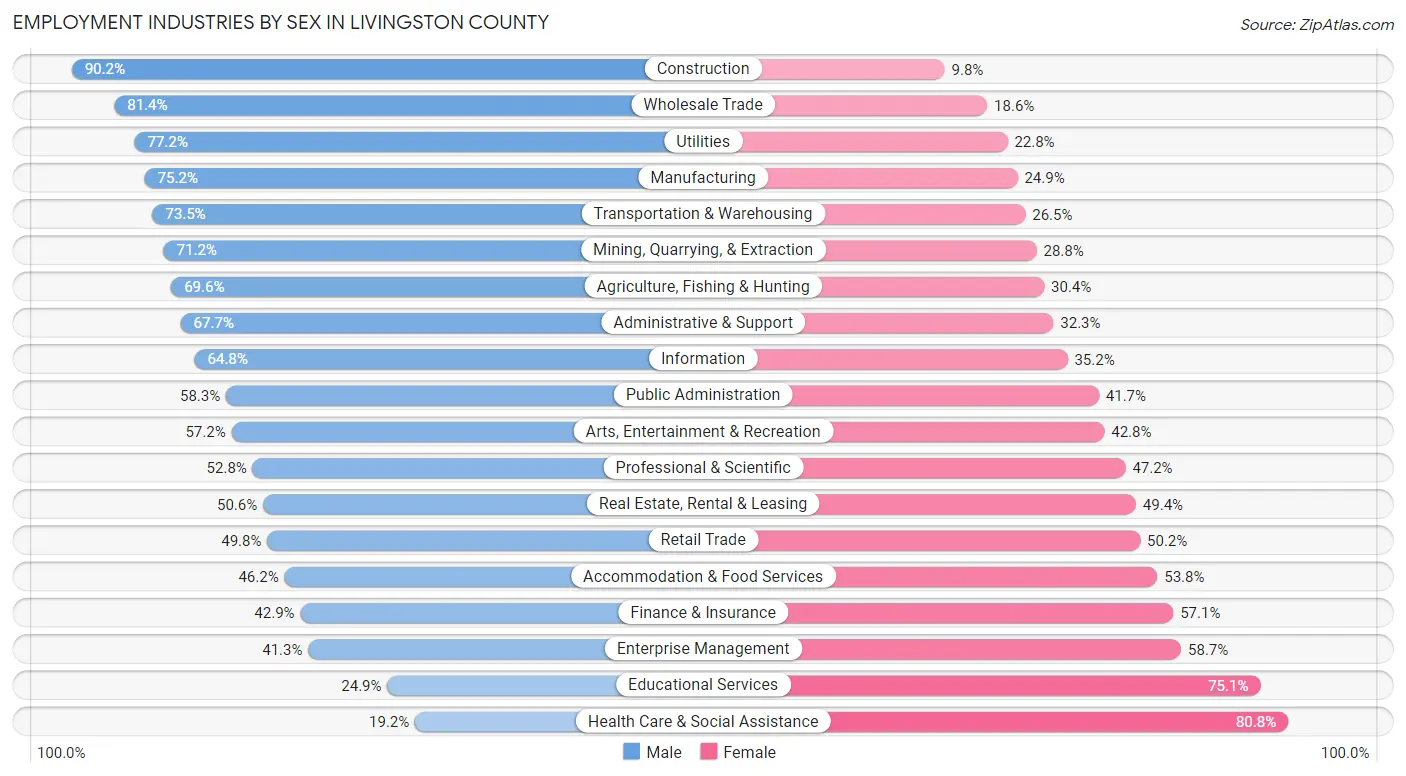
Employment Industries by Sex in Livingston County
The Livingston County industries that see more men than women are Construction (90.2%), Wholesale Trade (81.4%), and Utilities (77.2%), whereas the industries that tend to have a higher number of women are Health Care & Social Assistance (80.8%), Educational Services (75.1%), and Enterprise Management (58.7%).
| Industry | Male | Female |
| Agriculture, Fishing & Hunting | 390 (69.6%) | 170 (30.4%) |
| Mining, Quarrying, & Extraction | 47 (71.2%) | 19 (28.8%) |
| Construction | 7,607 (90.2%) | 823 (9.8%) |
| Manufacturing | 13,115 (75.1%) | 4,337 (24.8%) |
| Wholesale Trade | 2,564 (81.4%) | 585 (18.6%) |
| Retail Trade | 5,645 (49.8%) | 5,698 (50.2%) |
| Transportation & Warehousing | 2,246 (73.5%) | 808 (26.5%) |
| Utilities | 597 (77.2%) | 176 (22.8%) |
| Information | 821 (64.8%) | 446 (35.2%) |
| Finance & Insurance | 1,879 (42.9%) | 2,500 (57.1%) |
| Real Estate, Rental & Leasing | 868 (50.6%) | 846 (49.4%) |
| Professional & Scientific | 3,442 (52.8%) | 3,077 (47.2%) |
| Enterprise Management | 71 (41.3%) | 101 (58.7%) |
| Administrative & Support | 2,314 (67.7%) | 1,103 (32.3%) |
| Educational Services | 1,780 (24.9%) | 5,366 (75.1%) |
| Health Care & Social Assistance | 2,695 (19.2%) | 11,364 (80.8%) |
| Arts, Entertainment & Recreation | 1,011 (57.2%) | 757 (42.8%) |
| Accommodation & Food Services | 2,893 (46.2%) | 3,368 (53.8%) |
| Public Administration | 1,661 (58.3%) | 1,188 (41.7%) |
| Total | 53,547 (54.3%) | 44,987 (45.7%) |
Education in Livingston County
School Enrollment in Livingston County
The most common levels of schooling among the 42,844 students in Livingston County are high school (10,309 | 24.1%), middle school (8,907 | 20.8%), and elementary school (8,549 | 20.0%).
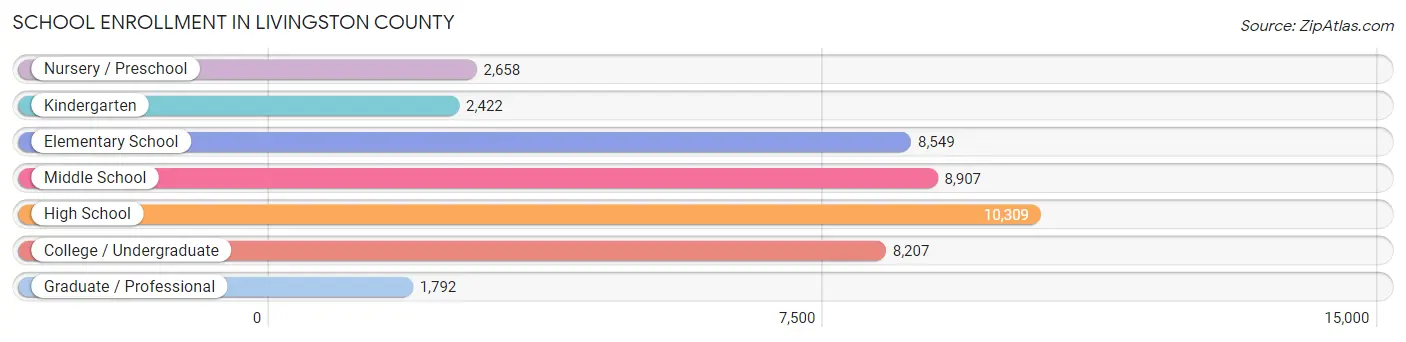
| School Level | # Students | % Students |
| Nursery / Preschool | 2,658 | 6.2% |
| Kindergarten | 2,422 | 5.7% |
| Elementary School | 8,549 | 20.0% |
| Middle School | 8,907 | 20.8% |
| High School | 10,309 | 24.1% |
| College / Undergraduate | 8,207 | 19.2% |
| Graduate / Professional | 1,792 | 4.2% |
| Total | 42,844 | 100.0% |
School Enrollment by Age by Funding Source in Livingston County
Out of a total of 42,844 students who are enrolled in schools in Livingston County, 6,127 (14.3%) attend a private institution, while the remaining 36,717 (85.7%) are enrolled in public schools. The age group of 3 to 4 year olds has the highest likelihood of being enrolled in private schools, with 897 (44.3% in the age bracket) enrolled. Conversely, the age group of 15 to 17 year olds has the lowest likelihood of being enrolled in a private school, with 6,926 (90.7% in the age bracket) attending a public institution.
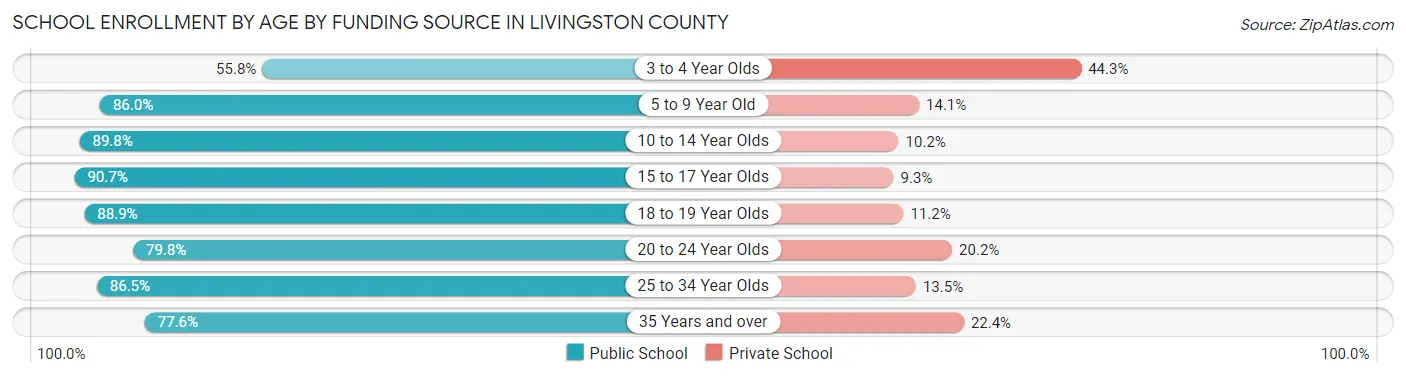
| Age Bracket | Public School | Private School |
| 3 to 4 Year Olds | 1,130 (55.7%) | 897 (44.3%) |
| 5 to 9 Year Old | 9,027 (86.0%) | 1,476 (14.1%) |
| 10 to 14 Year Olds | 10,155 (89.8%) | 1,159 (10.2%) |
| 15 to 17 Year Olds | 6,926 (90.7%) | 710 (9.3%) |
| 18 to 19 Year Olds | 2,980 (88.8%) | 374 (11.2%) |
| 20 to 24 Year Olds | 3,416 (79.8%) | 865 (20.2%) |
| 25 to 34 Year Olds | 1,670 (86.5%) | 260 (13.5%) |
| 35 Years and over | 1,396 (77.6%) | 403 (22.4%) |
| Total | 36,717 (85.7%) | 6,127 (14.3%) |
Educational Attainment by Field of Study in Livingston County
Business (13,005 | 22.9%), engineering (7,293 | 12.9%), science & technology (6,761 | 11.9%), education (6,227 | 11.0%), and arts & humanities (3,844 | 6.8%) are the most common fields of study among 56,705 individuals in Livingston County who have obtained a bachelor's degree or higher.
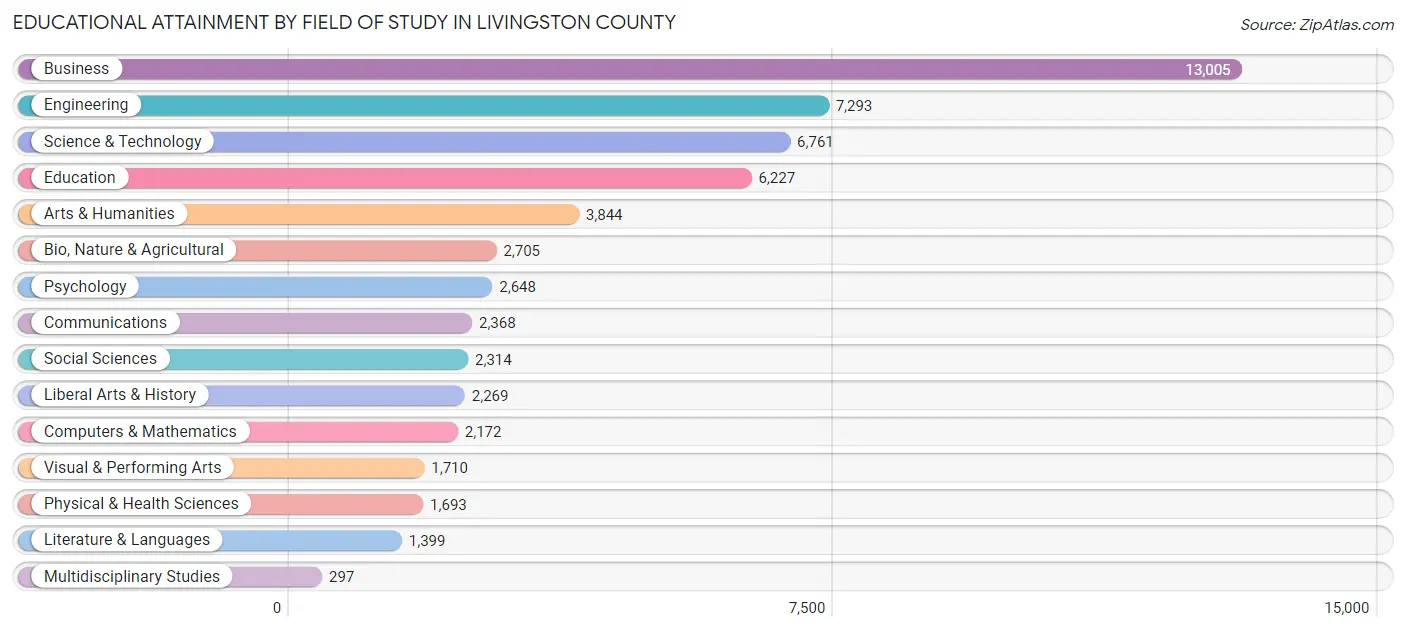
| Field of Study | # Graduates | % Graduates |
| Computers & Mathematics | 2,172 | 3.8% |
| Bio, Nature & Agricultural | 2,705 | 4.8% |
| Physical & Health Sciences | 1,693 | 3.0% |
| Psychology | 2,648 | 4.7% |
| Social Sciences | 2,314 | 4.1% |
| Engineering | 7,293 | 12.9% |
| Multidisciplinary Studies | 297 | 0.5% |
| Science & Technology | 6,761 | 11.9% |
| Business | 13,005 | 22.9% |
| Education | 6,227 | 11.0% |
| Literature & Languages | 1,399 | 2.5% |
| Liberal Arts & History | 2,269 | 4.0% |
| Visual & Performing Arts | 1,710 | 3.0% |
| Communications | 2,368 | 4.2% |
| Arts & Humanities | 3,844 | 6.8% |
| Total | 56,705 | 100.0% |
Transportation & Commute in Livingston County
Vehicle Availability by Sex in Livingston County
The most prevalent vehicle ownership categories in Livingston County are males with 2 vehicles (23,252, accounting for 43.7%) and females with 2 vehicles (18,826, making up 52.8%).
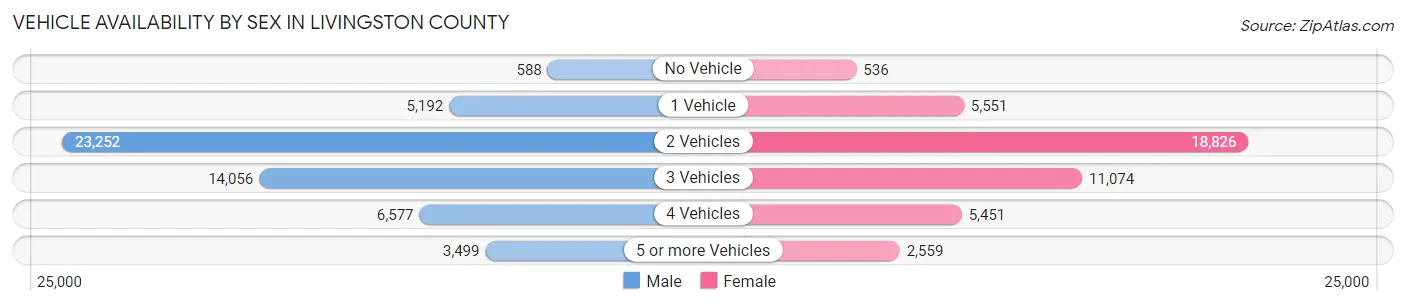
| Vehicles Available | Male | Female |
| No Vehicle | 588 (1.1%) | 536 (1.2%) |
| 1 Vehicle | 5,192 (9.8%) | 5,551 (12.6%) |
| 2 Vehicles | 23,252 (43.7%) | 18,826 (42.8%) |
| 3 Vehicles | 14,056 (26.4%) | 11,074 (25.2%) |
| 4 Vehicles | 6,577 (12.4%) | 5,451 (12.4%) |
| 5 or more Vehicles | 3,499 (6.6%) | 2,559 (5.8%) |
| Total | 53,164 (100.0%) | 43,997 (100.0%) |
Commute Time in Livingston County
The most frequently occuring commute durations in Livingston County are 45 to 59 minutes (11,895 commuters, 13.9%), 30 to 34 minutes (11,413 commuters, 13.4%), and 20 to 24 minutes (9,541 commuters, 11.2%).
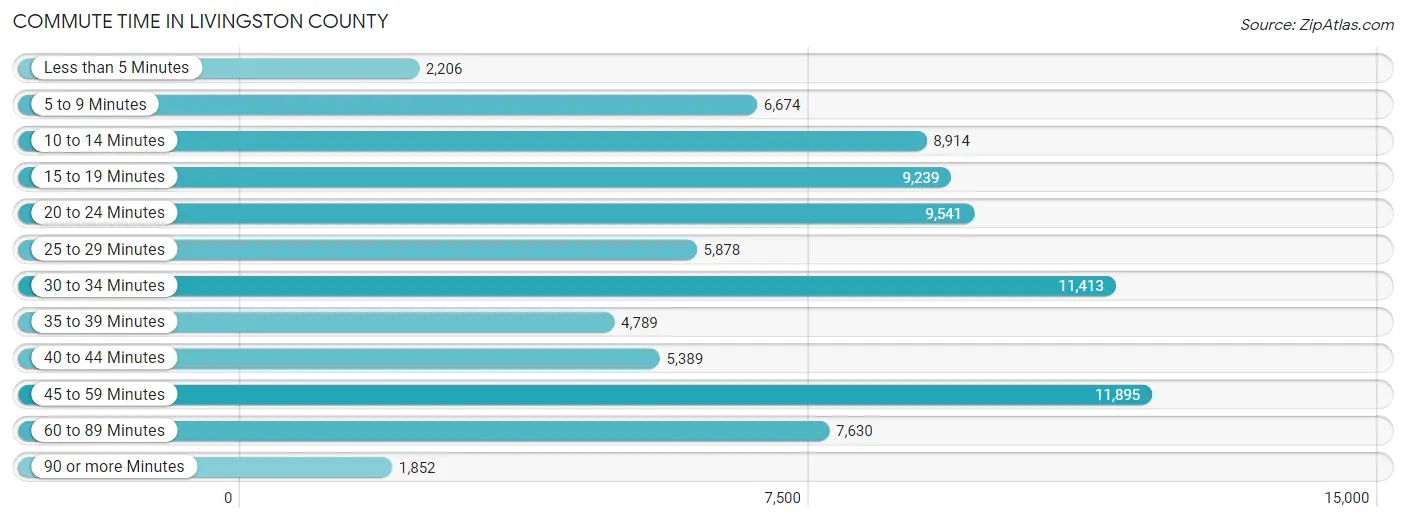
| Commute Time | # Commuters | % Commuters |
| Less than 5 Minutes | 2,206 | 2.6% |
| 5 to 9 Minutes | 6,674 | 7.8% |
| 10 to 14 Minutes | 8,914 | 10.4% |
| 15 to 19 Minutes | 9,239 | 10.8% |
| 20 to 24 Minutes | 9,541 | 11.2% |
| 25 to 29 Minutes | 5,878 | 6.9% |
| 30 to 34 Minutes | 11,413 | 13.4% |
| 35 to 39 Minutes | 4,789 | 5.6% |
| 40 to 44 Minutes | 5,389 | 6.3% |
| 45 to 59 Minutes | 11,895 | 13.9% |
| 60 to 89 Minutes | 7,630 | 8.9% |
| 90 or more Minutes | 1,852 | 2.2% |
Commute Time by Sex in Livingston County
The most common commute times in Livingston County are 45 to 59 minutes (7,446 commuters, 15.8%) for males and 10 to 14 minutes (5,213 commuters, 13.6%) for females.
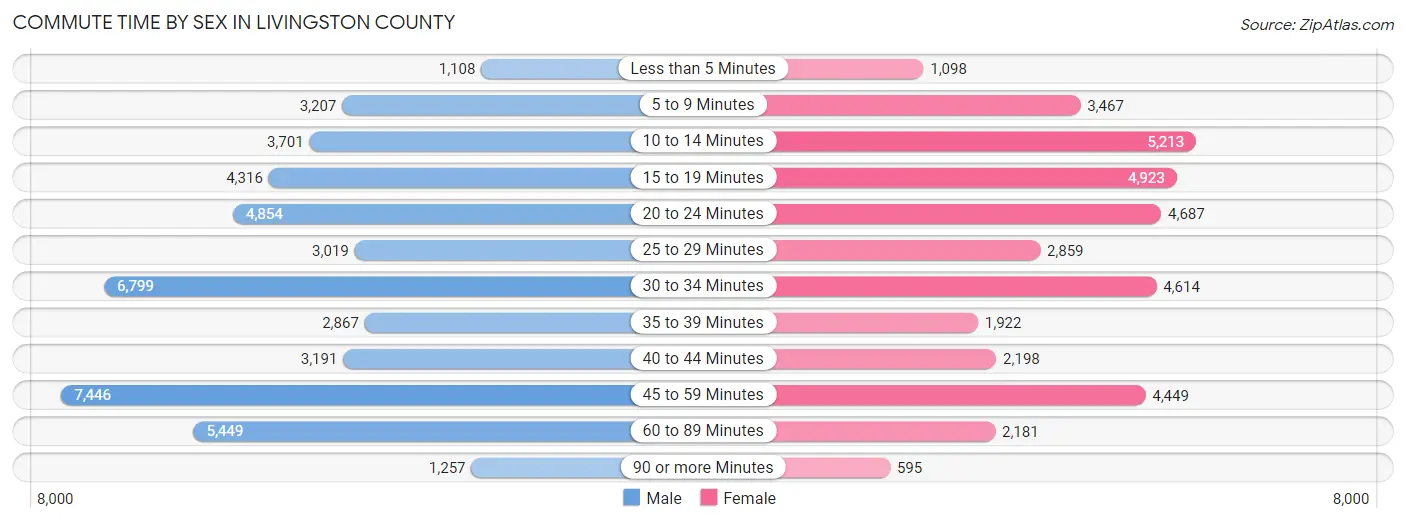
| Commute Time | Male | Female |
| Less than 5 Minutes | 1,108 (2.4%) | 1,098 (2.9%) |
| 5 to 9 Minutes | 3,207 (6.8%) | 3,467 (9.1%) |
| 10 to 14 Minutes | 3,701 (7.8%) | 5,213 (13.6%) |
| 15 to 19 Minutes | 4,316 (9.1%) | 4,923 (12.9%) |
| 20 to 24 Minutes | 4,854 (10.3%) | 4,687 (12.3%) |
| 25 to 29 Minutes | 3,019 (6.4%) | 2,859 (7.5%) |
| 30 to 34 Minutes | 6,799 (14.4%) | 4,614 (12.1%) |
| 35 to 39 Minutes | 2,867 (6.1%) | 1,922 (5.0%) |
| 40 to 44 Minutes | 3,191 (6.8%) | 2,198 (5.8%) |
| 45 to 59 Minutes | 7,446 (15.8%) | 4,449 (11.6%) |
| 60 to 89 Minutes | 5,449 (11.5%) | 2,181 (5.7%) |
| 90 or more Minutes | 1,257 (2.7%) | 595 (1.6%) |
Time of Departure to Work by Sex in Livingston County
The most frequent times of departure to work in Livingston County are 7:00 AM to 7:29 AM (6,975, 14.8%) for males and 7:00 AM to 7:29 AM (5,597, 14.6%) for females.
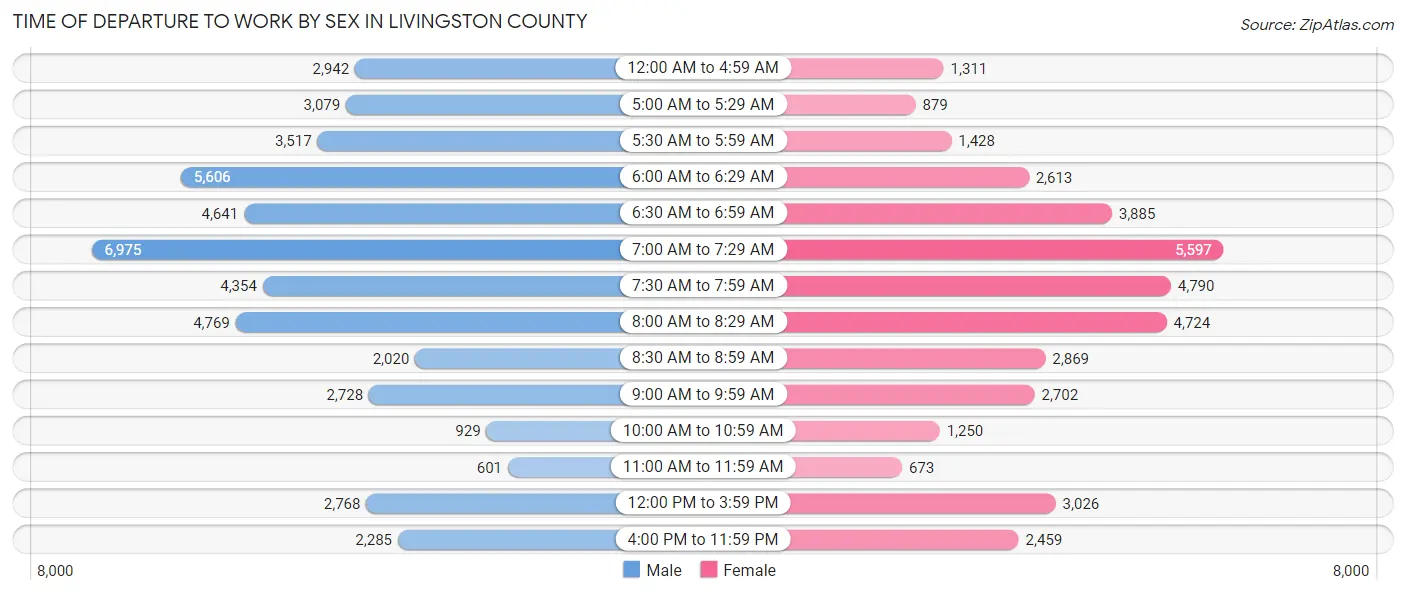
| Time of Departure | Male | Female |
| 12:00 AM to 4:59 AM | 2,942 (6.2%) | 1,311 (3.4%) |
| 5:00 AM to 5:29 AM | 3,079 (6.5%) | 879 (2.3%) |
| 5:30 AM to 5:59 AM | 3,517 (7.4%) | 1,428 (3.7%) |
| 6:00 AM to 6:29 AM | 5,606 (11.9%) | 2,613 (6.8%) |
| 6:30 AM to 6:59 AM | 4,641 (9.8%) | 3,885 (10.2%) |
| 7:00 AM to 7:29 AM | 6,975 (14.8%) | 5,597 (14.6%) |
| 7:30 AM to 7:59 AM | 4,354 (9.2%) | 4,790 (12.5%) |
| 8:00 AM to 8:29 AM | 4,769 (10.1%) | 4,724 (12.4%) |
| 8:30 AM to 8:59 AM | 2,020 (4.3%) | 2,869 (7.5%) |
| 9:00 AM to 9:59 AM | 2,728 (5.8%) | 2,702 (7.1%) |
| 10:00 AM to 10:59 AM | 929 (2.0%) | 1,250 (3.3%) |
| 11:00 AM to 11:59 AM | 601 (1.3%) | 673 (1.8%) |
| 12:00 PM to 3:59 PM | 2,768 (5.9%) | 3,026 (7.9%) |
| 4:00 PM to 11:59 PM | 2,285 (4.8%) | 2,459 (6.4%) |
| Total | 47,214 (100.0%) | 38,206 (100.0%) |
Housing Occupancy in Livingston County
Occupancy by Ownership in Livingston County
Of the total 74,841 dwellings in Livingston County, owner-occupied units account for 64,270 (85.9%), while renter-occupied units make up 10,571 (14.1%).
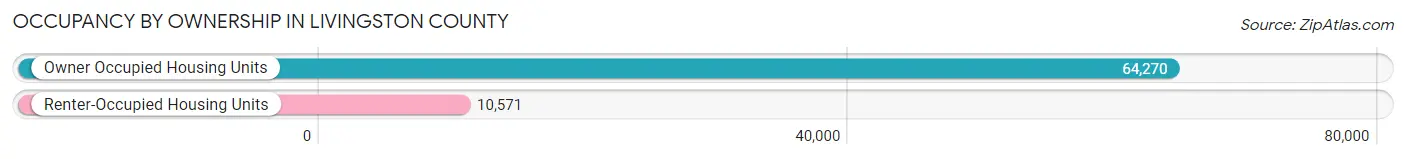
| Occupancy | # Housing Units | % Housing Units |
| Owner Occupied Housing Units | 64,270 | 85.9% |
| Renter-Occupied Housing Units | 10,571 | 14.1% |
| Total Occupied Housing Units | 74,841 | 100.0% |
Occupancy by Household Size in Livingston County
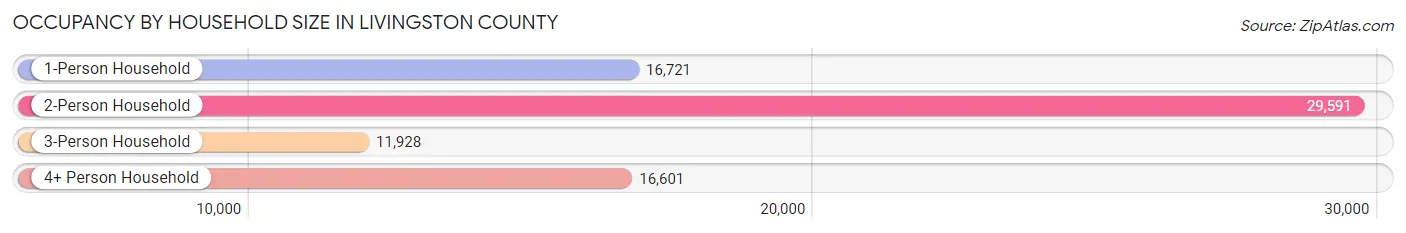
| Household Size | # Housing Units | % Housing Units |
| 1-Person Household | 16,721 | 22.3% |
| 2-Person Household | 29,591 | 39.5% |
| 3-Person Household | 11,928 | 15.9% |
| 4+ Person Household | 16,601 | 22.2% |
| Total Housing Units | 74,841 | 100.0% |
Occupancy by Ownership by Household Size in Livingston County
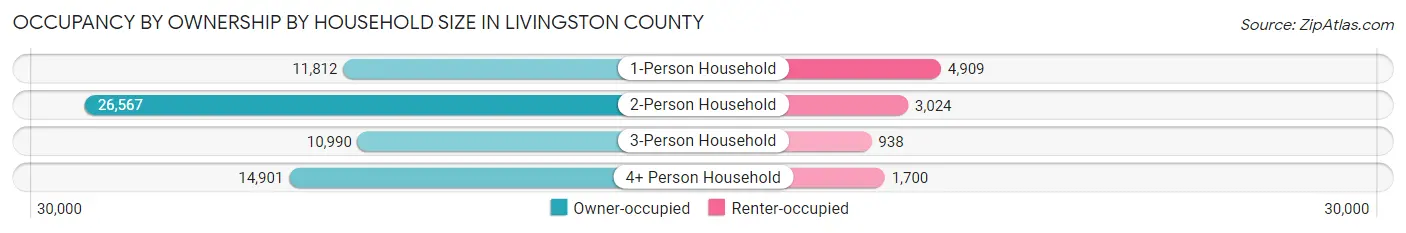
| Household Size | Owner-occupied | Renter-occupied |
| 1-Person Household | 11,812 (70.6%) | 4,909 (29.4%) |
| 2-Person Household | 26,567 (89.8%) | 3,024 (10.2%) |
| 3-Person Household | 10,990 (92.1%) | 938 (7.9%) |
| 4+ Person Household | 14,901 (89.8%) | 1,700 (10.2%) |
| Total Housing Units | 64,270 (85.9%) | 10,571 (14.1%) |
Occupancy by Educational Attainment in Livingston County
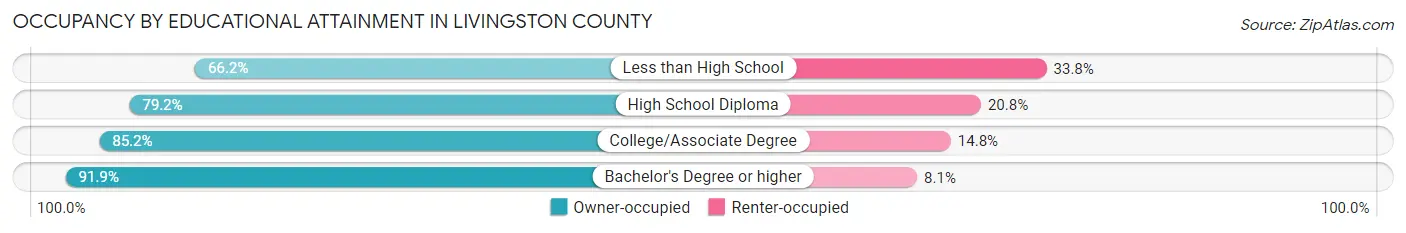
| Household Size | Owner-occupied | Renter-occupied |
| Less than High School | 1,677 (66.2%) | 856 (33.8%) |
| High School Diploma | 13,369 (79.2%) | 3,506 (20.8%) |
| College/Associate Degree | 21,698 (85.2%) | 3,774 (14.8%) |
| Bachelor's Degree or higher | 27,526 (91.9%) | 2,435 (8.1%) |
Occupancy by Age of Householder in Livingston County
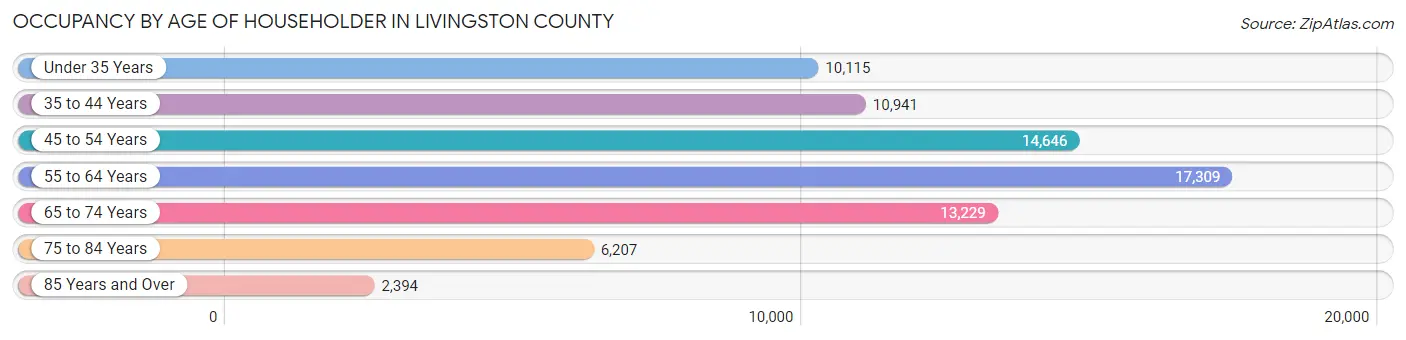
| Age Bracket | # Households | % Households |
| Under 35 Years | 10,115 | 13.5% |
| 35 to 44 Years | 10,941 | 14.6% |
| 45 to 54 Years | 14,646 | 19.6% |
| 55 to 64 Years | 17,309 | 23.1% |
| 65 to 74 Years | 13,229 | 17.7% |
| 75 to 84 Years | 6,207 | 8.3% |
| 85 Years and Over | 2,394 | 3.2% |
| Total | 74,841 | 100.0% |
Housing Finances in Livingston County
Median Income by Occupancy in Livingston County
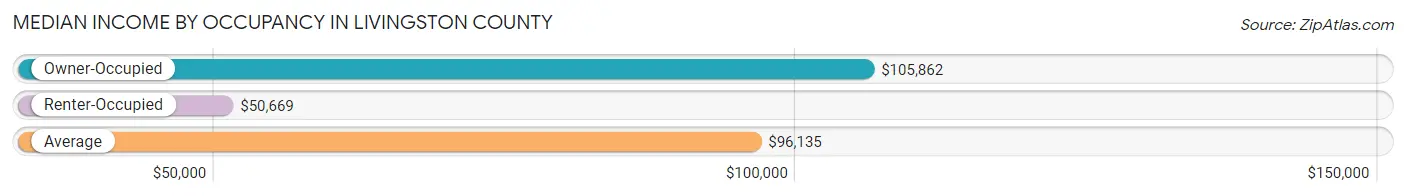
| Occupancy Type | # Households | Median Income |
| Owner-Occupied | 64,270 (85.9%) | $105,862 |
| Renter-Occupied | 10,571 (14.1%) | $50,669 |
| Average | 74,841 (100.0%) | $96,135 |
Occupancy by Householder Income Bracket in Livingston County
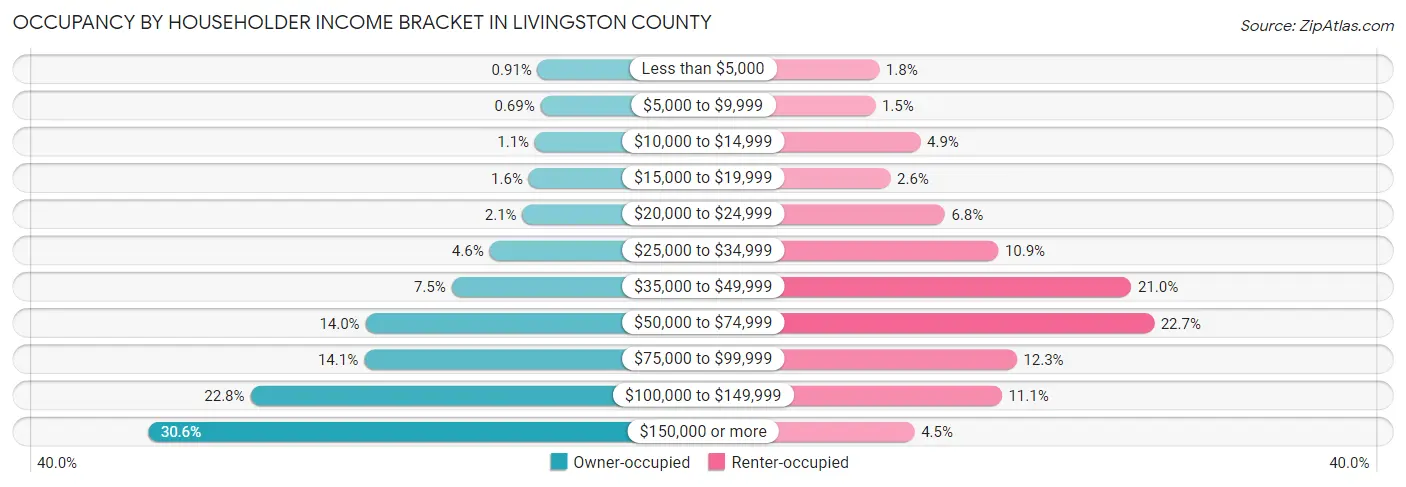
| Income Bracket | Owner-occupied | Renter-occupied |
| Less than $5,000 | 583 (0.9%) | 188 (1.8%) |
| $5,000 to $9,999 | 446 (0.7%) | 156 (1.5%) |
| $10,000 to $14,999 | 721 (1.1%) | 520 (4.9%) |
| $15,000 to $19,999 | 1,023 (1.6%) | 278 (2.6%) |
| $20,000 to $24,999 | 1,331 (2.1%) | 717 (6.8%) |
| $25,000 to $34,999 | 2,942 (4.6%) | 1,147 (10.8%) |
| $35,000 to $49,999 | 4,799 (7.5%) | 2,219 (21.0%) |
| $50,000 to $74,999 | 9,014 (14.0%) | 2,402 (22.7%) |
| $75,000 to $99,999 | 9,086 (14.1%) | 1,296 (12.3%) |
| $100,000 to $149,999 | 14,654 (22.8%) | 1,176 (11.1%) |
| $150,000 or more | 19,671 (30.6%) | 472 (4.5%) |
| Total | 64,270 (100.0%) | 10,571 (100.0%) |
Monthly Housing Cost Tiers in Livingston County
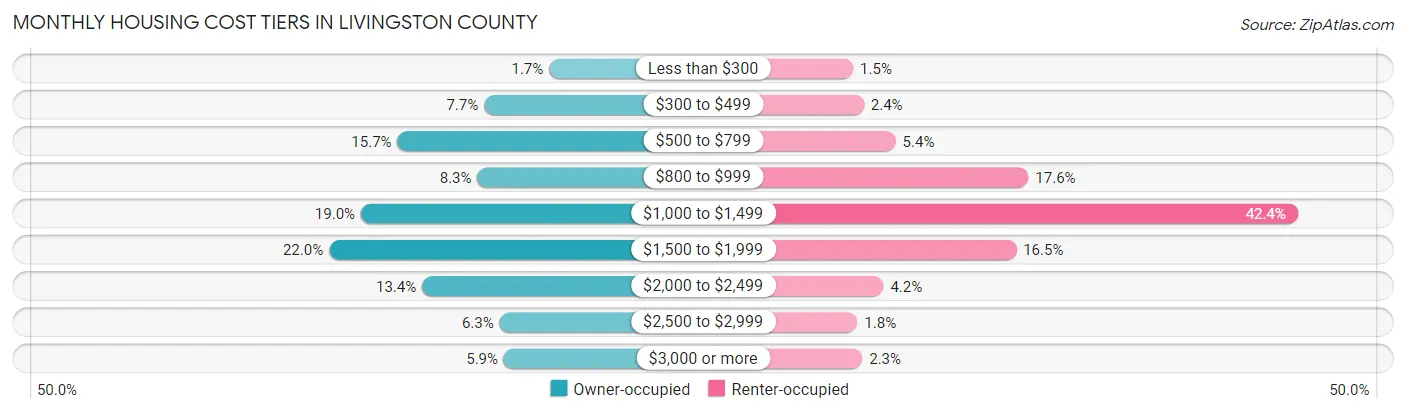
| Monthly Cost | Owner-occupied | Renter-occupied |
| Less than $300 | 1,098 (1.7%) | 153 (1.5%) |
| $300 to $499 | 4,948 (7.7%) | 257 (2.4%) |
| $500 to $799 | 10,076 (15.7%) | 567 (5.4%) |
| $800 to $999 | 5,350 (8.3%) | 1,858 (17.6%) |
| $1,000 to $1,499 | 12,238 (19.0%) | 4,479 (42.4%) |
| $1,500 to $1,999 | 14,127 (22.0%) | 1,740 (16.5%) |
| $2,000 to $2,499 | 8,616 (13.4%) | 448 (4.2%) |
| $2,500 to $2,999 | 4,037 (6.3%) | 194 (1.8%) |
| $3,000 or more | 3,780 (5.9%) | 242 (2.3%) |
| Total | 64,270 (100.0%) | 10,571 (100.0%) |
Physical Housing Characteristics in Livingston County
Housing Structures in Livingston County
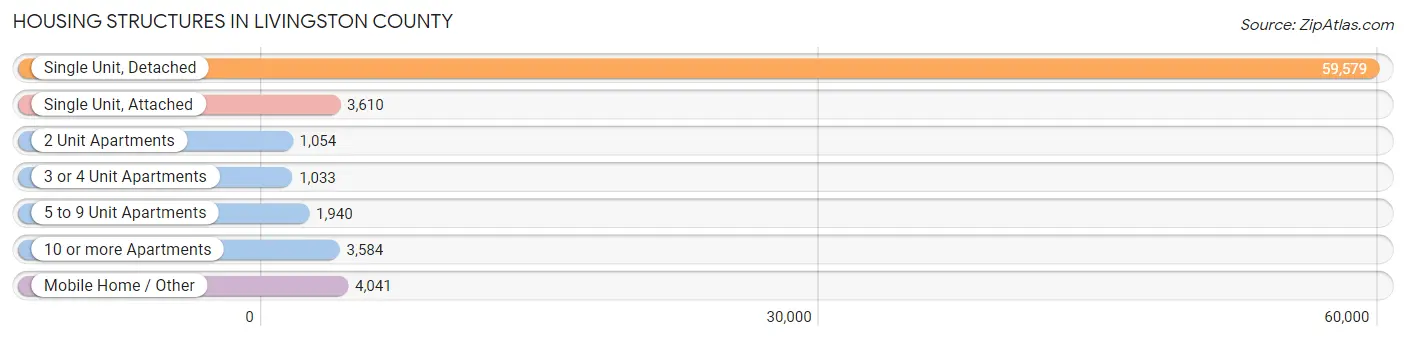
| Structure Type | # Housing Units | % Housing Units |
| Single Unit, Detached | 59,579 | 79.6% |
| Single Unit, Attached | 3,610 | 4.8% |
| 2 Unit Apartments | 1,054 | 1.4% |
| 3 or 4 Unit Apartments | 1,033 | 1.4% |
| 5 to 9 Unit Apartments | 1,940 | 2.6% |
| 10 or more Apartments | 3,584 | 4.8% |
| Mobile Home / Other | 4,041 | 5.4% |
| Total | 74,841 | 100.0% |
Housing Structures by Occupancy in Livingston County
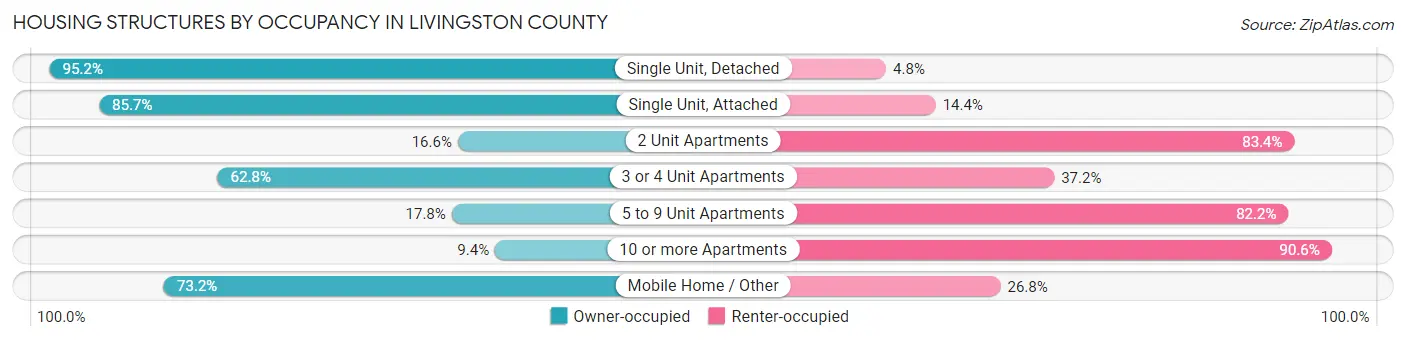
| Structure Type | Owner-occupied | Renter-occupied |
| Single Unit, Detached | 56,714 (95.2%) | 2,865 (4.8%) |
| Single Unit, Attached | 3,092 (85.7%) | 518 (14.3%) |
| 2 Unit Apartments | 175 (16.6%) | 879 (83.4%) |
| 3 or 4 Unit Apartments | 649 (62.8%) | 384 (37.2%) |
| 5 to 9 Unit Apartments | 345 (17.8%) | 1,595 (82.2%) |
| 10 or more Apartments | 338 (9.4%) | 3,246 (90.6%) |
| Mobile Home / Other | 2,957 (73.2%) | 1,084 (26.8%) |
| Total | 64,270 (85.9%) | 10,571 (14.1%) |
Housing Structures by Number of Rooms in Livingston County
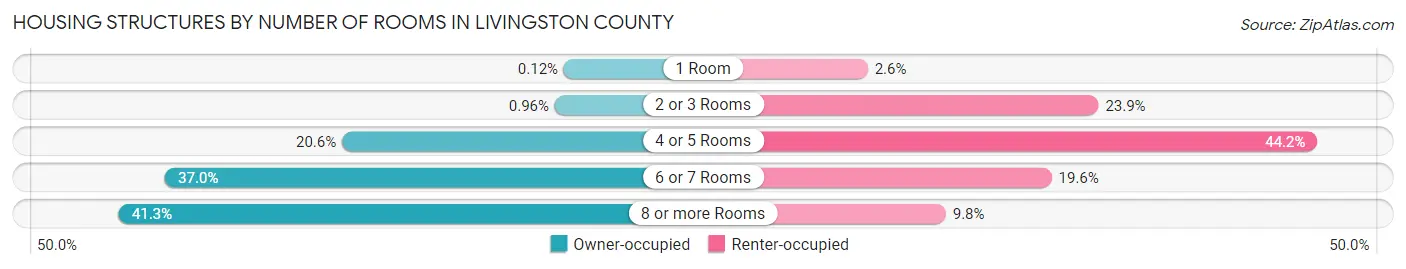
| Number of Rooms | Owner-occupied | Renter-occupied |
| 1 Room | 80 (0.1%) | 272 (2.6%) |
| 2 or 3 Rooms | 614 (1.0%) | 2,527 (23.9%) |
| 4 or 5 Rooms | 13,266 (20.6%) | 4,667 (44.2%) |
| 6 or 7 Rooms | 23,781 (37.0%) | 2,070 (19.6%) |
| 8 or more Rooms | 26,529 (41.3%) | 1,035 (9.8%) |
| Total | 64,270 (100.0%) | 10,571 (100.0%) |
Housing Structure by Heating Type in Livingston County
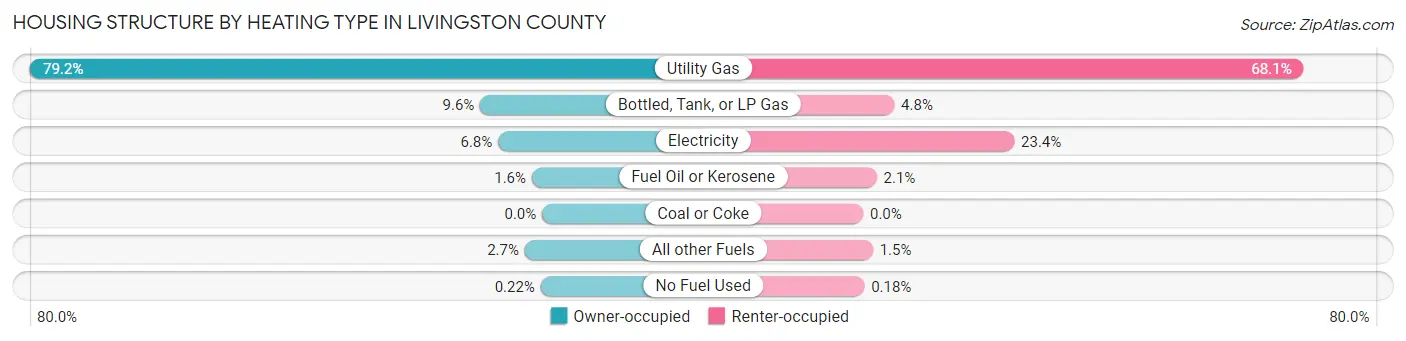
| Heating Type | Owner-occupied | Renter-occupied |
| Utility Gas | 50,870 (79.1%) | 7,197 (68.1%) |
| Bottled, Tank, or LP Gas | 6,148 (9.6%) | 508 (4.8%) |
| Electricity | 4,373 (6.8%) | 2,468 (23.4%) |
| Fuel Oil or Kerosene | 1,015 (1.6%) | 221 (2.1%) |
| Coal or Coke | 0 (0.0%) | 0 (0.0%) |
| All other Fuels | 1,721 (2.7%) | 158 (1.5%) |
| No Fuel Used | 143 (0.2%) | 19 (0.2%) |
| Total | 64,270 (100.0%) | 10,571 (100.0%) |
Household Vehicle Usage in Livingston County
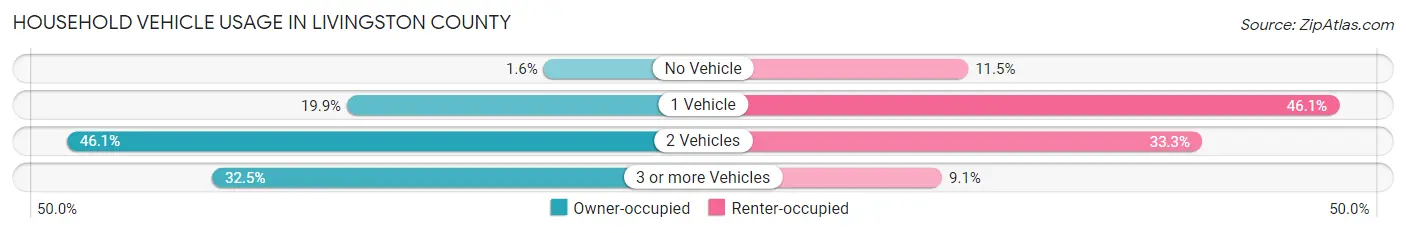
| Vehicles per Household | Owner-occupied | Renter-occupied |
| No Vehicle | 994 (1.5%) | 1,217 (11.5%) |
| 1 Vehicle | 12,796 (19.9%) | 4,874 (46.1%) |
| 2 Vehicles | 29,595 (46.1%) | 3,521 (33.3%) |
| 3 or more Vehicles | 20,885 (32.5%) | 959 (9.1%) |
| Total | 64,270 (100.0%) | 10,571 (100.0%) |
Real Estate & Mortgages in Livingston County
Real Estate and Mortgage Overview in Livingston County
| Characteristic | Without Mortgage | With Mortgage |
| Housing Units | 20,228 | 44,042 |
| Median Property Value | $284,500 | $324,000 |
| Median Household Income | $73,694 | $15,963 |
| Monthly Housing Costs | $639 | $3,700 |
| Real Estate Taxes | $2,913 | $1,283 |
Property Value by Mortgage Status in Livingston County
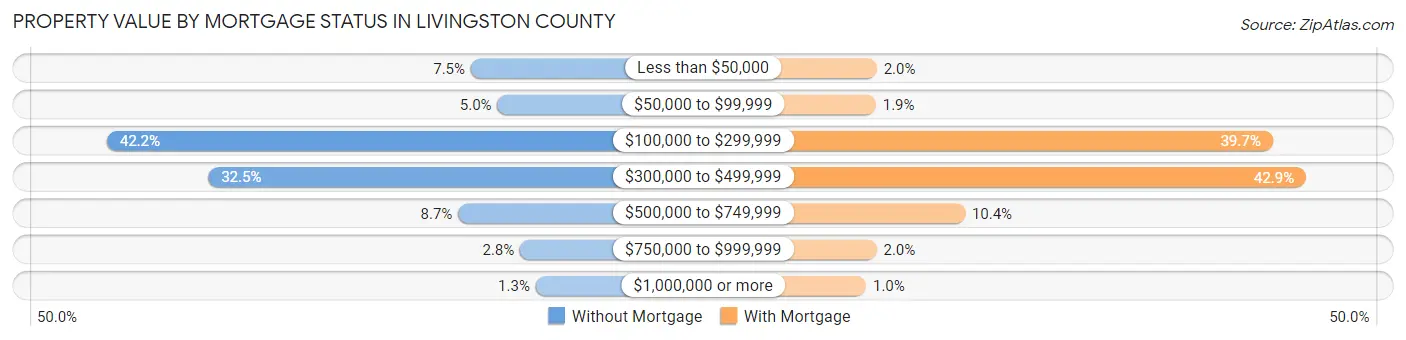
| Property Value | Without Mortgage | With Mortgage |
| Less than $50,000 | 1,518 (7.5%) | 891 (2.0%) |
| $50,000 to $99,999 | 1,006 (5.0%) | 848 (1.9%) |
| $100,000 to $299,999 | 8,530 (42.2%) | 17,499 (39.7%) |
| $300,000 to $499,999 | 6,576 (32.5%) | 18,894 (42.9%) |
| $500,000 to $749,999 | 1,762 (8.7%) | 4,587 (10.4%) |
| $750,000 to $999,999 | 568 (2.8%) | 883 (2.0%) |
| $1,000,000 or more | 268 (1.3%) | 440 (1.0%) |
| Total | 20,228 (100.0%) | 44,042 (100.0%) |
Household Income by Mortgage Status in Livingston County
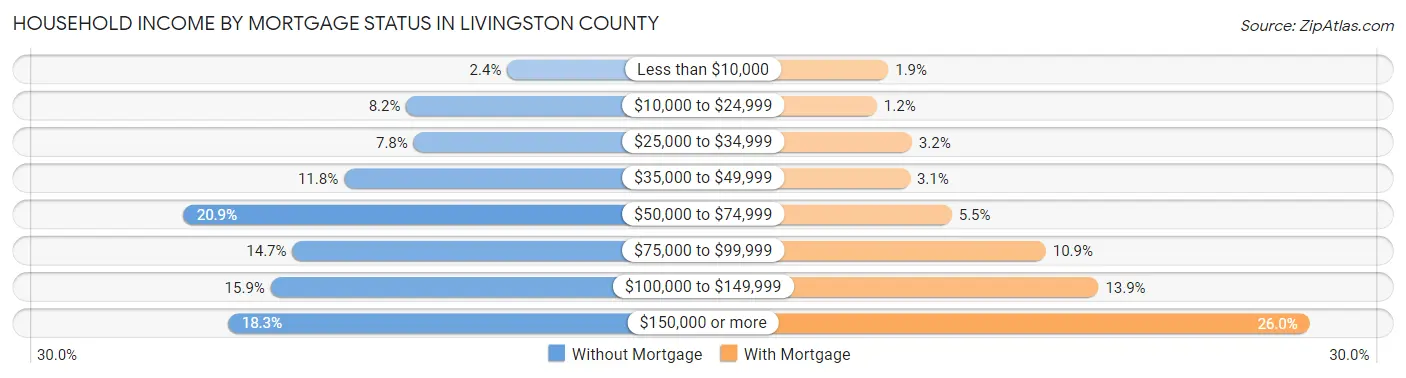
| Household Income | Without Mortgage | With Mortgage |
| Less than $10,000 | 490 (2.4%) | 825 (1.9%) |
| $10,000 to $24,999 | 1,656 (8.2%) | 539 (1.2%) |
| $25,000 to $34,999 | 1,572 (7.8%) | 1,419 (3.2%) |
| $35,000 to $49,999 | 2,377 (11.7%) | 1,370 (3.1%) |
| $50,000 to $74,999 | 4,228 (20.9%) | 2,422 (5.5%) |
| $75,000 to $99,999 | 2,973 (14.7%) | 4,786 (10.9%) |
| $100,000 to $149,999 | 3,224 (15.9%) | 6,113 (13.9%) |
| $150,000 or more | 3,708 (18.3%) | 11,430 (26.0%) |
| Total | 20,228 (100.0%) | 44,042 (100.0%) |
Property Value to Household Income Ratio in Livingston County
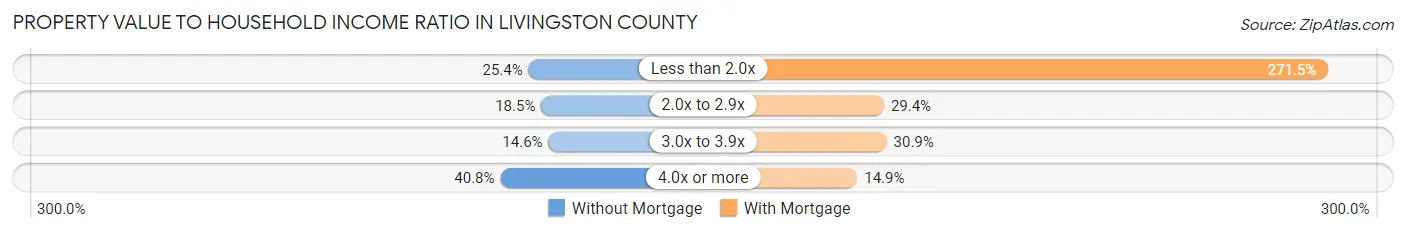
| Value-to-Income Ratio | Without Mortgage | With Mortgage |
| Less than 2.0x | 5,146 (25.4%) | 119,587 (271.5%) |
| 2.0x to 2.9x | 3,745 (18.5%) | 12,965 (29.4%) |
| 3.0x to 3.9x | 2,953 (14.6%) | 13,598 (30.9%) |
| 4.0x or more | 8,252 (40.8%) | 6,572 (14.9%) |
| Total | 20,228 (100.0%) | 44,042 (100.0%) |
Real Estate Taxes by Mortgage Status in Livingston County
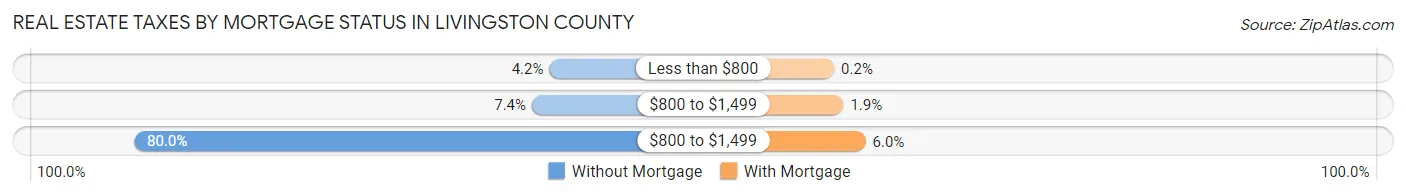
| Property Taxes | Without Mortgage | With Mortgage |
| Less than $800 | 841 (4.2%) | 89 (0.2%) |
| $800 to $1,499 | 1,486 (7.3%) | 835 (1.9%) |
| $800 to $1,499 | 16,184 (80.0%) | 2,619 (5.9%) |
| Total | 20,228 (100.0%) | 44,042 (100.0%) |
Health & Disability in Livingston County
Health Insurance Coverage by Age in Livingston County
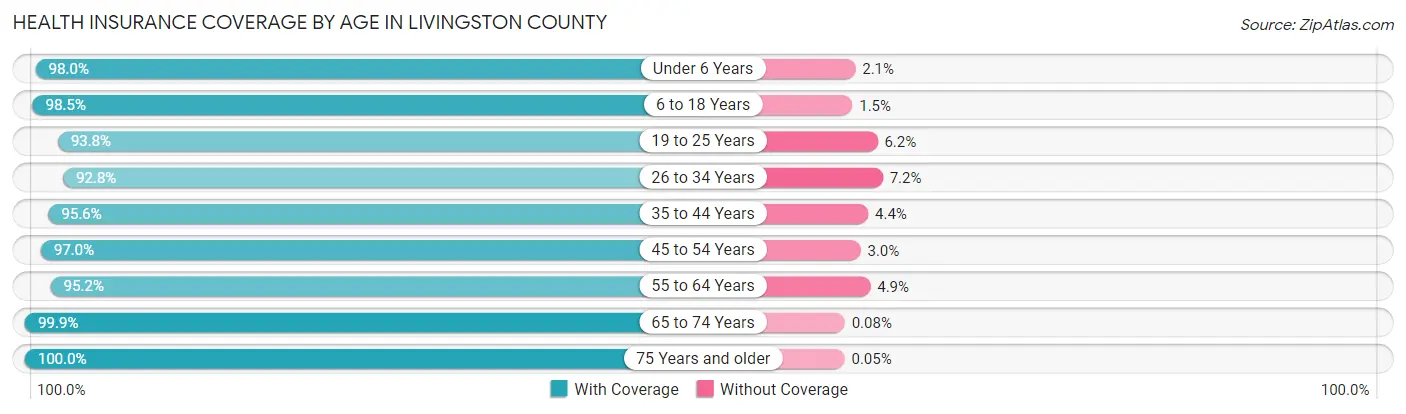
| Age Bracket | With Coverage | Without Coverage |
| Under 6 Years | 11,718 (98.0%) | 245 (2.1%) |
| 6 to 18 Years | 29,988 (98.5%) | 453 (1.5%) |
| 19 to 25 Years | 14,535 (93.8%) | 957 (6.2%) |
| 26 to 34 Years | 17,793 (92.8%) | 1,373 (7.2%) |
| 35 to 44 Years | 21,696 (95.6%) | 1,007 (4.4%) |
| 45 to 54 Years | 26,354 (97.0%) | 824 (3.0%) |
| 55 to 64 Years | 29,574 (95.2%) | 1,508 (4.9%) |
| 65 to 74 Years | 22,005 (99.9%) | 18 (0.1%) |
| 75 Years and older | 13,232 (100.0%) | 6 (0.1%) |
| Total | 186,895 (96.7%) | 6,391 (3.3%) |
Health Insurance Coverage by Citizenship Status in Livingston County
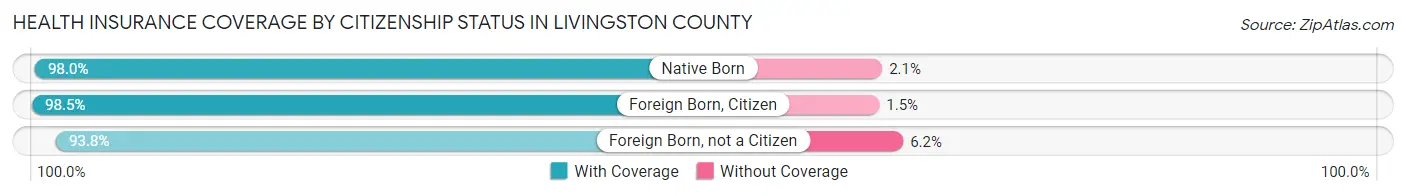
| Citizenship Status | With Coverage | Without Coverage |
| Native Born | 11,718 (98.0%) | 245 (2.1%) |
| Foreign Born, Citizen | 29,988 (98.5%) | 453 (1.5%) |
| Foreign Born, not a Citizen | 14,535 (93.8%) | 957 (6.2%) |
Health Insurance Coverage by Household Income in Livingston County
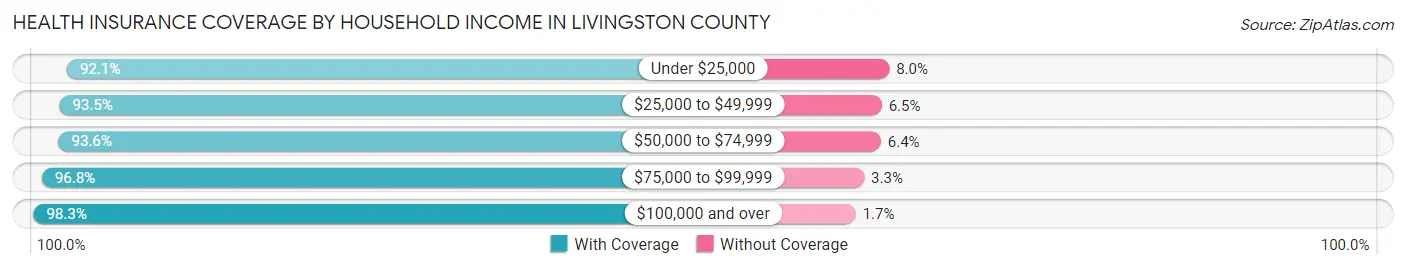
| Household Income | With Coverage | Without Coverage |
| Under $25,000 | 9,053 (92.0%) | 782 (8.0%) |
| $25,000 to $49,999 | 18,441 (93.5%) | 1,290 (6.5%) |
| $50,000 to $74,999 | 23,254 (93.6%) | 1,586 (6.4%) |
| $75,000 to $99,999 | 24,997 (96.8%) | 841 (3.3%) |
| $100,000 and over | 110,857 (98.3%) | 1,879 (1.7%) |
Public vs Private Health Insurance Coverage by Age in Livingston County
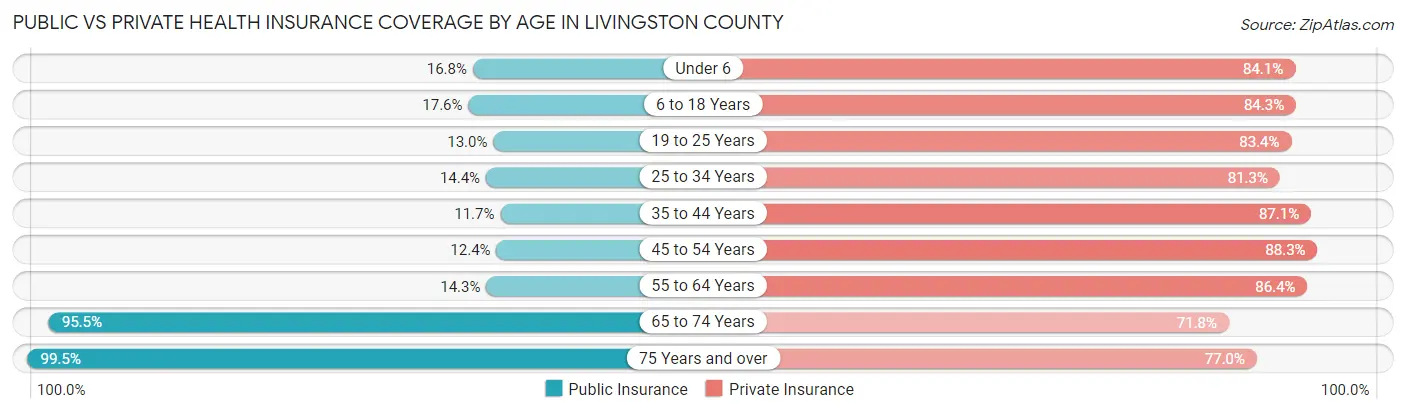
| Age Bracket | Public Insurance | Private Insurance |
| Under 6 | 2,011 (16.8%) | 10,063 (84.1%) |
| 6 to 18 Years | 5,367 (17.6%) | 25,662 (84.3%) |
| 19 to 25 Years | 2,016 (13.0%) | 12,926 (83.4%) |
| 25 to 34 Years | 2,755 (14.4%) | 15,580 (81.3%) |
| 35 to 44 Years | 2,656 (11.7%) | 19,770 (87.1%) |
| 45 to 54 Years | 3,379 (12.4%) | 23,993 (88.3%) |
| 55 to 64 Years | 4,446 (14.3%) | 26,862 (86.4%) |
| 65 to 74 Years | 21,033 (95.5%) | 15,821 (71.8%) |
| 75 Years and over | 13,165 (99.5%) | 10,198 (77.0%) |
| Total | 56,828 (29.4%) | 160,875 (83.2%) |
Disability Status by Sex by Age in Livingston County
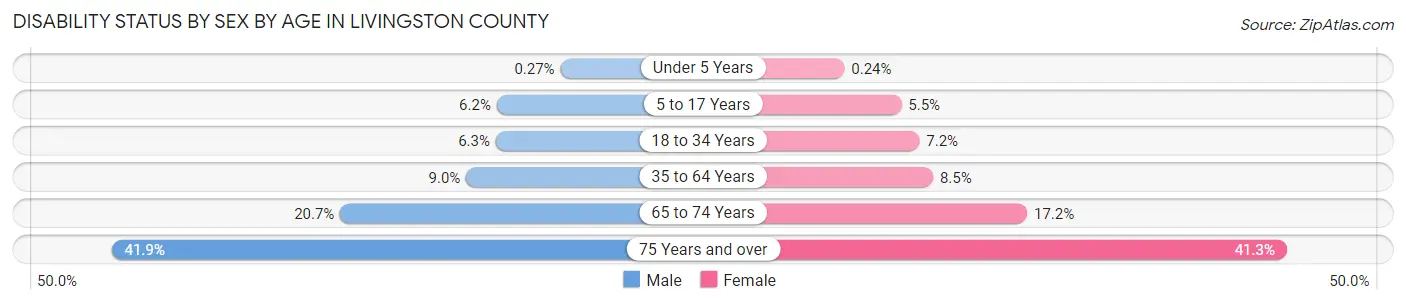
| Age Bracket | Male | Female |
| Under 5 Years | 13 (0.3%) | 11 (0.2%) |
| 5 to 17 Years | 978 (6.2%) | 819 (5.5%) |
| 18 to 34 Years | 1,213 (6.3%) | 1,270 (7.2%) |
| 35 to 64 Years | 3,681 (9.0%) | 3,396 (8.5%) |
| 65 to 74 Years | 2,250 (20.7%) | 1,918 (17.2%) |
| 75 Years and over | 2,489 (41.9%) | 3,015 (41.3%) |
Disability Class by Sex by Age in Livingston County
Disability Class: Hearing Difficulty
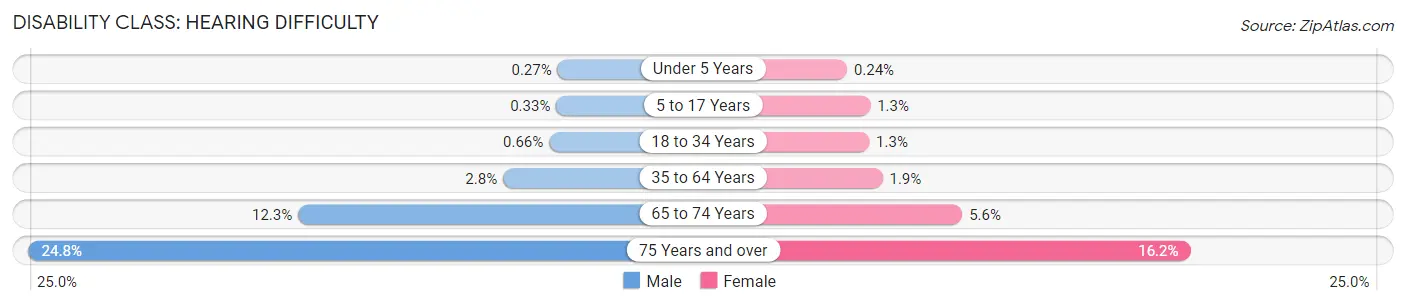
| Age Bracket | Male | Female |
| Under 5 Years | 13 (0.3%) | 11 (0.2%) |
| 5 to 17 Years | 53 (0.3%) | 196 (1.3%) |
| 18 to 34 Years | 127 (0.7%) | 224 (1.3%) |
| 35 to 64 Years | 1,141 (2.8%) | 757 (1.9%) |
| 65 to 74 Years | 1,337 (12.3%) | 624 (5.6%) |
| 75 Years and over | 1,473 (24.8%) | 1,181 (16.2%) |
Disability Class: Vision Difficulty
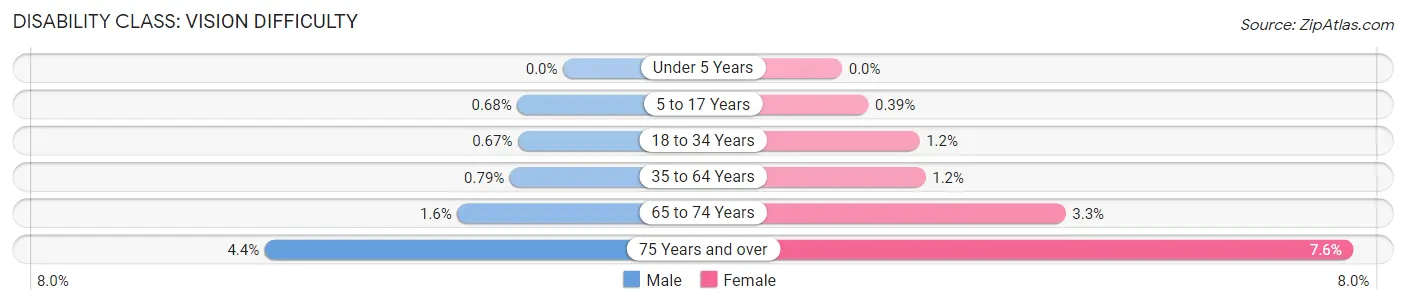
| Age Bracket | Male | Female |
| Under 5 Years | 0 (0.0%) | 0 (0.0%) |
| 5 to 17 Years | 107 (0.7%) | 58 (0.4%) |
| 18 to 34 Years | 129 (0.7%) | 203 (1.1%) |
| 35 to 64 Years | 323 (0.8%) | 498 (1.2%) |
| 65 to 74 Years | 171 (1.6%) | 370 (3.3%) |
| 75 Years and over | 263 (4.4%) | 555 (7.6%) |
Disability Class: Cognitive Difficulty
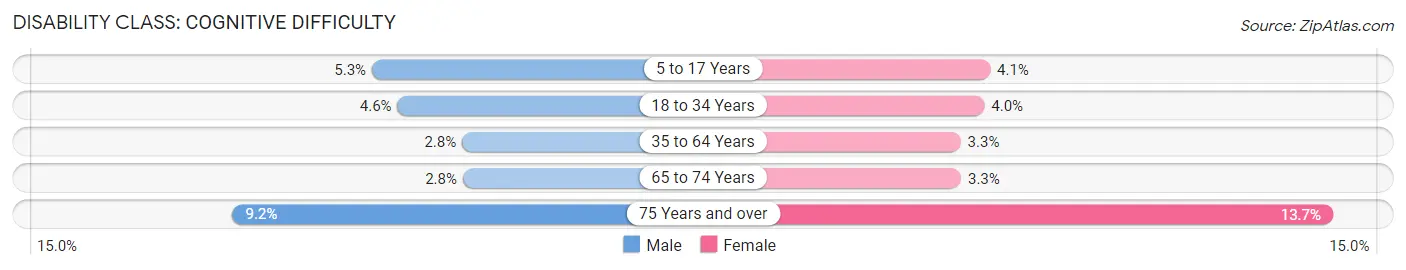
| Age Bracket | Male | Female |
| 5 to 17 Years | 843 (5.3%) | 611 (4.1%) |
| 18 to 34 Years | 893 (4.6%) | 700 (4.0%) |
| 35 to 64 Years | 1,149 (2.8%) | 1,328 (3.3%) |
| 65 to 74 Years | 304 (2.8%) | 370 (3.3%) |
| 75 Years and over | 547 (9.2%) | 998 (13.7%) |
Disability Class: Ambulatory Difficulty
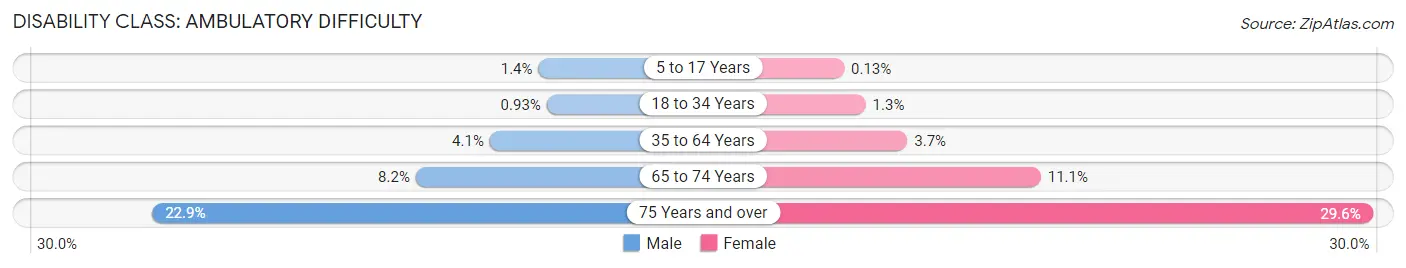
| Age Bracket | Male | Female |
| 5 to 17 Years | 220 (1.4%) | 19 (0.1%) |
| 18 to 34 Years | 180 (0.9%) | 235 (1.3%) |
| 35 to 64 Years | 1,672 (4.1%) | 1,466 (3.6%) |
| 65 to 74 Years | 893 (8.2%) | 1,236 (11.1%) |
| 75 Years and over | 1,359 (22.9%) | 2,158 (29.5%) |
Disability Class: Self-Care Difficulty
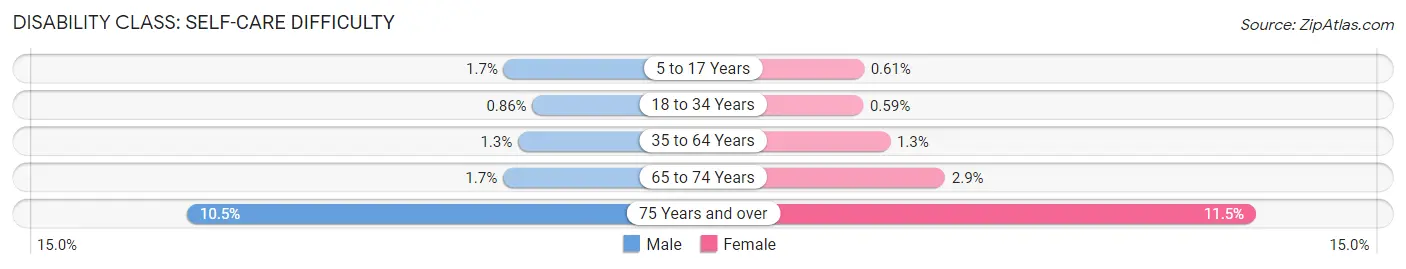
| Age Bracket | Male | Female |
| 5 to 17 Years | 262 (1.7%) | 90 (0.6%) |
| 18 to 34 Years | 167 (0.9%) | 104 (0.6%) |
| 35 to 64 Years | 516 (1.3%) | 539 (1.3%) |
| 65 to 74 Years | 183 (1.7%) | 320 (2.9%) |
| 75 Years and over | 622 (10.5%) | 842 (11.5%) |
Technology Access in Livingston County
Computing Device Access in Livingston County
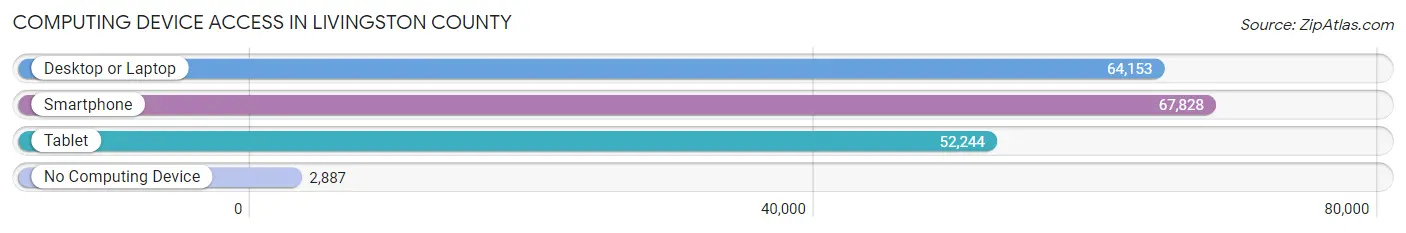
| Device Type | # Households | % Households |
| Desktop or Laptop | 64,153 | 85.7% |
| Smartphone | 67,828 | 90.6% |
| Tablet | 52,244 | 69.8% |
| No Computing Device | 2,887 | 3.9% |
| Total | 74,841 | 100.0% |
Internet Access in Livingston County
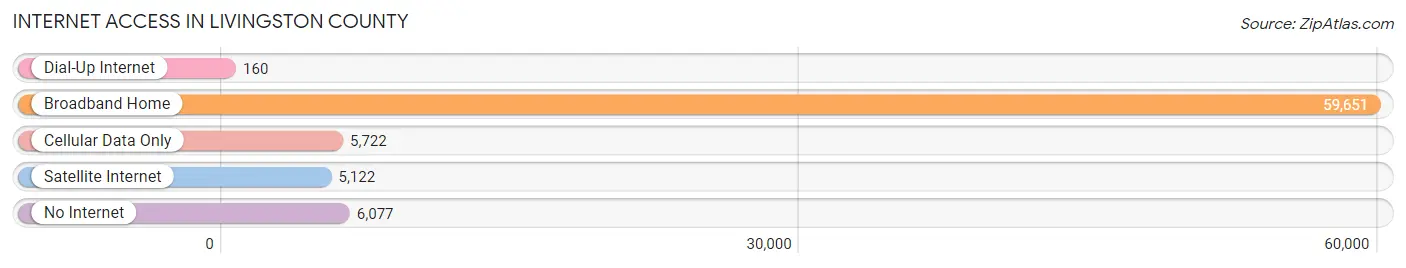
| Internet Type | # Households | % Households |
| Dial-Up Internet | 160 | 0.2% |
| Broadband Home | 59,651 | 79.7% |
| Cellular Data Only | 5,722 | 7.6% |
| Satellite Internet | 5,122 | 6.8% |
| No Internet | 6,077 | 8.1% |
| Total | 74,841 | 100.0% |
Livingston County Summary
Livingston County is located in the southeastern corner of Michigan, and is part of the Detroit metropolitan area. It is bordered by Oakland County to the north, Washtenaw County to the west, and Ingham County to the south. The county seat is Howell, and the largest city is Brighton. The county was established in 1833 and named after Edward Livingston, a prominent lawyer and politician from New York.
Geography
Livingston County covers an area of 577 square miles, making it the fifth largest county in Michigan. The terrain is mostly flat, with some rolling hills in the northern part of the county. The Huron River runs through the county, and there are several lakes and ponds scattered throughout. The county is mostly rural, with some small towns and villages. The largest city is Brighton, with a population of around 8,000.
Climate
Livingston County has a humid continental climate, with cold winters and hot, humid summers. The average annual temperature is around 50°F, and the average annual precipitation is around 33 inches.
Demographics
As of the 2010 census, Livingston County had a population of 180,967. The racial makeup of the county was 87.3% White, 8.2% African American, 0.7% Native American, 1.3% Asian, 0.1% Pacific Islander, and 2.4% from other races. Hispanic or Latino of any race were 4.2% of the population.
Economy
Livingston County has a diverse economy, with a mix of manufacturing, agriculture, and services. The largest employers in the county are the automotive industry, healthcare, and education. The county is home to several major automotive suppliers, including General Motors, Ford, and Chrysler. The county also has a strong agricultural sector, with dairy, beef, and poultry production.
The county is also home to several higher education institutions, including Cleary University, Eastern Michigan University, and the University of Michigan-Flint. These institutions provide a variety of educational and research opportunities for students and faculty.
Livingston County is also home to several tourist attractions, including the Howell Nature Center, the Brighton Recreation Area, and the Kensington Metropark. These attractions draw visitors from all over the state and beyond.
Conclusion
Livingston County is a diverse and vibrant county in southeastern Michigan. It has a strong economy, with a mix of manufacturing, agriculture, and services. The county is also home to several higher education institutions, tourist attractions, and recreational areas. With its diverse population and economy, Livingston County is a great place to live, work, and play.
Common Questions
What is the Total Population of Livingston County?
Total Population of Livingston County is 194,302.
What is the Total Male Population of Livingston County?
Total Male Population of Livingston County is 98,266.
What is the Total Female Population of Livingston County?
Total Female Population of Livingston County is 96,036.
What is the Ratio of Males per 100 Females in Livingston County?
There are 102.32 Males per 100 Females in Livingston County.
What is the Ratio of Females per 100 Males in Livingston County?
There are 97.73 Females per 100 Males in Livingston County.
What is the Median Population Age in Livingston County?
Median Population Age in Livingston County is 43.6 Years.
What is the Average Family Size in Livingston County
Average Family Size in Livingston County is 3.0 People.
What is the Average Household Size in Livingston County
Average Household Size in Livingston County is 2.6 People.
What is Per Capita Income in Livingston County?
Per Capita income in Livingston County is $47,253.
What is the Median Family Income in Livingston County?
Median Family Income in Livingston County is $113,824.
What is the Median Household income in Livingston County?
Median Household Income in Livingston County is $96,135.
What is Income or Wage Gap in Livingston County?
Income or Wage Gap in Livingston County is 38.9%.
Women in Livingston County earn 61.1 cents for every dollar earned by a man.
What is Family Income Deficit in Livingston County?
Family Income Deficit in Livingston County is $10,723.
Families that are below poverty line in Livingston County earn $10,723 less on average than the poverty threshold level.
What is Inequality or Gini Index in Livingston County?
Inequality or Gini Index in Livingston County is 0.41.
How Large is the Labor Force in Livingston County?
There are 102,707 People in the Labor Forcein in Livingston County.
What is the Percentage of People in the Labor Force in Livingston County?
64.4% of People are in the Labor Force in Livingston County.
What is the Unemployment Rate in Livingston County?
Unemployment Rate in Livingston County is 4.0%.