Lenawee County, MI
Lenawee County Overview
99,263
TOTAL POPULATION
50,546
MALE POPULATION
48,717
FEMALE POPULATION
103.75
MALES / 100 FEMALES
96.38
FEMALES / 100 MALES
42.0
MEDIAN AGE
2.9
AVG FAMILY SIZE
2.4
AVG HOUSEHOLD SIZE
$32,976
PER CAPITA INCOME
$78,131
AVG FAMILY INCOME
$65,484
AVG HOUSEHOLD INCOME
32.9%
WAGE / INCOME GAP [ % ]
67.1¢/ $1
WAGE / INCOME GAP [ $ ]
$11,431
FAMILY INCOME DEFICIT
0.42
INEQUALITY / GINI INDEX
46,690
LABOR FORCE [ PEOPLE ]
57.5%
PERCENT IN LABOR FORCE
5.6%
UNEMPLOYMENT RATE
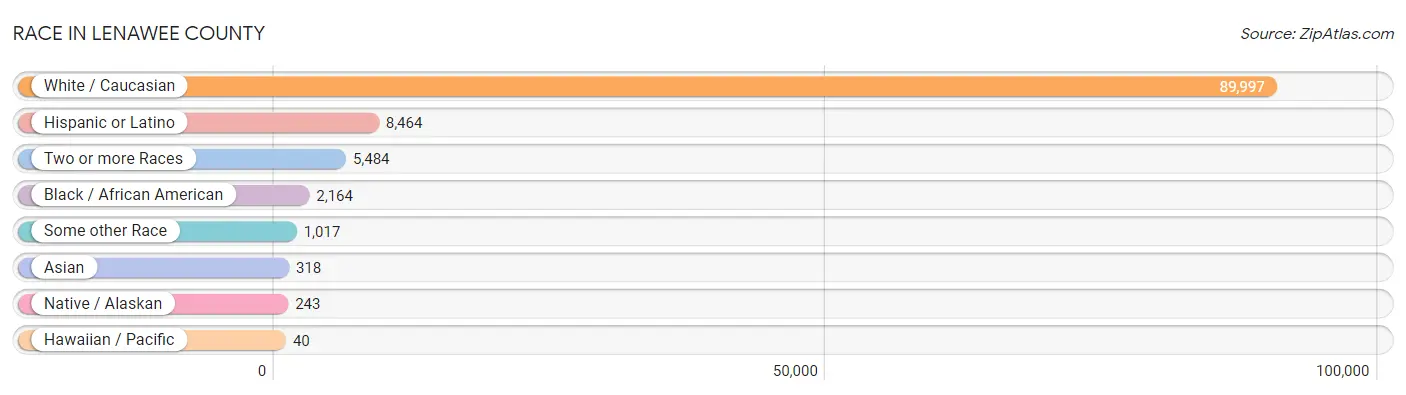
Race in Lenawee County
The most populous races in Lenawee County are White / Caucasian (89,997 | 90.7%), Hispanic or Latino (8,464 | 8.5%), and Two or more Races (5,484 | 5.5%).
| Race | # Population | % Population |
| Asian | 318 | 0.3% |
| Black / African American | 2,164 | 2.2% |
| Hawaiian / Pacific | 40 | 0.0% |
| Hispanic or Latino | 8,464 | 8.5% |
| Native / Alaskan | 243 | 0.2% |
| White / Caucasian | 89,997 | 90.7% |
| Two or more Races | 5,484 | 5.5% |
| Some other Race | 1,017 | 1.0% |
| Total | 99,263 | 100.0% |
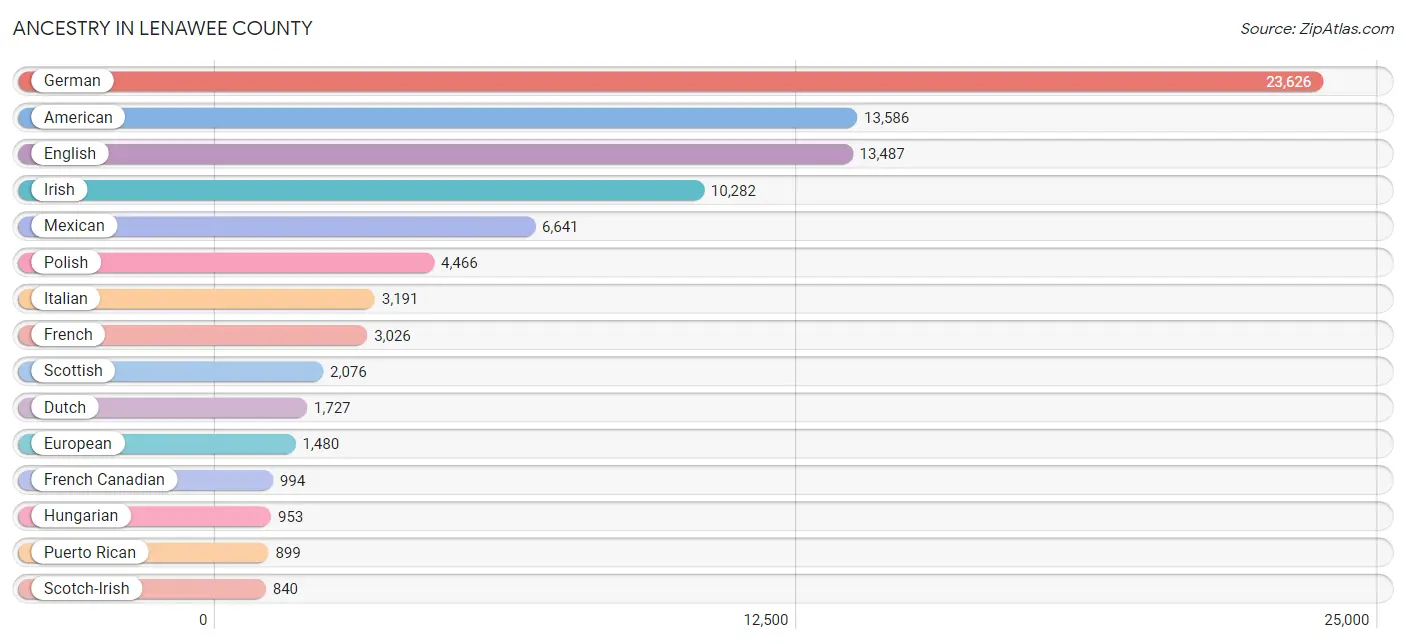
Ancestry in Lenawee County
The most populous ancestries reported in Lenawee County are German (23,626 | 23.8%), American (13,586 | 13.7%), English (13,487 | 13.6%), Irish (10,282 | 10.4%), and Mexican (6,641 | 6.7%), together accounting for 68.1% of all Lenawee County residents.
| Ancestry | # Population | % Population |
| African | 135 | 0.1% |
| American | 13,586 | 13.7% |
| Apache | 26 | 0.0% |
| Arab | 579 | 0.6% |
| Argentinean | 26 | 0.0% |
| Armenian | 38 | 0.0% |
| Australian | 63 | 0.1% |
| Austrian | 85 | 0.1% |
| Bahamian | 11 | 0.0% |
| Basque | 11 | 0.0% |
| Belgian | 576 | 0.6% |
| Bhutanese | 70 | 0.1% |
| Blackfeet | 112 | 0.1% |
| British | 380 | 0.4% |
| Bulgarian | 30 | 0.0% |
| Burmese | 145 | 0.2% |
| Cambodian | 5 | 0.0% |
| Canadian | 221 | 0.2% |
| Celtic | 38 | 0.0% |
| Central American | 96 | 0.1% |
| Central American Indian | 55 | 0.1% |
| Cherokee | 265 | 0.3% |
| Chilean | 35 | 0.0% |
| Chippewa | 227 | 0.2% |
| Choctaw | 32 | 0.0% |
| Colombian | 14 | 0.0% |
| Costa Rican | 9 | 0.0% |
| Cree | 14 | 0.0% |
| Creek | 15 | 0.0% |
| Croatian | 6 | 0.0% |
| Cuban | 83 | 0.1% |
| Czech | 491 | 0.5% |
| Czechoslovakian | 130 | 0.1% |
| Danish | 231 | 0.2% |
| Dominican | 93 | 0.1% |
| Dutch | 1,727 | 1.7% |
| Eastern European | 118 | 0.1% |
| Ecuadorian | 37 | 0.0% |
| Egyptian | 30 | 0.0% |
| English | 13,487 | 13.6% |
| Ethiopian | 9 | 0.0% |
| European | 1,480 | 1.5% |
| Finnish | 468 | 0.5% |
| French | 3,026 | 3.0% |
| French American Indian | 17 | 0.0% |
| French Canadian | 994 | 1.0% |
| German | 23,626 | 23.8% |
| Greek | 262 | 0.3% |
| Guatemalan | 59 | 0.1% |
| Haitian | 5 | 0.0% |
| Honduran | 3 | 0.0% |
| Hungarian | 953 | 1.0% |
| Indian (Asian) | 171 | 0.2% |
| Iraqi | 161 | 0.2% |
| Irish | 10,282 | 10.4% |
| Iroquois | 109 | 0.1% |
| Israeli | 12 | 0.0% |
| Italian | 3,191 | 3.2% |
| Jamaican | 25 | 0.0% |
| Jordanian | 8 | 0.0% |
| Korean | 305 | 0.3% |
| Laotian | 30 | 0.0% |
| Lebanese | 165 | 0.2% |
| Lithuanian | 99 | 0.1% |
| Lumbee | 23 | 0.0% |
| Macedonian | 27 | 0.0% |
| Maltese | 30 | 0.0% |
| Mexican | 6,641 | 6.7% |
| Mexican American Indian | 11 | 0.0% |
| Moroccan | 53 | 0.1% |
| Native Hawaiian | 64 | 0.1% |
| Navajo | 2 | 0.0% |
| New Zealander | 6 | 0.0% |
| Nigerian | 14 | 0.0% |
| Northern European | 102 | 0.1% |
| Norwegian | 361 | 0.4% |
| Ottawa | 9 | 0.0% |
| Pakistani | 1 | 0.0% |
| Pennsylvania German | 18 | 0.0% |
| Peruvian | 57 | 0.1% |
| Polish | 4,466 | 4.5% |
| Portuguese | 19 | 0.0% |
| Potawatomi | 22 | 0.0% |
| Puerto Rican | 899 | 0.9% |
| Romanian | 227 | 0.2% |
| Russian | 333 | 0.3% |
| Salvadoran | 25 | 0.0% |
| Scandinavian | 147 | 0.2% |
| Scotch-Irish | 840 | 0.9% |
| Scottish | 2,076 | 2.1% |
| Serbian | 48 | 0.1% |
| Sioux | 16 | 0.0% |
| Slavic | 6 | 0.0% |
| Slovak | 94 | 0.1% |
| Slovene | 5 | 0.0% |
| South American | 169 | 0.2% |
| Spaniard | 142 | 0.1% |
| Spanish | 74 | 0.1% |
| Spanish American | 4 | 0.0% |
| Sri Lankan | 18 | 0.0% |
| Subsaharan African | 158 | 0.2% |
| Swedish | 565 | 0.6% |
| Swiss | 248 | 0.3% |
| Syrian | 4 | 0.0% |
| Thai | 17 | 0.0% |
| Trinidadian and Tobagonian | 5 | 0.0% |
| Turkish | 3 | 0.0% |
| Ukrainian | 292 | 0.3% |
| Welsh | 476 | 0.5% |
| West Indian | 55 | 0.1% |
| Yaqui | 1 | 0.0% |
| Yugoslavian | 8 | 0.0% | View All 112 Rows |
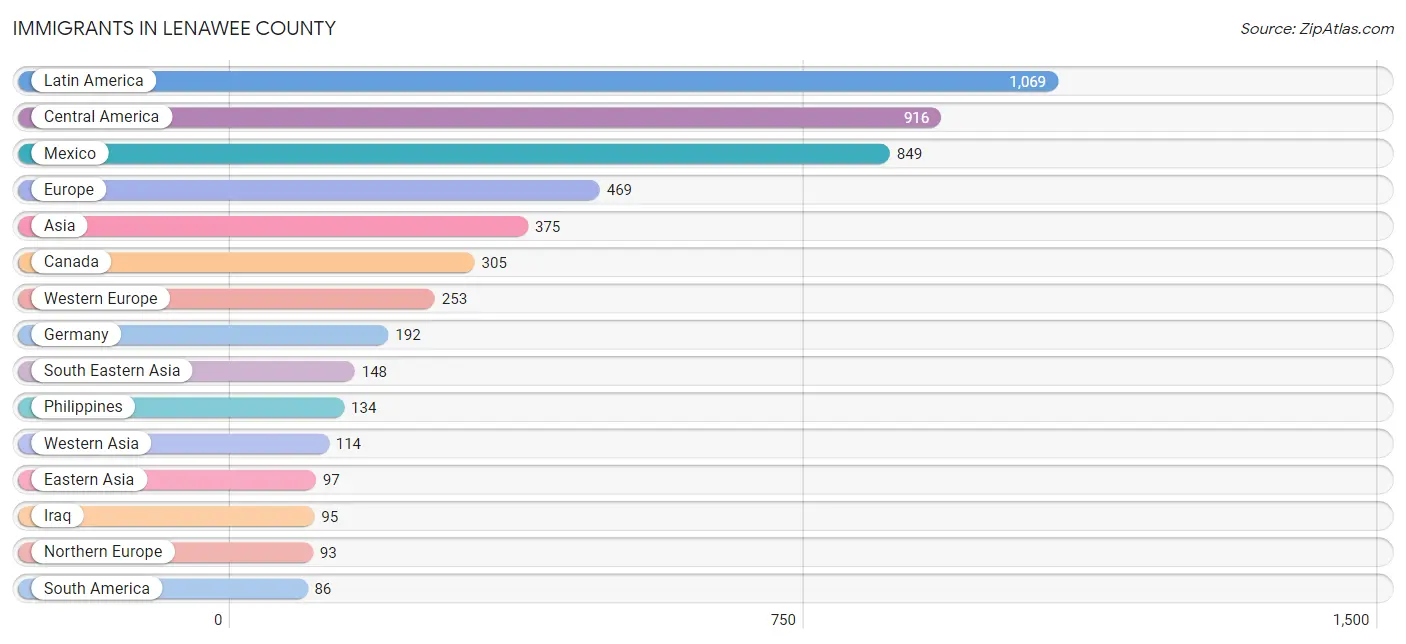
Immigrants in Lenawee County
The most numerous immigrant groups reported in Lenawee County came from Latin America (1,069 | 1.1%), Central America (916 | 0.9%), Mexico (849 | 0.9%), Europe (469 | 0.5%), and Asia (375 | 0.4%), together accounting for 3.7% of all Lenawee County residents.
| Immigration Origin | # Population | % Population |
| Africa | 23 | 0.0% |
| Argentina | 28 | 0.0% |
| Asia | 375 | 0.4% |
| Australia | 3 | 0.0% |
| Barbados | 6 | 0.0% |
| Bulgaria | 5 | 0.0% |
| Canada | 305 | 0.3% |
| Caribbean | 67 | 0.1% |
| Central America | 916 | 0.9% |
| Chile | 21 | 0.0% |
| China | 37 | 0.0% |
| Colombia | 12 | 0.0% |
| Cuba | 34 | 0.0% |
| Czechoslovakia | 2 | 0.0% |
| Dominican Republic | 19 | 0.0% |
| Eastern Africa | 19 | 0.0% |
| Eastern Asia | 97 | 0.1% |
| Eastern Europe | 71 | 0.1% |
| El Salvador | 42 | 0.0% |
| England | 33 | 0.0% |
| Ethiopia | 9 | 0.0% |
| Europe | 469 | 0.5% |
| Germany | 192 | 0.2% |
| Greece | 21 | 0.0% |
| Guatemala | 22 | 0.0% |
| Honduras | 3 | 0.0% |
| India | 4 | 0.0% |
| Iraq | 95 | 0.1% |
| Ireland | 49 | 0.1% |
| Japan | 29 | 0.0% |
| Jordan | 9 | 0.0% |
| Korea | 31 | 0.0% |
| Latin America | 1,069 | 1.1% |
| Mexico | 849 | 0.9% |
| Netherlands | 61 | 0.1% |
| North Macedonia | 10 | 0.0% |
| Northern Africa | 4 | 0.0% |
| Northern Europe | 93 | 0.1% |
| Oceania | 9 | 0.0% |
| Peru | 25 | 0.0% |
| Philippines | 134 | 0.1% |
| Poland | 9 | 0.0% |
| Romania | 28 | 0.0% |
| Russia | 5 | 0.0% |
| Serbia | 6 | 0.0% |
| South America | 86 | 0.1% |
| South Central Asia | 4 | 0.0% |
| South Eastern Asia | 148 | 0.2% |
| Southern Europe | 52 | 0.1% |
| Spain | 27 | 0.0% |
| Sweden | 2 | 0.0% |
| Syria | 10 | 0.0% |
| Thailand | 14 | 0.0% |
| Trinidad and Tobago | 8 | 0.0% |
| Western Asia | 114 | 0.1% |
| Western Europe | 253 | 0.3% | View All 56 Rows |
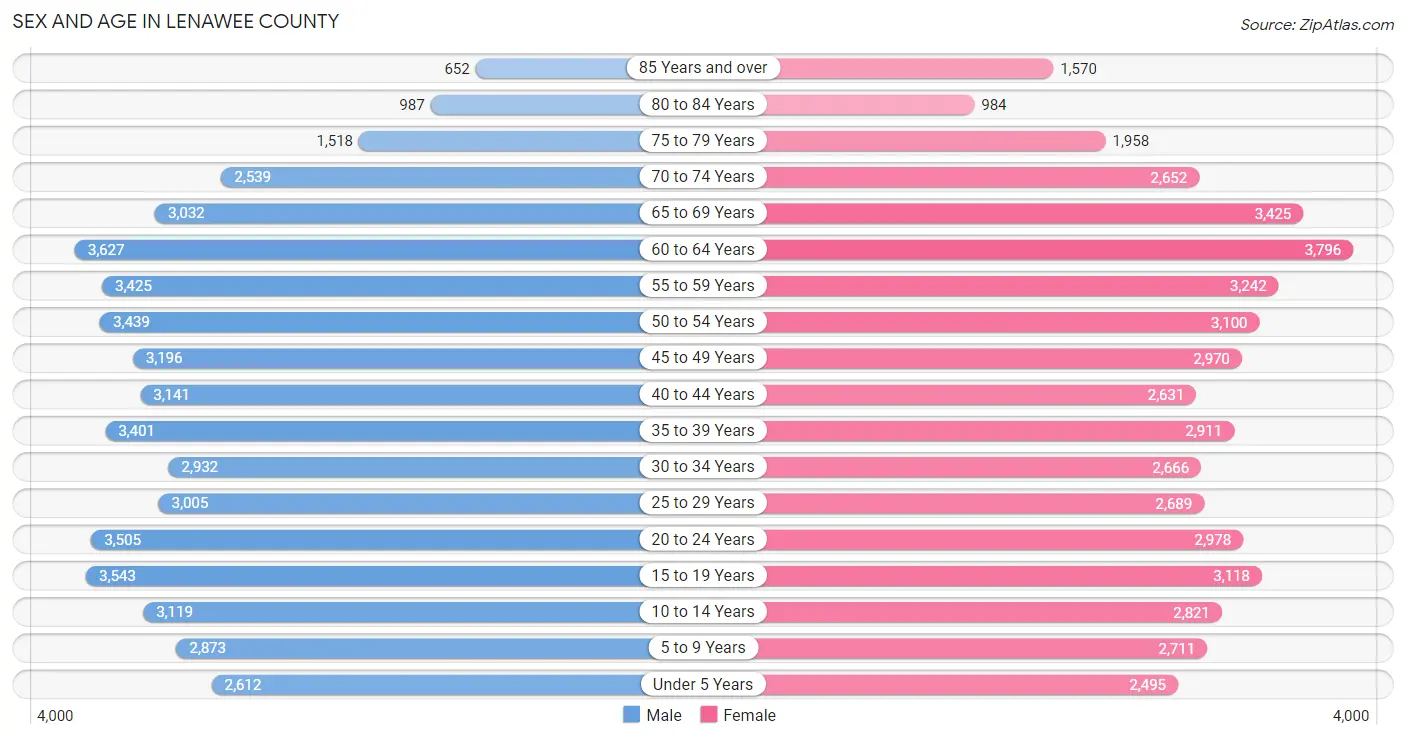
Sex and Age in Lenawee County
Sex and Age in Lenawee County
The most populous age groups in Lenawee County are 60 to 64 Years (3,627 | 7.2%) for men and 60 to 64 Years (3,796 | 7.8%) for women.
| Age Bracket | Male | Female |
| Under 5 Years | 2,612 (5.2%) | 2,495 (5.1%) |
| 5 to 9 Years | 2,873 (5.7%) | 2,711 (5.6%) |
| 10 to 14 Years | 3,119 (6.2%) | 2,821 (5.8%) |
| 15 to 19 Years | 3,543 (7.0%) | 3,118 (6.4%) |
| 20 to 24 Years | 3,505 (6.9%) | 2,978 (6.1%) |
| 25 to 29 Years | 3,005 (5.9%) | 2,689 (5.5%) |
| 30 to 34 Years | 2,932 (5.8%) | 2,666 (5.5%) |
| 35 to 39 Years | 3,401 (6.7%) | 2,911 (6.0%) |
| 40 to 44 Years | 3,141 (6.2%) | 2,631 (5.4%) |
| 45 to 49 Years | 3,196 (6.3%) | 2,970 (6.1%) |
| 50 to 54 Years | 3,439 (6.8%) | 3,100 (6.4%) |
| 55 to 59 Years | 3,425 (6.8%) | 3,242 (6.7%) |
| 60 to 64 Years | 3,627 (7.2%) | 3,796 (7.8%) |
| 65 to 69 Years | 3,032 (6.0%) | 3,425 (7.0%) |
| 70 to 74 Years | 2,539 (5.0%) | 2,652 (5.4%) |
| 75 to 79 Years | 1,518 (3.0%) | 1,958 (4.0%) |
| 80 to 84 Years | 987 (1.9%) | 984 (2.0%) |
| 85 Years and over | 652 (1.3%) | 1,570 (3.2%) |
| Total | 50,546 (100.0%) | 48,717 (100.0%) |
Families and Households in Lenawee County
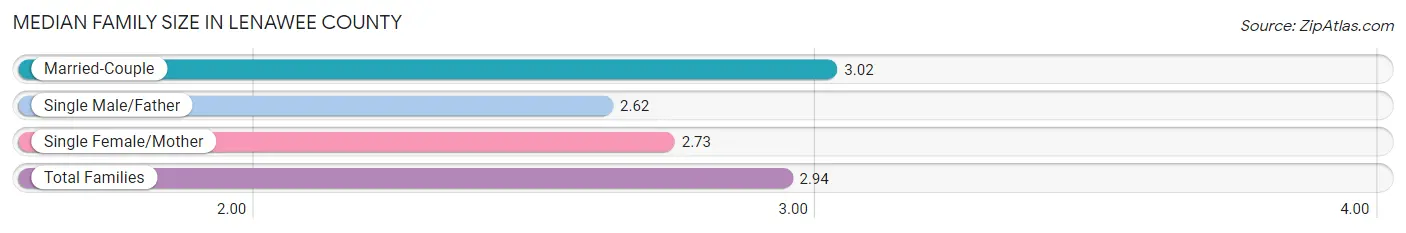
Median Family Size in Lenawee County
The median family size in Lenawee County is 2.94 persons per family, with married-couple families (19,824 | 76.6%) accounting for the largest median family size of 3.02 persons per family. On the other hand, single male/father families (2,288 | 8.8%) represent the smallest median family size with 2.62 persons per family.
| Family Type | # Families | Family Size |
| Married-Couple | 19,824 (76.6%) | 3.02 |
| Single Male/Father | 2,288 (8.8%) | 2.62 |
| Single Female/Mother | 3,751 (14.5%) | 2.73 |
| Total Families | 25,863 (100.0%) | 2.94 |
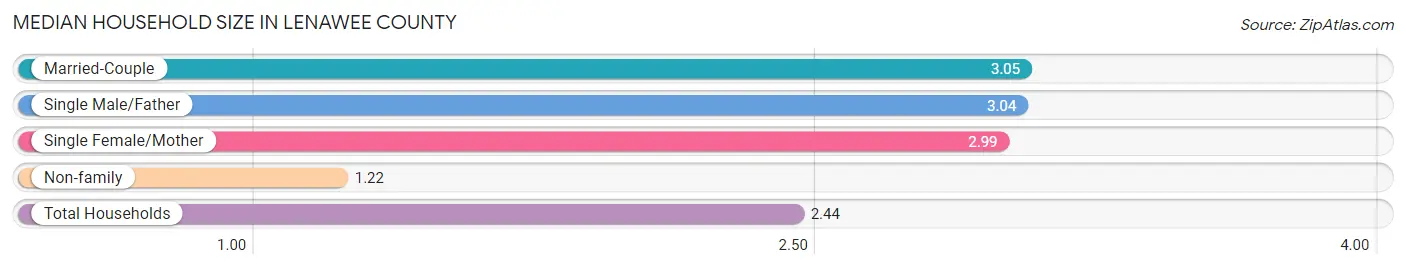
Median Household Size in Lenawee County
The median household size in Lenawee County is 2.44 persons per household, with married-couple households (19,824 | 51.3%) accounting for the largest median household size of 3.05 persons per household. non-family households (12,763 | 33.0%) represent the smallest median household size with 1.22 persons per household.
| Household Type | # Households | Household Size |
| Married-Couple | 19,824 (51.3%) | 3.05 |
| Single Male/Father | 2,288 (5.9%) | 3.04 |
| Single Female/Mother | 3,751 (9.7%) | 2.99 |
| Non-family | 12,763 (33.0%) | 1.22 |
| Total Households | 38,626 (100.0%) | 2.44 |
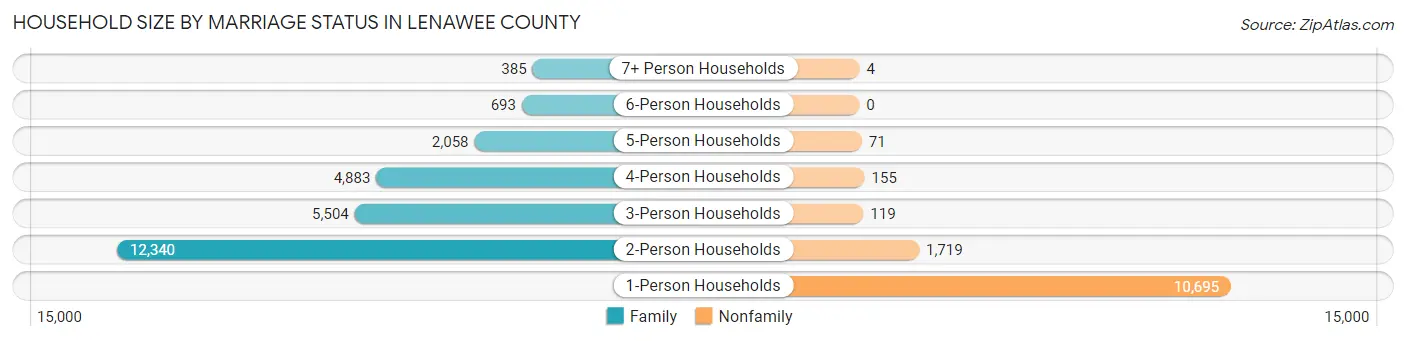
Household Size by Marriage Status in Lenawee County
Out of a total of 38,626 households in Lenawee County, 25,863 (67.0%) are family households, while 12,763 (33.0%) are nonfamily households. The most numerous type of family households are 2-person households, comprising 12,340, and the most common type of nonfamily households are 1-person households, comprising 10,695.
| Household Size | Family Households | Nonfamily Households |
| 1-Person Households | - | 10,695 (27.7%) |
| 2-Person Households | 12,340 (32.0%) | 1,719 (4.4%) |
| 3-Person Households | 5,504 (14.2%) | 119 (0.3%) |
| 4-Person Households | 4,883 (12.6%) | 155 (0.4%) |
| 5-Person Households | 2,058 (5.3%) | 71 (0.2%) |
| 6-Person Households | 693 (1.8%) | 0 (0.0%) |
| 7+ Person Households | 385 (1.0%) | 4 (0.0%) |
| Total | 25,863 (67.0%) | 12,763 (33.0%) |
Female Fertility in Lenawee County
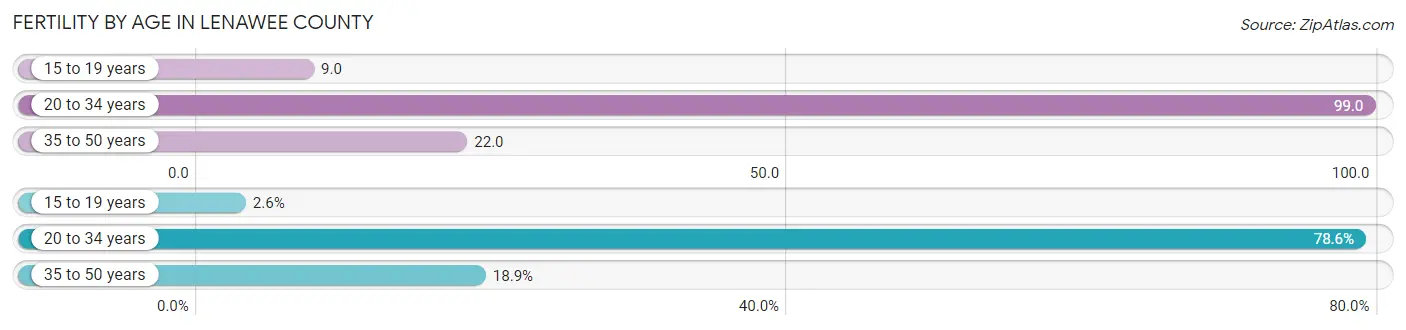
Fertility by Age in Lenawee County
Average fertility rate in Lenawee County is 51.0 births per 1,000 women. Women in the age bracket of 20 to 34 years have the highest fertility rate with 99.0 births per 1,000 women. Women in the age bracket of 20 to 34 years acount for 78.6% of all women with births.
| Age Bracket | Women with Births | Births / 1,000 Women |
| 15 to 19 years | 27 (2.6%) | 9.0 |
| 20 to 34 years | 825 (78.6%) | 99.0 |
| 35 to 50 years | 198 (18.9%) | 22.0 |
| Total | 1,050 (100.0%) | 51.0 |
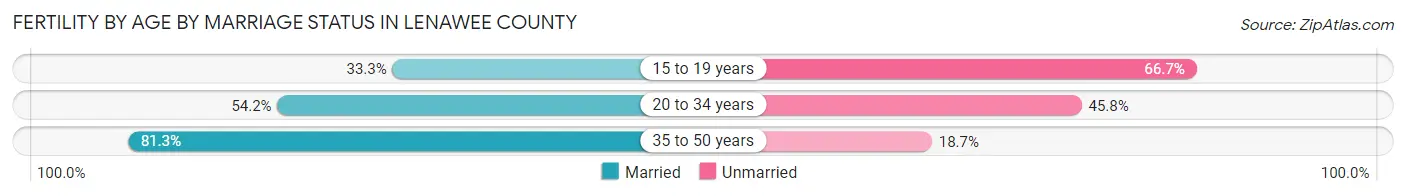
Fertility by Age by Marriage Status in Lenawee County
58.8% of women with births (1,050) in Lenawee County are married. The highest percentage of unmarried women with births falls into 15 to 19 years age bracket with 66.7% of them unmarried at the time of birth, while the lowest percentage of unmarried women with births belong to 35 to 50 years age bracket with 18.7% of them unmarried.
| Age Bracket | Married | Unmarried |
| 15 to 19 years | 9 (33.3%) | 18 (66.7%) |
| 20 to 34 years | 447 (54.2%) | 378 (45.8%) |
| 35 to 50 years | 161 (81.3%) | 37 (18.7%) |
| Total | 617 (58.8%) | 433 (41.2%) |
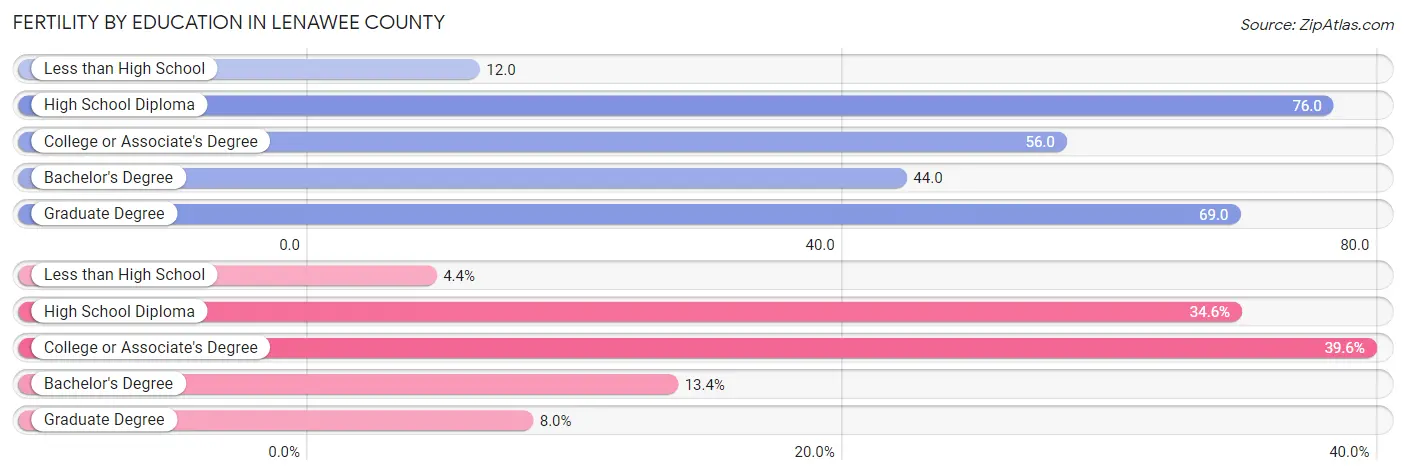
Fertility by Education in Lenawee County
Average fertility rate in Lenawee County is 51.0 births per 1,000 women. Women with the education attainment of high school diploma have the highest fertility rate of 76.0 births per 1,000 women, while women with the education attainment of less than high school have the lowest fertility at 12.0 births per 1,000 women. Women with the education attainment of college or associate's degree represent 39.6% of all women with births.
| Educational Attainment | Women with Births | Births / 1,000 Women |
| Less than High School | 46 (4.4%) | 12.0 |
| High School Diploma | 363 (34.6%) | 76.0 |
| College or Associate's Degree | 416 (39.6%) | 56.0 |
| Bachelor's Degree | 141 (13.4%) | 44.0 |
| Graduate Degree | 84 (8.0%) | 69.0 |
| Total | 1,050 (100.0%) | 51.0 |
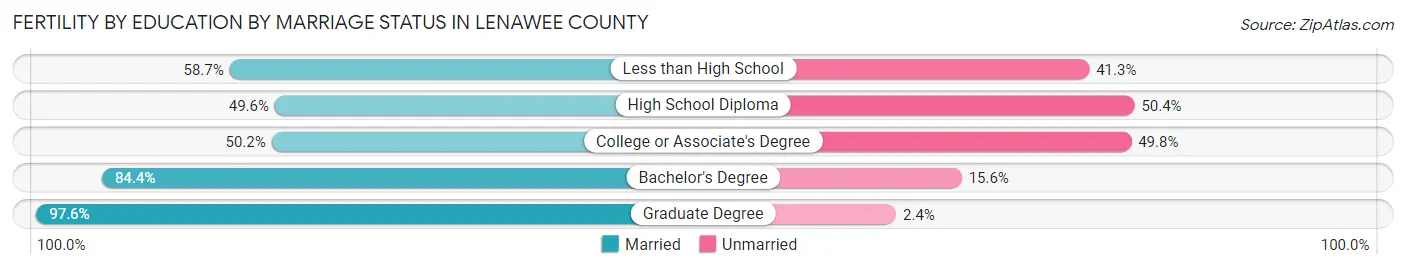
Fertility by Education by Marriage Status in Lenawee County
41.2% of women with births in Lenawee County are unmarried. Women with the educational attainment of graduate degree are most likely to be married with 97.6% of them married at childbirth, while women with the educational attainment of high school diploma are least likely to be married with 50.4% of them unmarried at childbirth.
| Educational Attainment | Married | Unmarried |
| Less than High School | 27 (58.7%) | 19 (41.3%) |
| High School Diploma | 180 (49.6%) | 183 (50.4%) |
| College or Associate's Degree | 209 (50.2%) | 207 (49.8%) |
| Bachelor's Degree | 119 (84.4%) | 22 (15.6%) |
| Graduate Degree | 82 (97.6%) | 2 (2.4%) |
| Total | 617 (58.8%) | 433 (41.2%) |
Income in Lenawee County
Income Overview in Lenawee County
Per Capita Income in Lenawee County is $32,976, while median incomes of families and households are $78,131 and $65,484 respectively.
| Characteristic | Number | Measure |
| Per Capita Income | 99,263 | $32,976 |
| Median Family Income | 25,863 | $78,131 |
| Mean Family Income | 25,863 | $95,986 |
| Median Household Income | 38,626 | $65,484 |
| Mean Household Income | 38,626 | $81,943 |
| Income Deficit | 25,863 | $11,431 |
| Wage / Income Gap (%) | 99,263 | 32.92% |
| Wage / Income Gap ($) | 99,263 | 67.08¢ per $1 |
| Gini / Inequality Index | 99,263 | 0.42 |
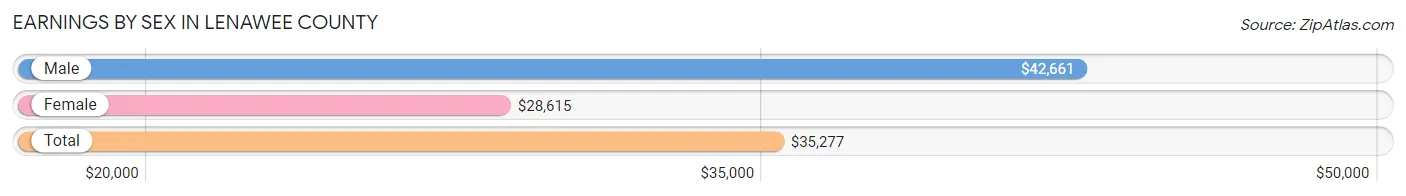
Earnings by Sex in Lenawee County
Average Earnings in Lenawee County are $35,277, $42,661 for men and $28,615 for women, a difference of 32.9%.
| Sex | Number | Average Earnings |
| Male | 27,666 (54.0%) | $42,661 |
| Female | 23,598 (46.0%) | $28,615 |
| Total | 51,264 (100.0%) | $35,277 |
Earnings by Sex by Income Bracket in Lenawee County
The most common earnings brackets in Lenawee County are $100,000+ for men (3,129 | 11.3%) and $2,499 or less for women (1,946 | 8.3%).
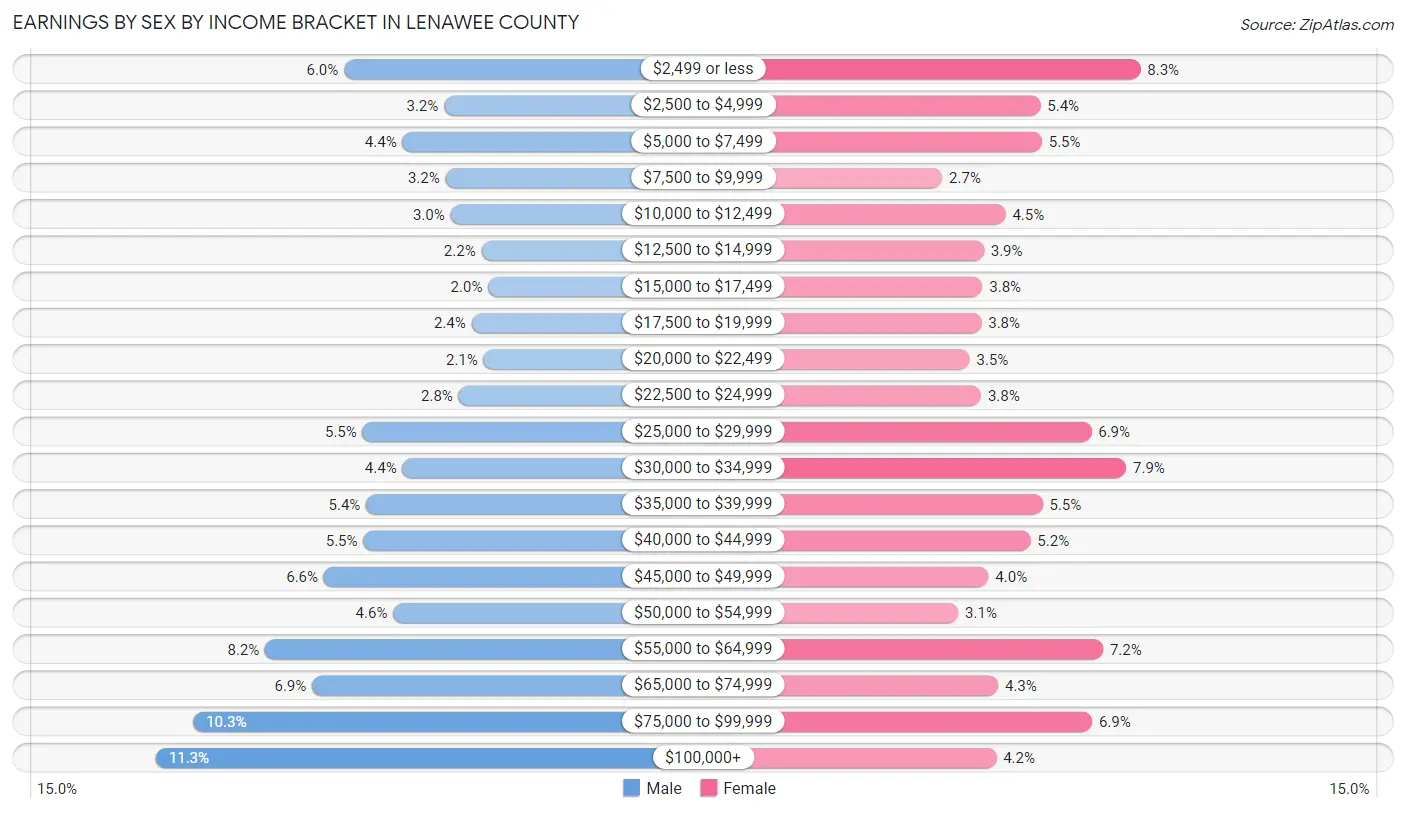
| Income | Male | Female |
| $2,499 or less | 1,665 (6.0%) | 1,946 (8.3%) |
| $2,500 to $4,999 | 889 (3.2%) | 1,283 (5.4%) |
| $5,000 to $7,499 | 1,213 (4.4%) | 1,292 (5.5%) |
| $7,500 to $9,999 | 878 (3.2%) | 633 (2.7%) |
| $10,000 to $12,499 | 838 (3.0%) | 1,053 (4.5%) |
| $12,500 to $14,999 | 597 (2.2%) | 909 (3.8%) |
| $15,000 to $17,499 | 546 (2.0%) | 898 (3.8%) |
| $17,500 to $19,999 | 675 (2.4%) | 892 (3.8%) |
| $20,000 to $22,499 | 581 (2.1%) | 814 (3.5%) |
| $22,500 to $24,999 | 774 (2.8%) | 889 (3.8%) |
| $25,000 to $29,999 | 1,522 (5.5%) | 1,622 (6.9%) |
| $30,000 to $34,999 | 1,212 (4.4%) | 1,853 (7.9%) |
| $35,000 to $39,999 | 1,493 (5.4%) | 1,299 (5.5%) |
| $40,000 to $44,999 | 1,516 (5.5%) | 1,218 (5.2%) |
| $45,000 to $49,999 | 1,823 (6.6%) | 939 (4.0%) |
| $50,000 to $54,999 | 1,283 (4.6%) | 738 (3.1%) |
| $55,000 to $64,999 | 2,280 (8.2%) | 1,699 (7.2%) |
| $65,000 to $74,999 | 1,914 (6.9%) | 1,004 (4.3%) |
| $75,000 to $99,999 | 2,838 (10.3%) | 1,626 (6.9%) |
| $100,000+ | 3,129 (11.3%) | 991 (4.2%) |
| Total | 27,666 (100.0%) | 23,598 (100.0%) |
Earnings by Sex by Educational Attainment in Lenawee County
Average earnings in Lenawee County are $48,474 for men and $33,810 for women, a difference of 30.2%. Men with an educational attainment of graduate degree enjoy the highest average annual earnings of $85,884, while those with less than high school education earn the least with $39,558. Women with an educational attainment of graduate degree earn the most with the average annual earnings of $62,591, while those with less than high school education have the smallest earnings of $22,692.
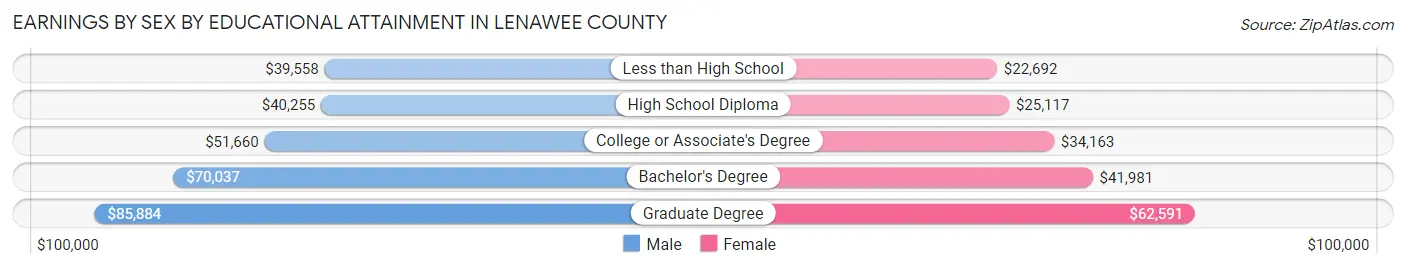
| Educational Attainment | Male Income | Female Income |
| Less than High School | $39,558 | $22,692 |
| High School Diploma | $40,255 | $25,117 |
| College or Associate's Degree | $51,660 | $34,163 |
| Bachelor's Degree | $70,037 | $41,981 |
| Graduate Degree | $85,884 | $62,591 |
| Total | $48,474 | $33,810 |
Family Income in Lenawee County
Family Income Brackets in Lenawee County
According to the Lenawee County family income data, there are 5,457 families falling into the $50,000 to $74,999 income range, which is the most common income bracket and makes up 21.1% of all families. Conversely, the $10,000 to $14,999 income bracket is the least frequent group with only 414 families (1.6%) belonging to this category.
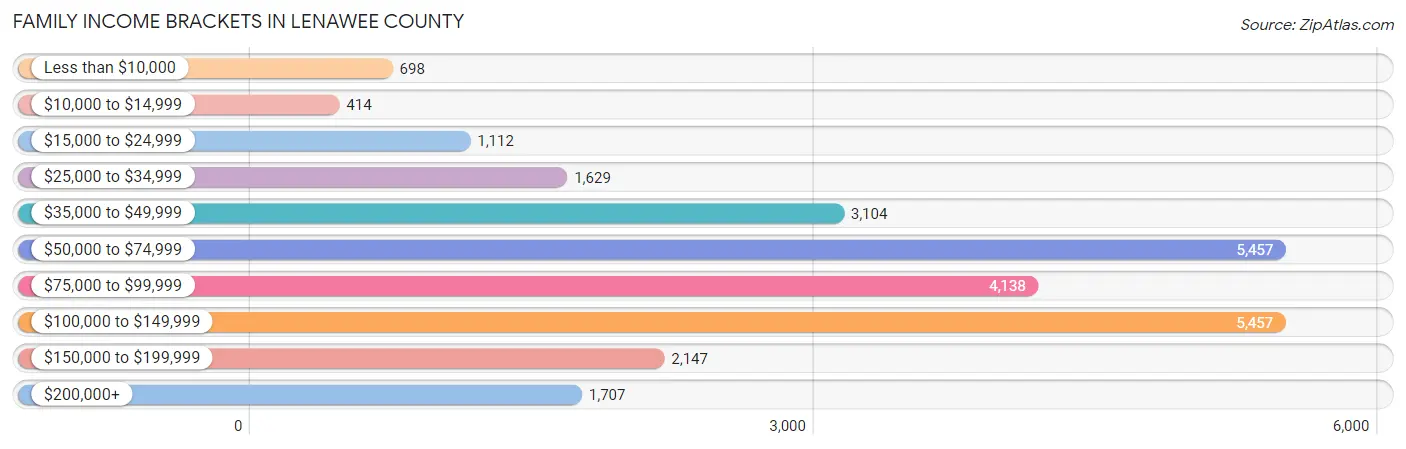
| Income Bracket | # Families | % Families |
| Less than $10,000 | 698 | 2.7% |
| $10,000 to $14,999 | 414 | 1.6% |
| $15,000 to $24,999 | 1,112 | 4.3% |
| $25,000 to $34,999 | 1,629 | 6.3% |
| $35,000 to $49,999 | 3,104 | 12.0% |
| $50,000 to $74,999 | 5,457 | 21.1% |
| $75,000 to $99,999 | 4,138 | 16.0% |
| $100,000 to $149,999 | 5,457 | 21.1% |
| $150,000 to $199,999 | 2,147 | 8.3% |
| $200,000+ | 1,707 | 6.6% |
Family Income by Famaliy Size in Lenawee County
5-person families (1,712 | 6.6%) account for the highest median family income in Lenawee County with $99,846 per family, while 2-person families (13,381 | 51.7%) have the highest median income of $36,199 per family member.
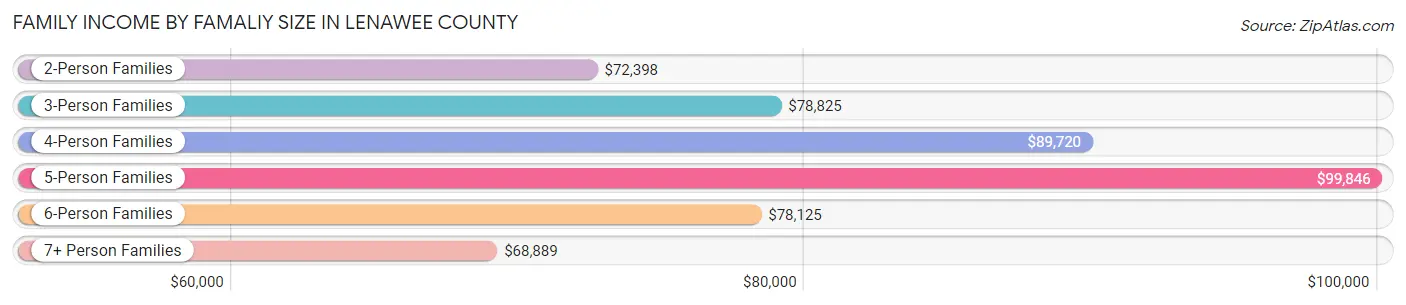
| Income Bracket | # Families | Median Income |
| 2-Person Families | 13,381 (51.7%) | $72,398 |
| 3-Person Families | 5,223 (20.2%) | $78,825 |
| 4-Person Families | 4,576 (17.7%) | $89,720 |
| 5-Person Families | 1,712 (6.6%) | $99,846 |
| 6-Person Families | 647 (2.5%) | $78,125 |
| 7+ Person Families | 324 (1.3%) | $68,889 |
| Total | 25,863 (100.0%) | $78,131 |
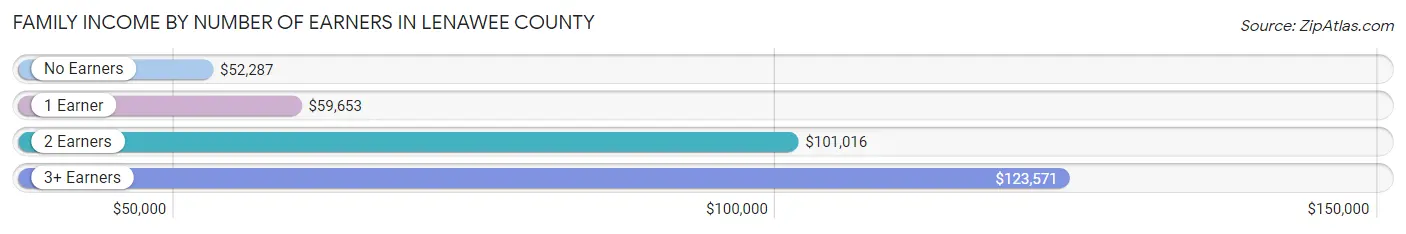
Family Income by Number of Earners in Lenawee County
The median family income in Lenawee County is $78,131, with families comprising 3+ earners (2,696) having the highest median family income of $123,571, while families with no earners (4,763) have the lowest median family income of $52,287, accounting for 10.4% and 18.4% of families, respectively.
| Number of Earners | # Families | Median Income |
| No Earners | 4,763 (18.4%) | $52,287 |
| 1 Earner | 8,256 (31.9%) | $59,653 |
| 2 Earners | 10,148 (39.2%) | $101,016 |
| 3+ Earners | 2,696 (10.4%) | $123,571 |
| Total | 25,863 (100.0%) | $78,131 |
Household Income in Lenawee County
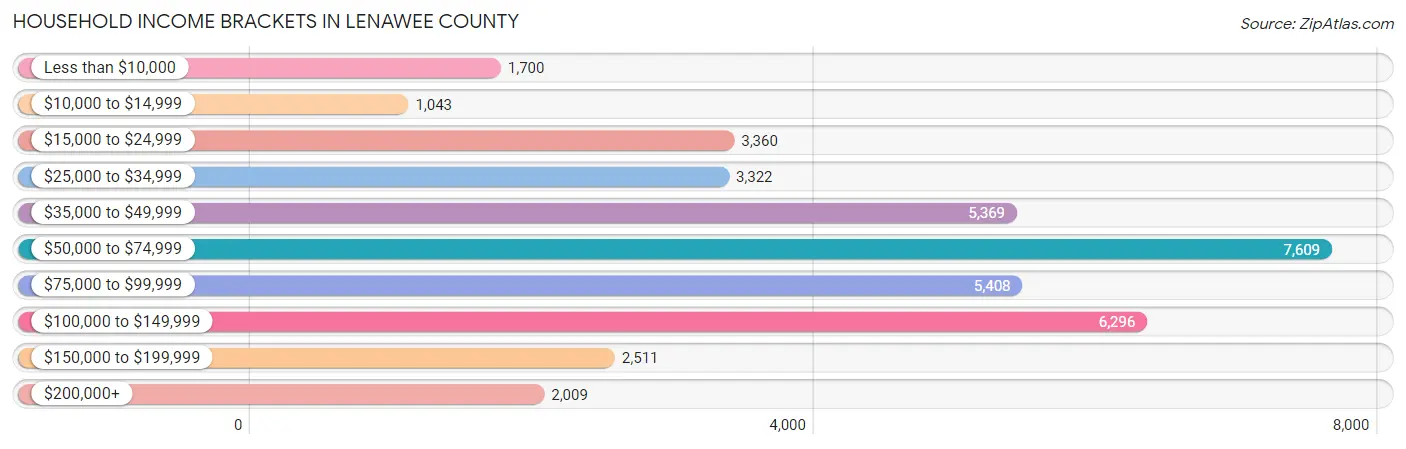
Household Income Brackets in Lenawee County
With 7,609 households falling in the category, the $50,000 to $74,999 income range is the most frequent in Lenawee County, accounting for 19.7% of all households. In contrast, only 1,043 households (2.7%) fall into the $10,000 to $14,999 income bracket, making it the least populous group.
| Income Bracket | # Households | % Households |
| Less than $10,000 | 1,700 | 4.4% |
| $10,000 to $14,999 | 1,043 | 2.7% |
| $15,000 to $24,999 | 3,360 | 8.7% |
| $25,000 to $34,999 | 3,322 | 8.6% |
| $35,000 to $49,999 | 5,369 | 13.9% |
| $50,000 to $74,999 | 7,609 | 19.7% |
| $75,000 to $99,999 | 5,408 | 14.0% |
| $100,000 to $149,999 | 6,296 | 16.3% |
| $150,000 to $199,999 | 2,511 | 6.5% |
| $200,000+ | 2,009 | 5.2% |
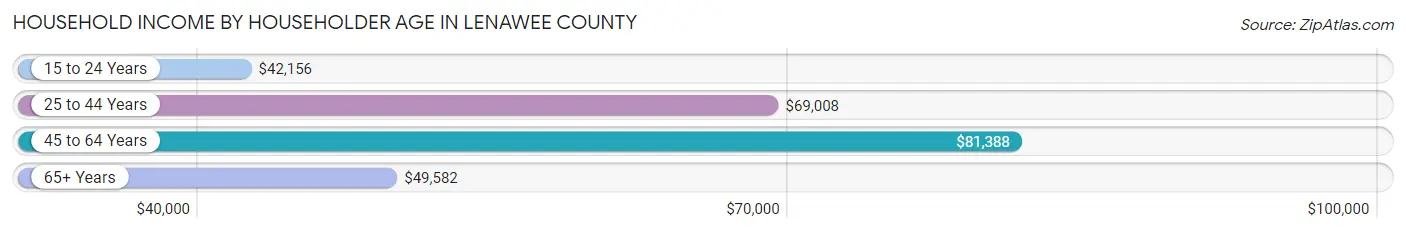
Household Income by Householder Age in Lenawee County
The median household income in Lenawee County is $65,484, with the highest median household income of $81,388 found in the 45 to 64 years age bracket for the primary householder. A total of 14,492 households (37.5%) fall into this category. Meanwhile, the 15 to 24 years age bracket for the primary householder has the lowest median household income of $42,156, with 1,269 households (3.3%) in this group.
| Income Bracket | # Households | Median Income |
| 15 to 24 Years | 1,269 (3.3%) | $42,156 |
| 25 to 44 Years | 10,843 (28.1%) | $69,008 |
| 45 to 64 Years | 14,492 (37.5%) | $81,388 |
| 65+ Years | 12,022 (31.1%) | $49,582 |
| Total | 38,626 (100.0%) | $65,484 |
Poverty in Lenawee County
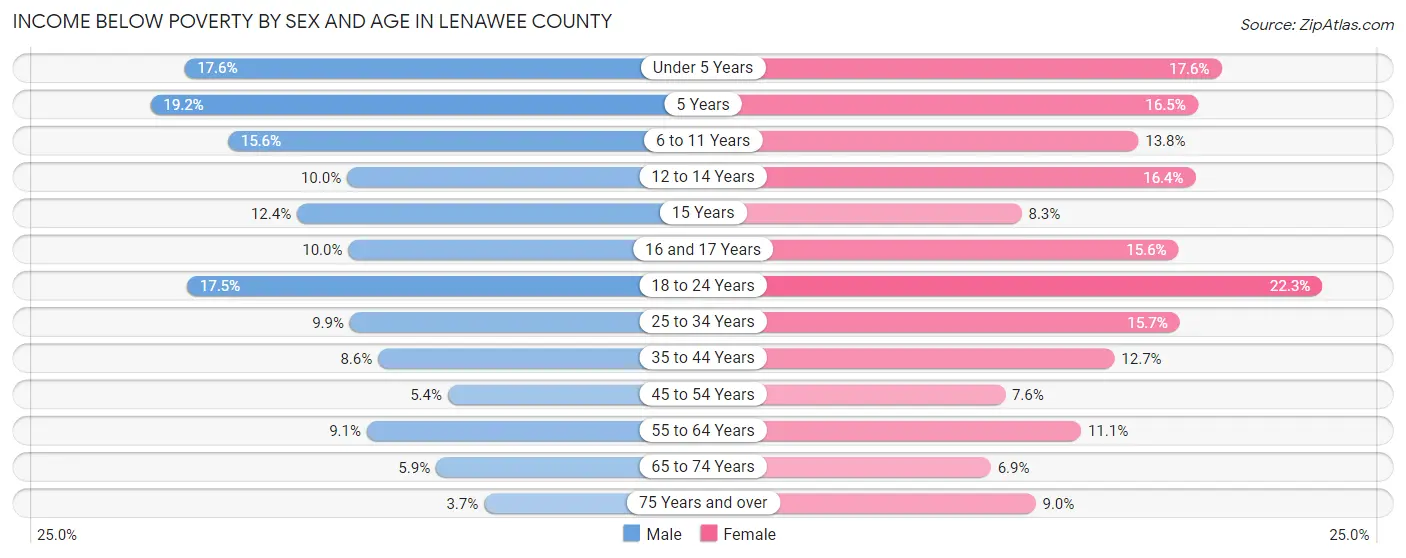
Income Below Poverty by Sex and Age in Lenawee County
With 9.8% poverty level for males and 12.3% for females among the residents of Lenawee County, 5 year old males and 18 to 24 year old females are the most vulnerable to poverty, with 109 males (19.2%) and 791 females (22.3%) in their respective age groups living below the poverty level.
| Age Bracket | Male | Female |
| Under 5 Years | 448 (17.6%) | 435 (17.6%) |
| 5 Years | 109 (19.2%) | 103 (16.5%) |
| 6 to 11 Years | 575 (15.6%) | 403 (13.8%) |
| 12 to 14 Years | 158 (10.0%) | 312 (16.4%) |
| 15 Years | 86 (12.4%) | 60 (8.3%) |
| 16 and 17 Years | 126 (10.0%) | 175 (15.6%) |
| 18 to 24 Years | 689 (17.5%) | 791 (22.3%) |
| 25 to 34 Years | 543 (9.9%) | 838 (15.7%) |
| 35 to 44 Years | 504 (8.6%) | 700 (12.7%) |
| 45 to 54 Years | 324 (5.4%) | 457 (7.6%) |
| 55 to 64 Years | 610 (9.1%) | 780 (11.1%) |
| 65 to 74 Years | 322 (5.9%) | 415 (6.9%) |
| 75 Years and over | 114 (3.7%) | 374 (9.0%) |
| Total | 4,608 (9.8%) | 5,843 (12.3%) |
Income Above Poverty by Sex and Age in Lenawee County
According to the poverty statistics in Lenawee County, males aged 75 years and over and females aged 65 to 74 years are the age groups that are most secure financially, with 96.3% of males and 93.1% of females in these age groups living above the poverty line.
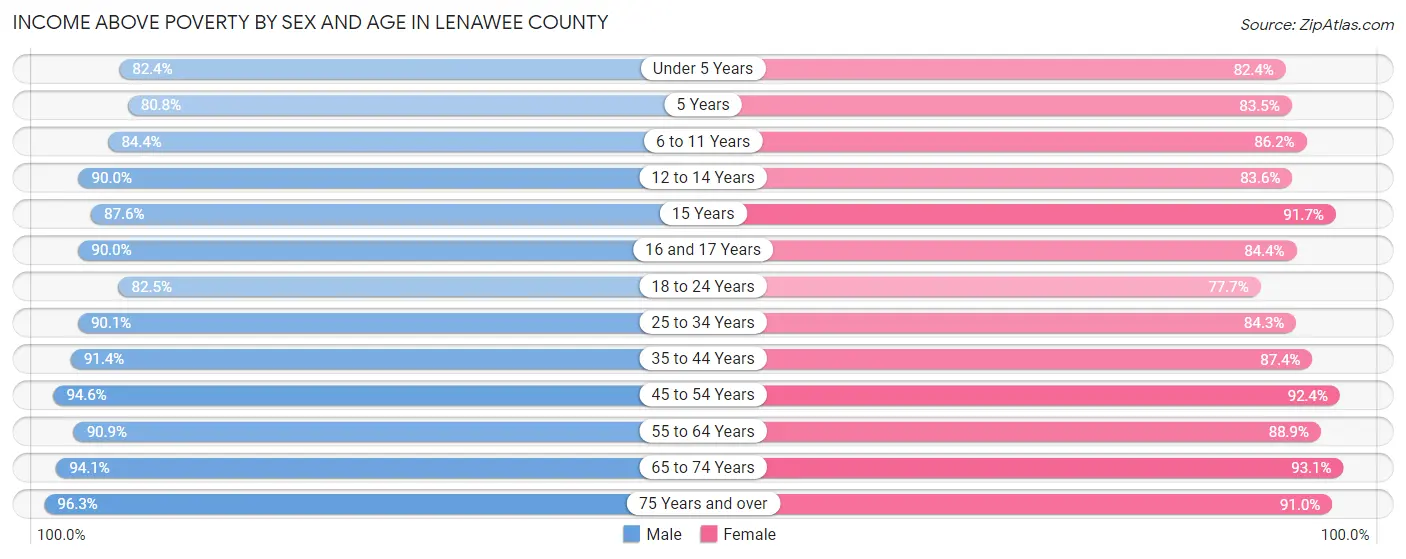
| Age Bracket | Male | Female |
| Under 5 Years | 2,099 (82.4%) | 2,035 (82.4%) |
| 5 Years | 460 (80.8%) | 521 (83.5%) |
| 6 to 11 Years | 3,118 (84.4%) | 2,525 (86.2%) |
| 12 to 14 Years | 1,416 (90.0%) | 1,590 (83.6%) |
| 15 Years | 610 (87.6%) | 659 (91.7%) |
| 16 and 17 Years | 1,137 (90.0%) | 945 (84.4%) |
| 18 to 24 Years | 3,255 (82.5%) | 2,758 (77.7%) |
| 25 to 34 Years | 4,936 (90.1%) | 4,509 (84.3%) |
| 35 to 44 Years | 5,359 (91.4%) | 4,833 (87.4%) |
| 45 to 54 Years | 5,717 (94.6%) | 5,580 (92.4%) |
| 55 to 64 Years | 6,077 (90.9%) | 6,249 (88.9%) |
| 65 to 74 Years | 5,126 (94.1%) | 5,589 (93.1%) |
| 75 Years and over | 2,986 (96.3%) | 3,786 (91.0%) |
| Total | 42,296 (90.2%) | 41,579 (87.7%) |
Income Below Poverty Among Married-Couple Families in Lenawee County
The poverty statistics for married-couple families in Lenawee County show that 4.1% or 814 of the total 19,824 families live below the poverty line. Families with 5 or more children have the highest poverty rate of 17.9%, comprising of 19 families. On the other hand, families with no children have the lowest poverty rate of 2.3%, which includes 295 families.
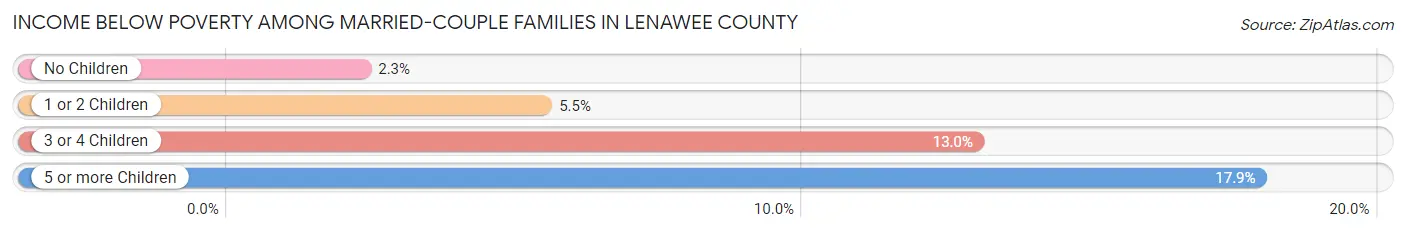
| Children | Above Poverty | Below Poverty |
| No Children | 12,430 (97.7%) | 295 (2.3%) |
| 1 or 2 Children | 5,134 (94.5%) | 297 (5.5%) |
| 3 or 4 Children | 1,359 (87.0%) | 203 (13.0%) |
| 5 or more Children | 87 (82.1%) | 19 (17.9%) |
| Total | 19,010 (95.9%) | 814 (4.1%) |
Income Below Poverty Among Single-Parent Households in Lenawee County
According to the poverty data in Lenawee County, 15.7% or 358 single-father households and 21.2% or 794 single-mother households are living below the poverty line. Among single-father households, those with 1 or 2 children have the highest poverty rate, with 293 households (22.6%) experiencing poverty. Likewise, among single-mother households, those with 5 or more children have the highest poverty rate, with 80 households (79.2%) falling below the poverty line.
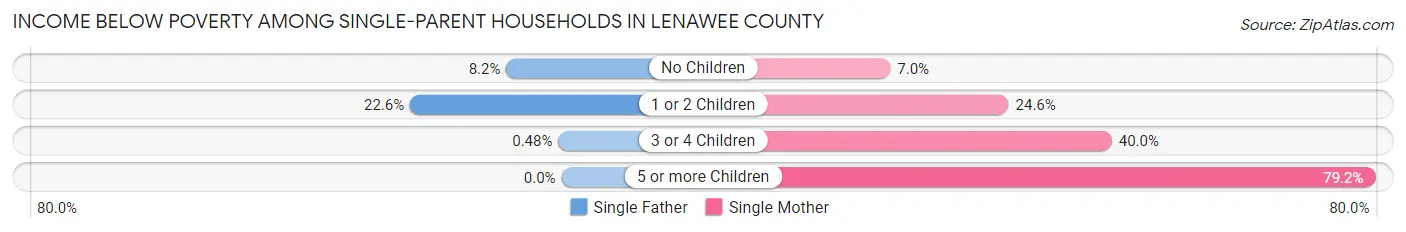
| Children | Single Father | Single Mother |
| No Children | 64 (8.2%) | 99 (7.0%) |
| 1 or 2 Children | 293 (22.6%) | 438 (24.6%) |
| 3 or 4 Children | 1 (0.5%) | 177 (40.0%) |
| 5 or more Children | 0 (0.0%) | 80 (79.2%) |
| Total | 358 (15.7%) | 794 (21.2%) |
Income Below Poverty Among Married-Couple vs Single-Parent Households in Lenawee County
The poverty data for Lenawee County shows that 814 of the married-couple family households (4.1%) and 1,152 of the single-parent households (19.1%) are living below the poverty level. Within the married-couple family households, those with 5 or more children have the highest poverty rate, with 19 households (17.9%) falling below the poverty line. Among the single-parent households, those with 5 or more children have the highest poverty rate, with 80 household (79.2%) living below poverty.
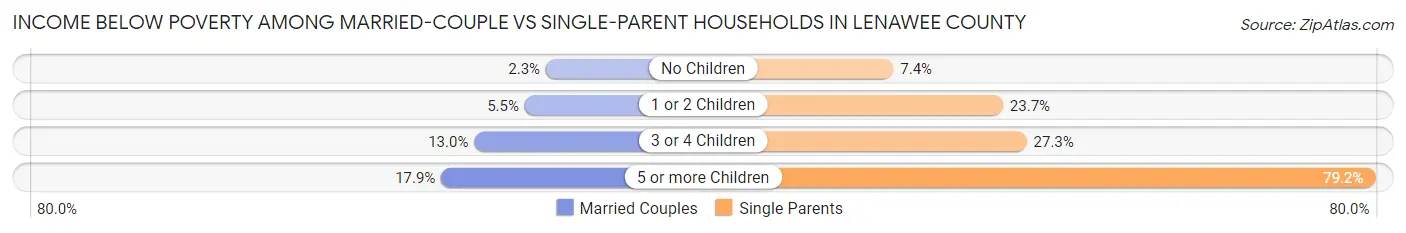
| Children | Married-Couple Families | Single-Parent Households |
| No Children | 295 (2.3%) | 163 (7.4%) |
| 1 or 2 Children | 297 (5.5%) | 731 (23.7%) |
| 3 or 4 Children | 203 (13.0%) | 178 (27.3%) |
| 5 or more Children | 19 (17.9%) | 80 (79.2%) |
| Total | 814 (4.1%) | 1,152 (19.1%) |
Employment Characteristics in Lenawee County
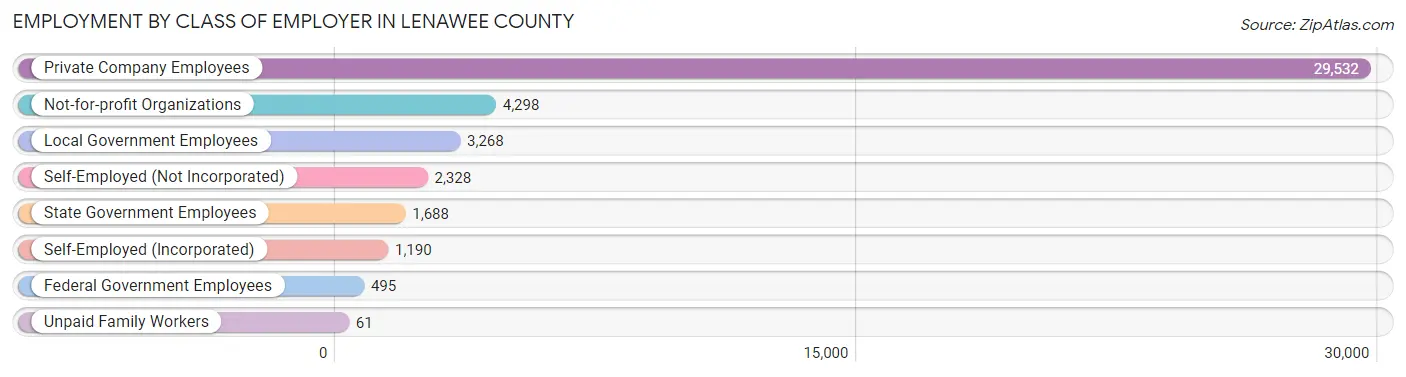
Employment by Class of Employer in Lenawee County
Among the 42,860 employed individuals in Lenawee County, private company employees (29,532 | 68.9%), not-for-profit organizations (4,298 | 10.0%), and local government employees (3,268 | 7.6%) make up the most common classes of employment.
| Employer Class | # Employees | % Employees |
| Private Company Employees | 29,532 | 68.9% |
| Self-Employed (Incorporated) | 1,190 | 2.8% |
| Self-Employed (Not Incorporated) | 2,328 | 5.4% |
| Not-for-profit Organizations | 4,298 | 10.0% |
| Local Government Employees | 3,268 | 7.6% |
| State Government Employees | 1,688 | 3.9% |
| Federal Government Employees | 495 | 1.1% |
| Unpaid Family Workers | 61 | 0.1% |
| Total | 42,860 | 100.0% |
Employment Status by Age in Lenawee County
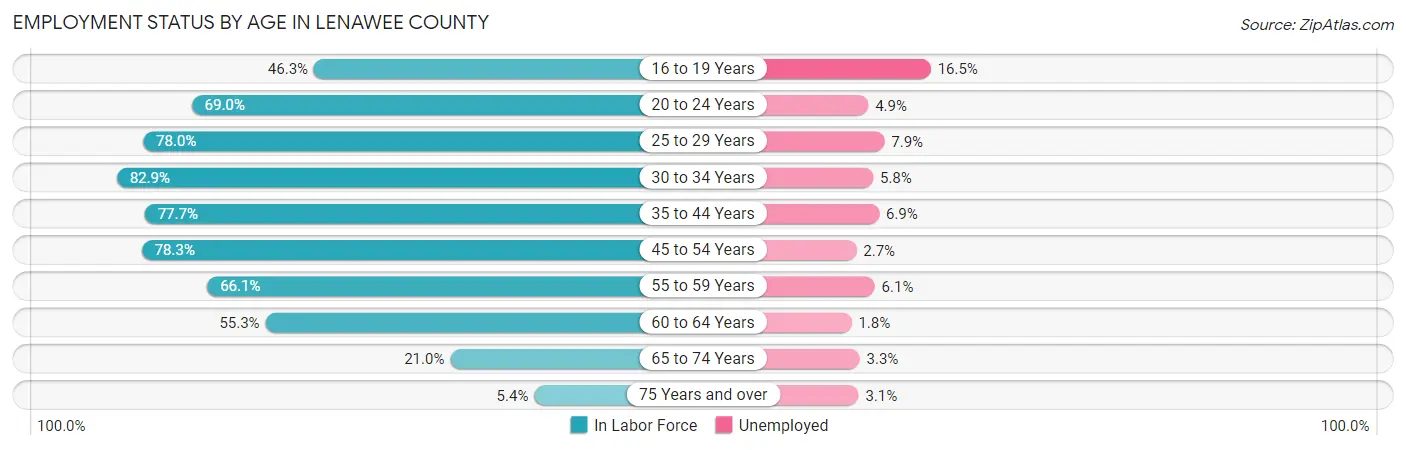
According to the labor force statistics for Lenawee County, out of the total population over 16 years of age (81,200), 57.5% or 46,690 individuals are in the labor force, with 5.6% or 2,615 of them unemployed. The age group with the highest labor force participation rate is 30 to 34 years, with 82.9% or 4,641 individuals in the labor force. Within the labor force, the 16 to 19 years age range has the highest percentage of unemployed individuals, with 16.5% or 399 of them being unemployed.
| Age Bracket | In Labor Force | Unemployed |
| 16 to 19 Years | 2,421 (46.3%) | 399 (16.5%) |
| 20 to 24 Years | 4,473 (69.0%) | 219 (4.9%) |
| 25 to 29 Years | 4,441 (78.0%) | 351 (7.9%) |
| 30 to 34 Years | 4,641 (82.9%) | 269 (5.8%) |
| 35 to 44 Years | 9,389 (77.7%) | 648 (6.9%) |
| 45 to 54 Years | 9,948 (78.3%) | 269 (2.7%) |
| 55 to 59 Years | 4,407 (66.1%) | 269 (6.1%) |
| 60 to 64 Years | 4,105 (55.3%) | 74 (1.8%) |
| 65 to 74 Years | 2,446 (21.0%) | 81 (3.3%) |
| 75 Years and over | 414 (5.4%) | 13 (3.1%) |
| Total | 46,690 (57.5%) | 2,615 (5.6%) |
Employment Status by Educational Attainment in Lenawee County
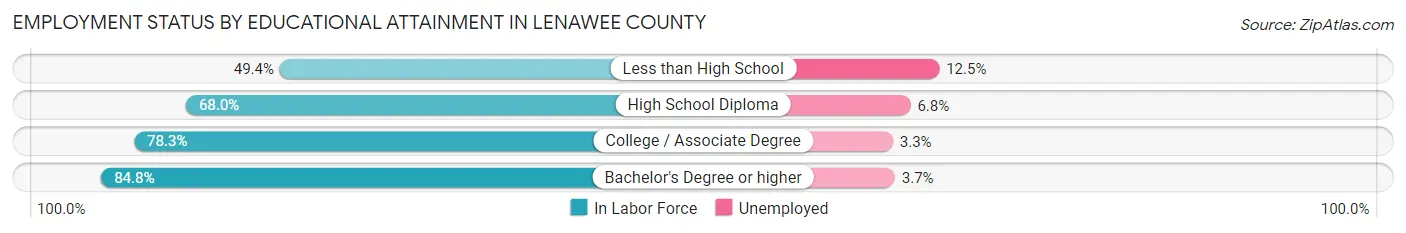
According to labor force statistics for Lenawee County, 73.6% of individuals (36,926) out of the total population between 25 and 64 years of age (50,171) are in the labor force, with 5.1% or 1,883 of them being unemployed. The group with the highest labor force participation rate are those with the educational attainment of bachelor's degree or higher, with 84.8% or 9,498 individuals in the labor force. Within the labor force, individuals with less than high school education have the highest percentage of unemployment, with 12.5% or 276 of them being unemployed.
| Educational Attainment | In Labor Force | Unemployed |
| Less than High School | 2,208 (49.4%) | 559 (12.5%) |
| High School Diploma | 11,800 (68.0%) | 1,180 (6.8%) |
| College / Associate Degree | 13,426 (78.3%) | 566 (3.3%) |
| Bachelor's Degree or higher | 9,498 (84.8%) | 414 (3.7%) |
| Total | 36,926 (73.6%) | 2,559 (5.1%) |
Employment Occupations by Sex in Lenawee County
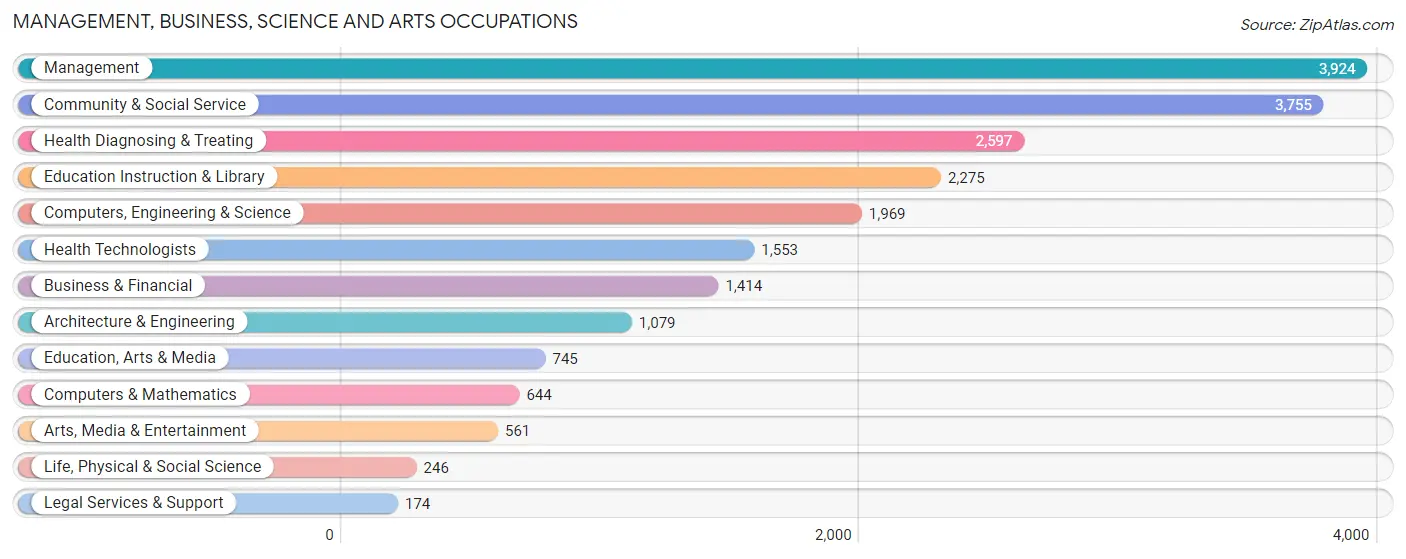
Management, Business, Science and Arts Occupations
The most common Management, Business, Science and Arts occupations in Lenawee County are Management (3,924 | 8.9%), Community & Social Service (3,755 | 8.5%), Health Diagnosing & Treating (2,597 | 5.9%), Education Instruction & Library (2,275 | 5.2%), and Computers, Engineering & Science (1,969 | 4.5%).
Management, Business, Science and Arts Occupations by Sex
Within the Management, Business, Science and Arts occupations in Lenawee County, the most male-oriented occupations are Architecture & Engineering (90.4%), Computers, Engineering & Science (81.1%), and Computers & Mathematics (72.1%), while the most female-oriented occupations are Health Technologists (88.1%), Health Diagnosing & Treating (83.0%), and Education Instruction & Library (77.3%).
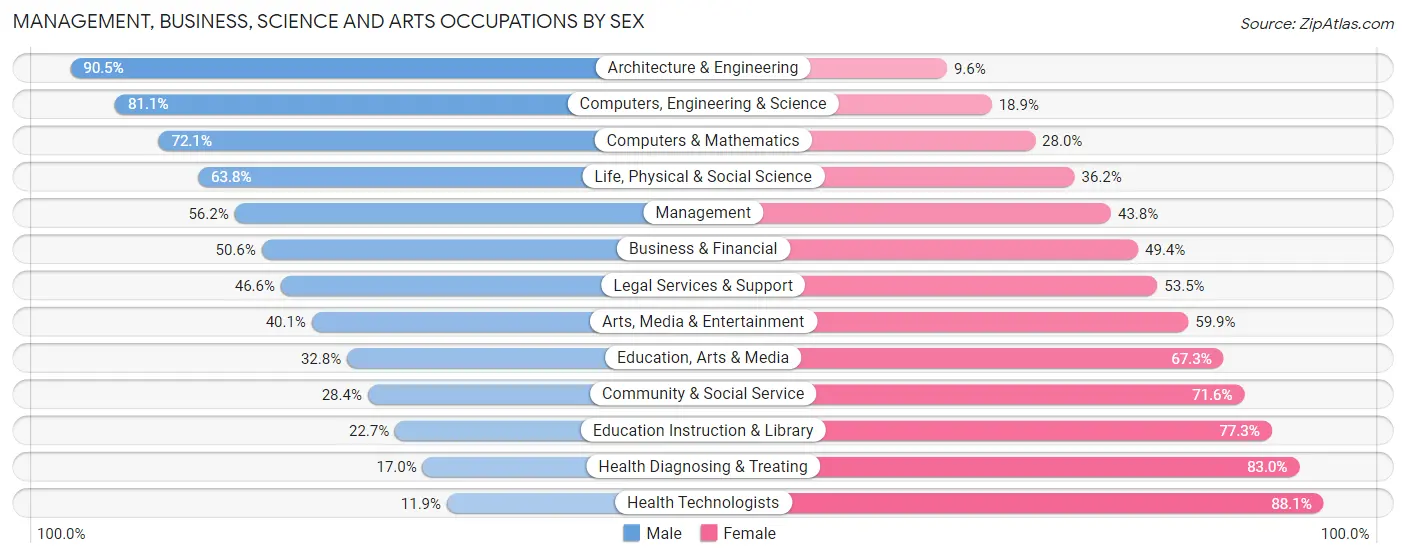
| Occupation | Male | Female |
| Management | 2,206 (56.2%) | 1,718 (43.8%) |
| Business & Financial | 715 (50.6%) | 699 (49.4%) |
| Computers, Engineering & Science | 1,597 (81.1%) | 372 (18.9%) |
| Computers & Mathematics | 464 (72.1%) | 180 (28.0%) |
| Architecture & Engineering | 976 (90.4%) | 103 (9.6%) |
| Life, Physical & Social Science | 157 (63.8%) | 89 (36.2%) |
| Community & Social Service | 1,067 (28.4%) | 2,688 (71.6%) |
| Education, Arts & Media | 244 (32.8%) | 501 (67.2%) |
| Legal Services & Support | 81 (46.6%) | 93 (53.4%) |
| Education Instruction & Library | 517 (22.7%) | 1,758 (77.3%) |
| Arts, Media & Entertainment | 225 (40.1%) | 336 (59.9%) |
| Health Diagnosing & Treating | 441 (17.0%) | 2,156 (83.0%) |
| Health Technologists | 185 (11.9%) | 1,368 (88.1%) |
| Total (Category) | 6,026 (44.1%) | 7,633 (55.9%) |
| Total (Overall) | 23,649 (53.7%) | 20,397 (46.3%) |
Services Occupations
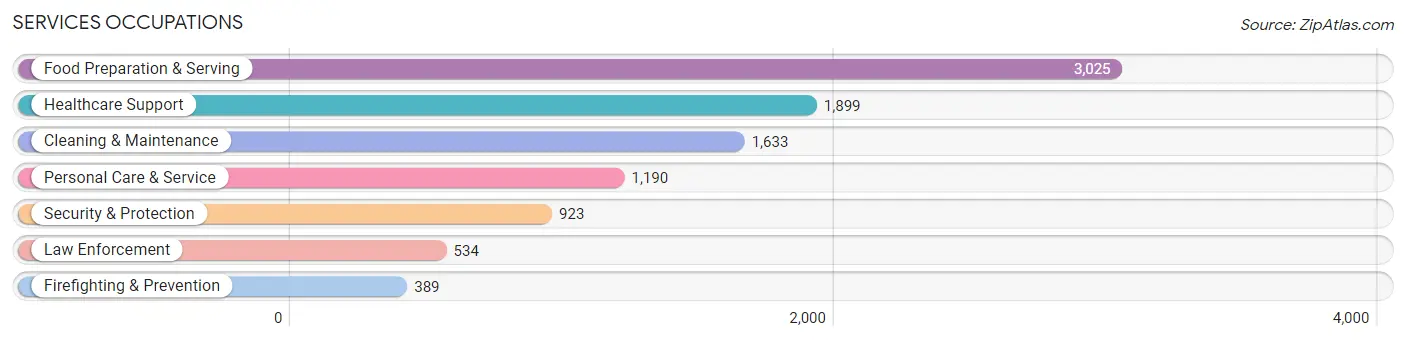
The most common Services occupations in Lenawee County are Food Preparation & Serving (3,025 | 6.9%), Healthcare Support (1,899 | 4.3%), Cleaning & Maintenance (1,633 | 3.7%), Personal Care & Service (1,190 | 2.7%), and Security & Protection (923 | 2.1%).
Services Occupations by Sex
Within the Services occupations in Lenawee County, the most male-oriented occupations are Law Enforcement (82.6%), Security & Protection (78.1%), and Firefighting & Prevention (72.0%), while the most female-oriented occupations are Healthcare Support (93.3%), Personal Care & Service (75.9%), and Food Preparation & Serving (60.4%).
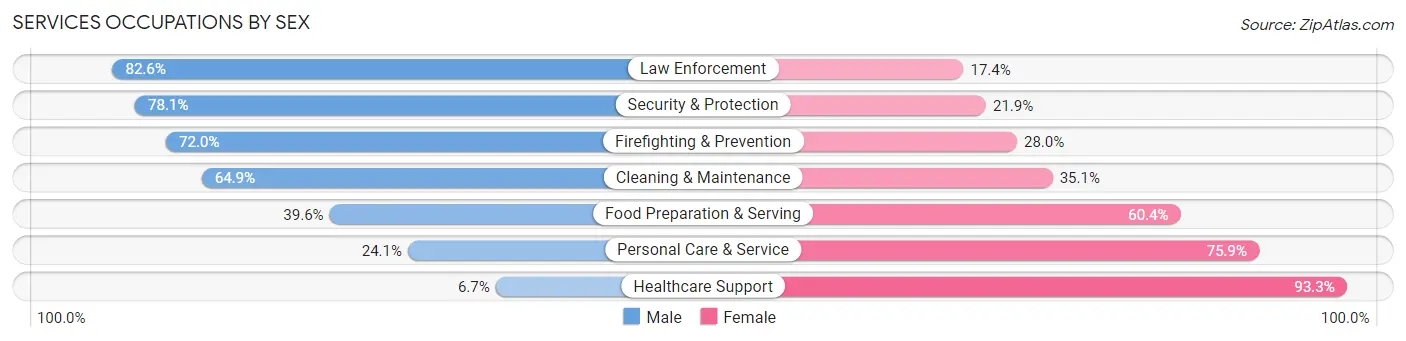
| Occupation | Male | Female |
| Healthcare Support | 128 (6.7%) | 1,771 (93.3%) |
| Security & Protection | 721 (78.1%) | 202 (21.9%) |
| Firefighting & Prevention | 280 (72.0%) | 109 (28.0%) |
| Law Enforcement | 441 (82.6%) | 93 (17.4%) |
| Food Preparation & Serving | 1,199 (39.6%) | 1,826 (60.4%) |
| Cleaning & Maintenance | 1,060 (64.9%) | 573 (35.1%) |
| Personal Care & Service | 287 (24.1%) | 903 (75.9%) |
| Total (Category) | 3,395 (39.2%) | 5,275 (60.8%) |
| Total (Overall) | 23,649 (53.7%) | 20,397 (46.3%) |
Sales and Office Occupations
The most common Sales and Office occupations in Lenawee County are Office & Administration (4,555 | 10.3%), and Sales & Related (3,407 | 7.7%).

Sales and Office Occupations by Sex

| Occupation | Male | Female |
| Sales & Related | 1,621 (47.6%) | 1,786 (52.4%) |
| Office & Administration | 1,090 (23.9%) | 3,465 (76.1%) |
| Total (Category) | 2,711 (34.1%) | 5,251 (65.9%) |
| Total (Overall) | 23,649 (53.7%) | 20,397 (46.3%) |
Natural Resources, Construction and Maintenance Occupations
The most common Natural Resources, Construction and Maintenance occupations in Lenawee County are Construction & Extraction (2,142 | 4.9%), Installation, Maintenance & Repair (1,668 | 3.8%), and Farming, Fishing & Forestry (540 | 1.2%).

Natural Resources, Construction and Maintenance Occupations by Sex

| Occupation | Male | Female |
| Farming, Fishing & Forestry | 391 (72.4%) | 149 (27.6%) |
| Construction & Extraction | 2,117 (98.8%) | 25 (1.2%) |
| Installation, Maintenance & Repair | 1,605 (96.2%) | 63 (3.8%) |
| Total (Category) | 4,113 (94.6%) | 237 (5.4%) |
| Total (Overall) | 23,649 (53.7%) | 20,397 (46.3%) |
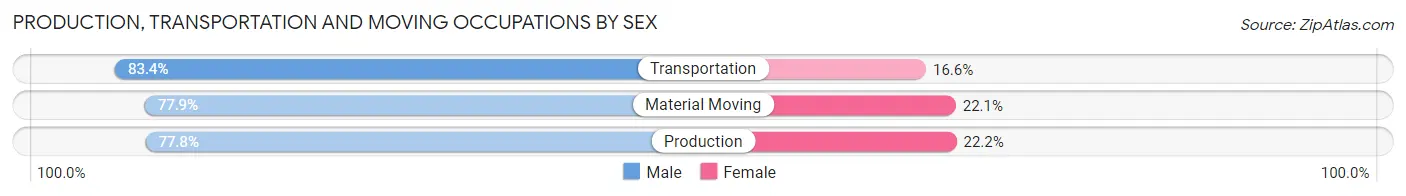
Production, Transportation and Moving Occupations
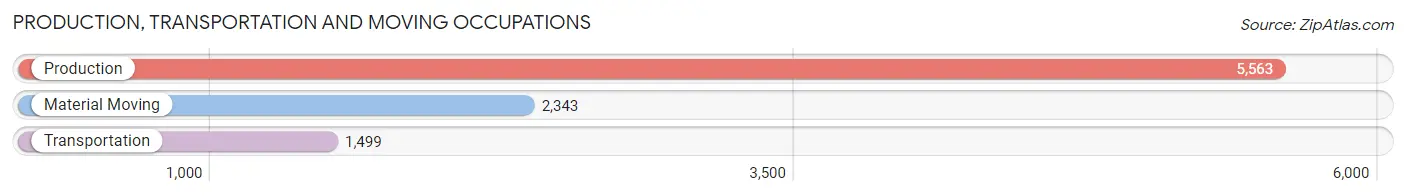
The most common Production, Transportation and Moving occupations in Lenawee County are Production (5,563 | 12.6%), Material Moving (2,343 | 5.3%), and Transportation (1,499 | 3.4%).
Production, Transportation and Moving Occupations by Sex
| Occupation | Male | Female |
| Production | 4,328 (77.8%) | 1,235 (22.2%) |
| Transportation | 1,250 (83.4%) | 249 (16.6%) |
| Material Moving | 1,826 (77.9%) | 517 (22.1%) |
| Total (Category) | 7,404 (78.7%) | 2,001 (21.3%) |
| Total (Overall) | 23,649 (53.7%) | 20,397 (46.3%) |
Employment Industries by Sex in Lenawee County
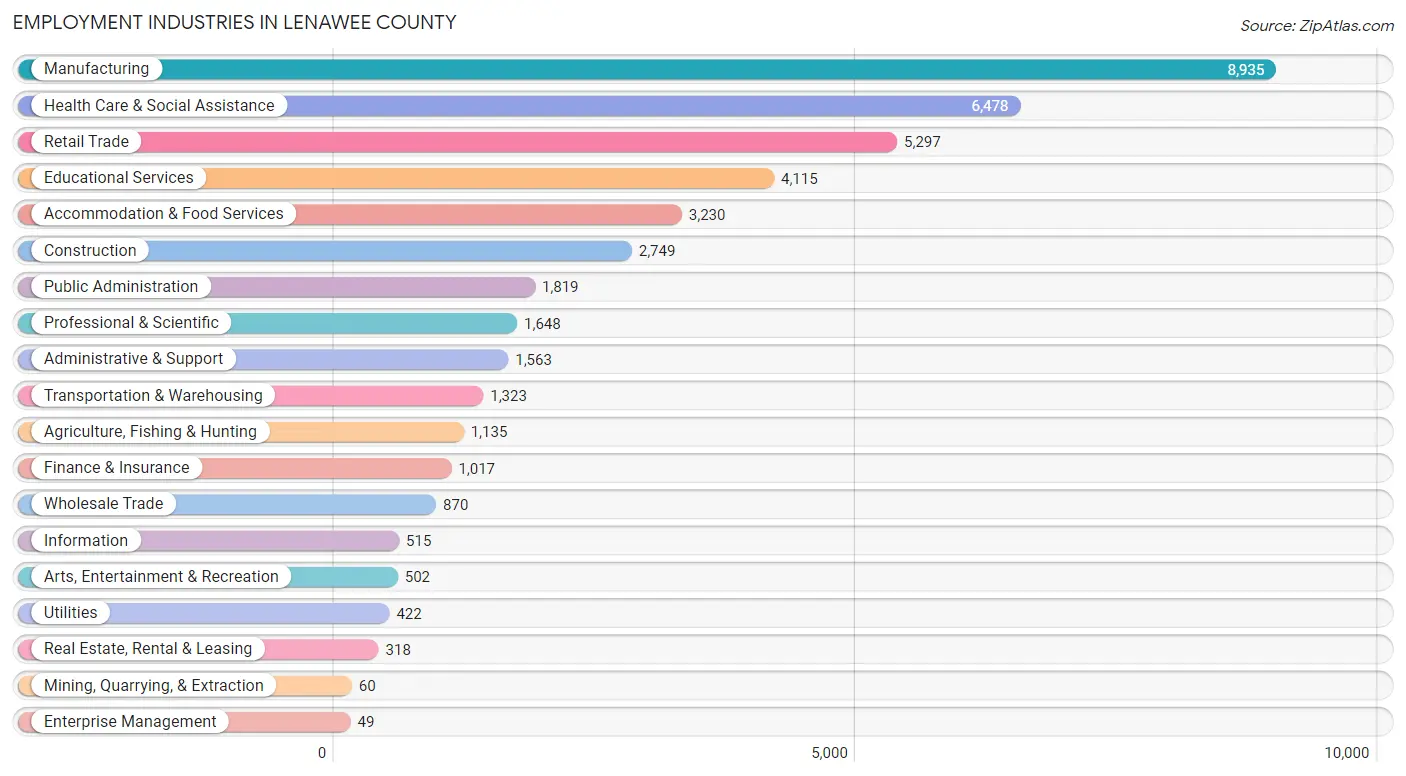
Employment Industries in Lenawee County
The major employment industries in Lenawee County include Manufacturing (8,935 | 20.3%), Health Care & Social Assistance (6,478 | 14.7%), Retail Trade (5,297 | 12.0%), Educational Services (4,115 | 9.3%), and Accommodation & Food Services (3,230 | 7.3%).
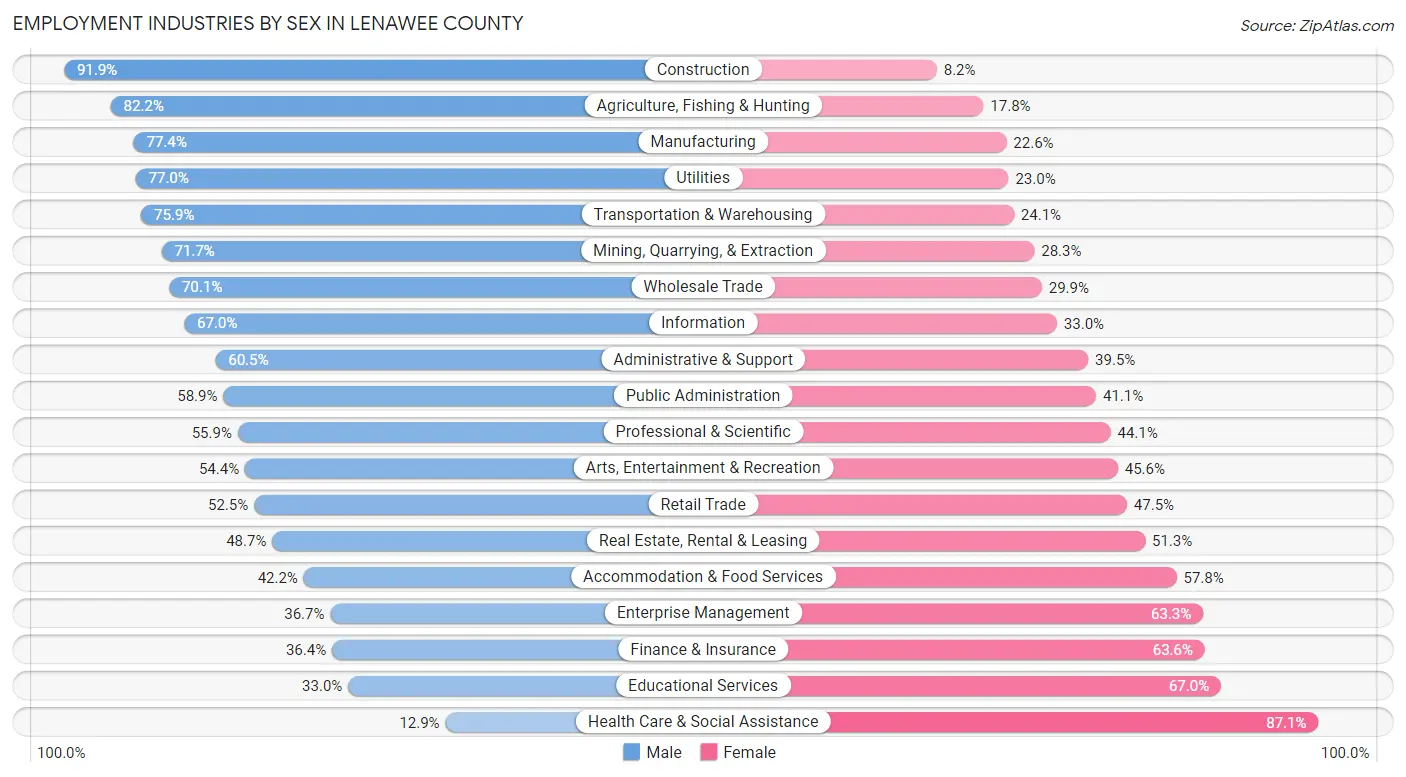
Employment Industries by Sex in Lenawee County
The Lenawee County industries that see more men than women are Construction (91.8%), Agriculture, Fishing & Hunting (82.2%), and Manufacturing (77.4%), whereas the industries that tend to have a higher number of women are Health Care & Social Assistance (87.1%), Educational Services (67.0%), and Finance & Insurance (63.6%).
| Industry | Male | Female |
| Agriculture, Fishing & Hunting | 933 (82.2%) | 202 (17.8%) |
| Mining, Quarrying, & Extraction | 43 (71.7%) | 17 (28.3%) |
| Construction | 2,525 (91.8%) | 224 (8.2%) |
| Manufacturing | 6,919 (77.4%) | 2,016 (22.6%) |
| Wholesale Trade | 610 (70.1%) | 260 (29.9%) |
| Retail Trade | 2,781 (52.5%) | 2,516 (47.5%) |
| Transportation & Warehousing | 1,004 (75.9%) | 319 (24.1%) |
| Utilities | 325 (77.0%) | 97 (23.0%) |
| Information | 345 (67.0%) | 170 (33.0%) |
| Finance & Insurance | 370 (36.4%) | 647 (63.6%) |
| Real Estate, Rental & Leasing | 155 (48.7%) | 163 (51.3%) |
| Professional & Scientific | 921 (55.9%) | 727 (44.1%) |
| Enterprise Management | 18 (36.7%) | 31 (63.3%) |
| Administrative & Support | 946 (60.5%) | 617 (39.5%) |
| Educational Services | 1,359 (33.0%) | 2,756 (67.0%) |
| Health Care & Social Assistance | 835 (12.9%) | 5,643 (87.1%) |
| Arts, Entertainment & Recreation | 273 (54.4%) | 229 (45.6%) |
| Accommodation & Food Services | 1,364 (42.2%) | 1,866 (57.8%) |
| Public Administration | 1,071 (58.9%) | 748 (41.1%) |
| Total | 23,649 (53.7%) | 20,397 (46.3%) |
Education in Lenawee County
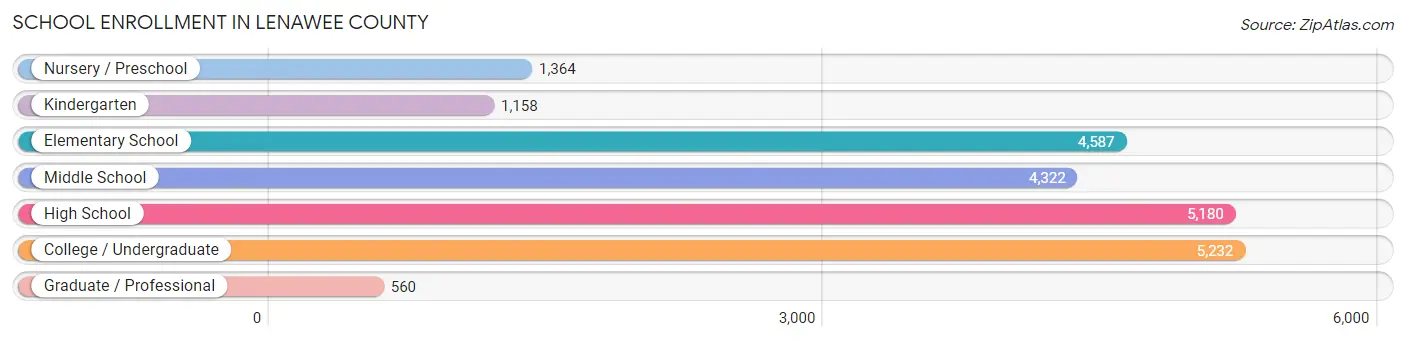
School Enrollment in Lenawee County
The most common levels of schooling among the 22,403 students in Lenawee County are college / undergraduate (5,232 | 23.4%), high school (5,180 | 23.1%), and elementary school (4,587 | 20.5%).
| School Level | # Students | % Students |
| Nursery / Preschool | 1,364 | 6.1% |
| Kindergarten | 1,158 | 5.2% |
| Elementary School | 4,587 | 20.5% |
| Middle School | 4,322 | 19.3% |
| High School | 5,180 | 23.1% |
| College / Undergraduate | 5,232 | 23.4% |
| Graduate / Professional | 560 | 2.5% |
| Total | 22,403 | 100.0% |
School Enrollment by Age by Funding Source in Lenawee County
Out of a total of 22,403 students who are enrolled in schools in Lenawee County, 4,525 (20.2%) attend a private institution, while the remaining 17,878 (79.8%) are enrolled in public schools. The age group of 20 to 24 year olds has the highest likelihood of being enrolled in private schools, with 1,637 (62.5% in the age bracket) enrolled. Conversely, the age group of 10 to 14 year olds has the lowest likelihood of being enrolled in a private school, with 5,415 (94.3% in the age bracket) attending a public institution.
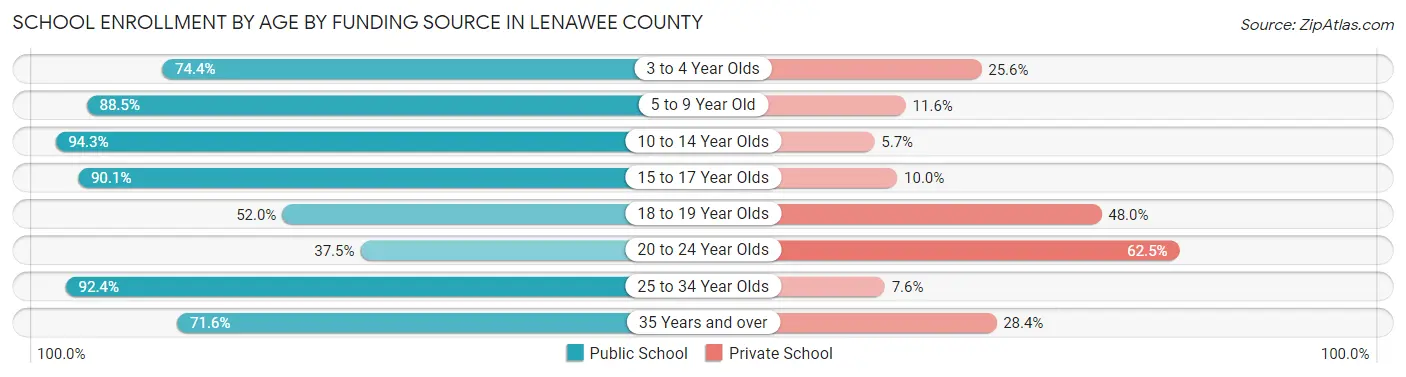
| Age Bracket | Public School | Private School |
| 3 to 4 Year Olds | 769 (74.4%) | 265 (25.6%) |
| 5 to 9 Year Old | 4,662 (88.4%) | 609 (11.6%) |
| 10 to 14 Year Olds | 5,415 (94.3%) | 328 (5.7%) |
| 15 to 17 Year Olds | 3,323 (90.0%) | 367 (10.0%) |
| 18 to 19 Year Olds | 1,006 (52.0%) | 928 (48.0%) |
| 20 to 24 Year Olds | 981 (37.5%) | 1,637 (62.5%) |
| 25 to 34 Year Olds | 895 (92.4%) | 74 (7.6%) |
| 35 Years and over | 819 (71.6%) | 325 (28.4%) |
| Total | 17,878 (79.8%) | 4,525 (20.2%) |
Educational Attainment by Field of Study in Lenawee County
Education (3,546 | 21.1%), business (3,204 | 19.1%), science & technology (1,945 | 11.6%), arts & humanities (1,495 | 8.9%), and engineering (829 | 4.9%) are the most common fields of study among 16,807 individuals in Lenawee County who have obtained a bachelor's degree or higher.
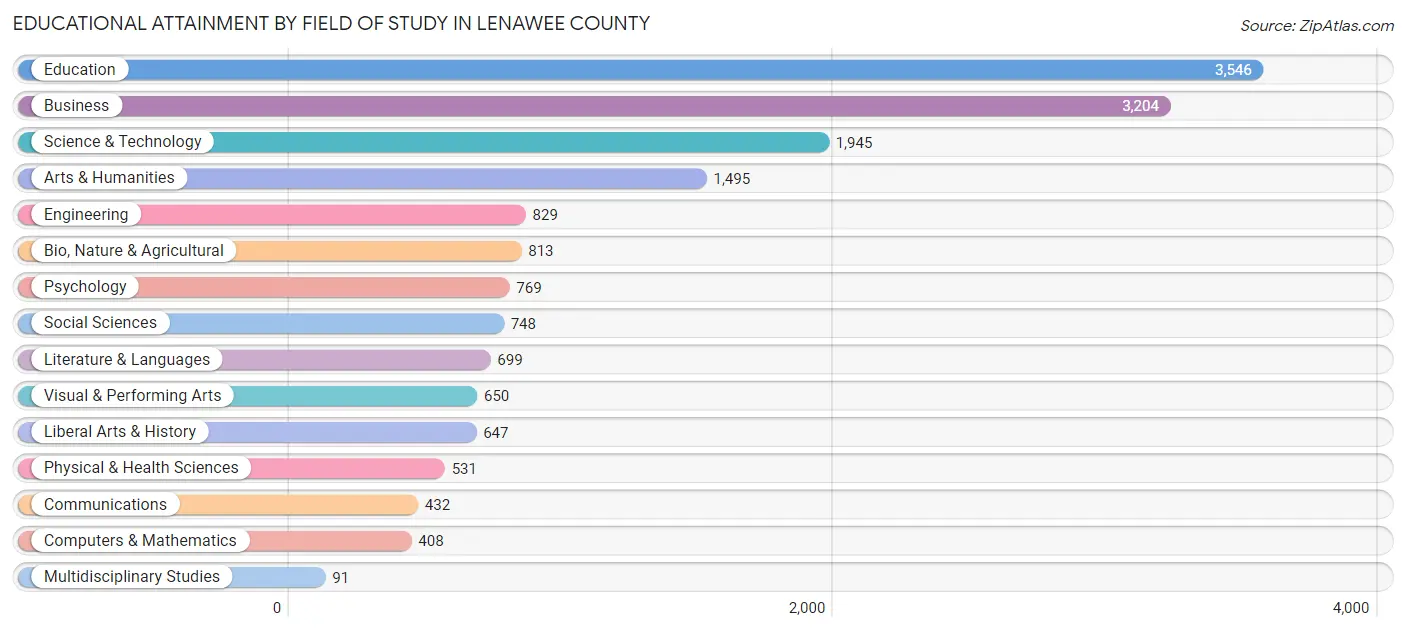
| Field of Study | # Graduates | % Graduates |
| Computers & Mathematics | 408 | 2.4% |
| Bio, Nature & Agricultural | 813 | 4.8% |
| Physical & Health Sciences | 531 | 3.2% |
| Psychology | 769 | 4.6% |
| Social Sciences | 748 | 4.4% |
| Engineering | 829 | 4.9% |
| Multidisciplinary Studies | 91 | 0.5% |
| Science & Technology | 1,945 | 11.6% |
| Business | 3,204 | 19.1% |
| Education | 3,546 | 21.1% |
| Literature & Languages | 699 | 4.2% |
| Liberal Arts & History | 647 | 3.8% |
| Visual & Performing Arts | 650 | 3.9% |
| Communications | 432 | 2.6% |
| Arts & Humanities | 1,495 | 8.9% |
| Total | 16,807 | 100.0% |
Transportation & Commute in Lenawee County
Vehicle Availability by Sex in Lenawee County
The most prevalent vehicle ownership categories in Lenawee County are males with 2 vehicles (10,208, accounting for 44.4%) and females with 2 vehicles (7,750, making up 53.2%).
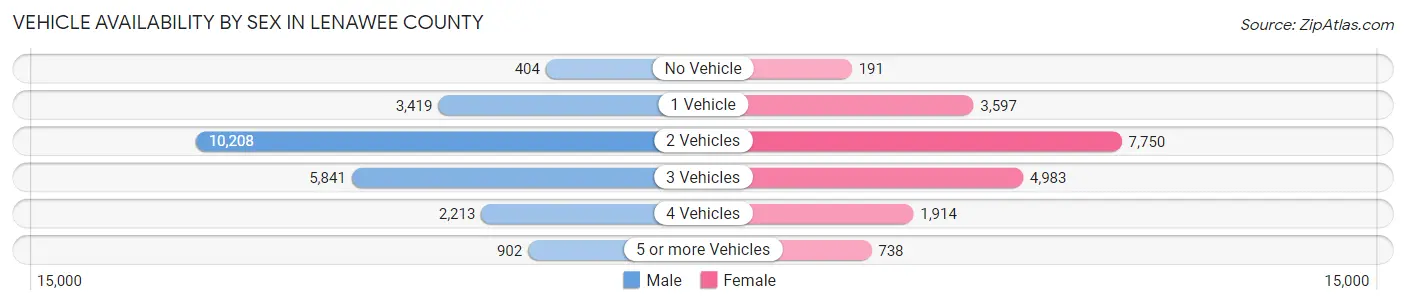
| Vehicles Available | Male | Female |
| No Vehicle | 404 (1.8%) | 191 (1.0%) |
| 1 Vehicle | 3,419 (14.9%) | 3,597 (18.8%) |
| 2 Vehicles | 10,208 (44.4%) | 7,750 (40.4%) |
| 3 Vehicles | 5,841 (25.4%) | 4,983 (26.0%) |
| 4 Vehicles | 2,213 (9.6%) | 1,914 (10.0%) |
| 5 or more Vehicles | 902 (3.9%) | 738 (3.8%) |
| Total | 22,987 (100.0%) | 19,173 (100.0%) |
Commute Time in Lenawee County
The most frequently occuring commute durations in Lenawee County are 5 to 9 minutes (5,671 commuters, 14.3%), 10 to 14 minutes (5,428 commuters, 13.7%), and 45 to 59 minutes (4,794 commuters, 12.1%).
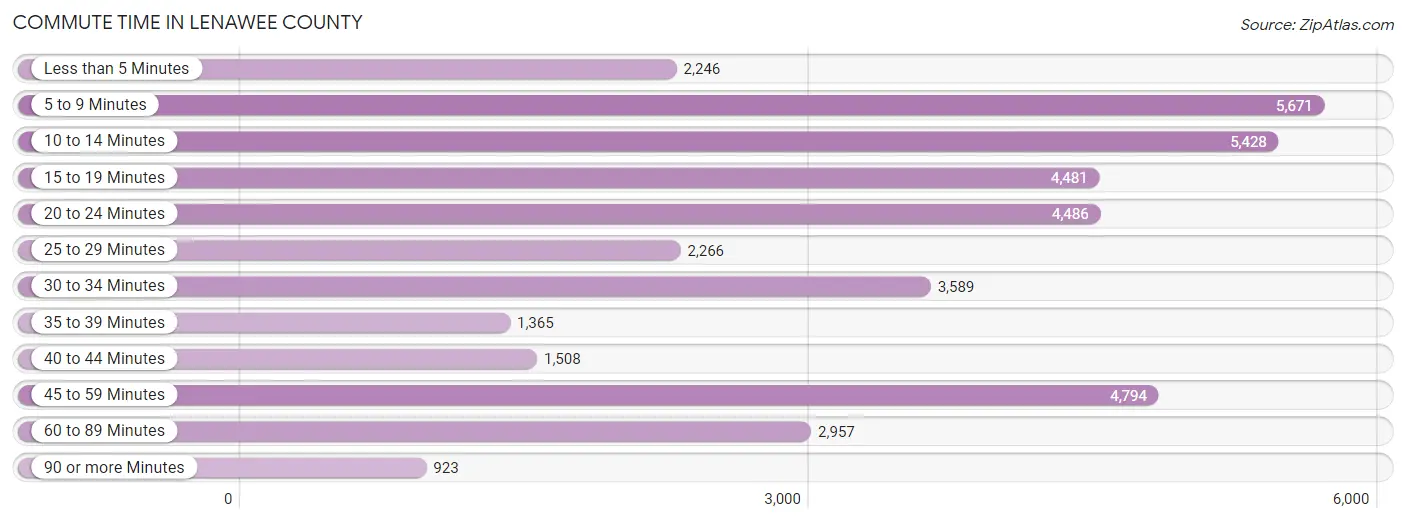
| Commute Time | # Commuters | % Commuters |
| Less than 5 Minutes | 2,246 | 5.7% |
| 5 to 9 Minutes | 5,671 | 14.3% |
| 10 to 14 Minutes | 5,428 | 13.7% |
| 15 to 19 Minutes | 4,481 | 11.3% |
| 20 to 24 Minutes | 4,486 | 11.3% |
| 25 to 29 Minutes | 2,266 | 5.7% |
| 30 to 34 Minutes | 3,589 | 9.0% |
| 35 to 39 Minutes | 1,365 | 3.4% |
| 40 to 44 Minutes | 1,508 | 3.8% |
| 45 to 59 Minutes | 4,794 | 12.1% |
| 60 to 89 Minutes | 2,957 | 7.4% |
| 90 or more Minutes | 923 | 2.3% |
Commute Time by Sex in Lenawee County
The most common commute times in Lenawee County are 45 to 59 minutes (2,880 commuters, 13.4%) for males and 5 to 9 minutes (3,021 commuters, 16.6%) for females.
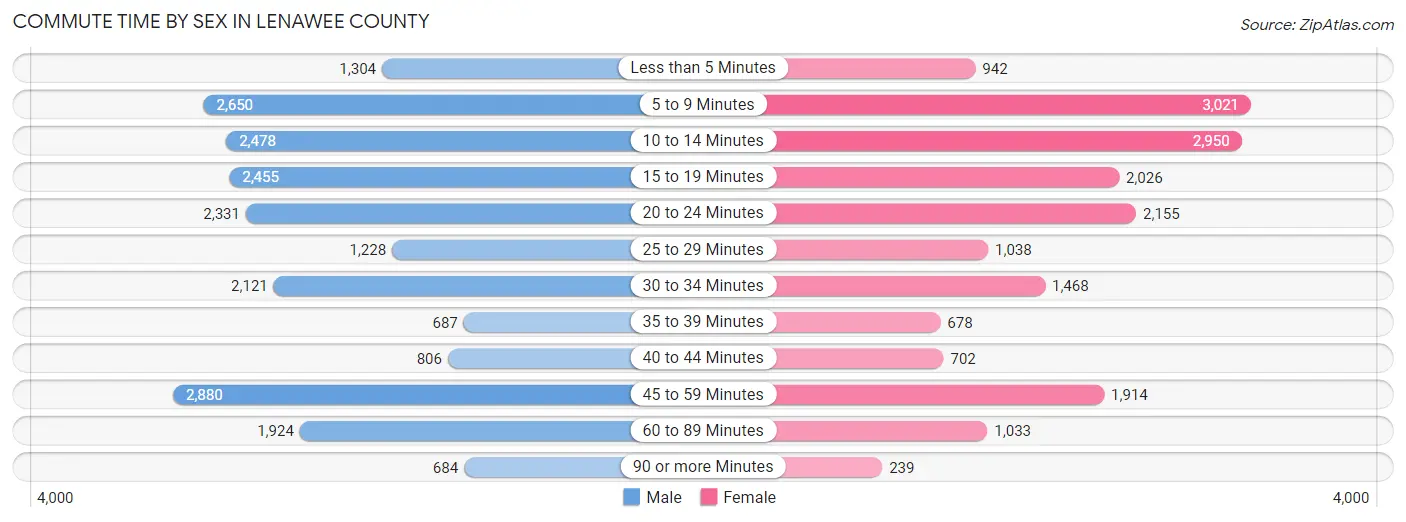
| Commute Time | Male | Female |
| Less than 5 Minutes | 1,304 (6.0%) | 942 (5.2%) |
| 5 to 9 Minutes | 2,650 (12.3%) | 3,021 (16.6%) |
| 10 to 14 Minutes | 2,478 (11.5%) | 2,950 (16.2%) |
| 15 to 19 Minutes | 2,455 (11.4%) | 2,026 (11.2%) |
| 20 to 24 Minutes | 2,331 (10.8%) | 2,155 (11.9%) |
| 25 to 29 Minutes | 1,228 (5.7%) | 1,038 (5.7%) |
| 30 to 34 Minutes | 2,121 (9.8%) | 1,468 (8.1%) |
| 35 to 39 Minutes | 687 (3.2%) | 678 (3.7%) |
| 40 to 44 Minutes | 806 (3.7%) | 702 (3.9%) |
| 45 to 59 Minutes | 2,880 (13.4%) | 1,914 (10.5%) |
| 60 to 89 Minutes | 1,924 (8.9%) | 1,033 (5.7%) |
| 90 or more Minutes | 684 (3.2%) | 239 (1.3%) |
Time of Departure to Work by Sex in Lenawee County
The most frequent times of departure to work in Lenawee County are 6:30 AM to 6:59 AM (2,517, 11.7%) for males and 7:30 AM to 7:59 AM (2,455, 13.5%) for females.
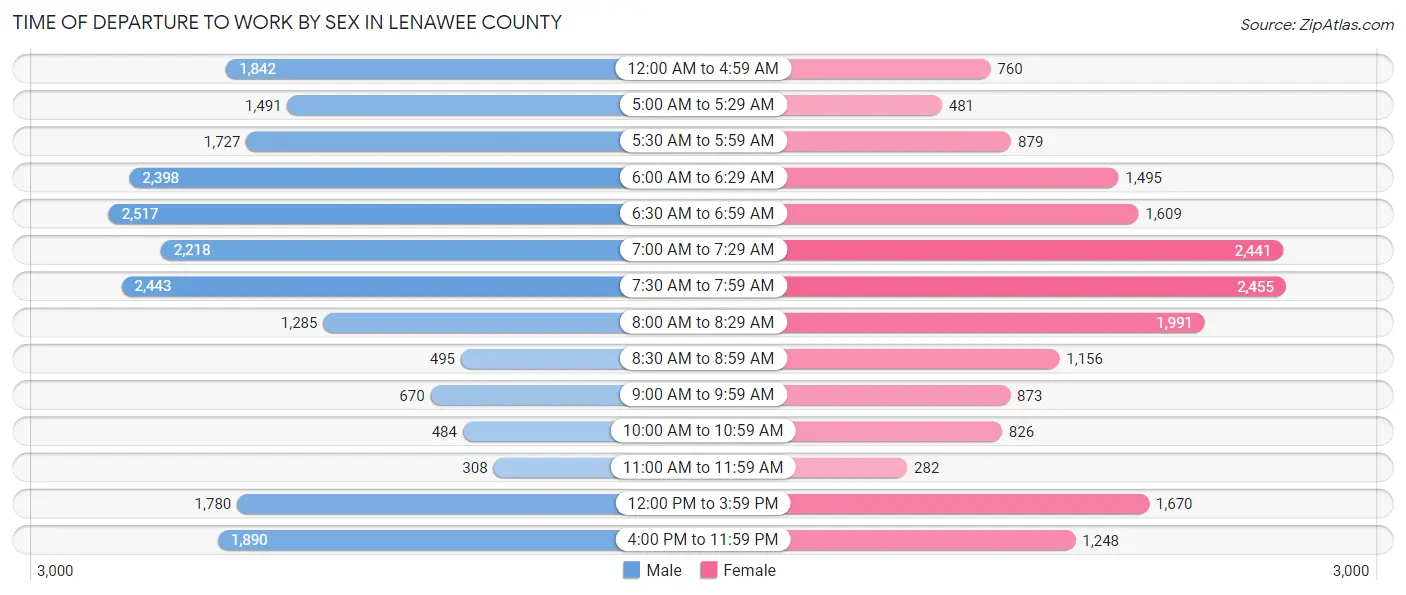
| Time of Departure | Male | Female |
| 12:00 AM to 4:59 AM | 1,842 (8.6%) | 760 (4.2%) |
| 5:00 AM to 5:29 AM | 1,491 (6.9%) | 481 (2.6%) |
| 5:30 AM to 5:59 AM | 1,727 (8.0%) | 879 (4.8%) |
| 6:00 AM to 6:29 AM | 2,398 (11.1%) | 1,495 (8.2%) |
| 6:30 AM to 6:59 AM | 2,517 (11.7%) | 1,609 (8.9%) |
| 7:00 AM to 7:29 AM | 2,218 (10.3%) | 2,441 (13.4%) |
| 7:30 AM to 7:59 AM | 2,443 (11.3%) | 2,455 (13.5%) |
| 8:00 AM to 8:29 AM | 1,285 (6.0%) | 1,991 (11.0%) |
| 8:30 AM to 8:59 AM | 495 (2.3%) | 1,156 (6.4%) |
| 9:00 AM to 9:59 AM | 670 (3.1%) | 873 (4.8%) |
| 10:00 AM to 10:59 AM | 484 (2.2%) | 826 (4.5%) |
| 11:00 AM to 11:59 AM | 308 (1.4%) | 282 (1.5%) |
| 12:00 PM to 3:59 PM | 1,780 (8.3%) | 1,670 (9.2%) |
| 4:00 PM to 11:59 PM | 1,890 (8.8%) | 1,248 (6.9%) |
| Total | 21,548 (100.0%) | 18,166 (100.0%) |
Housing Occupancy in Lenawee County
Occupancy by Ownership in Lenawee County
Of the total 38,626 dwellings in Lenawee County, owner-occupied units account for 30,376 (78.6%), while renter-occupied units make up 8,250 (21.4%).
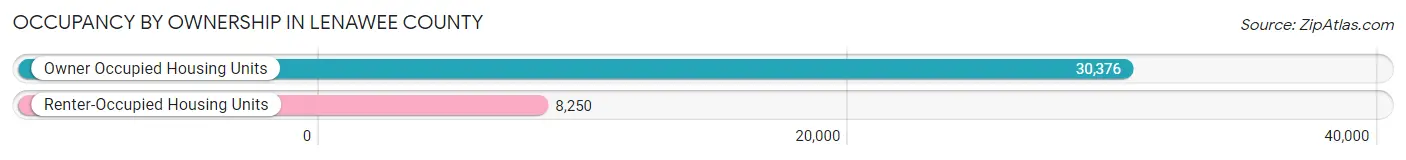
| Occupancy | # Housing Units | % Housing Units |
| Owner Occupied Housing Units | 30,376 | 78.6% |
| Renter-Occupied Housing Units | 8,250 | 21.4% |
| Total Occupied Housing Units | 38,626 | 100.0% |
Occupancy by Household Size in Lenawee County
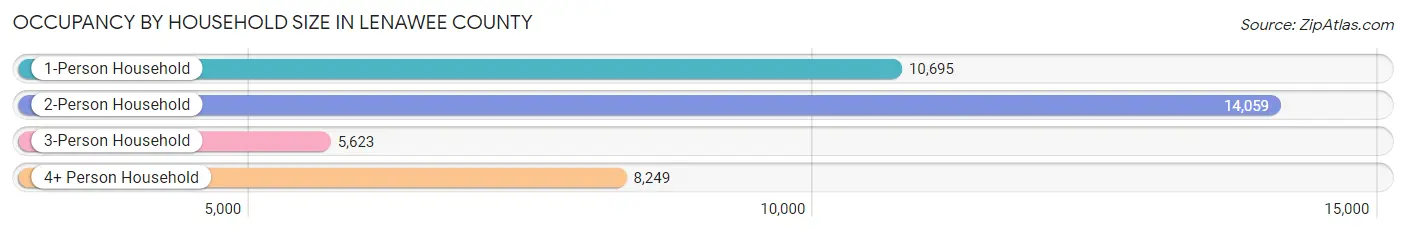
| Household Size | # Housing Units | % Housing Units |
| 1-Person Household | 10,695 | 27.7% |
| 2-Person Household | 14,059 | 36.4% |
| 3-Person Household | 5,623 | 14.6% |
| 4+ Person Household | 8,249 | 21.4% |
| Total Housing Units | 38,626 | 100.0% |
Occupancy by Ownership by Household Size in Lenawee County
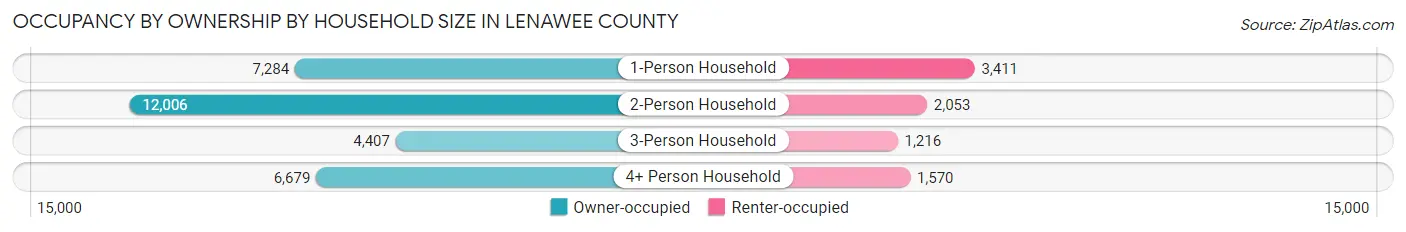
| Household Size | Owner-occupied | Renter-occupied |
| 1-Person Household | 7,284 (68.1%) | 3,411 (31.9%) |
| 2-Person Household | 12,006 (85.4%) | 2,053 (14.6%) |
| 3-Person Household | 4,407 (78.4%) | 1,216 (21.6%) |
| 4+ Person Household | 6,679 (81.0%) | 1,570 (19.0%) |
| Total Housing Units | 30,376 (78.6%) | 8,250 (21.4%) |
Occupancy by Educational Attainment in Lenawee County
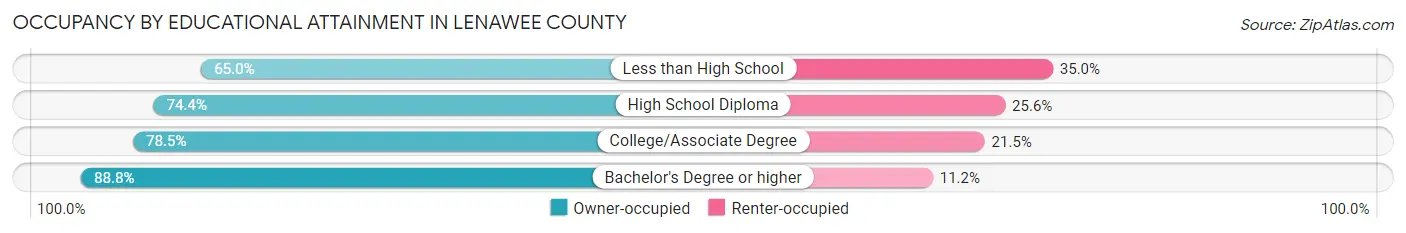
| Household Size | Owner-occupied | Renter-occupied |
| Less than High School | 1,884 (65.0%) | 1,016 (35.0%) |
| High School Diploma | 9,487 (74.4%) | 3,259 (25.6%) |
| College/Associate Degree | 10,656 (78.5%) | 2,920 (21.5%) |
| Bachelor's Degree or higher | 8,349 (88.8%) | 1,055 (11.2%) |
Occupancy by Age of Householder in Lenawee County
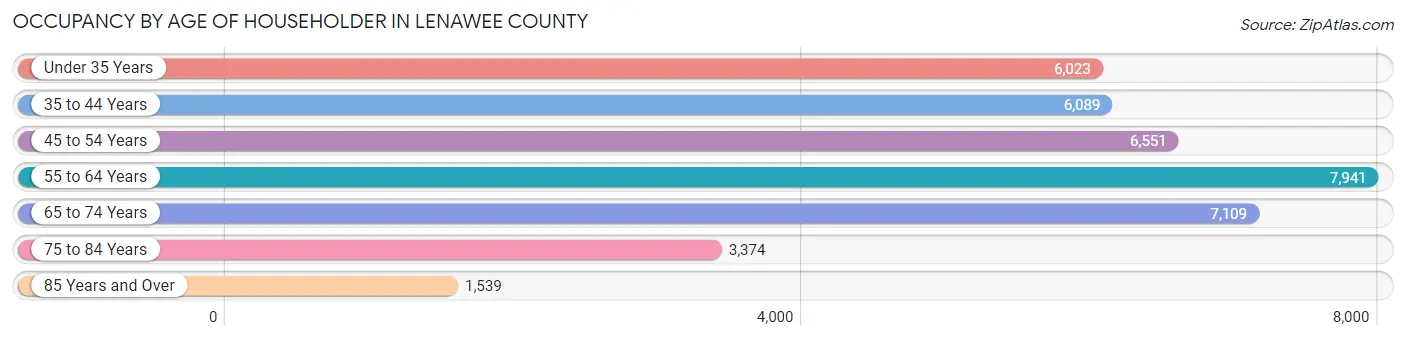
| Age Bracket | # Households | % Households |
| Under 35 Years | 6,023 | 15.6% |
| 35 to 44 Years | 6,089 | 15.8% |
| 45 to 54 Years | 6,551 | 17.0% |
| 55 to 64 Years | 7,941 | 20.6% |
| 65 to 74 Years | 7,109 | 18.4% |
| 75 to 84 Years | 3,374 | 8.7% |
| 85 Years and Over | 1,539 | 4.0% |
| Total | 38,626 | 100.0% |
Housing Finances in Lenawee County
Median Income by Occupancy in Lenawee County
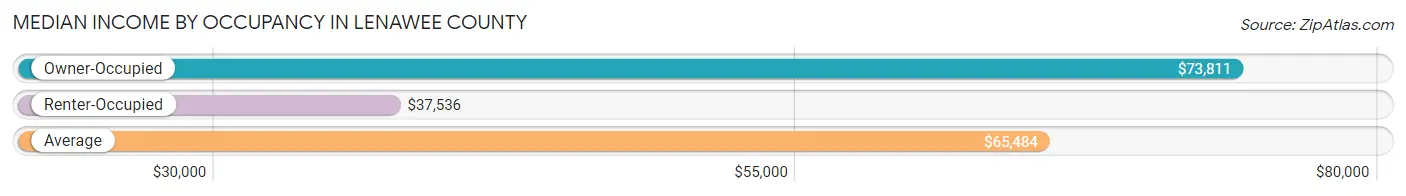
| Occupancy Type | # Households | Median Income |
| Owner-Occupied | 30,376 (78.6%) | $73,811 |
| Renter-Occupied | 8,250 (21.4%) | $37,536 |
| Average | 38,626 (100.0%) | $65,484 |
Occupancy by Householder Income Bracket in Lenawee County
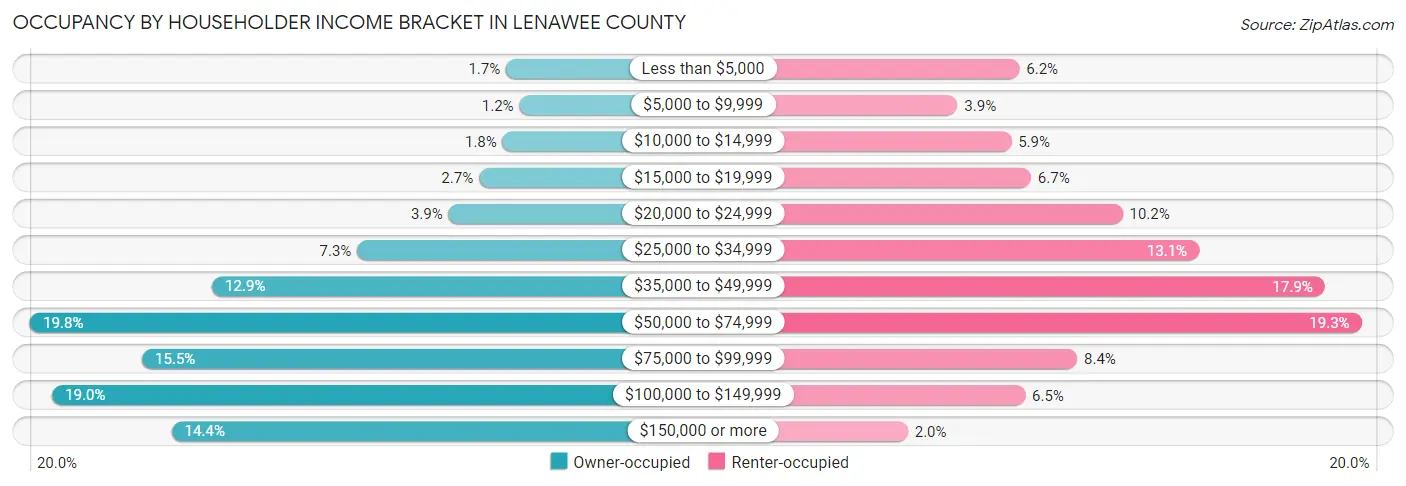
| Income Bracket | Owner-occupied | Renter-occupied |
| Less than $5,000 | 505 (1.7%) | 515 (6.2%) |
| $5,000 to $9,999 | 350 (1.1%) | 320 (3.9%) |
| $10,000 to $14,999 | 544 (1.8%) | 489 (5.9%) |
| $15,000 to $19,999 | 816 (2.7%) | 551 (6.7%) |
| $20,000 to $24,999 | 1,170 (3.8%) | 839 (10.2%) |
| $25,000 to $34,999 | 2,227 (7.3%) | 1,079 (13.1%) |
| $35,000 to $49,999 | 3,906 (12.9%) | 1,474 (17.9%) |
| $50,000 to $74,999 | 6,010 (19.8%) | 1,590 (19.3%) |
| $75,000 to $99,999 | 4,717 (15.5%) | 696 (8.4%) |
| $100,000 to $149,999 | 5,756 (19.0%) | 533 (6.5%) |
| $150,000 or more | 4,375 (14.4%) | 164 (2.0%) |
| Total | 30,376 (100.0%) | 8,250 (100.0%) |
Monthly Housing Cost Tiers in Lenawee County
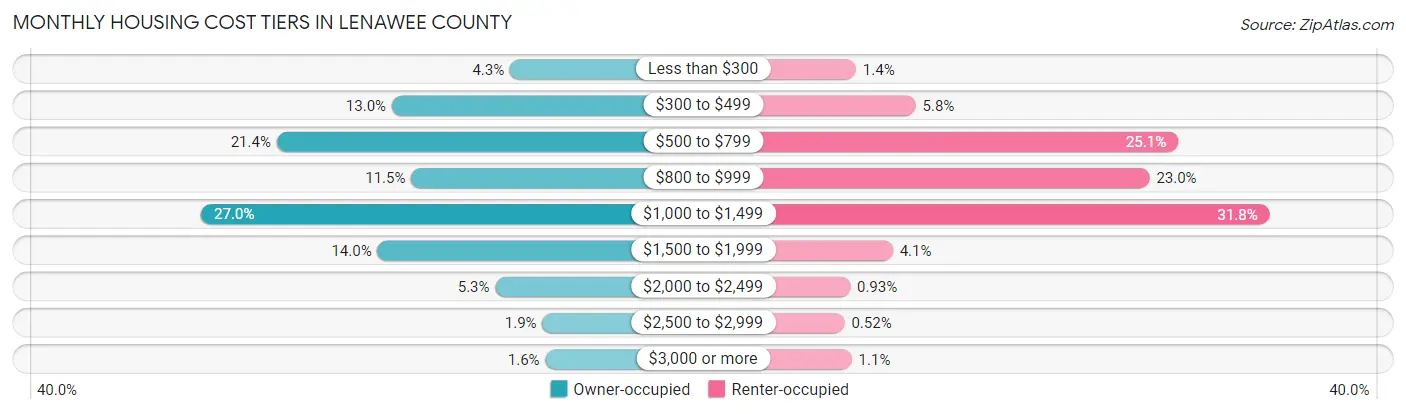
| Monthly Cost | Owner-occupied | Renter-occupied |
| Less than $300 | 1,291 (4.3%) | 112 (1.4%) |
| $300 to $499 | 3,933 (13.0%) | 475 (5.8%) |
| $500 to $799 | 6,511 (21.4%) | 2,069 (25.1%) |
| $800 to $999 | 3,499 (11.5%) | 1,896 (23.0%) |
| $1,000 to $1,499 | 8,202 (27.0%) | 2,625 (31.8%) |
| $1,500 to $1,999 | 4,255 (14.0%) | 336 (4.1%) |
| $2,000 to $2,499 | 1,620 (5.3%) | 77 (0.9%) |
| $2,500 to $2,999 | 566 (1.9%) | 43 (0.5%) |
| $3,000 or more | 499 (1.6%) | 87 (1.1%) |
| Total | 30,376 (100.0%) | 8,250 (100.0%) |
Physical Housing Characteristics in Lenawee County
Housing Structures in Lenawee County
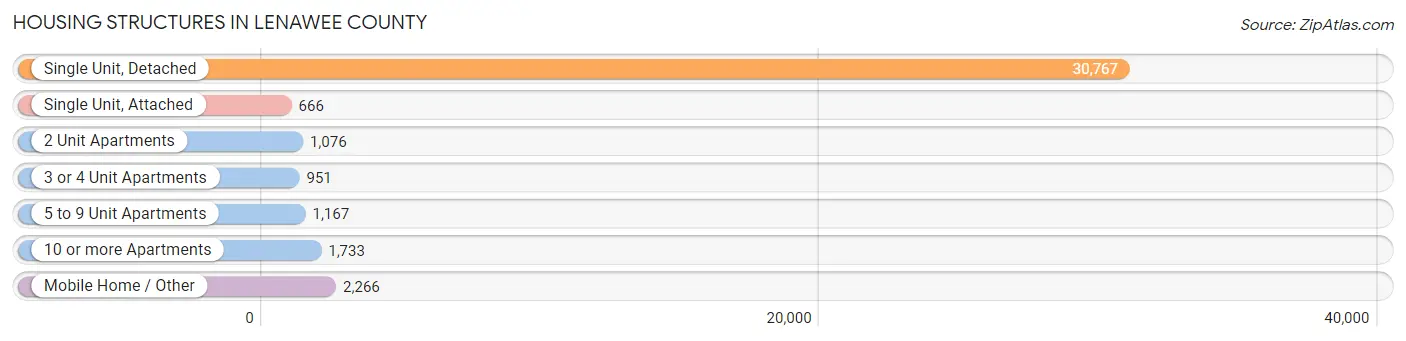
| Structure Type | # Housing Units | % Housing Units |
| Single Unit, Detached | 30,767 | 79.6% |
| Single Unit, Attached | 666 | 1.7% |
| 2 Unit Apartments | 1,076 | 2.8% |
| 3 or 4 Unit Apartments | 951 | 2.5% |
| 5 to 9 Unit Apartments | 1,167 | 3.0% |
| 10 or more Apartments | 1,733 | 4.5% |
| Mobile Home / Other | 2,266 | 5.9% |
| Total | 38,626 | 100.0% |
Housing Structures by Occupancy in Lenawee County
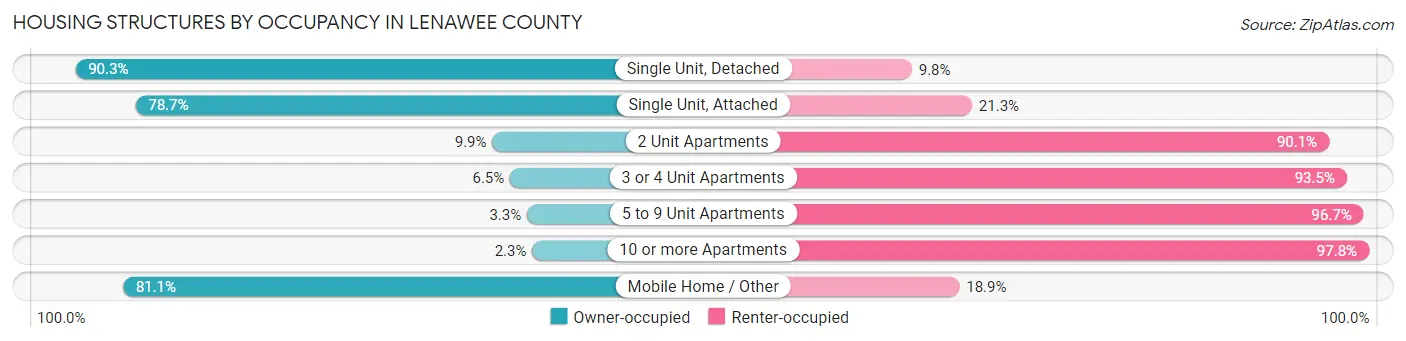
| Structure Type | Owner-occupied | Renter-occupied |
| Single Unit, Detached | 27,768 (90.2%) | 2,999 (9.8%) |
| Single Unit, Attached | 524 (78.7%) | 142 (21.3%) |
| 2 Unit Apartments | 107 (9.9%) | 969 (90.1%) |
| 3 or 4 Unit Apartments | 62 (6.5%) | 889 (93.5%) |
| 5 to 9 Unit Apartments | 38 (3.3%) | 1,129 (96.7%) |
| 10 or more Apartments | 39 (2.2%) | 1,694 (97.8%) |
| Mobile Home / Other | 1,838 (81.1%) | 428 (18.9%) |
| Total | 30,376 (78.6%) | 8,250 (21.4%) |
Housing Structures by Number of Rooms in Lenawee County
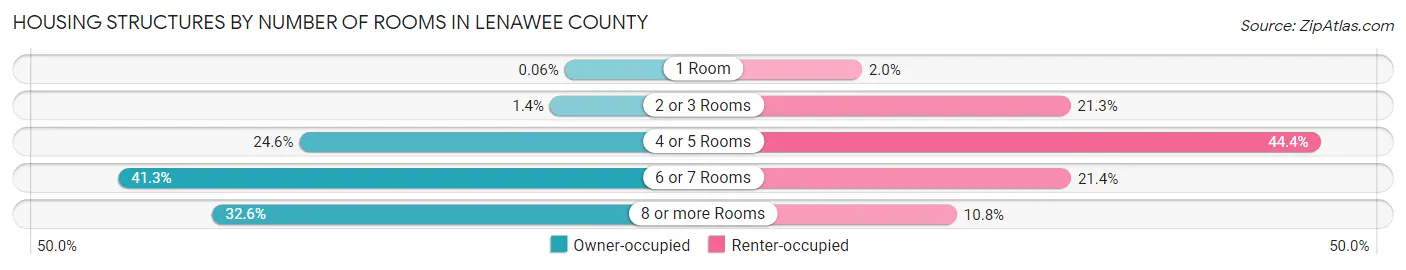
| Number of Rooms | Owner-occupied | Renter-occupied |
| 1 Room | 17 (0.1%) | 168 (2.0%) |
| 2 or 3 Rooms | 431 (1.4%) | 1,760 (21.3%) |
| 4 or 5 Rooms | 7,470 (24.6%) | 3,666 (44.4%) |
| 6 or 7 Rooms | 12,553 (41.3%) | 1,763 (21.4%) |
| 8 or more Rooms | 9,905 (32.6%) | 893 (10.8%) |
| Total | 30,376 (100.0%) | 8,250 (100.0%) |
Housing Structure by Heating Type in Lenawee County
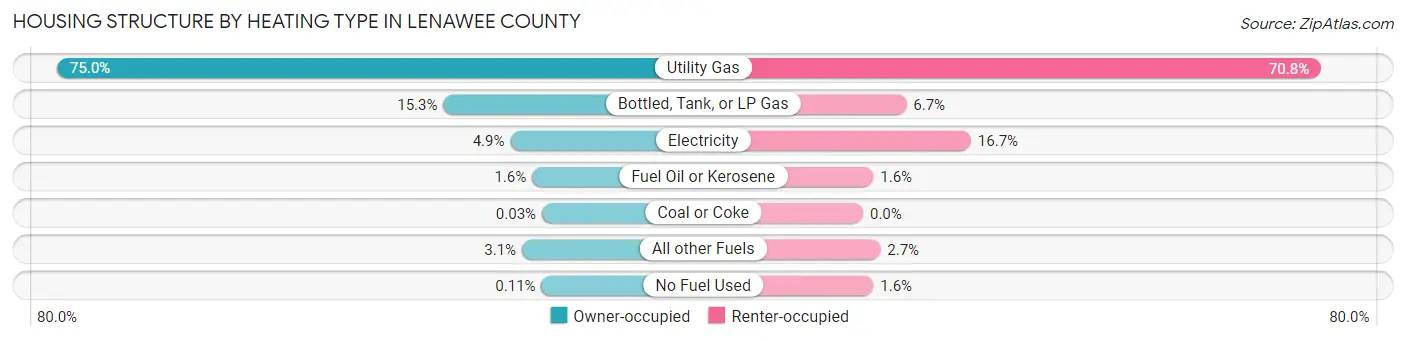
| Heating Type | Owner-occupied | Renter-occupied |
| Utility Gas | 22,783 (75.0%) | 5,840 (70.8%) |
| Bottled, Tank, or LP Gas | 4,640 (15.3%) | 552 (6.7%) |
| Electricity | 1,490 (4.9%) | 1,375 (16.7%) |
| Fuel Oil or Kerosene | 473 (1.6%) | 131 (1.6%) |
| Coal or Coke | 9 (0.0%) | 0 (0.0%) |
| All other Fuels | 949 (3.1%) | 221 (2.7%) |
| No Fuel Used | 32 (0.1%) | 131 (1.6%) |
| Total | 30,376 (100.0%) | 8,250 (100.0%) |
Household Vehicle Usage in Lenawee County
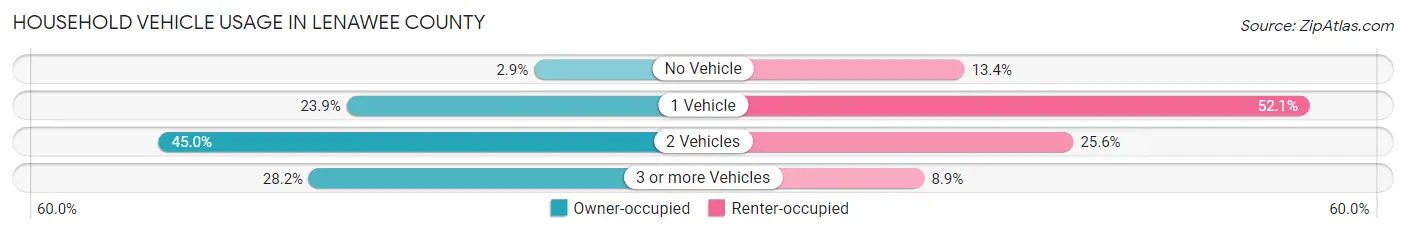
| Vehicles per Household | Owner-occupied | Renter-occupied |
| No Vehicle | 890 (2.9%) | 1,107 (13.4%) |
| 1 Vehicle | 7,271 (23.9%) | 4,296 (52.1%) |
| 2 Vehicles | 13,664 (45.0%) | 2,112 (25.6%) |
| 3 or more Vehicles | 8,551 (28.1%) | 735 (8.9%) |
| Total | 30,376 (100.0%) | 8,250 (100.0%) |
Real Estate & Mortgages in Lenawee County
Real Estate and Mortgage Overview in Lenawee County
| Characteristic | Without Mortgage | With Mortgage |
| Housing Units | 11,670 | 18,706 |
| Median Property Value | $153,500 | $177,700 |
| Median Household Income | $57,608 | $3,191 |
| Monthly Housing Costs | $535 | $479 |
| Real Estate Taxes | $2,236 | $773 |
Property Value by Mortgage Status in Lenawee County
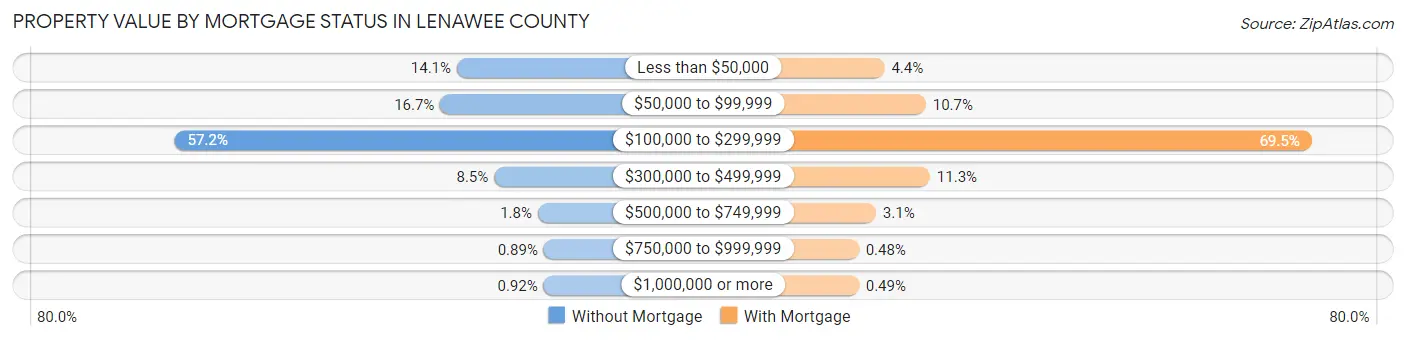
| Property Value | Without Mortgage | With Mortgage |
| Less than $50,000 | 1,649 (14.1%) | 824 (4.4%) |
| $50,000 to $99,999 | 1,945 (16.7%) | 2,002 (10.7%) |
| $100,000 to $299,999 | 6,669 (57.2%) | 13,000 (69.5%) |
| $300,000 to $499,999 | 986 (8.5%) | 2,120 (11.3%) |
| $500,000 to $749,999 | 210 (1.8%) | 579 (3.1%) |
| $750,000 to $999,999 | 104 (0.9%) | 90 (0.5%) |
| $1,000,000 or more | 107 (0.9%) | 91 (0.5%) |
| Total | 11,670 (100.0%) | 18,706 (100.0%) |
Household Income by Mortgage Status in Lenawee County
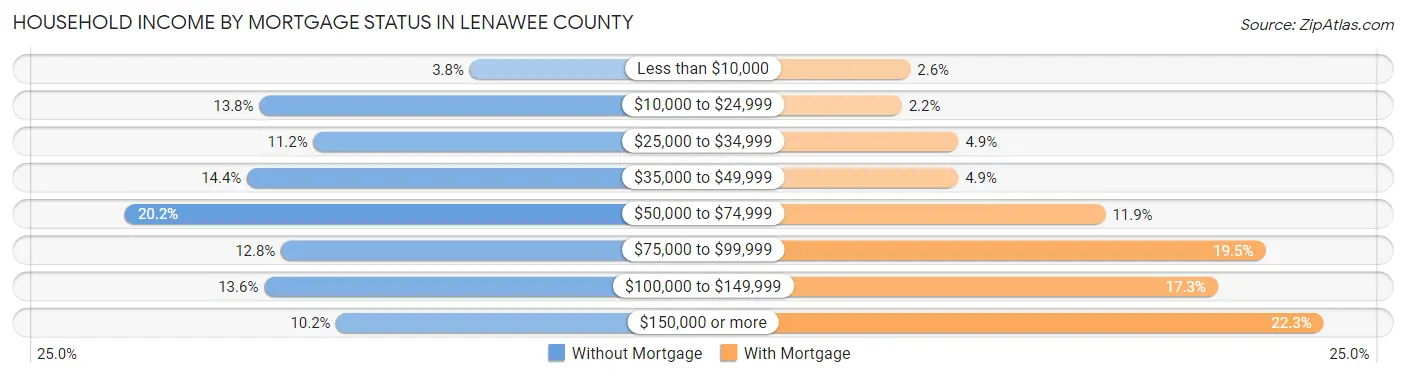
| Household Income | Without Mortgage | With Mortgage |
| Less than $10,000 | 444 (3.8%) | 488 (2.6%) |
| $10,000 to $24,999 | 1,613 (13.8%) | 411 (2.2%) |
| $25,000 to $34,999 | 1,312 (11.2%) | 917 (4.9%) |
| $35,000 to $49,999 | 1,680 (14.4%) | 915 (4.9%) |
| $50,000 to $74,999 | 2,360 (20.2%) | 2,226 (11.9%) |
| $75,000 to $99,999 | 1,491 (12.8%) | 3,650 (19.5%) |
| $100,000 to $149,999 | 1,586 (13.6%) | 3,226 (17.2%) |
| $150,000 or more | 1,184 (10.2%) | 4,170 (22.3%) |
| Total | 11,670 (100.0%) | 18,706 (100.0%) |
Property Value to Household Income Ratio in Lenawee County
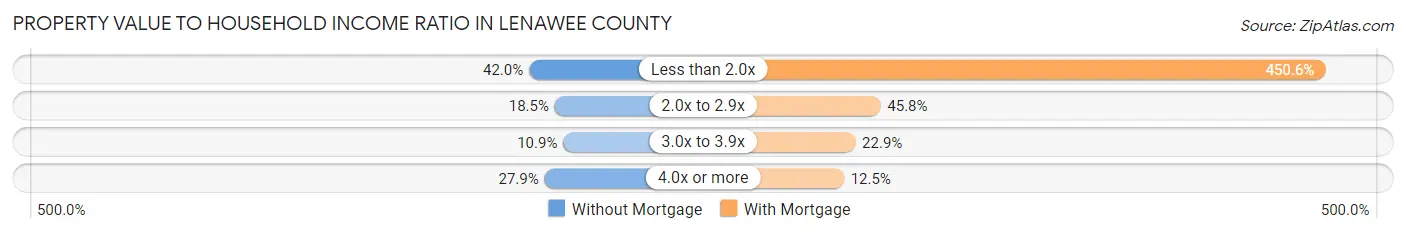
| Value-to-Income Ratio | Without Mortgage | With Mortgage |
| Less than 2.0x | 4,896 (41.9%) | 84,283 (450.6%) |
| 2.0x to 2.9x | 2,163 (18.5%) | 8,569 (45.8%) |
| 3.0x to 3.9x | 1,272 (10.9%) | 4,288 (22.9%) |
| 4.0x or more | 3,252 (27.9%) | 2,340 (12.5%) |
| Total | 11,670 (100.0%) | 18,706 (100.0%) |
Real Estate Taxes by Mortgage Status in Lenawee County
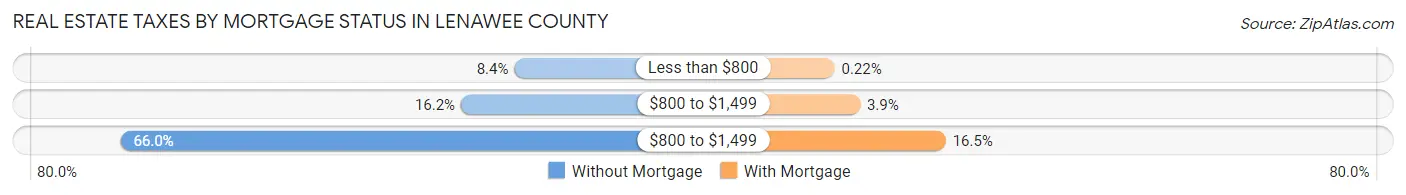
| Property Taxes | Without Mortgage | With Mortgage |
| Less than $800 | 985 (8.4%) | 42 (0.2%) |
| $800 to $1,499 | 1,895 (16.2%) | 735 (3.9%) |
| $800 to $1,499 | 7,701 (66.0%) | 3,079 (16.5%) |
| Total | 11,670 (100.0%) | 18,706 (100.0%) |
Health & Disability in Lenawee County
Health Insurance Coverage by Age in Lenawee County
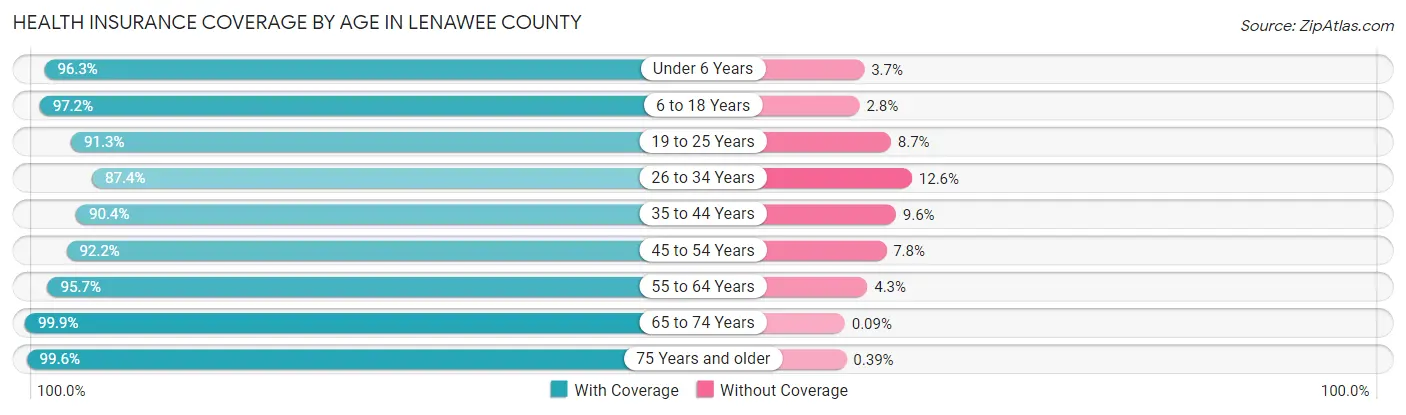
| Age Bracket | With Coverage | Without Coverage |
| Under 6 Years | 6,092 (96.3%) | 235 (3.7%) |
| 6 to 18 Years | 14,874 (97.2%) | 434 (2.8%) |
| 19 to 25 Years | 7,979 (91.3%) | 758 (8.7%) |
| 26 to 34 Years | 8,632 (87.4%) | 1,244 (12.6%) |
| 35 to 44 Years | 10,258 (90.4%) | 1,090 (9.6%) |
| 45 to 54 Years | 11,135 (92.2%) | 943 (7.8%) |
| 55 to 64 Years | 13,128 (95.7%) | 588 (4.3%) |
| 65 to 74 Years | 11,442 (99.9%) | 10 (0.1%) |
| 75 Years and older | 7,232 (99.6%) | 28 (0.4%) |
| Total | 90,772 (94.5%) | 5,330 (5.6%) |
Health Insurance Coverage by Citizenship Status in Lenawee County
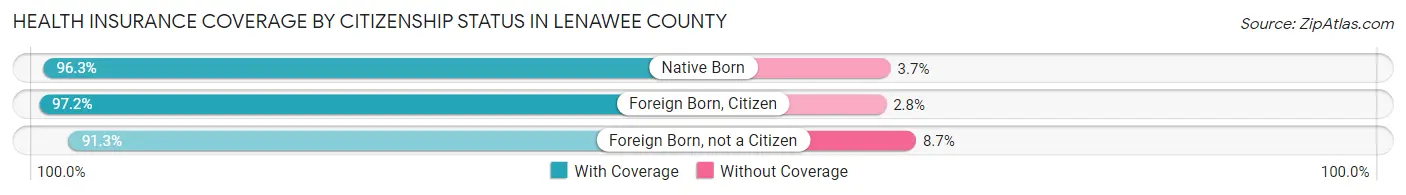
| Citizenship Status | With Coverage | Without Coverage |
| Native Born | 6,092 (96.3%) | 235 (3.7%) |
| Foreign Born, Citizen | 14,874 (97.2%) | 434 (2.8%) |
| Foreign Born, not a Citizen | 7,979 (91.3%) | 758 (8.7%) |
Health Insurance Coverage by Household Income in Lenawee County
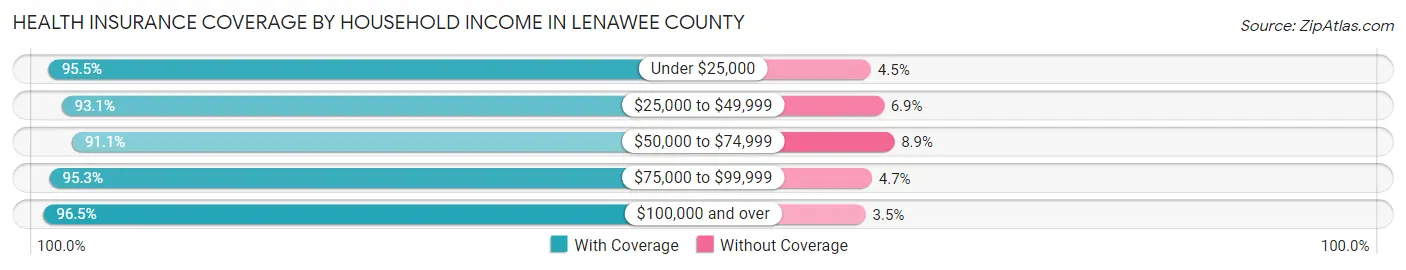
| Household Income | With Coverage | Without Coverage |
| Under $25,000 | 9,105 (95.5%) | 431 (4.5%) |
| $25,000 to $49,999 | 16,353 (93.1%) | 1,216 (6.9%) |
| $50,000 to $74,999 | 17,290 (91.1%) | 1,686 (8.9%) |
| $75,000 to $99,999 | 13,707 (95.3%) | 675 (4.7%) |
| $100,000 and over | 32,565 (96.5%) | 1,189 (3.5%) |
Public vs Private Health Insurance Coverage by Age in Lenawee County
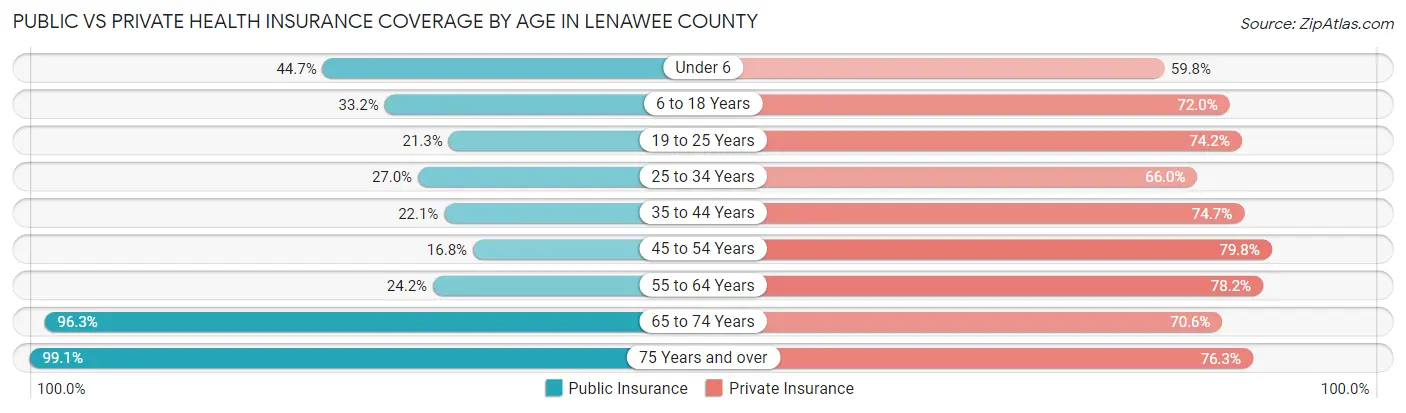
| Age Bracket | Public Insurance | Private Insurance |
| Under 6 | 2,829 (44.7%) | 3,782 (59.8%) |
| 6 to 18 Years | 5,080 (33.2%) | 11,017 (72.0%) |
| 19 to 25 Years | 1,862 (21.3%) | 6,483 (74.2%) |
| 25 to 34 Years | 2,666 (27.0%) | 6,516 (66.0%) |
| 35 to 44 Years | 2,510 (22.1%) | 8,472 (74.7%) |
| 45 to 54 Years | 2,028 (16.8%) | 9,633 (79.8%) |
| 55 to 64 Years | 3,321 (24.2%) | 10,721 (78.2%) |
| 65 to 74 Years | 11,031 (96.3%) | 8,089 (70.6%) |
| 75 Years and over | 7,194 (99.1%) | 5,538 (76.3%) |
| Total | 38,521 (40.1%) | 70,251 (73.1%) |
Disability Status by Sex by Age in Lenawee County
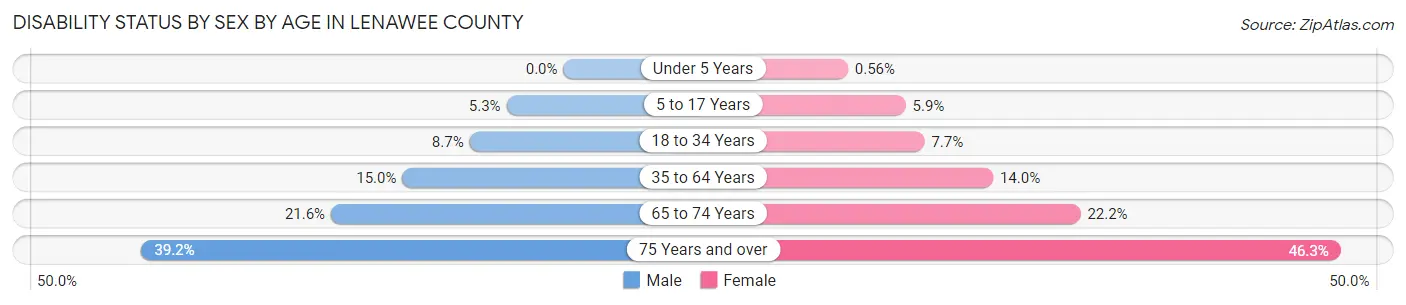
| Age Bracket | Male | Female |
| Under 5 Years | 0 (0.0%) | 14 (0.6%) |
| 5 to 17 Years | 418 (5.3%) | 436 (5.9%) |
| 18 to 34 Years | 896 (8.7%) | 734 (7.7%) |
| 35 to 64 Years | 2,772 (14.9%) | 2,609 (14.0%) |
| 65 to 74 Years | 1,175 (21.6%) | 1,330 (22.2%) |
| 75 Years and over | 1,214 (39.2%) | 1,926 (46.3%) |
Disability Class by Sex by Age in Lenawee County
Disability Class: Hearing Difficulty
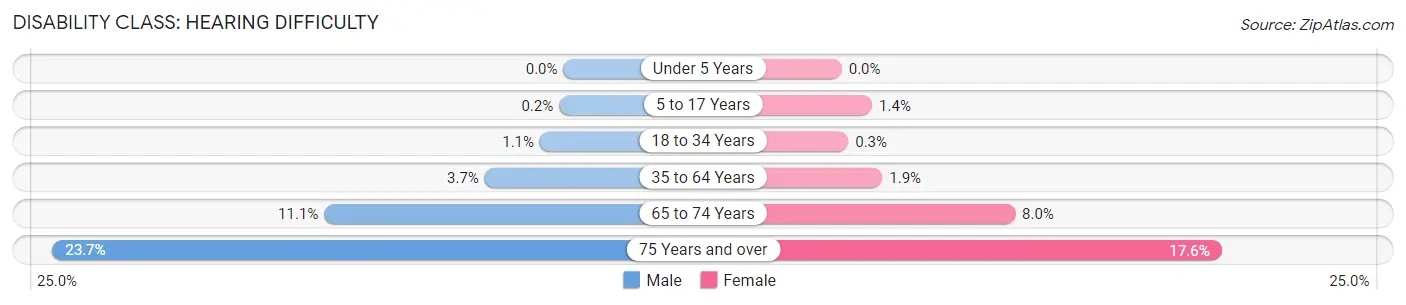
| Age Bracket | Male | Female |
| Under 5 Years | 0 (0.0%) | 0 (0.0%) |
| 5 to 17 Years | 16 (0.2%) | 104 (1.4%) |
| 18 to 34 Years | 112 (1.1%) | 29 (0.3%) |
| 35 to 64 Years | 677 (3.6%) | 350 (1.9%) |
| 65 to 74 Years | 605 (11.1%) | 483 (8.0%) |
| 75 Years and over | 735 (23.7%) | 733 (17.6%) |
Disability Class: Vision Difficulty
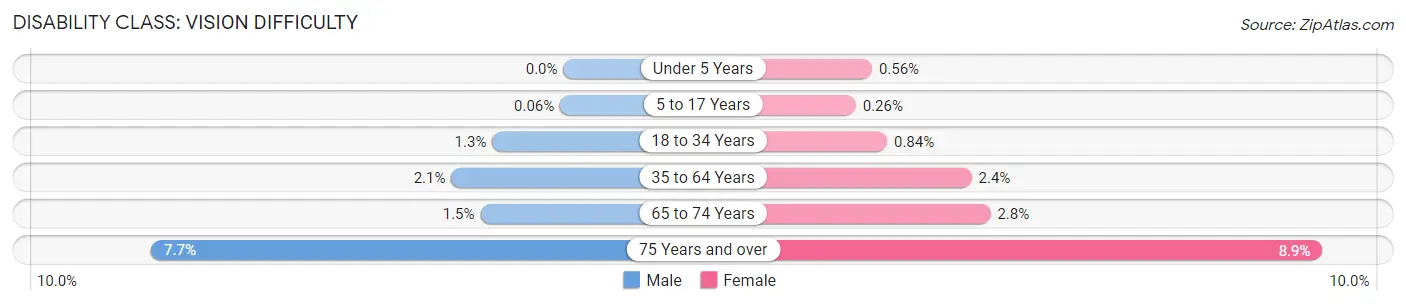
| Age Bracket | Male | Female |
| Under 5 Years | 0 (0.0%) | 14 (0.6%) |
| 5 to 17 Years | 5 (0.1%) | 19 (0.3%) |
| 18 to 34 Years | 136 (1.3%) | 80 (0.8%) |
| 35 to 64 Years | 386 (2.1%) | 448 (2.4%) |
| 65 to 74 Years | 84 (1.5%) | 166 (2.8%) |
| 75 Years and over | 237 (7.6%) | 371 (8.9%) |
Disability Class: Cognitive Difficulty
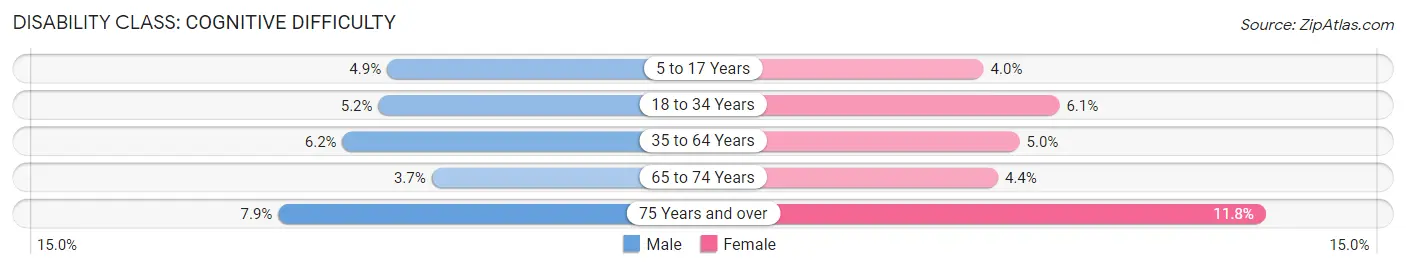
| Age Bracket | Male | Female |
| 5 to 17 Years | 389 (4.9%) | 291 (4.0%) |
| 18 to 34 Years | 530 (5.1%) | 580 (6.1%) |
| 35 to 64 Years | 1,141 (6.1%) | 920 (5.0%) |
| 65 to 74 Years | 200 (3.7%) | 261 (4.3%) |
| 75 Years and over | 246 (7.9%) | 491 (11.8%) |
Disability Class: Ambulatory Difficulty
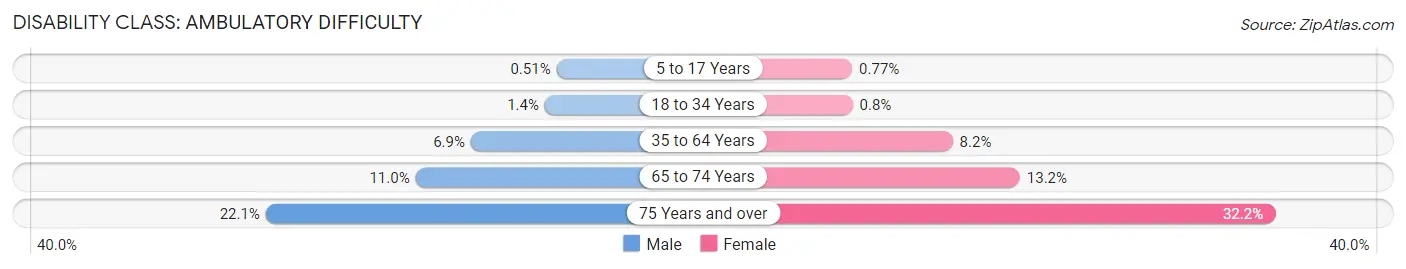
| Age Bracket | Male | Female |
| 5 to 17 Years | 40 (0.5%) | 57 (0.8%) |
| 18 to 34 Years | 142 (1.4%) | 77 (0.8%) |
| 35 to 64 Years | 1,273 (6.9%) | 1,530 (8.2%) |
| 65 to 74 Years | 598 (11.0%) | 794 (13.2%) |
| 75 Years and over | 685 (22.1%) | 1,338 (32.2%) |
Disability Class: Self-Care Difficulty
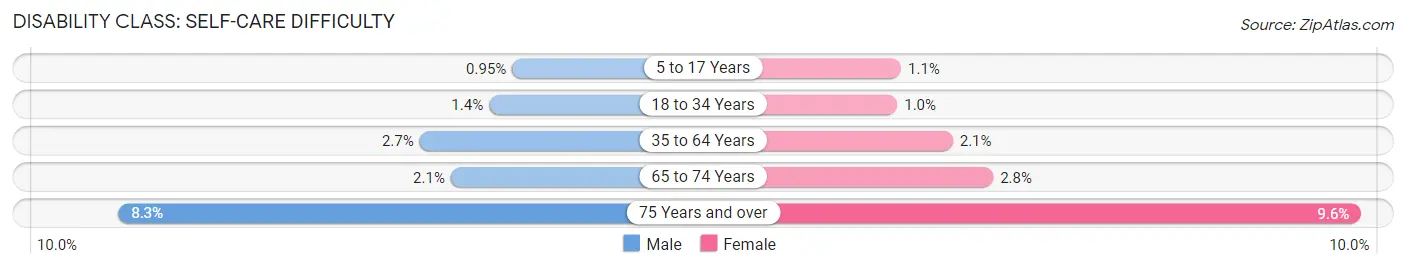
| Age Bracket | Male | Female |
| 5 to 17 Years | 75 (0.9%) | 81 (1.1%) |
| 18 to 34 Years | 142 (1.4%) | 99 (1.0%) |
| 35 to 64 Years | 496 (2.7%) | 383 (2.1%) |
| 65 to 74 Years | 114 (2.1%) | 169 (2.8%) |
| 75 Years and over | 256 (8.3%) | 401 (9.6%) |
Technology Access in Lenawee County
Computing Device Access in Lenawee County
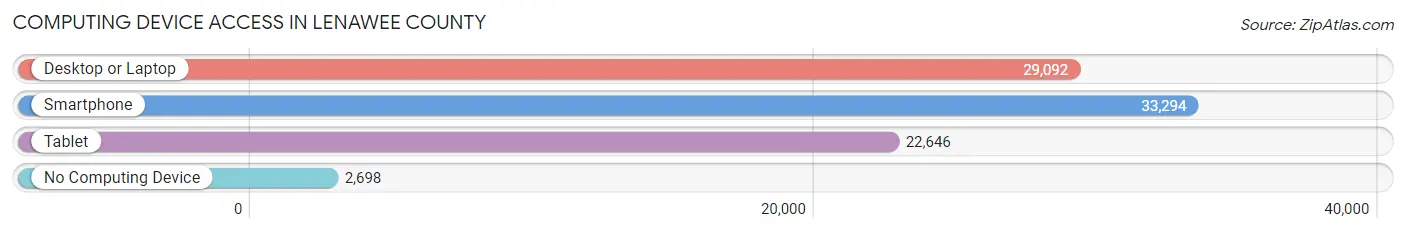
| Device Type | # Households | % Households |
| Desktop or Laptop | 29,092 | 75.3% |
| Smartphone | 33,294 | 86.2% |
| Tablet | 22,646 | 58.6% |
| No Computing Device | 2,698 | 7.0% |
| Total | 38,626 | 100.0% |
Internet Access in Lenawee County
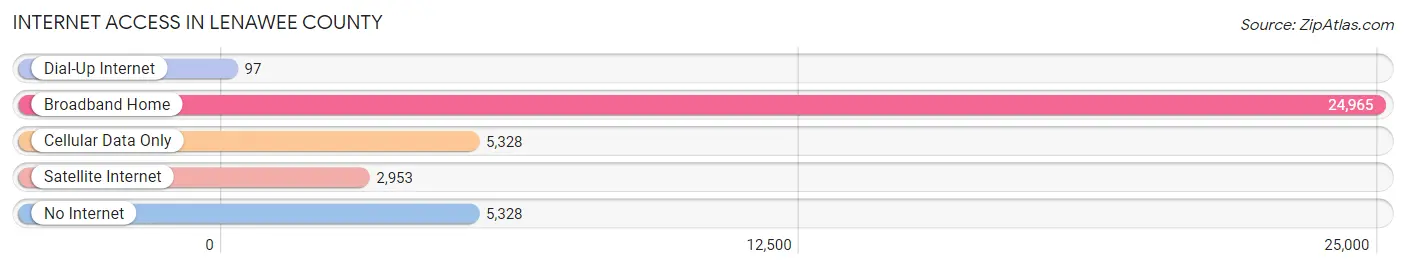
| Internet Type | # Households | % Households |
| Dial-Up Internet | 97 | 0.3% |
| Broadband Home | 24,965 | 64.6% |
| Cellular Data Only | 5,328 | 13.8% |
| Satellite Internet | 2,953 | 7.6% |
| No Internet | 5,328 | 13.8% |
| Total | 38,626 | 100.0% |
Lenawee County Summary
Lenawee County is located in the southeastern corner of Michigan, and is bordered by the state of Ohio to the south and the state of Indiana to the west. The county seat is Adrian, and the county is home to a population of approximately 98,000 people. Lenawee County is part of the Toledo Metropolitan Statistical Area, and is home to several small towns and villages, as well as the cities of Adrian, Tecumseh, and Hudson.
History
Lenawee County was established in 1822, and was named after the Native American tribe of the same name. The county was originally part of the Michigan Territory, and was one of the first counties to be established in the state. The county was originally home to several Native American tribes, including the Lenawee, Potawatomi, and Ottawa. The first settlers in the area were mostly of English and German descent, and the county was largely agricultural in nature.
In the mid-1800s, the county began to experience a period of rapid growth and development. The county was home to several industries, including lumber, paper, and furniture manufacturing. The county also became a major center for the production of agricultural products, such as wheat, corn, and hay.
Geography
Lenawee County is located in the southeastern corner of Michigan, and is bordered by the state of Ohio to the south and the state of Indiana to the west. The county is home to several small towns and villages, as well as the cities of Adrian, Tecumseh, and Hudson. The county is home to several lakes, including Devils Lake, Round Lake, and Wamplers Lake. The county is also home to several rivers, including the River Raisin, the River Rouge, and the River Huron.
The county is largely rural in nature, and is home to several state parks, including the River Raisin National Battlefield Park, the River Raisin State Recreation Area, and the River Raisin Wildlife Area. The county is also home to several golf courses, including the Lenawee Country Club and the Tecumseh Country Club.
Economy
Lenawee County is home to a diverse economy, and is home to several major industries, including manufacturing, agriculture, and tourism. The county is home to several major employers, including the Adrian Steel Company, the Tecumseh Products Company, and the Hudson Manufacturing Company. The county is also home to several smaller businesses, including several wineries, breweries, and distilleries.
The county is also home to several educational institutions, including Adrian College, Siena Heights University, and Jackson Community College. The county is also home to several healthcare facilities, including the ProMedica Bixby Hospital and the ProMedica Herrick Hospital.
Demographics
As of the 2010 census, Lenawee County had a population of 98,000 people. The population is largely white (90.3%), with small percentages of African American (3.2%), Hispanic (2.3%), and Asian (1.2%) populations. The median household income in the county is $50,000, and the median home value is $125,000. The county is home to several small towns and villages, as well as the cities of Adrian, Tecumseh, and Hudson. The county is largely rural in nature, and is home to several state parks, golf courses, and other recreational areas.
Common Questions
What is the Total Population of Lenawee County?
Total Population of Lenawee County is 99,263.
What is the Total Male Population of Lenawee County?
Total Male Population of Lenawee County is 50,546.
What is the Total Female Population of Lenawee County?
Total Female Population of Lenawee County is 48,717.
What is the Ratio of Males per 100 Females in Lenawee County?
There are 103.75 Males per 100 Females in Lenawee County.
What is the Ratio of Females per 100 Males in Lenawee County?
There are 96.38 Females per 100 Males in Lenawee County.
What is the Median Population Age in Lenawee County?
Median Population Age in Lenawee County is 42.0 Years.
What is the Average Family Size in Lenawee County
Average Family Size in Lenawee County is 2.9 People.
What is the Average Household Size in Lenawee County
Average Household Size in Lenawee County is 2.4 People.
What is Per Capita Income in Lenawee County?
Per Capita income in Lenawee County is $32,976.
What is the Median Family Income in Lenawee County?
Median Family Income in Lenawee County is $78,131.
What is the Median Household income in Lenawee County?
Median Household Income in Lenawee County is $65,484.
What is Income or Wage Gap in Lenawee County?
Income or Wage Gap in Lenawee County is 32.9%.
Women in Lenawee County earn 67.1 cents for every dollar earned by a man.
What is Family Income Deficit in Lenawee County?
Family Income Deficit in Lenawee County is $11,431.
Families that are below poverty line in Lenawee County earn $11,431 less on average than the poverty threshold level.
What is Inequality or Gini Index in Lenawee County?
Inequality or Gini Index in Lenawee County is 0.42.
How Large is the Labor Force in Lenawee County?
There are 46,690 People in the Labor Forcein in Lenawee County.
What is the Percentage of People in the Labor Force in Lenawee County?
57.5% of People are in the Labor Force in Lenawee County.
What is the Unemployment Rate in Lenawee County?
Unemployment Rate in Lenawee County is 5.6%.