Lapeer County, MI
Lapeer County Map
Lapeer County Overview
88,687
TOTAL POPULATION
45,727
MALE POPULATION
42,960
FEMALE POPULATION
106.44
MALES / 100 FEMALES
93.95
FEMALES / 100 MALES
44.5
MEDIAN AGE
2.9
AVG FAMILY SIZE
2.5
AVG HOUSEHOLD SIZE
$37,419
PER CAPITA INCOME
$85,295
AVG FAMILY INCOME
$75,402
AVG HOUSEHOLD INCOME
45.3%
WAGE / INCOME GAP [ % ]
54.7¢/ $1
WAGE / INCOME GAP [ $ ]
$11,761
FAMILY INCOME DEFICIT
0.43
INEQUALITY / GINI INDEX
43,246
LABOR FORCE [ PEOPLE ]
59.2%
PERCENT IN LABOR FORCE
5.3%
UNEMPLOYMENT RATE
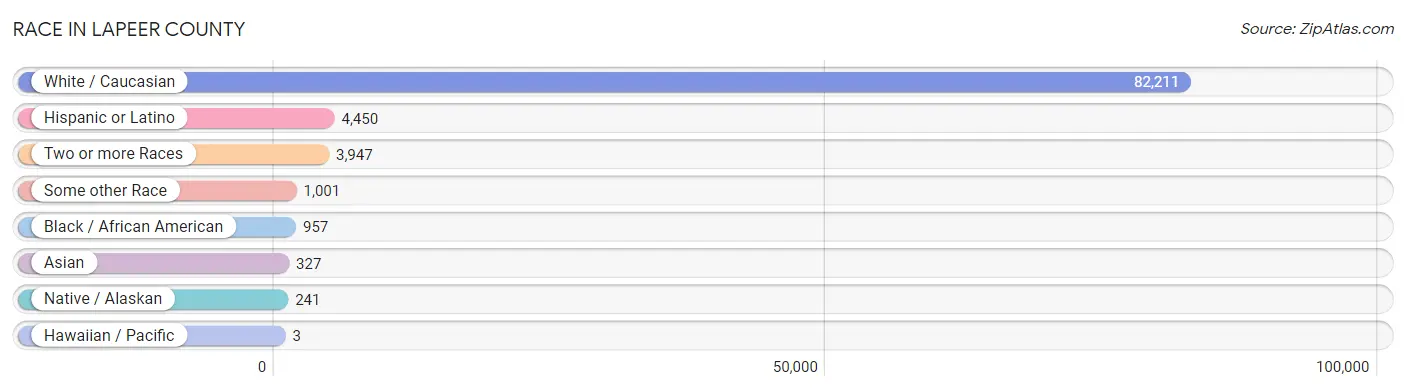
Race in Lapeer County
The most populous races in Lapeer County are White / Caucasian (82,211 | 92.7%), Hispanic or Latino (4,450 | 5.0%), and Two or more Races (3,947 | 4.4%).
| Race | # Population | % Population |
| Asian | 327 | 0.4% |
| Black / African American | 957 | 1.1% |
| Hawaiian / Pacific | 3 | 0.0% |
| Hispanic or Latino | 4,450 | 5.0% |
| Native / Alaskan | 241 | 0.3% |
| White / Caucasian | 82,211 | 92.7% |
| Two or more Races | 3,947 | 4.4% |
| Some other Race | 1,001 | 1.1% |
| Total | 88,687 | 100.0% |
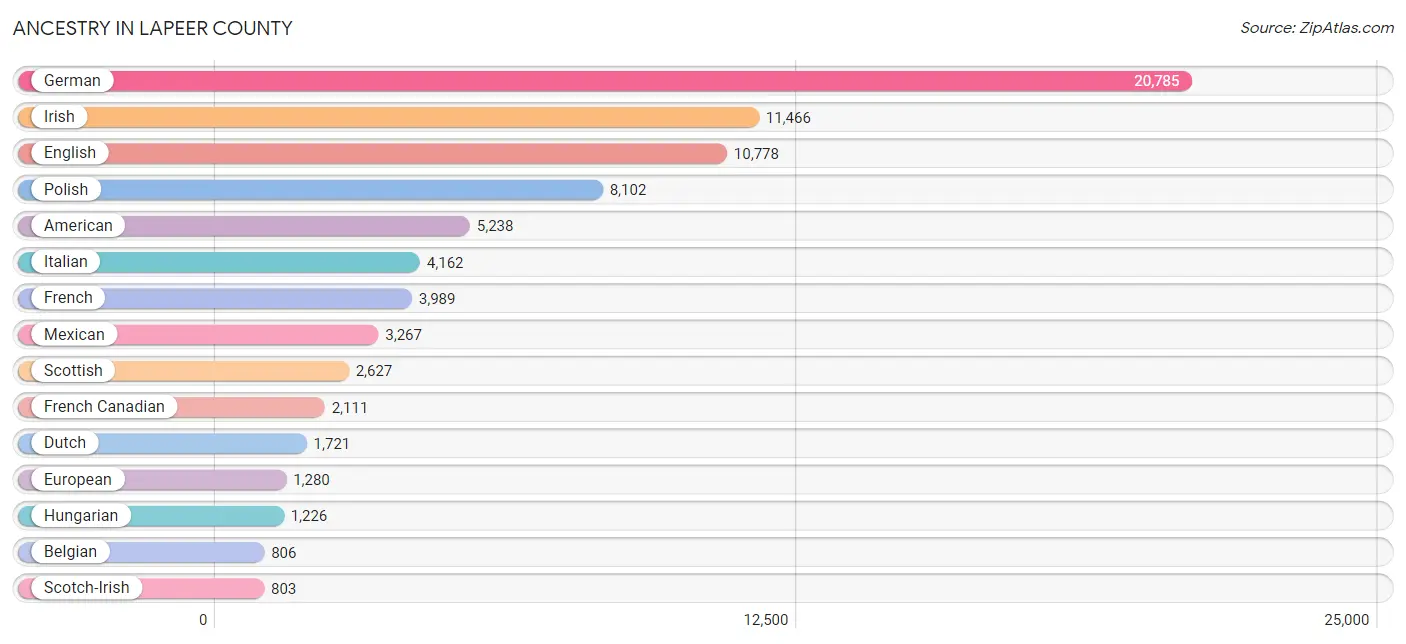
Ancestry in Lapeer County
The most populous ancestries reported in Lapeer County are German (20,785 | 23.4%), Irish (11,466 | 12.9%), English (10,778 | 12.1%), Polish (8,102 | 9.1%), and American (5,238 | 5.9%), together accounting for 63.6% of all Lapeer County residents.
| Ancestry | # Population | % Population |
| African | 135 | 0.2% |
| Albanian | 177 | 0.2% |
| American | 5,238 | 5.9% |
| Apache | 13 | 0.0% |
| Arab | 336 | 0.4% |
| Argentinean | 149 | 0.2% |
| Armenian | 19 | 0.0% |
| Assyrian / Chaldean / Syriac | 61 | 0.1% |
| Australian | 38 | 0.0% |
| Austrian | 84 | 0.1% |
| Belgian | 806 | 0.9% |
| Bhutanese | 188 | 0.2% |
| Blackfeet | 81 | 0.1% |
| British | 385 | 0.4% |
| Bulgarian | 86 | 0.1% |
| Burmese | 120 | 0.1% |
| Canadian | 478 | 0.5% |
| Celtic | 18 | 0.0% |
| Central American | 175 | 0.2% |
| Central American Indian | 142 | 0.2% |
| Cherokee | 196 | 0.2% |
| Chippewa | 95 | 0.1% |
| Choctaw | 3 | 0.0% |
| Colombian | 9 | 0.0% |
| Cree | 4 | 0.0% |
| Croatian | 201 | 0.2% |
| Cuban | 16 | 0.0% |
| Czech | 305 | 0.3% |
| Czechoslovakian | 118 | 0.1% |
| Danish | 291 | 0.3% |
| Dutch | 1,721 | 1.9% |
| Eastern European | 370 | 0.4% |
| Ecuadorian | 54 | 0.1% |
| Egyptian | 11 | 0.0% |
| English | 10,778 | 12.1% |
| European | 1,280 | 1.4% |
| Finnish | 587 | 0.7% |
| French | 3,989 | 4.5% |
| French American Indian | 4 | 0.0% |
| French Canadian | 2,111 | 2.4% |
| German | 20,785 | 23.4% |
| German Russian | 11 | 0.0% |
| Greek | 141 | 0.2% |
| Guamanian / Chamorro | 16 | 0.0% |
| Guatemalan | 64 | 0.1% |
| Hungarian | 1,226 | 1.4% |
| Indian (Asian) | 150 | 0.2% |
| Iranian | 9 | 0.0% |
| Iraqi | 9 | 0.0% |
| Irish | 11,466 | 12.9% |
| Iroquois | 18 | 0.0% |
| Israeli | 12 | 0.0% |
| Italian | 4,162 | 4.7% |
| Kiowa | 20 | 0.0% |
| Korean | 233 | 0.3% |
| Laotian | 118 | 0.1% |
| Lebanese | 195 | 0.2% |
| Lithuanian | 127 | 0.1% |
| Macedonian | 73 | 0.1% |
| Maltese | 155 | 0.2% |
| Mexican | 3,267 | 3.7% |
| Mexican American Indian | 30 | 0.0% |
| Moroccan | 5 | 0.0% |
| Native Hawaiian | 6 | 0.0% |
| Navajo | 9 | 0.0% |
| New Zealander | 8 | 0.0% |
| Nicaraguan | 23 | 0.0% |
| Northern European | 91 | 0.1% |
| Norwegian | 531 | 0.6% |
| Ottawa | 1 | 0.0% |
| Pakistani | 68 | 0.1% |
| Pennsylvania German | 18 | 0.0% |
| Polish | 8,102 | 9.1% |
| Portuguese | 16 | 0.0% |
| Potawatomi | 9 | 0.0% |
| Puerto Rican | 623 | 0.7% |
| Romanian | 286 | 0.3% |
| Russian | 307 | 0.4% |
| Salvadoran | 88 | 0.1% |
| Scandinavian | 287 | 0.3% |
| Scotch-Irish | 803 | 0.9% |
| Scottish | 2,627 | 3.0% |
| Seminole | 2 | 0.0% |
| Serbian | 121 | 0.1% |
| Sioux | 2 | 0.0% |
| Slavic | 264 | 0.3% |
| Slovak | 66 | 0.1% |
| Slovene | 46 | 0.1% |
| South American | 212 | 0.2% |
| Spaniard | 57 | 0.1% |
| Spanish | 39 | 0.0% |
| Sri Lankan | 9 | 0.0% |
| Subsaharan African | 135 | 0.2% |
| Swedish | 556 | 0.6% |
| Swiss | 122 | 0.1% |
| Syrian | 2 | 0.0% |
| Thai | 31 | 0.0% |
| Ukrainian | 308 | 0.4% |
| Vietnamese | 47 | 0.1% |
| Welsh | 546 | 0.6% |
| Yugoslavian | 108 | 0.1% | View All 101 Rows |
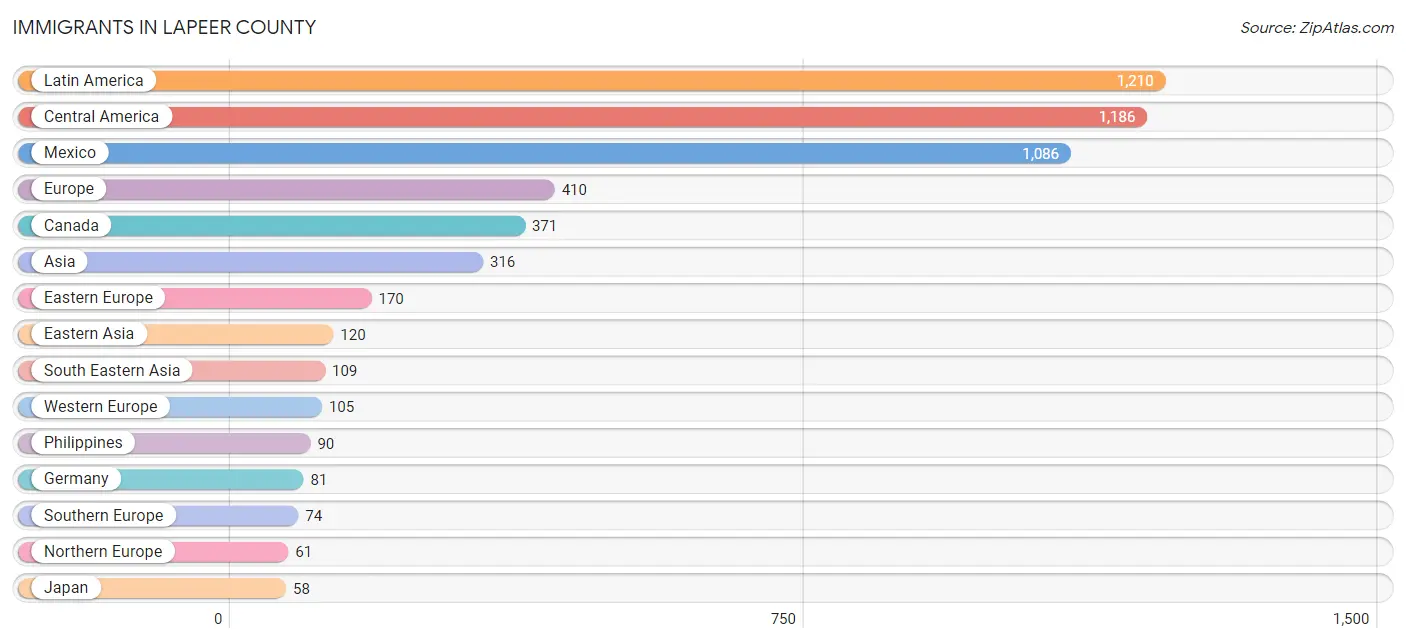
Immigrants in Lapeer County
The most numerous immigrant groups reported in Lapeer County came from Latin America (1,210 | 1.4%), Central America (1,186 | 1.3%), Mexico (1,086 | 1.2%), Europe (410 | 0.5%), and Canada (371 | 0.4%), together accounting for 4.8% of all Lapeer County residents.
| Immigration Origin | # Population | % Population |
| Africa | 7 | 0.0% |
| Albania | 7 | 0.0% |
| Argentina | 19 | 0.0% |
| Asia | 316 | 0.4% |
| Australia | 13 | 0.0% |
| Austria | 8 | 0.0% |
| Bangladesh | 47 | 0.1% |
| Canada | 371 | 0.4% |
| Caribbean | 5 | 0.0% |
| Central America | 1,186 | 1.3% |
| China | 55 | 0.1% |
| Cuba | 5 | 0.0% |
| Eastern Asia | 120 | 0.1% |
| Eastern Europe | 170 | 0.2% |
| El Salvador | 53 | 0.1% |
| England | 37 | 0.0% |
| Europe | 410 | 0.5% |
| France | 8 | 0.0% |
| Germany | 81 | 0.1% |
| Guatemala | 47 | 0.1% |
| Hong Kong | 17 | 0.0% |
| Hungary | 12 | 0.0% |
| Indonesia | 3 | 0.0% |
| Iraq | 18 | 0.0% |
| Israel | 9 | 0.0% |
| Italy | 42 | 0.1% |
| Japan | 58 | 0.1% |
| Korea | 7 | 0.0% |
| Kuwait | 9 | 0.0% |
| Latin America | 1,210 | 1.4% |
| Mexico | 1,086 | 1.2% |
| Netherlands | 8 | 0.0% |
| North Macedonia | 14 | 0.0% |
| Northern Europe | 61 | 0.1% |
| Oceania | 13 | 0.0% |
| Pakistan | 4 | 0.0% |
| Philippines | 90 | 0.1% |
| Poland | 15 | 0.0% |
| Romania | 58 | 0.1% |
| Russia | 11 | 0.0% |
| Scotland | 4 | 0.0% |
| South Africa | 7 | 0.0% |
| South America | 19 | 0.0% |
| South Central Asia | 51 | 0.1% |
| South Eastern Asia | 109 | 0.1% |
| Southern Europe | 74 | 0.1% |
| Thailand | 16 | 0.0% |
| Ukraine | 12 | 0.0% |
| Western Asia | 36 | 0.0% |
| Western Europe | 105 | 0.1% | View All 50 Rows |
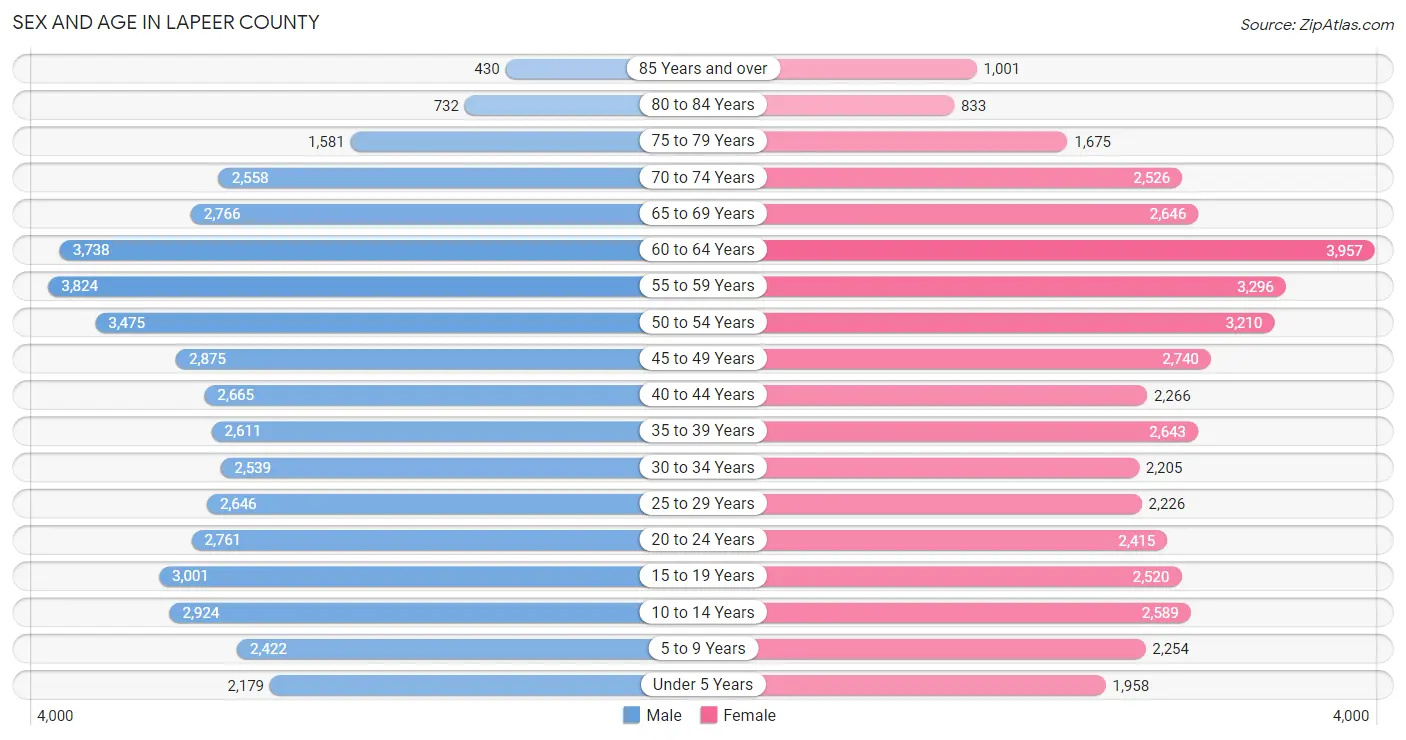
Sex and Age in Lapeer County
Sex and Age in Lapeer County
The most populous age groups in Lapeer County are 55 to 59 Years (3,824 | 8.4%) for men and 60 to 64 Years (3,957 | 9.2%) for women.
| Age Bracket | Male | Female |
| Under 5 Years | 2,179 (4.8%) | 1,958 (4.6%) |
| 5 to 9 Years | 2,422 (5.3%) | 2,254 (5.2%) |
| 10 to 14 Years | 2,924 (6.4%) | 2,589 (6.0%) |
| 15 to 19 Years | 3,001 (6.6%) | 2,520 (5.9%) |
| 20 to 24 Years | 2,761 (6.0%) | 2,415 (5.6%) |
| 25 to 29 Years | 2,646 (5.8%) | 2,226 (5.2%) |
| 30 to 34 Years | 2,539 (5.6%) | 2,205 (5.1%) |
| 35 to 39 Years | 2,611 (5.7%) | 2,643 (6.1%) |
| 40 to 44 Years | 2,665 (5.8%) | 2,266 (5.3%) |
| 45 to 49 Years | 2,875 (6.3%) | 2,740 (6.4%) |
| 50 to 54 Years | 3,475 (7.6%) | 3,210 (7.5%) |
| 55 to 59 Years | 3,824 (8.4%) | 3,296 (7.7%) |
| 60 to 64 Years | 3,738 (8.2%) | 3,957 (9.2%) |
| 65 to 69 Years | 2,766 (6.0%) | 2,646 (6.2%) |
| 70 to 74 Years | 2,558 (5.6%) | 2,526 (5.9%) |
| 75 to 79 Years | 1,581 (3.5%) | 1,675 (3.9%) |
| 80 to 84 Years | 732 (1.6%) | 833 (1.9%) |
| 85 Years and over | 430 (0.9%) | 1,001 (2.3%) |
| Total | 45,727 (100.0%) | 42,960 (100.0%) |
Families and Households in Lapeer County
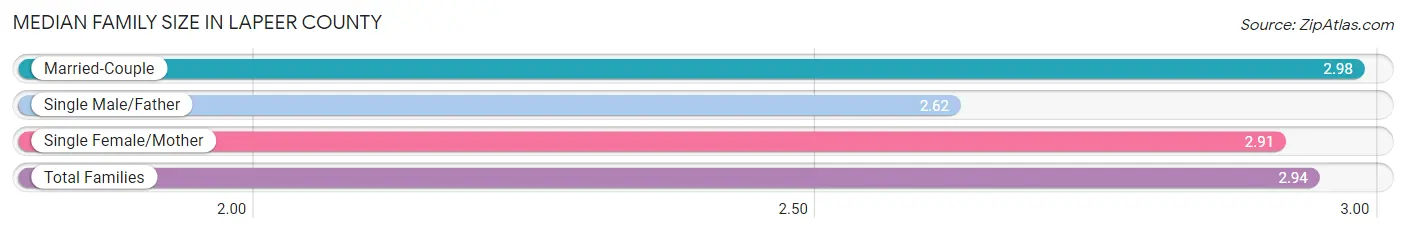
Median Family Size in Lapeer County
The median family size in Lapeer County is 2.94 persons per family, with married-couple families (20,055 | 80.2%) accounting for the largest median family size of 2.98 persons per family. On the other hand, single male/father families (1,722 | 6.9%) represent the smallest median family size with 2.62 persons per family.
| Family Type | # Families | Family Size |
| Married-Couple | 20,055 (80.2%) | 2.98 |
| Single Male/Father | 1,722 (6.9%) | 2.62 |
| Single Female/Mother | 3,214 (12.9%) | 2.91 |
| Total Families | 24,991 (100.0%) | 2.94 |
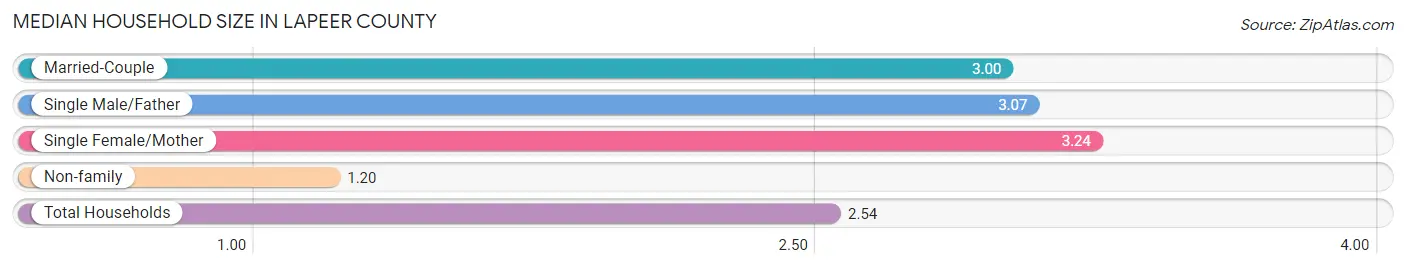
Median Household Size in Lapeer County
The median household size in Lapeer County is 2.54 persons per household, with single female/mother households (3,214 | 9.4%) accounting for the largest median household size of 3.24 persons per household. non-family households (9,248 | 27.0%) represent the smallest median household size with 1.20 persons per household.
| Household Type | # Households | Household Size |
| Married-Couple | 20,055 (58.6%) | 3.00 |
| Single Male/Father | 1,722 (5.0%) | 3.07 |
| Single Female/Mother | 3,214 (9.4%) | 3.24 |
| Non-family | 9,248 (27.0%) | 1.20 |
| Total Households | 34,239 (100.0%) | 2.54 |
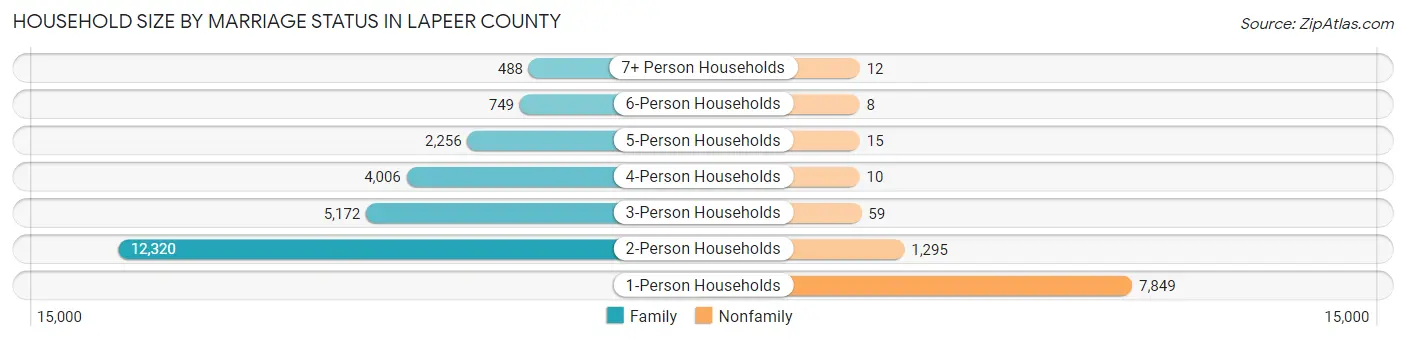
Household Size by Marriage Status in Lapeer County
Out of a total of 34,239 households in Lapeer County, 24,991 (73.0%) are family households, while 9,248 (27.0%) are nonfamily households. The most numerous type of family households are 2-person households, comprising 12,320, and the most common type of nonfamily households are 1-person households, comprising 7,849.
| Household Size | Family Households | Nonfamily Households |
| 1-Person Households | - | 7,849 (22.9%) |
| 2-Person Households | 12,320 (36.0%) | 1,295 (3.8%) |
| 3-Person Households | 5,172 (15.1%) | 59 (0.2%) |
| 4-Person Households | 4,006 (11.7%) | 10 (0.0%) |
| 5-Person Households | 2,256 (6.6%) | 15 (0.0%) |
| 6-Person Households | 749 (2.2%) | 8 (0.0%) |
| 7+ Person Households | 488 (1.4%) | 12 (0.0%) |
| Total | 24,991 (73.0%) | 9,248 (27.0%) |
Female Fertility in Lapeer County
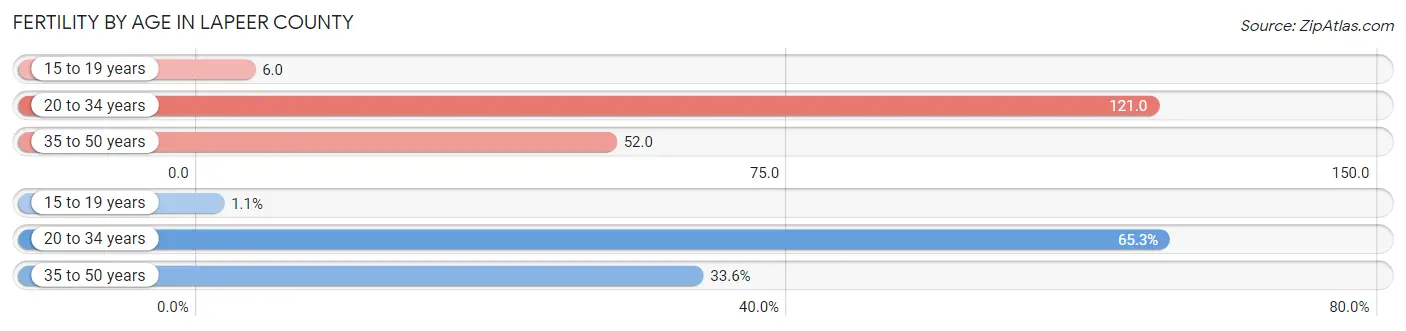
Fertility by Age in Lapeer County
Average fertility rate in Lapeer County is 72.0 births per 1,000 women. Women in the age bracket of 20 to 34 years have the highest fertility rate with 121.0 births per 1,000 women. Women in the age bracket of 20 to 34 years acount for 65.3% of all women with births.
| Age Bracket | Women with Births | Births / 1,000 Women |
| 15 to 19 years | 14 (1.1%) | 6.0 |
| 20 to 34 years | 829 (65.3%) | 121.0 |
| 35 to 50 years | 427 (33.6%) | 52.0 |
| Total | 1,270 (100.0%) | 72.0 |
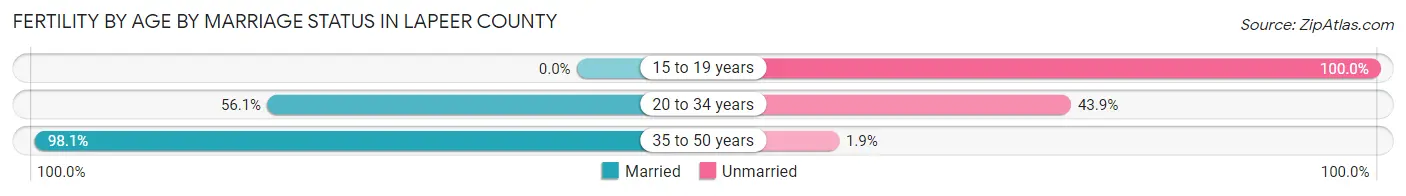
Fertility by Age by Marriage Status in Lapeer County
69.6% of women with births (1,270) in Lapeer County are married. The highest percentage of unmarried women with births falls into 15 to 19 years age bracket with 100.0% of them unmarried at the time of birth, while the lowest percentage of unmarried women with births belong to 35 to 50 years age bracket with 1.9% of them unmarried.
| Age Bracket | Married | Unmarried |
| 15 to 19 years | 0 (0.0%) | 14 (100.0%) |
| 20 to 34 years | 465 (56.1%) | 364 (43.9%) |
| 35 to 50 years | 419 (98.1%) | 8 (1.9%) |
| Total | 884 (69.6%) | 386 (30.4%) |
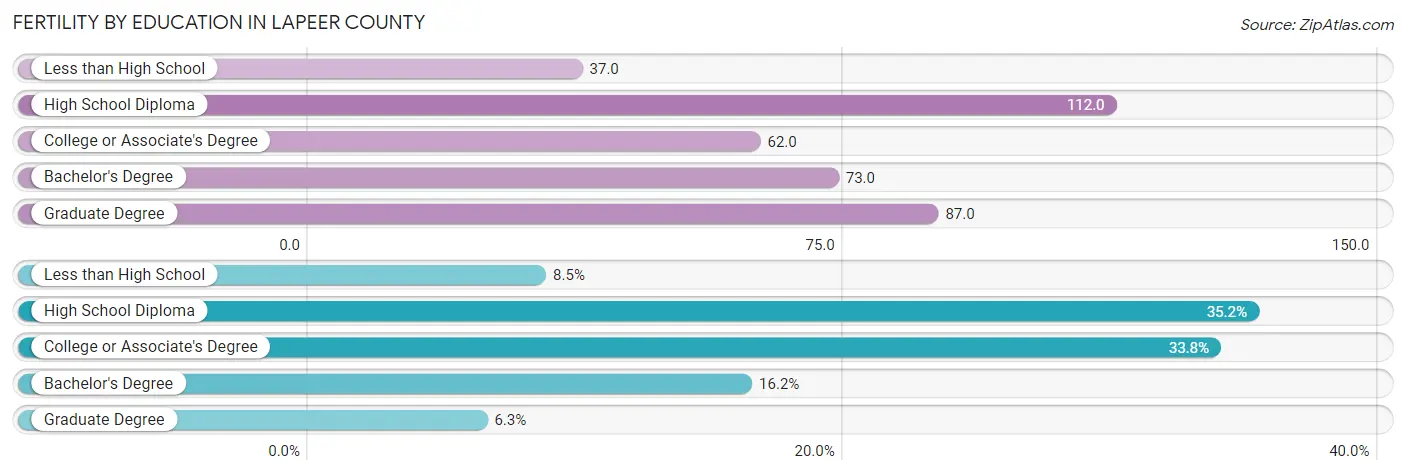
Fertility by Education in Lapeer County
Average fertility rate in Lapeer County is 72.0 births per 1,000 women. Women with the education attainment of high school diploma have the highest fertility rate of 112.0 births per 1,000 women, while women with the education attainment of less than high school have the lowest fertility at 37.0 births per 1,000 women. Women with the education attainment of high school diploma represent 35.2% of all women with births.
| Educational Attainment | Women with Births | Births / 1,000 Women |
| Less than High School | 108 (8.5%) | 37.0 |
| High School Diploma | 447 (35.2%) | 112.0 |
| College or Associate's Degree | 429 (33.8%) | 62.0 |
| Bachelor's Degree | 206 (16.2%) | 73.0 |
| Graduate Degree | 80 (6.3%) | 87.0 |
| Total | 1,270 (100.0%) | 72.0 |
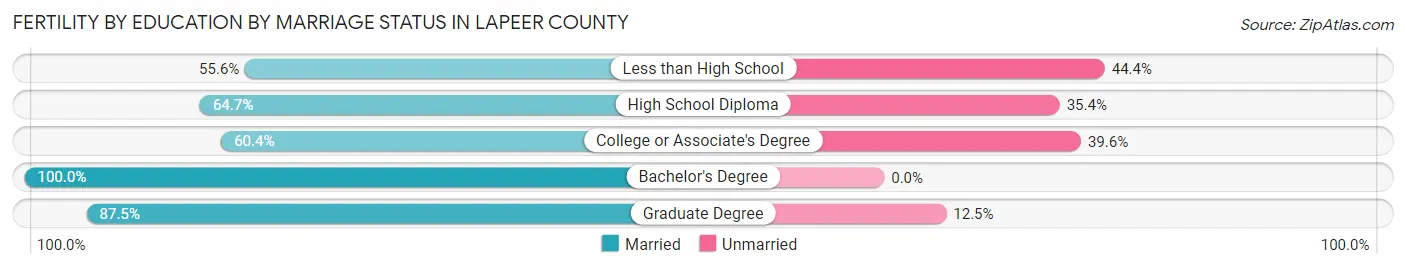
Fertility by Education by Marriage Status in Lapeer County
30.4% of women with births in Lapeer County are unmarried. Women with the educational attainment of bachelor's degree are most likely to be married with 100.0% of them married at childbirth, while women with the educational attainment of less than high school are least likely to be married with 44.4% of them unmarried at childbirth.
| Educational Attainment | Married | Unmarried |
| Less than High School | 60 (55.6%) | 48 (44.4%) |
| High School Diploma | 289 (64.6%) | 158 (35.3%) |
| College or Associate's Degree | 259 (60.4%) | 170 (39.6%) |
| Bachelor's Degree | 206 (100.0%) | 0 (0.0%) |
| Graduate Degree | 70 (87.5%) | 10 (12.5%) |
| Total | 884 (69.6%) | 386 (30.4%) |
Income in Lapeer County
Income Overview in Lapeer County
Per Capita Income in Lapeer County is $37,419, while median incomes of families and households are $85,295 and $75,402 respectively.
| Characteristic | Number | Measure |
| Per Capita Income | 88,687 | $37,419 |
| Median Family Income | 24,991 | $85,295 |
| Mean Family Income | 24,991 | $107,264 |
| Median Household Income | 34,239 | $75,402 |
| Mean Household Income | 34,239 | $94,615 |
| Income Deficit | 24,991 | $11,761 |
| Wage / Income Gap (%) | 88,687 | 45.32% |
| Wage / Income Gap ($) | 88,687 | 54.68¢ per $1 |
| Gini / Inequality Index | 88,687 | 0.43 |
Earnings by Sex in Lapeer County
Average Earnings in Lapeer County are $40,224, $53,184 for men and $29,083 for women, a difference of 45.3%.
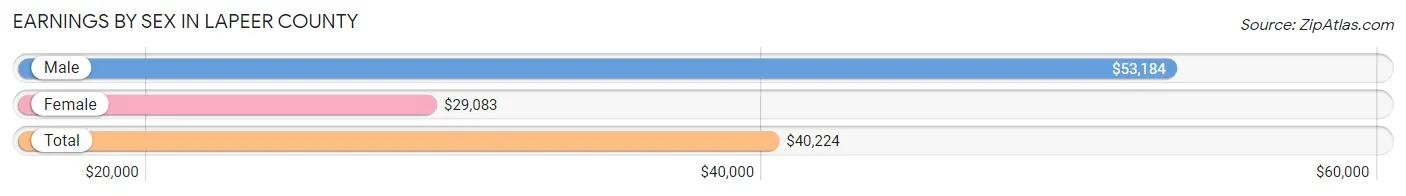
| Sex | Number | Average Earnings |
| Male | 25,119 (55.1%) | $53,184 |
| Female | 20,477 (44.9%) | $29,083 |
| Total | 45,596 (100.0%) | $40,224 |
Earnings by Sex by Income Bracket in Lapeer County
The most common earnings brackets in Lapeer County are $100,000+ for men (4,927 | 19.6%) and $30,000 to $34,999 for women (1,538 | 7.5%).
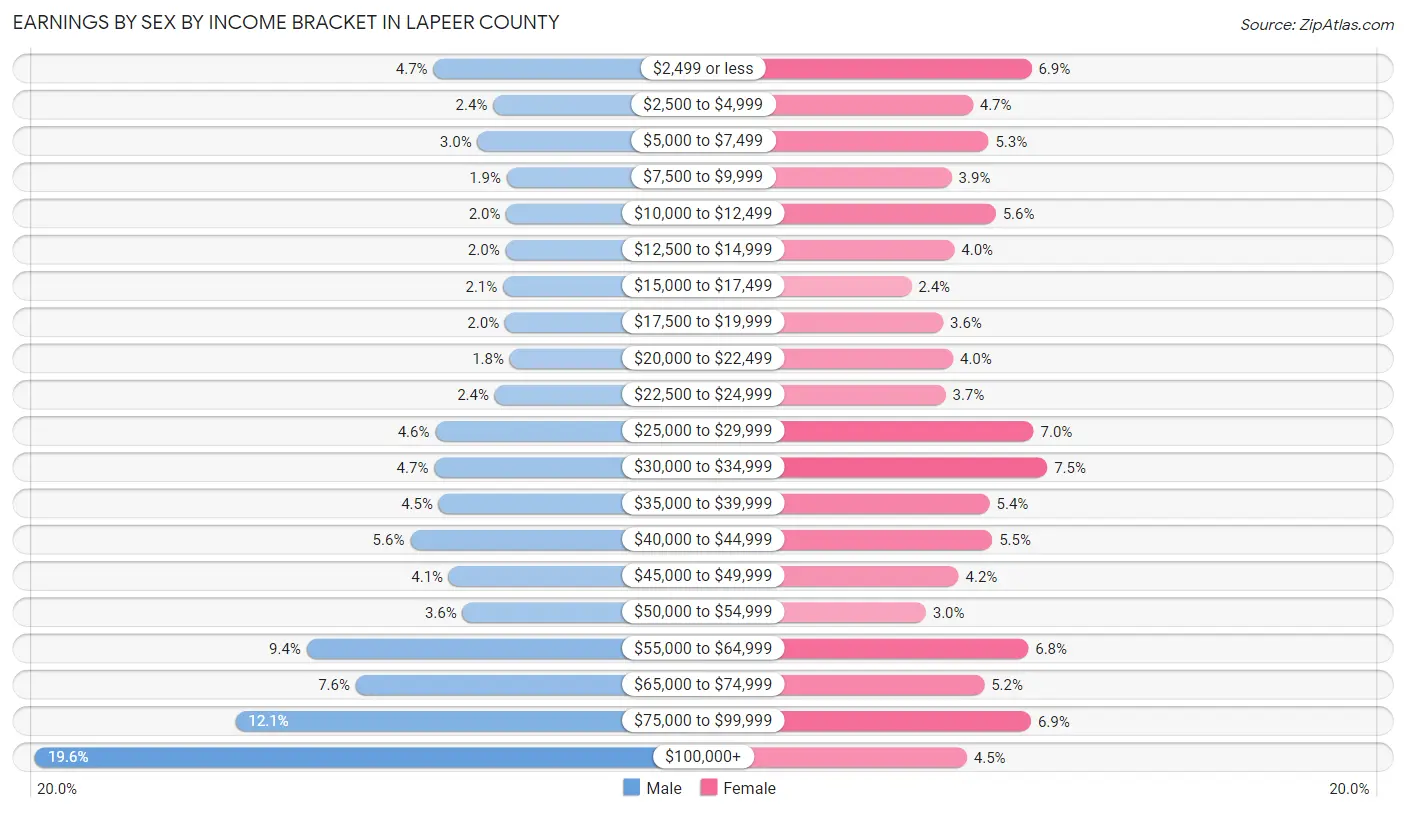
| Income | Male | Female |
| $2,499 or less | 1,175 (4.7%) | 1,416 (6.9%) |
| $2,500 to $4,999 | 614 (2.4%) | 967 (4.7%) |
| $5,000 to $7,499 | 762 (3.0%) | 1,087 (5.3%) |
| $7,500 to $9,999 | 484 (1.9%) | 804 (3.9%) |
| $10,000 to $12,499 | 489 (1.9%) | 1,142 (5.6%) |
| $12,500 to $14,999 | 498 (2.0%) | 825 (4.0%) |
| $15,000 to $17,499 | 521 (2.1%) | 495 (2.4%) |
| $17,500 to $19,999 | 503 (2.0%) | 740 (3.6%) |
| $20,000 to $22,499 | 456 (1.8%) | 814 (4.0%) |
| $22,500 to $24,999 | 598 (2.4%) | 758 (3.7%) |
| $25,000 to $29,999 | 1,157 (4.6%) | 1,434 (7.0%) |
| $30,000 to $34,999 | 1,168 (4.6%) | 1,538 (7.5%) |
| $35,000 to $39,999 | 1,125 (4.5%) | 1,095 (5.3%) |
| $40,000 to $44,999 | 1,394 (5.6%) | 1,116 (5.4%) |
| $45,000 to $49,999 | 1,030 (4.1%) | 859 (4.2%) |
| $50,000 to $54,999 | 903 (3.6%) | 606 (3.0%) |
| $55,000 to $64,999 | 2,368 (9.4%) | 1,393 (6.8%) |
| $65,000 to $74,999 | 1,907 (7.6%) | 1,054 (5.1%) |
| $75,000 to $99,999 | 3,040 (12.1%) | 1,413 (6.9%) |
| $100,000+ | 4,927 (19.6%) | 921 (4.5%) |
| Total | 25,119 (100.0%) | 20,477 (100.0%) |
Earnings by Sex by Educational Attainment in Lapeer County
Average earnings in Lapeer County are $60,235 for men and $33,528 for women, a difference of 44.3%. Men with an educational attainment of graduate degree enjoy the highest average annual earnings of $90,823, while those with less than high school education earn the least with $36,875. Women with an educational attainment of graduate degree earn the most with the average annual earnings of $64,963, while those with less than high school education have the smallest earnings of $23,454.
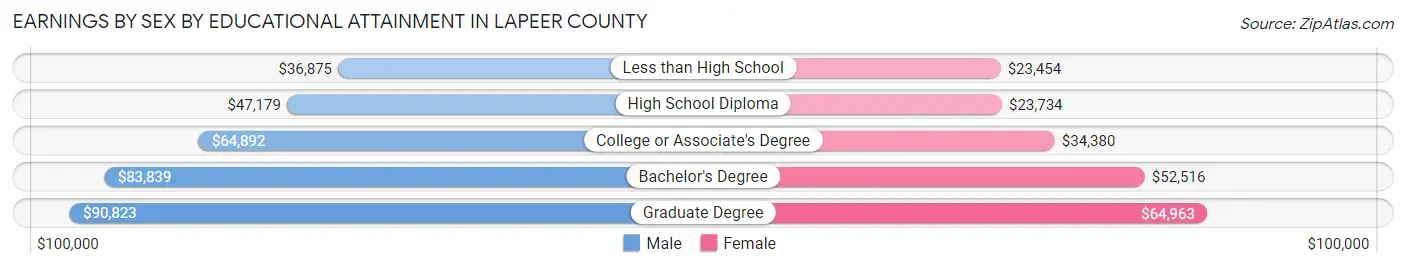
| Educational Attainment | Male Income | Female Income |
| Less than High School | $36,875 | $23,454 |
| High School Diploma | $47,179 | $23,734 |
| College or Associate's Degree | $64,892 | $34,380 |
| Bachelor's Degree | $83,839 | $52,516 |
| Graduate Degree | $90,823 | $64,963 |
| Total | $60,235 | $33,528 |
Family Income in Lapeer County
Family Income Brackets in Lapeer County
According to the Lapeer County family income data, there are 5,723 families falling into the $100,000 to $149,999 income range, which is the most common income bracket and makes up 22.9% of all families. Conversely, the $10,000 to $14,999 income bracket is the least frequent group with only 375 families (1.5%) belonging to this category.
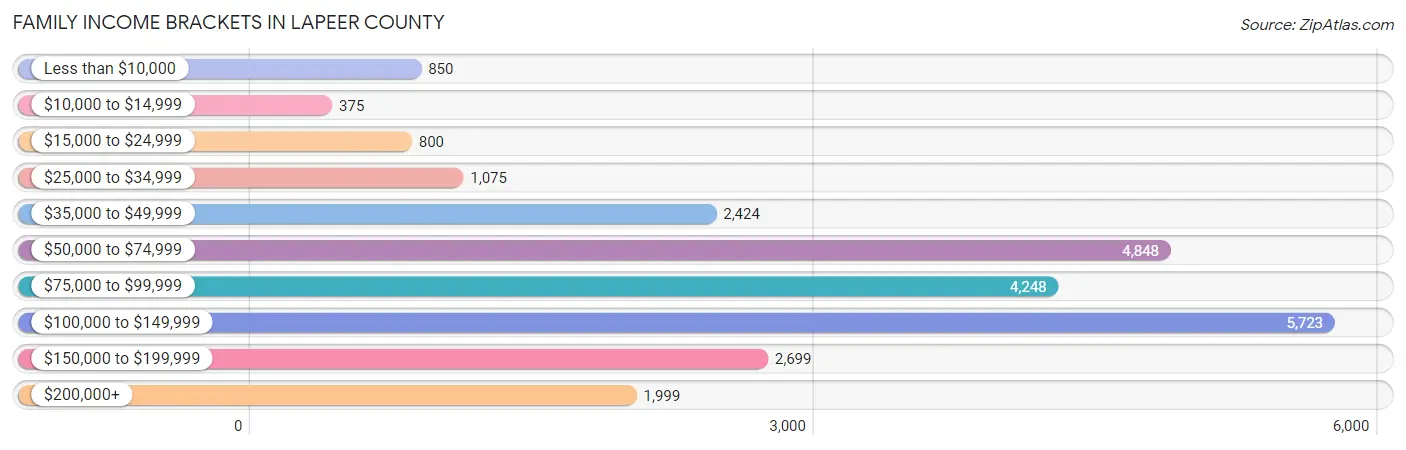
| Income Bracket | # Families | % Families |
| Less than $10,000 | 850 | 3.4% |
| $10,000 to $14,999 | 375 | 1.5% |
| $15,000 to $24,999 | 800 | 3.2% |
| $25,000 to $34,999 | 1,075 | 4.3% |
| $35,000 to $49,999 | 2,424 | 9.7% |
| $50,000 to $74,999 | 4,848 | 19.4% |
| $75,000 to $99,999 | 4,248 | 17.0% |
| $100,000 to $149,999 | 5,723 | 22.9% |
| $150,000 to $199,999 | 2,699 | 10.8% |
| $200,000+ | 1,999 | 8.0% |
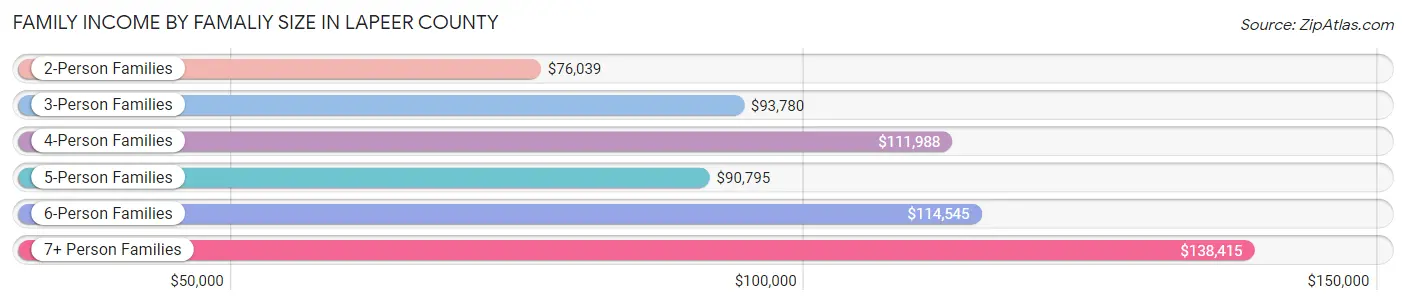
Family Income by Famaliy Size in Lapeer County
7+ person families (404 | 1.6%) account for the highest median family income in Lapeer County with $138,415 per family, while 2-person families (12,970 | 51.9%) have the highest median income of $38,020 per family member.
| Income Bracket | # Families | Median Income |
| 2-Person Families | 12,970 (51.9%) | $76,039 |
| 3-Person Families | 5,155 (20.6%) | $93,780 |
| 4-Person Families | 3,782 (15.1%) | $111,988 |
| 5-Person Families | 2,080 (8.3%) | $90,795 |
| 6-Person Families | 600 (2.4%) | $114,545 |
| 7+ Person Families | 404 (1.6%) | $138,415 |
| Total | 24,991 (100.0%) | $85,295 |
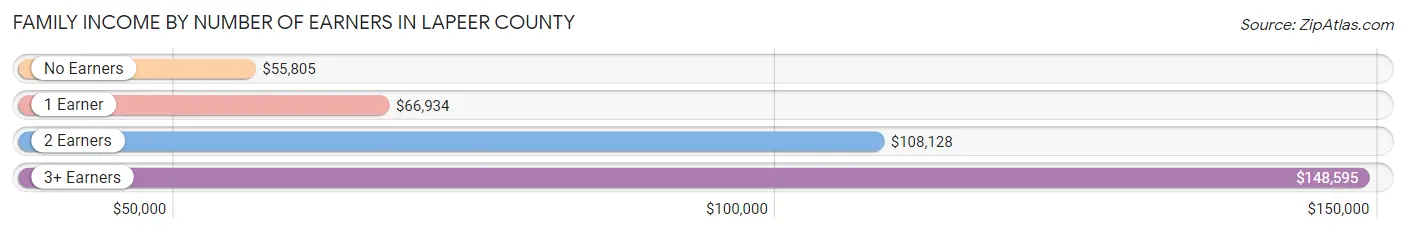
Family Income by Number of Earners in Lapeer County
The median family income in Lapeer County is $85,295, with families comprising 3+ earners (2,816) having the highest median family income of $148,595, while families with no earners (4,933) have the lowest median family income of $55,805, accounting for 11.3% and 19.7% of families, respectively.
| Number of Earners | # Families | Median Income |
| No Earners | 4,933 (19.7%) | $55,805 |
| 1 Earner | 7,128 (28.5%) | $66,934 |
| 2 Earners | 10,114 (40.5%) | $108,128 |
| 3+ Earners | 2,816 (11.3%) | $148,595 |
| Total | 24,991 (100.0%) | $85,295 |
Household Income in Lapeer County
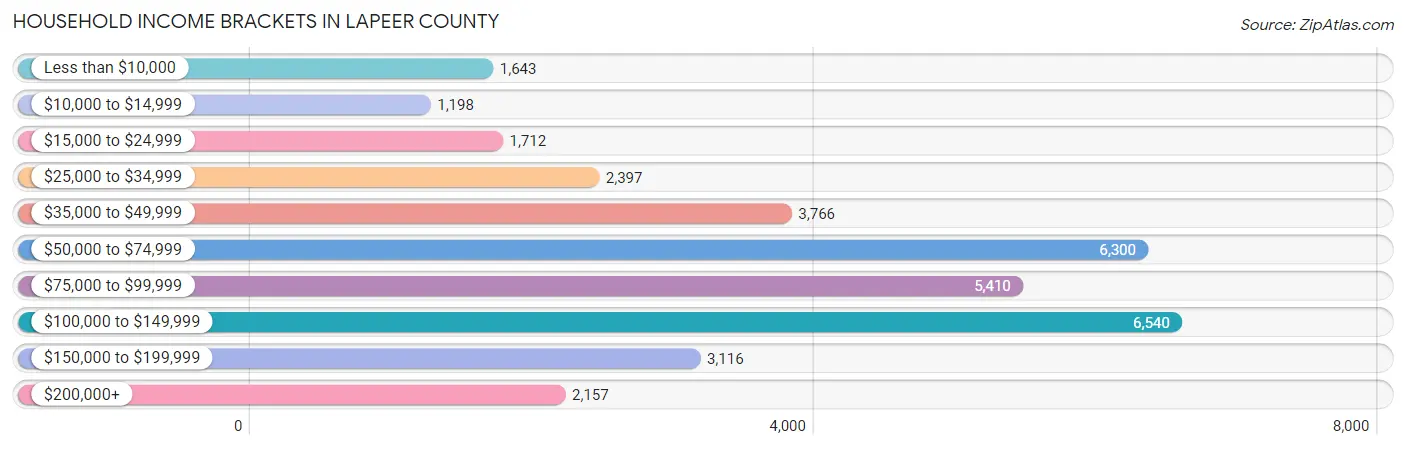
Household Income Brackets in Lapeer County
With 6,540 households falling in the category, the $100,000 to $149,999 income range is the most frequent in Lapeer County, accounting for 19.1% of all households. In contrast, only 1,198 households (3.5%) fall into the $10,000 to $14,999 income bracket, making it the least populous group.
| Income Bracket | # Households | % Households |
| Less than $10,000 | 1,643 | 4.8% |
| $10,000 to $14,999 | 1,198 | 3.5% |
| $15,000 to $24,999 | 1,712 | 5.0% |
| $25,000 to $34,999 | 2,397 | 7.0% |
| $35,000 to $49,999 | 3,766 | 11.0% |
| $50,000 to $74,999 | 6,300 | 18.4% |
| $75,000 to $99,999 | 5,410 | 15.8% |
| $100,000 to $149,999 | 6,540 | 19.1% |
| $150,000 to $199,999 | 3,116 | 9.1% |
| $200,000+ | 2,157 | 6.3% |
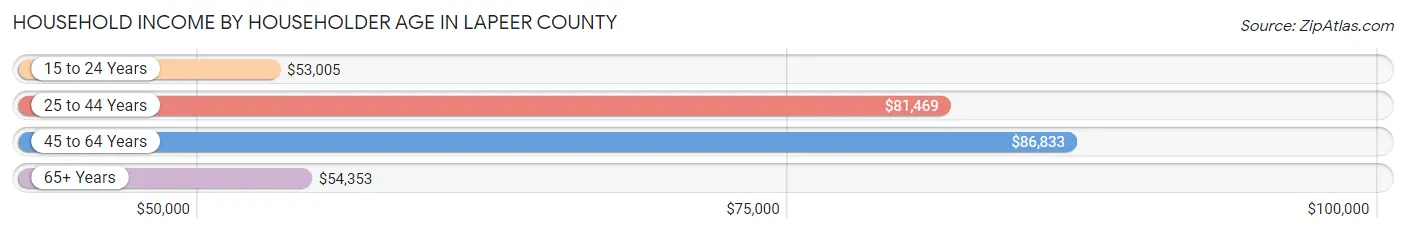
Household Income by Householder Age in Lapeer County
The median household income in Lapeer County is $75,402, with the highest median household income of $86,833 found in the 45 to 64 years age bracket for the primary householder. A total of 15,065 households (44.0%) fall into this category. Meanwhile, the 15 to 24 years age bracket for the primary householder has the lowest median household income of $53,005, with 604 households (1.8%) in this group.
| Income Bracket | # Households | Median Income |
| 15 to 24 Years | 604 (1.8%) | $53,005 |
| 25 to 44 Years | 8,520 (24.9%) | $81,469 |
| 45 to 64 Years | 15,065 (44.0%) | $86,833 |
| 65+ Years | 10,050 (29.3%) | $54,353 |
| Total | 34,239 (100.0%) | $75,402 |
Poverty in Lapeer County
Income Below Poverty by Sex and Age in Lapeer County
With 9.0% poverty level for males and 11.4% for females among the residents of Lapeer County, 5 year old males and 18 to 24 year old females are the most vulnerable to poverty, with 171 males (36.1%) and 580 females (17.9%) in their respective age groups living below the poverty level.

| Age Bracket | Male | Female |
| Under 5 Years | 371 (17.1%) | 256 (13.3%) |
| 5 Years | 171 (36.1%) | 77 (15.4%) |
| 6 to 11 Years | 448 (14.9%) | 334 (13.0%) |
| 12 to 14 Years | 257 (14.2%) | 174 (10.5%) |
| 15 Years | 88 (13.5%) | 58 (8.9%) |
| 16 and 17 Years | 75 (6.6%) | 83 (7.9%) |
| 18 to 24 Years | 220 (6.1%) | 580 (17.9%) |
| 25 to 34 Years | 439 (8.7%) | 781 (17.6%) |
| 35 to 44 Years | 405 (8.1%) | 627 (12.8%) |
| 45 to 54 Years | 425 (7.0%) | 535 (9.0%) |
| 55 to 64 Years | 608 (8.2%) | 558 (7.7%) |
| 65 to 74 Years | 340 (6.5%) | 464 (9.0%) |
| 75 Years and over | 132 (4.9%) | 326 (9.8%) |
| Total | 3,979 (9.0%) | 4,853 (11.4%) |
Income Above Poverty by Sex and Age in Lapeer County
According to the poverty statistics in Lapeer County, males aged 75 years and over and females aged 55 to 64 years are the age groups that are most secure financially, with 95.1% of males and 92.3% of females in these age groups living above the poverty line.
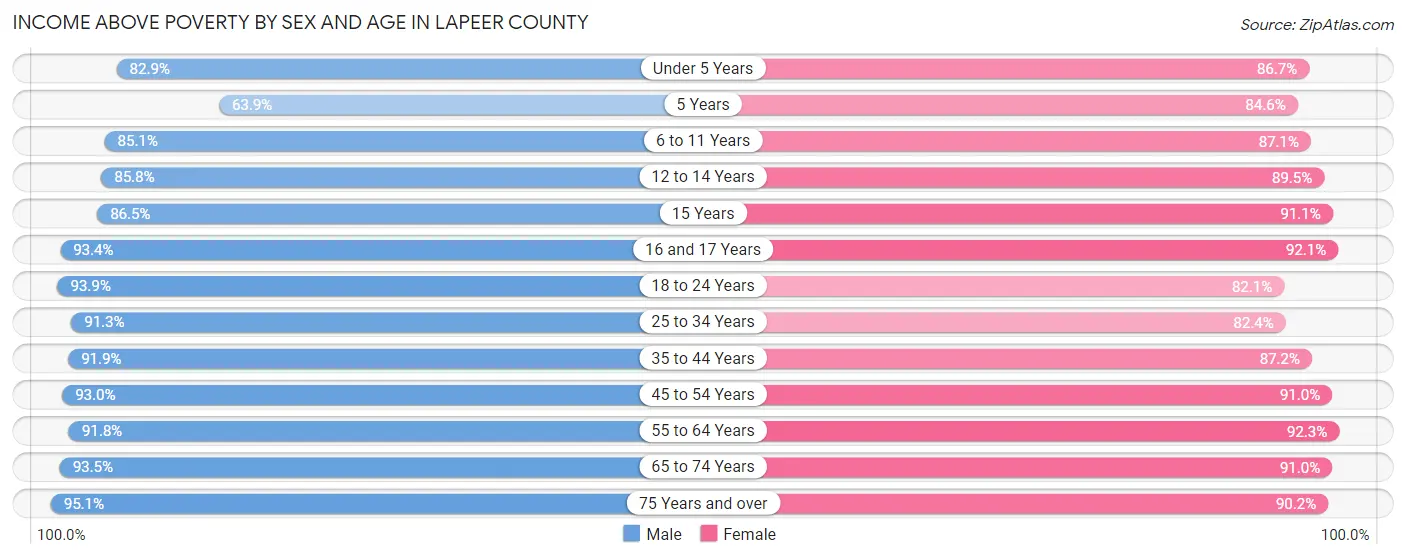
| Age Bracket | Male | Female |
| Under 5 Years | 1,800 (82.9%) | 1,671 (86.7%) |
| 5 Years | 303 (63.9%) | 423 (84.6%) |
| 6 to 11 Years | 2,566 (85.1%) | 2,246 (87.1%) |
| 12 to 14 Years | 1,546 (85.8%) | 1,484 (89.5%) |
| 15 Years | 565 (86.5%) | 593 (91.1%) |
| 16 and 17 Years | 1,059 (93.4%) | 967 (92.1%) |
| 18 to 24 Years | 3,381 (93.9%) | 2,654 (82.1%) |
| 25 to 34 Years | 4,618 (91.3%) | 3,650 (82.4%) |
| 35 to 44 Years | 4,593 (91.9%) | 4,282 (87.2%) |
| 45 to 54 Years | 5,656 (93.0%) | 5,405 (91.0%) |
| 55 to 64 Years | 6,780 (91.8%) | 6,683 (92.3%) |
| 65 to 74 Years | 4,870 (93.5%) | 4,681 (91.0%) |
| 75 Years and over | 2,577 (95.1%) | 3,015 (90.2%) |
| Total | 40,314 (91.0%) | 37,754 (88.6%) |
Income Below Poverty Among Married-Couple Families in Lapeer County
The poverty statistics for married-couple families in Lapeer County show that 3.8% or 767 of the total 20,055 families live below the poverty line. Families with 5 or more children have the highest poverty rate of 8.4%, comprising of 15 families. On the other hand, families with 1 or 2 children have the lowest poverty rate of 3.0%, which includes 156 families.
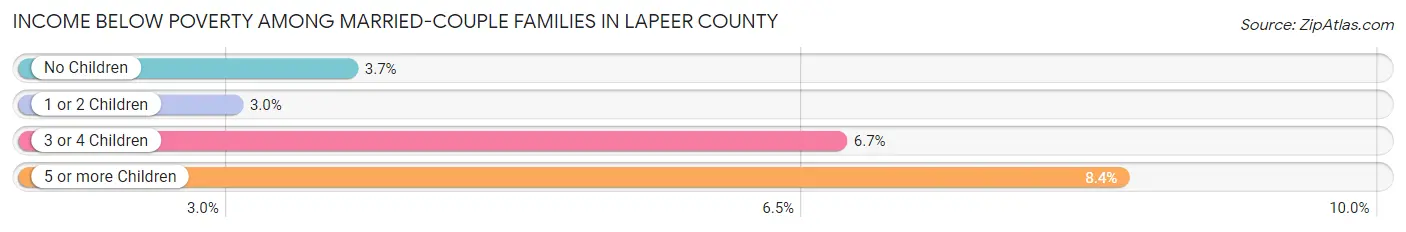
| Children | Above Poverty | Below Poverty |
| No Children | 12,678 (96.3%) | 491 (3.7%) |
| 1 or 2 Children | 4,988 (97.0%) | 156 (3.0%) |
| 3 or 4 Children | 1,459 (93.3%) | 105 (6.7%) |
| 5 or more Children | 163 (91.6%) | 15 (8.4%) |
| Total | 19,288 (96.2%) | 767 (3.8%) |
Income Below Poverty Among Single-Parent Households in Lapeer County
According to the poverty data in Lapeer County, 10.7% or 184 single-father households and 28.2% or 906 single-mother households are living below the poverty line. Among single-father households, those with 3 or 4 children have the highest poverty rate, with 33 households (46.5%) experiencing poverty. Likewise, among single-mother households, those with 5 or more children have the highest poverty rate, with 5 households (71.4%) falling below the poverty line.
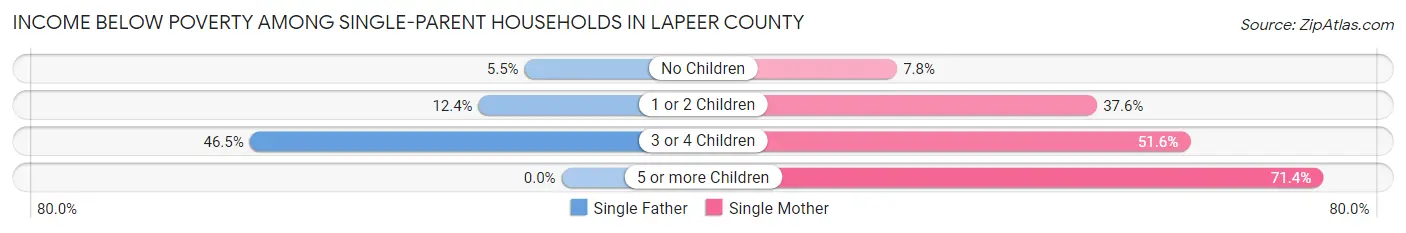
| Children | Single Father | Single Mother |
| No Children | 41 (5.5%) | 93 (7.8%) |
| 1 or 2 Children | 110 (12.4%) | 631 (37.6%) |
| 3 or 4 Children | 33 (46.5%) | 177 (51.6%) |
| 5 or more Children | 0 (0.0%) | 5 (71.4%) |
| Total | 184 (10.7%) | 906 (28.2%) |
Income Below Poverty Among Married-Couple vs Single-Parent Households in Lapeer County
The poverty data for Lapeer County shows that 767 of the married-couple family households (3.8%) and 1,090 of the single-parent households (22.1%) are living below the poverty level. Within the married-couple family households, those with 5 or more children have the highest poverty rate, with 15 households (8.4%) falling below the poverty line. Among the single-parent households, those with 3 or 4 children have the highest poverty rate, with 210 household (50.7%) living below poverty.
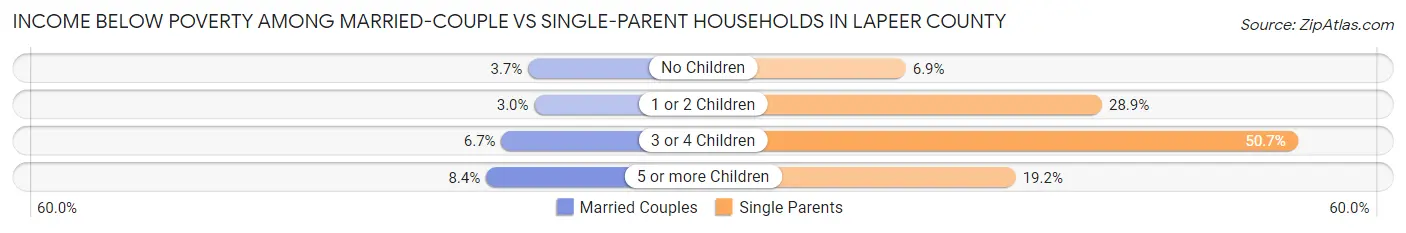
| Children | Married-Couple Families | Single-Parent Households |
| No Children | 491 (3.7%) | 134 (6.9%) |
| 1 or 2 Children | 156 (3.0%) | 741 (28.9%) |
| 3 or 4 Children | 105 (6.7%) | 210 (50.7%) |
| 5 or more Children | 15 (8.4%) | 5 (19.2%) |
| Total | 767 (3.8%) | 1,090 (22.1%) |
Employment Characteristics in Lapeer County
Employment by Class of Employer in Lapeer County
Among the 40,090 employed individuals in Lapeer County, private company employees (30,000 | 74.8%), not-for-profit organizations (2,760 | 6.9%), and self-employed (not incorporated) (2,448 | 6.1%) make up the most common classes of employment.
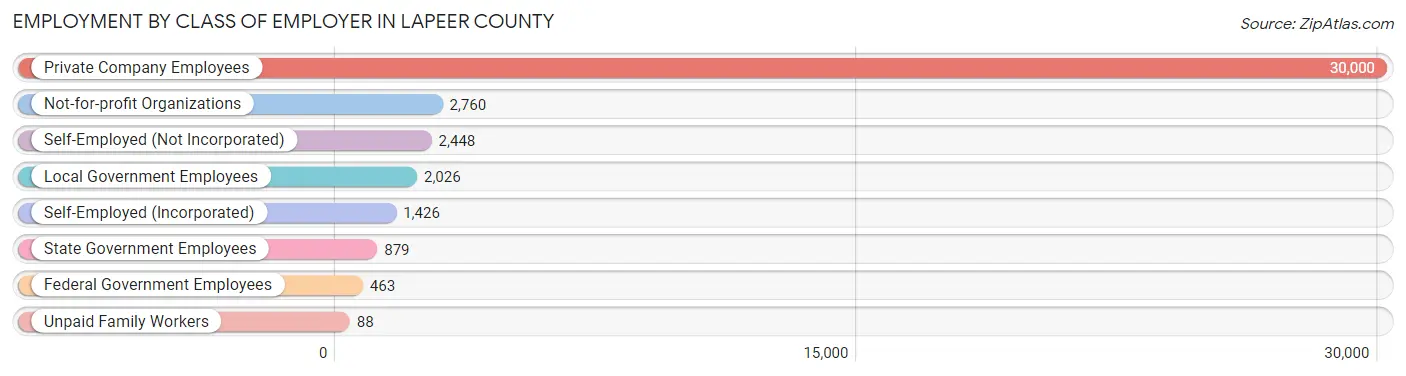
| Employer Class | # Employees | % Employees |
| Private Company Employees | 30,000 | 74.8% |
| Self-Employed (Incorporated) | 1,426 | 3.6% |
| Self-Employed (Not Incorporated) | 2,448 | 6.1% |
| Not-for-profit Organizations | 2,760 | 6.9% |
| Local Government Employees | 2,026 | 5.1% |
| State Government Employees | 879 | 2.2% |
| Federal Government Employees | 463 | 1.1% |
| Unpaid Family Workers | 88 | 0.2% |
| Total | 40,090 | 100.0% |
Employment Status by Age in Lapeer County
According to the labor force statistics for Lapeer County, out of the total population over 16 years of age (73,050), 59.2% or 43,246 individuals are in the labor force, with 5.3% or 2,292 of them unemployed. The age group with the highest labor force participation rate is 25 to 29 years, with 87.7% or 4,273 individuals in the labor force. Within the labor force, the 16 to 19 years age range has the highest percentage of unemployed individuals, with 14.9% or 278 of them being unemployed.
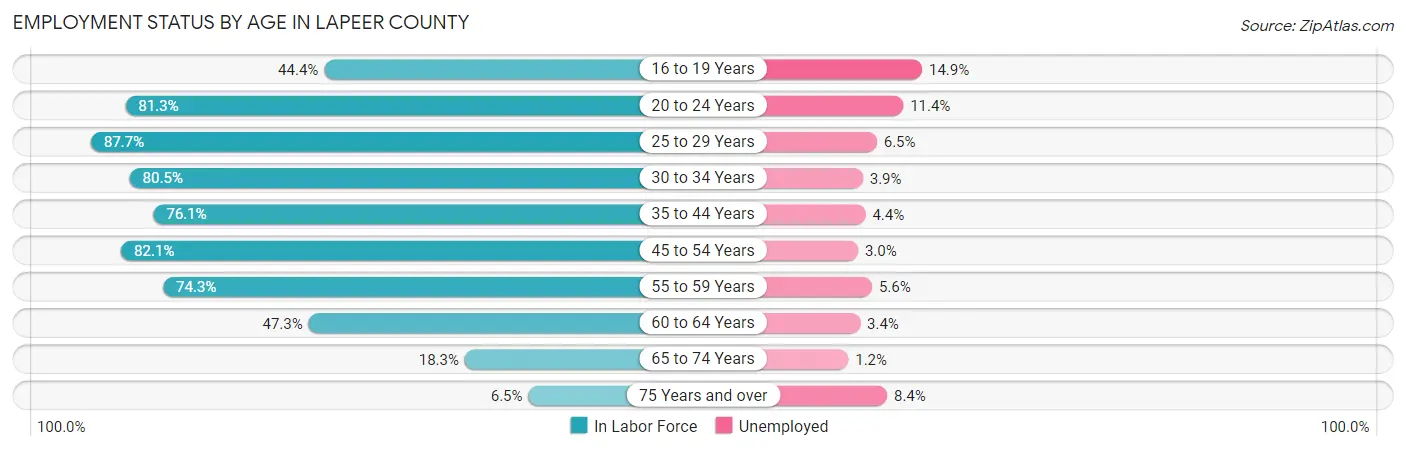
| Age Bracket | In Labor Force | Unemployed |
| 16 to 19 Years | 1,869 (44.4%) | 278 (14.9%) |
| 20 to 24 Years | 4,208 (81.3%) | 480 (11.4%) |
| 25 to 29 Years | 4,273 (87.7%) | 278 (6.5%) |
| 30 to 34 Years | 3,819 (80.5%) | 149 (3.9%) |
| 35 to 44 Years | 7,751 (76.1%) | 341 (4.4%) |
| 45 to 54 Years | 10,098 (82.1%) | 303 (3.0%) |
| 55 to 59 Years | 5,290 (74.3%) | 296 (5.6%) |
| 60 to 64 Years | 3,640 (47.3%) | 124 (3.4%) |
| 65 to 74 Years | 1,921 (18.3%) | 23 (1.2%) |
| 75 Years and over | 406 (6.5%) | 34 (8.4%) |
| Total | 43,246 (59.2%) | 2,292 (5.3%) |
Employment Status by Educational Attainment in Lapeer County
According to labor force statistics for Lapeer County, 74.3% of individuals (34,859) out of the total population between 25 and 64 years of age (46,916) are in the labor force, with 4.3% or 1,499 of them being unemployed. The group with the highest labor force participation rate are those with the educational attainment of bachelor's degree or higher, with 84.7% or 8,002 individuals in the labor force. Within the labor force, individuals with high school diploma education have the highest percentage of unemployment, with 4.8% or 523 of them being unemployed.
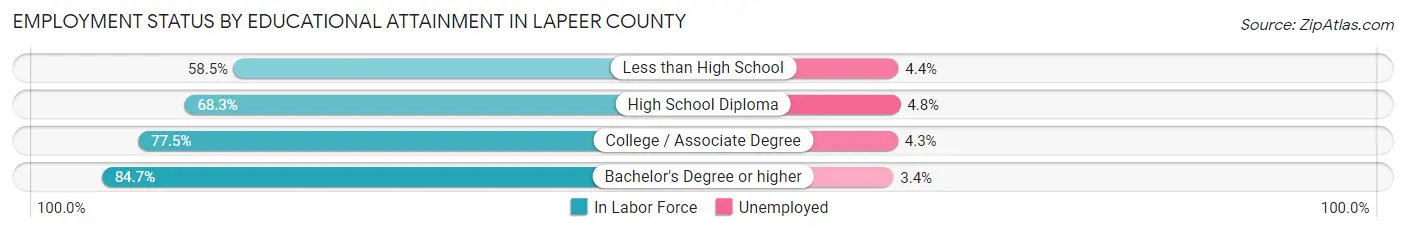
| Educational Attainment | In Labor Force | Unemployed |
| Less than High School | 2,166 (58.5%) | 163 (4.4%) |
| High School Diploma | 10,893 (68.3%) | 766 (4.8%) |
| College / Associate Degree | 13,808 (77.5%) | 766 (4.3%) |
| Bachelor's Degree or higher | 8,002 (84.7%) | 321 (3.4%) |
| Total | 34,859 (74.3%) | 2,017 (4.3%) |
Employment Occupations by Sex in Lapeer County
Management, Business, Science and Arts Occupations
The most common Management, Business, Science and Arts occupations in Lapeer County are Management (3,886 | 9.5%), Community & Social Service (3,297 | 8.1%), Computers, Engineering & Science (2,718 | 6.6%), Health Diagnosing & Treating (2,364 | 5.8%), and Education Instruction & Library (1,924 | 4.7%).
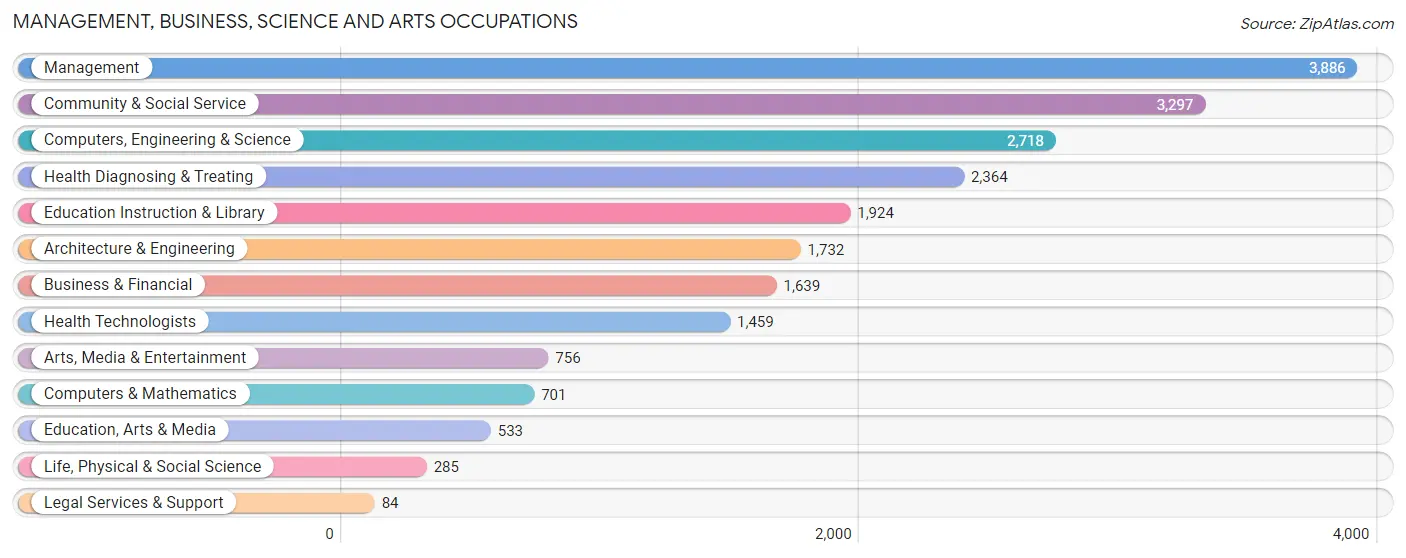
Management, Business, Science and Arts Occupations by Sex
Within the Management, Business, Science and Arts occupations in Lapeer County, the most male-oriented occupations are Architecture & Engineering (91.6%), Computers, Engineering & Science (85.0%), and Computers & Mathematics (80.9%), while the most female-oriented occupations are Health Diagnosing & Treating (85.7%), Health Technologists (84.0%), and Education Instruction & Library (76.8%).
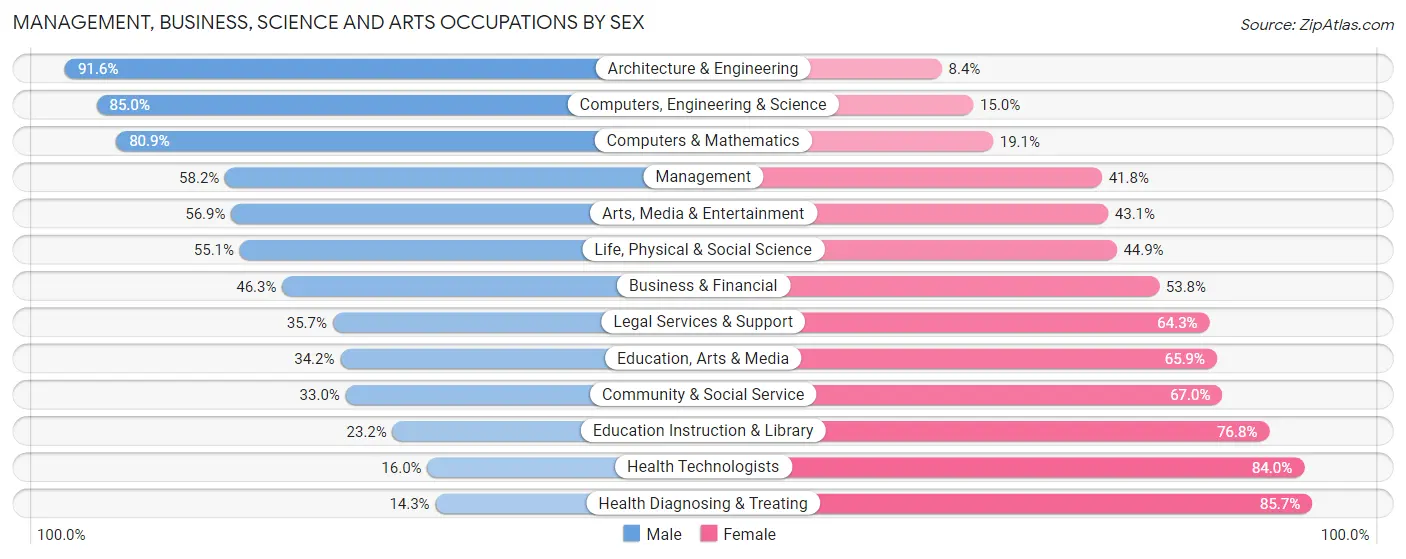
| Occupation | Male | Female |
| Management | 2,260 (58.2%) | 1,626 (41.8%) |
| Business & Financial | 758 (46.3%) | 881 (53.7%) |
| Computers, Engineering & Science | 2,310 (85.0%) | 408 (15.0%) |
| Computers & Mathematics | 567 (80.9%) | 134 (19.1%) |
| Architecture & Engineering | 1,586 (91.6%) | 146 (8.4%) |
| Life, Physical & Social Science | 157 (55.1%) | 128 (44.9%) |
| Community & Social Service | 1,089 (33.0%) | 2,208 (67.0%) |
| Education, Arts & Media | 182 (34.2%) | 351 (65.8%) |
| Legal Services & Support | 30 (35.7%) | 54 (64.3%) |
| Education Instruction & Library | 447 (23.2%) | 1,477 (76.8%) |
| Arts, Media & Entertainment | 430 (56.9%) | 326 (43.1%) |
| Health Diagnosing & Treating | 338 (14.3%) | 2,026 (85.7%) |
| Health Technologists | 233 (16.0%) | 1,226 (84.0%) |
| Total (Category) | 6,755 (48.6%) | 7,149 (51.4%) |
| Total (Overall) | 22,667 (55.3%) | 18,296 (44.7%) |
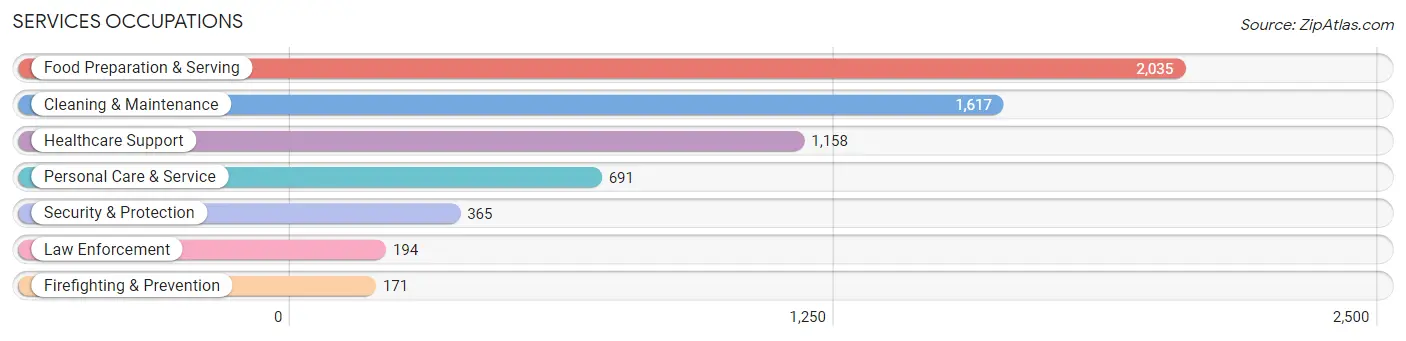
Services Occupations
The most common Services occupations in Lapeer County are Food Preparation & Serving (2,035 | 5.0%), Cleaning & Maintenance (1,617 | 4.0%), Healthcare Support (1,158 | 2.8%), Personal Care & Service (691 | 1.7%), and Security & Protection (365 | 0.9%).
Services Occupations by Sex
Within the Services occupations in Lapeer County, the most male-oriented occupations are Law Enforcement (93.3%), Security & Protection (80.8%), and Firefighting & Prevention (66.7%), while the most female-oriented occupations are Healthcare Support (89.4%), Personal Care & Service (81.6%), and Food Preparation & Serving (72.8%).
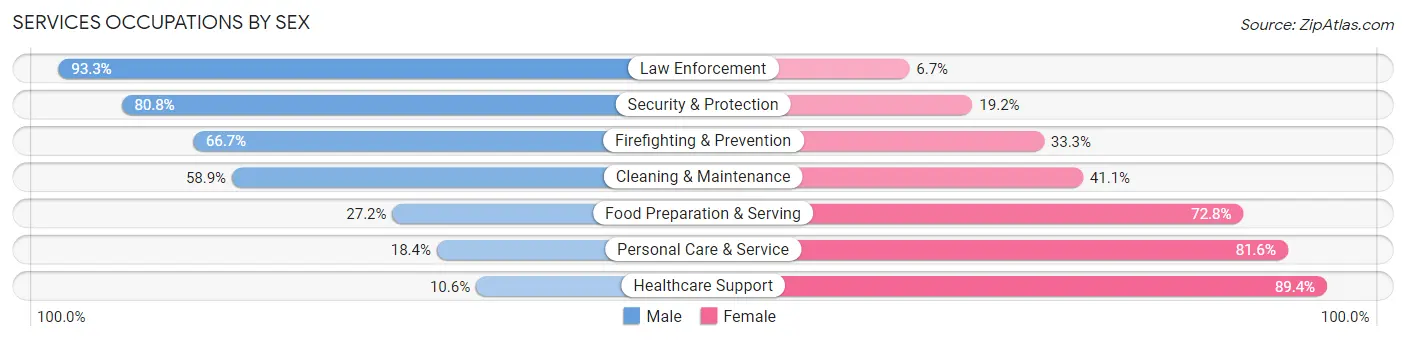
| Occupation | Male | Female |
| Healthcare Support | 123 (10.6%) | 1,035 (89.4%) |
| Security & Protection | 295 (80.8%) | 70 (19.2%) |
| Firefighting & Prevention | 114 (66.7%) | 57 (33.3%) |
| Law Enforcement | 181 (93.3%) | 13 (6.7%) |
| Food Preparation & Serving | 553 (27.2%) | 1,482 (72.8%) |
| Cleaning & Maintenance | 953 (58.9%) | 664 (41.1%) |
| Personal Care & Service | 127 (18.4%) | 564 (81.6%) |
| Total (Category) | 2,051 (35.0%) | 3,815 (65.0%) |
| Total (Overall) | 22,667 (55.3%) | 18,296 (44.7%) |
Sales and Office Occupations
The most common Sales and Office occupations in Lapeer County are Office & Administration (3,758 | 9.2%), and Sales & Related (3,623 | 8.8%).

Sales and Office Occupations by Sex
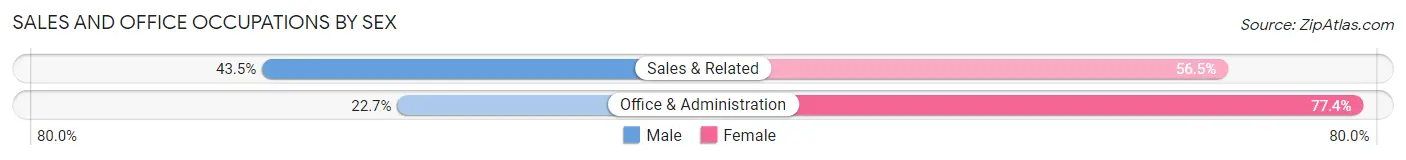
| Occupation | Male | Female |
| Sales & Related | 1,575 (43.5%) | 2,048 (56.5%) |
| Office & Administration | 851 (22.7%) | 2,907 (77.3%) |
| Total (Category) | 2,426 (32.9%) | 4,955 (67.1%) |
| Total (Overall) | 22,667 (55.3%) | 18,296 (44.7%) |
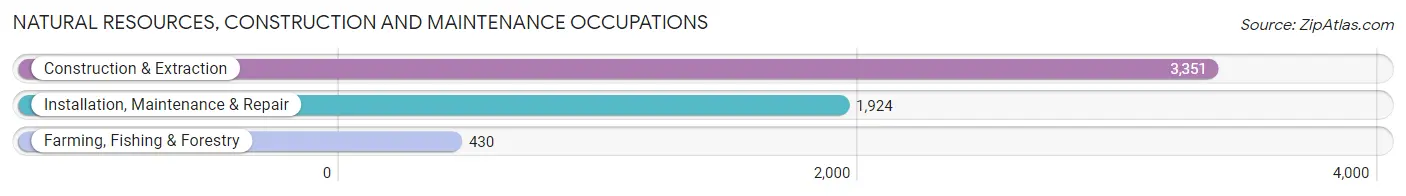
Natural Resources, Construction and Maintenance Occupations
The most common Natural Resources, Construction and Maintenance occupations in Lapeer County are Construction & Extraction (3,351 | 8.2%), Installation, Maintenance & Repair (1,924 | 4.7%), and Farming, Fishing & Forestry (430 | 1.1%).
Natural Resources, Construction and Maintenance Occupations by Sex
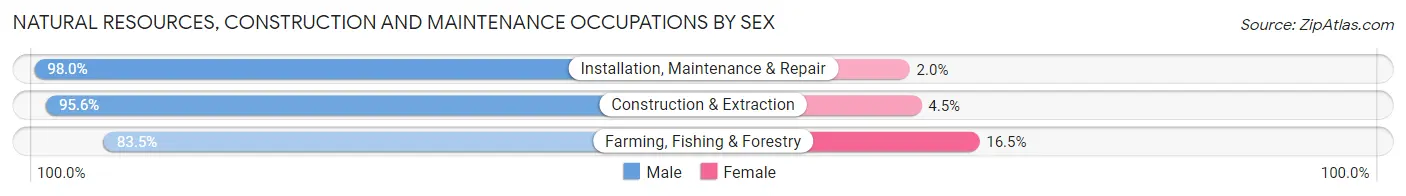
| Occupation | Male | Female |
| Farming, Fishing & Forestry | 359 (83.5%) | 71 (16.5%) |
| Construction & Extraction | 3,202 (95.6%) | 149 (4.4%) |
| Installation, Maintenance & Repair | 1,885 (98.0%) | 39 (2.0%) |
| Total (Category) | 5,446 (95.5%) | 259 (4.5%) |
| Total (Overall) | 22,667 (55.3%) | 18,296 (44.7%) |
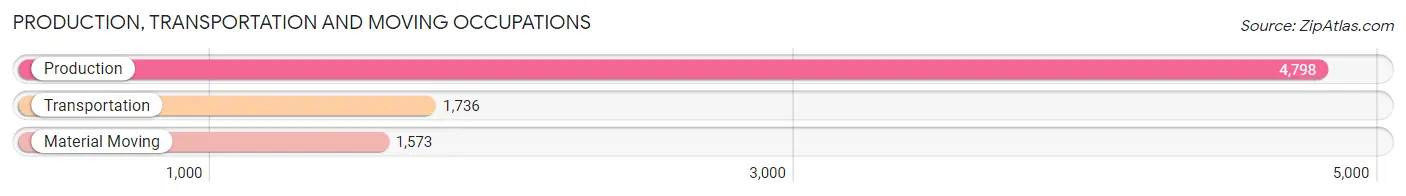
Production, Transportation and Moving Occupations
The most common Production, Transportation and Moving occupations in Lapeer County are Production (4,798 | 11.7%), Transportation (1,736 | 4.2%), and Material Moving (1,573 | 3.8%).
Production, Transportation and Moving Occupations by Sex
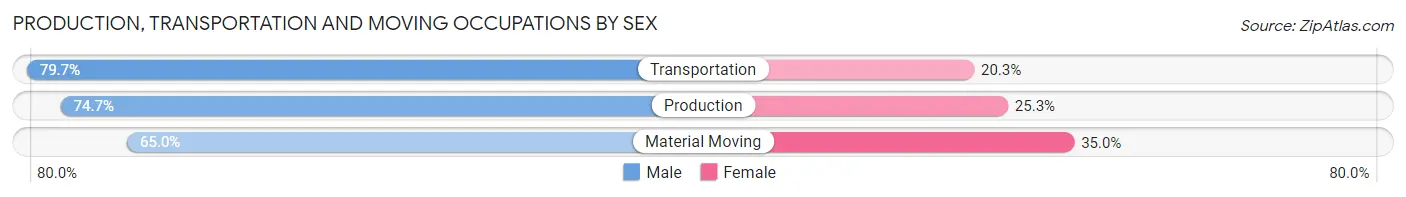
| Occupation | Male | Female |
| Production | 3,584 (74.7%) | 1,214 (25.3%) |
| Transportation | 1,383 (79.7%) | 353 (20.3%) |
| Material Moving | 1,022 (65.0%) | 551 (35.0%) |
| Total (Category) | 5,989 (73.9%) | 2,118 (26.1%) |
| Total (Overall) | 22,667 (55.3%) | 18,296 (44.7%) |
Employment Industries by Sex in Lapeer County
Employment Industries in Lapeer County
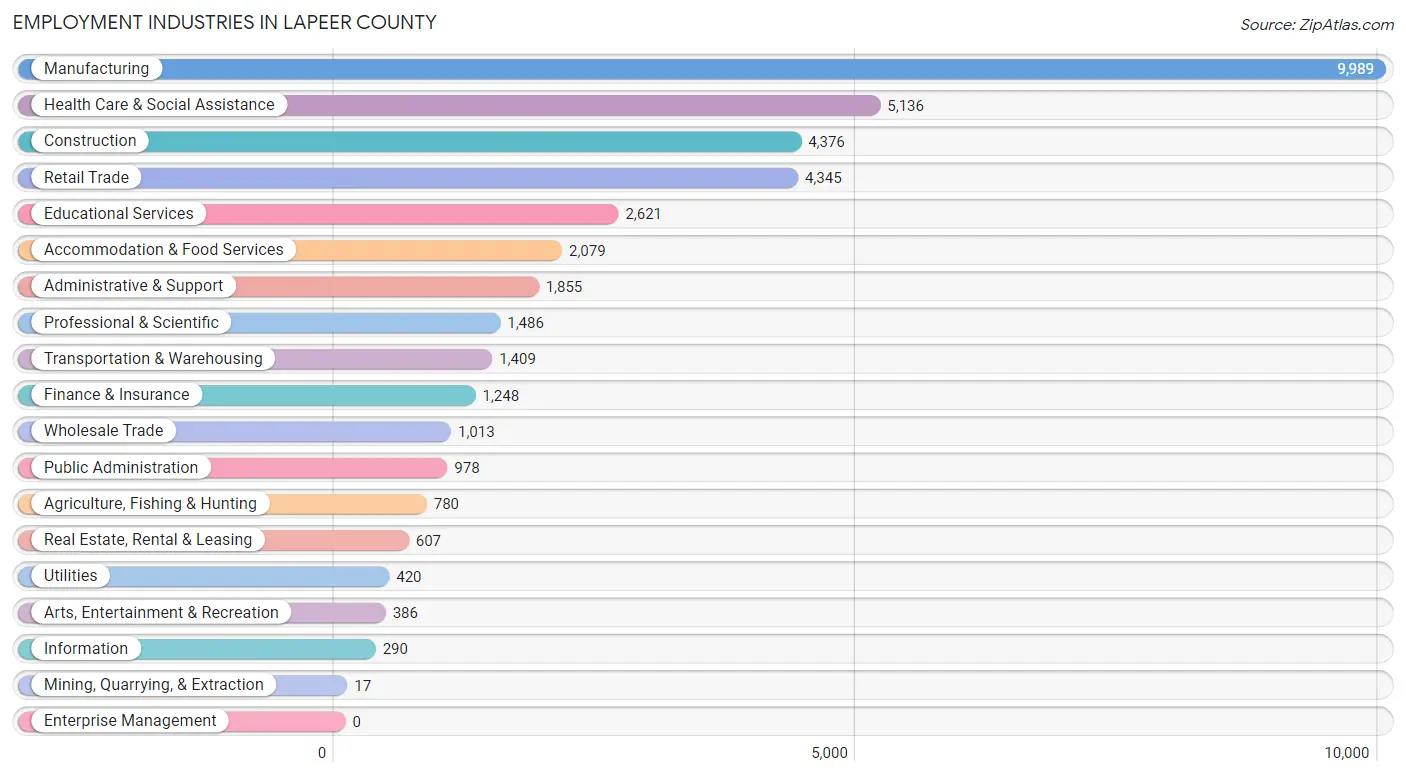
The major employment industries in Lapeer County include Manufacturing (9,989 | 24.4%), Health Care & Social Assistance (5,136 | 12.5%), Construction (4,376 | 10.7%), Retail Trade (4,345 | 10.6%), and Educational Services (2,621 | 6.4%).
Employment Industries by Sex in Lapeer County
The Lapeer County industries that see more men than women are Mining, Quarrying, & Extraction (100.0%), Construction (89.5%), and Agriculture, Fishing & Hunting (80.4%), whereas the industries that tend to have a higher number of women are Health Care & Social Assistance (84.8%), Educational Services (73.8%), and Accommodation & Food Services (67.6%).
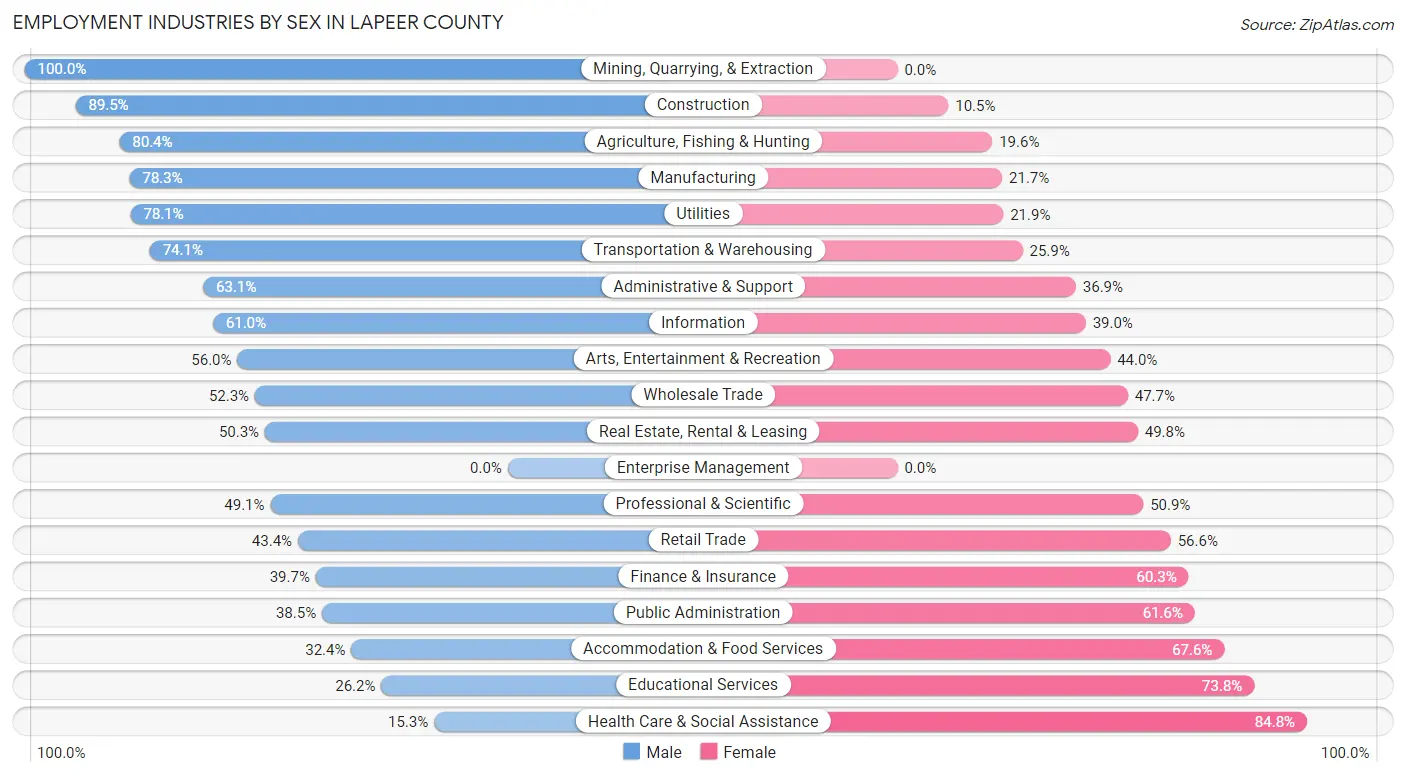
| Industry | Male | Female |
| Agriculture, Fishing & Hunting | 627 (80.4%) | 153 (19.6%) |
| Mining, Quarrying, & Extraction | 17 (100.0%) | 0 (0.0%) |
| Construction | 3,915 (89.5%) | 461 (10.5%) |
| Manufacturing | 7,824 (78.3%) | 2,165 (21.7%) |
| Wholesale Trade | 530 (52.3%) | 483 (47.7%) |
| Retail Trade | 1,887 (43.4%) | 2,458 (56.6%) |
| Transportation & Warehousing | 1,044 (74.1%) | 365 (25.9%) |
| Utilities | 328 (78.1%) | 92 (21.9%) |
| Information | 177 (61.0%) | 113 (39.0%) |
| Finance & Insurance | 496 (39.7%) | 752 (60.3%) |
| Real Estate, Rental & Leasing | 305 (50.2%) | 302 (49.7%) |
| Professional & Scientific | 730 (49.1%) | 756 (50.9%) |
| Enterprise Management | 0 (0.0%) | 0 (0.0%) |
| Administrative & Support | 1,170 (63.1%) | 685 (36.9%) |
| Educational Services | 686 (26.2%) | 1,935 (73.8%) |
| Health Care & Social Assistance | 783 (15.2%) | 4,353 (84.8%) |
| Arts, Entertainment & Recreation | 216 (56.0%) | 170 (44.0%) |
| Accommodation & Food Services | 673 (32.4%) | 1,406 (67.6%) |
| Public Administration | 376 (38.5%) | 602 (61.6%) |
| Total | 22,667 (55.3%) | 18,296 (44.7%) |
Education in Lapeer County
School Enrollment in Lapeer County
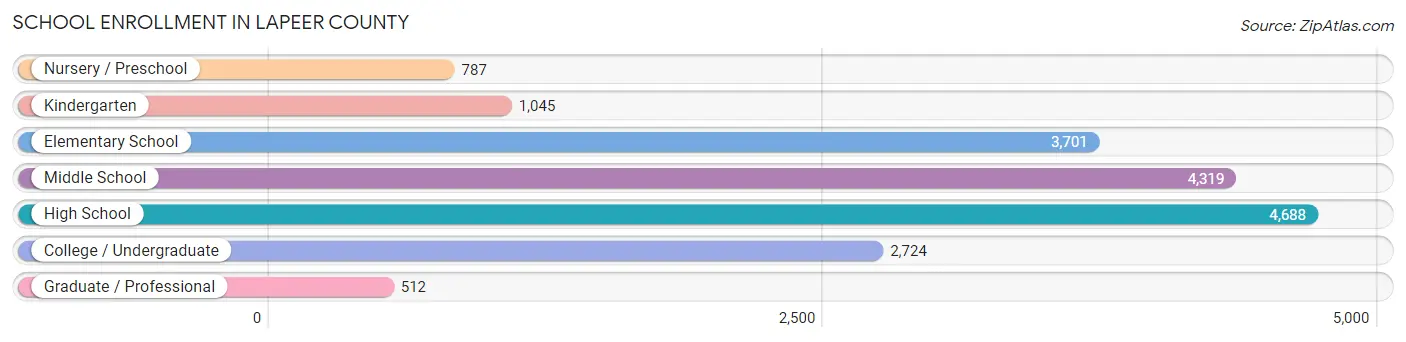
The most common levels of schooling among the 17,776 students in Lapeer County are high school (4,688 | 26.4%), middle school (4,319 | 24.3%), and elementary school (3,701 | 20.8%).
| School Level | # Students | % Students |
| Nursery / Preschool | 787 | 4.4% |
| Kindergarten | 1,045 | 5.9% |
| Elementary School | 3,701 | 20.8% |
| Middle School | 4,319 | 24.3% |
| High School | 4,688 | 26.4% |
| College / Undergraduate | 2,724 | 15.3% |
| Graduate / Professional | 512 | 2.9% |
| Total | 17,776 | 100.0% |
School Enrollment by Age by Funding Source in Lapeer County
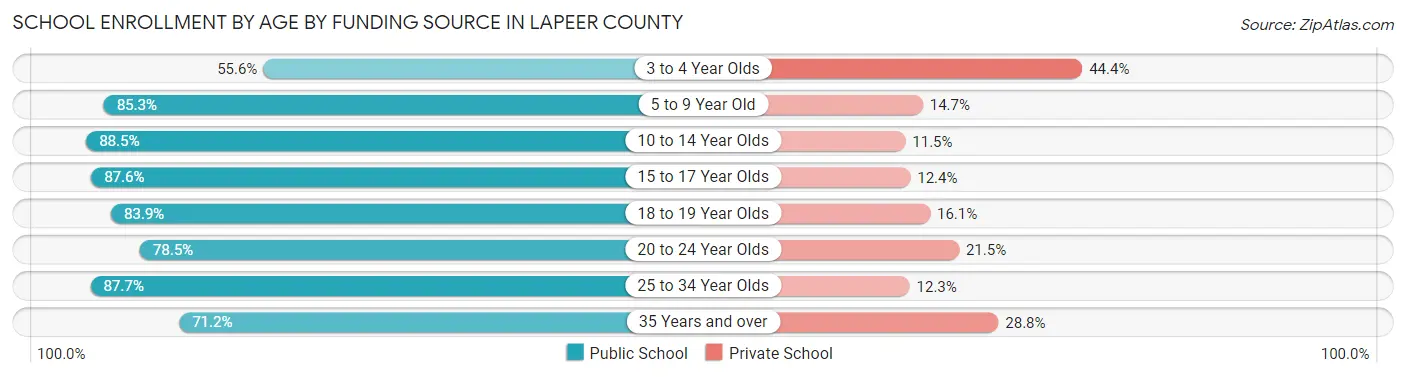
Out of a total of 17,776 students who are enrolled in schools in Lapeer County, 2,720 (15.3%) attend a private institution, while the remaining 15,056 (84.7%) are enrolled in public schools. The age group of 3 to 4 year olds has the highest likelihood of being enrolled in private schools, with 252 (44.4% in the age bracket) enrolled. Conversely, the age group of 10 to 14 year olds has the lowest likelihood of being enrolled in a private school, with 4,782 (88.5% in the age bracket) attending a public institution.
| Age Bracket | Public School | Private School |
| 3 to 4 Year Olds | 315 (55.6%) | 252 (44.4%) |
| 5 to 9 Year Old | 3,818 (85.3%) | 660 (14.7%) |
| 10 to 14 Year Olds | 4,782 (88.5%) | 621 (11.5%) |
| 15 to 17 Year Olds | 3,020 (87.6%) | 428 (12.4%) |
| 18 to 19 Year Olds | 1,043 (83.9%) | 200 (16.1%) |
| 20 to 24 Year Olds | 1,064 (78.5%) | 291 (21.5%) |
| 25 to 34 Year Olds | 543 (87.7%) | 76 (12.3%) |
| 35 Years and over | 472 (71.2%) | 191 (28.8%) |
| Total | 15,056 (84.7%) | 2,720 (15.3%) |
Educational Attainment by Field of Study in Lapeer County
Business (2,991 | 23.0%), education (2,457 | 18.9%), science & technology (1,796 | 13.8%), engineering (1,232 | 9.5%), and arts & humanities (841 | 6.5%) are the most common fields of study among 13,028 individuals in Lapeer County who have obtained a bachelor's degree or higher.
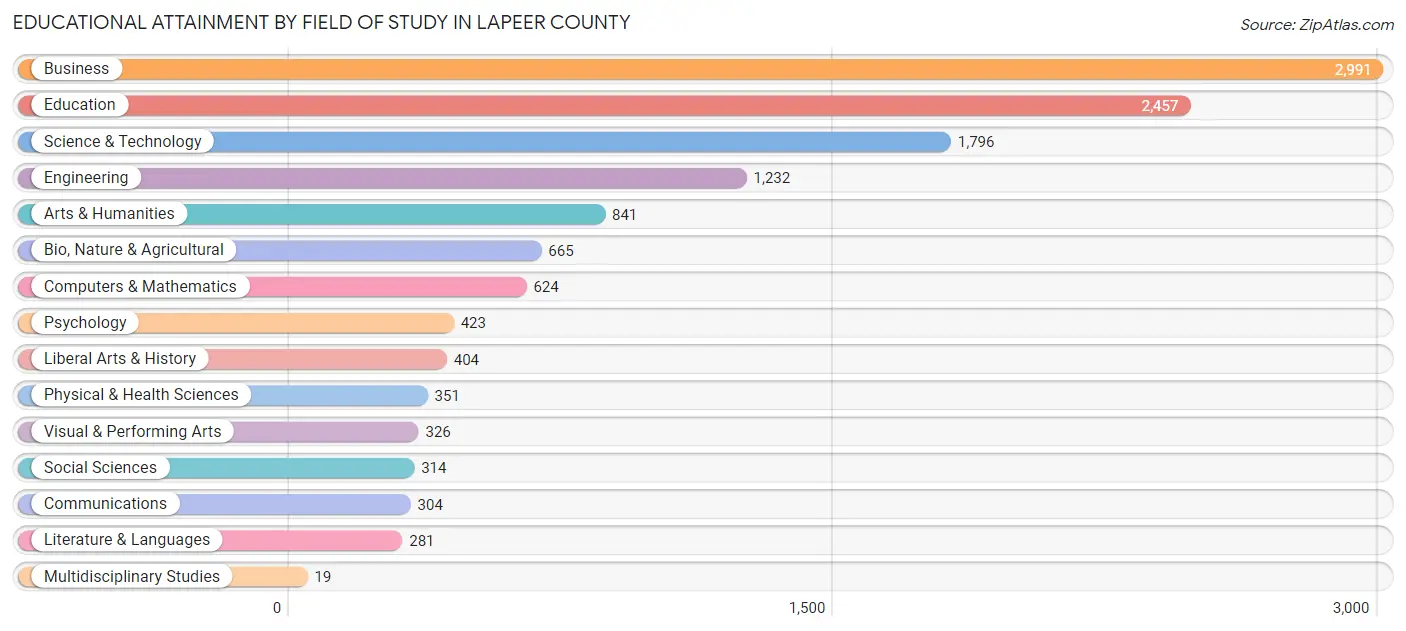
| Field of Study | # Graduates | % Graduates |
| Computers & Mathematics | 624 | 4.8% |
| Bio, Nature & Agricultural | 665 | 5.1% |
| Physical & Health Sciences | 351 | 2.7% |
| Psychology | 423 | 3.3% |
| Social Sciences | 314 | 2.4% |
| Engineering | 1,232 | 9.5% |
| Multidisciplinary Studies | 19 | 0.2% |
| Science & Technology | 1,796 | 13.8% |
| Business | 2,991 | 23.0% |
| Education | 2,457 | 18.9% |
| Literature & Languages | 281 | 2.2% |
| Liberal Arts & History | 404 | 3.1% |
| Visual & Performing Arts | 326 | 2.5% |
| Communications | 304 | 2.3% |
| Arts & Humanities | 841 | 6.5% |
| Total | 13,028 | 100.0% |
Transportation & Commute in Lapeer County
Vehicle Availability by Sex in Lapeer County
The most prevalent vehicle ownership categories in Lapeer County are males with 2 vehicles (7,990, accounting for 35.8%) and females with 2 vehicles (6,313, making up 45.1%).
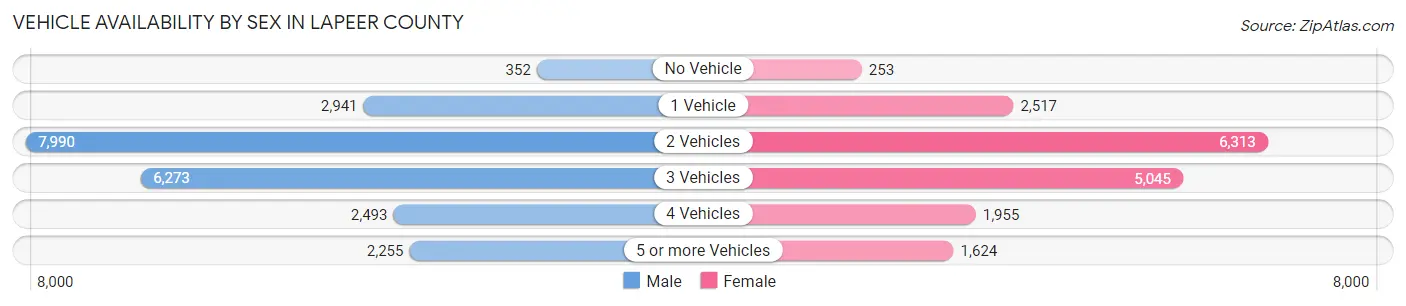
| Vehicles Available | Male | Female |
| No Vehicle | 352 (1.6%) | 253 (1.4%) |
| 1 Vehicle | 2,941 (13.2%) | 2,517 (14.2%) |
| 2 Vehicles | 7,990 (35.8%) | 6,313 (35.6%) |
| 3 Vehicles | 6,273 (28.1%) | 5,045 (28.5%) |
| 4 Vehicles | 2,493 (11.2%) | 1,955 (11.0%) |
| 5 or more Vehicles | 2,255 (10.1%) | 1,624 (9.2%) |
| Total | 22,304 (100.0%) | 17,707 (100.0%) |
Commute Time in Lapeer County
The most frequently occuring commute durations in Lapeer County are 45 to 59 minutes (5,764 commuters, 15.5%), 60 to 89 minutes (4,827 commuters, 13.0%), and 10 to 14 minutes (3,875 commuters, 10.4%).
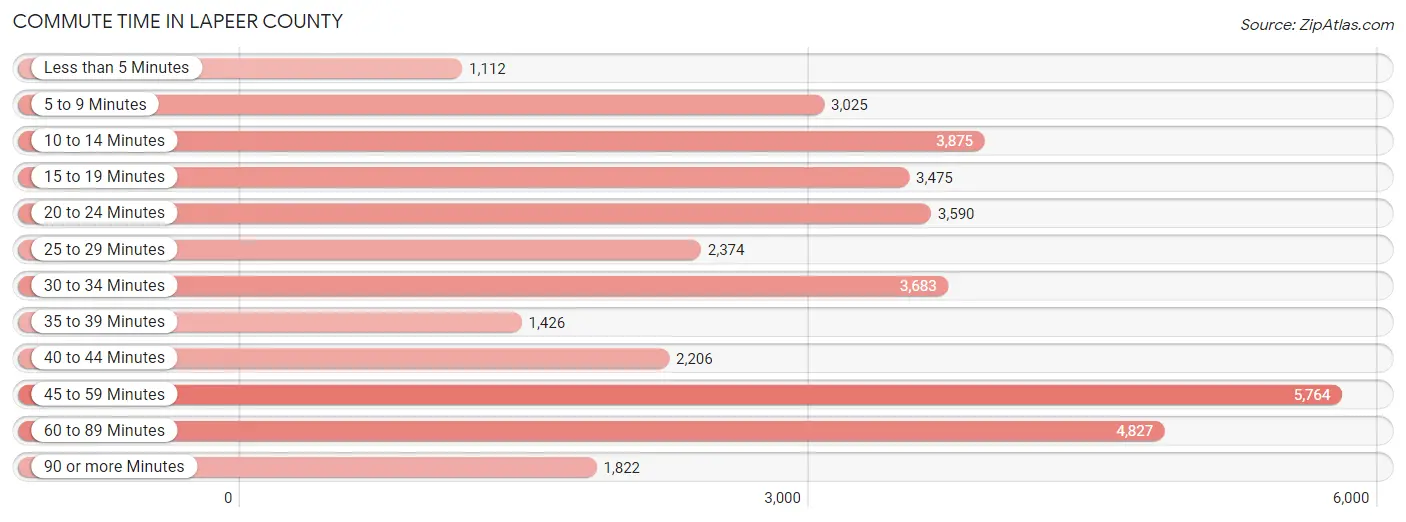
| Commute Time | # Commuters | % Commuters |
| Less than 5 Minutes | 1,112 | 3.0% |
| 5 to 9 Minutes | 3,025 | 8.1% |
| 10 to 14 Minutes | 3,875 | 10.4% |
| 15 to 19 Minutes | 3,475 | 9.3% |
| 20 to 24 Minutes | 3,590 | 9.7% |
| 25 to 29 Minutes | 2,374 | 6.4% |
| 30 to 34 Minutes | 3,683 | 9.9% |
| 35 to 39 Minutes | 1,426 | 3.8% |
| 40 to 44 Minutes | 2,206 | 5.9% |
| 45 to 59 Minutes | 5,764 | 15.5% |
| 60 to 89 Minutes | 4,827 | 13.0% |
| 90 or more Minutes | 1,822 | 4.9% |
Commute Time by Sex in Lapeer County
The most common commute times in Lapeer County are 45 to 59 minutes (3,562 commuters, 17.0%) for males and 45 to 59 minutes (2,202 commuters, 13.6%) for females.
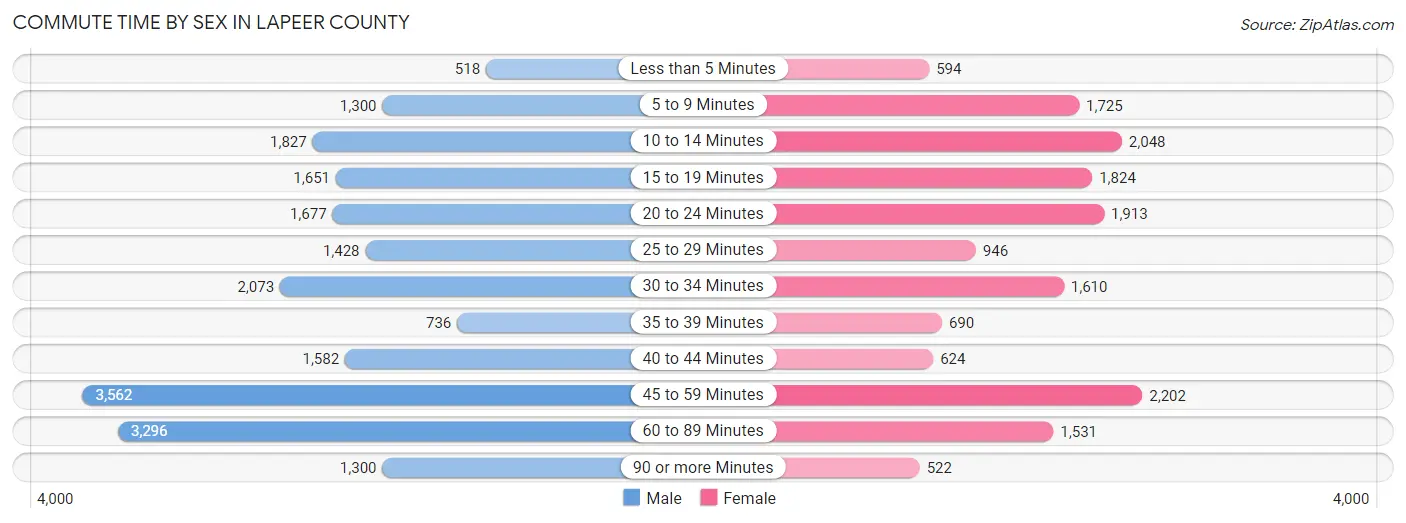
| Commute Time | Male | Female |
| Less than 5 Minutes | 518 (2.5%) | 594 (3.7%) |
| 5 to 9 Minutes | 1,300 (6.2%) | 1,725 (10.6%) |
| 10 to 14 Minutes | 1,827 (8.7%) | 2,048 (12.6%) |
| 15 to 19 Minutes | 1,651 (7.9%) | 1,824 (11.2%) |
| 20 to 24 Minutes | 1,677 (8.0%) | 1,913 (11.8%) |
| 25 to 29 Minutes | 1,428 (6.8%) | 946 (5.8%) |
| 30 to 34 Minutes | 2,073 (9.9%) | 1,610 (9.9%) |
| 35 to 39 Minutes | 736 (3.5%) | 690 (4.3%) |
| 40 to 44 Minutes | 1,582 (7.5%) | 624 (3.8%) |
| 45 to 59 Minutes | 3,562 (17.0%) | 2,202 (13.6%) |
| 60 to 89 Minutes | 3,296 (15.7%) | 1,531 (9.4%) |
| 90 or more Minutes | 1,300 (6.2%) | 522 (3.2%) |
Time of Departure to Work by Sex in Lapeer County
The most frequent times of departure to work in Lapeer County are 6:00 AM to 6:29 AM (2,693, 12.9%) for males and 7:30 AM to 7:59 AM (1,954, 12.0%) for females.
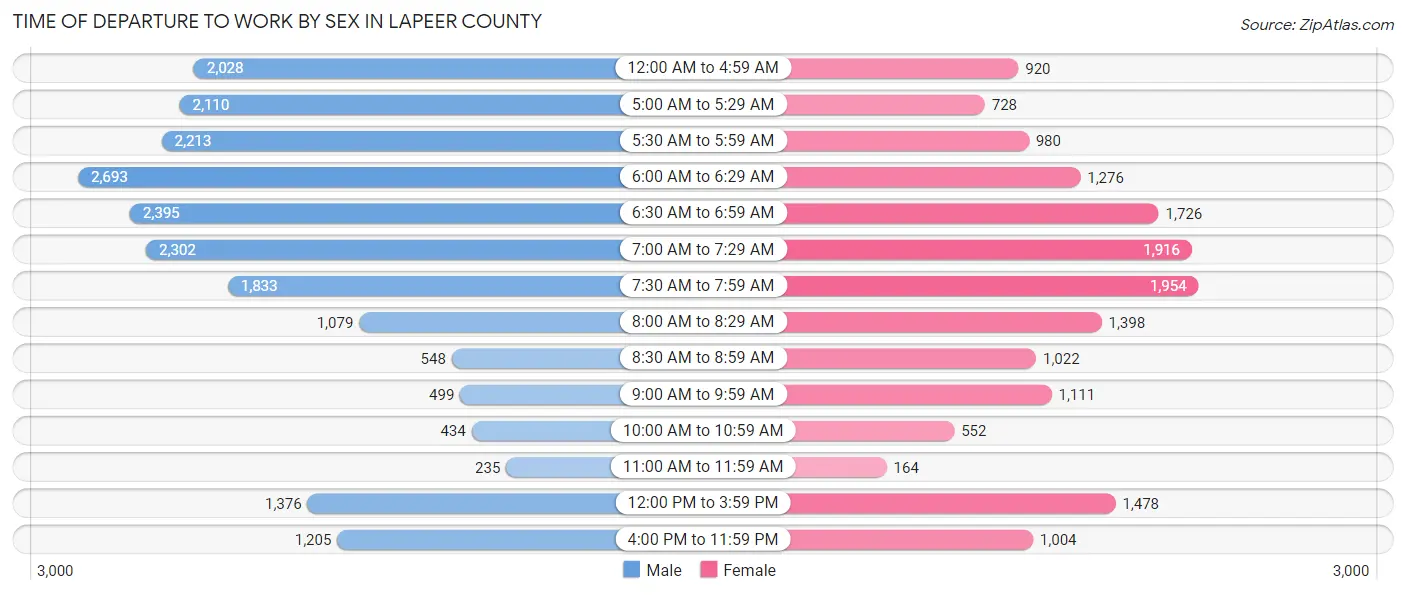
| Time of Departure | Male | Female |
| 12:00 AM to 4:59 AM | 2,028 (9.7%) | 920 (5.7%) |
| 5:00 AM to 5:29 AM | 2,110 (10.1%) | 728 (4.5%) |
| 5:30 AM to 5:59 AM | 2,213 (10.6%) | 980 (6.0%) |
| 6:00 AM to 6:29 AM | 2,693 (12.9%) | 1,276 (7.9%) |
| 6:30 AM to 6:59 AM | 2,395 (11.4%) | 1,726 (10.6%) |
| 7:00 AM to 7:29 AM | 2,302 (11.0%) | 1,916 (11.8%) |
| 7:30 AM to 7:59 AM | 1,833 (8.7%) | 1,954 (12.0%) |
| 8:00 AM to 8:29 AM | 1,079 (5.1%) | 1,398 (8.6%) |
| 8:30 AM to 8:59 AM | 548 (2.6%) | 1,022 (6.3%) |
| 9:00 AM to 9:59 AM | 499 (2.4%) | 1,111 (6.9%) |
| 10:00 AM to 10:59 AM | 434 (2.1%) | 552 (3.4%) |
| 11:00 AM to 11:59 AM | 235 (1.1%) | 164 (1.0%) |
| 12:00 PM to 3:59 PM | 1,376 (6.6%) | 1,478 (9.1%) |
| 4:00 PM to 11:59 PM | 1,205 (5.8%) | 1,004 (6.2%) |
| Total | 20,950 (100.0%) | 16,229 (100.0%) |
Housing Occupancy in Lapeer County
Occupancy by Ownership in Lapeer County
Of the total 34,239 dwellings in Lapeer County, owner-occupied units account for 29,288 (85.5%), while renter-occupied units make up 4,951 (14.5%).
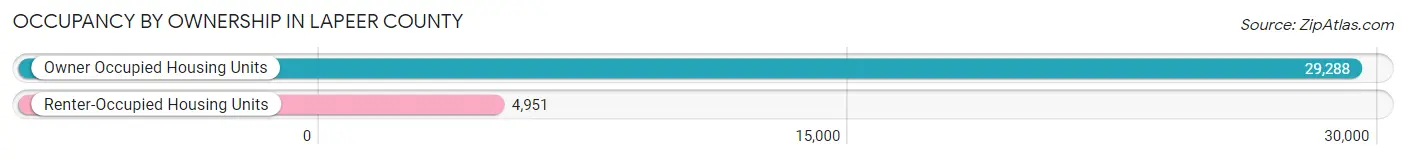
| Occupancy | # Housing Units | % Housing Units |
| Owner Occupied Housing Units | 29,288 | 85.5% |
| Renter-Occupied Housing Units | 4,951 | 14.5% |
| Total Occupied Housing Units | 34,239 | 100.0% |
Occupancy by Household Size in Lapeer County
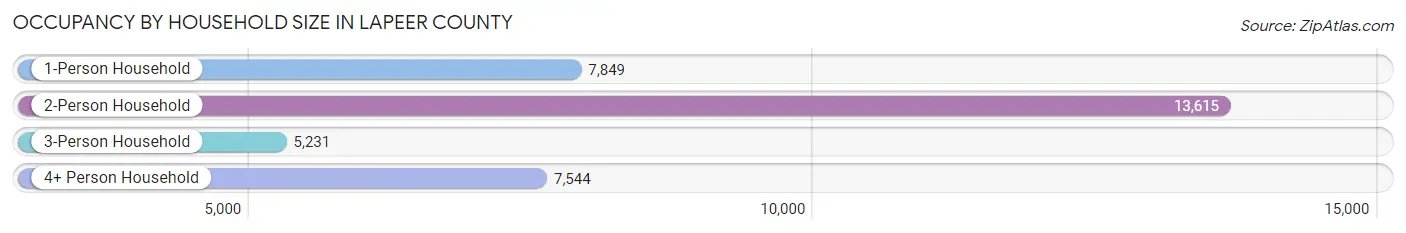
| Household Size | # Housing Units | % Housing Units |
| 1-Person Household | 7,849 | 22.9% |
| 2-Person Household | 13,615 | 39.8% |
| 3-Person Household | 5,231 | 15.3% |
| 4+ Person Household | 7,544 | 22.0% |
| Total Housing Units | 34,239 | 100.0% |
Occupancy by Ownership by Household Size in Lapeer County
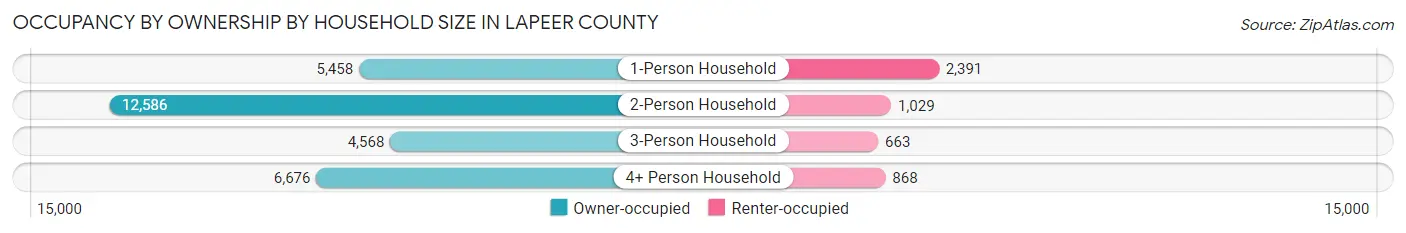
| Household Size | Owner-occupied | Renter-occupied |
| 1-Person Household | 5,458 (69.5%) | 2,391 (30.5%) |
| 2-Person Household | 12,586 (92.4%) | 1,029 (7.6%) |
| 3-Person Household | 4,568 (87.3%) | 663 (12.7%) |
| 4+ Person Household | 6,676 (88.5%) | 868 (11.5%) |
| Total Housing Units | 29,288 (85.5%) | 4,951 (14.5%) |
Occupancy by Educational Attainment in Lapeer County
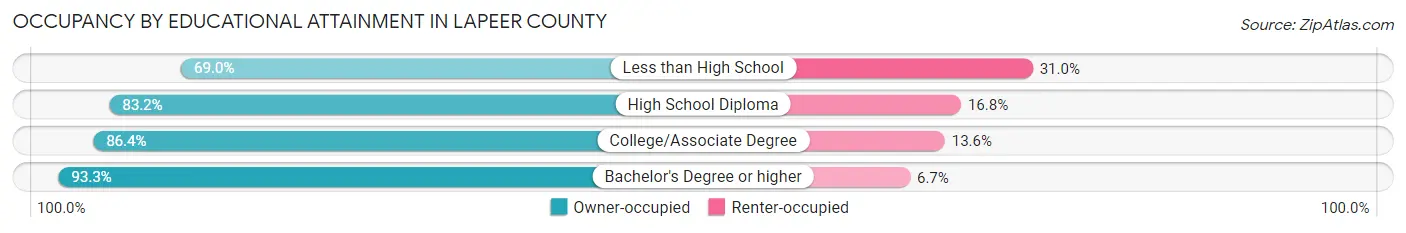
| Household Size | Owner-occupied | Renter-occupied |
| Less than High School | 1,606 (69.0%) | 723 (31.0%) |
| High School Diploma | 9,711 (83.2%) | 1,962 (16.8%) |
| College/Associate Degree | 11,366 (86.4%) | 1,791 (13.6%) |
| Bachelor's Degree or higher | 6,605 (93.3%) | 475 (6.7%) |
Occupancy by Age of Householder in Lapeer County
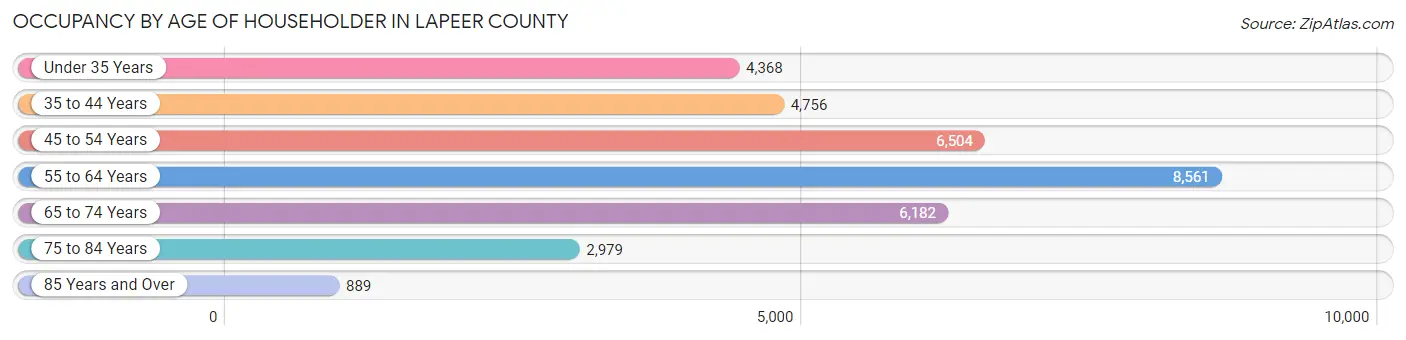
| Age Bracket | # Households | % Households |
| Under 35 Years | 4,368 | 12.8% |
| 35 to 44 Years | 4,756 | 13.9% |
| 45 to 54 Years | 6,504 | 19.0% |
| 55 to 64 Years | 8,561 | 25.0% |
| 65 to 74 Years | 6,182 | 18.1% |
| 75 to 84 Years | 2,979 | 8.7% |
| 85 Years and Over | 889 | 2.6% |
| Total | 34,239 | 100.0% |
Housing Finances in Lapeer County
Median Income by Occupancy in Lapeer County
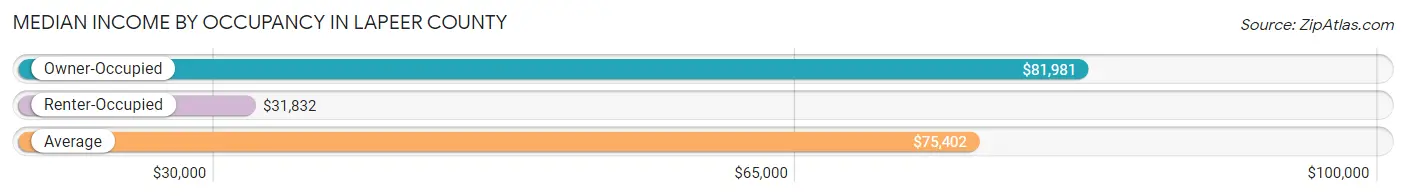
| Occupancy Type | # Households | Median Income |
| Owner-Occupied | 29,288 (85.5%) | $81,981 |
| Renter-Occupied | 4,951 (14.5%) | $31,832 |
| Average | 34,239 (100.0%) | $75,402 |
Occupancy by Householder Income Bracket in Lapeer County
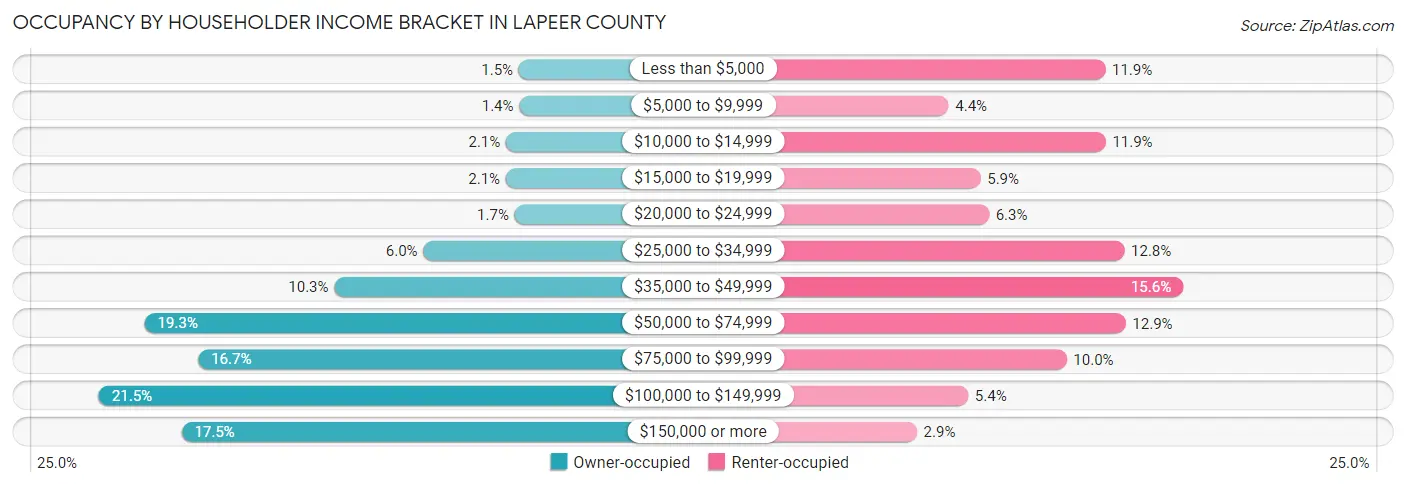
| Income Bracket | Owner-occupied | Renter-occupied |
| Less than $5,000 | 429 (1.5%) | 588 (11.9%) |
| $5,000 to $9,999 | 422 (1.4%) | 219 (4.4%) |
| $10,000 to $14,999 | 607 (2.1%) | 589 (11.9%) |
| $15,000 to $19,999 | 609 (2.1%) | 294 (5.9%) |
| $20,000 to $24,999 | 487 (1.7%) | 314 (6.3%) |
| $25,000 to $34,999 | 1,761 (6.0%) | 633 (12.8%) |
| $35,000 to $49,999 | 3,003 (10.2%) | 772 (15.6%) |
| $50,000 to $74,999 | 5,650 (19.3%) | 636 (12.9%) |
| $75,000 to $99,999 | 4,899 (16.7%) | 497 (10.0%) |
| $100,000 to $149,999 | 6,286 (21.5%) | 265 (5.3%) |
| $150,000 or more | 5,135 (17.5%) | 144 (2.9%) |
| Total | 29,288 (100.0%) | 4,951 (100.0%) |
Monthly Housing Cost Tiers in Lapeer County
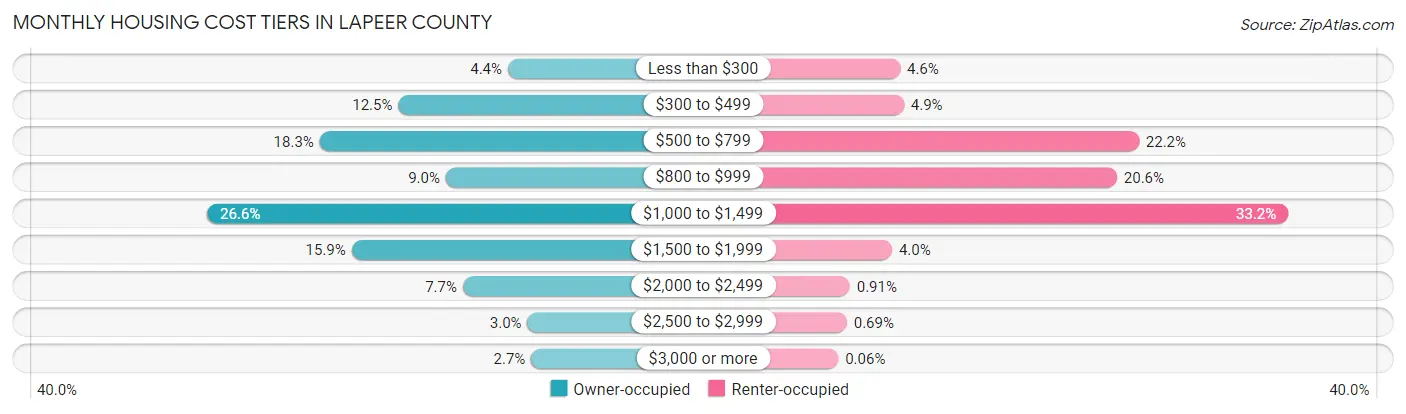
| Monthly Cost | Owner-occupied | Renter-occupied |
| Less than $300 | 1,291 (4.4%) | 228 (4.6%) |
| $300 to $499 | 3,655 (12.5%) | 242 (4.9%) |
| $500 to $799 | 5,350 (18.3%) | 1,099 (22.2%) |
| $800 to $999 | 2,630 (9.0%) | 1,019 (20.6%) |
| $1,000 to $1,499 | 7,779 (26.6%) | 1,643 (33.2%) |
| $1,500 to $1,999 | 4,662 (15.9%) | 199 (4.0%) |
| $2,000 to $2,499 | 2,263 (7.7%) | 45 (0.9%) |
| $2,500 to $2,999 | 869 (3.0%) | 34 (0.7%) |
| $3,000 or more | 789 (2.7%) | 3 (0.1%) |
| Total | 29,288 (100.0%) | 4,951 (100.0%) |
Physical Housing Characteristics in Lapeer County
Housing Structures in Lapeer County
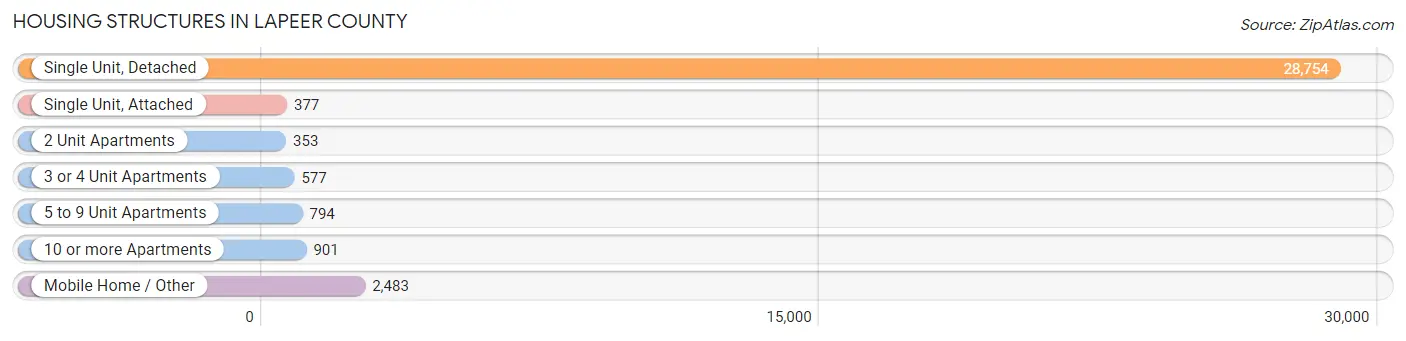
| Structure Type | # Housing Units | % Housing Units |
| Single Unit, Detached | 28,754 | 84.0% |
| Single Unit, Attached | 377 | 1.1% |
| 2 Unit Apartments | 353 | 1.0% |
| 3 or 4 Unit Apartments | 577 | 1.7% |
| 5 to 9 Unit Apartments | 794 | 2.3% |
| 10 or more Apartments | 901 | 2.6% |
| Mobile Home / Other | 2,483 | 7.2% |
| Total | 34,239 | 100.0% |
Housing Structures by Occupancy in Lapeer County
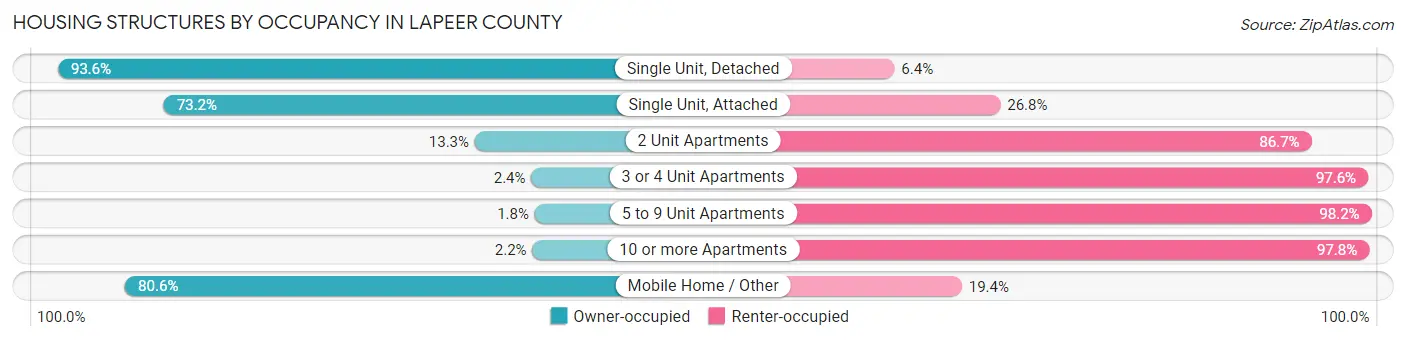
| Structure Type | Owner-occupied | Renter-occupied |
| Single Unit, Detached | 26,915 (93.6%) | 1,839 (6.4%) |
| Single Unit, Attached | 276 (73.2%) | 101 (26.8%) |
| 2 Unit Apartments | 47 (13.3%) | 306 (86.7%) |
| 3 or 4 Unit Apartments | 14 (2.4%) | 563 (97.6%) |
| 5 to 9 Unit Apartments | 14 (1.8%) | 780 (98.2%) |
| 10 or more Apartments | 20 (2.2%) | 881 (97.8%) |
| Mobile Home / Other | 2,002 (80.6%) | 481 (19.4%) |
| Total | 29,288 (85.5%) | 4,951 (14.5%) |
Housing Structures by Number of Rooms in Lapeer County
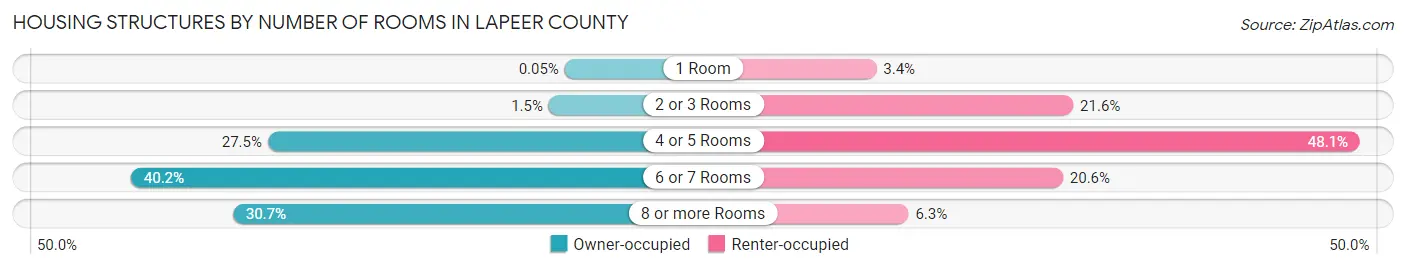
| Number of Rooms | Owner-occupied | Renter-occupied |
| 1 Room | 15 (0.1%) | 167 (3.4%) |
| 2 or 3 Rooms | 446 (1.5%) | 1,068 (21.6%) |
| 4 or 5 Rooms | 8,058 (27.5%) | 2,381 (48.1%) |
| 6 or 7 Rooms | 11,766 (40.2%) | 1,021 (20.6%) |
| 8 or more Rooms | 9,003 (30.7%) | 314 (6.3%) |
| Total | 29,288 (100.0%) | 4,951 (100.0%) |
Housing Structure by Heating Type in Lapeer County
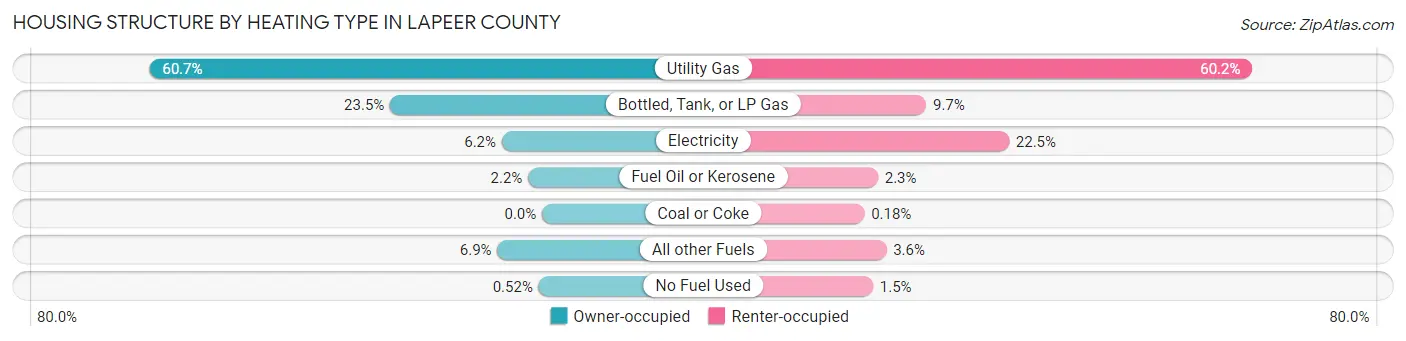
| Heating Type | Owner-occupied | Renter-occupied |
| Utility Gas | 17,785 (60.7%) | 2,979 (60.2%) |
| Bottled, Tank, or LP Gas | 6,880 (23.5%) | 482 (9.7%) |
| Electricity | 1,821 (6.2%) | 1,116 (22.5%) |
| Fuel Oil or Kerosene | 629 (2.1%) | 113 (2.3%) |
| Coal or Coke | 0 (0.0%) | 9 (0.2%) |
| All other Fuels | 2,021 (6.9%) | 177 (3.6%) |
| No Fuel Used | 152 (0.5%) | 75 (1.5%) |
| Total | 29,288 (100.0%) | 4,951 (100.0%) |
Household Vehicle Usage in Lapeer County
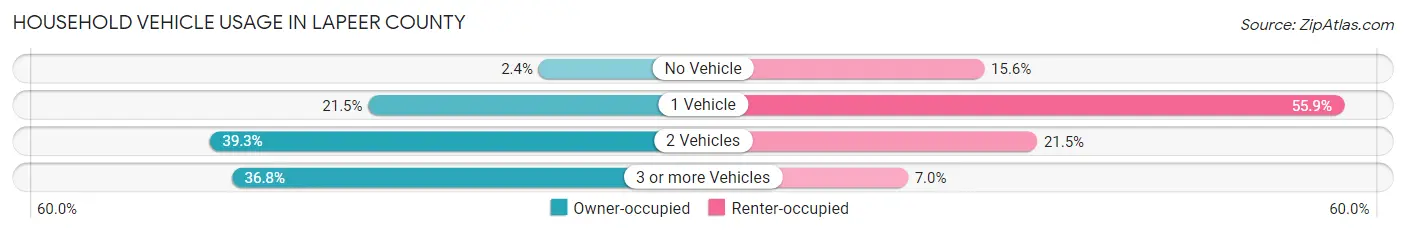
| Vehicles per Household | Owner-occupied | Renter-occupied |
| No Vehicle | 702 (2.4%) | 772 (15.6%) |
| 1 Vehicle | 6,293 (21.5%) | 2,766 (55.9%) |
| 2 Vehicles | 11,511 (39.3%) | 1,065 (21.5%) |
| 3 or more Vehicles | 10,782 (36.8%) | 348 (7.0%) |
| Total | 29,288 (100.0%) | 4,951 (100.0%) |
Real Estate & Mortgages in Lapeer County
Real Estate and Mortgage Overview in Lapeer County
| Characteristic | Without Mortgage | With Mortgage |
| Housing Units | 10,613 | 18,675 |
| Median Property Value | $202,700 | $227,000 |
| Median Household Income | $64,072 | $3,994 |
| Monthly Housing Costs | $528 | $779 |
| Real Estate Taxes | $2,028 | $1,421 |
Property Value by Mortgage Status in Lapeer County
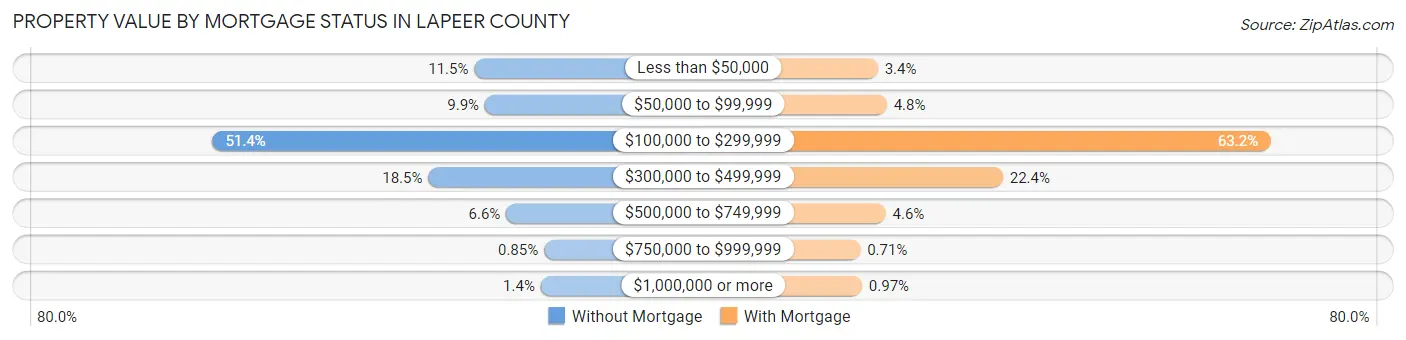
| Property Value | Without Mortgage | With Mortgage |
| Less than $50,000 | 1,218 (11.5%) | 632 (3.4%) |
| $50,000 to $99,999 | 1,045 (9.9%) | 887 (4.8%) |
| $100,000 to $299,999 | 5,452 (51.4%) | 11,794 (63.1%) |
| $300,000 to $499,999 | 1,962 (18.5%) | 4,191 (22.4%) |
| $500,000 to $749,999 | 703 (6.6%) | 856 (4.6%) |
| $750,000 to $999,999 | 90 (0.9%) | 133 (0.7%) |
| $1,000,000 or more | 143 (1.3%) | 182 (1.0%) |
| Total | 10,613 (100.0%) | 18,675 (100.0%) |
Household Income by Mortgage Status in Lapeer County
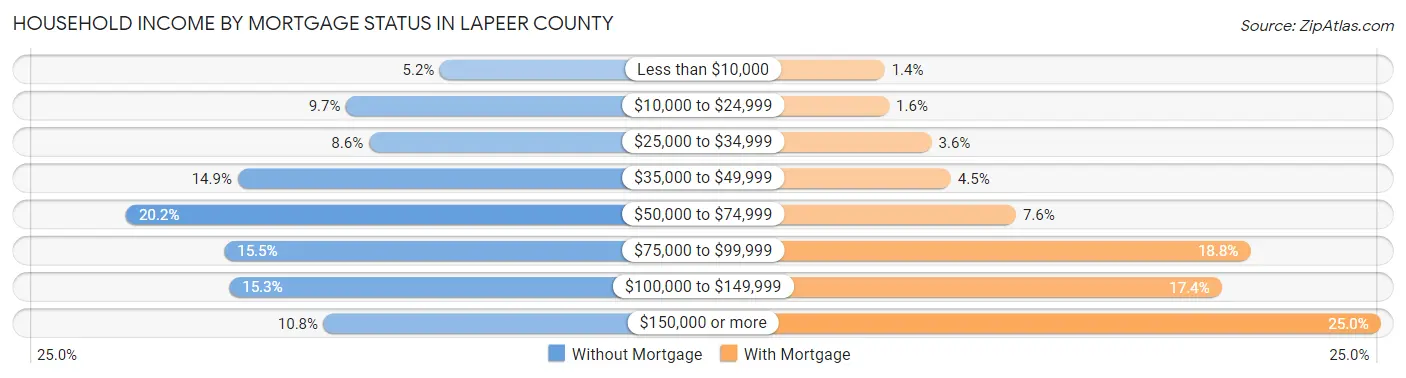
| Household Income | Without Mortgage | With Mortgage |
| Less than $10,000 | 553 (5.2%) | 259 (1.4%) |
| $10,000 to $24,999 | 1,027 (9.7%) | 298 (1.6%) |
| $25,000 to $34,999 | 913 (8.6%) | 676 (3.6%) |
| $35,000 to $49,999 | 1,576 (14.8%) | 848 (4.5%) |
| $50,000 to $74,999 | 2,141 (20.2%) | 1,427 (7.6%) |
| $75,000 to $99,999 | 1,644 (15.5%) | 3,509 (18.8%) |
| $100,000 to $149,999 | 1,618 (15.2%) | 3,255 (17.4%) |
| $150,000 or more | 1,141 (10.7%) | 4,668 (25.0%) |
| Total | 10,613 (100.0%) | 18,675 (100.0%) |
Property Value to Household Income Ratio in Lapeer County
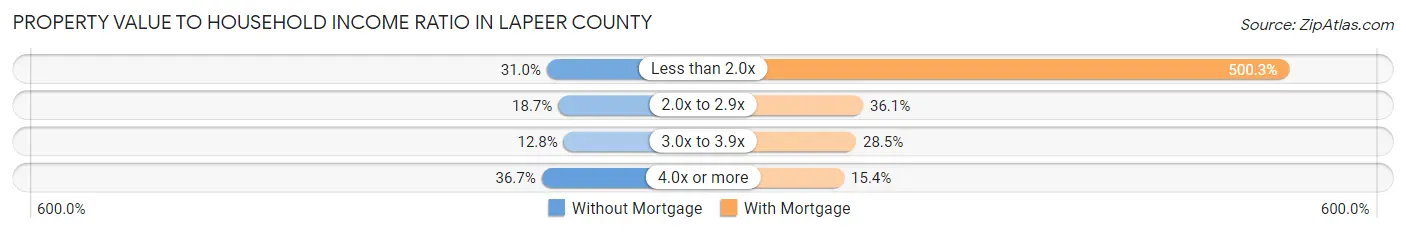
| Value-to-Income Ratio | Without Mortgage | With Mortgage |
| Less than 2.0x | 3,289 (31.0%) | 93,421 (500.3%) |
| 2.0x to 2.9x | 1,982 (18.7%) | 6,740 (36.1%) |
| 3.0x to 3.9x | 1,353 (12.8%) | 5,323 (28.5%) |
| 4.0x or more | 3,891 (36.7%) | 2,881 (15.4%) |
| Total | 10,613 (100.0%) | 18,675 (100.0%) |
Real Estate Taxes by Mortgage Status in Lapeer County
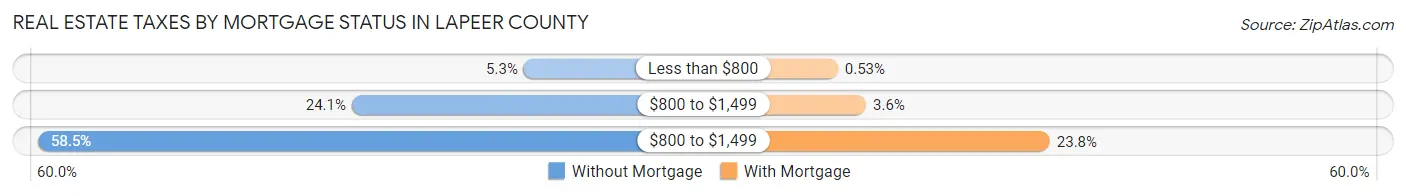
| Property Taxes | Without Mortgage | With Mortgage |
| Less than $800 | 562 (5.3%) | 99 (0.5%) |
| $800 to $1,499 | 2,562 (24.1%) | 676 (3.6%) |
| $800 to $1,499 | 6,213 (58.5%) | 4,437 (23.8%) |
| Total | 10,613 (100.0%) | 18,675 (100.0%) |
Health & Disability in Lapeer County
Health Insurance Coverage by Age in Lapeer County
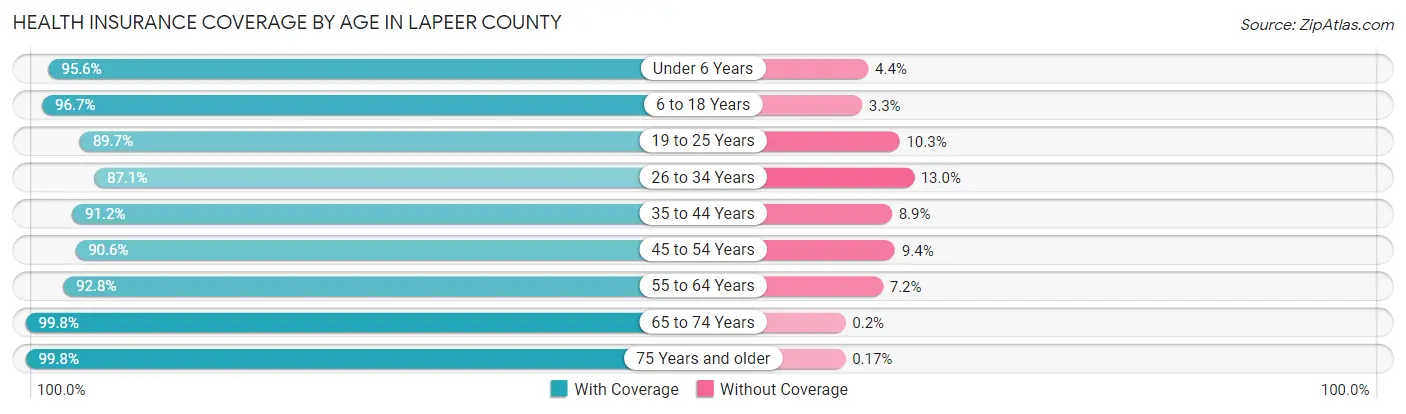
| Age Bracket | With Coverage | Without Coverage |
| Under 6 Years | 4,886 (95.6%) | 227 (4.4%) |
| 6 to 18 Years | 13,193 (96.7%) | 448 (3.3%) |
| 19 to 25 Years | 6,228 (89.7%) | 714 (10.3%) |
| 26 to 34 Years | 7,343 (87.1%) | 1,092 (13.0%) |
| 35 to 44 Years | 9,025 (91.1%) | 876 (8.8%) |
| 45 to 54 Years | 10,886 (90.6%) | 1,135 (9.4%) |
| 55 to 64 Years | 13,578 (92.8%) | 1,051 (7.2%) |
| 65 to 74 Years | 10,334 (99.8%) | 21 (0.2%) |
| 75 Years and older | 6,040 (99.8%) | 10 (0.2%) |
| Total | 81,513 (93.6%) | 5,574 (6.4%) |
Health Insurance Coverage by Citizenship Status in Lapeer County
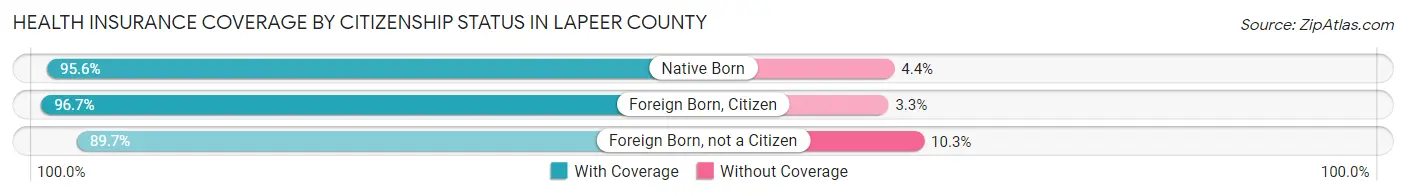
| Citizenship Status | With Coverage | Without Coverage |
| Native Born | 4,886 (95.6%) | 227 (4.4%) |
| Foreign Born, Citizen | 13,193 (96.7%) | 448 (3.3%) |
| Foreign Born, not a Citizen | 6,228 (89.7%) | 714 (10.3%) |
Health Insurance Coverage by Household Income in Lapeer County
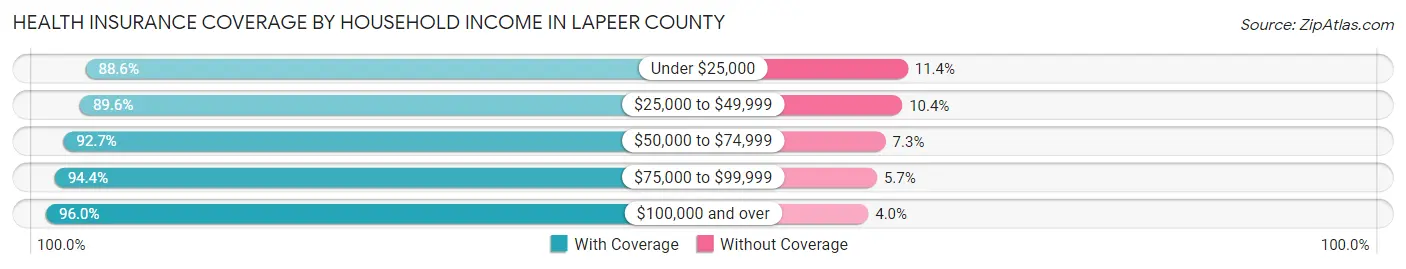
| Household Income | With Coverage | Without Coverage |
| Under $25,000 | 6,726 (88.6%) | 868 (11.4%) |
| $25,000 to $49,999 | 10,967 (89.6%) | 1,270 (10.4%) |
| $50,000 to $74,999 | 13,801 (92.7%) | 1,084 (7.3%) |
| $75,000 to $99,999 | 14,008 (94.4%) | 839 (5.7%) |
| $100,000 and over | 35,779 (96.0%) | 1,503 (4.0%) |
Public vs Private Health Insurance Coverage by Age in Lapeer County
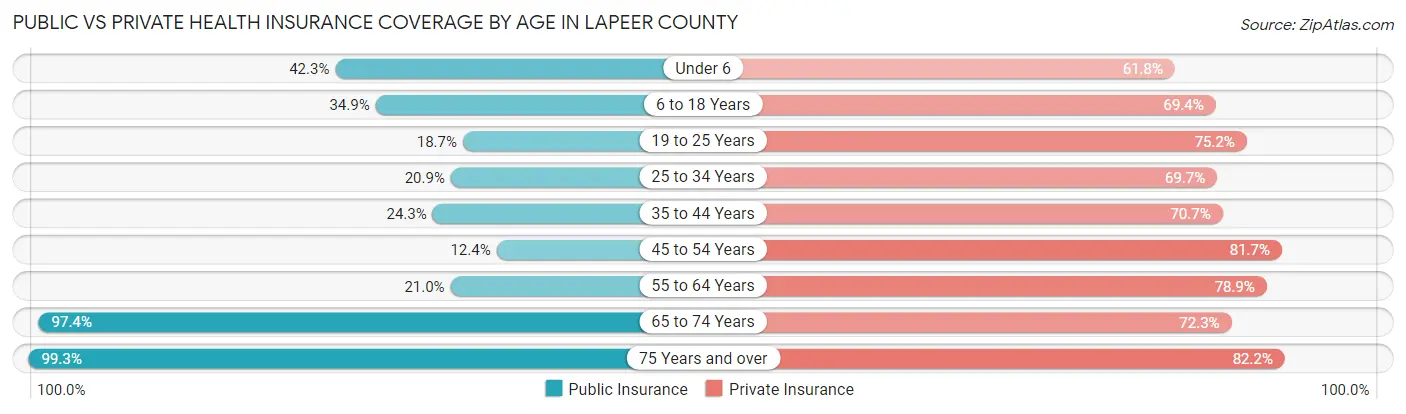
| Age Bracket | Public Insurance | Private Insurance |
| Under 6 | 2,165 (42.3%) | 3,160 (61.8%) |
| 6 to 18 Years | 4,757 (34.9%) | 9,464 (69.4%) |
| 19 to 25 Years | 1,296 (18.7%) | 5,217 (75.1%) |
| 25 to 34 Years | 1,763 (20.9%) | 5,876 (69.7%) |
| 35 to 44 Years | 2,404 (24.3%) | 6,995 (70.7%) |
| 45 to 54 Years | 1,492 (12.4%) | 9,817 (81.7%) |
| 55 to 64 Years | 3,066 (21.0%) | 11,537 (78.9%) |
| 65 to 74 Years | 10,085 (97.4%) | 7,488 (72.3%) |
| 75 Years and over | 6,006 (99.3%) | 4,974 (82.2%) |
| Total | 33,034 (37.9%) | 64,528 (74.1%) |
Disability Status by Sex by Age in Lapeer County
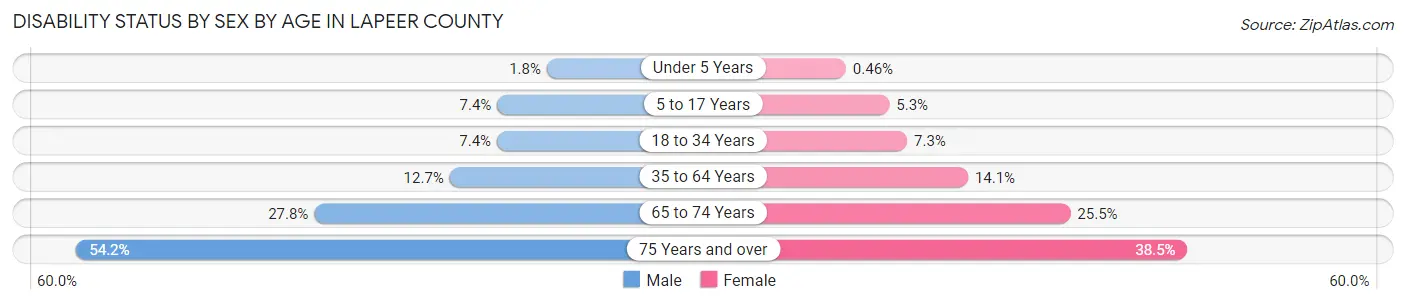
| Age Bracket | Male | Female |
| Under 5 Years | 40 (1.8%) | 9 (0.5%) |
| 5 to 17 Years | 526 (7.4%) | 347 (5.3%) |
| 18 to 34 Years | 640 (7.4%) | 557 (7.3%) |
| 35 to 64 Years | 2,338 (12.7%) | 2,542 (14.1%) |
| 65 to 74 Years | 1,446 (27.8%) | 1,310 (25.5%) |
| 75 Years and over | 1,469 (54.2%) | 1,286 (38.5%) |
Disability Class by Sex by Age in Lapeer County
Disability Class: Hearing Difficulty
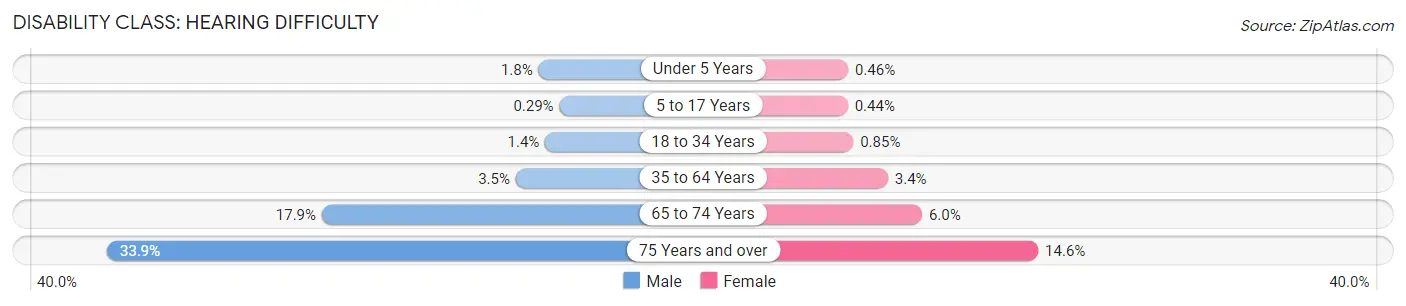
| Age Bracket | Male | Female |
| Under 5 Years | 40 (1.8%) | 9 (0.5%) |
| 5 to 17 Years | 21 (0.3%) | 29 (0.4%) |
| 18 to 34 Years | 117 (1.3%) | 65 (0.9%) |
| 35 to 64 Years | 652 (3.5%) | 619 (3.4%) |
| 65 to 74 Years | 934 (17.9%) | 306 (5.9%) |
| 75 Years and over | 918 (33.9%) | 487 (14.6%) |
Disability Class: Vision Difficulty
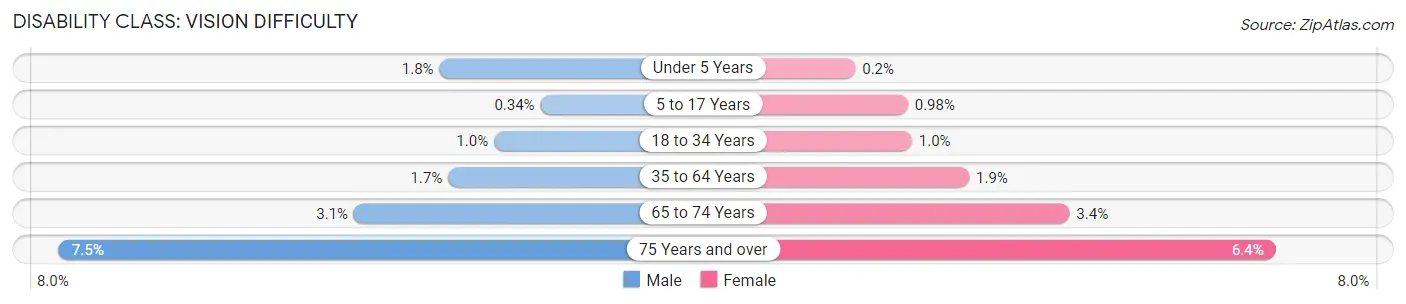
| Age Bracket | Male | Female |
| Under 5 Years | 40 (1.8%) | 4 (0.2%) |
| 5 to 17 Years | 24 (0.3%) | 64 (1.0%) |
| 18 to 34 Years | 89 (1.0%) | 80 (1.0%) |
| 35 to 64 Years | 316 (1.7%) | 342 (1.9%) |
| 65 to 74 Years | 162 (3.1%) | 174 (3.4%) |
| 75 Years and over | 203 (7.5%) | 215 (6.4%) |
Disability Class: Cognitive Difficulty
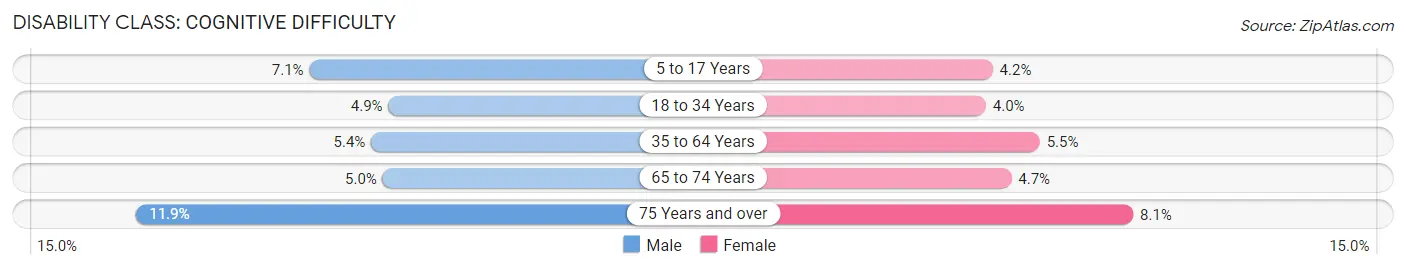
| Age Bracket | Male | Female |
| 5 to 17 Years | 504 (7.1%) | 275 (4.2%) |
| 18 to 34 Years | 421 (4.9%) | 307 (4.0%) |
| 35 to 64 Years | 988 (5.3%) | 997 (5.5%) |
| 65 to 74 Years | 262 (5.0%) | 243 (4.7%) |
| 75 Years and over | 322 (11.9%) | 271 (8.1%) |
Disability Class: Ambulatory Difficulty
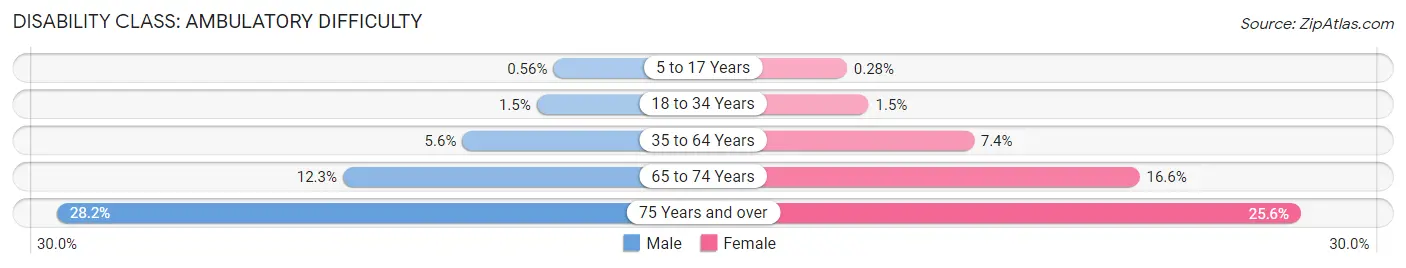
| Age Bracket | Male | Female |
| 5 to 17 Years | 40 (0.6%) | 18 (0.3%) |
| 18 to 34 Years | 129 (1.5%) | 114 (1.5%) |
| 35 to 64 Years | 1,040 (5.6%) | 1,330 (7.3%) |
| 65 to 74 Years | 640 (12.3%) | 853 (16.6%) |
| 75 Years and over | 764 (28.2%) | 854 (25.6%) |
Disability Class: Self-Care Difficulty
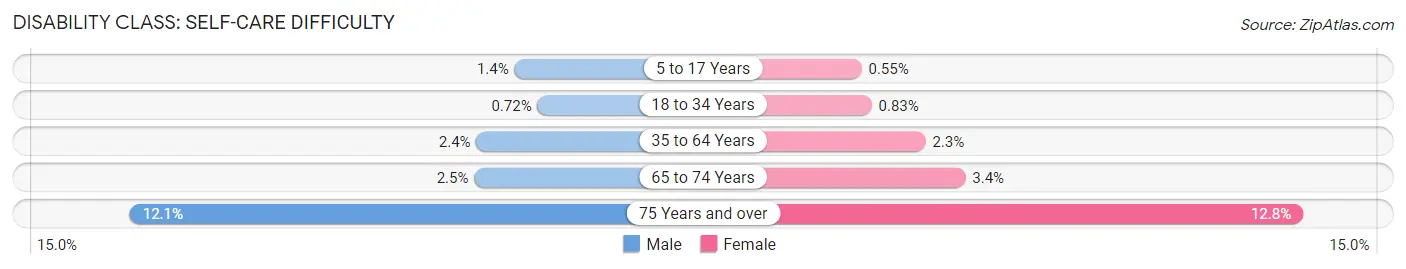
| Age Bracket | Male | Female |
| 5 to 17 Years | 97 (1.4%) | 36 (0.5%) |
| 18 to 34 Years | 62 (0.7%) | 64 (0.8%) |
| 35 to 64 Years | 446 (2.4%) | 422 (2.3%) |
| 65 to 74 Years | 129 (2.5%) | 177 (3.4%) |
| 75 Years and over | 327 (12.1%) | 429 (12.8%) |
Technology Access in Lapeer County
Computing Device Access in Lapeer County
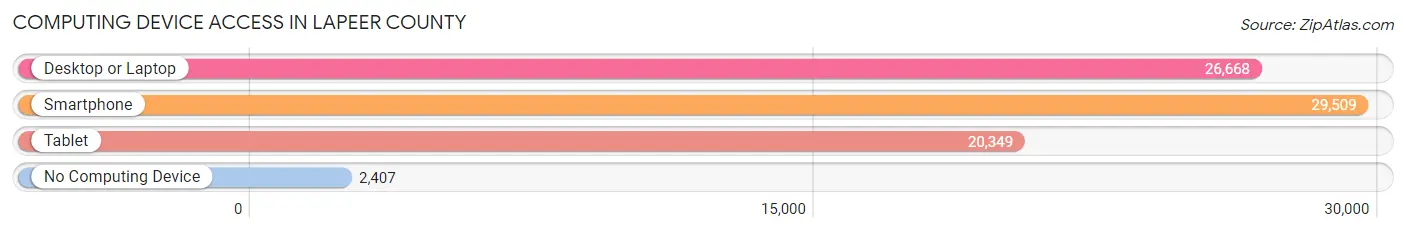
| Device Type | # Households | % Households |
| Desktop or Laptop | 26,668 | 77.9% |
| Smartphone | 29,509 | 86.2% |
| Tablet | 20,349 | 59.4% |
| No Computing Device | 2,407 | 7.0% |
| Total | 34,239 | 100.0% |
Internet Access in Lapeer County
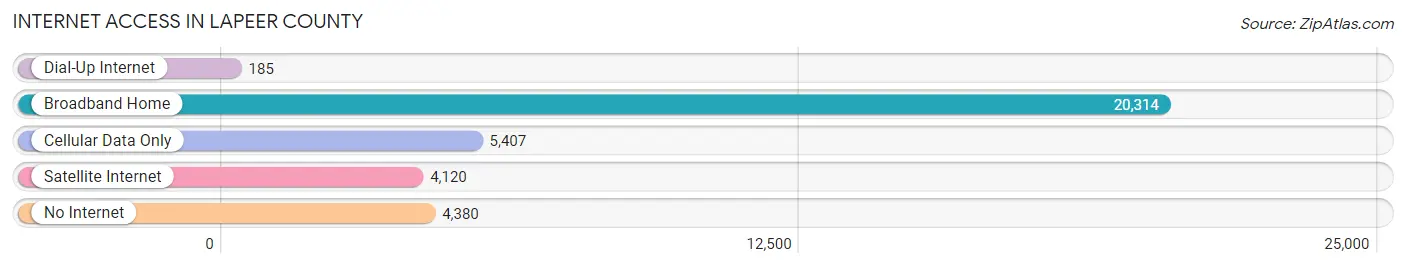
| Internet Type | # Households | % Households |
| Dial-Up Internet | 185 | 0.5% |
| Broadband Home | 20,314 | 59.3% |
| Cellular Data Only | 5,407 | 15.8% |
| Satellite Internet | 4,120 | 12.0% |
| No Internet | 4,380 | 12.8% |
| Total | 34,239 | 100.0% |
Lapeer County Summary
Lapeer County is a county located in the east-central portion of the U.S. state of Michigan. As of the 2010 census, the population was 88,319. The county seat is Lapeer. The county was created on September 18, 1822, and was fully organized on February 2, 1835.
Geography
Lapeer County is located in the Thumb region of Michigan. The county is bordered by Genesee County to the north, Oakland County to the east, St. Clair County to the south, and Sanilac and Tuscola counties to the west. The county has a total area of 577 square miles, of which 575 square miles is land and 2.2 square miles (0.4%) is water.
The county is drained by the Flint River, which flows through the county from north to south. The terrain is generally level, with some rolling hills in the northern and western parts of the county. The highest point in the county is an unnamed hill in the northwest corner of the county, at an elevation of 1,039 feet above sea level.
Demographics
As of the 2010 census, there were 88,319 people, 33,845 households, and 24,072 families residing in the county. The population density was 153.3 people per square mile. There were 36,845 housing units at an average density of 64.0 per square mile. The racial makeup of the county was 94.2% White, 2.3% Black or African American, 0.4% Native American, 0.7% Asian, 0.1% Pacific Islander, 0.7% from other races, and 1.6% from two or more races. 2.3% of the population were Hispanic or Latino of any race.
There were 33,845 households, out of which 33.2% had children under the age of 18 living with them, 56.2% were married couples living together, 10.7% had a female householder with no husband present, and 28.7% were non-families. 24.2% of all households were made up of individuals, and 10.2% had someone living alone who was 65 years of age or older. The average household size was 2.56 and the average family size was 3.04.
In the county, the population was spread out, with 25.2% under the age of 18, 8.2% from 18 to 24, 28.2% from 25 to 44, 24.2% from 45 to 64, and 14.2% who were 65 years of age or older. The median age was 38 years. For every 100 females there were 98.2 males. For every 100 females age 18 and over, there were 95.3 males.
The median income for a household in the county was $45,902, and the median income for a family was $53,845. Males had a median income of $41,945 versus $27,945 for females. The per capita income for the county was $21,845. About 6.2% of families and 8.7% of the population were below the poverty line, including 11.2% of those under age 18 and 6.7% of those age 65 or over.
Economy
The economy of Lapeer County is largely based on agriculture and manufacturing. The county is home to several large agricultural operations, including dairy farms, vegetable farms, and fruit orchards. The county is also home to several large manufacturing companies, including automotive parts suppliers, metal fabricators, and plastics manufacturers.
The county is also home to several small businesses, including restaurants, retail stores, and service providers. The county is also home to several tourist attractions, including the Lapeer County Historical Museum, the Lapeer County Fairgrounds, and the Lapeer County Park.
Conclusion
Lapeer County is a county located in the east-central portion of the U.S. state of Michigan. As of the 2010 census, the population was 88,319. The county seat is Lapeer. The county was created on September 18, 1822, and was fully organized on February 2, 1835. The county is bordered by Genesee County to the north, Oakland County to the east, St. Clair County to the south, and Sanilac and Tuscola counties to the west. The economy of Lapeer County is largely based on agriculture and manufacturing. The county is home to several large agricultural operations, including dairy farms, vegetable farms, and fruit orchards. The county is also home to several large manufacturing companies, including automotive parts suppliers, metal fabricators, and plastics manufacturers. The county is also home to several small businesses, including restaurants, retail stores, and service providers. The county is also home to several tourist attractions, including the Lapeer County Historical Museum, the Lapeer County Fairgrounds, and the Lapeer County Park.
Common Questions
What is the Total Population of Lapeer County?
Total Population of Lapeer County is 88,687.
What is the Total Male Population of Lapeer County?
Total Male Population of Lapeer County is 45,727.
What is the Total Female Population of Lapeer County?
Total Female Population of Lapeer County is 42,960.
What is the Ratio of Males per 100 Females in Lapeer County?
There are 106.44 Males per 100 Females in Lapeer County.
What is the Ratio of Females per 100 Males in Lapeer County?
There are 93.95 Females per 100 Males in Lapeer County.
What is the Median Population Age in Lapeer County?
Median Population Age in Lapeer County is 44.5 Years.
What is the Average Family Size in Lapeer County
Average Family Size in Lapeer County is 2.9 People.
What is the Average Household Size in Lapeer County
Average Household Size in Lapeer County is 2.5 People.
What is Per Capita Income in Lapeer County?
Per Capita income in Lapeer County is $37,419.
What is the Median Family Income in Lapeer County?
Median Family Income in Lapeer County is $85,295.
What is the Median Household income in Lapeer County?
Median Household Income in Lapeer County is $75,402.
What is Income or Wage Gap in Lapeer County?
Income or Wage Gap in Lapeer County is 45.3%.
Women in Lapeer County earn 54.7 cents for every dollar earned by a man.
What is Family Income Deficit in Lapeer County?
Family Income Deficit in Lapeer County is $11,761.
Families that are below poverty line in Lapeer County earn $11,761 less on average than the poverty threshold level.
What is Inequality or Gini Index in Lapeer County?
Inequality or Gini Index in Lapeer County is 0.43.
How Large is the Labor Force in Lapeer County?
There are 43,246 People in the Labor Forcein in Lapeer County.
What is the Percentage of People in the Labor Force in Lapeer County?
59.2% of People are in the Labor Force in Lapeer County.
What is the Unemployment Rate in Lapeer County?
Unemployment Rate in Lapeer County is 5.3%.