Kent County, MI
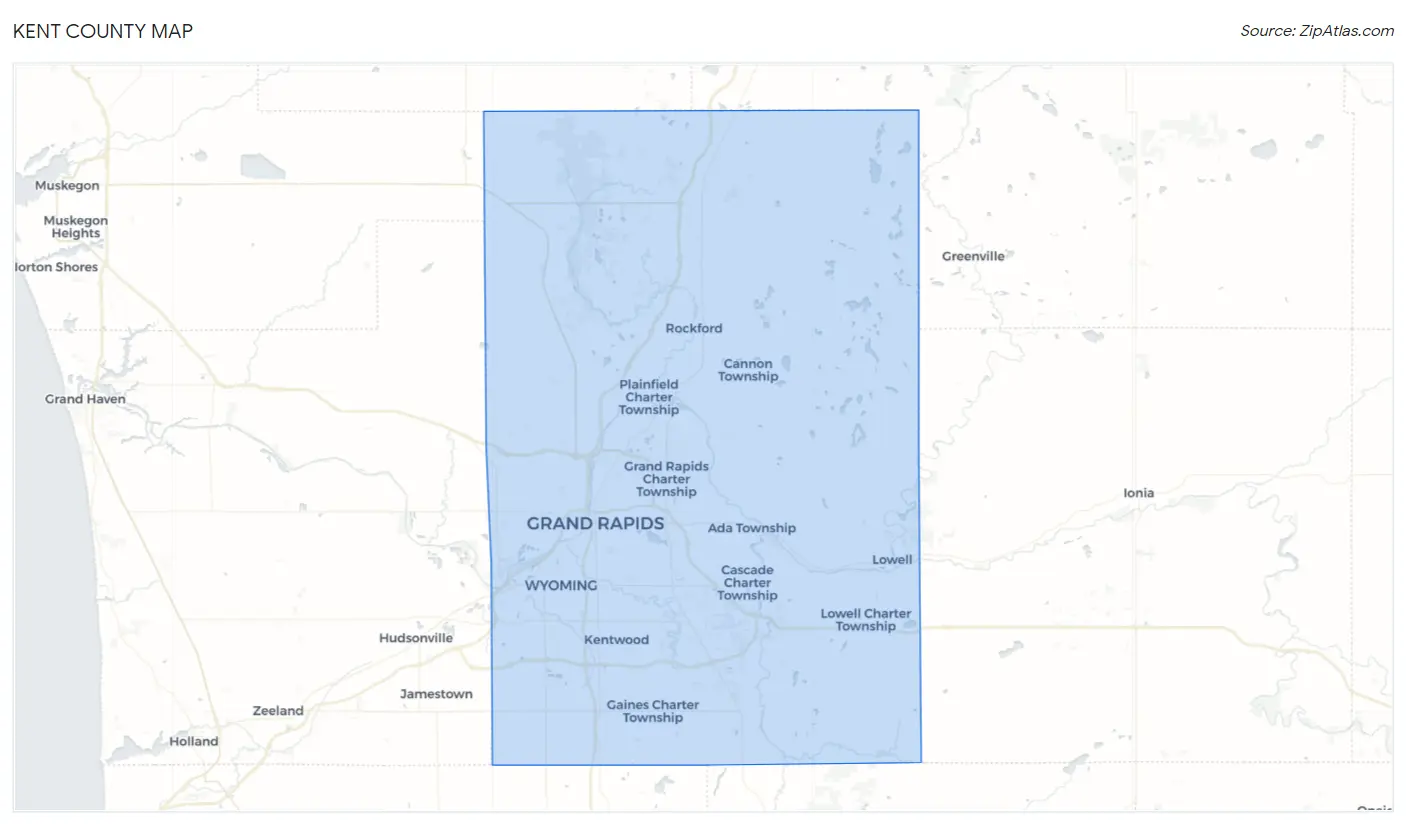
Kent County Map
Kent County Overview
657,321
TOTAL POPULATION
326,880
MALE POPULATION
330,441
FEMALE POPULATION
98.92
MALES / 100 FEMALES
101.09
FEMALES / 100 MALES
35.6
MEDIAN AGE
3.1
AVG FAMILY SIZE
2.6
AVG HOUSEHOLD SIZE
$39,342
PER CAPITA INCOME
$93,711
AVG FAMILY INCOME
$76,247
AVG HOUSEHOLD INCOME
29.8%
WAGE / INCOME GAP [ % ]
70.2¢/ $1
WAGE / INCOME GAP [ $ ]
$10,892
FAMILY INCOME DEFICIT
0.45
INEQUALITY / GINI INDEX
358,460
LABOR FORCE [ PEOPLE ]
69.1%
PERCENT IN LABOR FORCE
4.5%
UNEMPLOYMENT RATE
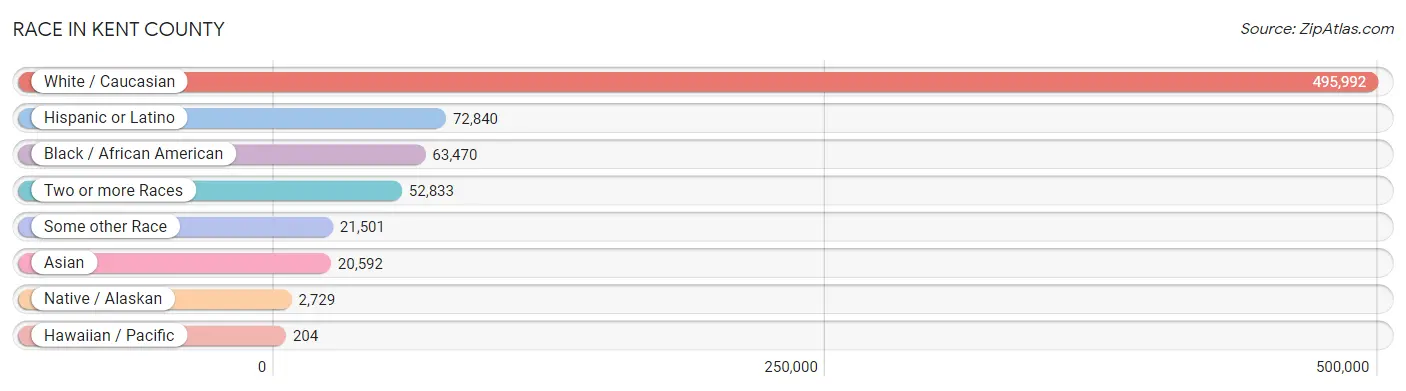
Race in Kent County
The most populous races in Kent County are White / Caucasian (495,992 | 75.5%), Hispanic or Latino (72,840 | 11.1%), and Black / African American (63,470 | 9.7%).
| Race | # Population | % Population |
| Asian | 20,592 | 3.1% |
| Black / African American | 63,470 | 9.7% |
| Hawaiian / Pacific | 204 | 0.0% |
| Hispanic or Latino | 72,840 | 11.1% |
| Native / Alaskan | 2,729 | 0.4% |
| White / Caucasian | 495,992 | 75.5% |
| Two or more Races | 52,833 | 8.0% |
| Some other Race | 21,501 | 3.3% |
| Total | 657,321 | 100.0% |
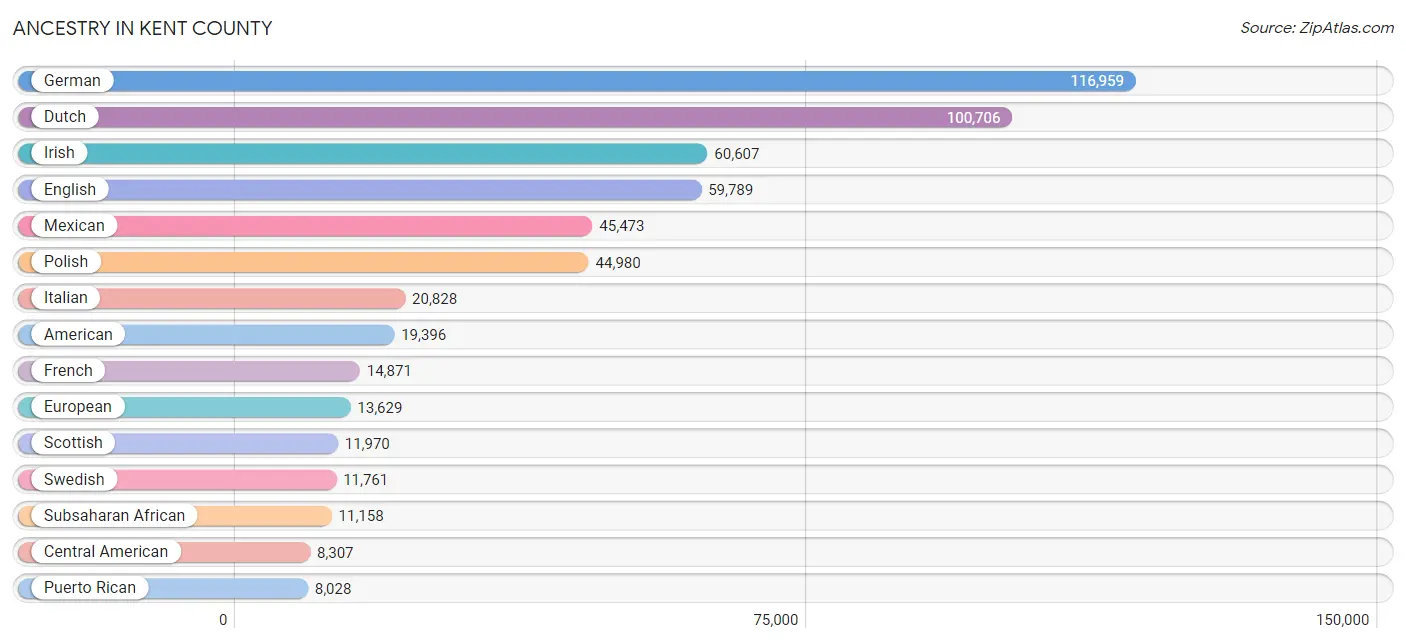
Ancestry in Kent County
The most populous ancestries reported in Kent County are German (116,959 | 17.8%), Dutch (100,706 | 15.3%), Irish (60,607 | 9.2%), English (59,789 | 9.1%), and Mexican (45,473 | 6.9%), together accounting for 58.4% of all Kent County residents.
| Ancestry | # Population | % Population |
| African | 3,148 | 0.5% |
| Alaska Native | 3 | 0.0% |
| Alaskan Athabascan | 7 | 0.0% |
| Albanian | 459 | 0.1% |
| American | 19,396 | 2.9% |
| Apache | 172 | 0.0% |
| Arab | 5,117 | 0.8% |
| Argentinean | 124 | 0.0% |
| Armenian | 578 | 0.1% |
| Assyrian / Chaldean / Syriac | 23 | 0.0% |
| Australian | 117 | 0.0% |
| Austrian | 1,174 | 0.2% |
| Bangladeshi | 139 | 0.0% |
| Barbadian | 8 | 0.0% |
| Belgian | 1,395 | 0.2% |
| Bhutanese | 1,416 | 0.2% |
| Blackfeet | 87 | 0.0% |
| Bolivian | 23 | 0.0% |
| Brazilian | 366 | 0.1% |
| British | 3,549 | 0.5% |
| Bulgarian | 65 | 0.0% |
| Burmese | 3,615 | 0.5% |
| Cajun | 16 | 0.0% |
| Canadian | 1,372 | 0.2% |
| Carpatho Rusyn | 11 | 0.0% |
| Celtic | 116 | 0.0% |
| Central American | 8,307 | 1.3% |
| Central American Indian | 915 | 0.1% |
| Cherokee | 1,674 | 0.3% |
| Chilean | 274 | 0.0% |
| Chinese | 15 | 0.0% |
| Chippewa | 1,152 | 0.2% |
| Choctaw | 127 | 0.0% |
| Colombian | 1,602 | 0.2% |
| Comanche | 33 | 0.0% |
| Costa Rican | 342 | 0.1% |
| Creek | 83 | 0.0% |
| Croatian | 708 | 0.1% |
| Cuban | 2,473 | 0.4% |
| Czech | 2,462 | 0.4% |
| Czechoslovakian | 1,114 | 0.2% |
| Danish | 4,035 | 0.6% |
| Delaware | 7 | 0.0% |
| Dominican | 2,333 | 0.4% |
| Dutch | 100,706 | 15.3% |
| Dutch West Indian | 46 | 0.0% |
| Eastern European | 1,879 | 0.3% |
| Ecuadorian | 242 | 0.0% |
| Egyptian | 142 | 0.0% |
| English | 59,789 | 9.1% |
| Estonian | 43 | 0.0% |
| Ethiopian | 608 | 0.1% |
| European | 13,629 | 2.1% |
| Filipino | 97 | 0.0% |
| Finnish | 2,953 | 0.4% |
| French | 14,871 | 2.3% |
| French American Indian | 314 | 0.1% |
| French Canadian | 4,495 | 0.7% |
| German | 116,959 | 17.8% |
| German Russian | 196 | 0.0% |
| Ghanaian | 98 | 0.0% |
| Greek | 2,248 | 0.3% |
| Guamanian / Chamorro | 38 | 0.0% |
| Guatemalan | 5,884 | 0.9% |
| Guyanese | 35 | 0.0% |
| Haitian | 865 | 0.1% |
| Honduran | 814 | 0.1% |
| Hopi | 99 | 0.0% |
| Hungarian | 2,663 | 0.4% |
| Icelander | 16 | 0.0% |
| Indian (Asian) | 4,139 | 0.6% |
| Indonesian | 2,111 | 0.3% |
| Inupiat | 6 | 0.0% |
| Iranian | 91 | 0.0% |
| Iraqi | 306 | 0.1% |
| Irish | 60,607 | 9.2% |
| Iroquois | 79 | 0.0% |
| Israeli | 129 | 0.0% |
| Italian | 20,828 | 3.2% |
| Jamaican | 807 | 0.1% |
| Japanese | 117 | 0.0% |
| Jordanian | 231 | 0.0% |
| Kenyan | 136 | 0.0% |
| Korean | 2,327 | 0.4% |
| Laotian | 463 | 0.1% |
| Latvian | 855 | 0.1% |
| Lebanese | 1,967 | 0.3% |
| Liberian | 1,636 | 0.3% |
| Lithuanian | 3,393 | 0.5% |
| Lumbee | 2 | 0.0% |
| Luxembourger | 108 | 0.0% |
| Macedonian | 89 | 0.0% |
| Malaysian | 47 | 0.0% |
| Maltese | 163 | 0.0% |
| Menominee | 1 | 0.0% |
| Mexican | 45,473 | 6.9% |
| Mexican American Indian | 898 | 0.1% |
| Mongolian | 1 | 0.0% |
| Moroccan | 179 | 0.0% |
| Native Hawaiian | 183 | 0.0% |
| Navajo | 64 | 0.0% |
| New Zealander | 11 | 0.0% |
| Nicaraguan | 152 | 0.0% |
| Nigerian | 586 | 0.1% |
| Northern European | 1,638 | 0.3% |
| Norwegian | 5,498 | 0.8% |
| Ottawa | 498 | 0.1% |
| Pakistani | 267 | 0.0% |
| Palestinian | 305 | 0.1% |
| Panamanian | 419 | 0.1% |
| Paraguayan | 28 | 0.0% |
| Pennsylvania German | 253 | 0.0% |
| Peruvian | 438 | 0.1% |
| Polish | 44,980 | 6.8% |
| Portuguese | 484 | 0.1% |
| Potawatomi | 1,078 | 0.2% |
| Pueblo | 127 | 0.0% |
| Puerto Rican | 8,028 | 1.2% |
| Romanian | 657 | 0.1% |
| Russian | 2,329 | 0.4% |
| Salvadoran | 696 | 0.1% |
| Samoan | 80 | 0.0% |
| Scandinavian | 1,632 | 0.3% |
| Scotch-Irish | 3,143 | 0.5% |
| Scottish | 11,970 | 1.8% |
| Seminole | 12 | 0.0% |
| Serbian | 304 | 0.1% |
| Sierra Leonean | 239 | 0.0% |
| Sioux | 44 | 0.0% |
| Slavic | 129 | 0.0% |
| Slovak | 771 | 0.1% |
| Slovene | 208 | 0.0% |
| Somali | 533 | 0.1% |
| South African | 66 | 0.0% |
| South American | 2,819 | 0.4% |
| South American Indian | 44 | 0.0% |
| Spaniard | 814 | 0.1% |
| Spanish | 564 | 0.1% |
| Spanish American | 170 | 0.0% |
| Sri Lankan | 5,341 | 0.8% |
| Subsaharan African | 11,158 | 1.7% |
| Sudanese | 965 | 0.2% |
| Swedish | 11,761 | 1.8% |
| Swiss | 1,813 | 0.3% |
| Syrian | 1,249 | 0.2% |
| Thai | 4,445 | 0.7% |
| Tlingit-Haida | 14 | 0.0% |
| Tohono O'Odham | 53 | 0.0% |
| Trinidadian and Tobagonian | 58 | 0.0% |
| Turkish | 91 | 0.0% |
| Ukrainian | 1,459 | 0.2% |
| Uruguayan | 21 | 0.0% |
| Ute | 1 | 0.0% |
| Venezuelan | 67 | 0.0% |
| Vietnamese | 354 | 0.1% |
| Welsh | 2,634 | 0.4% |
| West Indian | 37 | 0.0% |
| Yaqui | 57 | 0.0% |
| Yugoslavian | 3,303 | 0.5% |
| Zimbabwean | 69 | 0.0% | View All 160 Rows |
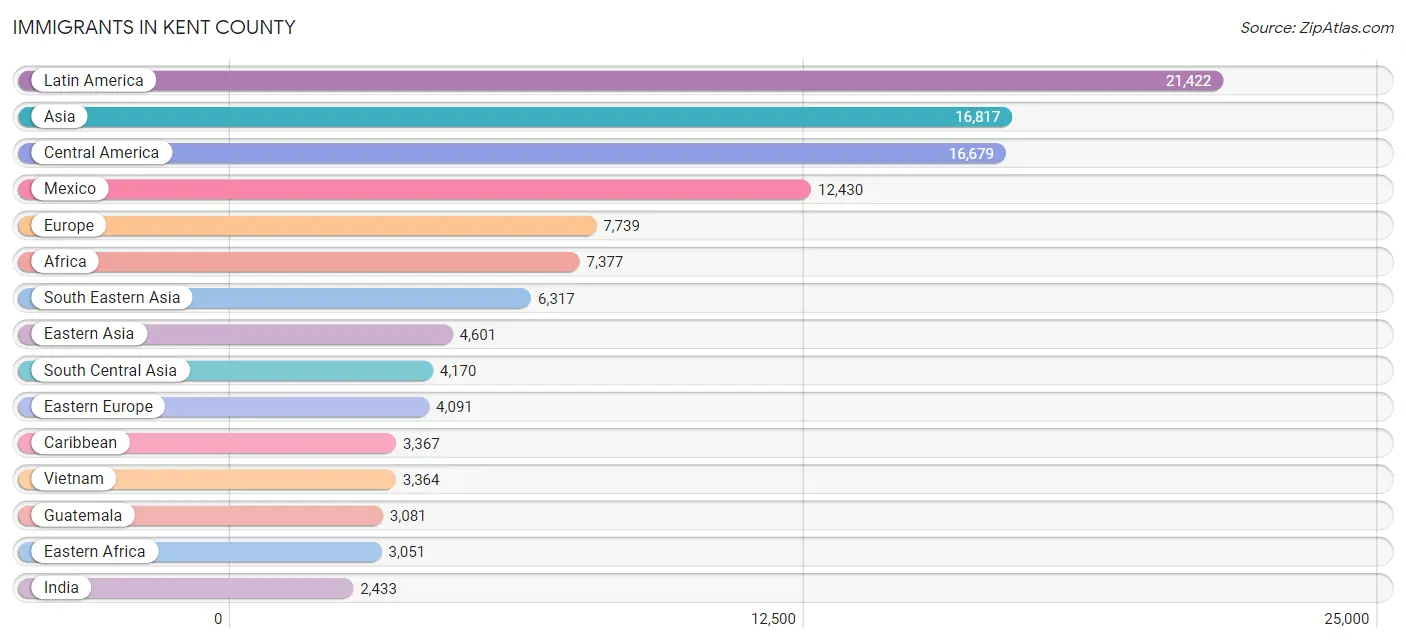
Immigrants in Kent County
The most numerous immigrant groups reported in Kent County came from Latin America (21,422 | 3.3%), Asia (16,817 | 2.6%), Central America (16,679 | 2.5%), Mexico (12,430 | 1.9%), and Europe (7,739 | 1.2%), together accounting for 11.4% of all Kent County residents.
| Immigration Origin | # Population | % Population |
| Africa | 7,377 | 1.1% |
| Albania | 293 | 0.0% |
| Argentina | 29 | 0.0% |
| Armenia | 25 | 0.0% |
| Asia | 16,817 | 2.6% |
| Australia | 141 | 0.0% |
| Austria | 69 | 0.0% |
| Bangladesh | 339 | 0.1% |
| Barbados | 8 | 0.0% |
| Belarus | 26 | 0.0% |
| Bolivia | 11 | 0.0% |
| Bosnia and Herzegovina | 2,283 | 0.4% |
| Brazil | 355 | 0.1% |
| Bulgaria | 52 | 0.0% |
| Cambodia | 34 | 0.0% |
| Cameroon | 64 | 0.0% |
| Canada | 1,313 | 0.2% |
| Caribbean | 3,367 | 0.5% |
| Central America | 16,679 | 2.5% |
| Chile | 97 | 0.0% |
| China | 2,290 | 0.4% |
| Colombia | 487 | 0.1% |
| Congo | 612 | 0.1% |
| Costa Rica | 105 | 0.0% |
| Croatia | 52 | 0.0% |
| Cuba | 1,492 | 0.2% |
| Czechoslovakia | 32 | 0.0% |
| Denmark | 52 | 0.0% |
| Dominican Republic | 1,328 | 0.2% |
| Eastern Africa | 3,051 | 0.5% |
| Eastern Asia | 4,601 | 0.7% |
| Eastern Europe | 4,091 | 0.6% |
| Ecuador | 74 | 0.0% |
| Egypt | 49 | 0.0% |
| El Salvador | 314 | 0.1% |
| England | 495 | 0.1% |
| Eritrea | 113 | 0.0% |
| Ethiopia | 328 | 0.1% |
| Europe | 7,739 | 1.2% |
| France | 144 | 0.0% |
| Germany | 1,069 | 0.2% |
| Ghana | 221 | 0.0% |
| Greece | 41 | 0.0% |
| Guatemala | 3,081 | 0.5% |
| Guyana | 73 | 0.0% |
| Haiti | 244 | 0.0% |
| Honduras | 516 | 0.1% |
| Hong Kong | 101 | 0.0% |
| Hungary | 35 | 0.0% |
| India | 2,433 | 0.4% |
| Indonesia | 81 | 0.0% |
| Iran | 33 | 0.0% |
| Iraq | 398 | 0.1% |
| Ireland | 28 | 0.0% |
| Israel | 61 | 0.0% |
| Italy | 255 | 0.0% |
| Jamaica | 242 | 0.0% |
| Japan | 555 | 0.1% |
| Jordan | 215 | 0.0% |
| Kazakhstan | 97 | 0.0% |
| Kenya | 46 | 0.0% |
| Korea | 1,756 | 0.3% |
| Kuwait | 115 | 0.0% |
| Laos | 35 | 0.0% |
| Latin America | 21,422 | 3.3% |
| Latvia | 130 | 0.0% |
| Lebanon | 267 | 0.0% |
| Liberia | 991 | 0.2% |
| Lithuania | 4 | 0.0% |
| Malaysia | 161 | 0.0% |
| Mexico | 12,430 | 1.9% |
| Middle Africa | 1,526 | 0.2% |
| Moldova | 20 | 0.0% |
| Morocco | 76 | 0.0% |
| Nepal | 697 | 0.1% |
| Netherlands | 975 | 0.2% |
| Nicaragua | 87 | 0.0% |
| Nigeria | 347 | 0.1% |
| North Macedonia | 24 | 0.0% |
| Northern Africa | 546 | 0.1% |
| Northern Europe | 983 | 0.2% |
| Oceania | 232 | 0.0% |
| Pakistan | 83 | 0.0% |
| Panama | 146 | 0.0% |
| Peru | 166 | 0.0% |
| Philippines | 953 | 0.1% |
| Poland | 306 | 0.1% |
| Romania | 225 | 0.0% |
| Russia | 275 | 0.0% |
| Saudi Arabia | 130 | 0.0% |
| Scotland | 109 | 0.0% |
| Serbia | 35 | 0.0% |
| Sierra Leone | 266 | 0.0% |
| Singapore | 56 | 0.0% |
| Somalia | 189 | 0.0% |
| South Africa | 95 | 0.0% |
| South America | 1,376 | 0.2% |
| South Central Asia | 4,170 | 0.6% |
| South Eastern Asia | 6,317 | 1.0% |
| Southern Europe | 392 | 0.1% |
| Spain | 80 | 0.0% |
| Sri Lanka | 7 | 0.0% |
| Sudan | 399 | 0.1% |
| Switzerland | 16 | 0.0% |
| Syria | 294 | 0.0% |
| Taiwan | 119 | 0.0% |
| Thailand | 64 | 0.0% |
| Trinidad and Tobago | 53 | 0.0% |
| Turkey | 28 | 0.0% |
| Uganda | 135 | 0.0% |
| Ukraine | 121 | 0.0% |
| Uruguay | 8 | 0.0% |
| Venezuela | 48 | 0.0% |
| Vietnam | 3,364 | 0.5% |
| Western Africa | 1,913 | 0.3% |
| Western Asia | 1,633 | 0.3% |
| Western Europe | 2,273 | 0.4% |
| Yemen | 30 | 0.0% |
| Zaire | 850 | 0.1% |
| Zimbabwe | 131 | 0.0% | View All 120 Rows |
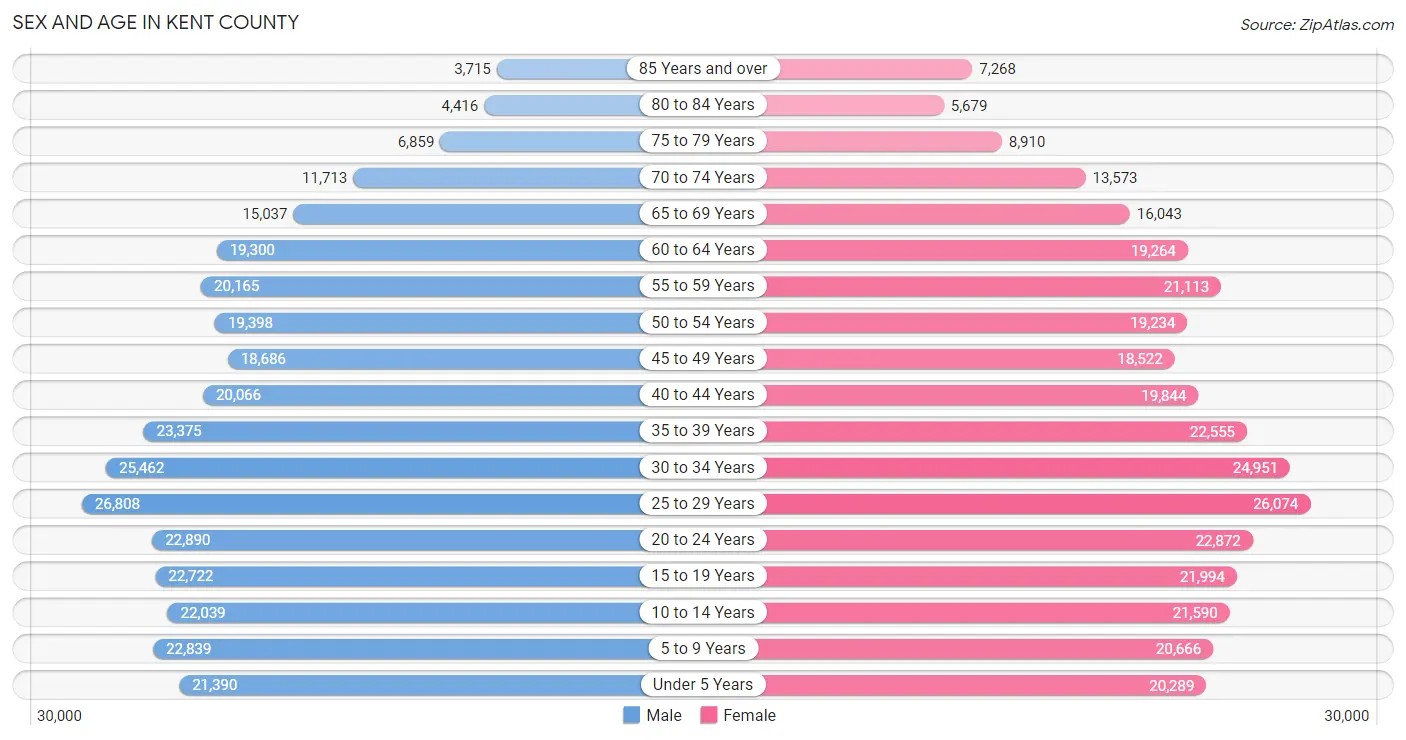
Sex and Age in Kent County
Sex and Age in Kent County
The most populous age groups in Kent County are 25 to 29 Years (26,808 | 8.2%) for men and 25 to 29 Years (26,074 | 7.9%) for women.
| Age Bracket | Male | Female |
| Under 5 Years | 21,390 (6.5%) | 20,289 (6.1%) |
| 5 to 9 Years | 22,839 (7.0%) | 20,666 (6.2%) |
| 10 to 14 Years | 22,039 (6.7%) | 21,590 (6.5%) |
| 15 to 19 Years | 22,722 (7.0%) | 21,994 (6.7%) |
| 20 to 24 Years | 22,890 (7.0%) | 22,872 (6.9%) |
| 25 to 29 Years | 26,808 (8.2%) | 26,074 (7.9%) |
| 30 to 34 Years | 25,462 (7.8%) | 24,951 (7.5%) |
| 35 to 39 Years | 23,375 (7.1%) | 22,555 (6.8%) |
| 40 to 44 Years | 20,066 (6.1%) | 19,844 (6.0%) |
| 45 to 49 Years | 18,686 (5.7%) | 18,522 (5.6%) |
| 50 to 54 Years | 19,398 (5.9%) | 19,234 (5.8%) |
| 55 to 59 Years | 20,165 (6.2%) | 21,113 (6.4%) |
| 60 to 64 Years | 19,300 (5.9%) | 19,264 (5.8%) |
| 65 to 69 Years | 15,037 (4.6%) | 16,043 (4.9%) |
| 70 to 74 Years | 11,713 (3.6%) | 13,573 (4.1%) |
| 75 to 79 Years | 6,859 (2.1%) | 8,910 (2.7%) |
| 80 to 84 Years | 4,416 (1.3%) | 5,679 (1.7%) |
| 85 Years and over | 3,715 (1.1%) | 7,268 (2.2%) |
| Total | 326,880 (100.0%) | 330,441 (100.0%) |
Families and Households in Kent County
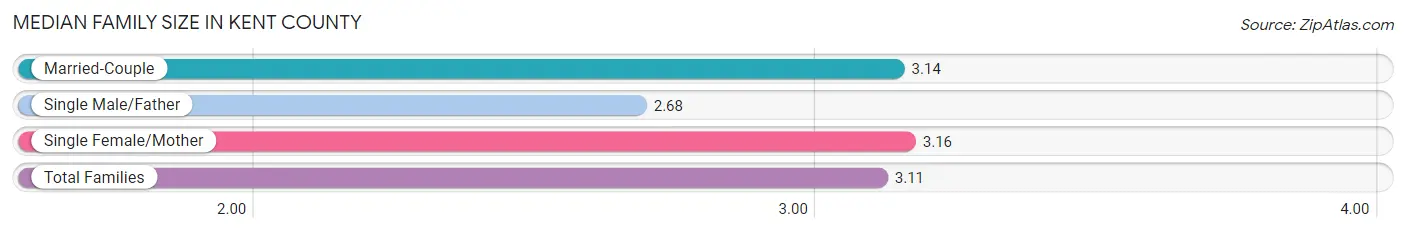
Median Family Size in Kent County
The median family size in Kent County is 3.11 persons per family, with single female/mother families (27,051 | 16.3%) accounting for the largest median family size of 3.16 persons per family. On the other hand, single male/father families (11,982 | 7.2%) represent the smallest median family size with 2.68 persons per family.
| Family Type | # Families | Family Size |
| Married-Couple | 126,922 (76.5%) | 3.14 |
| Single Male/Father | 11,982 (7.2%) | 2.68 |
| Single Female/Mother | 27,051 (16.3%) | 3.16 |
| Total Families | 165,955 (100.0%) | 3.11 |
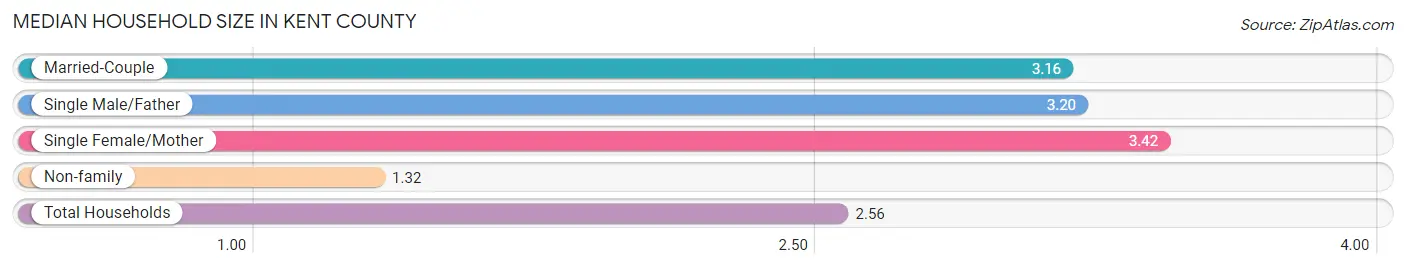
Median Household Size in Kent County
The median household size in Kent County is 2.56 persons per household, with single female/mother households (27,051 | 10.7%) accounting for the largest median household size of 3.42 persons per household. non-family households (86,739 | 34.3%) represent the smallest median household size with 1.32 persons per household.
| Household Type | # Households | Household Size |
| Married-Couple | 126,922 (50.2%) | 3.16 |
| Single Male/Father | 11,982 (4.7%) | 3.20 |
| Single Female/Mother | 27,051 (10.7%) | 3.42 |
| Non-family | 86,739 (34.3%) | 1.32 |
| Total Households | 252,694 (100.0%) | 2.56 |
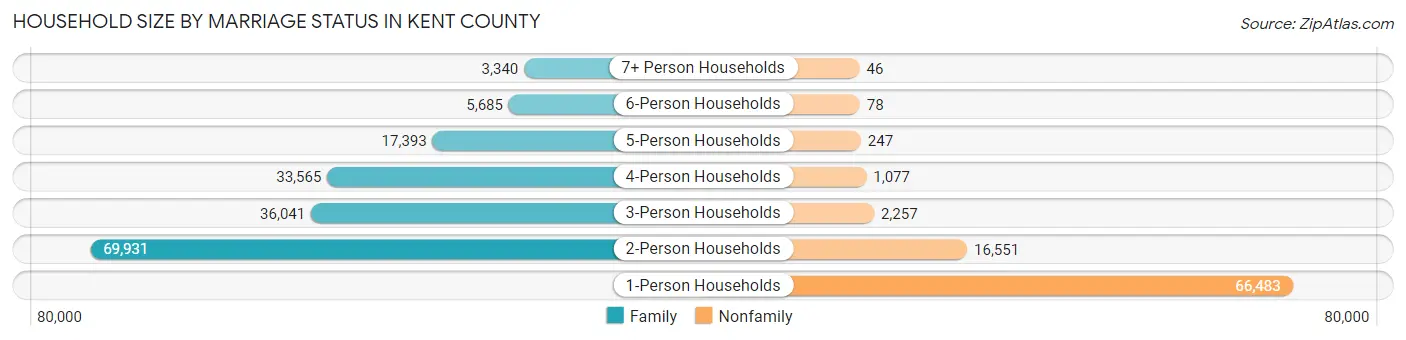
Household Size by Marriage Status in Kent County
Out of a total of 252,694 households in Kent County, 165,955 (65.7%) are family households, while 86,739 (34.3%) are nonfamily households. The most numerous type of family households are 2-person households, comprising 69,931, and the most common type of nonfamily households are 1-person households, comprising 66,483.
| Household Size | Family Households | Nonfamily Households |
| 1-Person Households | - | 66,483 (26.3%) |
| 2-Person Households | 69,931 (27.7%) | 16,551 (6.6%) |
| 3-Person Households | 36,041 (14.3%) | 2,257 (0.9%) |
| 4-Person Households | 33,565 (13.3%) | 1,077 (0.4%) |
| 5-Person Households | 17,393 (6.9%) | 247 (0.1%) |
| 6-Person Households | 5,685 (2.2%) | 78 (0.0%) |
| 7+ Person Households | 3,340 (1.3%) | 46 (0.0%) |
| Total | 165,955 (65.7%) | 86,739 (34.3%) |
Female Fertility in Kent County
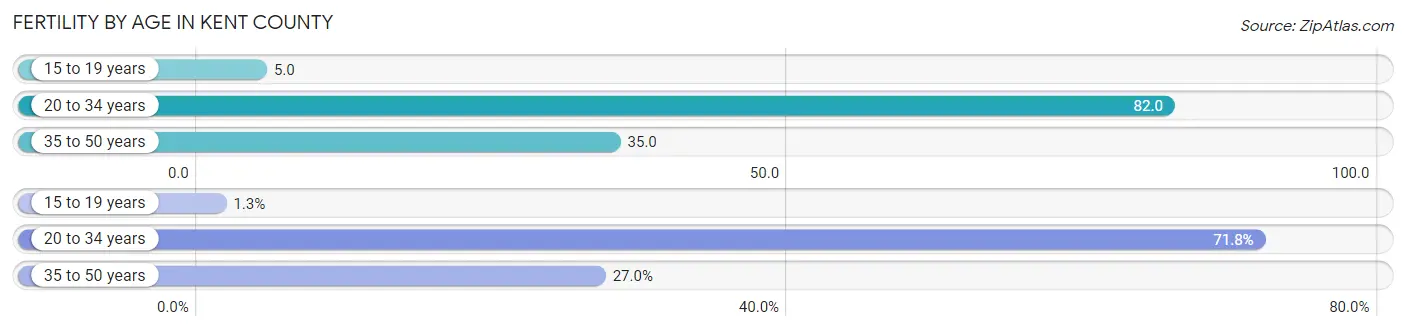
Fertility by Age in Kent County
Average fertility rate in Kent County is 53.0 births per 1,000 women. Women in the age bracket of 20 to 34 years have the highest fertility rate with 82.0 births per 1,000 women. Women in the age bracket of 20 to 34 years acount for 71.8% of all women with births.
| Age Bracket | Women with Births | Births / 1,000 Women |
| 15 to 19 years | 106 (1.3%) | 5.0 |
| 20 to 34 years | 6,082 (71.8%) | 82.0 |
| 35 to 50 years | 2,287 (27.0%) | 35.0 |
| Total | 8,475 (100.0%) | 53.0 |
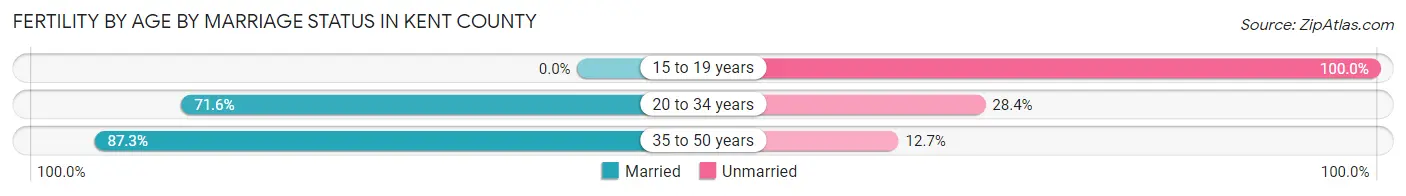
Fertility by Age by Marriage Status in Kent County
75.0% of women with births (8,475) in Kent County are married. The highest percentage of unmarried women with births falls into 15 to 19 years age bracket with 100.0% of them unmarried at the time of birth, while the lowest percentage of unmarried women with births belong to 35 to 50 years age bracket with 12.7% of them unmarried.
| Age Bracket | Married | Unmarried |
| 15 to 19 years | 0 (0.0%) | 106 (100.0%) |
| 20 to 34 years | 4,355 (71.6%) | 1,727 (28.4%) |
| 35 to 50 years | 1,997 (87.3%) | 290 (12.7%) |
| Total | 6,356 (75.0%) | 2,119 (25.0%) |
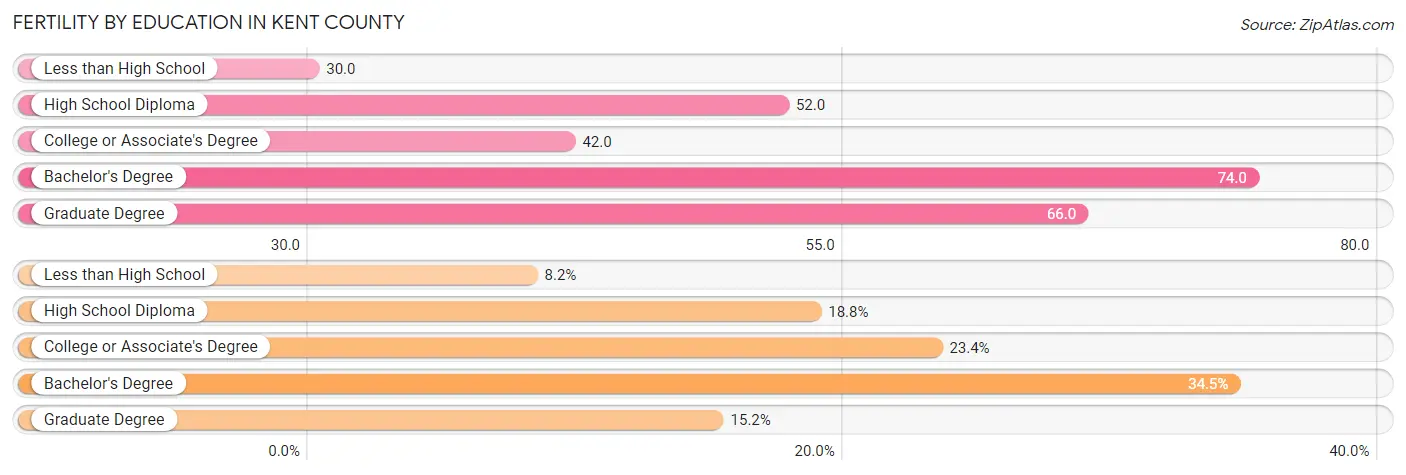
Fertility by Education in Kent County
Average fertility rate in Kent County is 53.0 births per 1,000 women. Women with the education attainment of bachelor's degree have the highest fertility rate of 74.0 births per 1,000 women, while women with the education attainment of less than high school have the lowest fertility at 30.0 births per 1,000 women. Women with the education attainment of bachelor's degree represent 34.5% of all women with births.
| Educational Attainment | Women with Births | Births / 1,000 Women |
| Less than High School | 693 (8.2%) | 30.0 |
| High School Diploma | 1,594 (18.8%) | 52.0 |
| College or Associate's Degree | 1,979 (23.4%) | 42.0 |
| Bachelor's Degree | 2,925 (34.5%) | 74.0 |
| Graduate Degree | 1,284 (15.1%) | 66.0 |
| Total | 8,475 (100.0%) | 53.0 |
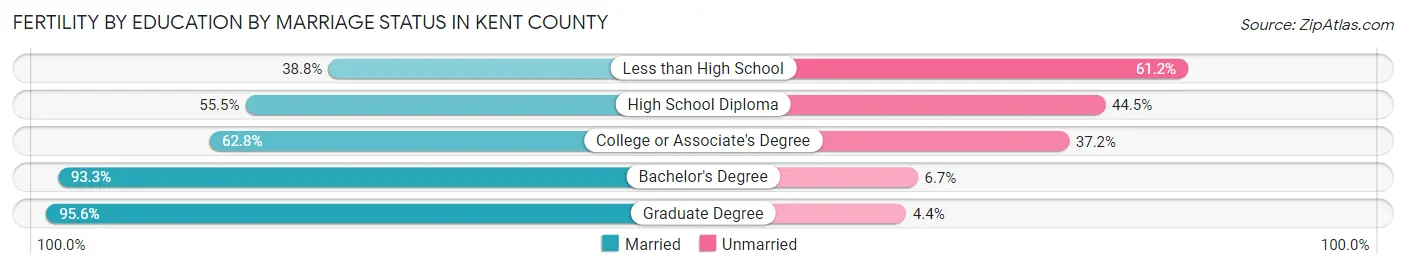
Fertility by Education by Marriage Status in Kent County
25.0% of women with births in Kent County are unmarried. Women with the educational attainment of graduate degree are most likely to be married with 95.6% of them married at childbirth, while women with the educational attainment of less than high school are least likely to be married with 61.2% of them unmarried at childbirth.
| Educational Attainment | Married | Unmarried |
| Less than High School | 269 (38.8%) | 424 (61.2%) |
| High School Diploma | 885 (55.5%) | 709 (44.5%) |
| College or Associate's Degree | 1,243 (62.8%) | 736 (37.2%) |
| Bachelor's Degree | 2,729 (93.3%) | 196 (6.7%) |
| Graduate Degree | 1,228 (95.6%) | 56 (4.4%) |
| Total | 6,356 (75.0%) | 2,119 (25.0%) |
Income in Kent County
Income Overview in Kent County
Per Capita Income in Kent County is $39,342, while median incomes of families and households are $93,711 and $76,247 respectively.
| Characteristic | Number | Measure |
| Per Capita Income | 657,321 | $39,342 |
| Median Family Income | 165,955 | $93,711 |
| Mean Family Income | 165,955 | $119,860 |
| Median Household Income | 252,694 | $76,247 |
| Mean Household Income | 252,694 | $100,762 |
| Income Deficit | 165,955 | $10,892 |
| Wage / Income Gap (%) | 657,321 | 29.82% |
| Wage / Income Gap ($) | 657,321 | 70.18¢ per $1 |
| Gini / Inequality Index | 657,321 | 0.45 |
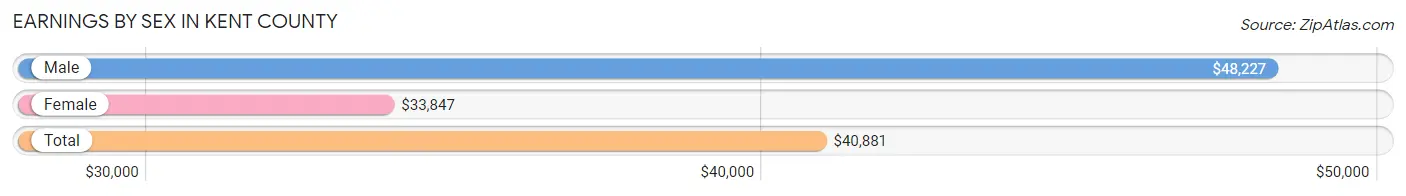
Earnings by Sex in Kent County
Average Earnings in Kent County are $40,881, $48,227 for men and $33,847 for women, a difference of 29.8%.
| Sex | Number | Average Earnings |
| Male | 199,022 (52.9%) | $48,227 |
| Female | 177,173 (47.1%) | $33,847 |
| Total | 376,195 (100.0%) | $40,881 |
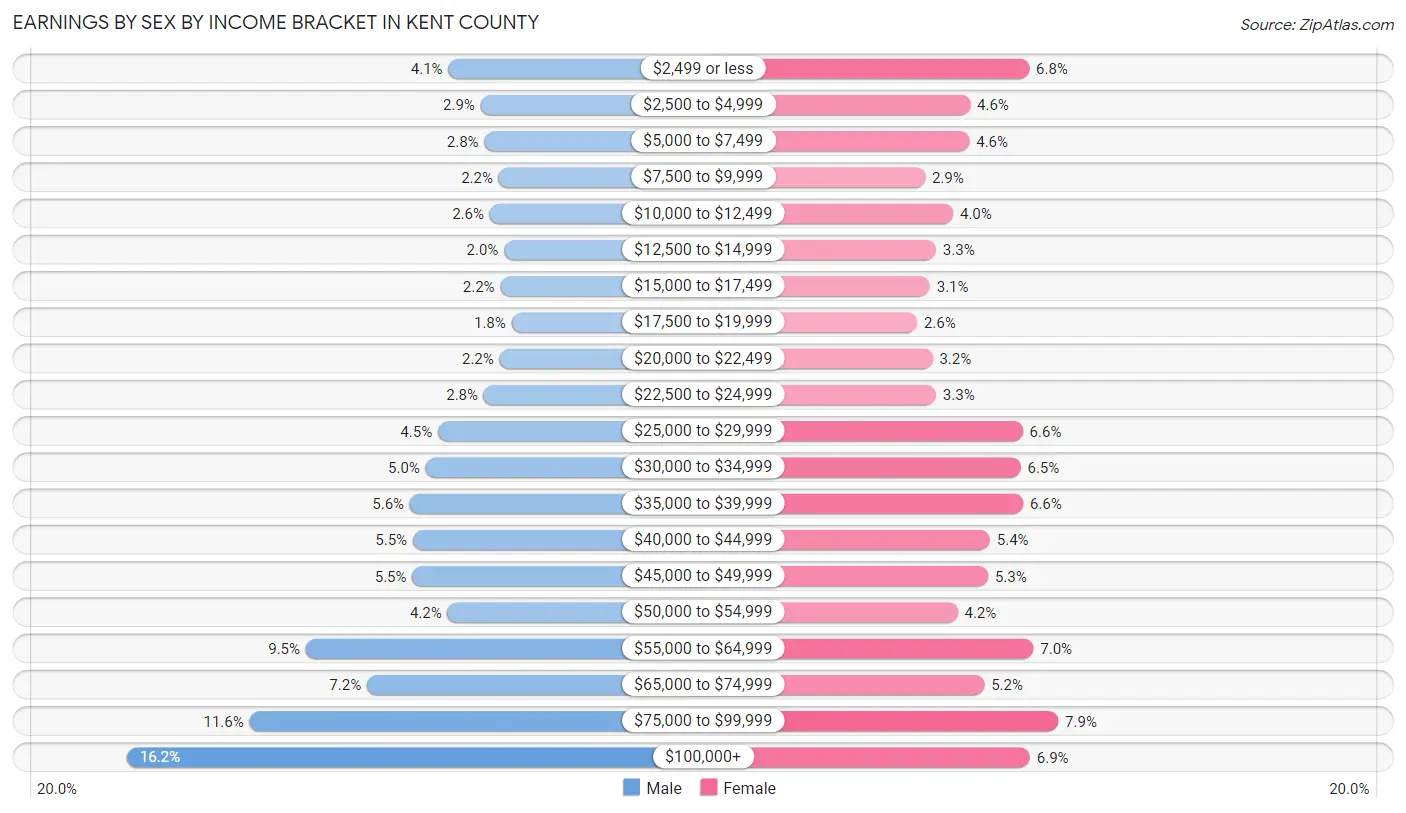
Earnings by Sex by Income Bracket in Kent County
The most common earnings brackets in Kent County are $100,000+ for men (32,179 | 16.2%) and $75,000 to $99,999 for women (14,024 | 7.9%).
| Income | Male | Female |
| $2,499 or less | 8,195 (4.1%) | 12,094 (6.8%) |
| $2,500 to $4,999 | 5,784 (2.9%) | 8,193 (4.6%) |
| $5,000 to $7,499 | 5,510 (2.8%) | 8,136 (4.6%) |
| $7,500 to $9,999 | 4,443 (2.2%) | 5,200 (2.9%) |
| $10,000 to $12,499 | 5,115 (2.6%) | 7,057 (4.0%) |
| $12,500 to $14,999 | 4,045 (2.0%) | 5,916 (3.3%) |
| $15,000 to $17,499 | 4,321 (2.2%) | 5,516 (3.1%) |
| $17,500 to $19,999 | 3,478 (1.8%) | 4,663 (2.6%) |
| $20,000 to $22,499 | 4,376 (2.2%) | 5,680 (3.2%) |
| $22,500 to $24,999 | 5,544 (2.8%) | 5,916 (3.3%) |
| $25,000 to $29,999 | 8,968 (4.5%) | 11,669 (6.6%) |
| $30,000 to $34,999 | 9,891 (5.0%) | 11,535 (6.5%) |
| $35,000 to $39,999 | 11,058 (5.6%) | 11,696 (6.6%) |
| $40,000 to $44,999 | 10,842 (5.4%) | 9,501 (5.4%) |
| $45,000 to $49,999 | 10,883 (5.5%) | 9,367 (5.3%) |
| $50,000 to $54,999 | 8,258 (4.2%) | 7,344 (4.2%) |
| $55,000 to $64,999 | 18,829 (9.5%) | 12,389 (7.0%) |
| $65,000 to $74,999 | 14,276 (7.2%) | 9,116 (5.1%) |
| $75,000 to $99,999 | 23,027 (11.6%) | 14,024 (7.9%) |
| $100,000+ | 32,179 (16.2%) | 12,161 (6.9%) |
| Total | 199,022 (100.0%) | 177,173 (100.0%) |
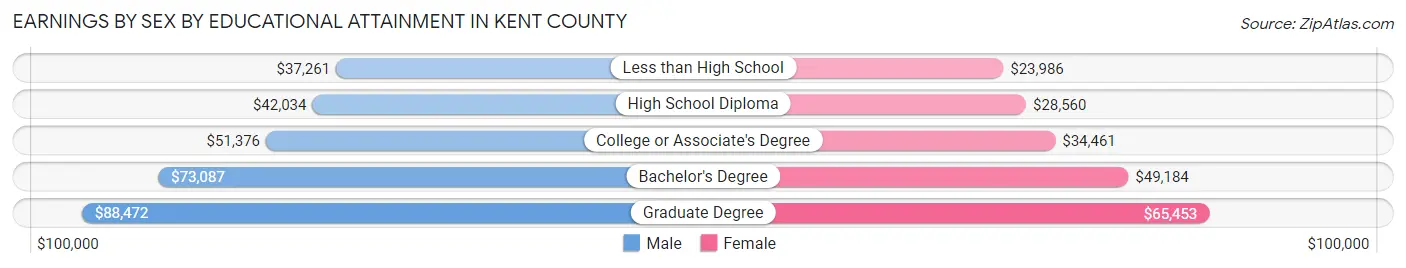
Earnings by Sex by Educational Attainment in Kent County
Average earnings in Kent County are $56,182 for men and $39,418 for women, a difference of 29.8%. Men with an educational attainment of graduate degree enjoy the highest average annual earnings of $88,472, while those with less than high school education earn the least with $37,261. Women with an educational attainment of graduate degree earn the most with the average annual earnings of $65,453, while those with less than high school education have the smallest earnings of $23,986.
| Educational Attainment | Male Income | Female Income |
| Less than High School | $37,261 | $23,986 |
| High School Diploma | $42,034 | $28,560 |
| College or Associate's Degree | $51,376 | $34,461 |
| Bachelor's Degree | $73,087 | $49,184 |
| Graduate Degree | $88,472 | $65,453 |
| Total | $56,182 | $39,418 |
Family Income in Kent County
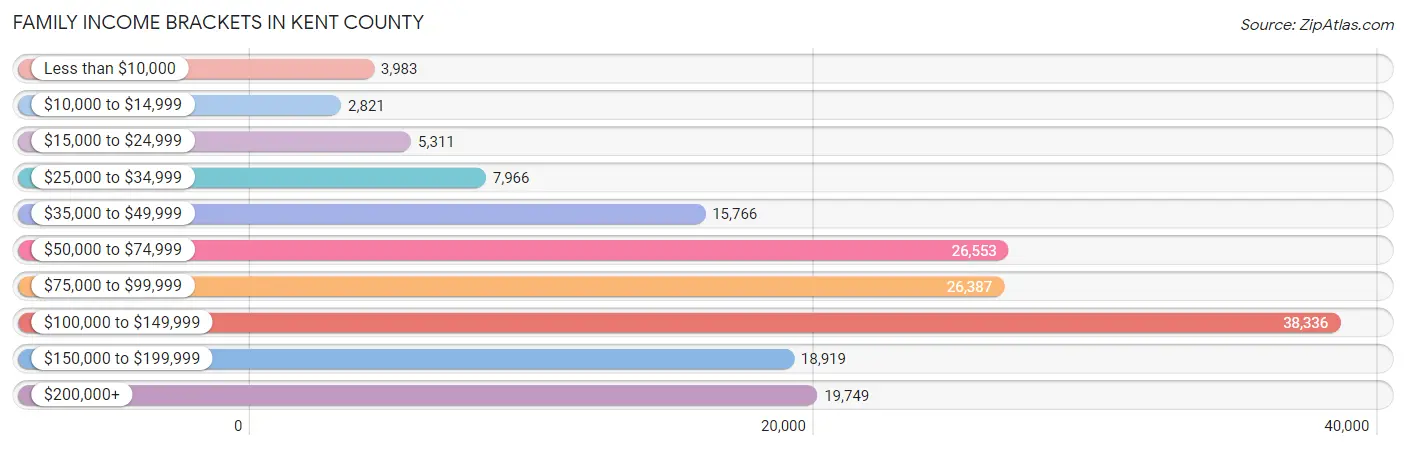
Family Income Brackets in Kent County
According to the Kent County family income data, there are 38,336 families falling into the $100,000 to $149,999 income range, which is the most common income bracket and makes up 23.1% of all families. Conversely, the $10,000 to $14,999 income bracket is the least frequent group with only 2,821 families (1.7%) belonging to this category.
| Income Bracket | # Families | % Families |
| Less than $10,000 | 3,983 | 2.4% |
| $10,000 to $14,999 | 2,821 | 1.7% |
| $15,000 to $24,999 | 5,311 | 3.2% |
| $25,000 to $34,999 | 7,966 | 4.8% |
| $35,000 to $49,999 | 15,766 | 9.5% |
| $50,000 to $74,999 | 26,553 | 16.0% |
| $75,000 to $99,999 | 26,387 | 15.9% |
| $100,000 to $149,999 | 38,336 | 23.1% |
| $150,000 to $199,999 | 18,919 | 11.4% |
| $200,000+ | 19,749 | 11.9% |
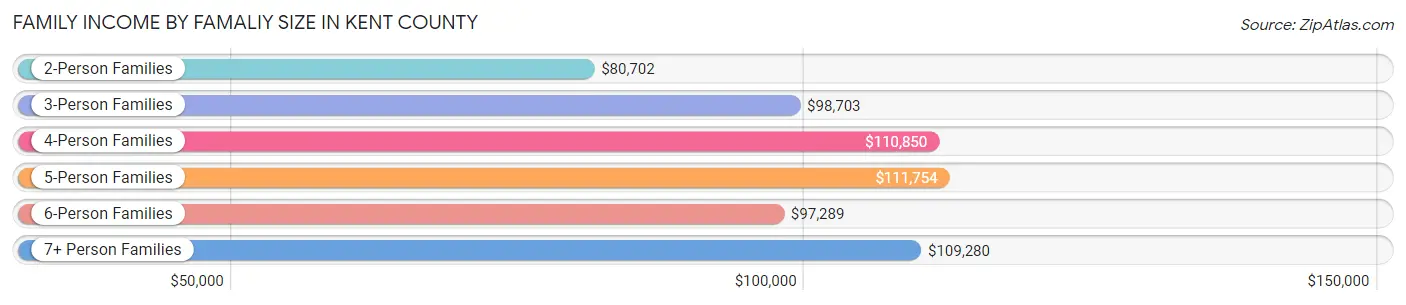
Family Income by Famaliy Size in Kent County
5-person families (15,862 | 9.6%) account for the highest median family income in Kent County with $111,754 per family, while 2-person families (75,381 | 45.4%) have the highest median income of $40,351 per family member.
| Income Bracket | # Families | Median Income |
| 2-Person Families | 75,381 (45.4%) | $80,702 |
| 3-Person Families | 35,061 (21.1%) | $98,703 |
| 4-Person Families | 31,824 (19.2%) | $110,850 |
| 5-Person Families | 15,862 (9.6%) | $111,754 |
| 6-Person Families | 5,197 (3.1%) | $97,289 |
| 7+ Person Families | 2,630 (1.6%) | $109,280 |
| Total | 165,955 (100.0%) | $93,711 |
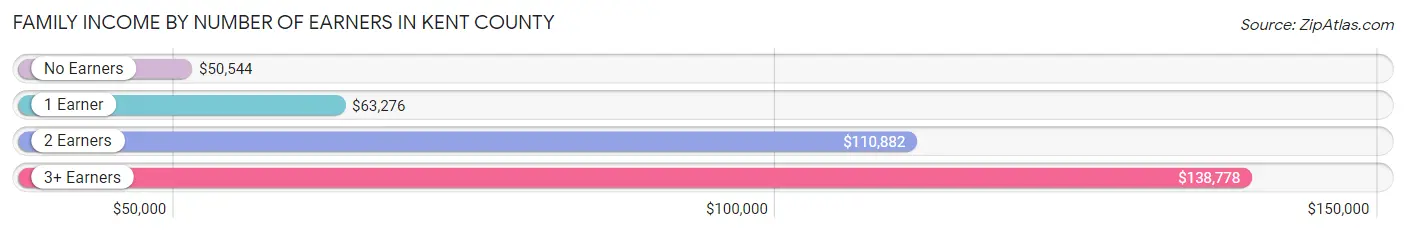
Family Income by Number of Earners in Kent County
The median family income in Kent County is $93,711, with families comprising 3+ earners (22,362) having the highest median family income of $138,778, while families with no earners (20,184) have the lowest median family income of $50,544, accounting for 13.5% and 12.2% of families, respectively.
| Number of Earners | # Families | Median Income |
| No Earners | 20,184 (12.2%) | $50,544 |
| 1 Earner | 46,575 (28.1%) | $63,276 |
| 2 Earners | 76,834 (46.3%) | $110,882 |
| 3+ Earners | 22,362 (13.5%) | $138,778 |
| Total | 165,955 (100.0%) | $93,711 |
Household Income in Kent County
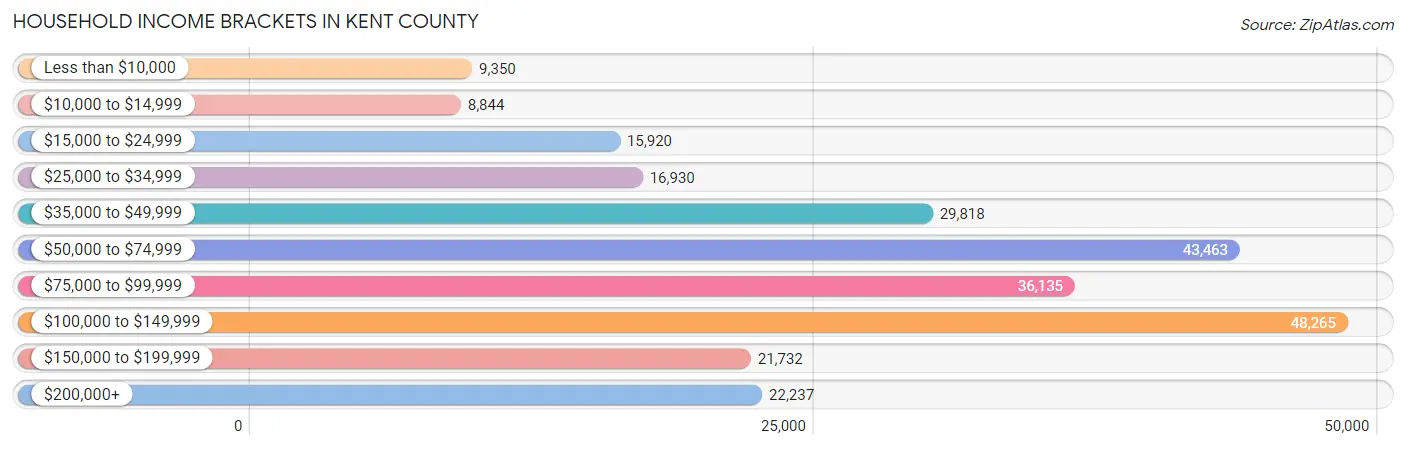
Household Income Brackets in Kent County
With 48,265 households falling in the category, the $100,000 to $149,999 income range is the most frequent in Kent County, accounting for 19.1% of all households. In contrast, only 8,844 households (3.5%) fall into the $10,000 to $14,999 income bracket, making it the least populous group.
| Income Bracket | # Households | % Households |
| Less than $10,000 | 9,350 | 3.7% |
| $10,000 to $14,999 | 8,844 | 3.5% |
| $15,000 to $24,999 | 15,920 | 6.3% |
| $25,000 to $34,999 | 16,930 | 6.7% |
| $35,000 to $49,999 | 29,818 | 11.8% |
| $50,000 to $74,999 | 43,463 | 17.2% |
| $75,000 to $99,999 | 36,135 | 14.3% |
| $100,000 to $149,999 | 48,265 | 19.1% |
| $150,000 to $199,999 | 21,732 | 8.6% |
| $200,000+ | 22,237 | 8.8% |
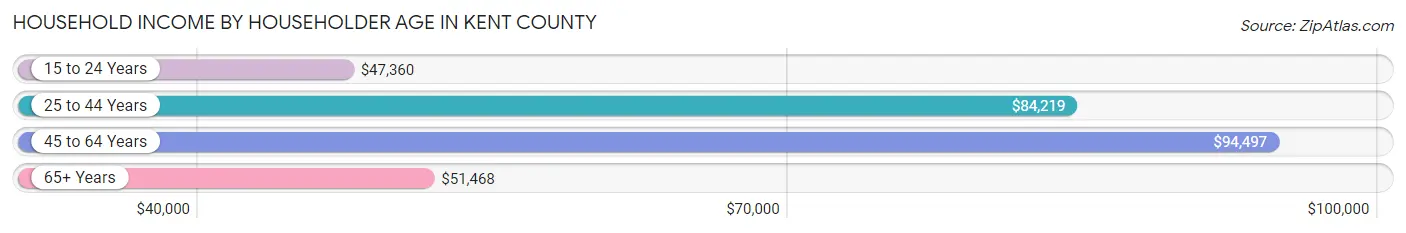
Household Income by Householder Age in Kent County
The median household income in Kent County is $76,247, with the highest median household income of $94,497 found in the 45 to 64 years age bracket for the primary householder. A total of 88,235 households (34.9%) fall into this category. Meanwhile, the 15 to 24 years age bracket for the primary householder has the lowest median household income of $47,360, with 12,057 households (4.8%) in this group.
| Income Bracket | # Households | Median Income |
| 15 to 24 Years | 12,057 (4.8%) | $47,360 |
| 25 to 44 Years | 93,232 (36.9%) | $84,219 |
| 45 to 64 Years | 88,235 (34.9%) | $94,497 |
| 65+ Years | 59,170 (23.4%) | $51,468 |
| Total | 252,694 (100.0%) | $76,247 |
Poverty in Kent County
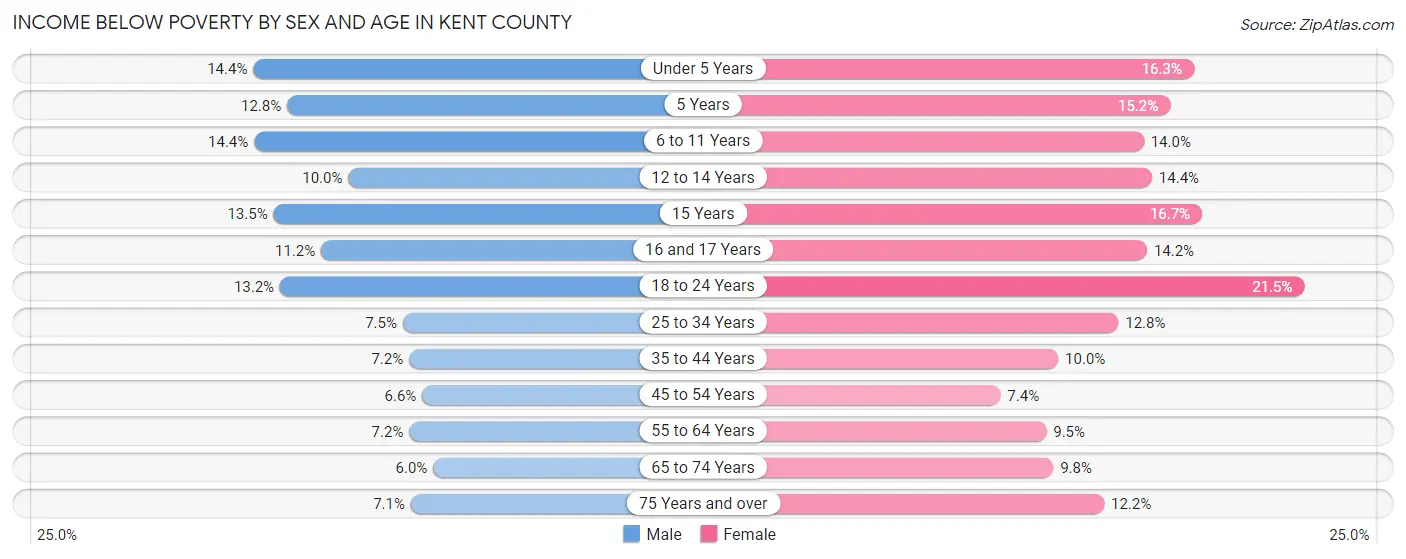
Income Below Poverty by Sex and Age in Kent County
With 9.1% poverty level for males and 12.4% for females among the residents of Kent County, under 5 year old males and 18 to 24 year old females are the most vulnerable to poverty, with 3,034 males (14.4%) and 6,299 females (21.5%) in their respective age groups living below the poverty level.
| Age Bracket | Male | Female |
| Under 5 Years | 3,034 (14.4%) | 3,271 (16.3%) |
| 5 Years | 553 (12.8%) | 579 (15.2%) |
| 6 to 11 Years | 3,863 (14.3%) | 3,482 (14.0%) |
| 12 to 14 Years | 1,262 (10.0%) | 1,876 (14.4%) |
| 15 Years | 640 (13.5%) | 824 (16.7%) |
| 16 and 17 Years | 997 (11.2%) | 1,129 (14.2%) |
| 18 to 24 Years | 3,970 (13.2%) | 6,299 (21.5%) |
| 25 to 34 Years | 3,853 (7.4%) | 6,537 (12.8%) |
| 35 to 44 Years | 3,084 (7.2%) | 4,251 (10.0%) |
| 45 to 54 Years | 2,482 (6.6%) | 2,777 (7.4%) |
| 55 to 64 Years | 2,802 (7.1%) | 3,818 (9.5%) |
| 65 to 74 Years | 1,584 (6.0%) | 2,893 (9.8%) |
| 75 Years and over | 1,014 (7.1%) | 2,514 (12.2%) |
| Total | 29,138 (9.1%) | 40,250 (12.4%) |
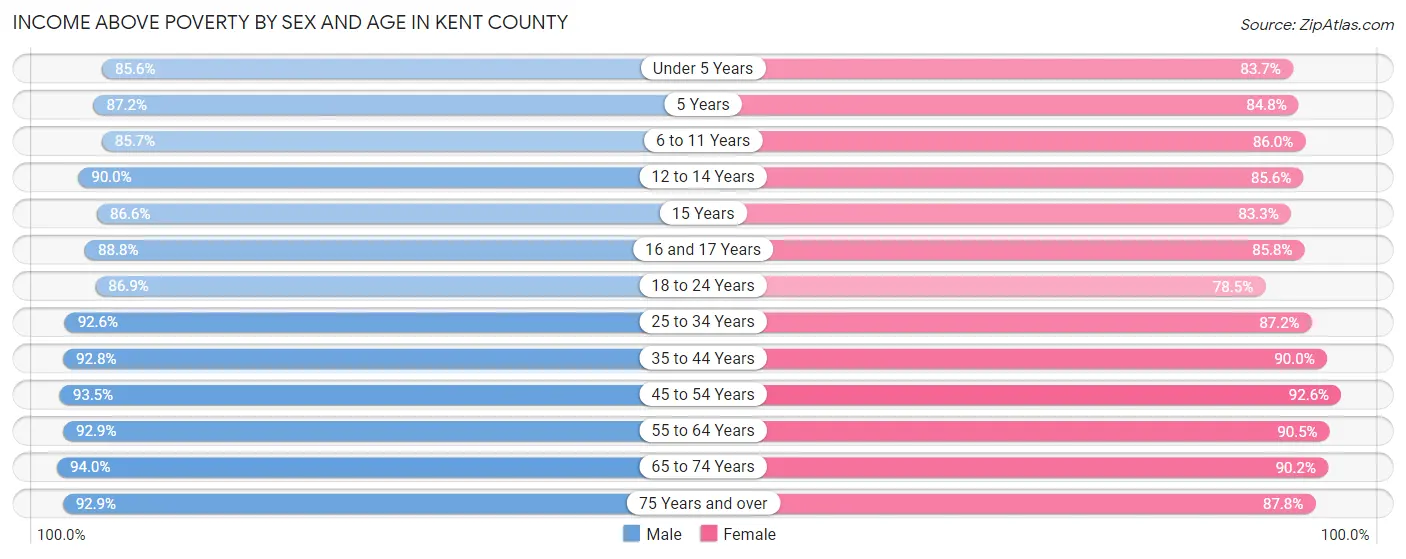
Income Above Poverty by Sex and Age in Kent County
According to the poverty statistics in Kent County, males aged 65 to 74 years and females aged 45 to 54 years are the age groups that are most secure financially, with 94.0% of males and 92.6% of females in these age groups living above the poverty line.
| Age Bracket | Male | Female |
| Under 5 Years | 18,056 (85.6%) | 16,761 (83.7%) |
| 5 Years | 3,760 (87.2%) | 3,223 (84.8%) |
| 6 to 11 Years | 23,056 (85.7%) | 21,368 (86.0%) |
| 12 to 14 Years | 11,385 (90.0%) | 11,164 (85.6%) |
| 15 Years | 4,119 (86.6%) | 4,108 (83.3%) |
| 16 and 17 Years | 7,873 (88.8%) | 6,843 (85.8%) |
| 18 to 24 Years | 26,215 (86.9%) | 23,052 (78.5%) |
| 25 to 34 Years | 47,887 (92.5%) | 44,401 (87.2%) |
| 35 to 44 Years | 40,014 (92.8%) | 38,099 (90.0%) |
| 45 to 54 Years | 35,411 (93.4%) | 34,935 (92.6%) |
| 55 to 64 Years | 36,371 (92.8%) | 36,401 (90.5%) |
| 65 to 74 Years | 24,620 (94.0%) | 26,600 (90.2%) |
| 75 Years and over | 13,305 (92.9%) | 18,146 (87.8%) |
| Total | 292,072 (90.9%) | 285,101 (87.6%) |
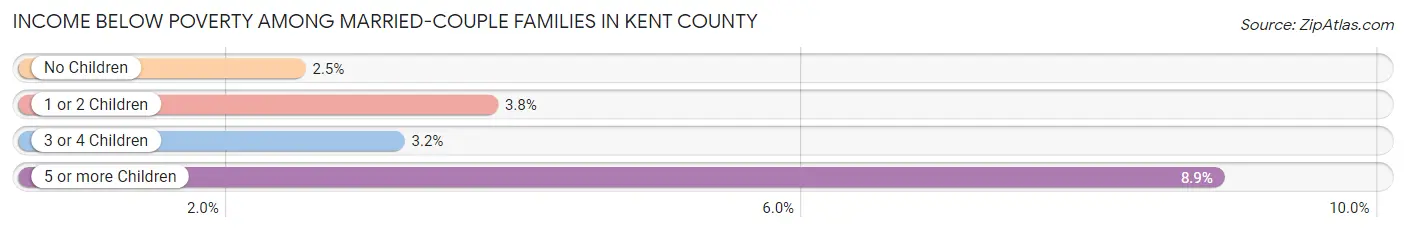
Income Below Poverty Among Married-Couple Families in Kent County
The poverty statistics for married-couple families in Kent County show that 3.0% or 3,845 of the total 126,922 families live below the poverty line. Families with 5 or more children have the highest poverty rate of 8.9%, comprising of 96 families. On the other hand, families with no children have the lowest poverty rate of 2.5%, which includes 1,777 families.
| Children | Above Poverty | Below Poverty |
| No Children | 70,075 (97.5%) | 1,777 (2.5%) |
| 1 or 2 Children | 39,470 (96.2%) | 1,563 (3.8%) |
| 3 or 4 Children | 12,546 (96.8%) | 409 (3.2%) |
| 5 or more Children | 986 (91.1%) | 96 (8.9%) |
| Total | 123,077 (97.0%) | 3,845 (3.0%) |
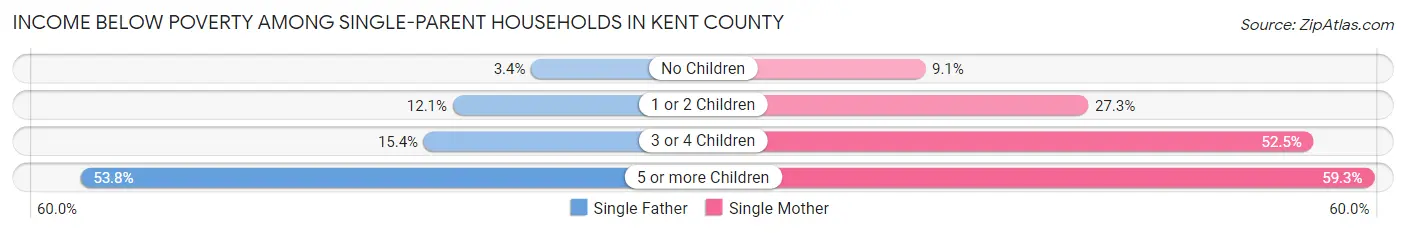
Income Below Poverty Among Single-Parent Households in Kent County
According to the poverty data in Kent County, 9.1% or 1,090 single-father households and 25.1% or 6,788 single-mother households are living below the poverty line. Among single-father households, those with 5 or more children have the highest poverty rate, with 57 households (53.8%) experiencing poverty. Likewise, among single-mother households, those with 5 or more children have the highest poverty rate, with 204 households (59.3%) falling below the poverty line.
| Children | Single Father | Single Mother |
| No Children | 170 (3.4%) | 849 (9.1%) |
| 1 or 2 Children | 699 (12.1%) | 3,668 (27.3%) |
| 3 or 4 Children | 164 (15.4%) | 2,067 (52.5%) |
| 5 or more Children | 57 (53.8%) | 204 (59.3%) |
| Total | 1,090 (9.1%) | 6,788 (25.1%) |
Income Below Poverty Among Married-Couple vs Single-Parent Households in Kent County
The poverty data for Kent County shows that 3,845 of the married-couple family households (3.0%) and 7,878 of the single-parent households (20.2%) are living below the poverty level. Within the married-couple family households, those with 5 or more children have the highest poverty rate, with 96 households (8.9%) falling below the poverty line. Among the single-parent households, those with 5 or more children have the highest poverty rate, with 261 household (58.0%) living below poverty.
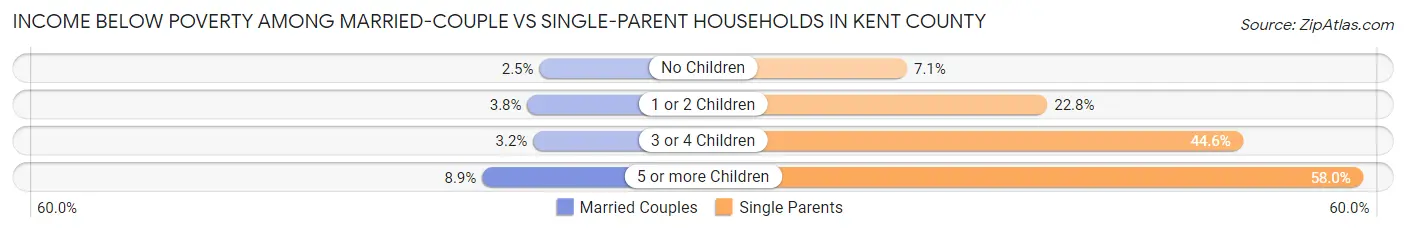
| Children | Married-Couple Families | Single-Parent Households |
| No Children | 1,777 (2.5%) | 1,019 (7.1%) |
| 1 or 2 Children | 1,563 (3.8%) | 4,367 (22.8%) |
| 3 or 4 Children | 409 (3.2%) | 2,231 (44.6%) |
| 5 or more Children | 96 (8.9%) | 261 (58.0%) |
| Total | 3,845 (3.0%) | 7,878 (20.2%) |
Employment Characteristics in Kent County
Employment by Class of Employer in Kent County
Among the 336,075 employed individuals in Kent County, private company employees (236,484 | 70.4%), not-for-profit organizations (45,068 | 13.4%), and self-employed (not incorporated) (16,075 | 4.8%) make up the most common classes of employment.
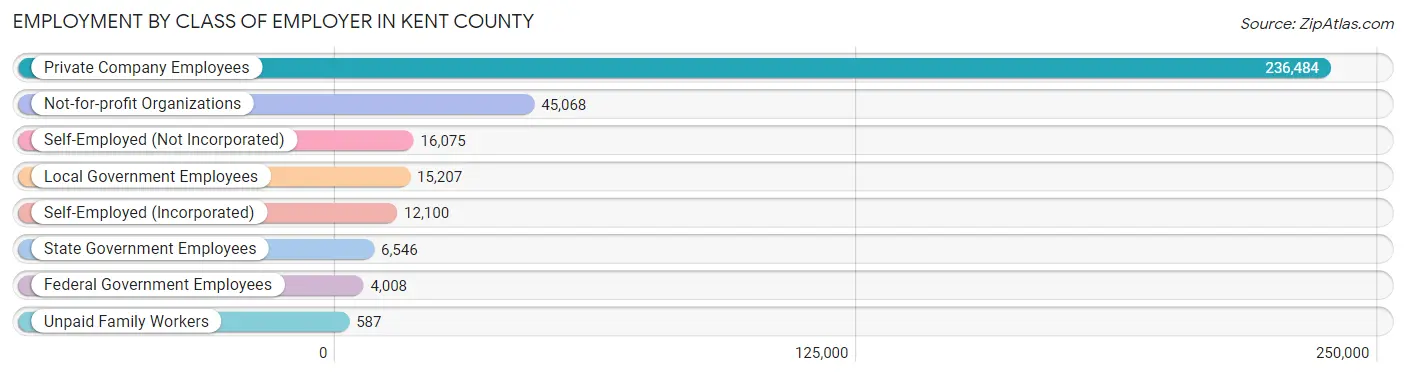
| Employer Class | # Employees | % Employees |
| Private Company Employees | 236,484 | 70.4% |
| Self-Employed (Incorporated) | 12,100 | 3.6% |
| Self-Employed (Not Incorporated) | 16,075 | 4.8% |
| Not-for-profit Organizations | 45,068 | 13.4% |
| Local Government Employees | 15,207 | 4.5% |
| State Government Employees | 6,546 | 1.9% |
| Federal Government Employees | 4,008 | 1.2% |
| Unpaid Family Workers | 587 | 0.2% |
| Total | 336,075 | 100.0% |
Employment Status by Age in Kent County
According to the labor force statistics for Kent County, out of the total population over 16 years of age (518,756), 69.1% or 358,460 individuals are in the labor force, with 4.5% or 16,131 of them unemployed. The age group with the highest labor force participation rate is 25 to 29 years, with 88.1% or 46,589 individuals in the labor force. Within the labor force, the 16 to 19 years age range has the highest percentage of unemployed individuals, with 13.0% or 2,323 of them being unemployed.
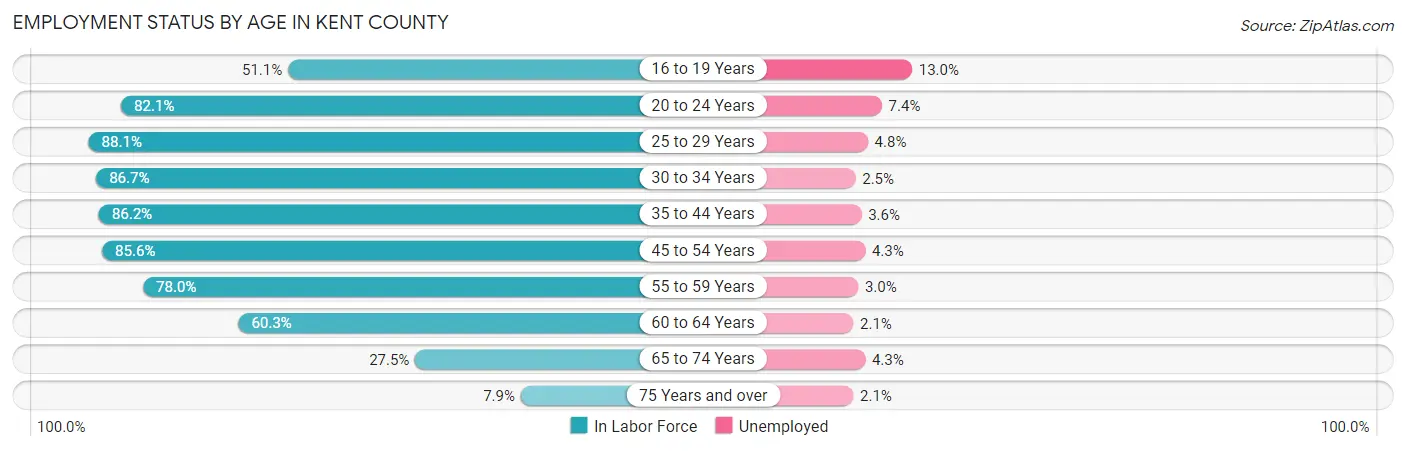
| Age Bracket | In Labor Force | Unemployed |
| 16 to 19 Years | 17,867 (51.1%) | 2,323 (13.0%) |
| 20 to 24 Years | 37,571 (82.1%) | 2,780 (7.4%) |
| 25 to 29 Years | 46,589 (88.1%) | 2,236 (4.8%) |
| 30 to 34 Years | 43,708 (86.7%) | 1,093 (2.5%) |
| 35 to 44 Years | 73,994 (86.2%) | 2,664 (3.6%) |
| 45 to 54 Years | 64,919 (85.6%) | 2,792 (4.3%) |
| 55 to 59 Years | 32,197 (78.0%) | 966 (3.0%) |
| 60 to 64 Years | 23,254 (60.3%) | 488 (2.1%) |
| 65 to 74 Years | 15,501 (27.5%) | 667 (4.3%) |
| 75 Years and over | 2,911 (7.9%) | 61 (2.1%) |
| Total | 358,460 (69.1%) | 16,131 (4.5%) |
Employment Status by Educational Attainment in Kent County
According to labor force statistics for Kent County, 82.6% of individuals (284,819) out of the total population between 25 and 64 years of age (344,817) are in the labor force, with 3.6% or 10,253 of them being unemployed. The group with the highest labor force participation rate are those with the educational attainment of bachelor's degree or higher, with 89.3% or 125,046 individuals in the labor force. Within the labor force, individuals with less than high school education have the highest percentage of unemployment, with 8.6% or 1,407 of them being unemployed.
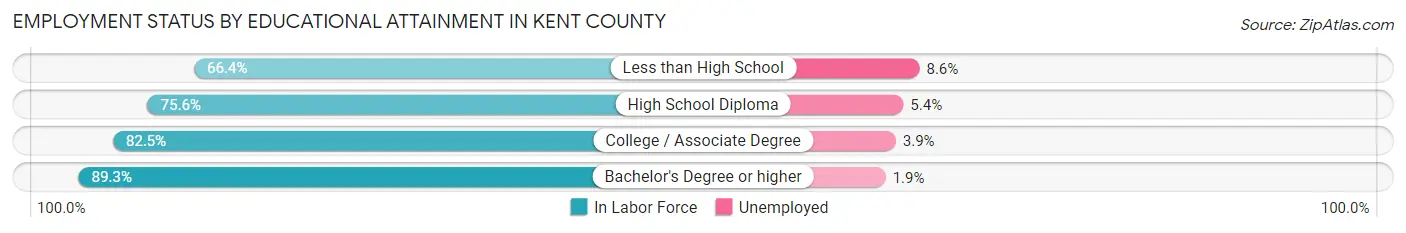
| Educational Attainment | In Labor Force | Unemployed |
| Less than High School | 16,355 (66.4%) | 2,118 (8.6%) |
| High School Diploma | 58,100 (75.6%) | 4,150 (5.4%) |
| College / Associate Degree | 85,227 (82.5%) | 4,029 (3.9%) |
| Bachelor's Degree or higher | 125,046 (89.3%) | 2,661 (1.9%) |
| Total | 284,819 (82.6%) | 12,413 (3.6%) |
Employment Occupations by Sex in Kent County
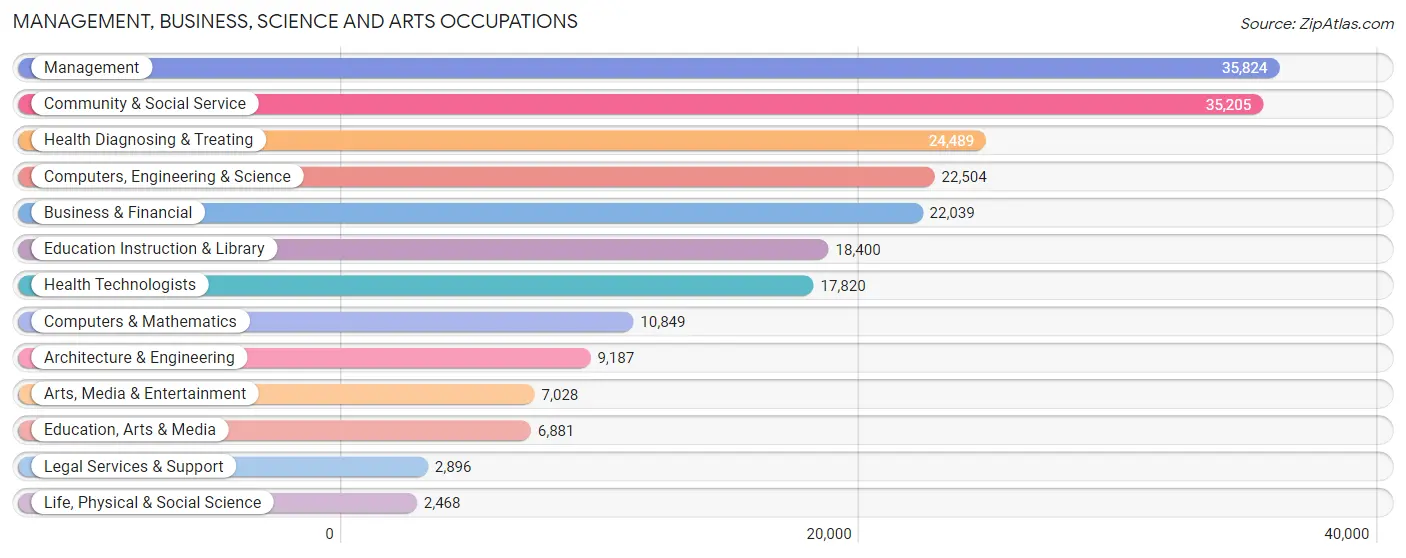
Management, Business, Science and Arts Occupations
The most common Management, Business, Science and Arts occupations in Kent County are Management (35,824 | 10.5%), Community & Social Service (35,205 | 10.3%), Health Diagnosing & Treating (24,489 | 7.1%), Computers, Engineering & Science (22,504 | 6.6%), and Business & Financial (22,039 | 6.4%).
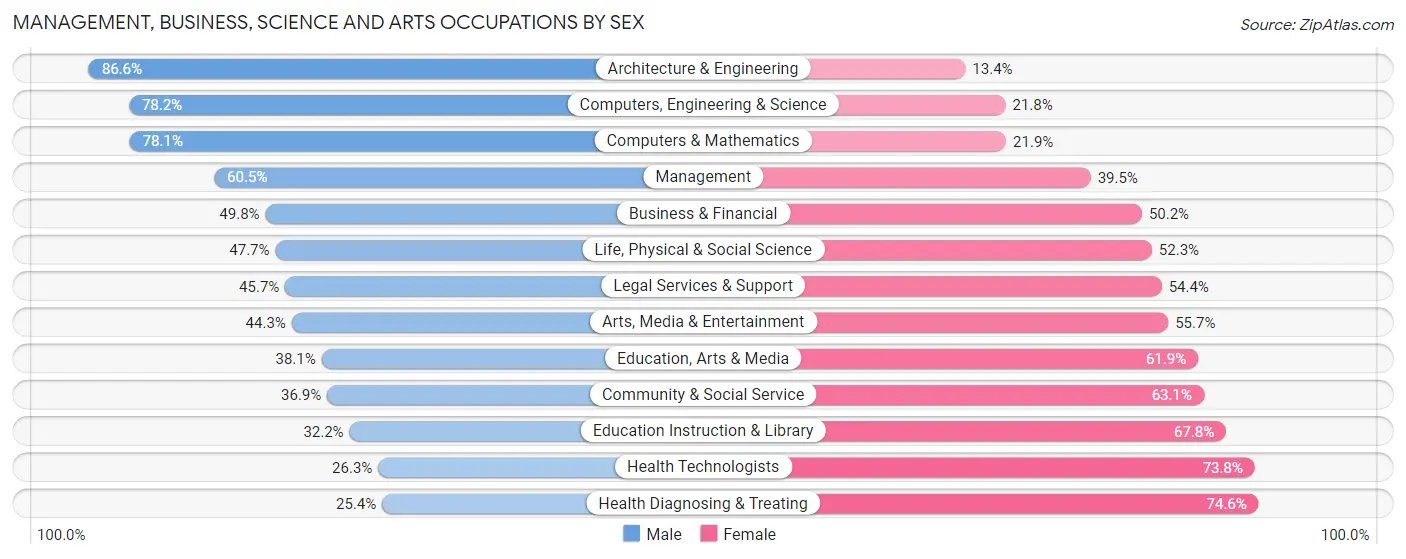
Management, Business, Science and Arts Occupations by Sex
Within the Management, Business, Science and Arts occupations in Kent County, the most male-oriented occupations are Architecture & Engineering (86.6%), Computers, Engineering & Science (78.2%), and Computers & Mathematics (78.1%), while the most female-oriented occupations are Health Diagnosing & Treating (74.6%), Health Technologists (73.8%), and Education Instruction & Library (67.8%).
| Occupation | Male | Female |
| Management | 21,660 (60.5%) | 14,164 (39.5%) |
| Business & Financial | 10,969 (49.8%) | 11,070 (50.2%) |
| Computers, Engineering & Science | 17,606 (78.2%) | 4,898 (21.8%) |
| Computers & Mathematics | 8,473 (78.1%) | 2,376 (21.9%) |
| Architecture & Engineering | 7,956 (86.6%) | 1,231 (13.4%) |
| Life, Physical & Social Science | 1,177 (47.7%) | 1,291 (52.3%) |
| Community & Social Service | 12,987 (36.9%) | 22,218 (63.1%) |
| Education, Arts & Media | 2,619 (38.1%) | 4,262 (61.9%) |
| Legal Services & Support | 1,322 (45.7%) | 1,574 (54.3%) |
| Education Instruction & Library | 5,933 (32.2%) | 12,467 (67.8%) |
| Arts, Media & Entertainment | 3,113 (44.3%) | 3,915 (55.7%) |
| Health Diagnosing & Treating | 6,230 (25.4%) | 18,259 (74.6%) |
| Health Technologists | 4,678 (26.3%) | 13,142 (73.8%) |
| Total (Category) | 69,452 (49.6%) | 70,609 (50.4%) |
| Total (Overall) | 181,433 (53.0%) | 160,854 (47.0%) |
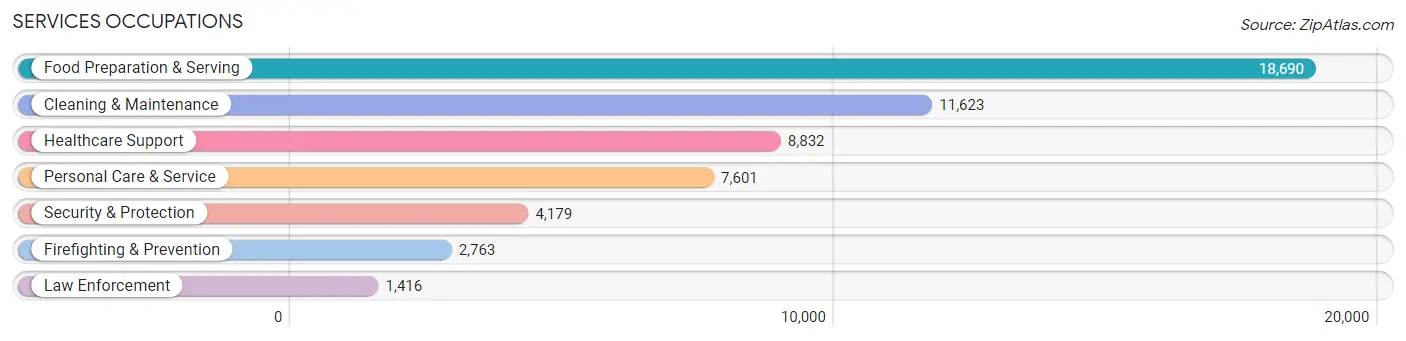
Services Occupations
The most common Services occupations in Kent County are Food Preparation & Serving (18,690 | 5.5%), Cleaning & Maintenance (11,623 | 3.4%), Healthcare Support (8,832 | 2.6%), Personal Care & Service (7,601 | 2.2%), and Security & Protection (4,179 | 1.2%).
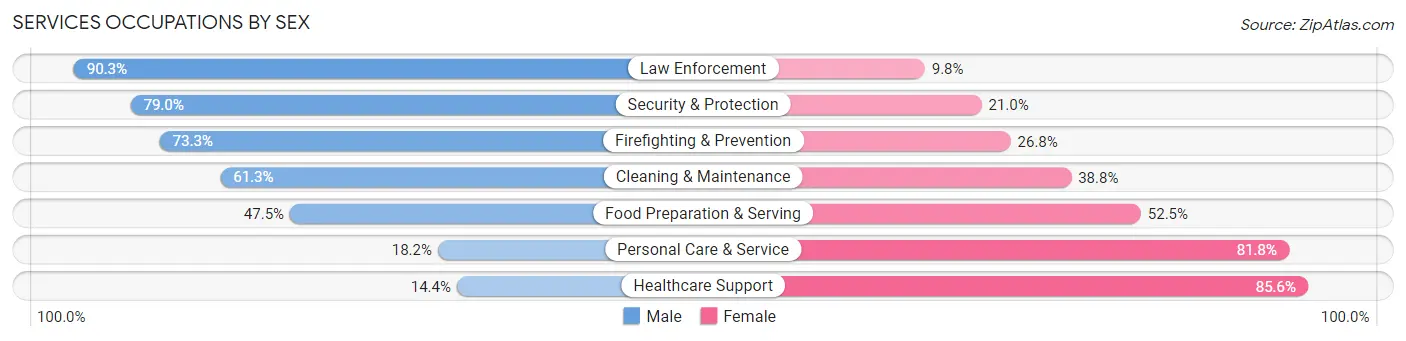
Services Occupations by Sex
Within the Services occupations in Kent County, the most male-oriented occupations are Law Enforcement (90.2%), Security & Protection (79.0%), and Firefighting & Prevention (73.3%), while the most female-oriented occupations are Healthcare Support (85.6%), Personal Care & Service (81.8%), and Food Preparation & Serving (52.5%).
| Occupation | Male | Female |
| Healthcare Support | 1,274 (14.4%) | 7,558 (85.6%) |
| Security & Protection | 3,302 (79.0%) | 877 (21.0%) |
| Firefighting & Prevention | 2,024 (73.3%) | 739 (26.8%) |
| Law Enforcement | 1,278 (90.2%) | 138 (9.8%) |
| Food Preparation & Serving | 8,871 (47.5%) | 9,819 (52.5%) |
| Cleaning & Maintenance | 7,119 (61.3%) | 4,504 (38.8%) |
| Personal Care & Service | 1,381 (18.2%) | 6,220 (81.8%) |
| Total (Category) | 21,947 (43.1%) | 28,978 (56.9%) |
| Total (Overall) | 181,433 (53.0%) | 160,854 (47.0%) |
Sales and Office Occupations
The most common Sales and Office occupations in Kent County are Office & Administration (37,603 | 11.0%), and Sales & Related (32,634 | 9.5%).

Sales and Office Occupations by Sex
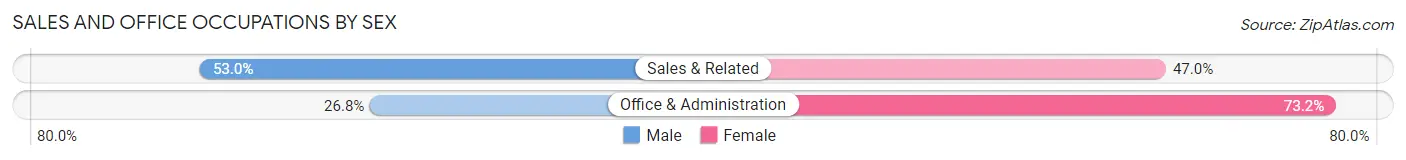
| Occupation | Male | Female |
| Sales & Related | 17,298 (53.0%) | 15,336 (47.0%) |
| Office & Administration | 10,094 (26.8%) | 27,509 (73.2%) |
| Total (Category) | 27,392 (39.0%) | 42,845 (61.0%) |
| Total (Overall) | 181,433 (53.0%) | 160,854 (47.0%) |
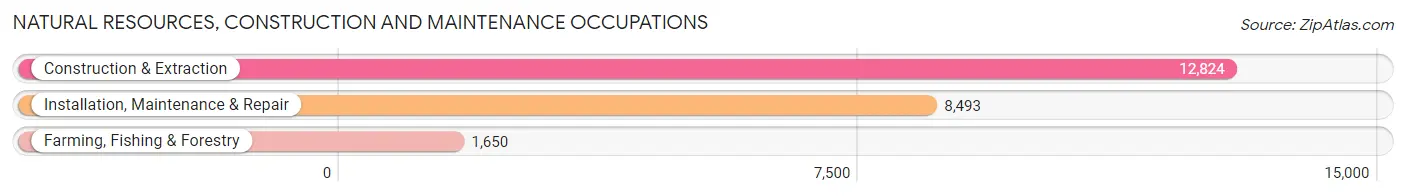
Natural Resources, Construction and Maintenance Occupations
The most common Natural Resources, Construction and Maintenance occupations in Kent County are Construction & Extraction (12,824 | 3.7%), Installation, Maintenance & Repair (8,493 | 2.5%), and Farming, Fishing & Forestry (1,650 | 0.5%).
Natural Resources, Construction and Maintenance Occupations by Sex
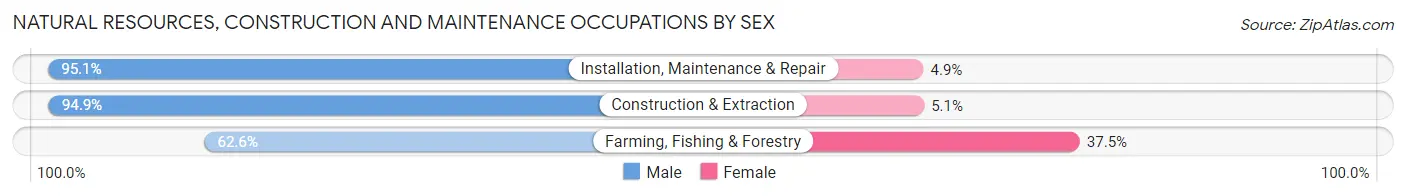
| Occupation | Male | Female |
| Farming, Fishing & Forestry | 1,032 (62.5%) | 618 (37.4%) |
| Construction & Extraction | 12,175 (94.9%) | 649 (5.1%) |
| Installation, Maintenance & Repair | 8,074 (95.1%) | 419 (4.9%) |
| Total (Category) | 21,281 (92.7%) | 1,686 (7.3%) |
| Total (Overall) | 181,433 (53.0%) | 160,854 (47.0%) |
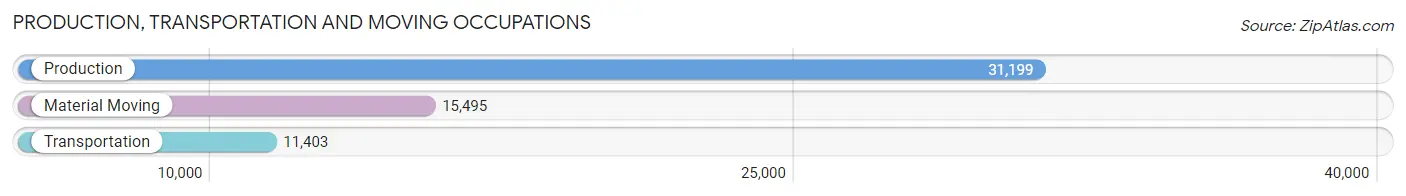
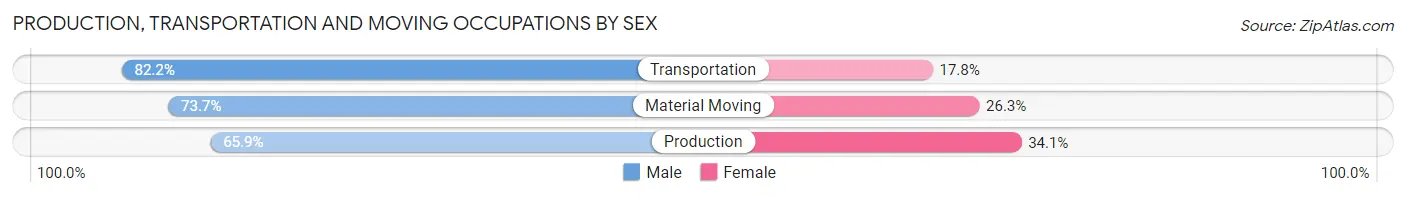
Production, Transportation and Moving Occupations
The most common Production, Transportation and Moving occupations in Kent County are Production (31,199 | 9.1%), Material Moving (15,495 | 4.5%), and Transportation (11,403 | 3.3%).
Production, Transportation and Moving Occupations by Sex
| Occupation | Male | Female |
| Production | 20,573 (65.9%) | 10,626 (34.1%) |
| Transportation | 9,374 (82.2%) | 2,029 (17.8%) |
| Material Moving | 11,414 (73.7%) | 4,081 (26.3%) |
| Total (Category) | 41,361 (71.2%) | 16,736 (28.8%) |
| Total (Overall) | 181,433 (53.0%) | 160,854 (47.0%) |
Employment Industries by Sex in Kent County
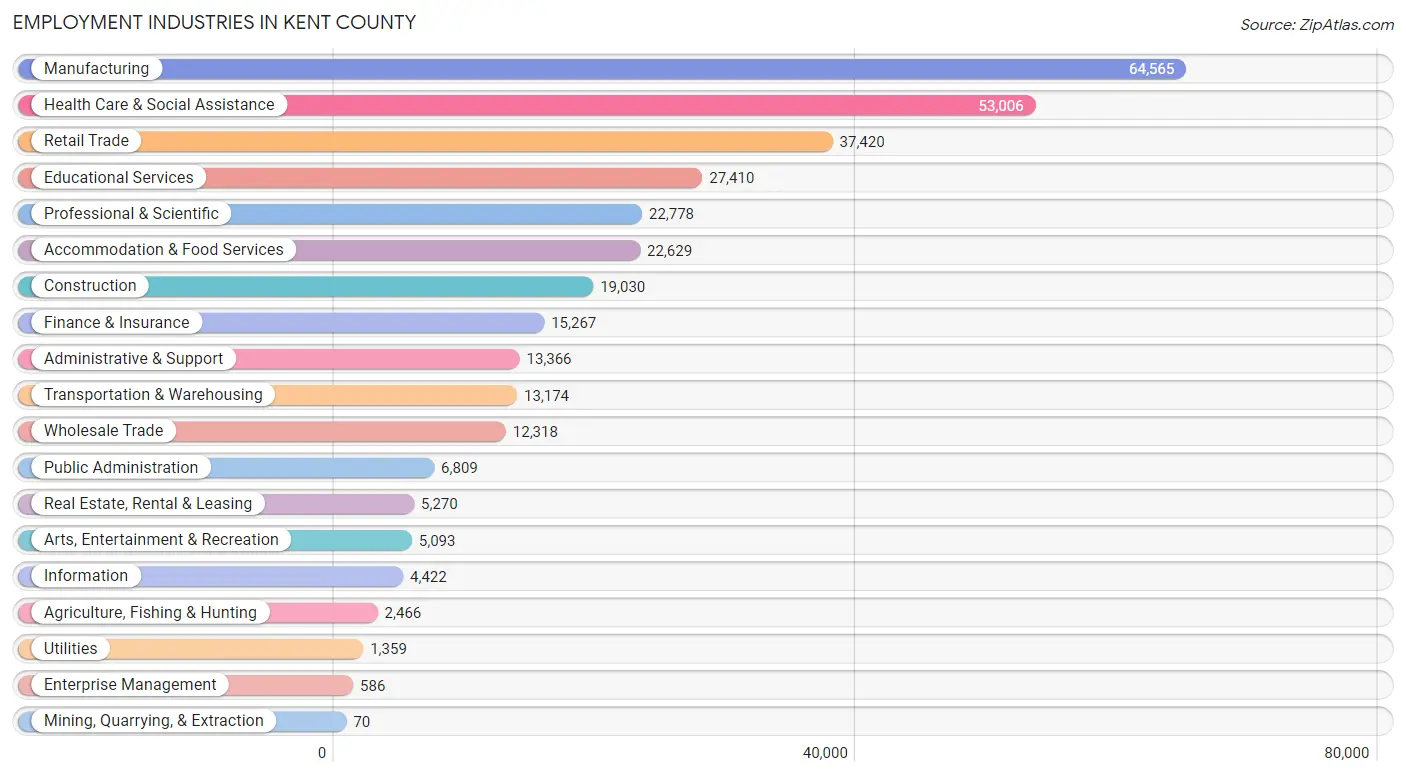
Employment Industries in Kent County
The major employment industries in Kent County include Manufacturing (64,565 | 18.9%), Health Care & Social Assistance (53,006 | 15.5%), Retail Trade (37,420 | 10.9%), Educational Services (27,410 | 8.0%), and Professional & Scientific (22,778 | 6.7%).
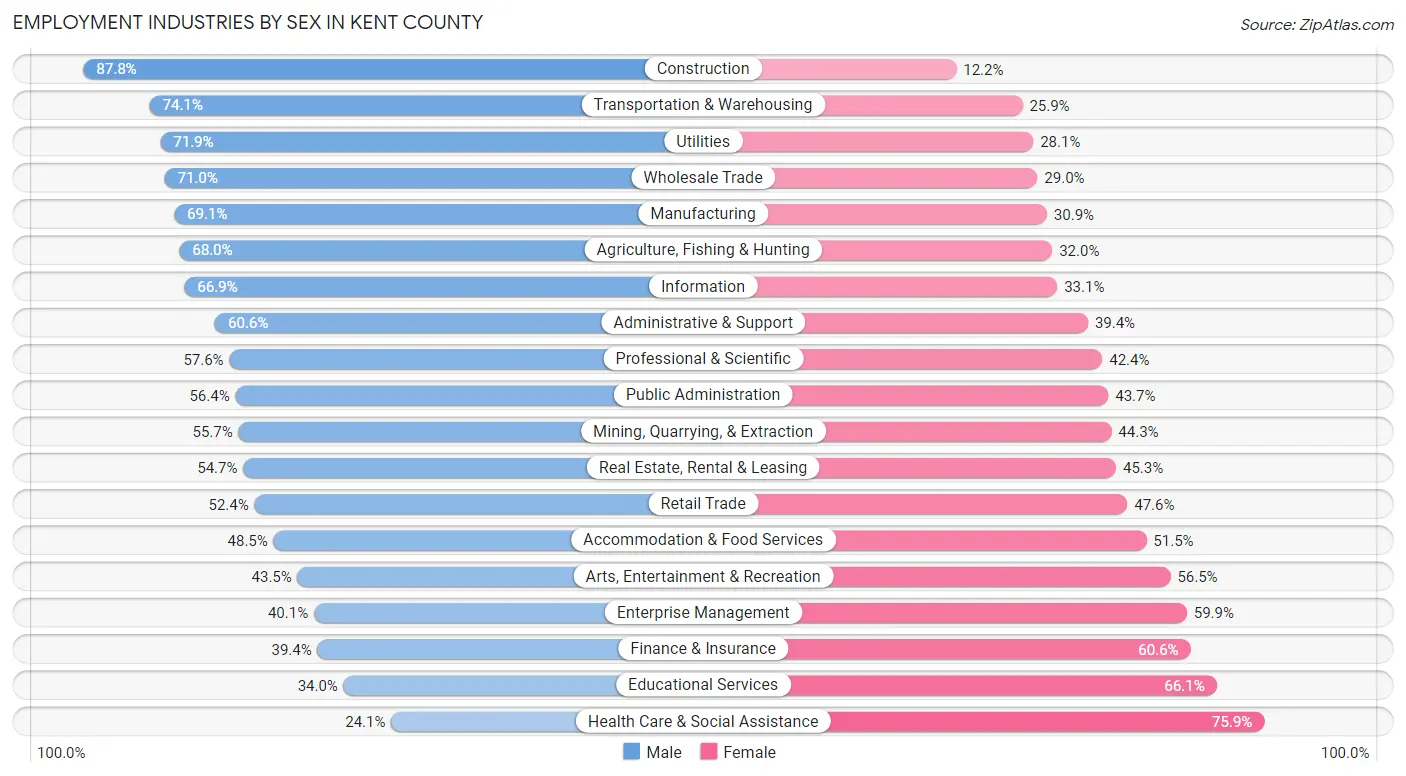
Employment Industries by Sex in Kent County
The Kent County industries that see more men than women are Construction (87.8%), Transportation & Warehousing (74.1%), and Utilities (71.9%), whereas the industries that tend to have a higher number of women are Health Care & Social Assistance (75.9%), Educational Services (66.0%), and Finance & Insurance (60.6%).
| Industry | Male | Female |
| Agriculture, Fishing & Hunting | 1,676 (68.0%) | 790 (32.0%) |
| Mining, Quarrying, & Extraction | 39 (55.7%) | 31 (44.3%) |
| Construction | 16,712 (87.8%) | 2,318 (12.2%) |
| Manufacturing | 44,589 (69.1%) | 19,976 (30.9%) |
| Wholesale Trade | 8,750 (71.0%) | 3,568 (29.0%) |
| Retail Trade | 19,613 (52.4%) | 17,807 (47.6%) |
| Transportation & Warehousing | 9,764 (74.1%) | 3,410 (25.9%) |
| Utilities | 977 (71.9%) | 382 (28.1%) |
| Information | 2,959 (66.9%) | 1,463 (33.1%) |
| Finance & Insurance | 6,009 (39.4%) | 9,258 (60.6%) |
| Real Estate, Rental & Leasing | 2,885 (54.7%) | 2,385 (45.3%) |
| Professional & Scientific | 13,120 (57.6%) | 9,658 (42.4%) |
| Enterprise Management | 235 (40.1%) | 351 (59.9%) |
| Administrative & Support | 8,095 (60.6%) | 5,271 (39.4%) |
| Educational Services | 9,305 (34.0%) | 18,105 (66.0%) |
| Health Care & Social Assistance | 12,773 (24.1%) | 40,233 (75.9%) |
| Arts, Entertainment & Recreation | 2,215 (43.5%) | 2,878 (56.5%) |
| Accommodation & Food Services | 10,965 (48.5%) | 11,664 (51.5%) |
| Public Administration | 3,837 (56.4%) | 2,972 (43.6%) |
| Total | 181,433 (53.0%) | 160,854 (47.0%) |
Education in Kent County
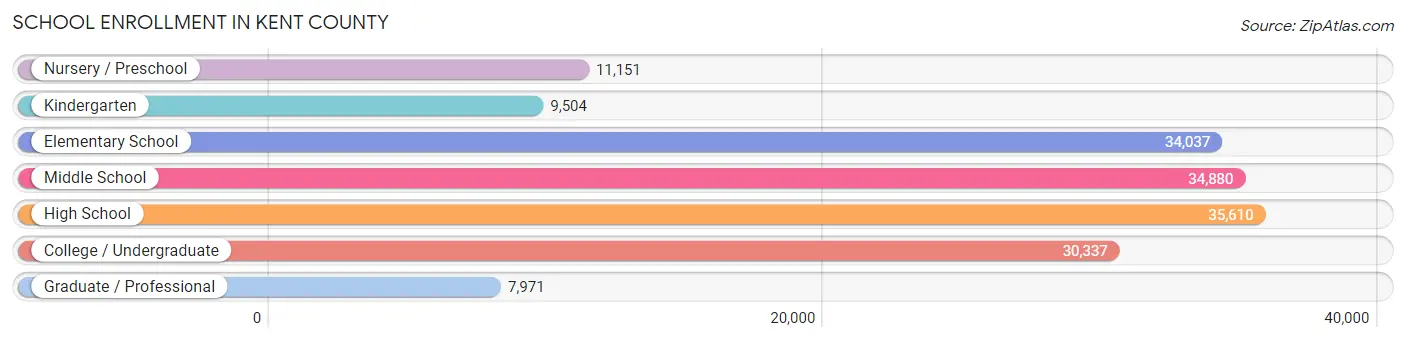
School Enrollment in Kent County
The most common levels of schooling among the 163,490 students in Kent County are high school (35,610 | 21.8%), middle school (34,880 | 21.3%), and elementary school (34,037 | 20.8%).
| School Level | # Students | % Students |
| Nursery / Preschool | 11,151 | 6.8% |
| Kindergarten | 9,504 | 5.8% |
| Elementary School | 34,037 | 20.8% |
| Middle School | 34,880 | 21.3% |
| High School | 35,610 | 21.8% |
| College / Undergraduate | 30,337 | 18.6% |
| Graduate / Professional | 7,971 | 4.9% |
| Total | 163,490 | 100.0% |
School Enrollment by Age by Funding Source in Kent County
Out of a total of 163,490 students who are enrolled in schools in Kent County, 34,169 (20.9%) attend a private institution, while the remaining 129,321 (79.1%) are enrolled in public schools. The age group of 3 to 4 year olds has the highest likelihood of being enrolled in private schools, with 3,190 (35.9% in the age bracket) enrolled. Conversely, the age group of 10 to 14 year olds has the lowest likelihood of being enrolled in a private school, with 36,309 (84.6% in the age bracket) attending a public institution.
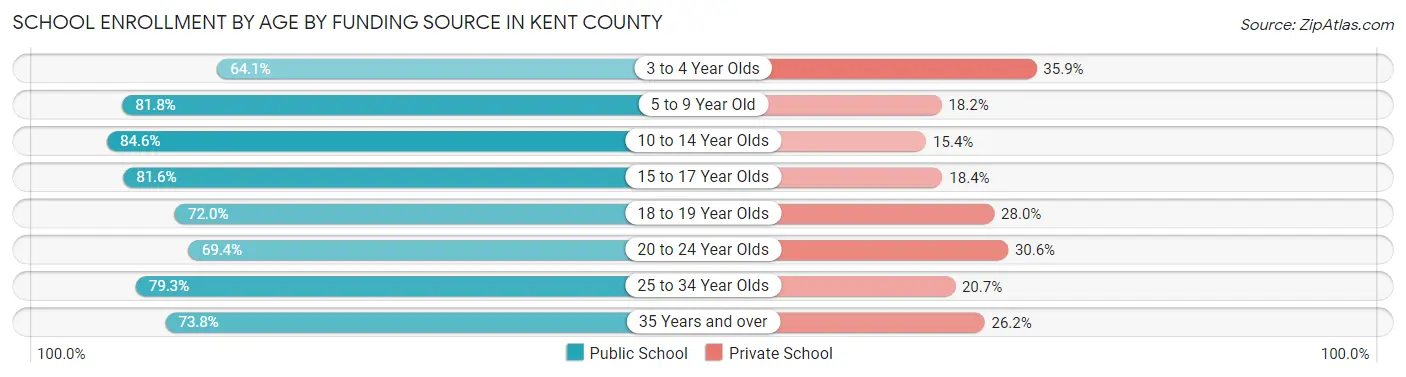
| Age Bracket | Public School | Private School |
| 3 to 4 Year Olds | 5,696 (64.1%) | 3,190 (35.9%) |
| 5 to 9 Year Old | 33,651 (81.8%) | 7,498 (18.2%) |
| 10 to 14 Year Olds | 36,309 (84.6%) | 6,591 (15.4%) |
| 15 to 17 Year Olds | 21,395 (81.6%) | 4,821 (18.4%) |
| 18 to 19 Year Olds | 8,916 (72.0%) | 3,473 (28.0%) |
| 20 to 24 Year Olds | 11,294 (69.4%) | 4,979 (30.6%) |
| 25 to 34 Year Olds | 7,500 (79.3%) | 1,961 (20.7%) |
| 35 Years and over | 4,585 (73.8%) | 1,631 (26.2%) |
| Total | 129,321 (79.1%) | 34,169 (20.9%) |
Educational Attainment by Field of Study in Kent County
Business (41,877 | 22.6%), education (21,510 | 11.6%), science & technology (21,043 | 11.4%), arts & humanities (13,379 | 7.2%), and social sciences (10,941 | 5.9%) are the most common fields of study among 185,305 individuals in Kent County who have obtained a bachelor's degree or higher.
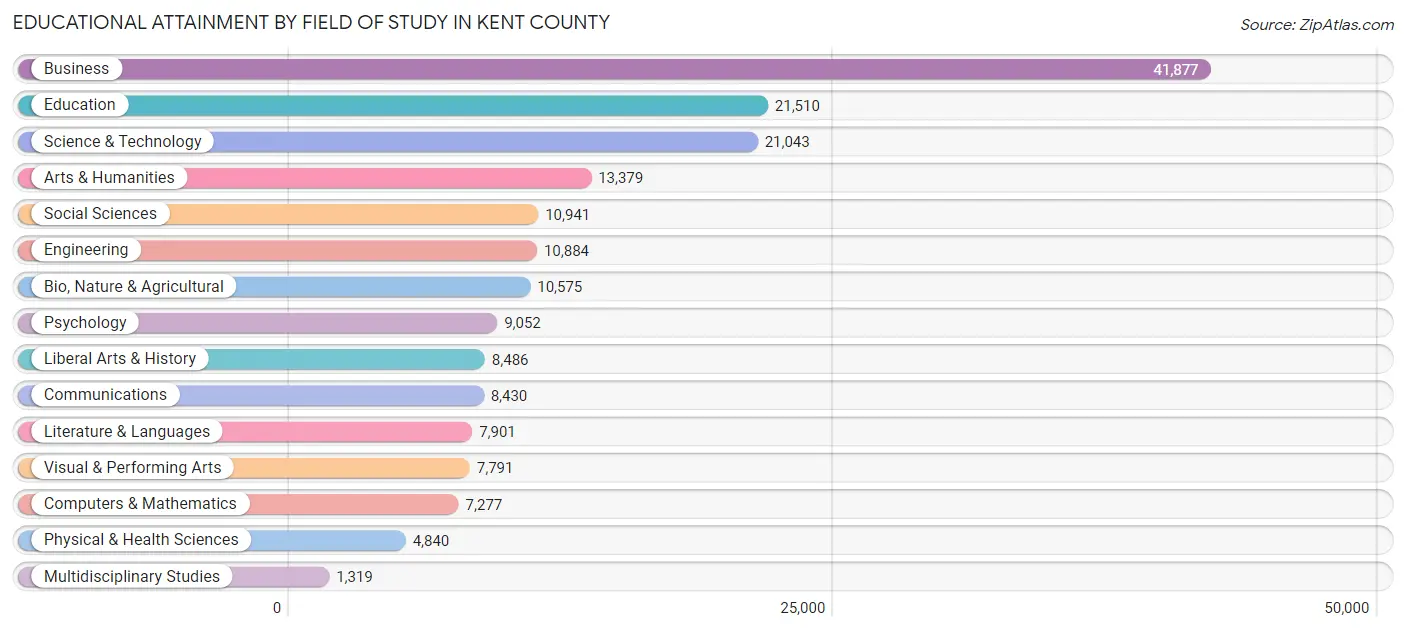
| Field of Study | # Graduates | % Graduates |
| Computers & Mathematics | 7,277 | 3.9% |
| Bio, Nature & Agricultural | 10,575 | 5.7% |
| Physical & Health Sciences | 4,840 | 2.6% |
| Psychology | 9,052 | 4.9% |
| Social Sciences | 10,941 | 5.9% |
| Engineering | 10,884 | 5.9% |
| Multidisciplinary Studies | 1,319 | 0.7% |
| Science & Technology | 21,043 | 11.4% |
| Business | 41,877 | 22.6% |
| Education | 21,510 | 11.6% |
| Literature & Languages | 7,901 | 4.3% |
| Liberal Arts & History | 8,486 | 4.6% |
| Visual & Performing Arts | 7,791 | 4.2% |
| Communications | 8,430 | 4.5% |
| Arts & Humanities | 13,379 | 7.2% |
| Total | 185,305 | 100.0% |
Transportation & Commute in Kent County
Vehicle Availability by Sex in Kent County
The most prevalent vehicle ownership categories in Kent County are males with 2 vehicles (84,718, accounting for 47.6%) and females with 2 vehicles (70,531, making up 54.4%).
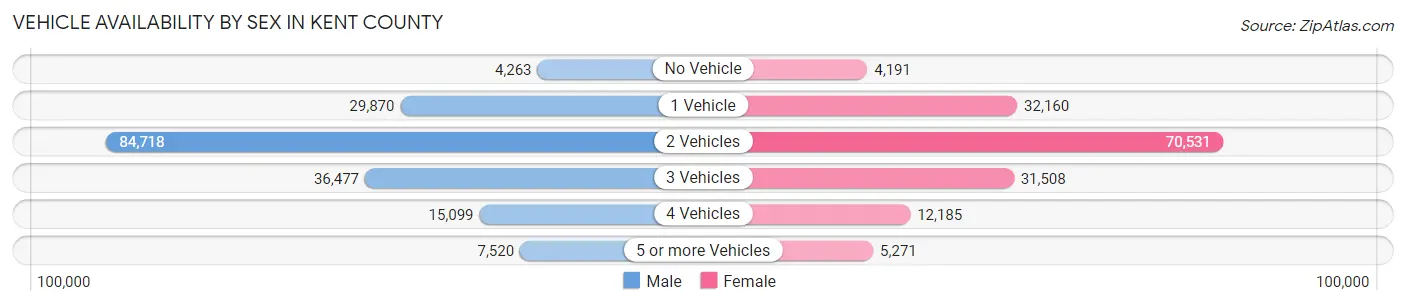
| Vehicles Available | Male | Female |
| No Vehicle | 4,263 (2.4%) | 4,191 (2.7%) |
| 1 Vehicle | 29,870 (16.8%) | 32,160 (20.6%) |
| 2 Vehicles | 84,718 (47.6%) | 70,531 (45.3%) |
| 3 Vehicles | 36,477 (20.5%) | 31,508 (20.2%) |
| 4 Vehicles | 15,099 (8.5%) | 12,185 (7.8%) |
| 5 or more Vehicles | 7,520 (4.2%) | 5,271 (3.4%) |
| Total | 177,947 (100.0%) | 155,846 (100.0%) |
Commute Time in Kent County
The most frequently occuring commute durations in Kent County are 15 to 19 minutes (62,632 commuters, 20.9%), 20 to 24 minutes (55,334 commuters, 18.5%), and 10 to 14 minutes (49,636 commuters, 16.6%).
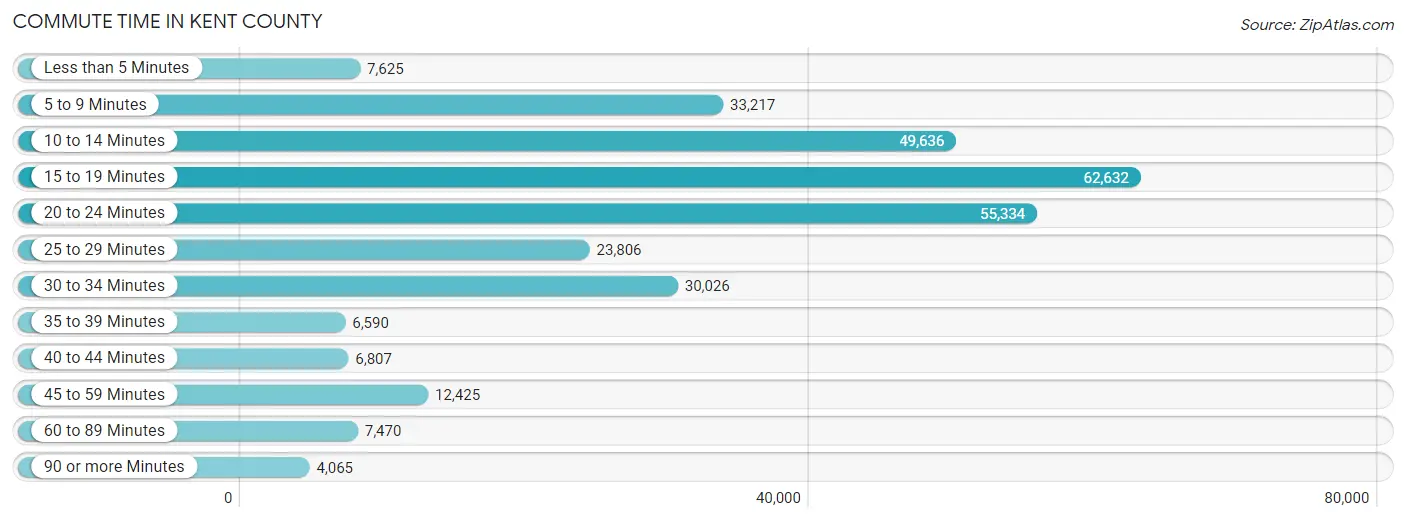
| Commute Time | # Commuters | % Commuters |
| Less than 5 Minutes | 7,625 | 2.5% |
| 5 to 9 Minutes | 33,217 | 11.1% |
| 10 to 14 Minutes | 49,636 | 16.6% |
| 15 to 19 Minutes | 62,632 | 20.9% |
| 20 to 24 Minutes | 55,334 | 18.5% |
| 25 to 29 Minutes | 23,806 | 8.0% |
| 30 to 34 Minutes | 30,026 | 10.0% |
| 35 to 39 Minutes | 6,590 | 2.2% |
| 40 to 44 Minutes | 6,807 | 2.3% |
| 45 to 59 Minutes | 12,425 | 4.2% |
| 60 to 89 Minutes | 7,470 | 2.5% |
| 90 or more Minutes | 4,065 | 1.4% |
Commute Time by Sex in Kent County
The most common commute times in Kent County are 15 to 19 minutes (33,283 commuters, 20.6%) for males and 15 to 19 minutes (29,349 commuters, 21.2%) for females.
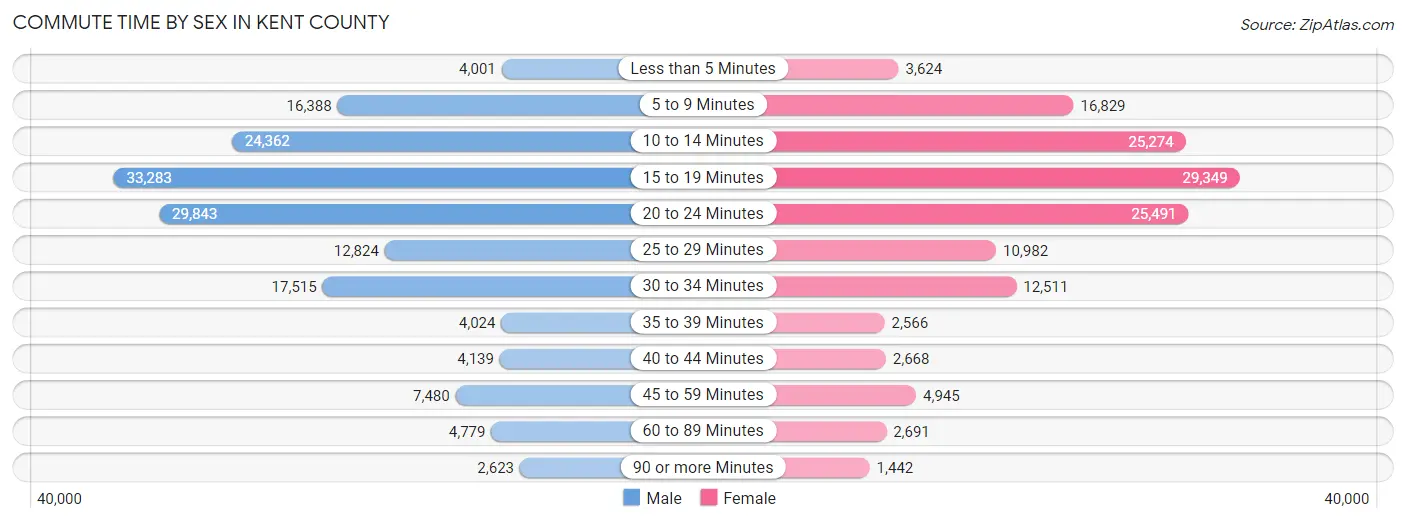
| Commute Time | Male | Female |
| Less than 5 Minutes | 4,001 (2.5%) | 3,624 (2.6%) |
| 5 to 9 Minutes | 16,388 (10.2%) | 16,829 (12.2%) |
| 10 to 14 Minutes | 24,362 (15.1%) | 25,274 (18.3%) |
| 15 to 19 Minutes | 33,283 (20.6%) | 29,349 (21.2%) |
| 20 to 24 Minutes | 29,843 (18.5%) | 25,491 (18.4%) |
| 25 to 29 Minutes | 12,824 (8.0%) | 10,982 (7.9%) |
| 30 to 34 Minutes | 17,515 (10.9%) | 12,511 (9.0%) |
| 35 to 39 Minutes | 4,024 (2.5%) | 2,566 (1.8%) |
| 40 to 44 Minutes | 4,139 (2.6%) | 2,668 (1.9%) |
| 45 to 59 Minutes | 7,480 (4.6%) | 4,945 (3.6%) |
| 60 to 89 Minutes | 4,779 (3.0%) | 2,691 (1.9%) |
| 90 or more Minutes | 2,623 (1.6%) | 1,442 (1.0%) |
Time of Departure to Work by Sex in Kent County
The most frequent times of departure to work in Kent County are 7:30 AM to 7:59 AM (22,295, 13.8%) for males and 7:30 AM to 7:59 AM (21,207, 15.3%) for females.
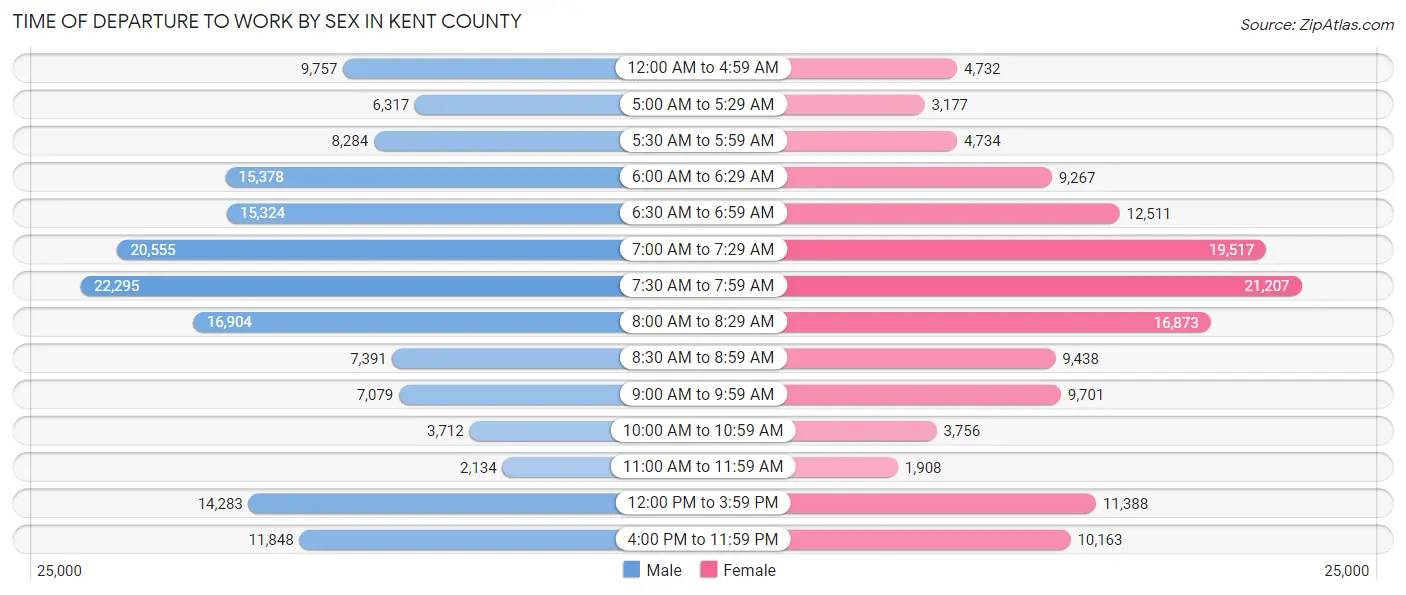
| Time of Departure | Male | Female |
| 12:00 AM to 4:59 AM | 9,757 (6.0%) | 4,732 (3.4%) |
| 5:00 AM to 5:29 AM | 6,317 (3.9%) | 3,177 (2.3%) |
| 5:30 AM to 5:59 AM | 8,284 (5.1%) | 4,734 (3.4%) |
| 6:00 AM to 6:29 AM | 15,378 (9.5%) | 9,267 (6.7%) |
| 6:30 AM to 6:59 AM | 15,324 (9.5%) | 12,511 (9.0%) |
| 7:00 AM to 7:29 AM | 20,555 (12.8%) | 19,517 (14.1%) |
| 7:30 AM to 7:59 AM | 22,295 (13.8%) | 21,207 (15.3%) |
| 8:00 AM to 8:29 AM | 16,904 (10.5%) | 16,873 (12.2%) |
| 8:30 AM to 8:59 AM | 7,391 (4.6%) | 9,438 (6.8%) |
| 9:00 AM to 9:59 AM | 7,079 (4.4%) | 9,701 (7.0%) |
| 10:00 AM to 10:59 AM | 3,712 (2.3%) | 3,756 (2.7%) |
| 11:00 AM to 11:59 AM | 2,134 (1.3%) | 1,908 (1.4%) |
| 12:00 PM to 3:59 PM | 14,283 (8.9%) | 11,388 (8.2%) |
| 4:00 PM to 11:59 PM | 11,848 (7.3%) | 10,163 (7.3%) |
| Total | 161,261 (100.0%) | 138,372 (100.0%) |
Housing Occupancy in Kent County
Occupancy by Ownership in Kent County
Of the total 252,694 dwellings in Kent County, owner-occupied units account for 176,905 (70.0%), while renter-occupied units make up 75,789 (30.0%).
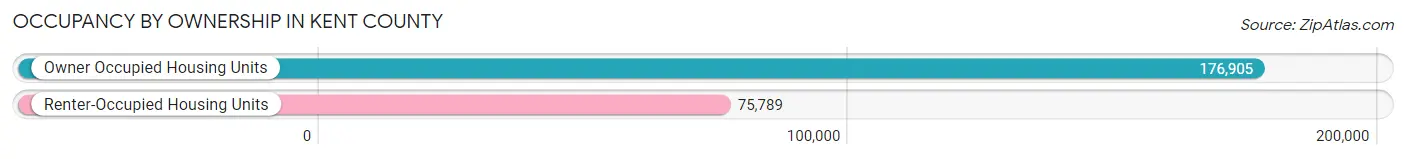
| Occupancy | # Housing Units | % Housing Units |
| Owner Occupied Housing Units | 176,905 | 70.0% |
| Renter-Occupied Housing Units | 75,789 | 30.0% |
| Total Occupied Housing Units | 252,694 | 100.0% |
Occupancy by Household Size in Kent County
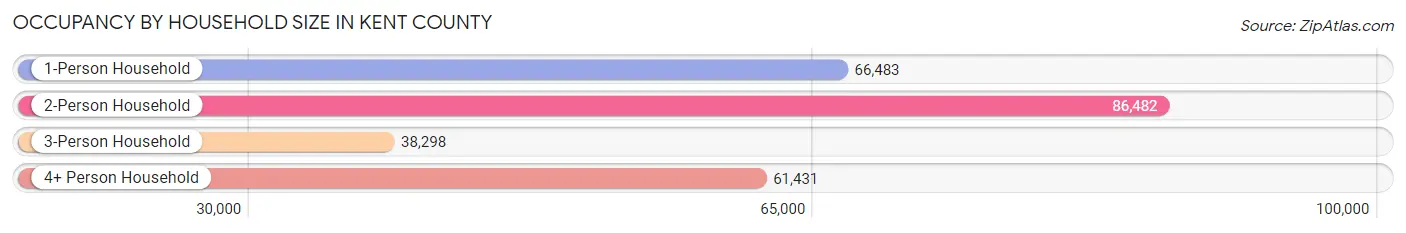
| Household Size | # Housing Units | % Housing Units |
| 1-Person Household | 66,483 | 26.3% |
| 2-Person Household | 86,482 | 34.2% |
| 3-Person Household | 38,298 | 15.2% |
| 4+ Person Household | 61,431 | 24.3% |
| Total Housing Units | 252,694 | 100.0% |
Occupancy by Ownership by Household Size in Kent County
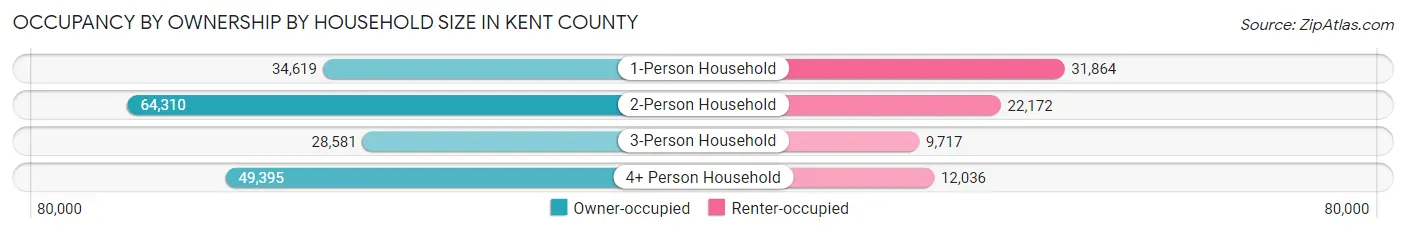
| Household Size | Owner-occupied | Renter-occupied |
| 1-Person Household | 34,619 (52.1%) | 31,864 (47.9%) |
| 2-Person Household | 64,310 (74.4%) | 22,172 (25.6%) |
| 3-Person Household | 28,581 (74.6%) | 9,717 (25.4%) |
| 4+ Person Household | 49,395 (80.4%) | 12,036 (19.6%) |
| Total Housing Units | 176,905 (70.0%) | 75,789 (30.0%) |
Occupancy by Educational Attainment in Kent County
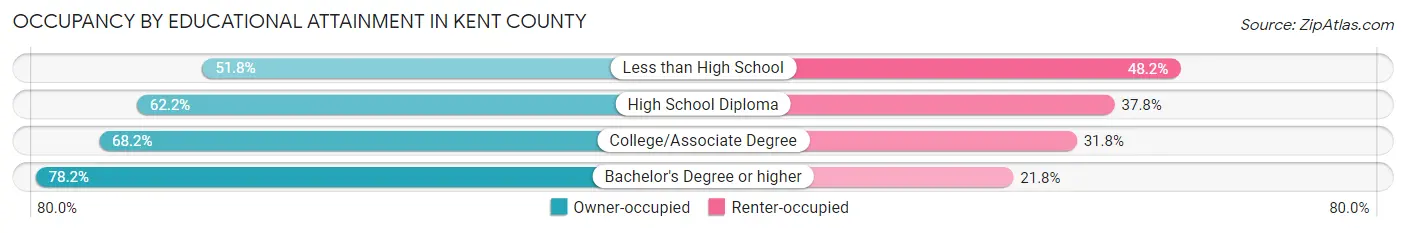
| Household Size | Owner-occupied | Renter-occupied |
| Less than High School | 8,594 (51.8%) | 7,995 (48.2%) |
| High School Diploma | 33,231 (62.2%) | 20,214 (37.8%) |
| College/Associate Degree | 53,144 (68.2%) | 24,796 (31.8%) |
| Bachelor's Degree or higher | 81,936 (78.2%) | 22,784 (21.8%) |
Occupancy by Age of Householder in Kent County
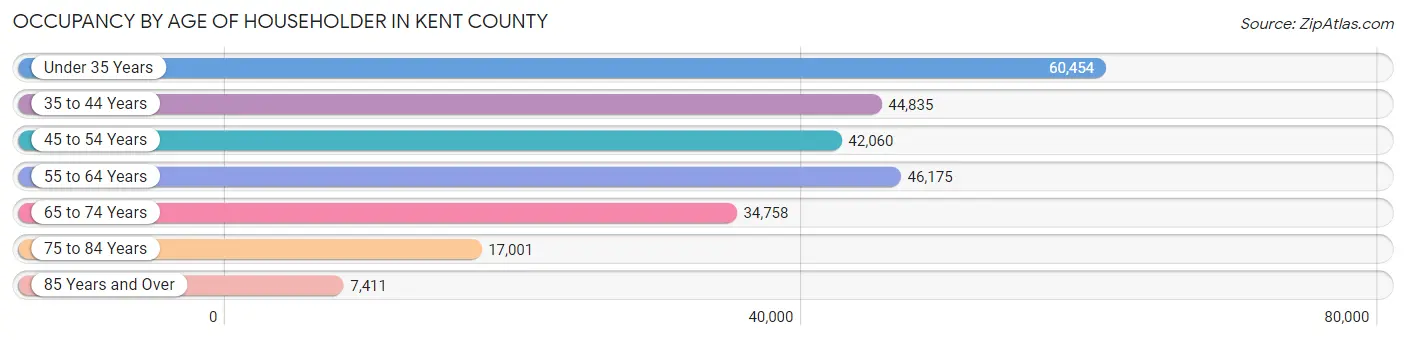
| Age Bracket | # Households | % Households |
| Under 35 Years | 60,454 | 23.9% |
| 35 to 44 Years | 44,835 | 17.7% |
| 45 to 54 Years | 42,060 | 16.6% |
| 55 to 64 Years | 46,175 | 18.3% |
| 65 to 74 Years | 34,758 | 13.8% |
| 75 to 84 Years | 17,001 | 6.7% |
| 85 Years and Over | 7,411 | 2.9% |
| Total | 252,694 | 100.0% |
Housing Finances in Kent County
Median Income by Occupancy in Kent County
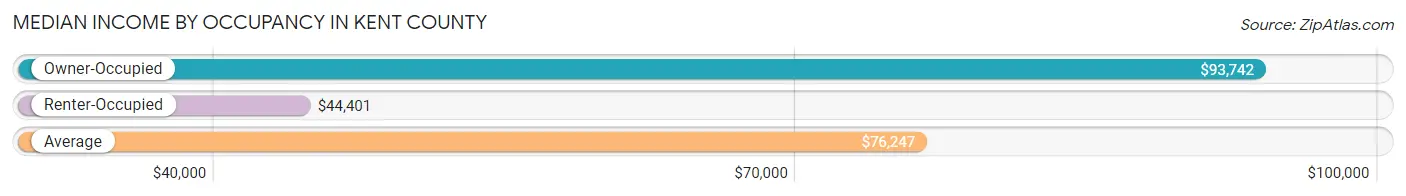
| Occupancy Type | # Households | Median Income |
| Owner-Occupied | 176,905 (70.0%) | $93,742 |
| Renter-Occupied | 75,789 (30.0%) | $44,401 |
| Average | 252,694 (100.0%) | $76,247 |
Occupancy by Householder Income Bracket in Kent County
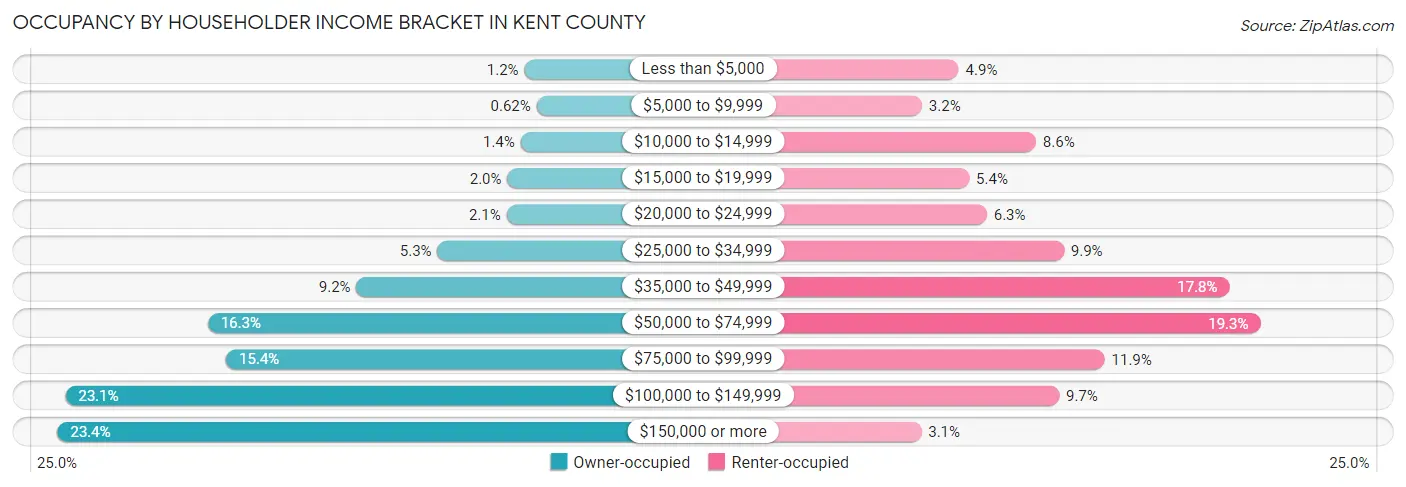
| Income Bracket | Owner-occupied | Renter-occupied |
| Less than $5,000 | 2,123 (1.2%) | 3,721 (4.9%) |
| $5,000 to $9,999 | 1,090 (0.6%) | 2,393 (3.2%) |
| $10,000 to $14,999 | 2,450 (1.4%) | 6,512 (8.6%) |
| $15,000 to $19,999 | 3,559 (2.0%) | 4,098 (5.4%) |
| $20,000 to $24,999 | 3,630 (2.1%) | 4,740 (6.2%) |
| $25,000 to $34,999 | 9,438 (5.3%) | 7,521 (9.9%) |
| $35,000 to $49,999 | 16,268 (9.2%) | 13,491 (17.8%) |
| $50,000 to $74,999 | 28,807 (16.3%) | 14,608 (19.3%) |
| $75,000 to $99,999 | 27,266 (15.4%) | 8,990 (11.9%) |
| $100,000 to $149,999 | 40,800 (23.1%) | 7,341 (9.7%) |
| $150,000 or more | 41,474 (23.4%) | 2,374 (3.1%) |
| Total | 176,905 (100.0%) | 75,789 (100.0%) |
Monthly Housing Cost Tiers in Kent County
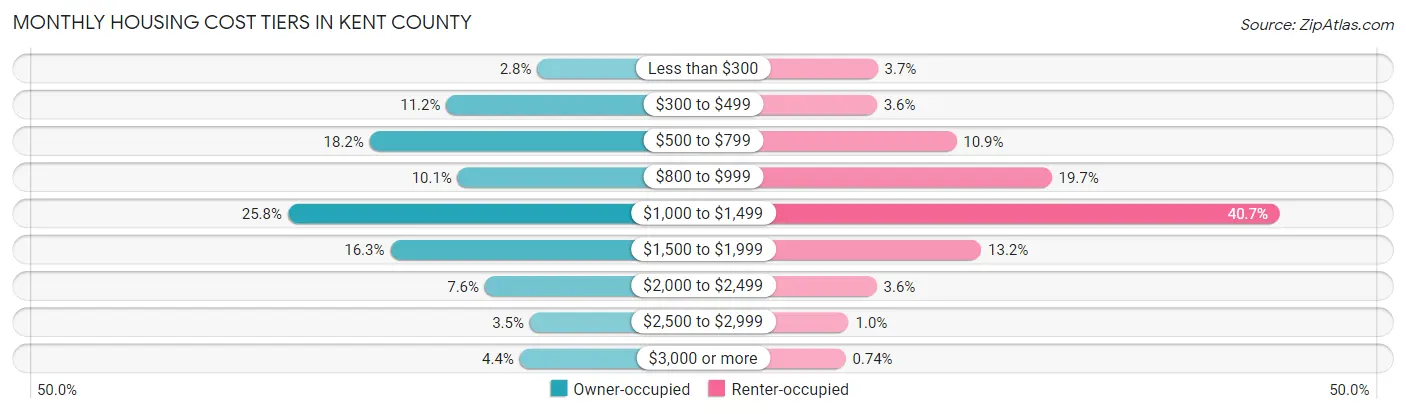
| Monthly Cost | Owner-occupied | Renter-occupied |
| Less than $300 | 4,953 (2.8%) | 2,803 (3.7%) |
| $300 to $499 | 19,777 (11.2%) | 2,742 (3.6%) |
| $500 to $799 | 32,276 (18.2%) | 8,295 (10.9%) |
| $800 to $999 | 17,917 (10.1%) | 14,938 (19.7%) |
| $1,000 to $1,499 | 45,590 (25.8%) | 30,861 (40.7%) |
| $1,500 to $1,999 | 28,888 (16.3%) | 10,029 (13.2%) |
| $2,000 to $2,499 | 13,496 (7.6%) | 2,739 (3.6%) |
| $2,500 to $2,999 | 6,181 (3.5%) | 777 (1.0%) |
| $3,000 or more | 7,827 (4.4%) | 558 (0.7%) |
| Total | 176,905 (100.0%) | 75,789 (100.0%) |
Physical Housing Characteristics in Kent County
Housing Structures in Kent County
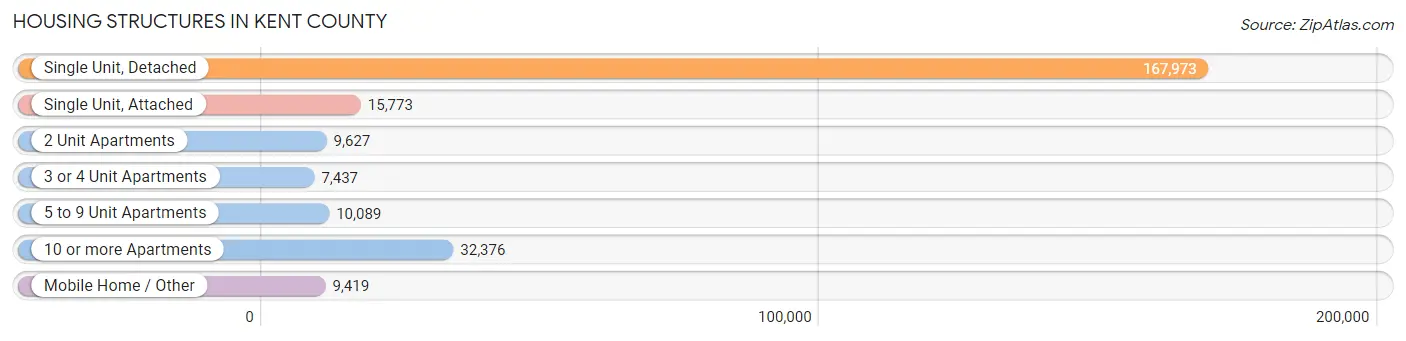
| Structure Type | # Housing Units | % Housing Units |
| Single Unit, Detached | 167,973 | 66.5% |
| Single Unit, Attached | 15,773 | 6.2% |
| 2 Unit Apartments | 9,627 | 3.8% |
| 3 or 4 Unit Apartments | 7,437 | 2.9% |
| 5 to 9 Unit Apartments | 10,089 | 4.0% |
| 10 or more Apartments | 32,376 | 12.8% |
| Mobile Home / Other | 9,419 | 3.7% |
| Total | 252,694 | 100.0% |
Housing Structures by Occupancy in Kent County
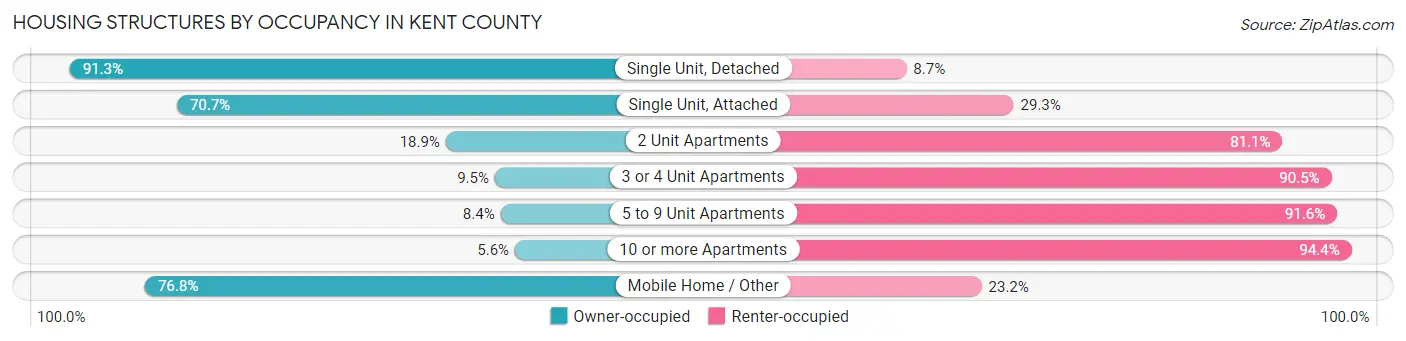
| Structure Type | Owner-occupied | Renter-occupied |
| Single Unit, Detached | 153,346 (91.3%) | 14,627 (8.7%) |
| Single Unit, Attached | 11,145 (70.7%) | 4,628 (29.3%) |
| 2 Unit Apartments | 1,821 (18.9%) | 7,806 (81.1%) |
| 3 or 4 Unit Apartments | 704 (9.5%) | 6,733 (90.5%) |
| 5 to 9 Unit Apartments | 844 (8.4%) | 9,245 (91.6%) |
| 10 or more Apartments | 1,810 (5.6%) | 30,566 (94.4%) |
| Mobile Home / Other | 7,235 (76.8%) | 2,184 (23.2%) |
| Total | 176,905 (70.0%) | 75,789 (30.0%) |
Housing Structures by Number of Rooms in Kent County
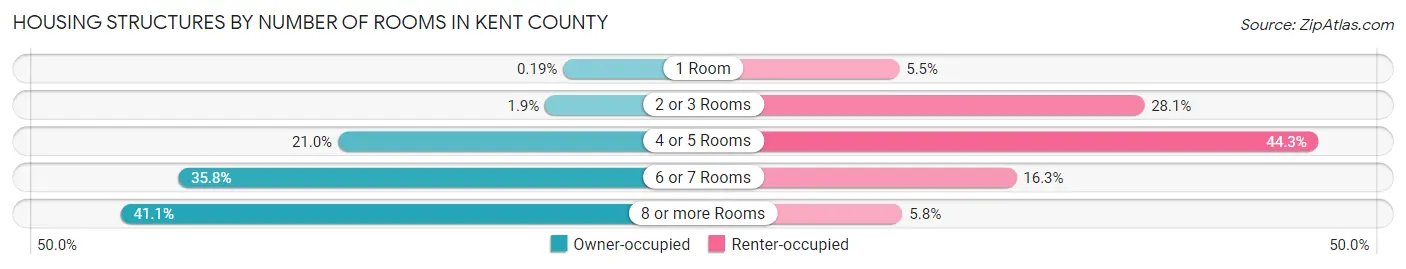
| Number of Rooms | Owner-occupied | Renter-occupied |
| 1 Room | 340 (0.2%) | 4,159 (5.5%) |
| 2 or 3 Rooms | 3,297 (1.9%) | 21,328 (28.1%) |
| 4 or 5 Rooms | 37,183 (21.0%) | 33,555 (44.3%) |
| 6 or 7 Rooms | 63,347 (35.8%) | 12,367 (16.3%) |
| 8 or more Rooms | 72,738 (41.1%) | 4,380 (5.8%) |
| Total | 176,905 (100.0%) | 75,789 (100.0%) |
Housing Structure by Heating Type in Kent County
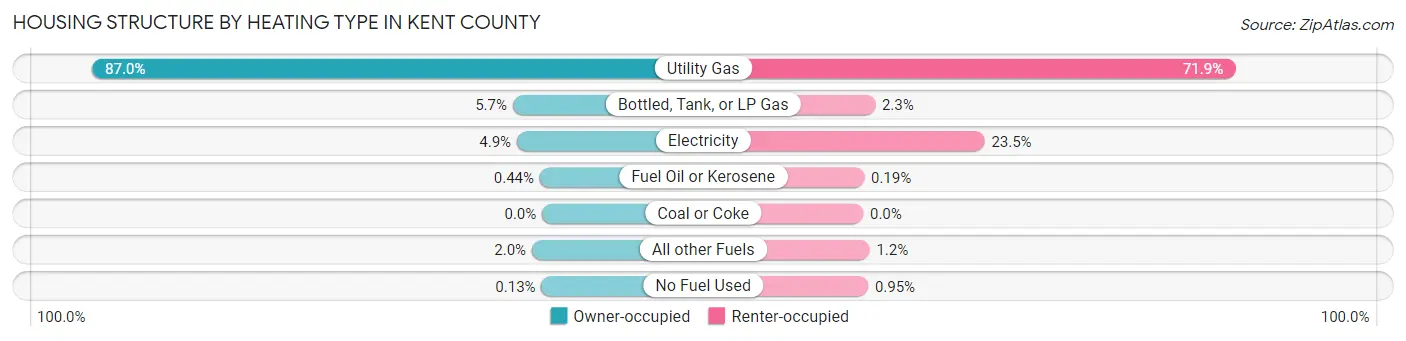
| Heating Type | Owner-occupied | Renter-occupied |
| Utility Gas | 153,816 (87.0%) | 54,469 (71.9%) |
| Bottled, Tank, or LP Gas | 10,006 (5.7%) | 1,740 (2.3%) |
| Electricity | 8,595 (4.9%) | 17,780 (23.5%) |
| Fuel Oil or Kerosene | 784 (0.4%) | 144 (0.2%) |
| Coal or Coke | 0 (0.0%) | 0 (0.0%) |
| All other Fuels | 3,470 (2.0%) | 939 (1.2%) |
| No Fuel Used | 234 (0.1%) | 717 (0.9%) |
| Total | 176,905 (100.0%) | 75,789 (100.0%) |
Household Vehicle Usage in Kent County
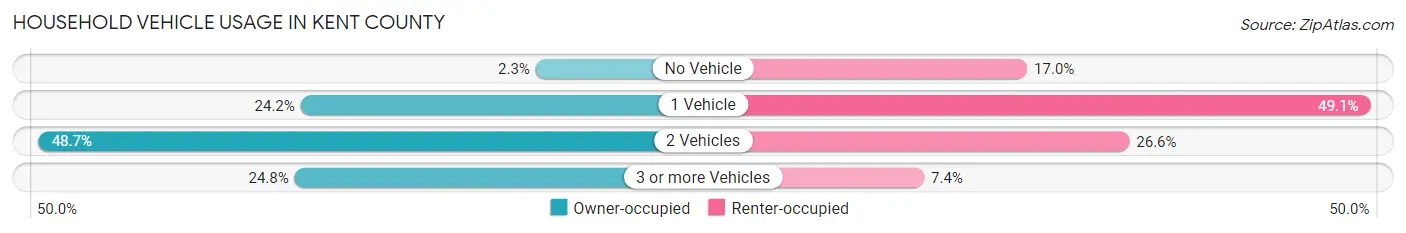
| Vehicles per Household | Owner-occupied | Renter-occupied |
| No Vehicle | 4,050 (2.3%) | 12,888 (17.0%) |
| 1 Vehicle | 42,875 (24.2%) | 37,177 (49.0%) |
| 2 Vehicles | 86,114 (48.7%) | 20,123 (26.6%) |
| 3 or more Vehicles | 43,866 (24.8%) | 5,601 (7.4%) |
| Total | 176,905 (100.0%) | 75,789 (100.0%) |
Real Estate & Mortgages in Kent County
Real Estate and Mortgage Overview in Kent County
| Characteristic | Without Mortgage | With Mortgage |
| Housing Units | 64,739 | 112,166 |
| Median Property Value | $230,800 | $247,700 |
| Median Household Income | $72,240 | $29,861 |
| Monthly Housing Costs | $572 | $7,683 |
| Real Estate Taxes | $2,769 | $3,751 |
Property Value by Mortgage Status in Kent County
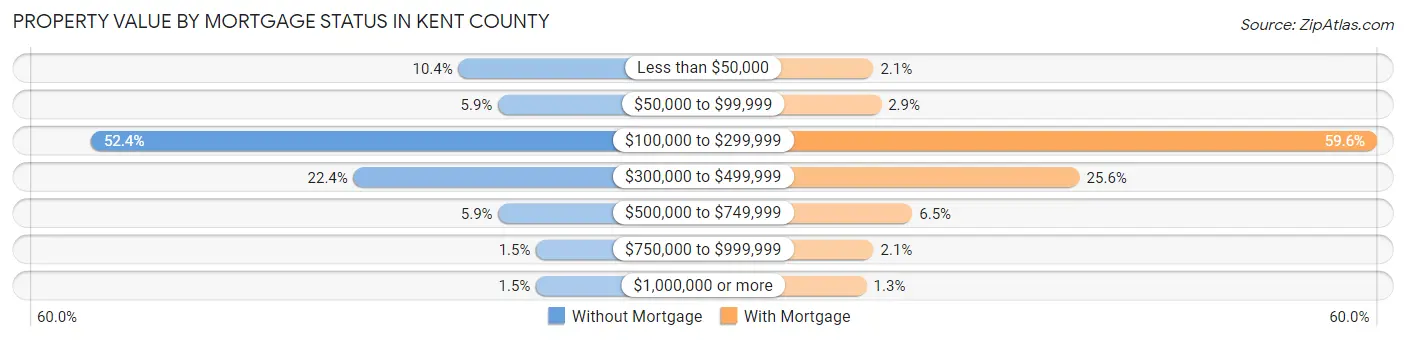
| Property Value | Without Mortgage | With Mortgage |
| Less than $50,000 | 6,739 (10.4%) | 2,304 (2.1%) |
| $50,000 to $99,999 | 3,804 (5.9%) | 3,287 (2.9%) |
| $100,000 to $299,999 | 33,932 (52.4%) | 66,824 (59.6%) |
| $300,000 to $499,999 | 14,502 (22.4%) | 28,729 (25.6%) |
| $500,000 to $749,999 | 3,788 (5.9%) | 7,285 (6.5%) |
| $750,000 to $999,999 | 986 (1.5%) | 2,309 (2.1%) |
| $1,000,000 or more | 988 (1.5%) | 1,428 (1.3%) |
| Total | 64,739 (100.0%) | 112,166 (100.0%) |
Household Income by Mortgage Status in Kent County
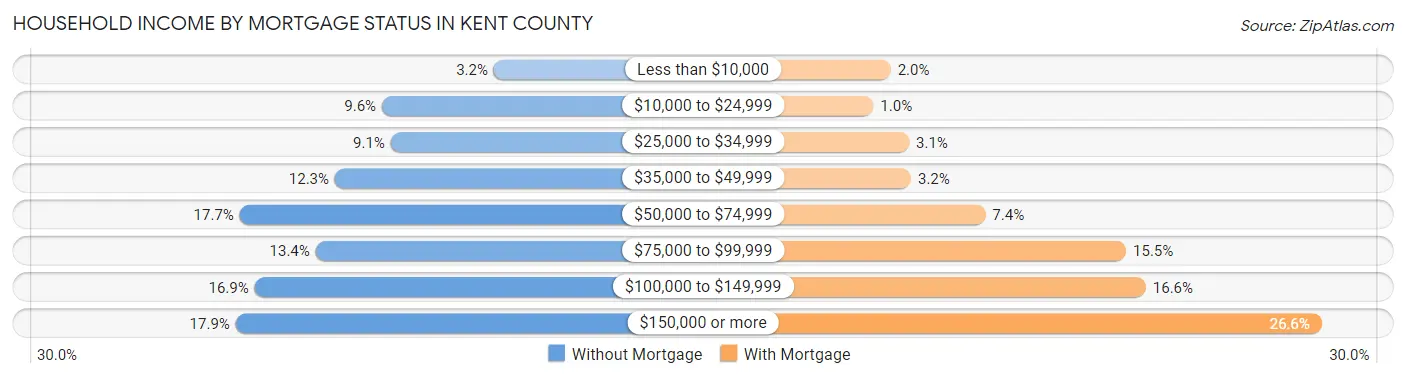
| Household Income | Without Mortgage | With Mortgage |
| Less than $10,000 | 2,068 (3.2%) | 2,258 (2.0%) |
| $10,000 to $24,999 | 6,203 (9.6%) | 1,145 (1.0%) |
| $25,000 to $34,999 | 5,879 (9.1%) | 3,436 (3.1%) |
| $35,000 to $49,999 | 7,942 (12.3%) | 3,559 (3.2%) |
| $50,000 to $74,999 | 11,463 (17.7%) | 8,326 (7.4%) |
| $75,000 to $99,999 | 8,653 (13.4%) | 17,344 (15.5%) |
| $100,000 to $149,999 | 10,918 (16.9%) | 18,613 (16.6%) |
| $150,000 or more | 11,613 (17.9%) | 29,882 (26.6%) |
| Total | 64,739 (100.0%) | 112,166 (100.0%) |
Property Value to Household Income Ratio in Kent County
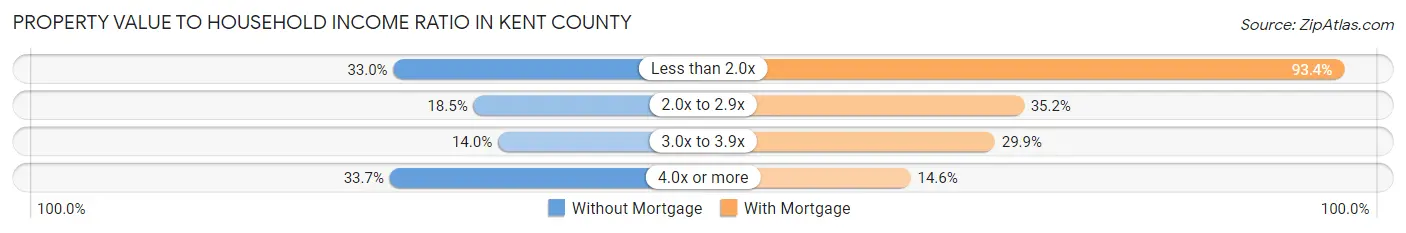
| Value-to-Income Ratio | Without Mortgage | With Mortgage |
| Less than 2.0x | 21,373 (33.0%) | 104,743 (93.4%) |
| 2.0x to 2.9x | 11,963 (18.5%) | 39,475 (35.2%) |
| 3.0x to 3.9x | 9,080 (14.0%) | 33,587 (29.9%) |
| 4.0x or more | 21,808 (33.7%) | 16,423 (14.6%) |
| Total | 64,739 (100.0%) | 112,166 (100.0%) |
Real Estate Taxes by Mortgage Status in Kent County
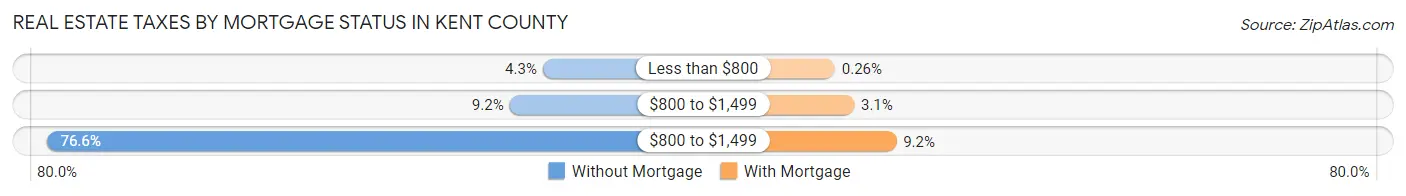
| Property Taxes | Without Mortgage | With Mortgage |
| Less than $800 | 2,778 (4.3%) | 289 (0.3%) |
| $800 to $1,499 | 5,922 (9.1%) | 3,447 (3.1%) |
| $800 to $1,499 | 49,615 (76.6%) | 10,354 (9.2%) |
| Total | 64,739 (100.0%) | 112,166 (100.0%) |
Health & Disability in Kent County
Health Insurance Coverage by Age in Kent County
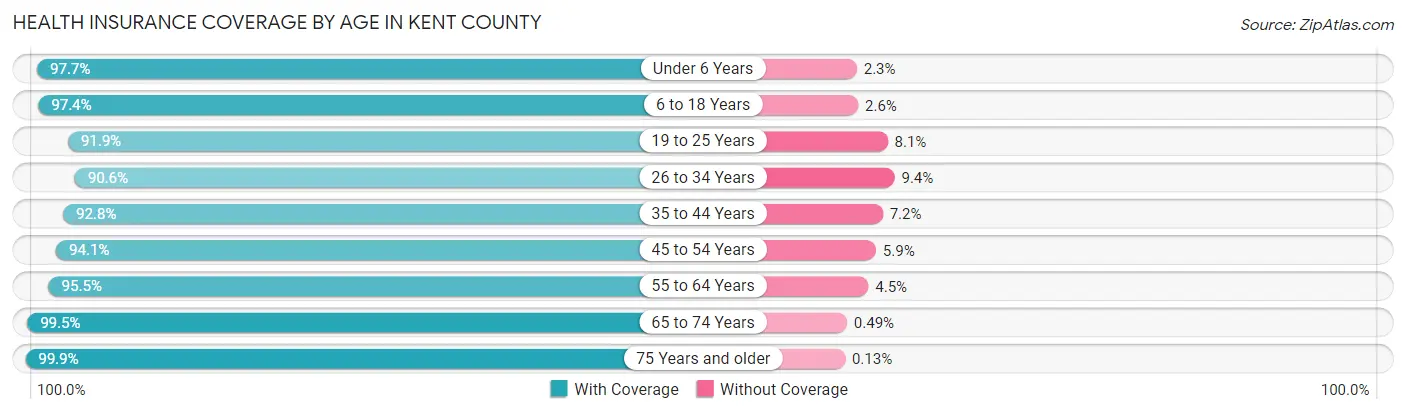
| Age Bracket | With Coverage | Without Coverage |
| Under 6 Years | 48,713 (97.7%) | 1,161 (2.3%) |
| 6 to 18 Years | 111,258 (97.4%) | 2,937 (2.6%) |
| 19 to 25 Years | 59,863 (91.9%) | 5,262 (8.1%) |
| 26 to 34 Years | 83,547 (90.6%) | 8,640 (9.4%) |
| 35 to 44 Years | 79,253 (92.8%) | 6,117 (7.2%) |
| 45 to 54 Years | 71,153 (94.1%) | 4,452 (5.9%) |
| 55 to 64 Years | 75,828 (95.5%) | 3,564 (4.5%) |
| 65 to 74 Years | 55,425 (99.5%) | 272 (0.5%) |
| 75 Years and older | 34,933 (99.9%) | 46 (0.1%) |
| Total | 619,973 (95.0%) | 32,451 (5.0%) |
Health Insurance Coverage by Citizenship Status in Kent County
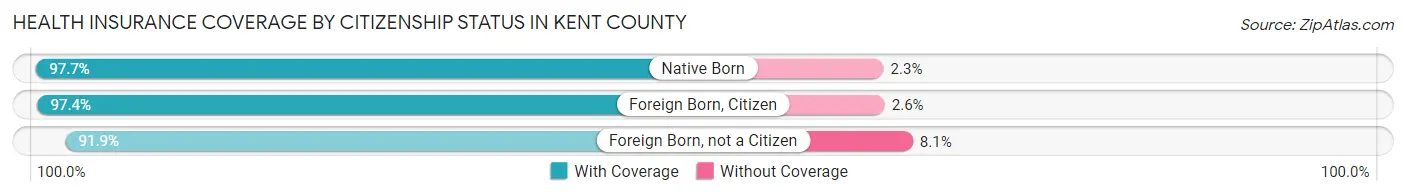
| Citizenship Status | With Coverage | Without Coverage |
| Native Born | 48,713 (97.7%) | 1,161 (2.3%) |
| Foreign Born, Citizen | 111,258 (97.4%) | 2,937 (2.6%) |
| Foreign Born, not a Citizen | 59,863 (91.9%) | 5,262 (8.1%) |
Health Insurance Coverage by Household Income in Kent County
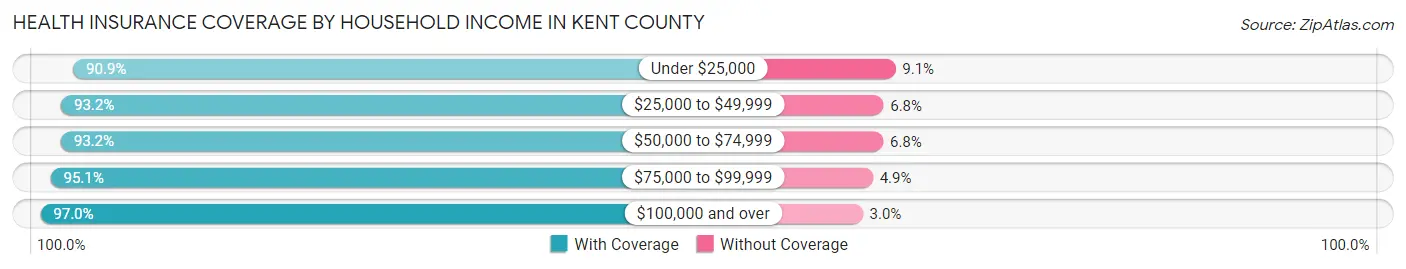
| Household Income | With Coverage | Without Coverage |
| Under $25,000 | 52,756 (90.9%) | 5,272 (9.1%) |
| $25,000 to $49,999 | 87,968 (93.2%) | 6,460 (6.8%) |
| $50,000 to $74,999 | 96,476 (93.2%) | 7,032 (6.8%) |
| $75,000 to $99,999 | 94,688 (95.1%) | 4,832 (4.9%) |
| $100,000 and over | 281,376 (97.0%) | 8,574 (3.0%) |
Public vs Private Health Insurance Coverage by Age in Kent County
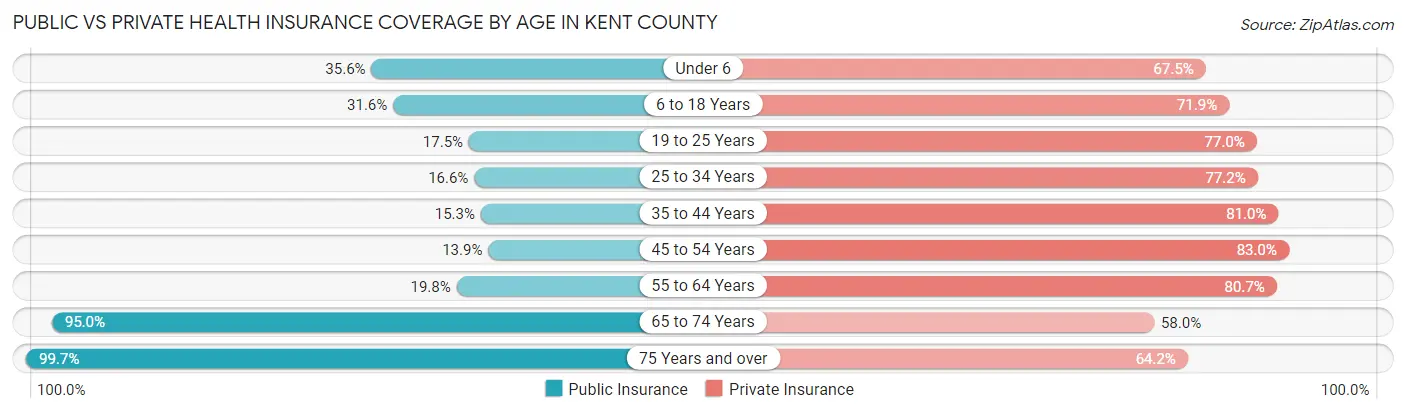
| Age Bracket | Public Insurance | Private Insurance |
| Under 6 | 17,772 (35.6%) | 33,681 (67.5%) |
| 6 to 18 Years | 36,089 (31.6%) | 82,082 (71.9%) |
| 19 to 25 Years | 11,414 (17.5%) | 50,149 (77.0%) |
| 25 to 34 Years | 15,260 (16.6%) | 71,140 (77.2%) |
| 35 to 44 Years | 13,080 (15.3%) | 69,170 (81.0%) |
| 45 to 54 Years | 10,538 (13.9%) | 62,715 (83.0%) |
| 55 to 64 Years | 15,737 (19.8%) | 64,080 (80.7%) |
| 65 to 74 Years | 52,883 (95.0%) | 32,274 (58.0%) |
| 75 Years and over | 34,881 (99.7%) | 22,455 (64.2%) |
| Total | 207,654 (31.8%) | 487,746 (74.8%) |
Disability Status by Sex by Age in Kent County
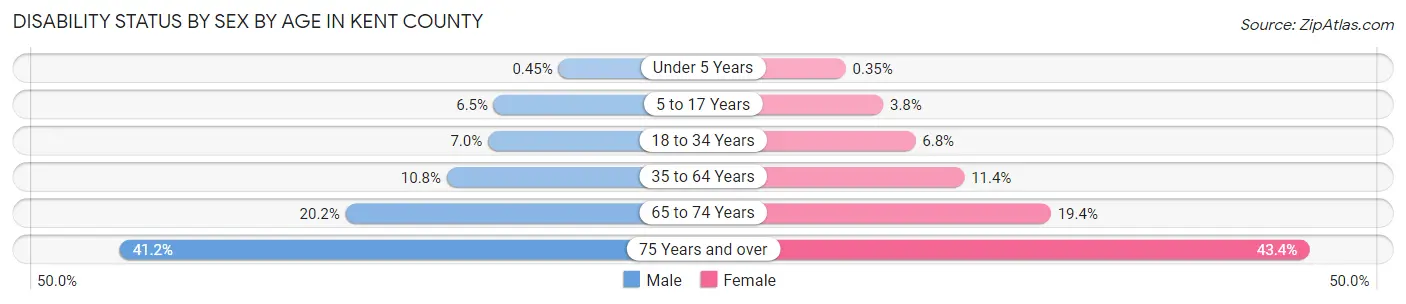
| Age Bracket | Male | Female |
| Under 5 Years | 96 (0.4%) | 71 (0.4%) |
| 5 to 17 Years | 3,768 (6.5%) | 2,111 (3.8%) |
| 18 to 34 Years | 5,831 (7.0%) | 5,650 (6.8%) |
| 35 to 64 Years | 12,985 (10.8%) | 13,667 (11.4%) |
| 65 to 74 Years | 5,297 (20.2%) | 5,720 (19.4%) |
| 75 Years and over | 5,895 (41.2%) | 8,959 (43.4%) |
Disability Class by Sex by Age in Kent County
Disability Class: Hearing Difficulty
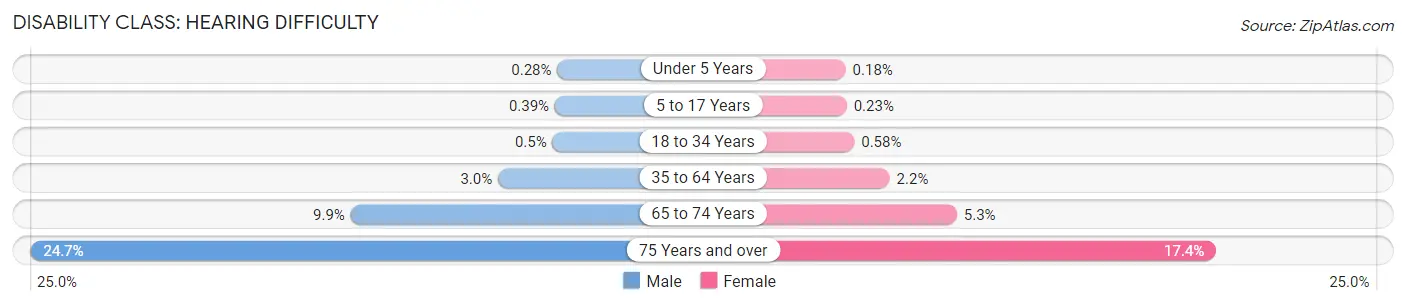
| Age Bracket | Male | Female |
| Under 5 Years | 60 (0.3%) | 37 (0.2%) |
| 5 to 17 Years | 227 (0.4%) | 127 (0.2%) |
| 18 to 34 Years | 416 (0.5%) | 482 (0.6%) |
| 35 to 64 Years | 3,642 (3.0%) | 2,670 (2.2%) |
| 65 to 74 Years | 2,587 (9.9%) | 1,575 (5.3%) |
| 75 Years and over | 3,541 (24.7%) | 3,589 (17.4%) |
Disability Class: Vision Difficulty
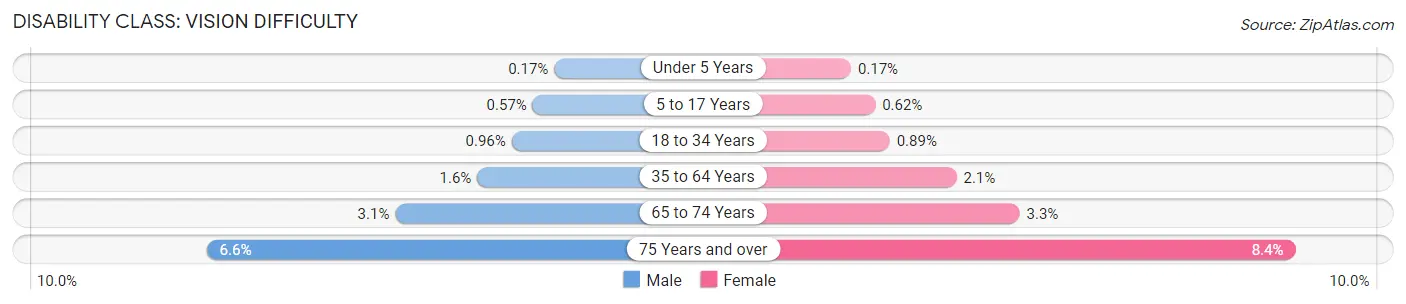
| Age Bracket | Male | Female |
| Under 5 Years | 36 (0.2%) | 34 (0.2%) |
| 5 to 17 Years | 335 (0.6%) | 340 (0.6%) |
| 18 to 34 Years | 799 (1.0%) | 736 (0.9%) |
| 35 to 64 Years | 1,916 (1.6%) | 2,556 (2.1%) |
| 65 to 74 Years | 818 (3.1%) | 972 (3.3%) |
| 75 Years and over | 948 (6.6%) | 1,739 (8.4%) |
Disability Class: Cognitive Difficulty
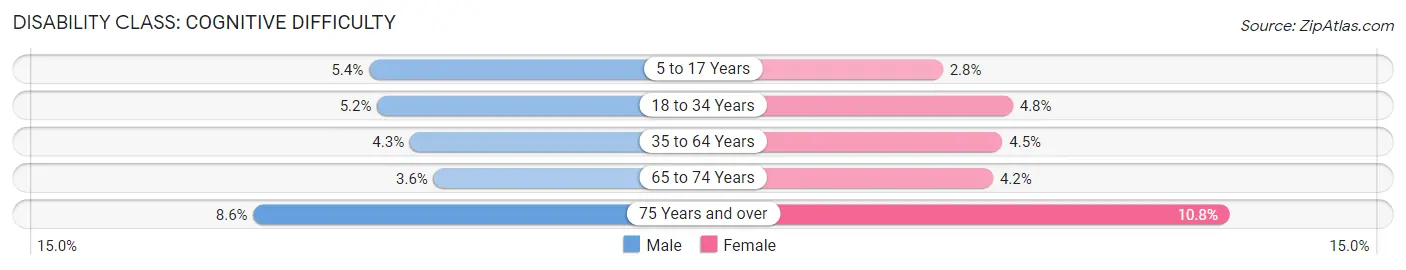
| Age Bracket | Male | Female |
| 5 to 17 Years | 3,161 (5.4%) | 1,549 (2.8%) |
| 18 to 34 Years | 4,320 (5.2%) | 3,934 (4.8%) |
| 35 to 64 Years | 5,124 (4.3%) | 5,375 (4.5%) |
| 65 to 74 Years | 947 (3.6%) | 1,241 (4.2%) |
| 75 Years and over | 1,236 (8.6%) | 2,232 (10.8%) |
Disability Class: Ambulatory Difficulty
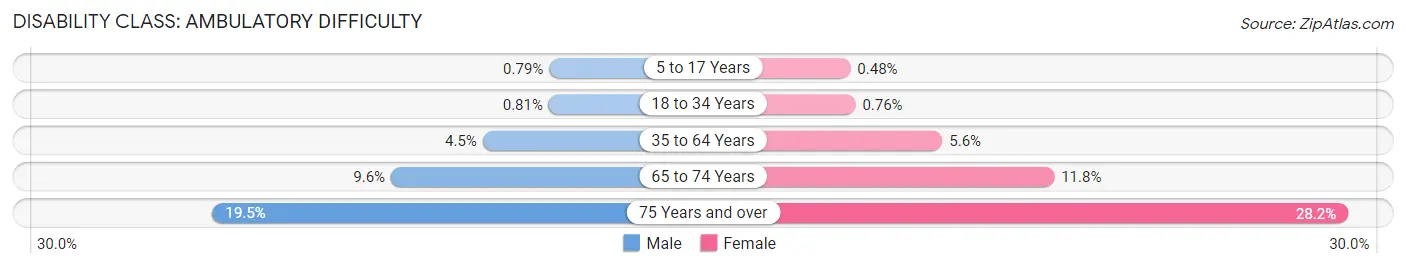
| Age Bracket | Male | Female |
| 5 to 17 Years | 464 (0.8%) | 264 (0.5%) |
| 18 to 34 Years | 672 (0.8%) | 626 (0.8%) |
| 35 to 64 Years | 5,395 (4.5%) | 6,736 (5.6%) |
| 65 to 74 Years | 2,515 (9.6%) | 3,490 (11.8%) |
| 75 Years and over | 2,798 (19.5%) | 5,825 (28.2%) |
Disability Class: Self-Care Difficulty
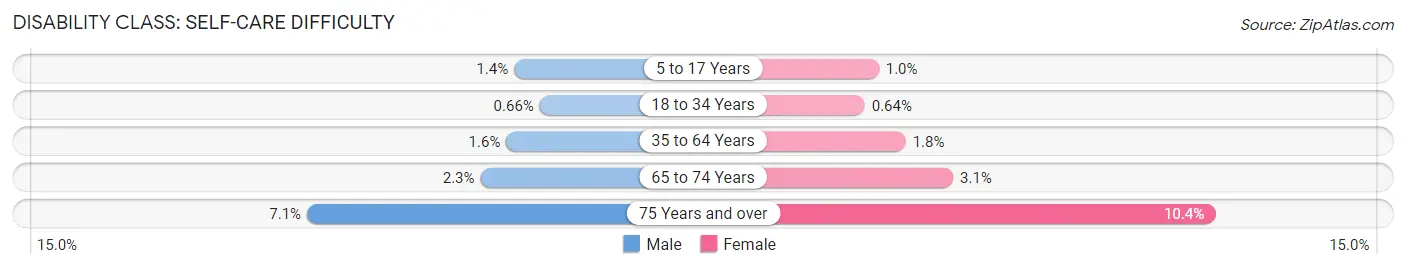
| Age Bracket | Male | Female |
| 5 to 17 Years | 798 (1.4%) | 570 (1.0%) |
| 18 to 34 Years | 551 (0.7%) | 530 (0.6%) |
| 35 to 64 Years | 1,911 (1.6%) | 2,137 (1.8%) |
| 65 to 74 Years | 605 (2.3%) | 915 (3.1%) |
| 75 Years and over | 1,023 (7.1%) | 2,153 (10.4%) |
Technology Access in Kent County
Computing Device Access in Kent County
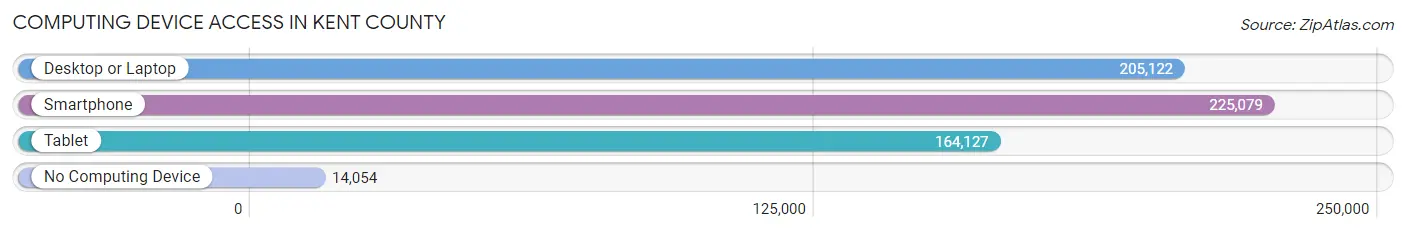
| Device Type | # Households | % Households |
| Desktop or Laptop | 205,122 | 81.2% |
| Smartphone | 225,079 | 89.1% |
| Tablet | 164,127 | 64.9% |
| No Computing Device | 14,054 | 5.6% |
| Total | 252,694 | 100.0% |
Internet Access in Kent County
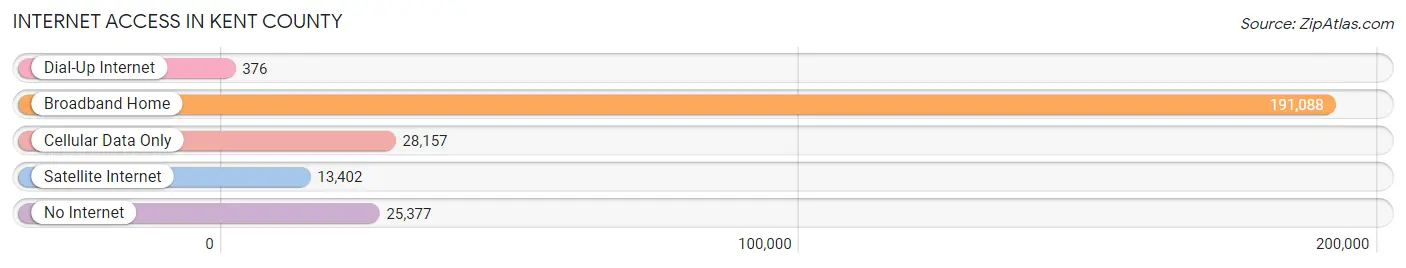
| Internet Type | # Households | % Households |
| Dial-Up Internet | 376 | 0.2% |
| Broadband Home | 191,088 | 75.6% |
| Cellular Data Only | 28,157 | 11.1% |
| Satellite Internet | 13,402 | 5.3% |
| No Internet | 25,377 | 10.0% |
| Total | 252,694 | 100.0% |
Kent County Summary
Kent County, Michigan is located in the western part of the state and is part of the Grand Rapids metropolitan area. It is the fourth most populous county in Michigan, with a population of 602,622 as of the 2010 census. The county seat is Grand Rapids, the second largest city in the state.
Geography
Kent County is located in the western part of Michigan, bordered by Lake Michigan to the west, Muskegon County to the north, Ottawa County to the east, and Allegan County to the south. The county covers an area of 876 square miles, making it the fourth largest county in the state. The terrain is mostly flat, with some rolling hills in the northern part of the county. The Grand River runs through the county, and there are several smaller rivers and streams. The county is home to several parks and nature preserves, including the Grand Rapids Whitewater Park, the Grand River Greenway, and the Kent Trails.
Demographics
As of the 2010 census, Kent County had a population of 602,622, making it the fourth most populous county in Michigan. The population was spread out, with 25.3% under the age of 18, 11.2% from 18 to 24, 28.2% from 25 to 44, 22.3% from 45 to 64, and 12.9% who were 65 years of age or older. The median age was 34.4 years. The racial makeup of the county was 79.2% White, 11.3% African American, 0.7% Native American, 2.7% Asian, 0.1% Pacific Islander, 3.2% from other races, and 3.0% from two or more races. Hispanic or Latino of any race were 6.7% of the population.
Economy
Kent County is home to a diverse economy, with a variety of industries represented. The largest employers in the county are Spectrum Health, Mercy Health, and the Grand Rapids Public Schools. Other major employers include Amway, Meijer, and Steelcase. The county is also home to several universities and colleges, including Grand Valley State University, Calvin College, and Davenport University.
The county has a strong manufacturing sector, with companies such as General Motors, Ford, and Whirlpool having a presence in the area. The county is also home to several technology companies, including IBM, Microsoft, and Google. Tourism is also an important part of the economy, with the county being home to several popular attractions, such as the Grand Rapids Art Museum, the Gerald R. Ford Presidential Museum, and the John Ball Zoo.
Conclusion
Kent County, Michigan is a vibrant and diverse county located in the western part of the state. It is home to a variety of industries, including manufacturing, technology, and tourism. The county has a population of 602,622, and is the fourth most populous county in Michigan. The county is home to several universities and colleges, as well as several popular attractions. Kent County is an important part of the Michigan economy, and is a great place to live and work.
Common Questions
What is the Total Population of Kent County?
Total Population of Kent County is 657,321.
What is the Total Male Population of Kent County?
Total Male Population of Kent County is 326,880.
What is the Total Female Population of Kent County?
Total Female Population of Kent County is 330,441.
What is the Ratio of Males per 100 Females in Kent County?
There are 98.92 Males per 100 Females in Kent County.
What is the Ratio of Females per 100 Males in Kent County?
There are 101.09 Females per 100 Males in Kent County.
What is the Median Population Age in Kent County?
Median Population Age in Kent County is 35.6 Years.
What is the Average Family Size in Kent County
Average Family Size in Kent County is 3.1 People.
What is the Average Household Size in Kent County
Average Household Size in Kent County is 2.6 People.
What is Per Capita Income in Kent County?
Per Capita income in Kent County is $39,342.
What is the Median Family Income in Kent County?
Median Family Income in Kent County is $93,711.
What is the Median Household income in Kent County?
Median Household Income in Kent County is $76,247.
What is Income or Wage Gap in Kent County?
Income or Wage Gap in Kent County is 29.8%.
Women in Kent County earn 70.2 cents for every dollar earned by a man.
What is Family Income Deficit in Kent County?
Family Income Deficit in Kent County is $10,892.
Families that are below poverty line in Kent County earn $10,892 less on average than the poverty threshold level.
What is Inequality or Gini Index in Kent County?
Inequality or Gini Index in Kent County is 0.45.
How Large is the Labor Force in Kent County?
There are 358,460 People in the Labor Forcein in Kent County.
What is the Percentage of People in the Labor Force in Kent County?
69.1% of People are in the Labor Force in Kent County.
What is the Unemployment Rate in Kent County?
Unemployment Rate in Kent County is 4.5%.