Kalkaska County, MI
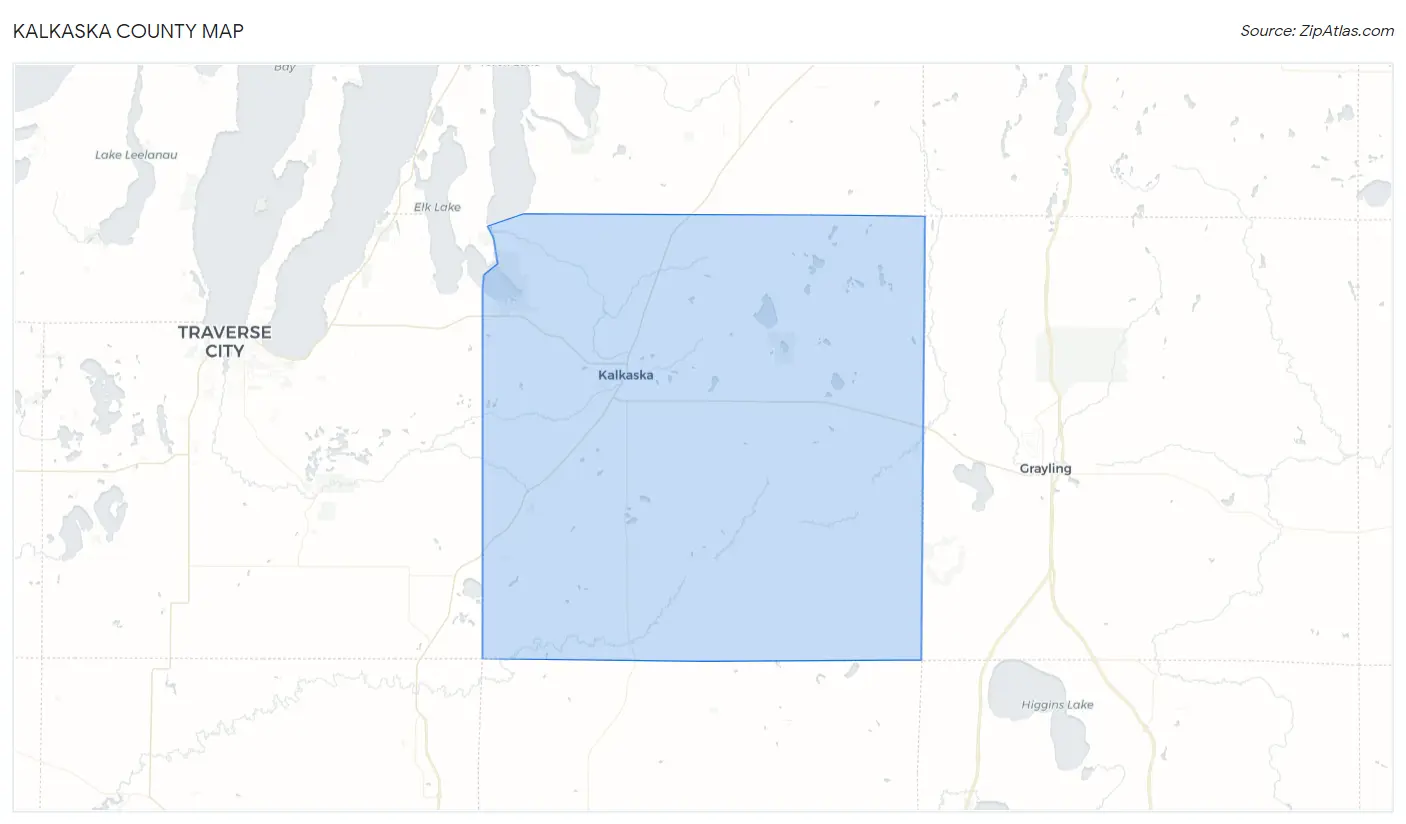
Kalkaska County Map
Kalkaska County Overview
17,934
TOTAL POPULATION
9,122
MALE POPULATION
8,812
FEMALE POPULATION
103.52
MALES / 100 FEMALES
96.60
FEMALES / 100 MALES
43.3
MEDIAN AGE
3.0
AVG FAMILY SIZE
2.4
AVG HOUSEHOLD SIZE
$31,074
PER CAPITA INCOME
$70,691
AVG FAMILY INCOME
$56,380
AVG HOUSEHOLD INCOME
35.9%
WAGE / INCOME GAP [ % ]
64.1¢/ $1
WAGE / INCOME GAP [ $ ]
$8,887
FAMILY INCOME DEFICIT
0.43
INEQUALITY / GINI INDEX
7,982
LABOR FORCE [ PEOPLE ]
54.4%
PERCENT IN LABOR FORCE
4.6%
UNEMPLOYMENT RATE
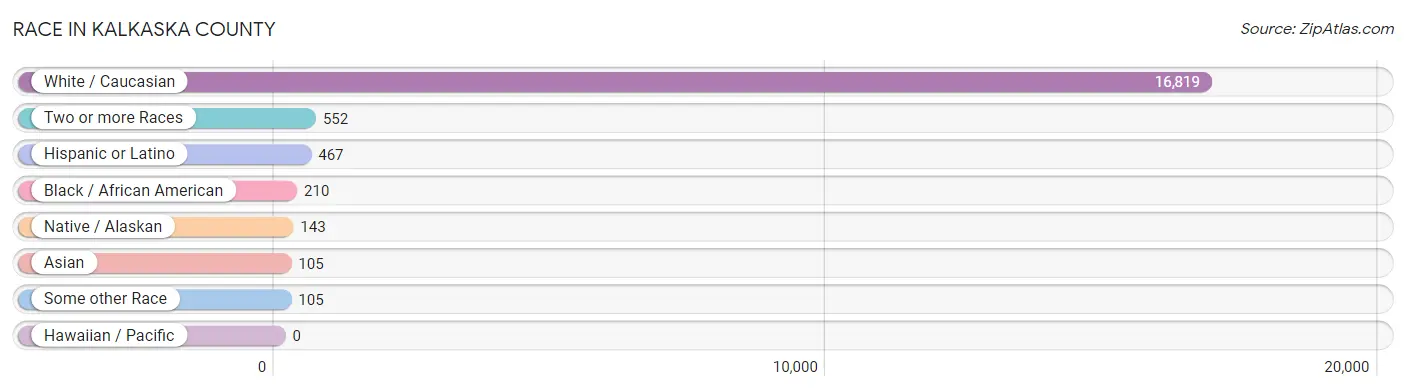
Race in Kalkaska County
The most populous races in Kalkaska County are White / Caucasian (16,819 | 93.8%), Two or more Races (552 | 3.1%), and Hispanic or Latino (467 | 2.6%).
| Race | # Population | % Population |
| Asian | 105 | 0.6% |
| Black / African American | 210 | 1.2% |
| Hawaiian / Pacific | 0 | 0.0% |
| Hispanic or Latino | 467 | 2.6% |
| Native / Alaskan | 143 | 0.8% |
| White / Caucasian | 16,819 | 93.8% |
| Two or more Races | 552 | 3.1% |
| Some other Race | 105 | 0.6% |
| Total | 17,934 | 100.0% |
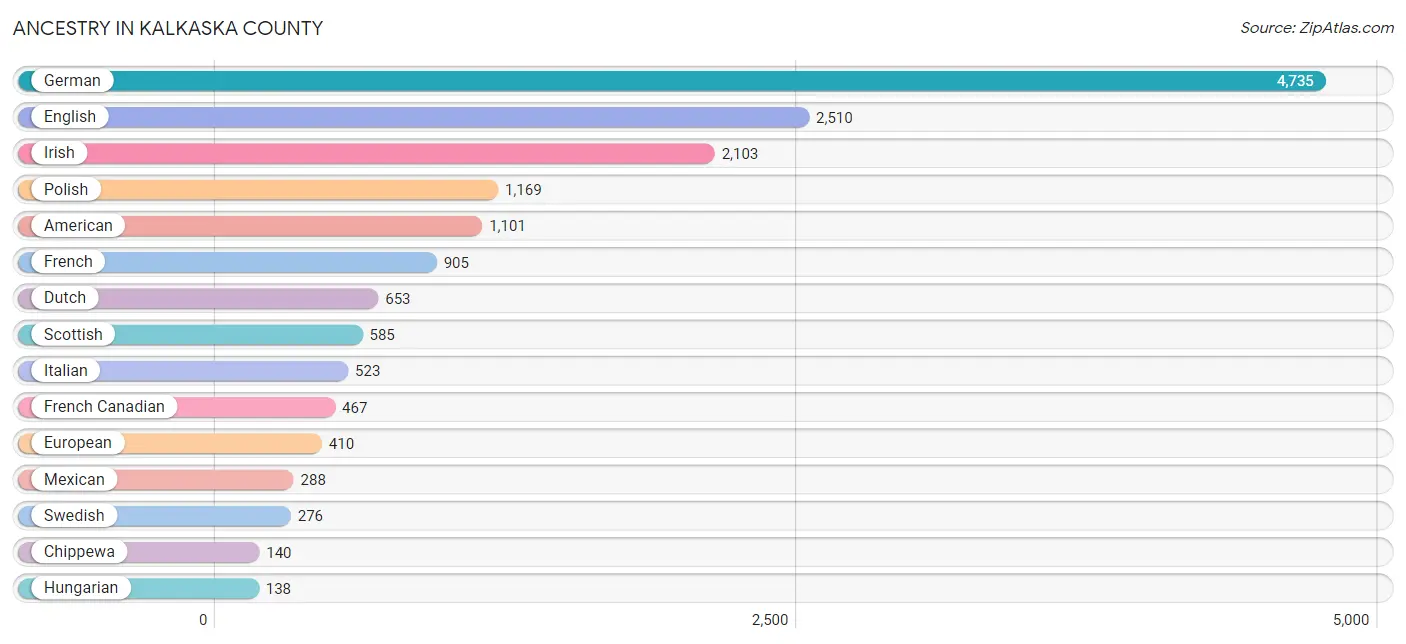
Ancestry in Kalkaska County
The most populous ancestries reported in Kalkaska County are German (4,735 | 26.4%), English (2,510 | 14.0%), Irish (2,103 | 11.7%), Polish (1,169 | 6.5%), and American (1,101 | 6.1%), together accounting for 64.8% of all Kalkaska County residents.
| Ancestry | # Population | % Population |
| Albanian | 27 | 0.2% |
| American | 1,101 | 6.1% |
| Arab | 21 | 0.1% |
| Armenian | 8 | 0.0% |
| Austrian | 41 | 0.2% |
| Basque | 2 | 0.0% |
| Belgian | 54 | 0.3% |
| Bhutanese | 7 | 0.0% |
| Blackfeet | 24 | 0.1% |
| Brazilian | 10 | 0.1% |
| British | 34 | 0.2% |
| Burmese | 14 | 0.1% |
| Canadian | 70 | 0.4% |
| Celtic | 3 | 0.0% |
| Cherokee | 35 | 0.2% |
| Chippewa | 140 | 0.8% |
| Colombian | 7 | 0.0% |
| Croatian | 17 | 0.1% |
| Cuban | 7 | 0.0% |
| Czech | 45 | 0.3% |
| Czechoslovakian | 6 | 0.0% |
| Danish | 44 | 0.3% |
| Dutch | 653 | 3.6% |
| Eastern European | 124 | 0.7% |
| English | 2,510 | 14.0% |
| European | 410 | 2.3% |
| Finnish | 107 | 0.6% |
| French | 905 | 5.1% |
| French American Indian | 75 | 0.4% |
| French Canadian | 467 | 2.6% |
| German | 4,735 | 26.4% |
| Greek | 50 | 0.3% |
| Hungarian | 138 | 0.8% |
| Indian (Asian) | 73 | 0.4% |
| Iranian | 4 | 0.0% |
| Irish | 2,103 | 11.7% |
| Iroquois | 5 | 0.0% |
| Italian | 523 | 2.9% |
| Korean | 40 | 0.2% |
| Latvian | 5 | 0.0% |
| Lebanese | 10 | 0.1% |
| Lithuanian | 36 | 0.2% |
| Luxembourger | 5 | 0.0% |
| Malaysian | 4 | 0.0% |
| Maltese | 3 | 0.0% |
| Mexican | 288 | 1.6% |
| Native Hawaiian | 7 | 0.0% |
| Navajo | 8 | 0.0% |
| Northern European | 64 | 0.4% |
| Norwegian | 82 | 0.5% |
| Ottawa | 60 | 0.3% |
| Pennsylvania German | 17 | 0.1% |
| Polish | 1,169 | 6.5% |
| Portuguese | 14 | 0.1% |
| Potawatomi | 9 | 0.1% |
| Puerto Rican | 100 | 0.6% |
| Romanian | 17 | 0.1% |
| Russian | 49 | 0.3% |
| Scandinavian | 136 | 0.8% |
| Scotch-Irish | 99 | 0.5% |
| Scottish | 585 | 3.3% |
| Seminole | 47 | 0.3% |
| Slovak | 13 | 0.1% |
| South American | 7 | 0.0% |
| Spanish | 64 | 0.4% |
| Swedish | 276 | 1.5% |
| Swiss | 42 | 0.2% |
| Syrian | 11 | 0.1% |
| Ukrainian | 31 | 0.2% |
| Welsh | 117 | 0.6% |
| Yugoslavian | 14 | 0.1% | View All 71 Rows |
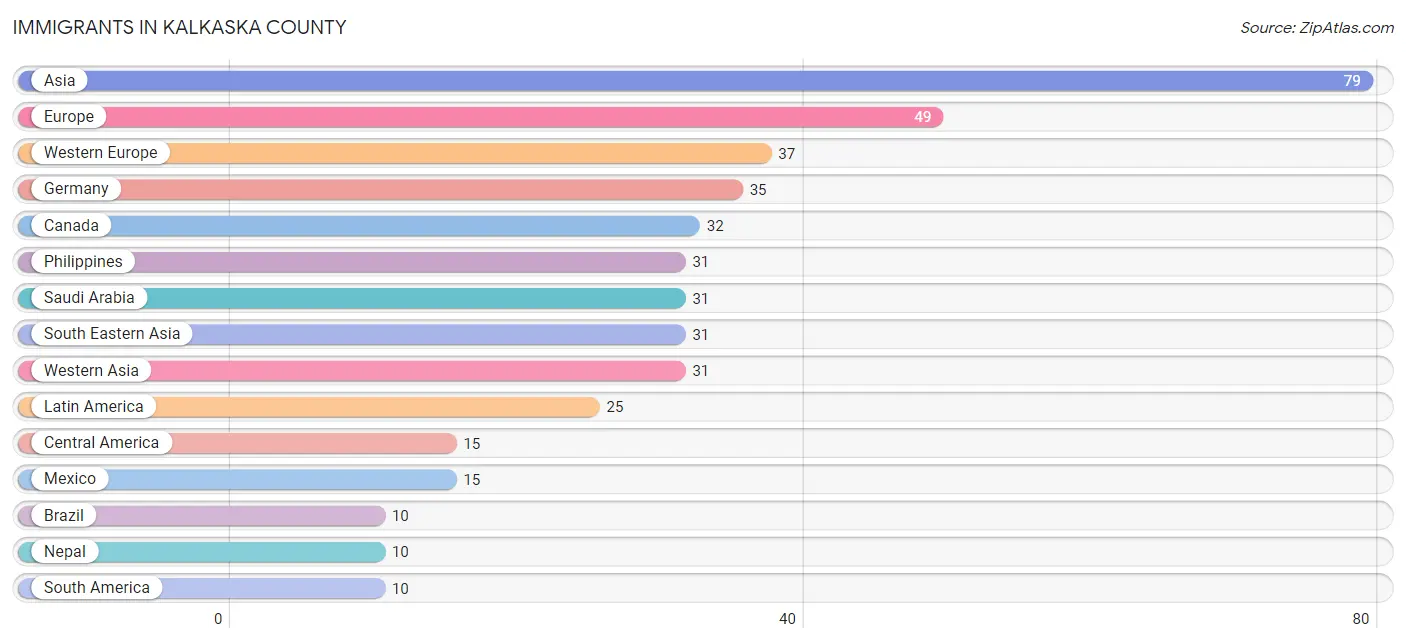
Immigrants in Kalkaska County
The most numerous immigrant groups reported in Kalkaska County came from Asia (79 | 0.4%), Europe (49 | 0.3%), Western Europe (37 | 0.2%), Germany (35 | 0.2%), and Canada (32 | 0.2%), together accounting for 1.3% of all Kalkaska County residents.
| Immigration Origin | # Population | % Population |
| Africa | 4 | 0.0% |
| Asia | 79 | 0.4% |
| Austria | 2 | 0.0% |
| Brazil | 10 | 0.1% |
| Canada | 32 | 0.2% |
| Central America | 15 | 0.1% |
| China | 7 | 0.0% |
| Eastern Asia | 7 | 0.0% |
| Eastern Europe | 2 | 0.0% |
| England | 4 | 0.0% |
| Europe | 49 | 0.3% |
| Germany | 35 | 0.2% |
| Hong Kong | 6 | 0.0% |
| Italy | 4 | 0.0% |
| Latin America | 25 | 0.1% |
| Mexico | 15 | 0.1% |
| Nepal | 10 | 0.1% |
| Northern Europe | 6 | 0.0% |
| Philippines | 31 | 0.2% |
| Saudi Arabia | 31 | 0.2% |
| South Africa | 4 | 0.0% |
| South America | 10 | 0.1% |
| South Central Asia | 10 | 0.1% |
| South Eastern Asia | 31 | 0.2% |
| Southern Europe | 4 | 0.0% |
| Taiwan | 1 | 0.0% |
| Ukraine | 2 | 0.0% |
| Western Asia | 31 | 0.2% |
| Western Europe | 37 | 0.2% | View All 29 Rows |
Sex and Age in Kalkaska County
Sex and Age in Kalkaska County
The most populous age groups in Kalkaska County are 60 to 64 Years (774 | 8.5%) for men and 60 to 64 Years (785 | 8.9%) for women.
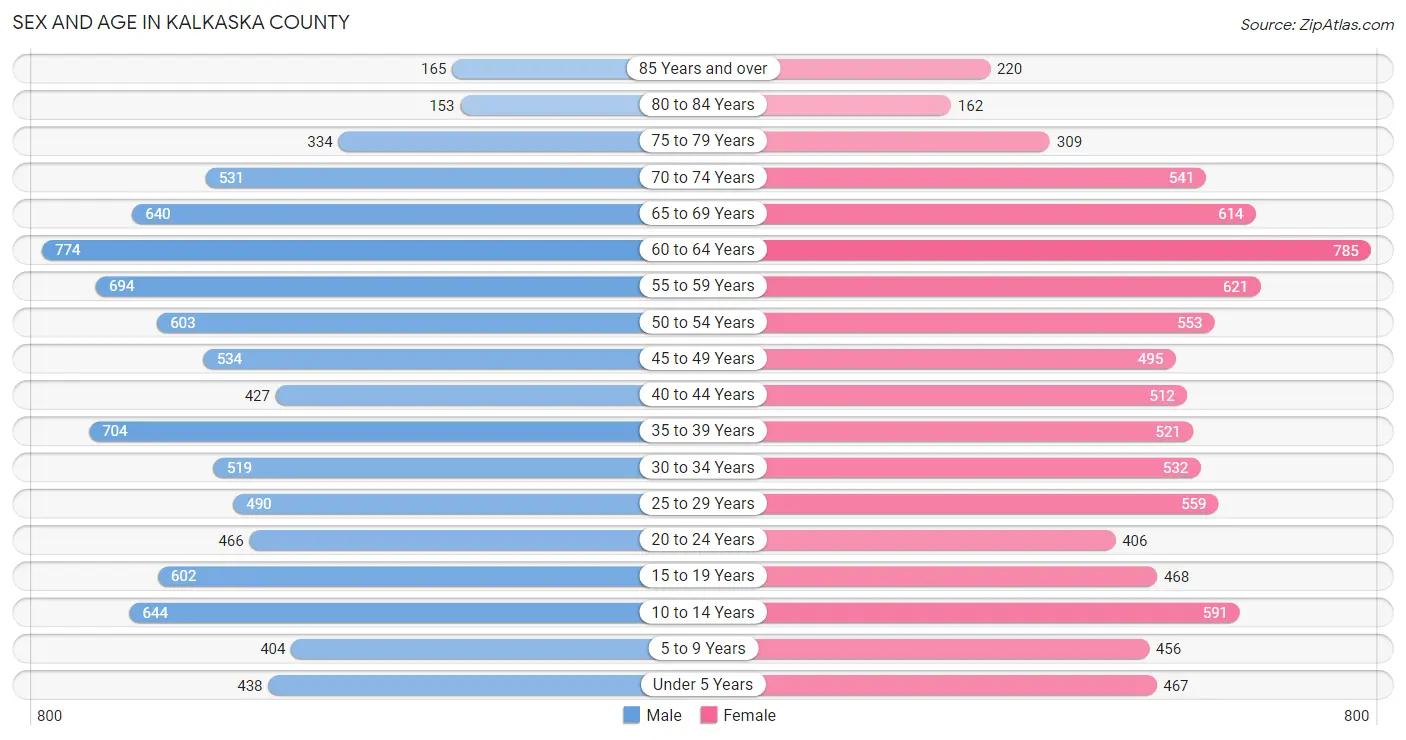
| Age Bracket | Male | Female |
| Under 5 Years | 438 (4.8%) | 467 (5.3%) |
| 5 to 9 Years | 404 (4.4%) | 456 (5.2%) |
| 10 to 14 Years | 644 (7.1%) | 591 (6.7%) |
| 15 to 19 Years | 602 (6.6%) | 468 (5.3%) |
| 20 to 24 Years | 466 (5.1%) | 406 (4.6%) |
| 25 to 29 Years | 490 (5.4%) | 559 (6.3%) |
| 30 to 34 Years | 519 (5.7%) | 532 (6.0%) |
| 35 to 39 Years | 704 (7.7%) | 521 (5.9%) |
| 40 to 44 Years | 427 (4.7%) | 512 (5.8%) |
| 45 to 49 Years | 534 (5.9%) | 495 (5.6%) |
| 50 to 54 Years | 603 (6.6%) | 553 (6.3%) |
| 55 to 59 Years | 694 (7.6%) | 621 (7.0%) |
| 60 to 64 Years | 774 (8.5%) | 785 (8.9%) |
| 65 to 69 Years | 640 (7.0%) | 614 (7.0%) |
| 70 to 74 Years | 531 (5.8%) | 541 (6.1%) |
| 75 to 79 Years | 334 (3.7%) | 309 (3.5%) |
| 80 to 84 Years | 153 (1.7%) | 162 (1.8%) |
| 85 Years and over | 165 (1.8%) | 220 (2.5%) |
| Total | 9,122 (100.0%) | 8,812 (100.0%) |
Families and Households in Kalkaska County
Median Family Size in Kalkaska County
The median family size in Kalkaska County is 2.99 persons per family, with single male/father families (331 | 7.2%) accounting for the largest median family size of 3.04 persons per family. On the other hand, single female/mother families (584 | 12.8%) represent the smallest median family size with 2.84 persons per family.

| Family Type | # Families | Family Size |
| Married-Couple | 3,653 (80.0%) | 3.01 |
| Single Male/Father | 331 (7.2%) | 3.04 |
| Single Female/Mother | 584 (12.8%) | 2.84 |
| Total Families | 4,568 (100.0%) | 2.99 |
Median Household Size in Kalkaska County
The median household size in Kalkaska County is 2.41 persons per household, with single male/father households (331 | 4.5%) accounting for the largest median household size of 3.66 persons per household. non-family households (2,809 | 38.1%) represent the smallest median household size with 1.28 persons per household.
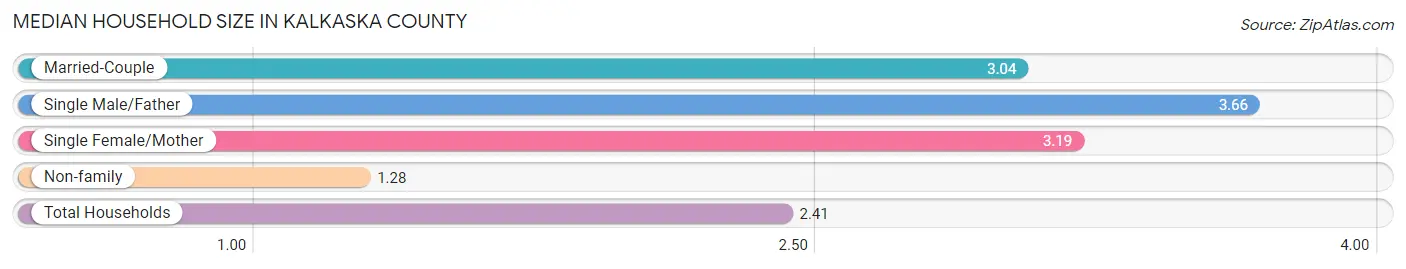
| Household Type | # Households | Household Size |
| Married-Couple | 3,653 (49.5%) | 3.04 |
| Single Male/Father | 331 (4.5%) | 3.66 |
| Single Female/Mother | 584 (7.9%) | 3.19 |
| Non-family | 2,809 (38.1%) | 1.28 |
| Total Households | 7,377 (100.0%) | 2.41 |
Household Size by Marriage Status in Kalkaska County
Out of a total of 7,377 households in Kalkaska County, 4,568 (61.9%) are family households, while 2,809 (38.1%) are nonfamily households. The most numerous type of family households are 2-person households, comprising 2,352, and the most common type of nonfamily households are 1-person households, comprising 2,111.
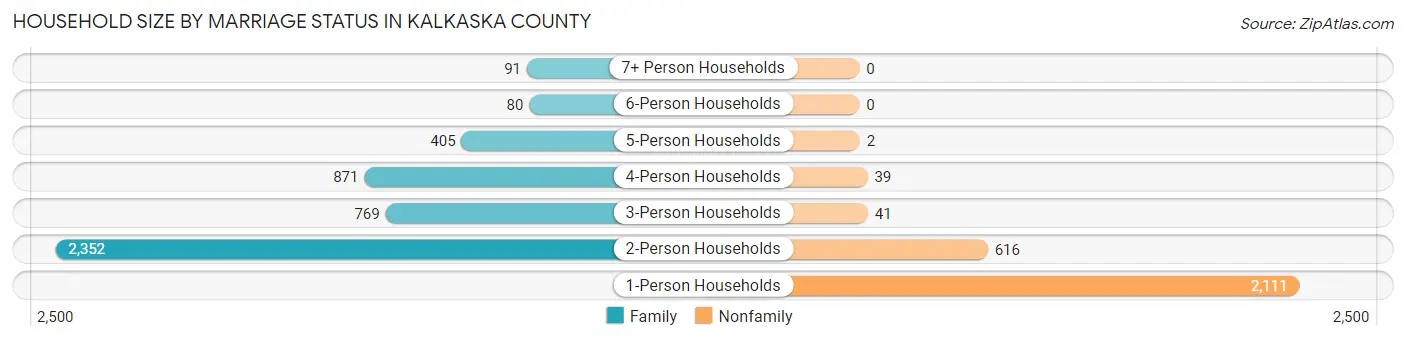
| Household Size | Family Households | Nonfamily Households |
| 1-Person Households | - | 2,111 (28.6%) |
| 2-Person Households | 2,352 (31.9%) | 616 (8.4%) |
| 3-Person Households | 769 (10.4%) | 41 (0.6%) |
| 4-Person Households | 871 (11.8%) | 39 (0.5%) |
| 5-Person Households | 405 (5.5%) | 2 (0.0%) |
| 6-Person Households | 80 (1.1%) | 0 (0.0%) |
| 7+ Person Households | 91 (1.2%) | 0 (0.0%) |
| Total | 4,568 (61.9%) | 2,809 (38.1%) |
Female Fertility in Kalkaska County
Fertility by Age in Kalkaska County
Average fertility rate in Kalkaska County is 24.0 births per 1,000 women. Women in the age bracket of 20 to 34 years have the highest fertility rate with 45.0 births per 1,000 women. Women in the age bracket of 20 to 34 years acount for 77.0% of all women with births.

| Age Bracket | Women with Births | Births / 1,000 Women |
| 15 to 19 years | 0 (0.0%) | 0.0 |
| 20 to 34 years | 67 (77.0%) | 45.0 |
| 35 to 50 years | 20 (23.0%) | 12.0 |
| Total | 87 (100.0%) | 24.0 |
Fertility by Age by Marriage Status in Kalkaska County
63.2% of women with births (87) in Kalkaska County are married. The highest percentage of unmarried women with births falls into 20 to 34 years age bracket with 43.3% of them unmarried at the time of birth, while the lowest percentage of unmarried women with births belong to 35 to 50 years age bracket with 15.0% of them unmarried.
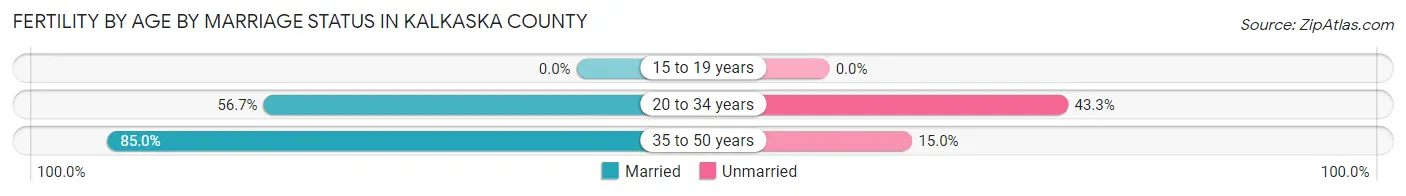
| Age Bracket | Married | Unmarried |
| 15 to 19 years | 0 (0.0%) | 0 (0.0%) |
| 20 to 34 years | 38 (56.7%) | 29 (43.3%) |
| 35 to 50 years | 17 (85.0%) | 3 (15.0%) |
| Total | 55 (63.2%) | 32 (36.8%) |
Fertility by Education in Kalkaska County
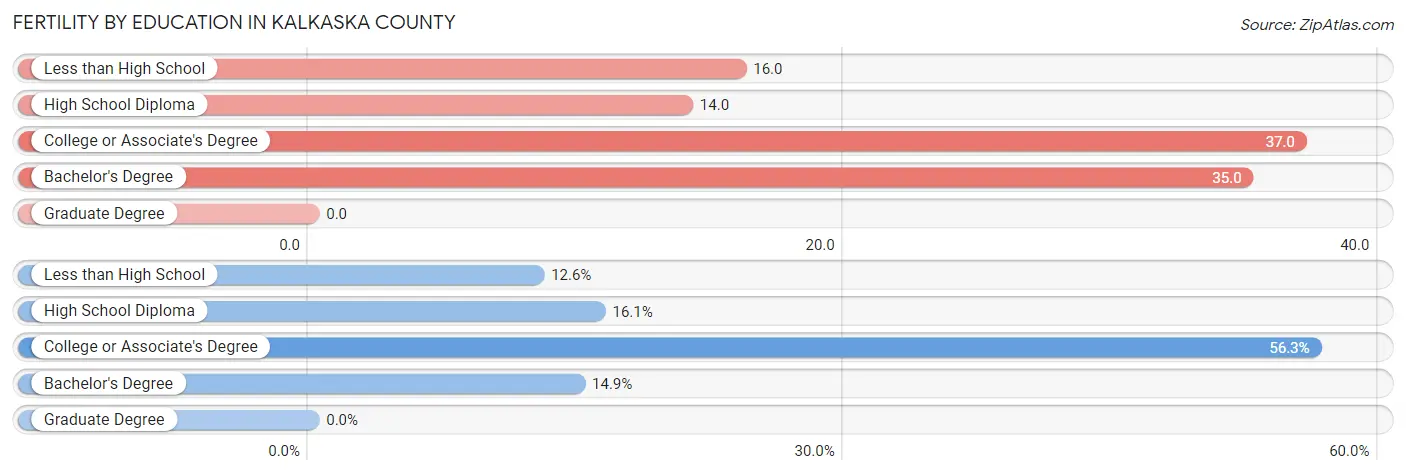
| Educational Attainment | Women with Births | Births / 1,000 Women |
| Less than High School | 11 (12.6%) | 16.0 |
| High School Diploma | 14 (16.1%) | 14.0 |
| College or Associate's Degree | 49 (56.3%) | 37.0 |
| Bachelor's Degree | 13 (14.9%) | 35.0 |
| Graduate Degree | 0 (0.0%) | 0.0 |
| Total | 87 (100.0%) | 24.0 |
Fertility by Education by Marriage Status in Kalkaska County
36.8% of women with births in Kalkaska County are unmarried. Women with the educational attainment of bachelor's degree are most likely to be married with 100.0% of them married at childbirth, while women with the educational attainment of less than high school are least likely to be married with 100.0% of them unmarried at childbirth.

| Educational Attainment | Married | Unmarried |
| Less than High School | 0 (0.0%) | 11 (100.0%) |
| High School Diploma | 11 (78.6%) | 3 (21.4%) |
| College or Associate's Degree | 31 (63.3%) | 18 (36.7%) |
| Bachelor's Degree | 13 (100.0%) | 0 (0.0%) |
| Graduate Degree | 0 (0.0%) | 0 (0.0%) |
| Total | 55 (63.2%) | 32 (36.8%) |
Income in Kalkaska County
Income Overview in Kalkaska County
Per Capita Income in Kalkaska County is $31,074, while median incomes of families and households are $70,691 and $56,380 respectively.
| Characteristic | Number | Measure |
| Per Capita Income | 17,934 | $31,074 |
| Median Family Income | 4,568 | $70,691 |
| Mean Family Income | 4,568 | $87,777 |
| Median Household Income | 7,377 | $56,380 |
| Mean Household Income | 7,377 | $73,664 |
| Income Deficit | 4,568 | $8,887 |
| Wage / Income Gap (%) | 17,934 | 35.86% |
| Wage / Income Gap ($) | 17,934 | 64.14¢ per $1 |
| Gini / Inequality Index | 17,934 | 0.43 |
Earnings by Sex in Kalkaska County
Average Earnings in Kalkaska County are $34,176, $42,164 for men and $27,042 for women, a difference of 35.9%.

| Sex | Number | Average Earnings |
| Male | 4,705 (54.9%) | $42,164 |
| Female | 3,872 (45.1%) | $27,042 |
| Total | 8,577 (100.0%) | $34,176 |
Earnings by Sex by Income Bracket in Kalkaska County
The most common earnings brackets in Kalkaska County are $100,000+ for men (513 | 10.9%) and $35,000 to $39,999 for women (314 | 8.1%).
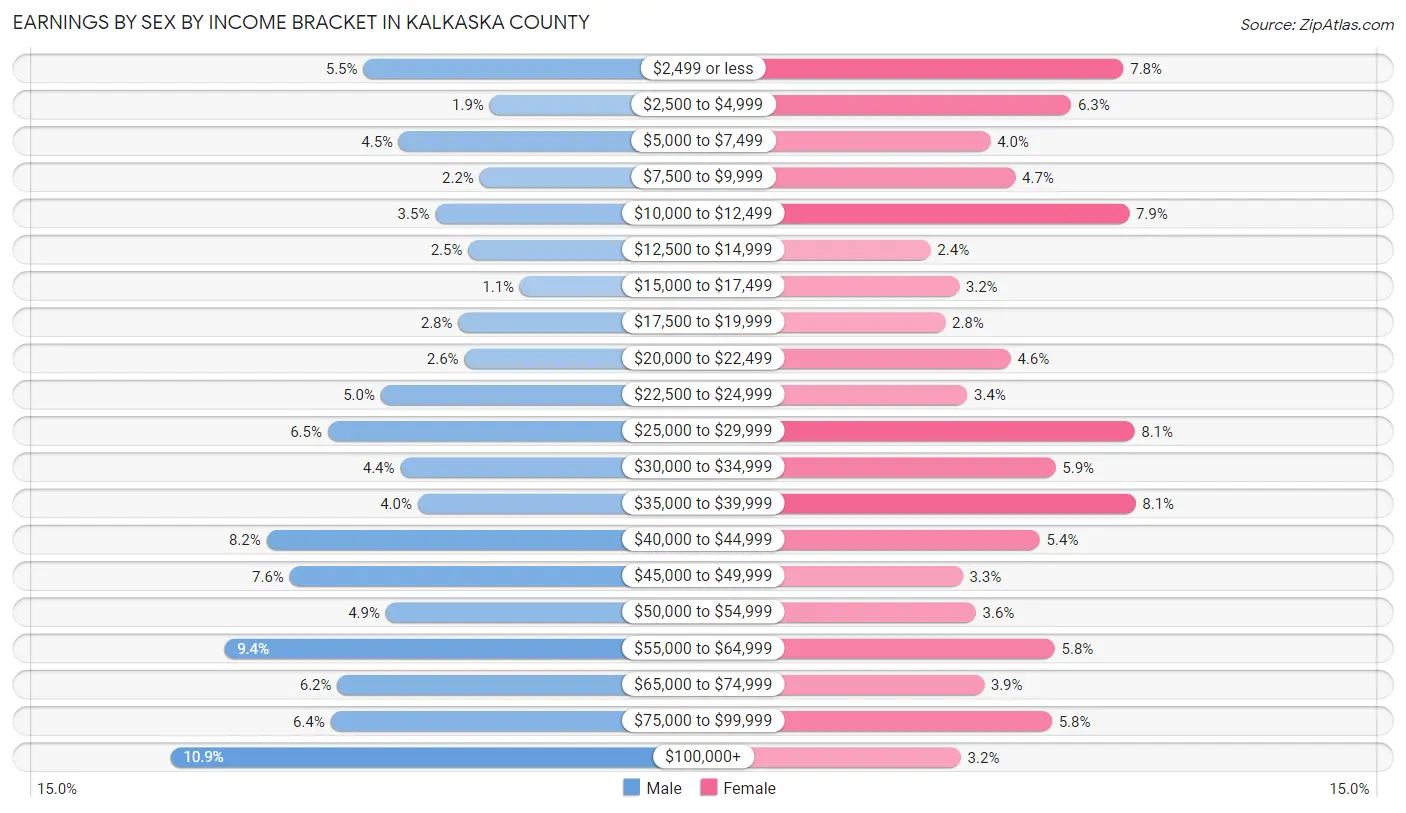
| Income | Male | Female |
| $2,499 or less | 258 (5.5%) | 301 (7.8%) |
| $2,500 to $4,999 | 91 (1.9%) | 244 (6.3%) |
| $5,000 to $7,499 | 211 (4.5%) | 156 (4.0%) |
| $7,500 to $9,999 | 104 (2.2%) | 183 (4.7%) |
| $10,000 to $12,499 | 163 (3.5%) | 307 (7.9%) |
| $12,500 to $14,999 | 119 (2.5%) | 91 (2.4%) |
| $15,000 to $17,499 | 51 (1.1%) | 122 (3.2%) |
| $17,500 to $19,999 | 132 (2.8%) | 107 (2.8%) |
| $20,000 to $22,499 | 124 (2.6%) | 178 (4.6%) |
| $22,500 to $24,999 | 235 (5.0%) | 131 (3.4%) |
| $25,000 to $29,999 | 305 (6.5%) | 313 (8.1%) |
| $30,000 to $34,999 | 209 (4.4%) | 227 (5.9%) |
| $35,000 to $39,999 | 186 (4.0%) | 314 (8.1%) |
| $40,000 to $44,999 | 386 (8.2%) | 210 (5.4%) |
| $45,000 to $49,999 | 355 (7.5%) | 126 (3.3%) |
| $50,000 to $54,999 | 228 (4.9%) | 140 (3.6%) |
| $55,000 to $64,999 | 442 (9.4%) | 226 (5.8%) |
| $65,000 to $74,999 | 292 (6.2%) | 149 (3.8%) |
| $75,000 to $99,999 | 301 (6.4%) | 223 (5.8%) |
| $100,000+ | 513 (10.9%) | 124 (3.2%) |
| Total | 4,705 (100.0%) | 3,872 (100.0%) |
Earnings by Sex by Educational Attainment in Kalkaska County
Average earnings in Kalkaska County are $45,835 for men and $31,196 for women, a difference of 31.9%. Men with an educational attainment of bachelor's degree enjoy the highest average annual earnings of $63,438, while those with less than high school education earn the least with $41,375. Women with an educational attainment of graduate degree earn the most with the average annual earnings of $63,996, while those with less than high school education have the smallest earnings of $16,250.

| Educational Attainment | Male Income | Female Income |
| Less than High School | $41,375 | $16,250 |
| High School Diploma | $41,769 | $29,649 |
| College or Associate's Degree | $50,679 | $28,431 |
| Bachelor's Degree | $63,438 | $50,286 |
| Graduate Degree | $59,145 | $63,996 |
| Total | $45,835 | $31,196 |
Family Income in Kalkaska County
Family Income Brackets in Kalkaska County
According to the Kalkaska County family income data, there are 1,014 families falling into the $50,000 to $74,999 income range, which is the most common income bracket and makes up 22.2% of all families. Conversely, the $10,000 to $14,999 income bracket is the least frequent group with only 119 families (2.6%) belonging to this category.
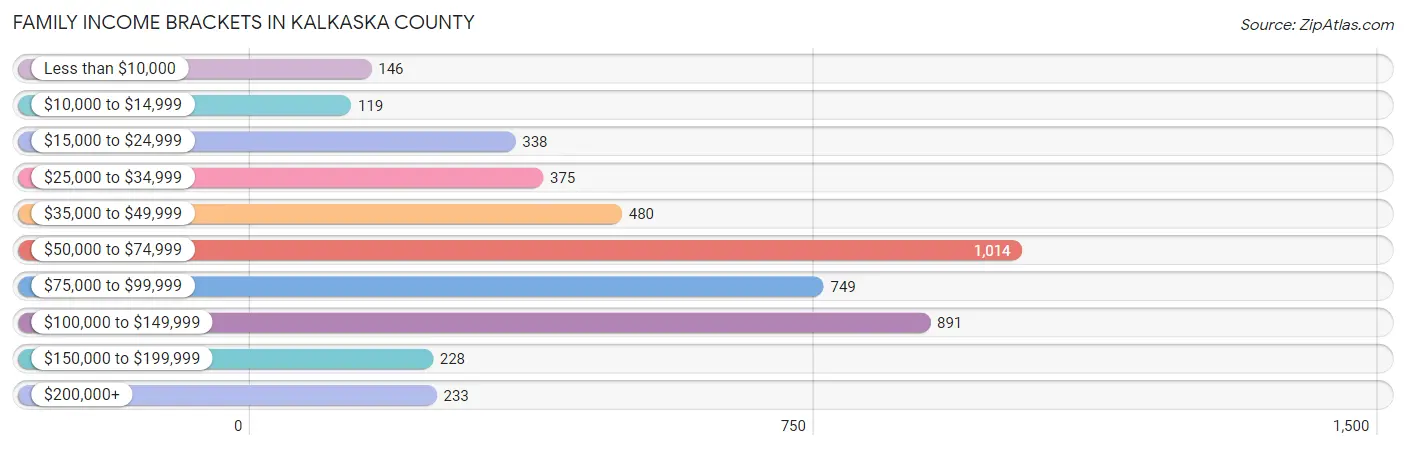
| Income Bracket | # Families | % Families |
| Less than $10,000 | 146 | 3.2% |
| $10,000 to $14,999 | 119 | 2.6% |
| $15,000 to $24,999 | 338 | 7.4% |
| $25,000 to $34,999 | 375 | 8.2% |
| $35,000 to $49,999 | 480 | 10.5% |
| $50,000 to $74,999 | 1,014 | 22.2% |
| $75,000 to $99,999 | 749 | 16.4% |
| $100,000 to $149,999 | 891 | 19.5% |
| $150,000 to $199,999 | 228 | 5.0% |
| $200,000+ | 233 | 5.1% |
Family Income by Famaliy Size in Kalkaska County
5-person families (389 | 8.5%) account for the highest median family income in Kalkaska County with $102,585 per family, while 2-person families (2,473 | 54.1%) have the highest median income of $30,491 per family member.

| Income Bracket | # Families | Median Income |
| 2-Person Families | 2,473 (54.1%) | $60,982 |
| 3-Person Families | 818 (17.9%) | $71,563 |
| 4-Person Families | 756 (16.6%) | $82,708 |
| 5-Person Families | 389 (8.5%) | $102,585 |
| 6-Person Families | 60 (1.3%) | $97,941 |
| 7+ Person Families | 72 (1.6%) | $82,500 |
| Total | 4,568 (100.0%) | $70,691 |
Family Income by Number of Earners in Kalkaska County
The median family income in Kalkaska County is $70,691, with families comprising 3+ earners (459) having the highest median family income of $104,844, while families with no earners (1,217) have the lowest median family income of $50,494, accounting for 10.1% and 26.6% of families, respectively.
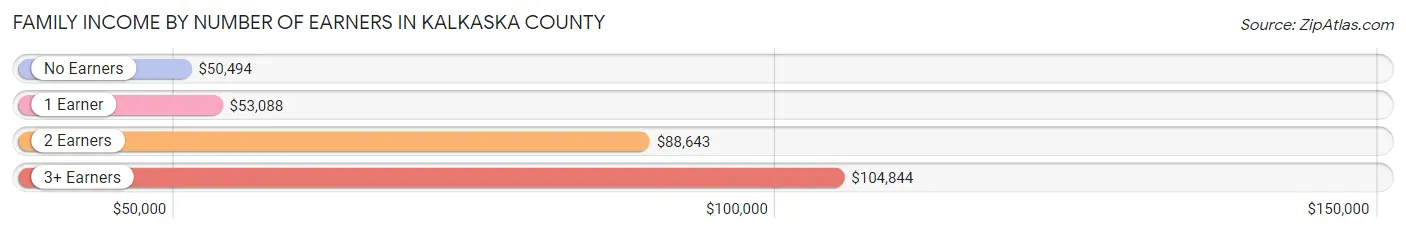
| Number of Earners | # Families | Median Income |
| No Earners | 1,217 (26.6%) | $50,494 |
| 1 Earner | 1,220 (26.7%) | $53,088 |
| 2 Earners | 1,672 (36.6%) | $88,643 |
| 3+ Earners | 459 (10.1%) | $104,844 |
| Total | 4,568 (100.0%) | $70,691 |
Household Income in Kalkaska County
Household Income Brackets in Kalkaska County
With 1,512 households falling in the category, the $50,000 to $74,999 income range is the most frequent in Kalkaska County, accounting for 20.5% of all households. In contrast, only 251 households (3.4%) fall into the less than $10,000 income bracket, making it the least populous group.

| Income Bracket | # Households | % Households |
| Less than $10,000 | 251 | 3.4% |
| $10,000 to $14,999 | 391 | 5.3% |
| $15,000 to $24,999 | 789 | 10.7% |
| $25,000 to $34,999 | 686 | 9.3% |
| $35,000 to $49,999 | 1,084 | 14.7% |
| $50,000 to $74,999 | 1,512 | 20.5% |
| $75,000 to $99,999 | 1,003 | 13.6% |
| $100,000 to $149,999 | 1,143 | 15.5% |
| $150,000 to $199,999 | 258 | 3.5% |
| $200,000+ | 258 | 3.5% |
Household Income by Householder Age in Kalkaska County
The median household income in Kalkaska County is $56,380, with the highest median household income of $73,229 found in the 25 to 44 years age bracket for the primary householder. A total of 1,991 households (27.0%) fall into this category. Meanwhile, the 15 to 24 years age bracket for the primary householder has the lowest median household income of $24,835, with 248 households (3.4%) in this group.
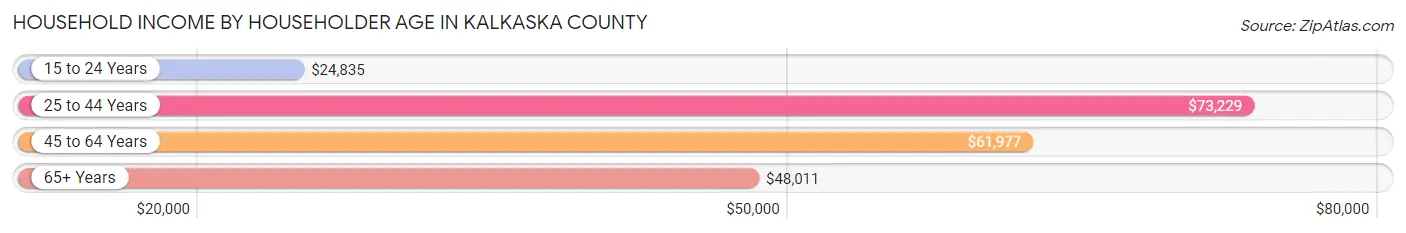
| Income Bracket | # Households | Median Income |
| 15 to 24 Years | 248 (3.4%) | $24,835 |
| 25 to 44 Years | 1,991 (27.0%) | $73,229 |
| 45 to 64 Years | 2,736 (37.1%) | $61,977 |
| 65+ Years | 2,402 (32.6%) | $48,011 |
| Total | 7,377 (100.0%) | $56,380 |
Poverty in Kalkaska County
Income Below Poverty by Sex and Age in Kalkaska County
With 13.1% poverty level for males and 16.4% for females among the residents of Kalkaska County, 5 year old males and 18 to 24 year old females are the most vulnerable to poverty, with 27 males (41.5%) and 168 females (28.8%) in their respective age groups living below the poverty level.
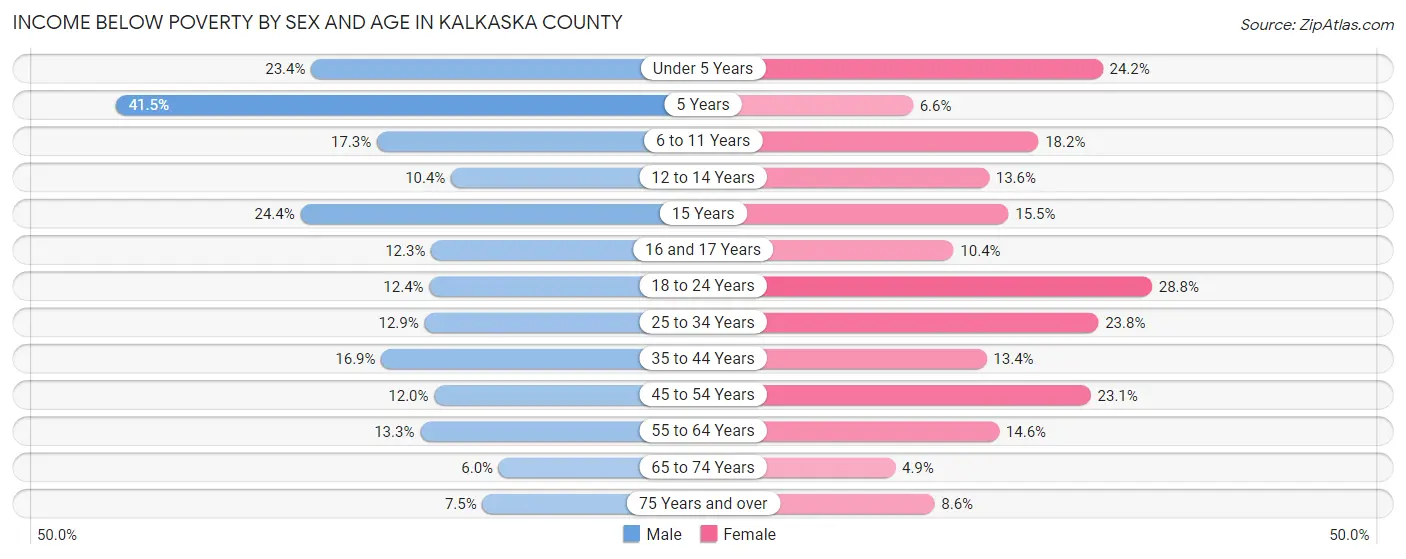
| Age Bracket | Male | Female |
| Under 5 Years | 102 (23.4%) | 113 (24.2%) |
| 5 Years | 27 (41.5%) | 5 (6.6%) |
| 6 to 11 Years | 97 (17.3%) | 111 (18.2%) |
| 12 to 14 Years | 41 (10.4%) | 42 (13.6%) |
| 15 Years | 40 (24.4%) | 15 (15.5%) |
| 16 and 17 Years | 26 (12.3%) | 20 (10.4%) |
| 18 to 24 Years | 86 (12.4%) | 168 (28.8%) |
| 25 to 34 Years | 128 (12.9%) | 257 (23.8%) |
| 35 to 44 Years | 191 (16.9%) | 138 (13.4%) |
| 45 to 54 Years | 135 (12.0%) | 242 (23.1%) |
| 55 to 64 Years | 192 (13.3%) | 205 (14.6%) |
| 65 to 74 Years | 70 (6.0%) | 57 (4.9%) |
| 75 Years and over | 48 (7.5%) | 59 (8.6%) |
| Total | 1,183 (13.1%) | 1,432 (16.4%) |
Income Above Poverty by Sex and Age in Kalkaska County
According to the poverty statistics in Kalkaska County, males aged 65 to 74 years and females aged 65 to 74 years are the age groups that are most secure financially, with 94.0% of males and 95.1% of females in these age groups living above the poverty line.

| Age Bracket | Male | Female |
| Under 5 Years | 334 (76.6%) | 354 (75.8%) |
| 5 Years | 38 (58.5%) | 71 (93.4%) |
| 6 to 11 Years | 464 (82.7%) | 498 (81.8%) |
| 12 to 14 Years | 353 (89.6%) | 266 (86.4%) |
| 15 Years | 124 (75.6%) | 82 (84.5%) |
| 16 and 17 Years | 186 (87.7%) | 173 (89.6%) |
| 18 to 24 Years | 606 (87.6%) | 416 (71.2%) |
| 25 to 34 Years | 866 (87.1%) | 823 (76.2%) |
| 35 to 44 Years | 940 (83.1%) | 890 (86.6%) |
| 45 to 54 Years | 993 (88.0%) | 806 (76.9%) |
| 55 to 64 Years | 1,254 (86.7%) | 1,201 (85.4%) |
| 65 to 74 Years | 1,101 (94.0%) | 1,096 (95.1%) |
| 75 Years and over | 592 (92.5%) | 628 (91.4%) |
| Total | 7,851 (86.9%) | 7,304 (83.6%) |
Income Below Poverty Among Married-Couple Families in Kalkaska County
The poverty statistics for married-couple families in Kalkaska County show that 5.8% or 211 of the total 3,653 families live below the poverty line. Families with 3 or 4 children have the highest poverty rate of 8.4%, comprising of 16 families. On the other hand, families with no children have the lowest poverty rate of 4.9%, which includes 118 families.
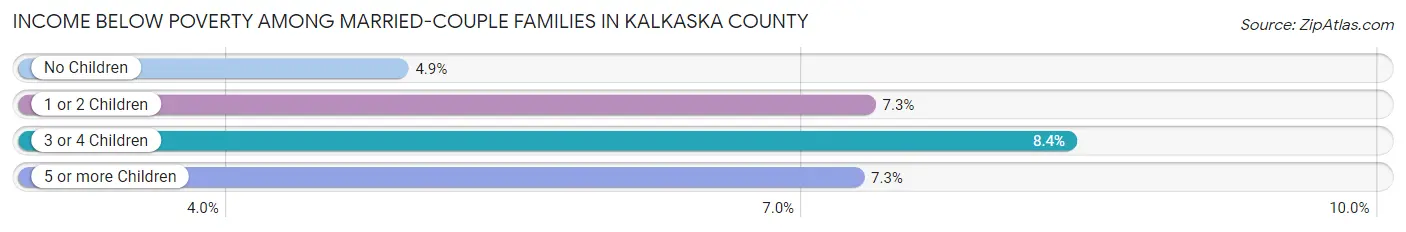
| Children | Above Poverty | Below Poverty |
| No Children | 2,293 (95.1%) | 118 (4.9%) |
| 1 or 2 Children | 923 (92.7%) | 73 (7.3%) |
| 3 or 4 Children | 175 (91.6%) | 16 (8.4%) |
| 5 or more Children | 51 (92.7%) | 4 (7.3%) |
| Total | 3,442 (94.2%) | 211 (5.8%) |
Income Below Poverty Among Single-Parent Households in Kalkaska County
According to the poverty data in Kalkaska County, 11.2% or 37 single-father households and 37.7% or 220 single-mother households are living below the poverty line. Among single-father households, those with 3 or 4 children have the highest poverty rate, with 9 households (15.8%) experiencing poverty. Likewise, among single-mother households, those with 3 or 4 children have the highest poverty rate, with 28 households (49.1%) falling below the poverty line.
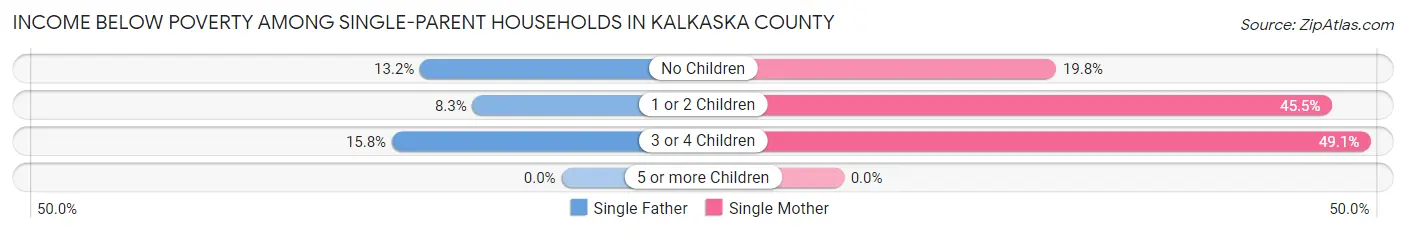
| Children | Single Father | Single Mother |
| No Children | 15 (13.2%) | 35 (19.8%) |
| 1 or 2 Children | 13 (8.3%) | 157 (45.5%) |
| 3 or 4 Children | 9 (15.8%) | 28 (49.1%) |
| 5 or more Children | 0 (0.0%) | 0 (0.0%) |
| Total | 37 (11.2%) | 220 (37.7%) |
Income Below Poverty Among Married-Couple vs Single-Parent Households in Kalkaska County
The poverty data for Kalkaska County shows that 211 of the married-couple family households (5.8%) and 257 of the single-parent households (28.1%) are living below the poverty level. Within the married-couple family households, those with 3 or 4 children have the highest poverty rate, with 16 households (8.4%) falling below the poverty line. Among the single-parent households, those with 1 or 2 children have the highest poverty rate, with 170 household (33.9%) living below poverty.
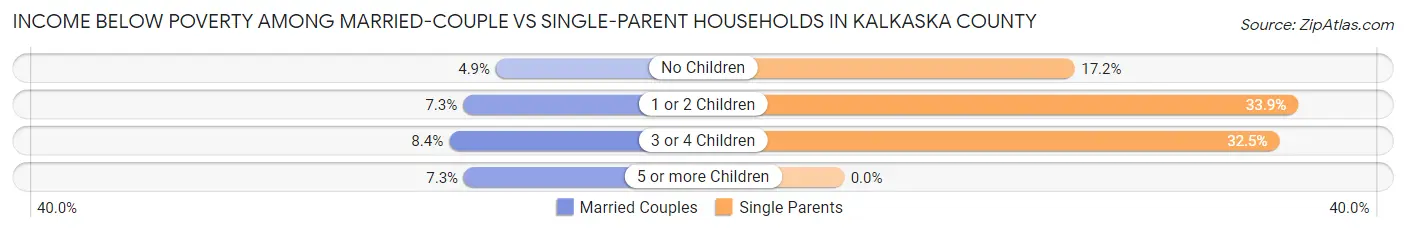
| Children | Married-Couple Families | Single-Parent Households |
| No Children | 118 (4.9%) | 50 (17.2%) |
| 1 or 2 Children | 73 (7.3%) | 170 (33.9%) |
| 3 or 4 Children | 16 (8.4%) | 37 (32.5%) |
| 5 or more Children | 4 (7.3%) | 0 (0.0%) |
| Total | 211 (5.8%) | 257 (28.1%) |
Employment Characteristics in Kalkaska County
Employment by Class of Employer in Kalkaska County
Among the 7,438 employed individuals in Kalkaska County, private company employees (5,264 | 70.8%), not-for-profit organizations (672 | 9.0%), and local government employees (517 | 7.0%) make up the most common classes of employment.
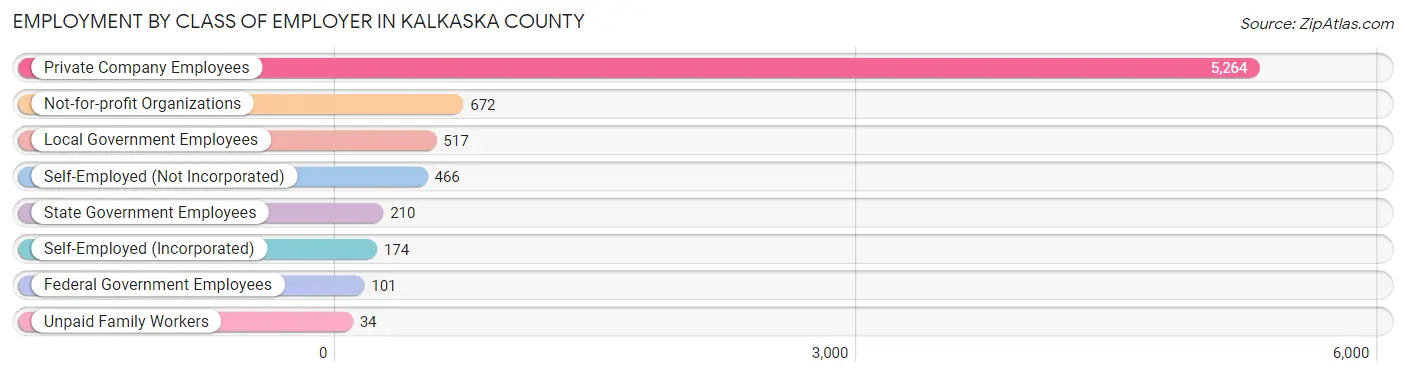
| Employer Class | # Employees | % Employees |
| Private Company Employees | 5,264 | 70.8% |
| Self-Employed (Incorporated) | 174 | 2.3% |
| Self-Employed (Not Incorporated) | 466 | 6.3% |
| Not-for-profit Organizations | 672 | 9.0% |
| Local Government Employees | 517 | 7.0% |
| State Government Employees | 210 | 2.8% |
| Federal Government Employees | 101 | 1.4% |
| Unpaid Family Workers | 34 | 0.5% |
| Total | 7,438 | 100.0% |
Employment Status by Age in Kalkaska County
According to the labor force statistics for Kalkaska County, out of the total population over 16 years of age (14,673), 54.4% or 7,982 individuals are in the labor force, with 4.6% or 367 of them unemployed. The age group with the highest labor force participation rate is 35 to 44 years, with 84.2% or 1,822 individuals in the labor force. Within the labor force, the 16 to 19 years age range has the highest percentage of unemployed individuals, with 10.7% or 41 of them being unemployed.
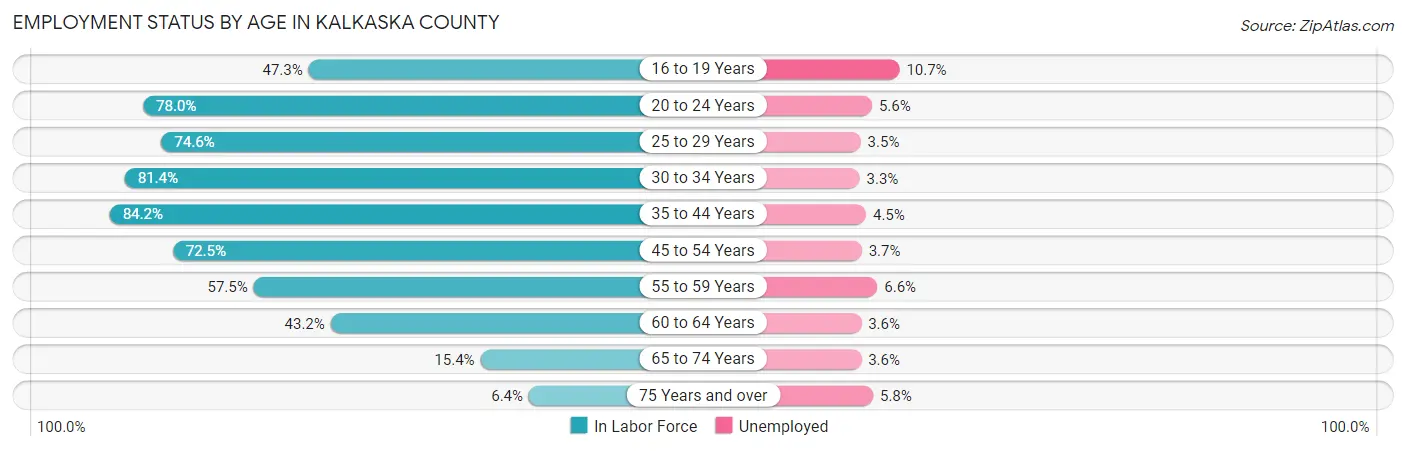
| Age Bracket | In Labor Force | Unemployed |
| 16 to 19 Years | 383 (47.3%) | 41 (10.7%) |
| 20 to 24 Years | 680 (78.0%) | 38 (5.6%) |
| 25 to 29 Years | 783 (74.6%) | 27 (3.5%) |
| 30 to 34 Years | 856 (81.4%) | 28 (3.3%) |
| 35 to 44 Years | 1,822 (84.2%) | 82 (4.5%) |
| 45 to 54 Years | 1,584 (72.5%) | 59 (3.7%) |
| 55 to 59 Years | 756 (57.5%) | 50 (6.6%) |
| 60 to 64 Years | 673 (43.2%) | 24 (3.6%) |
| 65 to 74 Years | 358 (15.4%) | 13 (3.6%) |
| 75 Years and over | 86 (6.4%) | 5 (5.8%) |
| Total | 7,982 (54.4%) | 367 (4.6%) |
Employment Status by Educational Attainment in Kalkaska County
According to labor force statistics for Kalkaska County, 69.4% of individuals (6,470) out of the total population between 25 and 64 years of age (9,323) are in the labor force, with 4.2% or 272 of them being unemployed. The group with the highest labor force participation rate are those with the educational attainment of bachelor's degree or higher, with 79.8% or 1,349 individuals in the labor force. Within the labor force, individuals with high school diploma education have the highest percentage of unemployment, with 6.1% or 146 of them being unemployed.
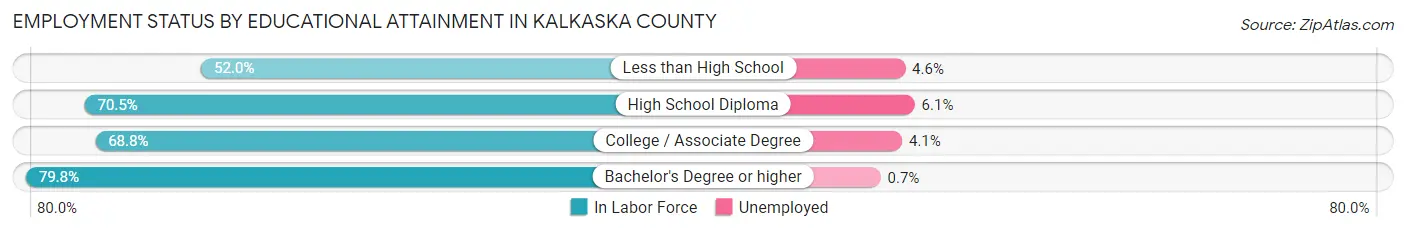
| Educational Attainment | In Labor Force | Unemployed |
| Less than High School | 562 (52.0%) | 50 (4.6%) |
| High School Diploma | 2,391 (70.5%) | 207 (6.1%) |
| College / Associate Degree | 2,175 (68.8%) | 130 (4.1%) |
| Bachelor's Degree or higher | 1,349 (79.8%) | 12 (0.7%) |
| Total | 6,470 (69.4%) | 392 (4.2%) |
Employment Occupations by Sex in Kalkaska County
Management, Business, Science and Arts Occupations
The most common Management, Business, Science and Arts occupations in Kalkaska County are Community & Social Service (646 | 8.5%), Management (583 | 7.7%), Health Diagnosing & Treating (379 | 5.0%), Education Instruction & Library (342 | 4.5%), and Health Technologists (244 | 3.2%).

Management, Business, Science and Arts Occupations by Sex
Within the Management, Business, Science and Arts occupations in Kalkaska County, the most male-oriented occupations are Architecture & Engineering (91.1%), Computers, Engineering & Science (81.6%), and Life, Physical & Social Science (76.0%), while the most female-oriented occupations are Education Instruction & Library (86.6%), Health Diagnosing & Treating (82.3%), and Health Technologists (81.6%).
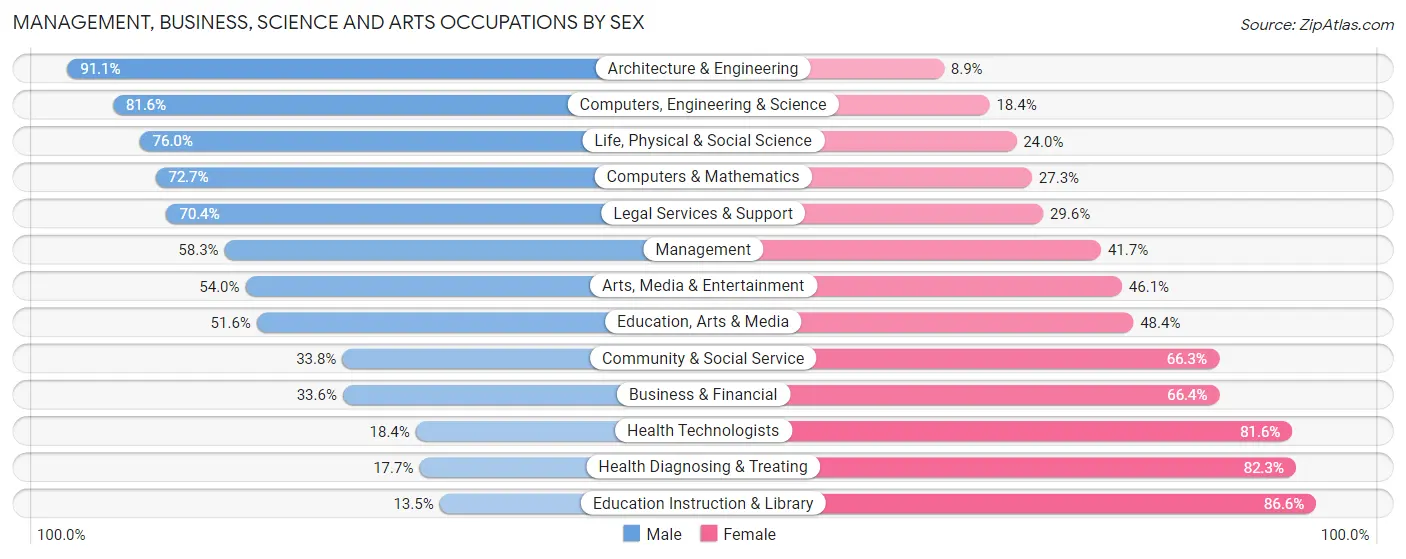
| Occupation | Male | Female |
| Management | 340 (58.3%) | 243 (41.7%) |
| Business & Financial | 37 (33.6%) | 73 (66.4%) |
| Computers, Engineering & Science | 186 (81.6%) | 42 (18.4%) |
| Computers & Mathematics | 56 (72.7%) | 21 (27.3%) |
| Architecture & Engineering | 92 (91.1%) | 9 (8.9%) |
| Life, Physical & Social Science | 38 (76.0%) | 12 (24.0%) |
| Community & Social Service | 218 (33.8%) | 428 (66.2%) |
| Education, Arts & Media | 81 (51.6%) | 76 (48.4%) |
| Legal Services & Support | 50 (70.4%) | 21 (29.6%) |
| Education Instruction & Library | 46 (13.5%) | 296 (86.6%) |
| Arts, Media & Entertainment | 41 (53.9%) | 35 (46.1%) |
| Health Diagnosing & Treating | 67 (17.7%) | 312 (82.3%) |
| Health Technologists | 45 (18.4%) | 199 (81.6%) |
| Total (Category) | 848 (43.6%) | 1,098 (56.4%) |
| Total (Overall) | 4,228 (55.6%) | 3,371 (44.4%) |
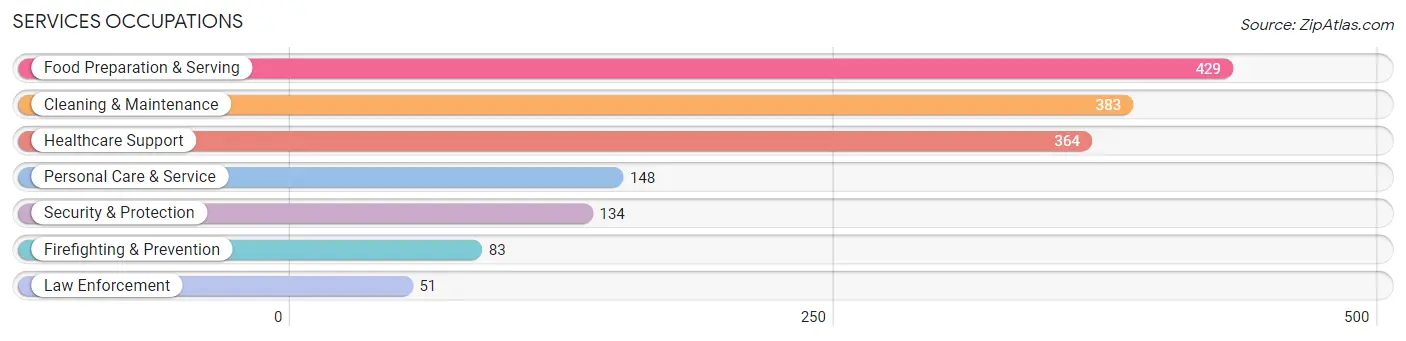
Services Occupations
The most common Services occupations in Kalkaska County are Food Preparation & Serving (429 | 5.7%), Cleaning & Maintenance (383 | 5.0%), Healthcare Support (364 | 4.8%), Personal Care & Service (148 | 1.9%), and Security & Protection (134 | 1.8%).
Services Occupations by Sex
Within the Services occupations in Kalkaska County, the most male-oriented occupations are Law Enforcement (100.0%), Security & Protection (90.3%), and Firefighting & Prevention (84.3%), while the most female-oriented occupations are Healthcare Support (79.7%), Personal Care & Service (73.7%), and Food Preparation & Serving (70.2%).
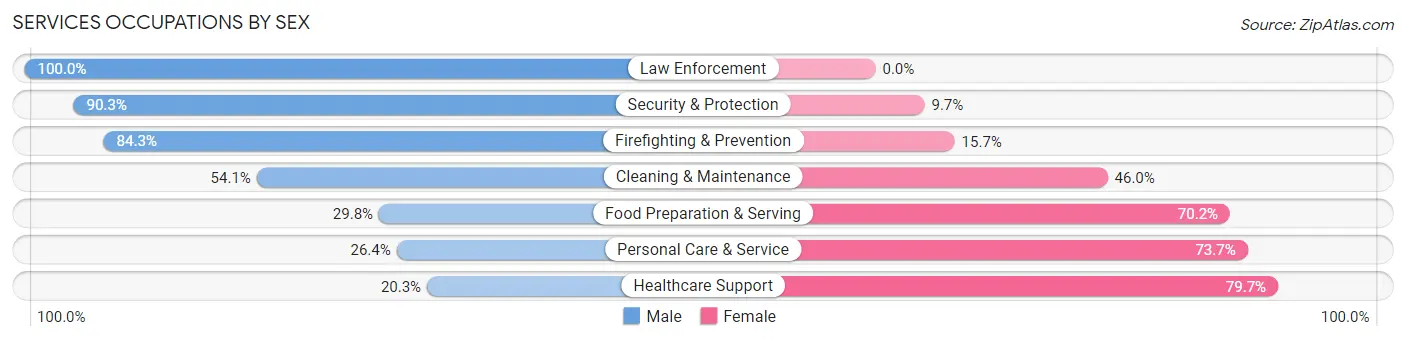
| Occupation | Male | Female |
| Healthcare Support | 74 (20.3%) | 290 (79.7%) |
| Security & Protection | 121 (90.3%) | 13 (9.7%) |
| Firefighting & Prevention | 70 (84.3%) | 13 (15.7%) |
| Law Enforcement | 51 (100.0%) | 0 (0.0%) |
| Food Preparation & Serving | 128 (29.8%) | 301 (70.2%) |
| Cleaning & Maintenance | 207 (54.0%) | 176 (46.0%) |
| Personal Care & Service | 39 (26.4%) | 109 (73.7%) |
| Total (Category) | 569 (39.0%) | 889 (61.0%) |
| Total (Overall) | 4,228 (55.6%) | 3,371 (44.4%) |
Sales and Office Occupations
The most common Sales and Office occupations in Kalkaska County are Office & Administration (951 | 12.5%), and Sales & Related (747 | 9.8%).

Sales and Office Occupations by Sex
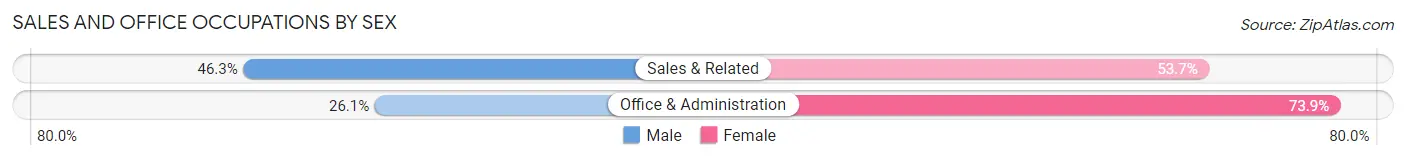
| Occupation | Male | Female |
| Sales & Related | 346 (46.3%) | 401 (53.7%) |
| Office & Administration | 248 (26.1%) | 703 (73.9%) |
| Total (Category) | 594 (35.0%) | 1,104 (65.0%) |
| Total (Overall) | 4,228 (55.6%) | 3,371 (44.4%) |
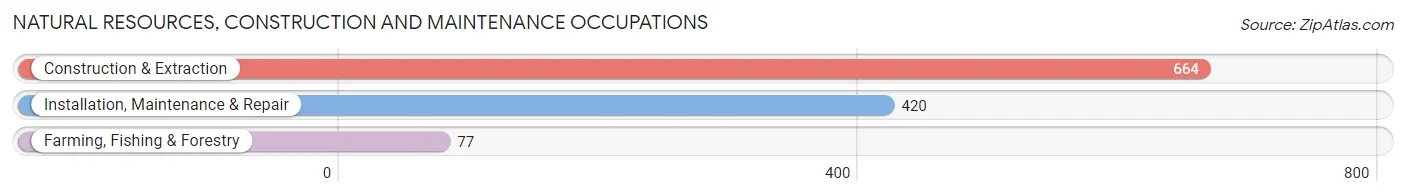
Natural Resources, Construction and Maintenance Occupations
The most common Natural Resources, Construction and Maintenance occupations in Kalkaska County are Construction & Extraction (664 | 8.7%), Installation, Maintenance & Repair (420 | 5.5%), and Farming, Fishing & Forestry (77 | 1.0%).
Natural Resources, Construction and Maintenance Occupations by Sex
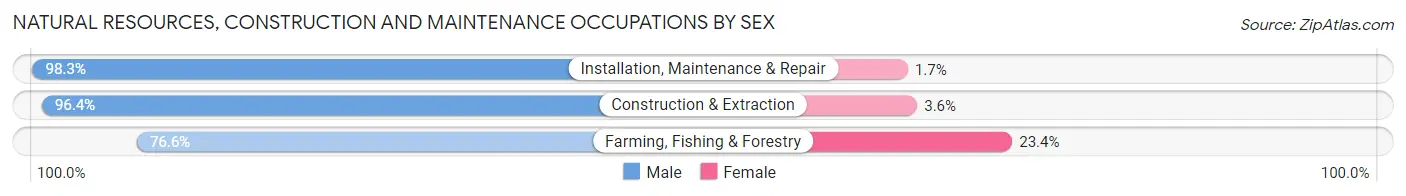
| Occupation | Male | Female |
| Farming, Fishing & Forestry | 59 (76.6%) | 18 (23.4%) |
| Construction & Extraction | 640 (96.4%) | 24 (3.6%) |
| Installation, Maintenance & Repair | 413 (98.3%) | 7 (1.7%) |
| Total (Category) | 1,112 (95.8%) | 49 (4.2%) |
| Total (Overall) | 4,228 (55.6%) | 3,371 (44.4%) |
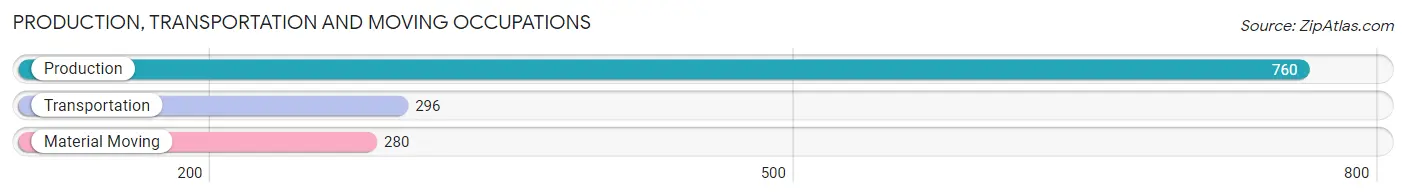
Production, Transportation and Moving Occupations
The most common Production, Transportation and Moving occupations in Kalkaska County are Production (760 | 10.0%), Transportation (296 | 3.9%), and Material Moving (280 | 3.7%).
Production, Transportation and Moving Occupations by Sex
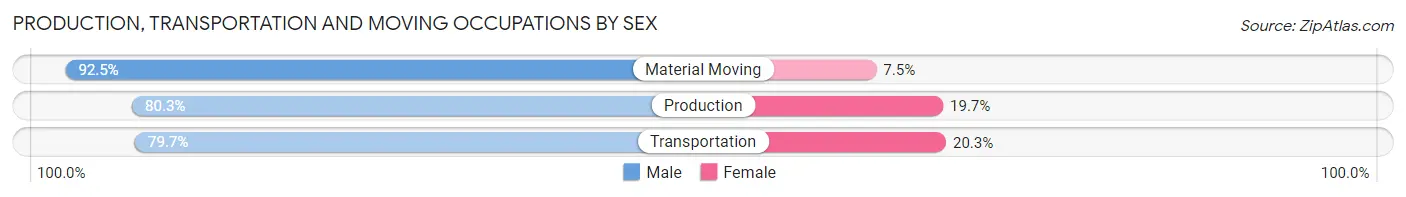
| Occupation | Male | Female |
| Production | 610 (80.3%) | 150 (19.7%) |
| Transportation | 236 (79.7%) | 60 (20.3%) |
| Material Moving | 259 (92.5%) | 21 (7.5%) |
| Total (Category) | 1,105 (82.7%) | 231 (17.3%) |
| Total (Overall) | 4,228 (55.6%) | 3,371 (44.4%) |
Employment Industries by Sex in Kalkaska County
Employment Industries in Kalkaska County
The major employment industries in Kalkaska County include Health Care & Social Assistance (1,149 | 15.1%), Manufacturing (1,123 | 14.8%), Retail Trade (929 | 12.2%), Construction (735 | 9.7%), and Accommodation & Food Services (610 | 8.0%).

Employment Industries by Sex in Kalkaska County
The Kalkaska County industries that see more men than women are Enterprise Management (100.0%), Construction (92.9%), and Mining, Quarrying, & Extraction (88.5%), whereas the industries that tend to have a higher number of women are Educational Services (81.6%), Health Care & Social Assistance (80.9%), and Accommodation & Food Services (60.8%).
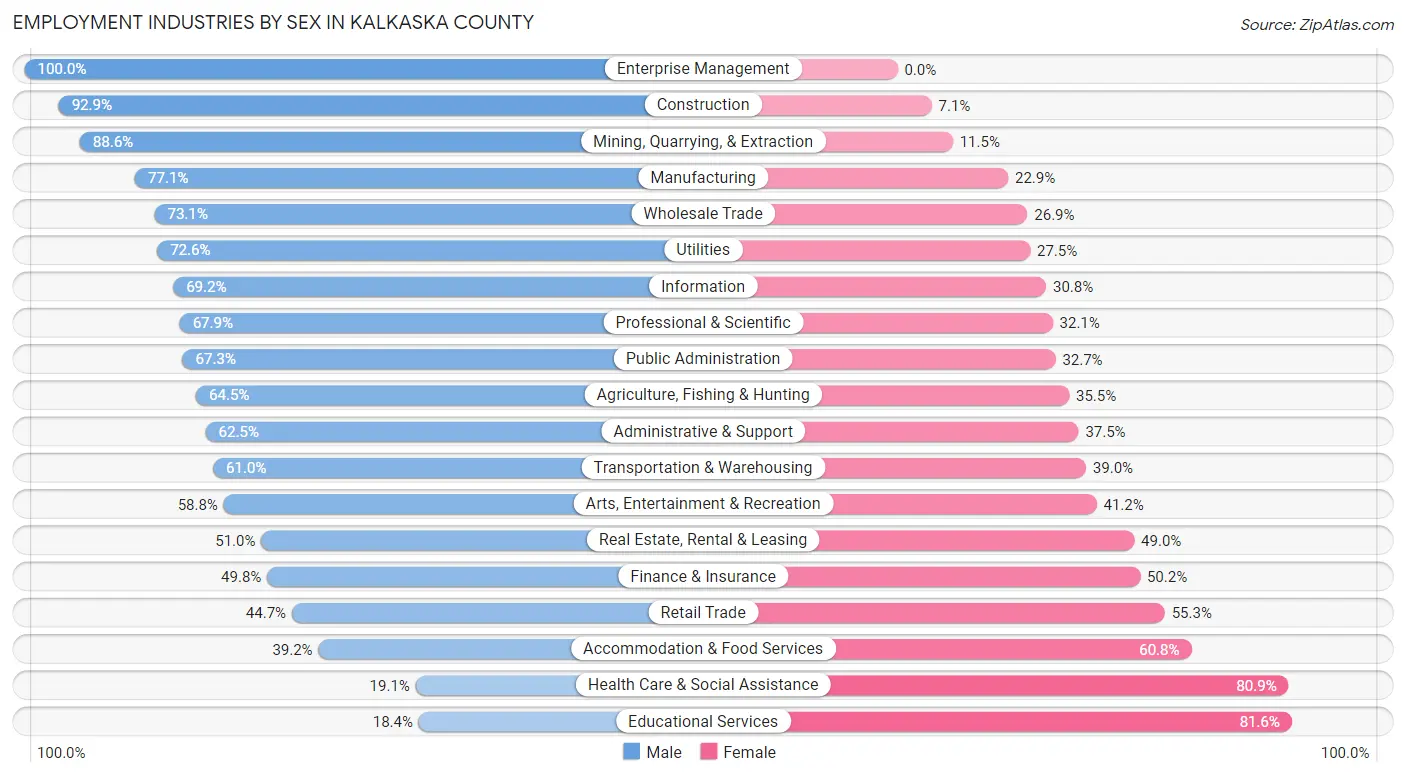
| Industry | Male | Female |
| Agriculture, Fishing & Hunting | 118 (64.5%) | 65 (35.5%) |
| Mining, Quarrying, & Extraction | 116 (88.5%) | 15 (11.5%) |
| Construction | 683 (92.9%) | 52 (7.1%) |
| Manufacturing | 866 (77.1%) | 257 (22.9%) |
| Wholesale Trade | 106 (73.1%) | 39 (26.9%) |
| Retail Trade | 415 (44.7%) | 514 (55.3%) |
| Transportation & Warehousing | 136 (61.0%) | 87 (39.0%) |
| Utilities | 37 (72.6%) | 14 (27.5%) |
| Information | 63 (69.2%) | 28 (30.8%) |
| Finance & Insurance | 119 (49.8%) | 120 (50.2%) |
| Real Estate, Rental & Leasing | 51 (51.0%) | 49 (49.0%) |
| Professional & Scientific | 131 (67.9%) | 62 (32.1%) |
| Enterprise Management | 3 (100.0%) | 0 (0.0%) |
| Administrative & Support | 232 (62.5%) | 139 (37.5%) |
| Educational Services | 69 (18.4%) | 306 (81.6%) |
| Health Care & Social Assistance | 219 (19.1%) | 930 (80.9%) |
| Arts, Entertainment & Recreation | 117 (58.8%) | 82 (41.2%) |
| Accommodation & Food Services | 239 (39.2%) | 371 (60.8%) |
| Public Administration | 181 (67.3%) | 88 (32.7%) |
| Total | 4,228 (55.6%) | 3,371 (44.4%) |
Education in Kalkaska County
School Enrollment in Kalkaska County
The most common levels of schooling among the 3,636 students in Kalkaska County are high school (971 | 26.7%), middle school (878 | 24.1%), and elementary school (731 | 20.1%).

| School Level | # Students | % Students |
| Nursery / Preschool | 246 | 6.8% |
| Kindergarten | 140 | 3.8% |
| Elementary School | 731 | 20.1% |
| Middle School | 878 | 24.1% |
| High School | 971 | 26.7% |
| College / Undergraduate | 590 | 16.2% |
| Graduate / Professional | 80 | 2.2% |
| Total | 3,636 | 100.0% |
School Enrollment by Age by Funding Source in Kalkaska County
Out of a total of 3,636 students who are enrolled in schools in Kalkaska County, 527 (14.5%) attend a private institution, while the remaining 3,109 (85.5%) are enrolled in public schools. The age group of 3 to 4 year olds has the highest likelihood of being enrolled in private schools, with 88 (42.5% in the age bracket) enrolled. Conversely, the age group of 18 to 19 year olds has the lowest likelihood of being enrolled in a private school, with 265 (100.0% in the age bracket) attending a public institution.
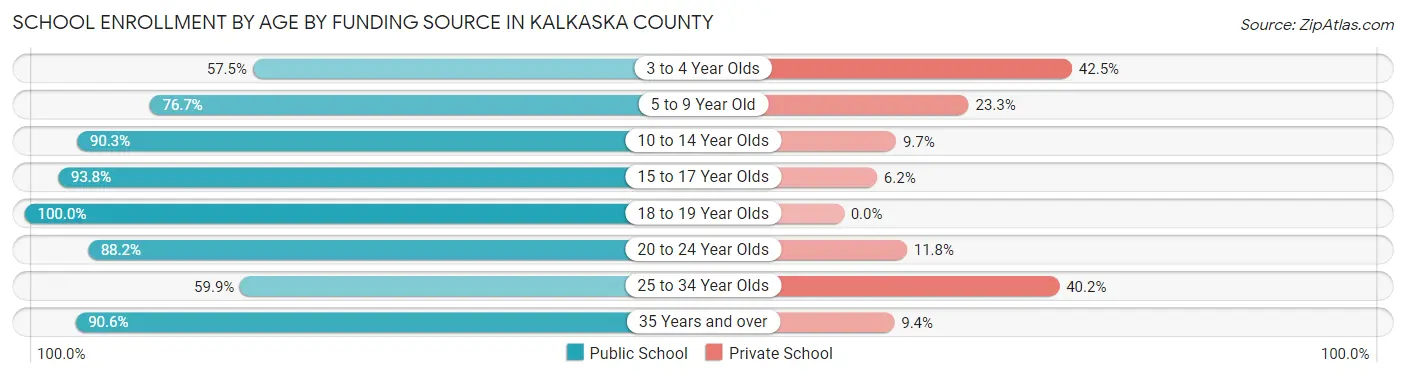
| Age Bracket | Public School | Private School |
| 3 to 4 Year Olds | 119 (57.5%) | 88 (42.5%) |
| 5 to 9 Year Old | 627 (76.7%) | 190 (23.3%) |
| 10 to 14 Year Olds | 1,075 (90.3%) | 116 (9.7%) |
| 15 to 17 Year Olds | 606 (93.8%) | 40 (6.2%) |
| 18 to 19 Year Olds | 265 (100.0%) | 0 (0.0%) |
| 20 to 24 Year Olds | 240 (88.2%) | 32 (11.8%) |
| 25 to 34 Year Olds | 79 (59.9%) | 53 (40.2%) |
| 35 Years and over | 96 (90.6%) | 10 (9.4%) |
| Total | 3,109 (85.5%) | 527 (14.5%) |
Educational Attainment by Field of Study in Kalkaska County
Business (458 | 18.9%), education (437 | 18.0%), science & technology (254 | 10.5%), arts & humanities (177 | 7.3%), and psychology (166 | 6.9%) are the most common fields of study among 2,424 individuals in Kalkaska County who have obtained a bachelor's degree or higher.
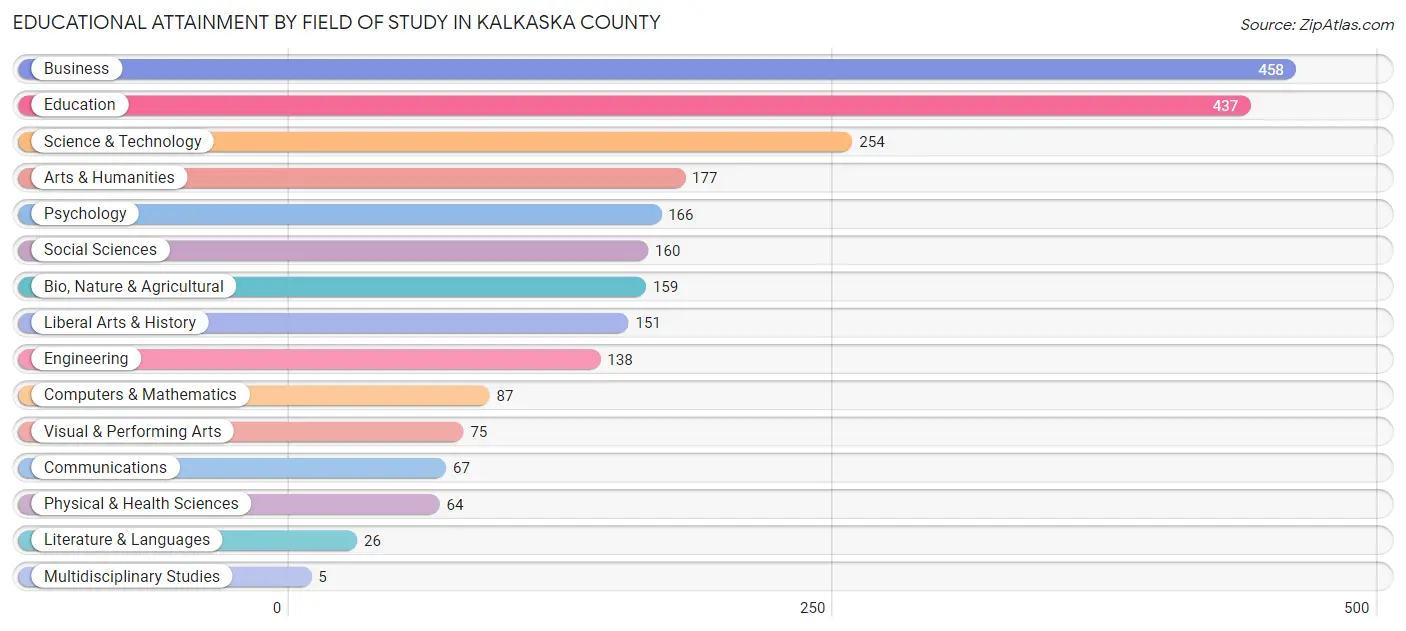
| Field of Study | # Graduates | % Graduates |
| Computers & Mathematics | 87 | 3.6% |
| Bio, Nature & Agricultural | 159 | 6.6% |
| Physical & Health Sciences | 64 | 2.6% |
| Psychology | 166 | 6.9% |
| Social Sciences | 160 | 6.6% |
| Engineering | 138 | 5.7% |
| Multidisciplinary Studies | 5 | 0.2% |
| Science & Technology | 254 | 10.5% |
| Business | 458 | 18.9% |
| Education | 437 | 18.0% |
| Literature & Languages | 26 | 1.1% |
| Liberal Arts & History | 151 | 6.2% |
| Visual & Performing Arts | 75 | 3.1% |
| Communications | 67 | 2.8% |
| Arts & Humanities | 177 | 7.3% |
| Total | 2,424 | 100.0% |
Transportation & Commute in Kalkaska County
Vehicle Availability by Sex in Kalkaska County
The most prevalent vehicle ownership categories in Kalkaska County are males with 2 vehicles (1,788, accounting for 42.7%) and females with 2 vehicles (1,325, making up 55.2%).
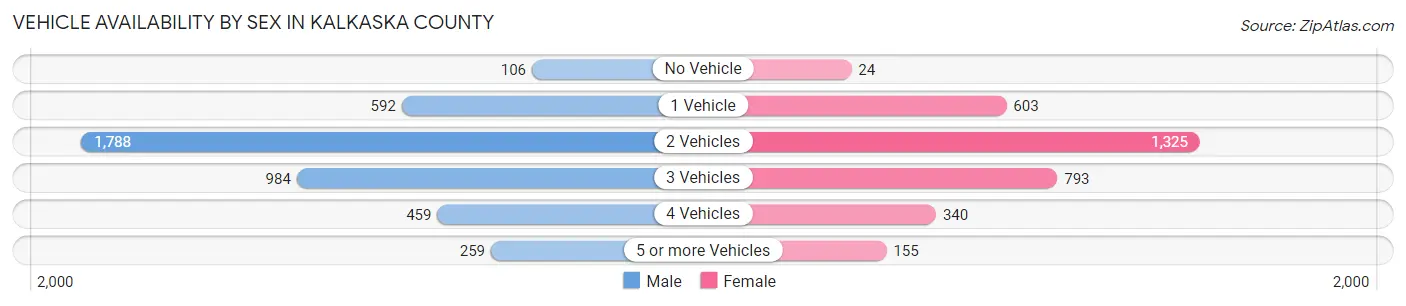
| Vehicles Available | Male | Female |
| No Vehicle | 106 (2.5%) | 24 (0.7%) |
| 1 Vehicle | 592 (14.1%) | 603 (18.6%) |
| 2 Vehicles | 1,788 (42.7%) | 1,325 (40.9%) |
| 3 Vehicles | 984 (23.5%) | 793 (24.5%) |
| 4 Vehicles | 459 (11.0%) | 340 (10.5%) |
| 5 or more Vehicles | 259 (6.2%) | 155 (4.8%) |
| Total | 4,188 (100.0%) | 3,240 (100.0%) |
Commute Time in Kalkaska County
The most frequently occuring commute durations in Kalkaska County are 15 to 19 minutes (1,001 commuters, 14.2%), 20 to 24 minutes (868 commuters, 12.3%), and 10 to 14 minutes (813 commuters, 11.5%).
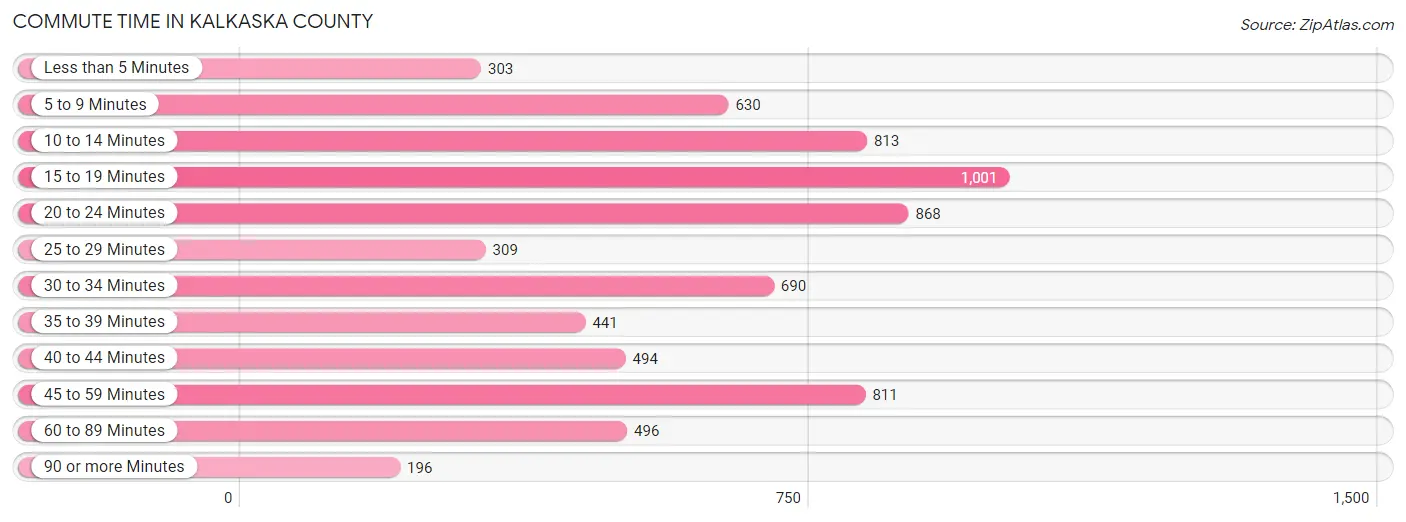
| Commute Time | # Commuters | % Commuters |
| Less than 5 Minutes | 303 | 4.3% |
| 5 to 9 Minutes | 630 | 8.9% |
| 10 to 14 Minutes | 813 | 11.5% |
| 15 to 19 Minutes | 1,001 | 14.2% |
| 20 to 24 Minutes | 868 | 12.3% |
| 25 to 29 Minutes | 309 | 4.4% |
| 30 to 34 Minutes | 690 | 9.8% |
| 35 to 39 Minutes | 441 | 6.2% |
| 40 to 44 Minutes | 494 | 7.0% |
| 45 to 59 Minutes | 811 | 11.5% |
| 60 to 89 Minutes | 496 | 7.0% |
| 90 or more Minutes | 196 | 2.8% |
Commute Time by Sex in Kalkaska County
The most common commute times in Kalkaska County are 20 to 24 minutes (565 commuters, 14.1%) for males and 15 to 19 minutes (517 commuters, 17.0%) for females.
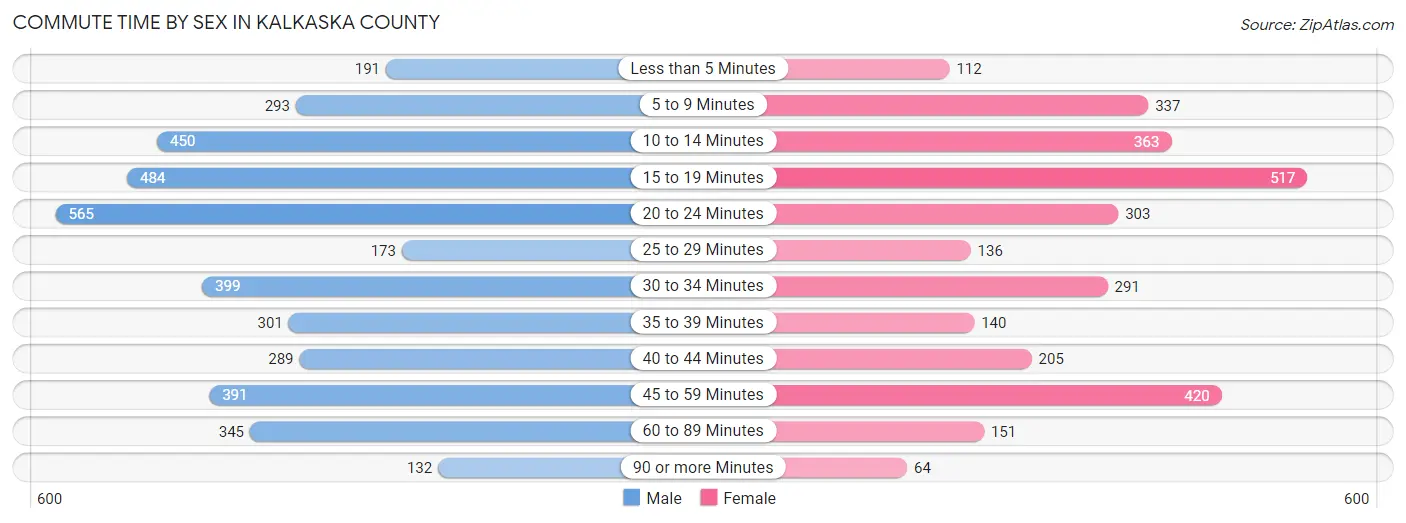
| Commute Time | Male | Female |
| Less than 5 Minutes | 191 (4.8%) | 112 (3.7%) |
| 5 to 9 Minutes | 293 (7.3%) | 337 (11.1%) |
| 10 to 14 Minutes | 450 (11.2%) | 363 (11.9%) |
| 15 to 19 Minutes | 484 (12.1%) | 517 (17.0%) |
| 20 to 24 Minutes | 565 (14.1%) | 303 (10.0%) |
| 25 to 29 Minutes | 173 (4.3%) | 136 (4.5%) |
| 30 to 34 Minutes | 399 (9.9%) | 291 (9.6%) |
| 35 to 39 Minutes | 301 (7.5%) | 140 (4.6%) |
| 40 to 44 Minutes | 289 (7.2%) | 205 (6.8%) |
| 45 to 59 Minutes | 391 (9.7%) | 420 (13.8%) |
| 60 to 89 Minutes | 345 (8.6%) | 151 (5.0%) |
| 90 or more Minutes | 132 (3.3%) | 64 (2.1%) |
Time of Departure to Work by Sex in Kalkaska County
The most frequent times of departure to work in Kalkaska County are 7:30 AM to 7:59 AM (581, 14.5%) for males and 7:00 AM to 7:29 AM (595, 19.6%) for females.

| Time of Departure | Male | Female |
| 12:00 AM to 4:59 AM | 366 (9.1%) | 59 (1.9%) |
| 5:00 AM to 5:29 AM | 243 (6.1%) | 124 (4.1%) |
| 5:30 AM to 5:59 AM | 334 (8.3%) | 137 (4.5%) |
| 6:00 AM to 6:29 AM | 373 (9.3%) | 180 (5.9%) |
| 6:30 AM to 6:59 AM | 433 (10.8%) | 244 (8.0%) |
| 7:00 AM to 7:29 AM | 510 (12.7%) | 595 (19.6%) |
| 7:30 AM to 7:59 AM | 581 (14.5%) | 483 (15.9%) |
| 8:00 AM to 8:29 AM | 330 (8.2%) | 262 (8.6%) |
| 8:30 AM to 8:59 AM | 46 (1.1%) | 144 (4.7%) |
| 9:00 AM to 9:59 AM | 242 (6.0%) | 179 (5.9%) |
| 10:00 AM to 10:59 AM | 103 (2.6%) | 85 (2.8%) |
| 11:00 AM to 11:59 AM | 40 (1.0%) | 43 (1.4%) |
| 12:00 PM to 3:59 PM | 251 (6.2%) | 178 (5.9%) |
| 4:00 PM to 11:59 PM | 161 (4.0%) | 326 (10.7%) |
| Total | 4,013 (100.0%) | 3,039 (100.0%) |
Housing Occupancy in Kalkaska County
Occupancy by Ownership in Kalkaska County
Of the total 7,377 dwellings in Kalkaska County, owner-occupied units account for 6,362 (86.2%), while renter-occupied units make up 1,015 (13.8%).

| Occupancy | # Housing Units | % Housing Units |
| Owner Occupied Housing Units | 6,362 | 86.2% |
| Renter-Occupied Housing Units | 1,015 | 13.8% |
| Total Occupied Housing Units | 7,377 | 100.0% |
Occupancy by Household Size in Kalkaska County
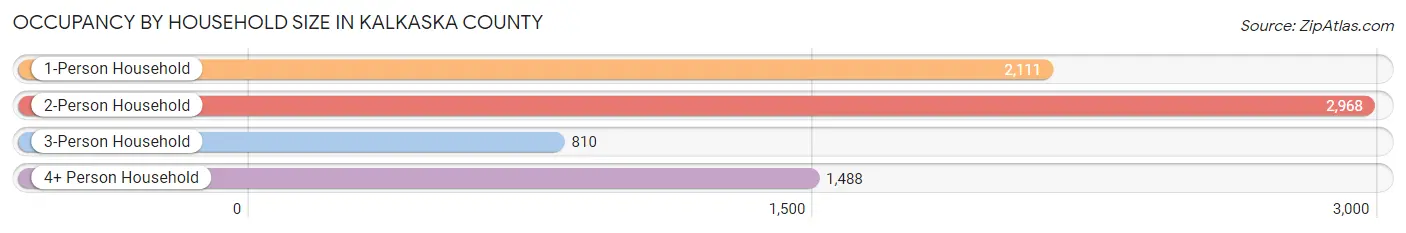
| Household Size | # Housing Units | % Housing Units |
| 1-Person Household | 2,111 | 28.6% |
| 2-Person Household | 2,968 | 40.2% |
| 3-Person Household | 810 | 11.0% |
| 4+ Person Household | 1,488 | 20.2% |
| Total Housing Units | 7,377 | 100.0% |
Occupancy by Ownership by Household Size in Kalkaska County

| Household Size | Owner-occupied | Renter-occupied |
| 1-Person Household | 1,707 (80.9%) | 404 (19.1%) |
| 2-Person Household | 2,691 (90.7%) | 277 (9.3%) |
| 3-Person Household | 747 (92.2%) | 63 (7.8%) |
| 4+ Person Household | 1,217 (81.8%) | 271 (18.2%) |
| Total Housing Units | 6,362 (86.2%) | 1,015 (13.8%) |
Occupancy by Educational Attainment in Kalkaska County
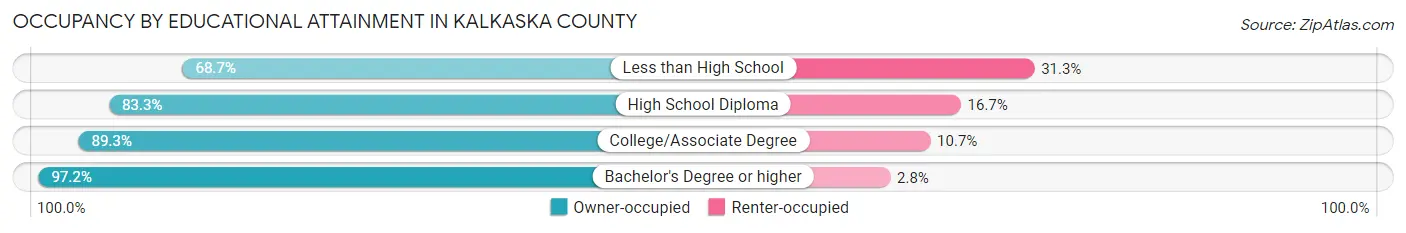
| Household Size | Owner-occupied | Renter-occupied |
| Less than High School | 572 (68.7%) | 261 (31.3%) |
| High School Diploma | 2,169 (83.3%) | 436 (16.7%) |
| College/Associate Degree | 2,354 (89.3%) | 282 (10.7%) |
| Bachelor's Degree or higher | 1,267 (97.2%) | 36 (2.8%) |
Occupancy by Age of Householder in Kalkaska County
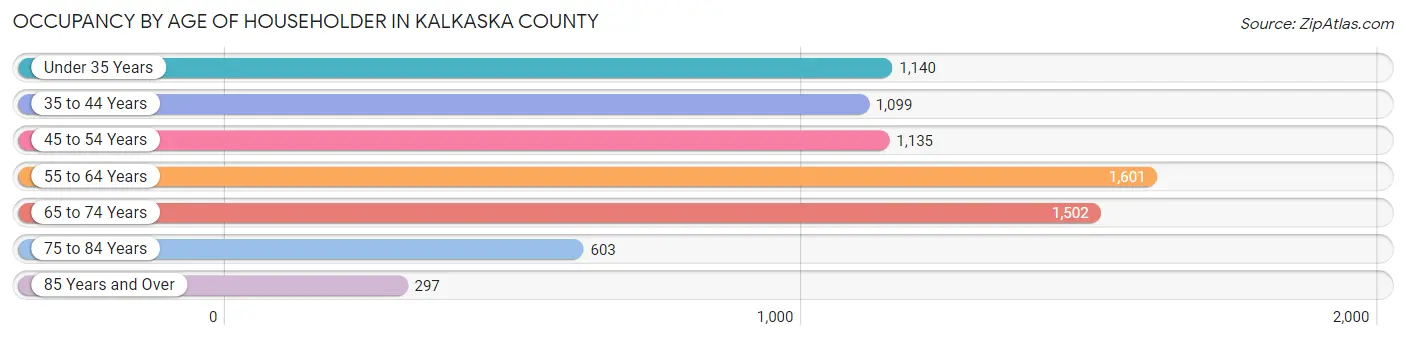
| Age Bracket | # Households | % Households |
| Under 35 Years | 1,140 | 15.4% |
| 35 to 44 Years | 1,099 | 14.9% |
| 45 to 54 Years | 1,135 | 15.4% |
| 55 to 64 Years | 1,601 | 21.7% |
| 65 to 74 Years | 1,502 | 20.4% |
| 75 to 84 Years | 603 | 8.2% |
| 85 Years and Over | 297 | 4.0% |
| Total | 7,377 | 100.0% |
Housing Finances in Kalkaska County
Median Income by Occupancy in Kalkaska County
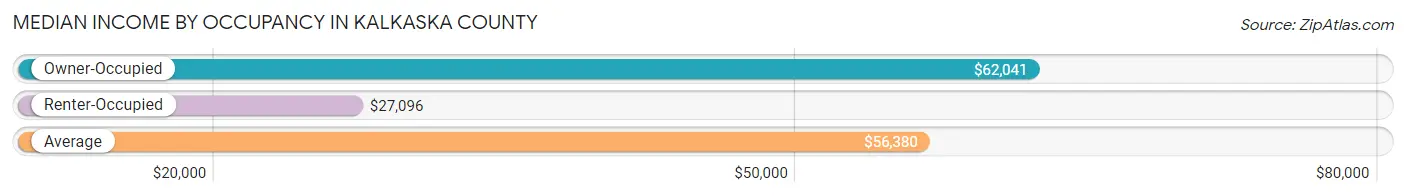
| Occupancy Type | # Households | Median Income |
| Owner-Occupied | 6,362 (86.2%) | $62,041 |
| Renter-Occupied | 1,015 (13.8%) | $27,096 |
| Average | 7,377 (100.0%) | $56,380 |
Occupancy by Householder Income Bracket in Kalkaska County
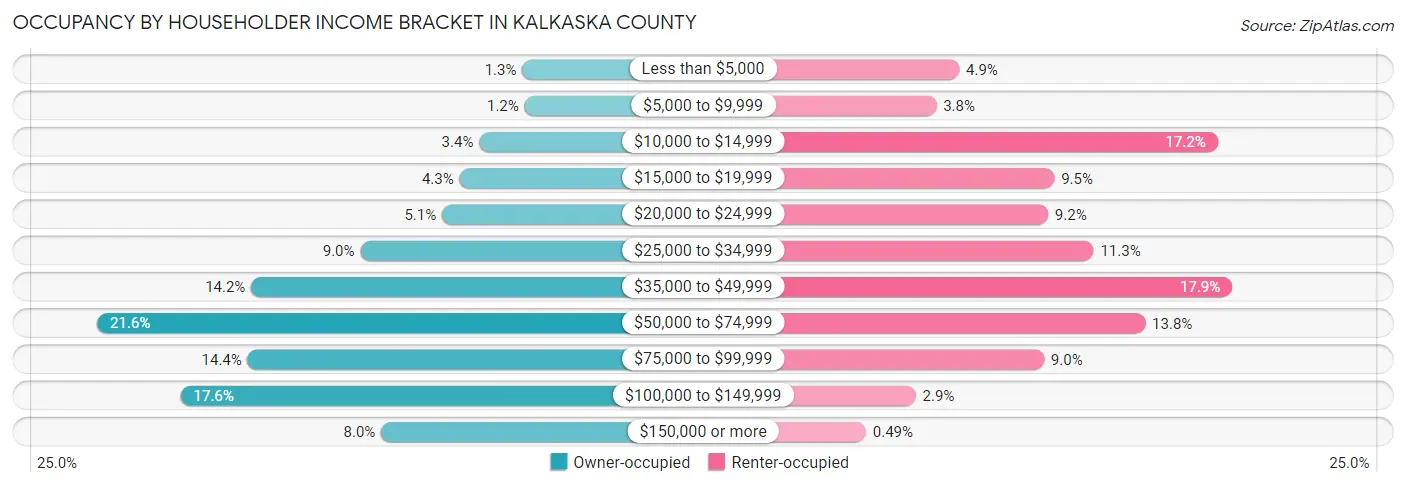
| Income Bracket | Owner-occupied | Renter-occupied |
| Less than $5,000 | 83 (1.3%) | 50 (4.9%) |
| $5,000 to $9,999 | 76 (1.2%) | 39 (3.8%) |
| $10,000 to $14,999 | 213 (3.4%) | 175 (17.2%) |
| $15,000 to $19,999 | 273 (4.3%) | 96 (9.5%) |
| $20,000 to $24,999 | 326 (5.1%) | 93 (9.2%) |
| $25,000 to $34,999 | 573 (9.0%) | 115 (11.3%) |
| $35,000 to $49,999 | 904 (14.2%) | 182 (17.9%) |
| $50,000 to $74,999 | 1,371 (21.5%) | 140 (13.8%) |
| $75,000 to $99,999 | 915 (14.4%) | 91 (9.0%) |
| $100,000 to $149,999 | 1,118 (17.6%) | 29 (2.9%) |
| $150,000 or more | 510 (8.0%) | 5 (0.5%) |
| Total | 6,362 (100.0%) | 1,015 (100.0%) |
Monthly Housing Cost Tiers in Kalkaska County

| Monthly Cost | Owner-occupied | Renter-occupied |
| Less than $300 | 481 (7.6%) | 73 (7.2%) |
| $300 to $499 | 1,168 (18.4%) | 92 (9.1%) |
| $500 to $799 | 1,416 (22.3%) | 299 (29.5%) |
| $800 to $999 | 759 (11.9%) | 166 (16.4%) |
| $1,000 to $1,499 | 1,498 (23.5%) | 237 (23.4%) |
| $1,500 to $1,999 | 684 (10.7%) | 13 (1.3%) |
| $2,000 to $2,499 | 281 (4.4%) | 6 (0.6%) |
| $2,500 to $2,999 | 27 (0.4%) | 0 (0.0%) |
| $3,000 or more | 48 (0.7%) | 13 (1.3%) |
| Total | 6,362 (100.0%) | 1,015 (100.0%) |
Physical Housing Characteristics in Kalkaska County
Housing Structures in Kalkaska County

| Structure Type | # Housing Units | % Housing Units |
| Single Unit, Detached | 5,973 | 81.0% |
| Single Unit, Attached | 28 | 0.4% |
| 2 Unit Apartments | 38 | 0.5% |
| 3 or 4 Unit Apartments | 35 | 0.5% |
| 5 to 9 Unit Apartments | 168 | 2.3% |
| 10 or more Apartments | 161 | 2.2% |
| Mobile Home / Other | 974 | 13.2% |
| Total | 7,377 | 100.0% |
Housing Structures by Occupancy in Kalkaska County
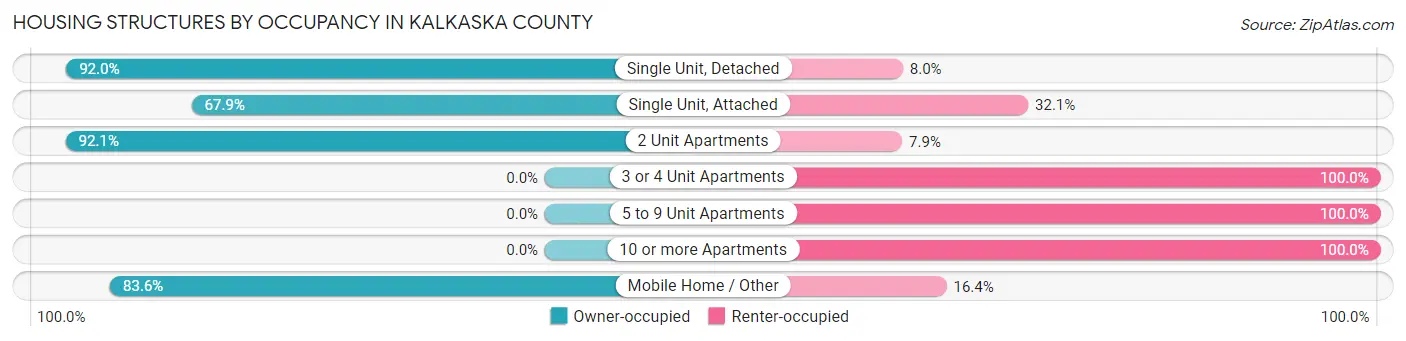
| Structure Type | Owner-occupied | Renter-occupied |
| Single Unit, Detached | 5,494 (92.0%) | 479 (8.0%) |
| Single Unit, Attached | 19 (67.9%) | 9 (32.1%) |
| 2 Unit Apartments | 35 (92.1%) | 3 (7.9%) |
| 3 or 4 Unit Apartments | 0 (0.0%) | 35 (100.0%) |
| 5 to 9 Unit Apartments | 0 (0.0%) | 168 (100.0%) |
| 10 or more Apartments | 0 (0.0%) | 161 (100.0%) |
| Mobile Home / Other | 814 (83.6%) | 160 (16.4%) |
| Total | 6,362 (86.2%) | 1,015 (13.8%) |
Housing Structures by Number of Rooms in Kalkaska County

| Number of Rooms | Owner-occupied | Renter-occupied |
| 1 Room | 23 (0.4%) | 39 (3.8%) |
| 2 or 3 Rooms | 350 (5.5%) | 167 (16.5%) |
| 4 or 5 Rooms | 2,363 (37.1%) | 555 (54.7%) |
| 6 or 7 Rooms | 2,140 (33.6%) | 181 (17.8%) |
| 8 or more Rooms | 1,486 (23.4%) | 73 (7.2%) |
| Total | 6,362 (100.0%) | 1,015 (100.0%) |
Housing Structure by Heating Type in Kalkaska County
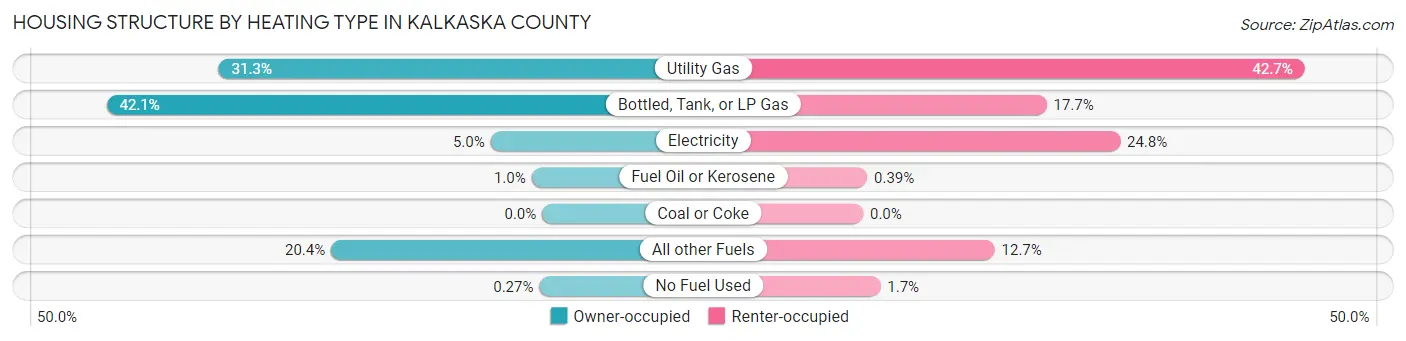
| Heating Type | Owner-occupied | Renter-occupied |
| Utility Gas | 1,988 (31.2%) | 433 (42.7%) |
| Bottled, Tank, or LP Gas | 2,678 (42.1%) | 180 (17.7%) |
| Electricity | 317 (5.0%) | 252 (24.8%) |
| Fuel Oil or Kerosene | 65 (1.0%) | 4 (0.4%) |
| Coal or Coke | 0 (0.0%) | 0 (0.0%) |
| All other Fuels | 1,297 (20.4%) | 129 (12.7%) |
| No Fuel Used | 17 (0.3%) | 17 (1.7%) |
| Total | 6,362 (100.0%) | 1,015 (100.0%) |
Household Vehicle Usage in Kalkaska County
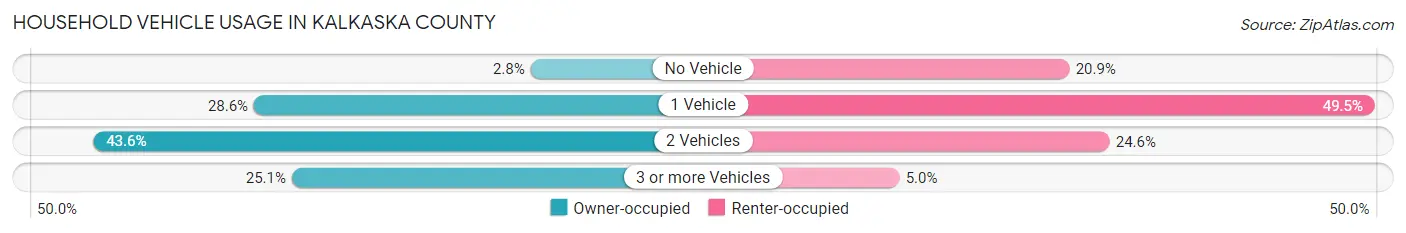
| Vehicles per Household | Owner-occupied | Renter-occupied |
| No Vehicle | 176 (2.8%) | 212 (20.9%) |
| 1 Vehicle | 1,819 (28.6%) | 502 (49.5%) |
| 2 Vehicles | 2,773 (43.6%) | 250 (24.6%) |
| 3 or more Vehicles | 1,594 (25.1%) | 51 (5.0%) |
| Total | 6,362 (100.0%) | 1,015 (100.0%) |
Real Estate & Mortgages in Kalkaska County
Real Estate and Mortgage Overview in Kalkaska County
| Characteristic | Without Mortgage | With Mortgage |
| Housing Units | 2,670 | 3,692 |
| Median Property Value | $131,200 | $162,700 |
| Median Household Income | $51,535 | $362 |
| Monthly Housing Costs | $452 | $45 |
| Real Estate Taxes | $1,415 | $163 |
Property Value by Mortgage Status in Kalkaska County
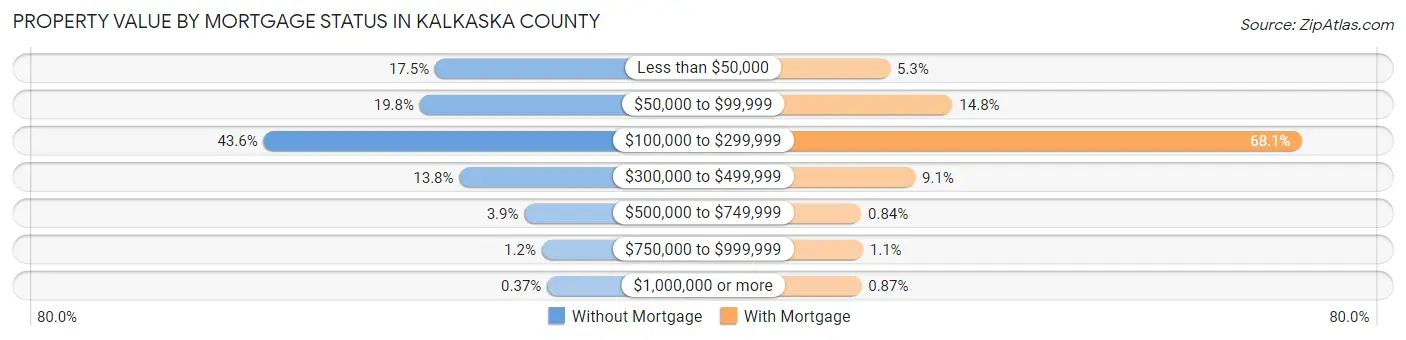
| Property Value | Without Mortgage | With Mortgage |
| Less than $50,000 | 466 (17.4%) | 194 (5.2%) |
| $50,000 to $99,999 | 528 (19.8%) | 545 (14.8%) |
| $100,000 to $299,999 | 1,164 (43.6%) | 2,514 (68.1%) |
| $300,000 to $499,999 | 367 (13.8%) | 335 (9.1%) |
| $500,000 to $749,999 | 103 (3.9%) | 31 (0.8%) |
| $750,000 to $999,999 | 32 (1.2%) | 41 (1.1%) |
| $1,000,000 or more | 10 (0.4%) | 32 (0.9%) |
| Total | 2,670 (100.0%) | 3,692 (100.0%) |
Household Income by Mortgage Status in Kalkaska County
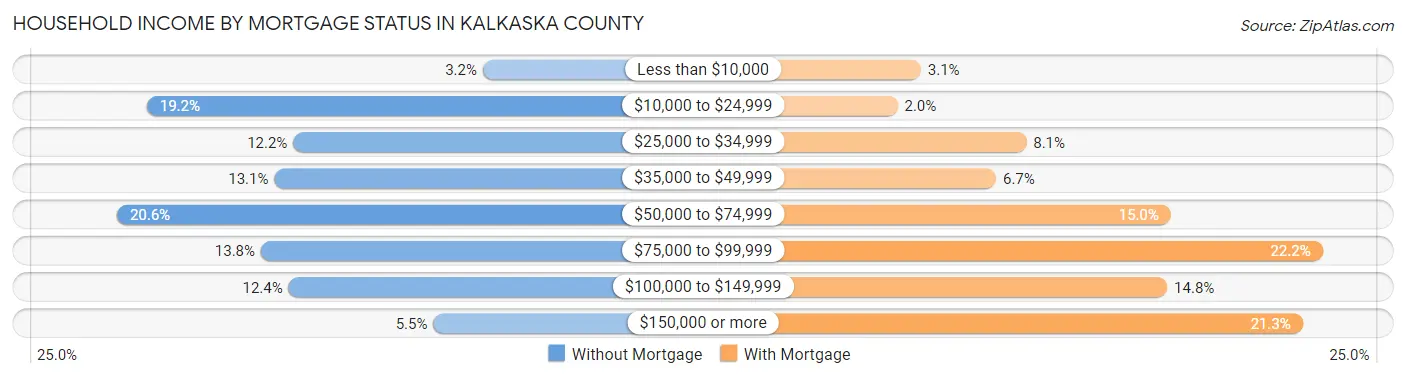
| Household Income | Without Mortgage | With Mortgage |
| Less than $10,000 | 85 (3.2%) | 115 (3.1%) |
| $10,000 to $24,999 | 512 (19.2%) | 74 (2.0%) |
| $25,000 to $34,999 | 326 (12.2%) | 300 (8.1%) |
| $35,000 to $49,999 | 350 (13.1%) | 247 (6.7%) |
| $50,000 to $74,999 | 550 (20.6%) | 554 (15.0%) |
| $75,000 to $99,999 | 367 (13.8%) | 821 (22.2%) |
| $100,000 to $149,999 | 332 (12.4%) | 548 (14.8%) |
| $150,000 or more | 148 (5.5%) | 786 (21.3%) |
| Total | 2,670 (100.0%) | 3,692 (100.0%) |
Property Value to Household Income Ratio in Kalkaska County

| Value-to-Income Ratio | Without Mortgage | With Mortgage |
| Less than 2.0x | 1,048 (39.3%) | 70,048 (1,897.3%) |
| 2.0x to 2.9x | 462 (17.3%) | 1,458 (39.5%) |
| 3.0x to 3.9x | 222 (8.3%) | 1,084 (29.4%) |
| 4.0x or more | 917 (34.3%) | 356 (9.6%) |
| Total | 2,670 (100.0%) | 3,692 (100.0%) |
Real Estate Taxes by Mortgage Status in Kalkaska County
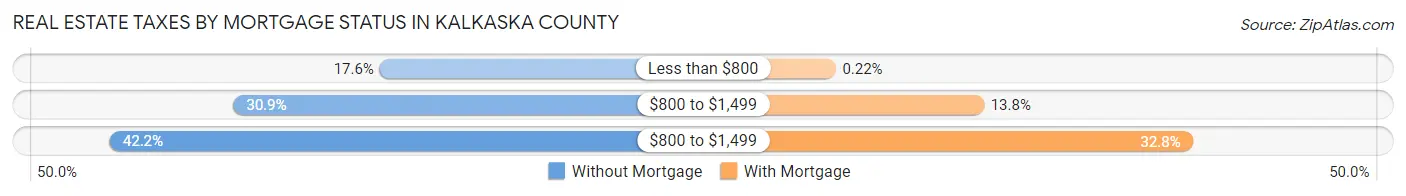
| Property Taxes | Without Mortgage | With Mortgage |
| Less than $800 | 469 (17.6%) | 8 (0.2%) |
| $800 to $1,499 | 826 (30.9%) | 508 (13.8%) |
| $800 to $1,499 | 1,127 (42.2%) | 1,212 (32.8%) |
| Total | 2,670 (100.0%) | 3,692 (100.0%) |
Health & Disability in Kalkaska County
Health Insurance Coverage by Age in Kalkaska County
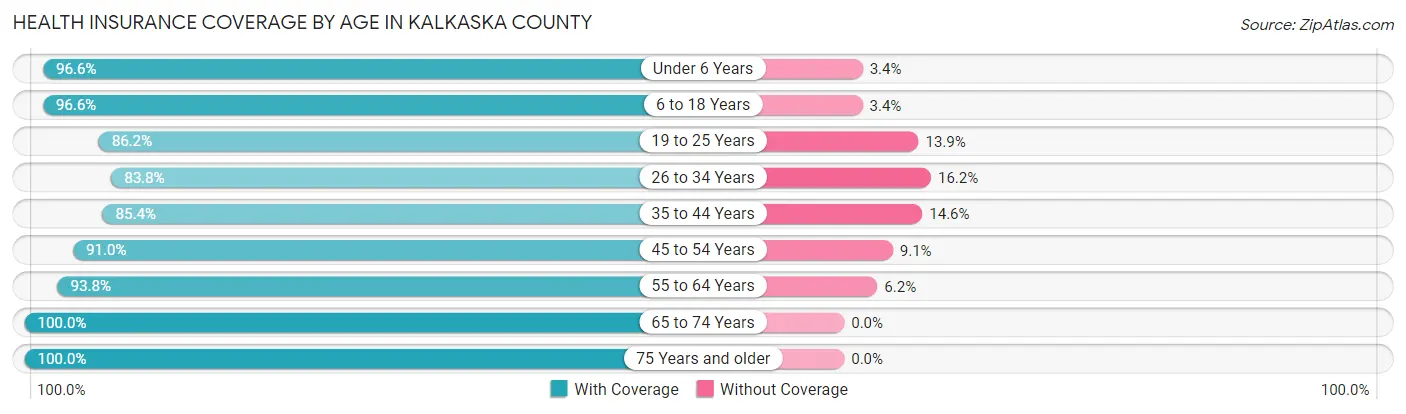
| Age Bracket | With Coverage | Without Coverage |
| Under 6 Years | 1,010 (96.6%) | 36 (3.4%) |
| 6 to 18 Years | 2,709 (96.6%) | 96 (3.4%) |
| 19 to 25 Years | 1,076 (86.2%) | 173 (13.9%) |
| 26 to 34 Years | 1,595 (83.8%) | 308 (16.2%) |
| 35 to 44 Years | 1,842 (85.4%) | 314 (14.6%) |
| 45 to 54 Years | 1,979 (90.9%) | 197 (9.0%) |
| 55 to 64 Years | 2,676 (93.8%) | 176 (6.2%) |
| 65 to 74 Years | 2,324 (100.0%) | 0 (0.0%) |
| 75 Years and older | 1,327 (100.0%) | 0 (0.0%) |
| Total | 16,538 (92.7%) | 1,300 (7.3%) |
Health Insurance Coverage by Citizenship Status in Kalkaska County

| Citizenship Status | With Coverage | Without Coverage |
| Native Born | 1,010 (96.6%) | 36 (3.4%) |
| Foreign Born, Citizen | 2,709 (96.6%) | 96 (3.4%) |
| Foreign Born, not a Citizen | 1,076 (86.2%) | 173 (13.9%) |
Health Insurance Coverage by Household Income in Kalkaska County
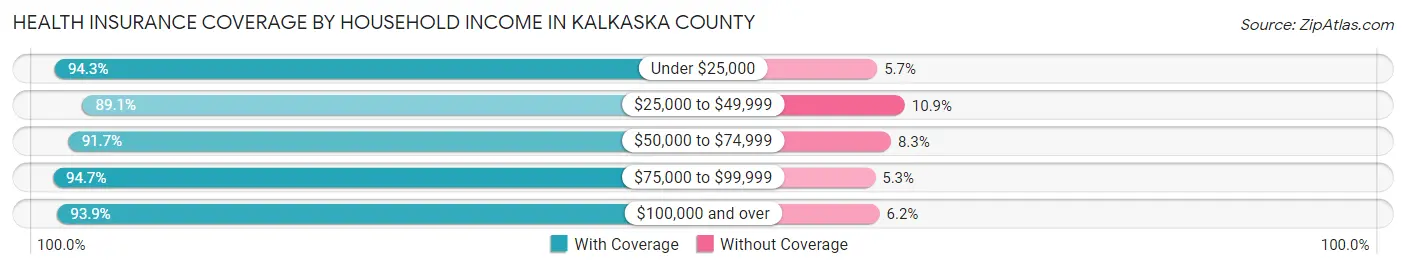
| Household Income | With Coverage | Without Coverage |
| Under $25,000 | 2,351 (94.3%) | 142 (5.7%) |
| $25,000 to $49,999 | 3,015 (89.1%) | 368 (10.9%) |
| $50,000 to $74,999 | 3,560 (91.7%) | 321 (8.3%) |
| $75,000 to $99,999 | 2,679 (94.7%) | 151 (5.3%) |
| $100,000 and over | 4,854 (93.9%) | 318 (6.1%) |
Public vs Private Health Insurance Coverage by Age in Kalkaska County

| Age Bracket | Public Insurance | Private Insurance |
| Under 6 | 581 (55.5%) | 540 (51.6%) |
| 6 to 18 Years | 1,316 (46.9%) | 1,677 (59.8%) |
| 19 to 25 Years | 452 (36.2%) | 693 (55.5%) |
| 25 to 34 Years | 617 (32.4%) | 1,082 (56.9%) |
| 35 to 44 Years | 544 (25.2%) | 1,378 (63.9%) |
| 45 to 54 Years | 669 (30.7%) | 1,449 (66.6%) |
| 55 to 64 Years | 865 (30.3%) | 2,093 (73.4%) |
| 65 to 74 Years | 2,300 (99.0%) | 1,556 (66.9%) |
| 75 Years and over | 1,322 (99.6%) | 1,057 (79.6%) |
| Total | 8,666 (48.6%) | 11,525 (64.6%) |
Disability Status by Sex by Age in Kalkaska County
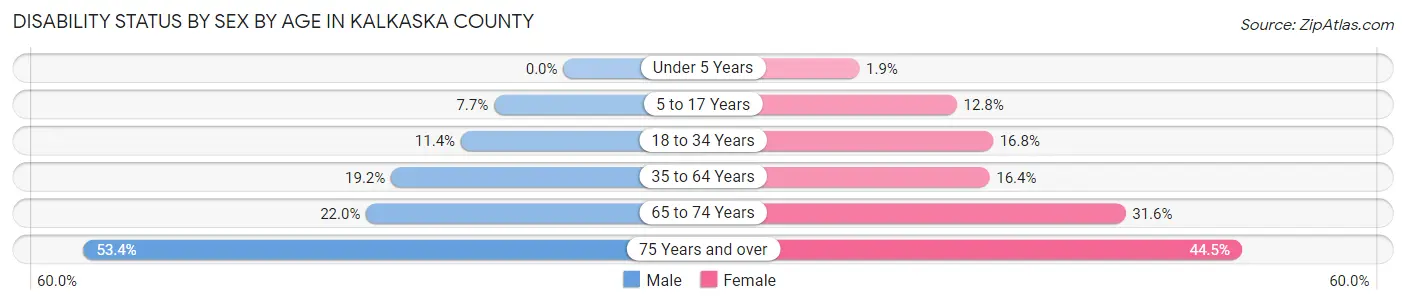
| Age Bracket | Male | Female |
| Under 5 Years | 0 (0.0%) | 9 (1.9%) |
| 5 to 17 Years | 110 (7.7%) | 171 (12.8%) |
| 18 to 34 Years | 192 (11.4%) | 278 (16.8%) |
| 35 to 64 Years | 710 (19.2%) | 572 (16.4%) |
| 65 to 74 Years | 257 (22.0%) | 364 (31.6%) |
| 75 Years and over | 342 (53.4%) | 306 (44.5%) |
Disability Class by Sex by Age in Kalkaska County
Disability Class: Hearing Difficulty

| Age Bracket | Male | Female |
| Under 5 Years | 0 (0.0%) | 9 (1.9%) |
| 5 to 17 Years | 5 (0.4%) | 9 (0.7%) |
| 18 to 34 Years | 0 (0.0%) | 12 (0.7%) |
| 35 to 64 Years | 151 (4.1%) | 58 (1.7%) |
| 65 to 74 Years | 145 (12.4%) | 109 (9.5%) |
| 75 Years and over | 242 (37.8%) | 169 (24.6%) |
Disability Class: Vision Difficulty

| Age Bracket | Male | Female |
| Under 5 Years | 0 (0.0%) | 9 (1.9%) |
| 5 to 17 Years | 0 (0.0%) | 5 (0.4%) |
| 18 to 34 Years | 19 (1.1%) | 21 (1.3%) |
| 35 to 64 Years | 67 (1.8%) | 46 (1.3%) |
| 65 to 74 Years | 10 (0.9%) | 26 (2.2%) |
| 75 Years and over | 39 (6.1%) | 91 (13.3%) |
Disability Class: Cognitive Difficulty

| Age Bracket | Male | Female |
| 5 to 17 Years | 110 (7.7%) | 137 (10.2%) |
| 18 to 34 Years | 55 (3.3%) | 230 (13.9%) |
| 35 to 64 Years | 295 (8.0%) | 243 (7.0%) |
| 65 to 74 Years | 50 (4.3%) | 66 (5.7%) |
| 75 Years and over | 67 (10.5%) | 79 (11.5%) |
Disability Class: Ambulatory Difficulty
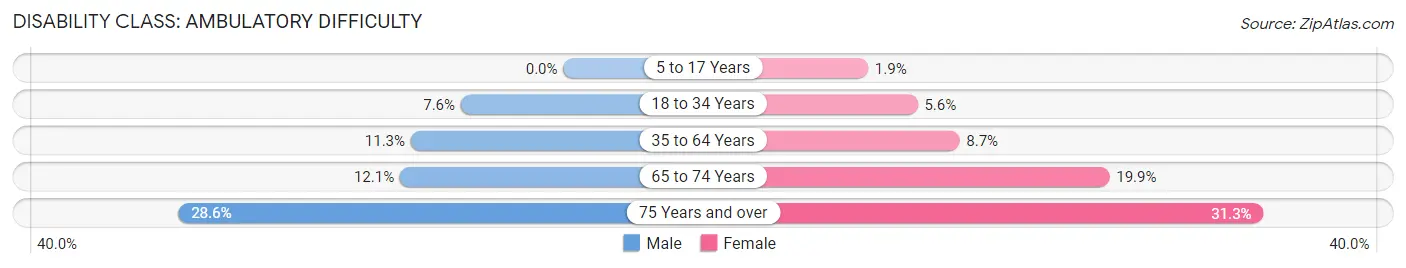
| Age Bracket | Male | Female |
| 5 to 17 Years | 0 (0.0%) | 26 (1.9%) |
| 18 to 34 Years | 128 (7.6%) | 93 (5.6%) |
| 35 to 64 Years | 419 (11.3%) | 304 (8.7%) |
| 65 to 74 Years | 142 (12.1%) | 229 (19.9%) |
| 75 Years and over | 183 (28.6%) | 215 (31.3%) |
Disability Class: Self-Care Difficulty

| Age Bracket | Male | Female |
| 5 to 17 Years | 5 (0.4%) | 11 (0.8%) |
| 18 to 34 Years | 25 (1.5%) | 43 (2.6%) |
| 35 to 64 Years | 138 (3.7%) | 102 (2.9%) |
| 65 to 74 Years | 39 (3.3%) | 92 (8.0%) |
| 75 Years and over | 88 (13.8%) | 103 (15.0%) |
Technology Access in Kalkaska County
Computing Device Access in Kalkaska County
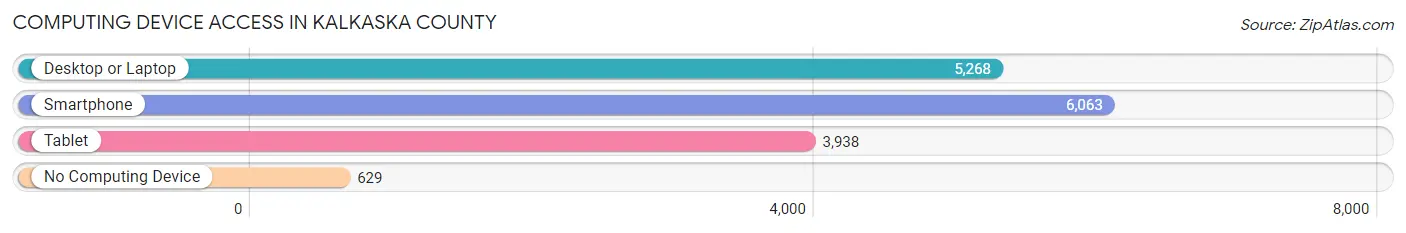
| Device Type | # Households | % Households |
| Desktop or Laptop | 5,268 | 71.4% |
| Smartphone | 6,063 | 82.2% |
| Tablet | 3,938 | 53.4% |
| No Computing Device | 629 | 8.5% |
| Total | 7,377 | 100.0% |
Internet Access in Kalkaska County
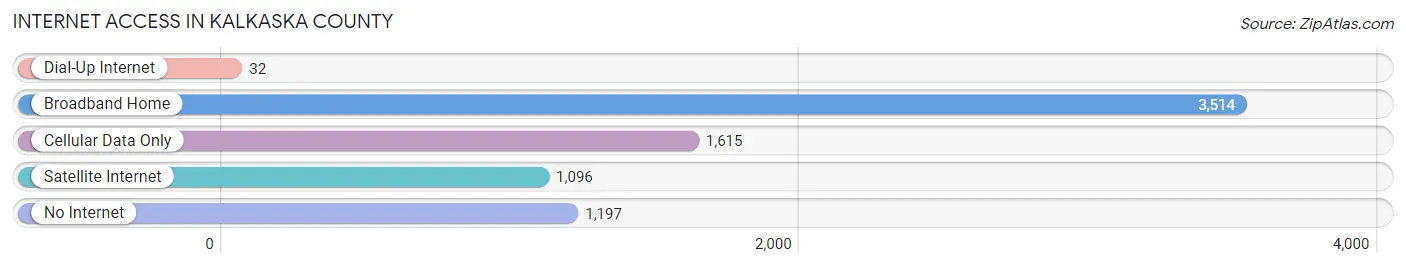
| Internet Type | # Households | % Households |
| Dial-Up Internet | 32 | 0.4% |
| Broadband Home | 3,514 | 47.6% |
| Cellular Data Only | 1,615 | 21.9% |
| Satellite Internet | 1,096 | 14.9% |
| No Internet | 1,197 | 16.2% |
| Total | 7,377 | 100.0% |
Kalkaska County Summary
Kalkaska County is located in the northwestern part of Michigan’s Lower Peninsula. It is bordered by Grand Traverse County to the north, Antrim County to the east, Missaukee County to the south, and Wexford County to the west. The county seat is Kalkaska, and the county has a total area of 576 square miles.
History
Kalkaska County was established in 1840 and was named after the Kalkaska River, which was derived from the Ojibwe word “galkaski,” meaning “flat or level land.” The county was originally part of Mackinac County, but was split off in 1840. The first settlers in the area were mostly lumberjacks and farmers. The county was largely rural until the 1950s, when the population began to grow rapidly due to the development of the area’s natural resources.
Geography
Kalkaska County is located in the northwestern part of Michigan’s Lower Peninsula. It is bordered by Grand Traverse County to the north, Antrim County to the east, Missaukee County to the south, and Wexford County to the west. The county seat is Kalkaska, and the county has a total area of 576 square miles. The terrain is mostly rolling hills and lowlands, with some higher elevations in the northern part of the county. The county is home to several lakes, including Lake Skegemog, Lake Bellaire, and Lake Dubonnet.
Economy
Kalkaska County’s economy is largely based on agriculture and tourism. The county is home to several wineries, breweries, and distilleries, as well as several farms and orchards. The county is also home to several manufacturing companies, including a paper mill, a furniture factory, and a plastics factory. The county is also home to several state parks and recreation areas, which attract visitors from all over the state.
Demographics
As of the 2010 census, Kalkaska County had a population of 17,153. The population was spread out, with 48.3% male and 51.7% female. The median age was 43.7 years. The racial makeup of the county was 94.2% White, 0.7% African American, 0.7% Native American, 0.4% Asian, 0.1% Pacific Islander, 2.2% from other races, and 1.7% from two or more races. Hispanic or Latino of any race were 4.2% of the population.
Kalkaska County is a largely rural area, with a median household income of $41,845. The per capita income was $20,945. About 11.2% of the population was below the poverty line. The unemployment rate was 8.2%.
Kalkaska County is a largely rural area, with a population that is largely white and of European descent. The county is home to several farms and orchards, as well as several manufacturing companies. The county is also home to several state parks and recreation areas, which attract visitors from all over the state. The county has a median household income of $41,845 and a per capita income of $20,945. The unemployment rate is 8.2%.
Common Questions
What is the Total Population of Kalkaska County?
Total Population of Kalkaska County is 17,934.
What is the Total Male Population of Kalkaska County?
Total Male Population of Kalkaska County is 9,122.
What is the Total Female Population of Kalkaska County?
Total Female Population of Kalkaska County is 8,812.
What is the Ratio of Males per 100 Females in Kalkaska County?
There are 103.52 Males per 100 Females in Kalkaska County.
What is the Ratio of Females per 100 Males in Kalkaska County?
There are 96.60 Females per 100 Males in Kalkaska County.
What is the Median Population Age in Kalkaska County?
Median Population Age in Kalkaska County is 43.3 Years.
What is the Average Family Size in Kalkaska County
Average Family Size in Kalkaska County is 3.0 People.
What is the Average Household Size in Kalkaska County
Average Household Size in Kalkaska County is 2.4 People.
What is Per Capita Income in Kalkaska County?
Per Capita income in Kalkaska County is $31,074.
What is the Median Family Income in Kalkaska County?
Median Family Income in Kalkaska County is $70,691.
What is the Median Household income in Kalkaska County?
Median Household Income in Kalkaska County is $56,380.
What is Income or Wage Gap in Kalkaska County?
Income or Wage Gap in Kalkaska County is 35.9%.
Women in Kalkaska County earn 64.1 cents for every dollar earned by a man.
What is Family Income Deficit in Kalkaska County?
Family Income Deficit in Kalkaska County is $8,887.
Families that are below poverty line in Kalkaska County earn $8,887 less on average than the poverty threshold level.
What is Inequality or Gini Index in Kalkaska County?
Inequality or Gini Index in Kalkaska County is 0.43.
How Large is the Labor Force in Kalkaska County?
There are 7,982 People in the Labor Forcein in Kalkaska County.
What is the Percentage of People in the Labor Force in Kalkaska County?
54.4% of People are in the Labor Force in Kalkaska County.
What is the Unemployment Rate in Kalkaska County?
Unemployment Rate in Kalkaska County is 4.6%.