Jackson County, MI
Jackson County Map
Jackson County Overview
160,637
TOTAL POPULATION
82,776
MALE POPULATION
77,861
FEMALE POPULATION
106.31
MALES / 100 FEMALES
94.06
FEMALES / 100 MALES
41.1
MEDIAN AGE
3.1
AVG FAMILY SIZE
2.4
AVG HOUSEHOLD SIZE
$33,065
PER CAPITA INCOME
$79,374
AVG FAMILY INCOME
$62,581
AVG HOUSEHOLD INCOME
29.1%
WAGE / INCOME GAP [ % ]
70.9¢/ $1
WAGE / INCOME GAP [ $ ]
$10,005
FAMILY INCOME DEFICIT
0.45
INEQUALITY / GINI INDEX
74,116
LABOR FORCE [ PEOPLE ]
56.7%
PERCENT IN LABOR FORCE
6.3%
UNEMPLOYMENT RATE
Jackson County Area Codes
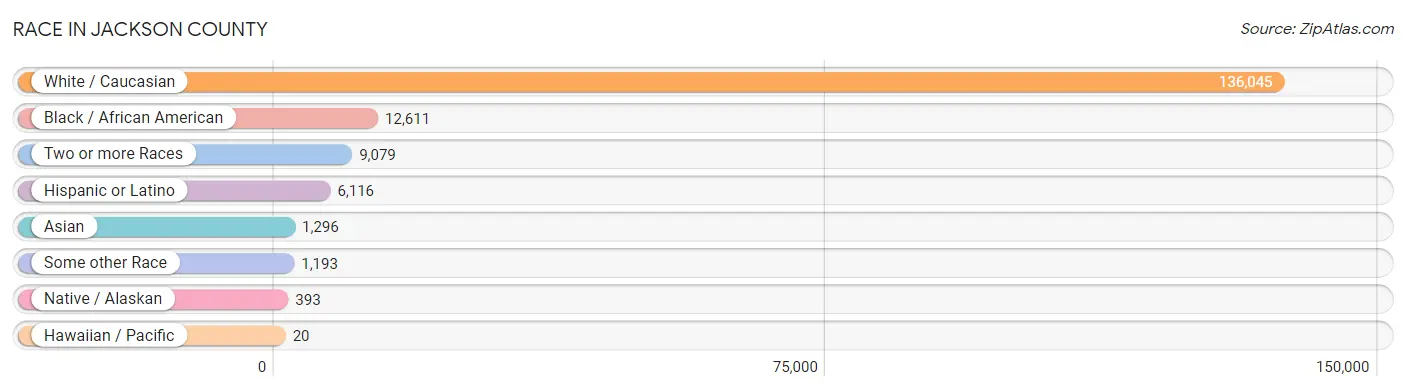
Race in Jackson County
The most populous races in Jackson County are White / Caucasian (136,045 | 84.7%), Black / African American (12,611 | 7.9%), and Two or more Races (9,079 | 5.7%).
| Race | # Population | % Population |
| Asian | 1,296 | 0.8% |
| Black / African American | 12,611 | 7.9% |
| Hawaiian / Pacific | 20 | 0.0% |
| Hispanic or Latino | 6,116 | 3.8% |
| Native / Alaskan | 393 | 0.2% |
| White / Caucasian | 136,045 | 84.7% |
| Two or more Races | 9,079 | 5.7% |
| Some other Race | 1,193 | 0.7% |
| Total | 160,637 | 100.0% |
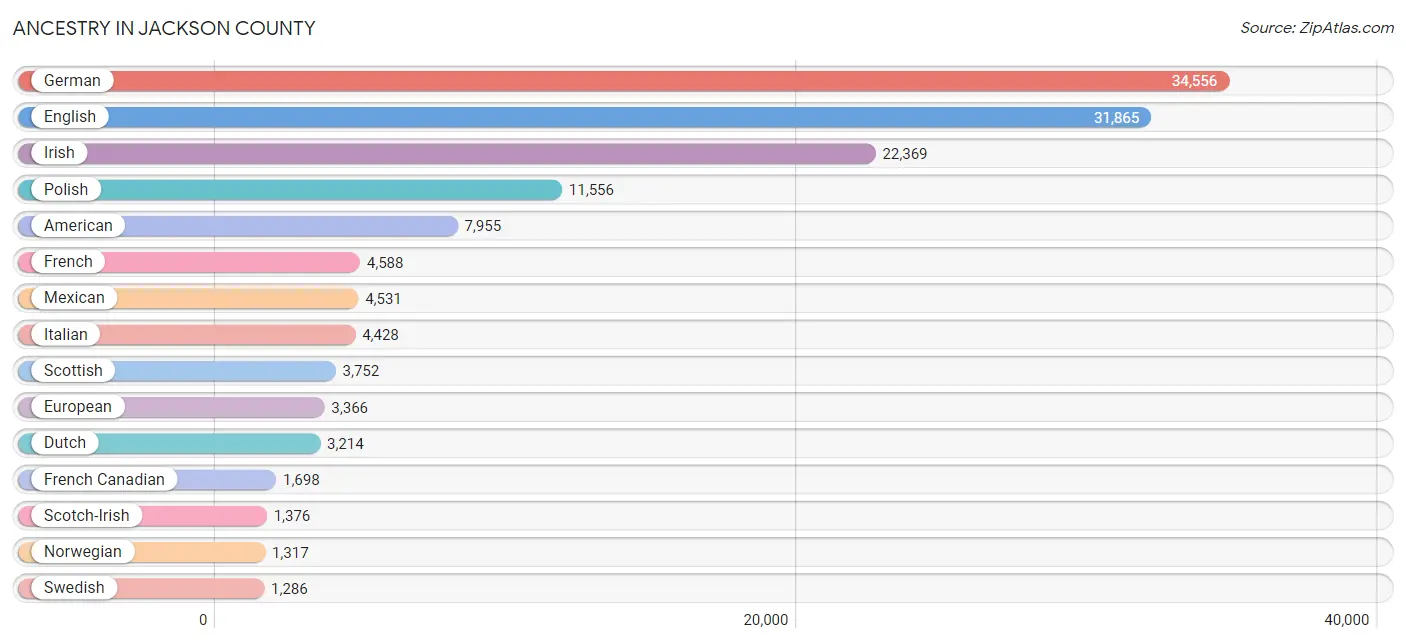
Ancestry in Jackson County
The most populous ancestries reported in Jackson County are German (34,556 | 21.5%), English (31,865 | 19.8%), Irish (22,369 | 13.9%), Polish (11,556 | 7.2%), and American (7,955 | 5.0%), together accounting for 67.4% of all Jackson County residents.
| Ancestry | # Population | % Population |
| African | 366 | 0.2% |
| Albanian | 245 | 0.2% |
| Aleut | 1 | 0.0% |
| American | 7,955 | 5.0% |
| Apache | 31 | 0.0% |
| Arab | 358 | 0.2% |
| Armenian | 130 | 0.1% |
| Assyrian / Chaldean / Syriac | 30 | 0.0% |
| Australian | 26 | 0.0% |
| Austrian | 128 | 0.1% |
| Bahamian | 10 | 0.0% |
| Bangladeshi | 24 | 0.0% |
| Basque | 4 | 0.0% |
| Belgian | 255 | 0.2% |
| Belizean | 6 | 0.0% |
| Bhutanese | 318 | 0.2% |
| Blackfeet | 196 | 0.1% |
| Bolivian | 18 | 0.0% |
| Brazilian | 10 | 0.0% |
| British | 631 | 0.4% |
| British West Indian | 23 | 0.0% |
| Bulgarian | 31 | 0.0% |
| Burmese | 459 | 0.3% |
| Cajun | 13 | 0.0% |
| Canadian | 1,096 | 0.7% |
| Celtic | 38 | 0.0% |
| Central American | 135 | 0.1% |
| Central American Indian | 27 | 0.0% |
| Cherokee | 405 | 0.3% |
| Chickasaw | 39 | 0.0% |
| Chilean | 21 | 0.0% |
| Chippewa | 237 | 0.2% |
| Choctaw | 7 | 0.0% |
| Colombian | 248 | 0.2% |
| Croatian | 131 | 0.1% |
| Cuban | 296 | 0.2% |
| Czech | 241 | 0.2% |
| Czechoslovakian | 160 | 0.1% |
| Danish | 227 | 0.1% |
| Dutch | 3,214 | 2.0% |
| Eastern European | 278 | 0.2% |
| English | 31,865 | 19.8% |
| Ethiopian | 138 | 0.1% |
| European | 3,366 | 2.1% |
| Filipino | 31 | 0.0% |
| Finnish | 752 | 0.5% |
| French | 4,588 | 2.9% |
| French American Indian | 17 | 0.0% |
| French Canadian | 1,698 | 1.1% |
| German | 34,556 | 21.5% |
| German Russian | 30 | 0.0% |
| Ghanaian | 4 | 0.0% |
| Greek | 440 | 0.3% |
| Guatemalan | 72 | 0.0% |
| Haitian | 10 | 0.0% |
| Honduran | 37 | 0.0% |
| Hungarian | 968 | 0.6% |
| Icelander | 13 | 0.0% |
| Indian (Asian) | 170 | 0.1% |
| Iraqi | 72 | 0.0% |
| Irish | 22,369 | 13.9% |
| Iroquois | 31 | 0.0% |
| Italian | 4,428 | 2.8% |
| Jamaican | 57 | 0.0% |
| Japanese | 1 | 0.0% |
| Jordanian | 9 | 0.0% |
| Korean | 339 | 0.2% |
| Lebanese | 105 | 0.1% |
| Lithuanian | 367 | 0.2% |
| Luxembourger | 7 | 0.0% |
| Macedonian | 25 | 0.0% |
| Maltese | 92 | 0.1% |
| Mexican | 4,531 | 2.8% |
| Mexican American Indian | 33 | 0.0% |
| Moroccan | 41 | 0.0% |
| Native Hawaiian | 70 | 0.0% |
| Navajo | 4 | 0.0% |
| Nicaraguan | 17 | 0.0% |
| Nigerian | 54 | 0.0% |
| Northern European | 306 | 0.2% |
| Norwegian | 1,317 | 0.8% |
| Ottawa | 64 | 0.0% |
| Pakistani | 2 | 0.0% |
| Palestinian | 10 | 0.0% |
| Panamanian | 9 | 0.0% |
| Pennsylvania German | 83 | 0.1% |
| Peruvian | 50 | 0.0% |
| Polish | 11,556 | 7.2% |
| Portuguese | 97 | 0.1% |
| Potawatomi | 6 | 0.0% |
| Puerto Rican | 557 | 0.4% |
| Romanian | 375 | 0.2% |
| Russian | 381 | 0.2% |
| Samoan | 28 | 0.0% |
| Scandinavian | 557 | 0.4% |
| Scotch-Irish | 1,376 | 0.9% |
| Scottish | 3,752 | 2.3% |
| Seminole | 1 | 0.0% |
| Serbian | 49 | 0.0% |
| Sioux | 65 | 0.0% |
| Slavic | 70 | 0.0% |
| Slovak | 163 | 0.1% |
| Slovene | 2 | 0.0% |
| South African | 1 | 0.0% |
| South American | 377 | 0.2% |
| Spaniard | 29 | 0.0% |
| Spanish | 96 | 0.1% |
| Sri Lankan | 32 | 0.0% |
| Subsaharan African | 600 | 0.4% |
| Sudanese | 37 | 0.0% |
| Swedish | 1,286 | 0.8% |
| Swiss | 313 | 0.2% |
| Thai | 513 | 0.3% |
| Trinidadian and Tobagonian | 29 | 0.0% |
| Ukrainian | 283 | 0.2% |
| Venezuelan | 40 | 0.0% |
| Welsh | 656 | 0.4% |
| West Indian | 26 | 0.0% |
| Yaqui | 22 | 0.0% |
| Yugoslavian | 16 | 0.0% | View All 120 Rows |
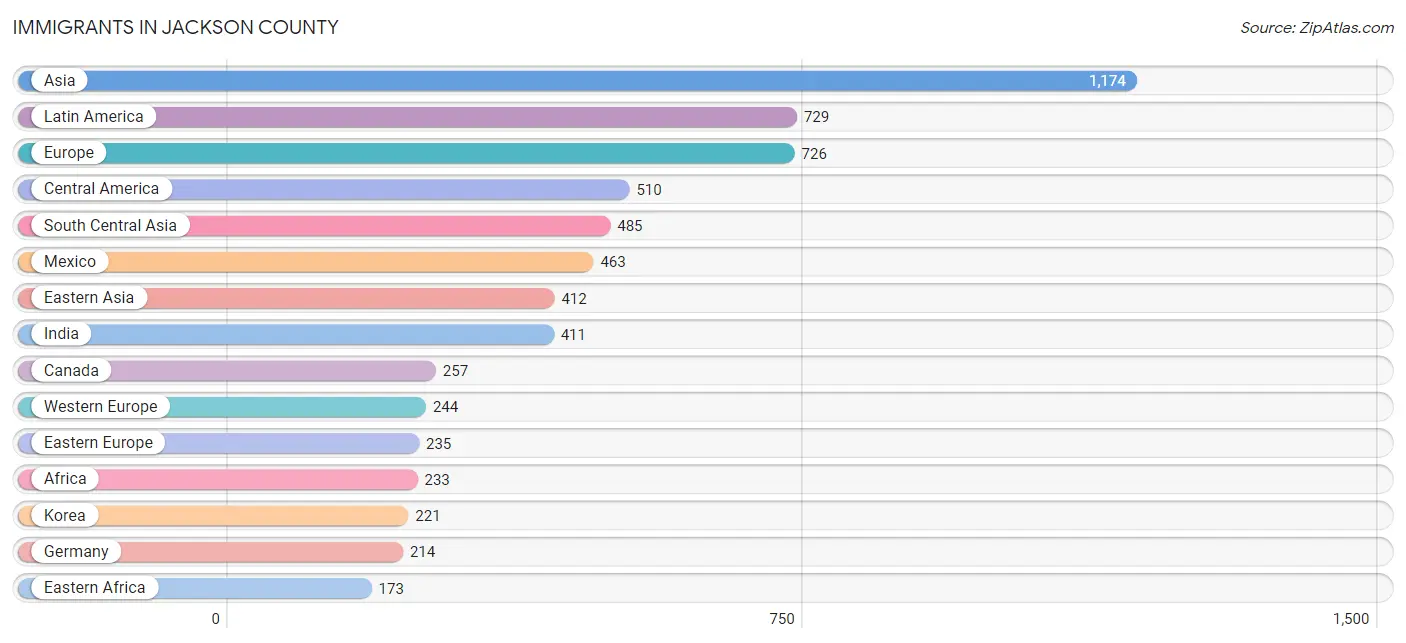
Immigrants in Jackson County
The most numerous immigrant groups reported in Jackson County came from Asia (1,174 | 0.7%), Latin America (729 | 0.4%), Europe (726 | 0.4%), Central America (510 | 0.3%), and South Central Asia (485 | 0.3%), together accounting for 2.2% of all Jackson County residents.
| Immigration Origin | # Population | % Population |
| Africa | 233 | 0.2% |
| Albania | 30 | 0.0% |
| Asia | 1,174 | 0.7% |
| Australia | 13 | 0.0% |
| Cambodia | 1 | 0.0% |
| Canada | 257 | 0.2% |
| Caribbean | 108 | 0.1% |
| Central America | 510 | 0.3% |
| Chile | 11 | 0.0% |
| China | 111 | 0.1% |
| Colombia | 49 | 0.0% |
| Cuba | 46 | 0.0% |
| Czechoslovakia | 9 | 0.0% |
| Eastern Africa | 173 | 0.1% |
| Eastern Asia | 412 | 0.3% |
| Eastern Europe | 235 | 0.2% |
| England | 36 | 0.0% |
| Ethiopia | 138 | 0.1% |
| Europe | 726 | 0.4% |
| Fiji | 7 | 0.0% |
| France | 1 | 0.0% |
| Germany | 214 | 0.1% |
| Guatemala | 14 | 0.0% |
| Honduras | 15 | 0.0% |
| India | 411 | 0.3% |
| Iraq | 56 | 0.0% |
| Ireland | 6 | 0.0% |
| Italy | 70 | 0.0% |
| Jamaica | 62 | 0.0% |
| Japan | 76 | 0.1% |
| Kazakhstan | 30 | 0.0% |
| Korea | 221 | 0.1% |
| Laos | 5 | 0.0% |
| Latin America | 729 | 0.4% |
| Mexico | 463 | 0.3% |
| Moldova | 12 | 0.0% |
| Netherlands | 29 | 0.0% |
| Nigeria | 56 | 0.0% |
| Northern Europe | 118 | 0.1% |
| Oceania | 43 | 0.0% |
| Pakistan | 44 | 0.0% |
| Panama | 18 | 0.0% |
| Peru | 11 | 0.0% |
| Philippines | 145 | 0.1% |
| Poland | 8 | 0.0% |
| Romania | 64 | 0.0% |
| Russia | 15 | 0.0% |
| Scotland | 17 | 0.0% |
| South Africa | 1 | 0.0% |
| South America | 111 | 0.1% |
| South Central Asia | 485 | 0.3% |
| South Eastern Asia | 164 | 0.1% |
| Southern Europe | 105 | 0.1% |
| Sweden | 2 | 0.0% |
| Taiwan | 12 | 0.0% |
| Thailand | 2 | 0.0% |
| Venezuela | 40 | 0.0% |
| Vietnam | 11 | 0.0% |
| Western Africa | 59 | 0.0% |
| Western Asia | 69 | 0.0% |
| Western Europe | 244 | 0.2% |
| Yemen | 13 | 0.0% | View All 62 Rows |
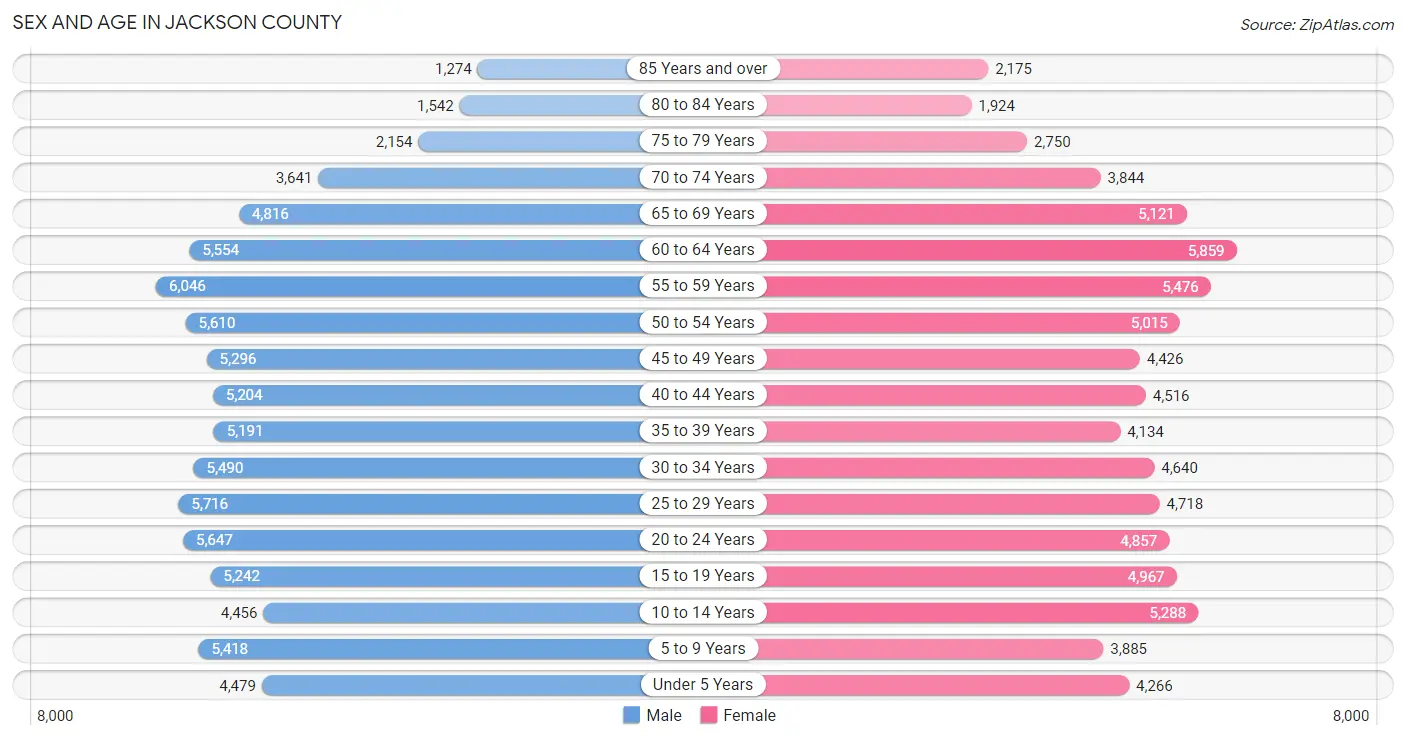
Sex and Age in Jackson County
Sex and Age in Jackson County
The most populous age groups in Jackson County are 55 to 59 Years (6,046 | 7.3%) for men and 60 to 64 Years (5,859 | 7.5%) for women.
| Age Bracket | Male | Female |
| Under 5 Years | 4,479 (5.4%) | 4,266 (5.5%) |
| 5 to 9 Years | 5,418 (6.6%) | 3,885 (5.0%) |
| 10 to 14 Years | 4,456 (5.4%) | 5,288 (6.8%) |
| 15 to 19 Years | 5,242 (6.3%) | 4,967 (6.4%) |
| 20 to 24 Years | 5,647 (6.8%) | 4,857 (6.2%) |
| 25 to 29 Years | 5,716 (6.9%) | 4,718 (6.1%) |
| 30 to 34 Years | 5,490 (6.6%) | 4,640 (6.0%) |
| 35 to 39 Years | 5,191 (6.3%) | 4,134 (5.3%) |
| 40 to 44 Years | 5,204 (6.3%) | 4,516 (5.8%) |
| 45 to 49 Years | 5,296 (6.4%) | 4,426 (5.7%) |
| 50 to 54 Years | 5,610 (6.8%) | 5,015 (6.4%) |
| 55 to 59 Years | 6,046 (7.3%) | 5,476 (7.0%) |
| 60 to 64 Years | 5,554 (6.7%) | 5,859 (7.5%) |
| 65 to 69 Years | 4,816 (5.8%) | 5,121 (6.6%) |
| 70 to 74 Years | 3,641 (4.4%) | 3,844 (4.9%) |
| 75 to 79 Years | 2,154 (2.6%) | 2,750 (3.5%) |
| 80 to 84 Years | 1,542 (1.9%) | 1,924 (2.5%) |
| 85 Years and over | 1,274 (1.5%) | 2,175 (2.8%) |
| Total | 82,776 (100.0%) | 77,861 (100.0%) |
Families and Households in Jackson County
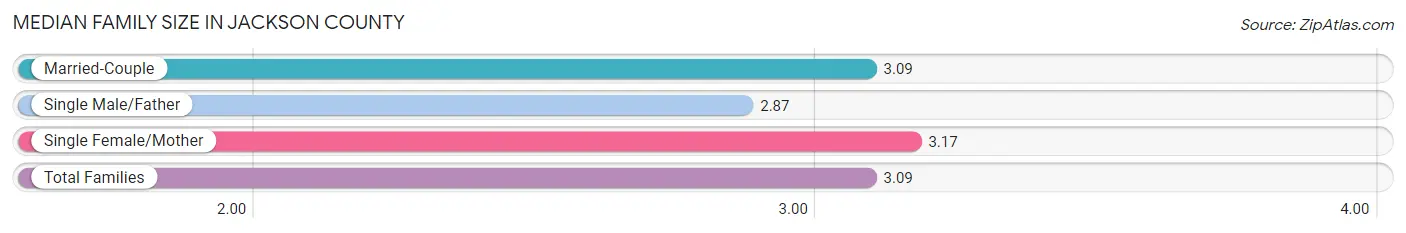
Median Family Size in Jackson County
The median family size in Jackson County is 3.09 persons per family, with single female/mother families (7,067 | 18.1%) accounting for the largest median family size of 3.17 persons per family. On the other hand, single male/father families (3,378 | 8.7%) represent the smallest median family size with 2.87 persons per family.
| Family Type | # Families | Family Size |
| Married-Couple | 28,533 (73.2%) | 3.09 |
| Single Male/Father | 3,378 (8.7%) | 2.87 |
| Single Female/Mother | 7,067 (18.1%) | 3.17 |
| Total Families | 38,978 (100.0%) | 3.09 |
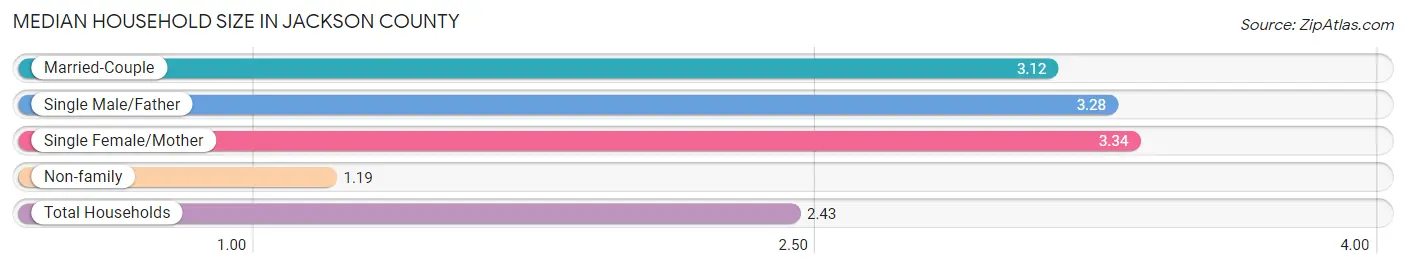
Median Household Size in Jackson County
The median household size in Jackson County is 2.43 persons per household, with single female/mother households (7,067 | 11.4%) accounting for the largest median household size of 3.34 persons per household. non-family households (23,081 | 37.2%) represent the smallest median household size with 1.19 persons per household.
| Household Type | # Households | Household Size |
| Married-Couple | 28,533 (46.0%) | 3.12 |
| Single Male/Father | 3,378 (5.4%) | 3.28 |
| Single Female/Mother | 7,067 (11.4%) | 3.34 |
| Non-family | 23,081 (37.2%) | 1.19 |
| Total Households | 62,059 (100.0%) | 2.43 |
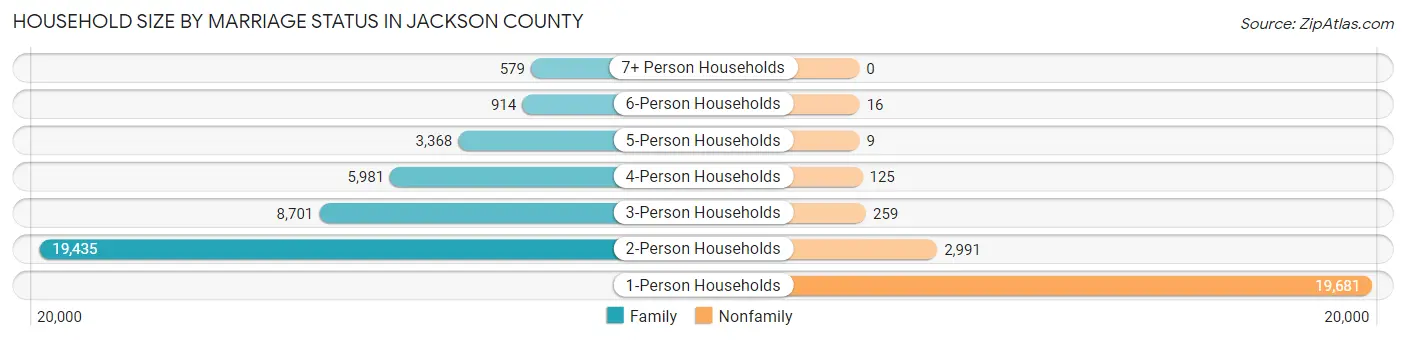
Household Size by Marriage Status in Jackson County
Out of a total of 62,059 households in Jackson County, 38,978 (62.8%) are family households, while 23,081 (37.2%) are nonfamily households. The most numerous type of family households are 2-person households, comprising 19,435, and the most common type of nonfamily households are 1-person households, comprising 19,681.
| Household Size | Family Households | Nonfamily Households |
| 1-Person Households | - | 19,681 (31.7%) |
| 2-Person Households | 19,435 (31.3%) | 2,991 (4.8%) |
| 3-Person Households | 8,701 (14.0%) | 259 (0.4%) |
| 4-Person Households | 5,981 (9.6%) | 125 (0.2%) |
| 5-Person Households | 3,368 (5.4%) | 9 (0.0%) |
| 6-Person Households | 914 (1.5%) | 16 (0.0%) |
| 7+ Person Households | 579 (0.9%) | 0 (0.0%) |
| Total | 38,978 (62.8%) | 23,081 (37.2%) |
Female Fertility in Jackson County
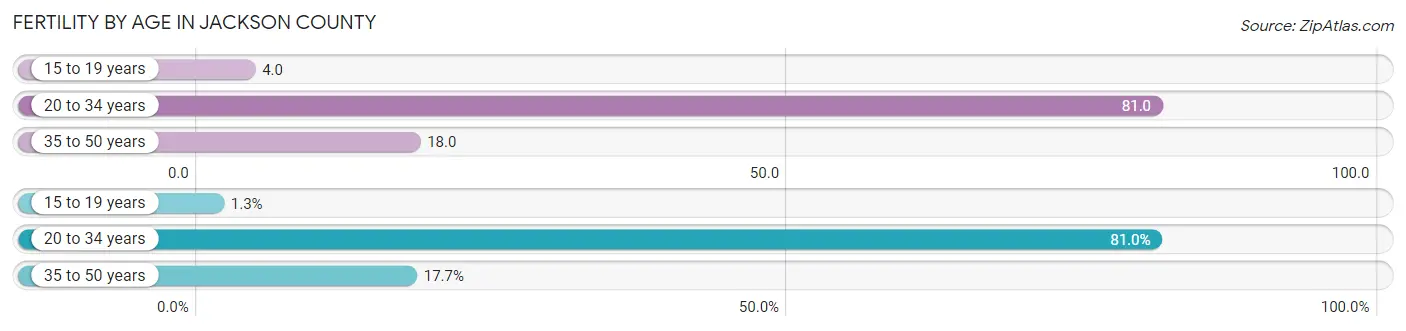
Fertility by Age in Jackson County
Average fertility rate in Jackson County is 43.0 births per 1,000 women. Women in the age bracket of 20 to 34 years have the highest fertility rate with 81.0 births per 1,000 women. Women in the age bracket of 20 to 34 years acount for 80.9% of all women with births.
| Age Bracket | Women with Births | Births / 1,000 Women |
| 15 to 19 years | 19 (1.3%) | 4.0 |
| 20 to 34 years | 1,147 (80.9%) | 81.0 |
| 35 to 50 years | 251 (17.7%) | 18.0 |
| Total | 1,417 (100.0%) | 43.0 |
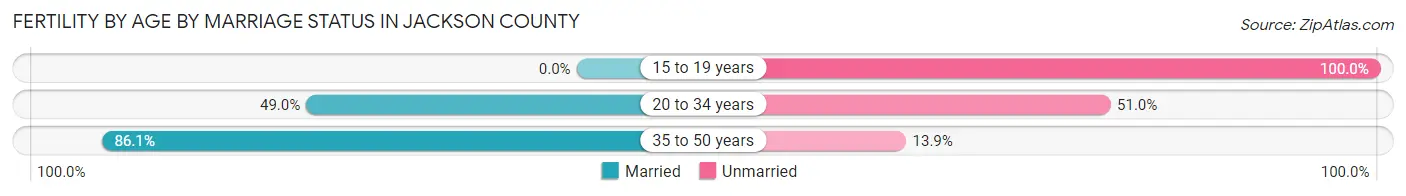
Fertility by Age by Marriage Status in Jackson County
54.9% of women with births (1,417) in Jackson County are married. The highest percentage of unmarried women with births falls into 15 to 19 years age bracket with 100.0% of them unmarried at the time of birth, while the lowest percentage of unmarried women with births belong to 35 to 50 years age bracket with 13.9% of them unmarried.
| Age Bracket | Married | Unmarried |
| 15 to 19 years | 0 (0.0%) | 19 (100.0%) |
| 20 to 34 years | 562 (49.0%) | 585 (51.0%) |
| 35 to 50 years | 216 (86.1%) | 35 (13.9%) |
| Total | 778 (54.9%) | 639 (45.1%) |
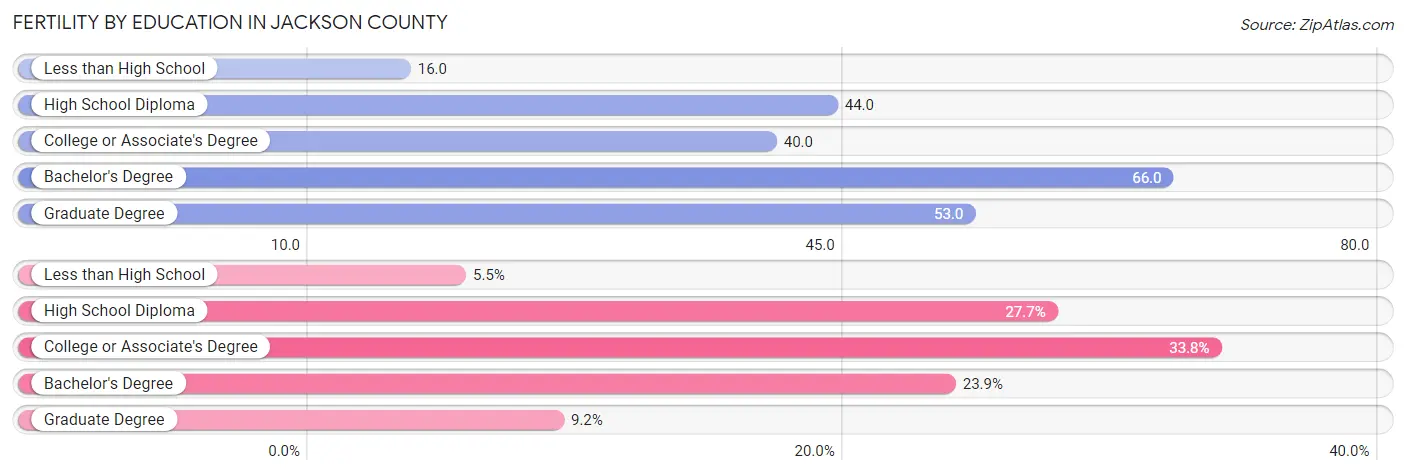
Fertility by Education in Jackson County
Average fertility rate in Jackson County is 43.0 births per 1,000 women. Women with the education attainment of bachelor's degree have the highest fertility rate of 66.0 births per 1,000 women, while women with the education attainment of less than high school have the lowest fertility at 16.0 births per 1,000 women. Women with the education attainment of college or associate's degree represent 33.8% of all women with births.
| Educational Attainment | Women with Births | Births / 1,000 Women |
| Less than High School | 78 (5.5%) | 16.0 |
| High School Diploma | 392 (27.7%) | 44.0 |
| College or Associate's Degree | 479 (33.8%) | 40.0 |
| Bachelor's Degree | 338 (23.8%) | 66.0 |
| Graduate Degree | 130 (9.2%) | 53.0 |
| Total | 1,417 (100.0%) | 43.0 |
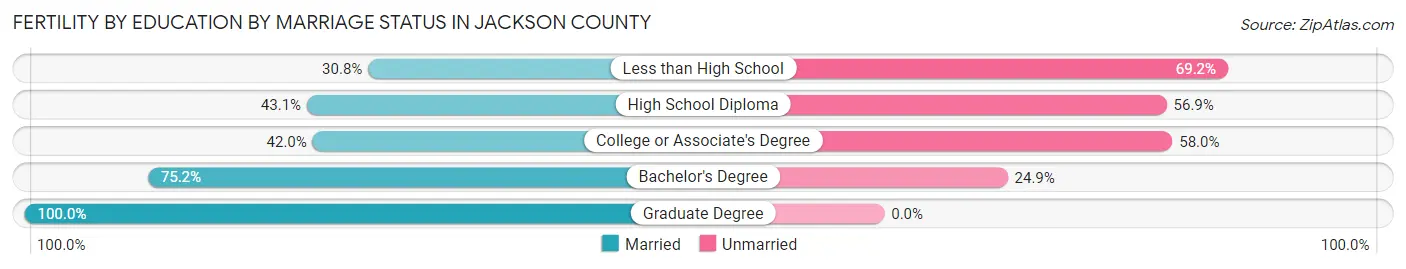
Fertility by Education by Marriage Status in Jackson County
45.1% of women with births in Jackson County are unmarried. Women with the educational attainment of graduate degree are most likely to be married with 100.0% of them married at childbirth, while women with the educational attainment of less than high school are least likely to be married with 69.2% of them unmarried at childbirth.
| Educational Attainment | Married | Unmarried |
| Less than High School | 24 (30.8%) | 54 (69.2%) |
| High School Diploma | 169 (43.1%) | 223 (56.9%) |
| College or Associate's Degree | 201 (42.0%) | 278 (58.0%) |
| Bachelor's Degree | 254 (75.1%) | 84 (24.8%) |
| Graduate Degree | 130 (100.0%) | 0 (0.0%) |
| Total | 778 (54.9%) | 639 (45.1%) |
Income in Jackson County
Income Overview in Jackson County
Per Capita Income in Jackson County is $33,065, while median incomes of families and households are $79,374 and $62,581 respectively.
| Characteristic | Number | Measure |
| Per Capita Income | 160,637 | $33,065 |
| Median Family Income | 38,978 | $79,374 |
| Mean Family Income | 38,978 | $98,825 |
| Median Household Income | 62,059 | $62,581 |
| Mean Household Income | 62,059 | $82,443 |
| Income Deficit | 38,978 | $10,005 |
| Wage / Income Gap (%) | 160,637 | 29.14% |
| Wage / Income Gap ($) | 160,637 | 70.86¢ per $1 |
| Gini / Inequality Index | 160,637 | 0.45 |
Earnings by Sex in Jackson County
Average Earnings in Jackson County are $37,045, $43,651 for men and $30,933 for women, a difference of 29.1%.
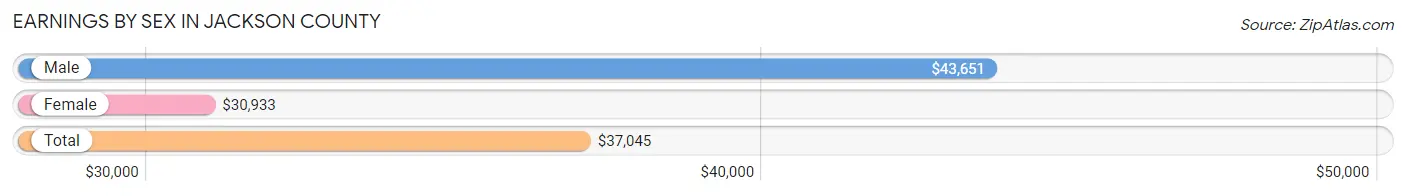
| Sex | Number | Average Earnings |
| Male | 42,919 (53.2%) | $43,651 |
| Female | 37,736 (46.8%) | $30,933 |
| Total | 80,655 (100.0%) | $37,045 |
Earnings by Sex by Income Bracket in Jackson County
The most common earnings brackets in Jackson County are $75,000 to $99,999 for men (5,182 | 12.1%) and $25,000 to $29,999 for women (2,714 | 7.2%).
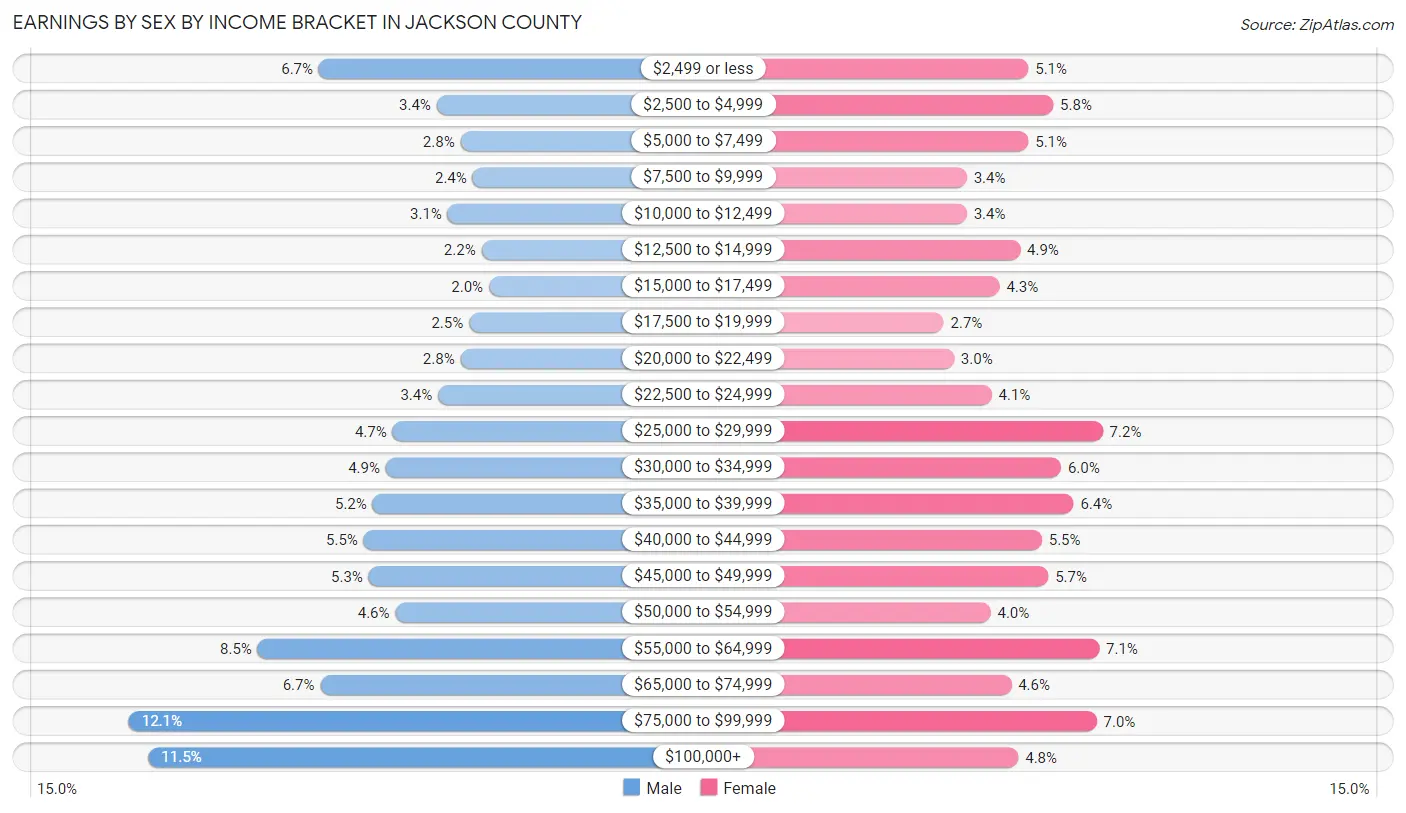
| Income | Male | Female |
| $2,499 or less | 2,887 (6.7%) | 1,926 (5.1%) |
| $2,500 to $4,999 | 1,467 (3.4%) | 2,189 (5.8%) |
| $5,000 to $7,499 | 1,180 (2.8%) | 1,925 (5.1%) |
| $7,500 to $9,999 | 1,034 (2.4%) | 1,273 (3.4%) |
| $10,000 to $12,499 | 1,334 (3.1%) | 1,273 (3.4%) |
| $12,500 to $14,999 | 926 (2.2%) | 1,836 (4.9%) |
| $15,000 to $17,499 | 837 (1.9%) | 1,620 (4.3%) |
| $17,500 to $19,999 | 1,076 (2.5%) | 1,025 (2.7%) |
| $20,000 to $22,499 | 1,181 (2.8%) | 1,135 (3.0%) |
| $22,500 to $24,999 | 1,451 (3.4%) | 1,536 (4.1%) |
| $25,000 to $29,999 | 2,001 (4.7%) | 2,714 (7.2%) |
| $30,000 to $34,999 | 2,081 (4.9%) | 2,272 (6.0%) |
| $35,000 to $39,999 | 2,242 (5.2%) | 2,402 (6.4%) |
| $40,000 to $44,999 | 2,348 (5.5%) | 2,067 (5.5%) |
| $45,000 to $49,999 | 2,288 (5.3%) | 2,134 (5.7%) |
| $50,000 to $54,999 | 1,965 (4.6%) | 1,525 (4.0%) |
| $55,000 to $64,999 | 3,625 (8.5%) | 2,674 (7.1%) |
| $65,000 to $74,999 | 2,870 (6.7%) | 1,742 (4.6%) |
| $75,000 to $99,999 | 5,182 (12.1%) | 2,650 (7.0%) |
| $100,000+ | 4,944 (11.5%) | 1,818 (4.8%) |
| Total | 42,919 (100.0%) | 37,736 (100.0%) |
Earnings by Sex by Educational Attainment in Jackson County
Average earnings in Jackson County are $49,458 for men and $36,958 for women, a difference of 25.3%. Men with an educational attainment of graduate degree enjoy the highest average annual earnings of $89,629, while those with less than high school education earn the least with $30,703. Women with an educational attainment of graduate degree earn the most with the average annual earnings of $68,333, while those with less than high school education have the smallest earnings of $21,406.
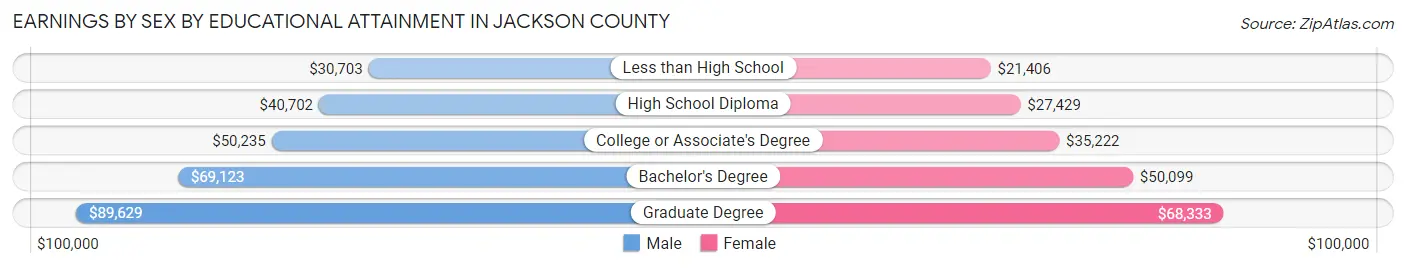
| Educational Attainment | Male Income | Female Income |
| Less than High School | $30,703 | $21,406 |
| High School Diploma | $40,702 | $27,429 |
| College or Associate's Degree | $50,235 | $35,222 |
| Bachelor's Degree | $69,123 | $50,099 |
| Graduate Degree | $89,629 | $68,333 |
| Total | $49,458 | $36,958 |
Family Income in Jackson County
Family Income Brackets in Jackson County
According to the Jackson County family income data, there are 8,263 families falling into the $100,000 to $149,999 income range, which is the most common income bracket and makes up 21.2% of all families. Conversely, the less than $10,000 income bracket is the least frequent group with only 858 families (2.2%) belonging to this category.
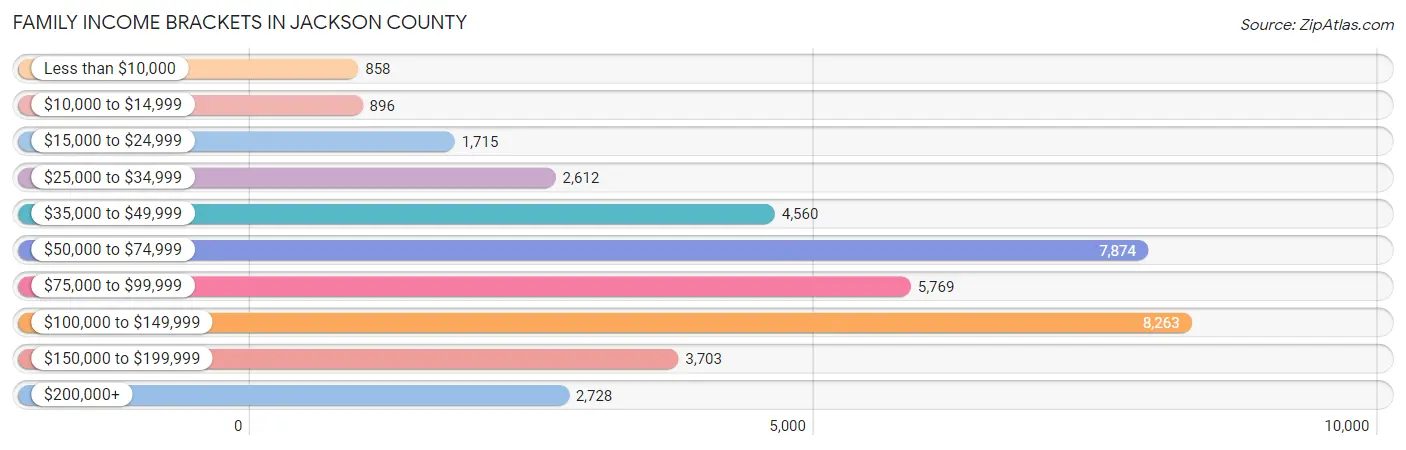
| Income Bracket | # Families | % Families |
| Less than $10,000 | 858 | 2.2% |
| $10,000 to $14,999 | 896 | 2.3% |
| $15,000 to $24,999 | 1,715 | 4.4% |
| $25,000 to $34,999 | 2,612 | 6.7% |
| $35,000 to $49,999 | 4,560 | 11.7% |
| $50,000 to $74,999 | 7,874 | 20.2% |
| $75,000 to $99,999 | 5,769 | 14.8% |
| $100,000 to $149,999 | 8,263 | 21.2% |
| $150,000 to $199,999 | 3,703 | 9.5% |
| $200,000+ | 2,728 | 7.0% |
Family Income by Famaliy Size in Jackson County
6-person families (920 | 2.4%) account for the highest median family income in Jackson County with $100,357 per family, while 2-person families (20,706 | 53.1%) have the highest median income of $35,190 per family member.

| Income Bracket | # Families | Median Income |
| 2-Person Families | 20,706 (53.1%) | $70,379 |
| 3-Person Families | 8,240 (21.1%) | $85,647 |
| 4-Person Families | 5,802 (14.9%) | $99,260 |
| 5-Person Families | 2,883 (7.4%) | $96,934 |
| 6-Person Families | 920 (2.4%) | $100,357 |
| 7+ Person Families | 427 (1.1%) | $83,542 |
| Total | 38,978 (100.0%) | $79,374 |
Family Income by Number of Earners in Jackson County
The median family income in Jackson County is $79,374, with families comprising 3+ earners (3,952) having the highest median family income of $142,872, while families with no earners (6,858) have the lowest median family income of $50,944, accounting for 10.1% and 17.6% of families, respectively.
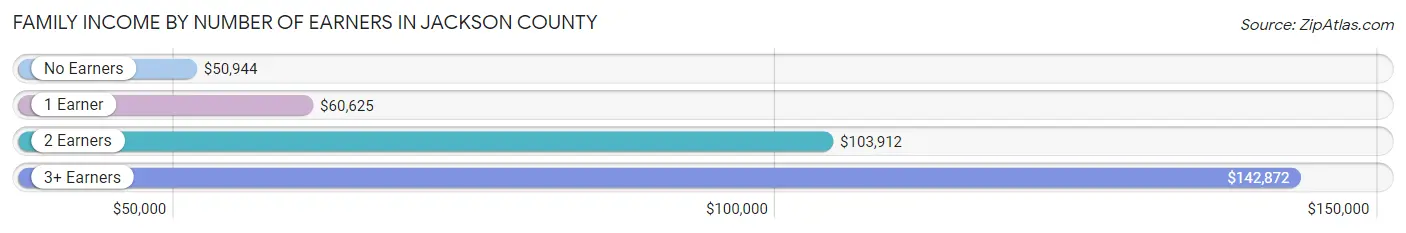
| Number of Earners | # Families | Median Income |
| No Earners | 6,858 (17.6%) | $50,944 |
| 1 Earner | 13,725 (35.2%) | $60,625 |
| 2 Earners | 14,443 (37.0%) | $103,912 |
| 3+ Earners | 3,952 (10.1%) | $142,872 |
| Total | 38,978 (100.0%) | $79,374 |
Household Income in Jackson County
Household Income Brackets in Jackson County
With 11,791 households falling in the category, the $50,000 to $74,999 income range is the most frequent in Jackson County, accounting for 19.0% of all households. In contrast, only 2,731 households (4.4%) fall into the less than $10,000 income bracket, making it the least populous group.
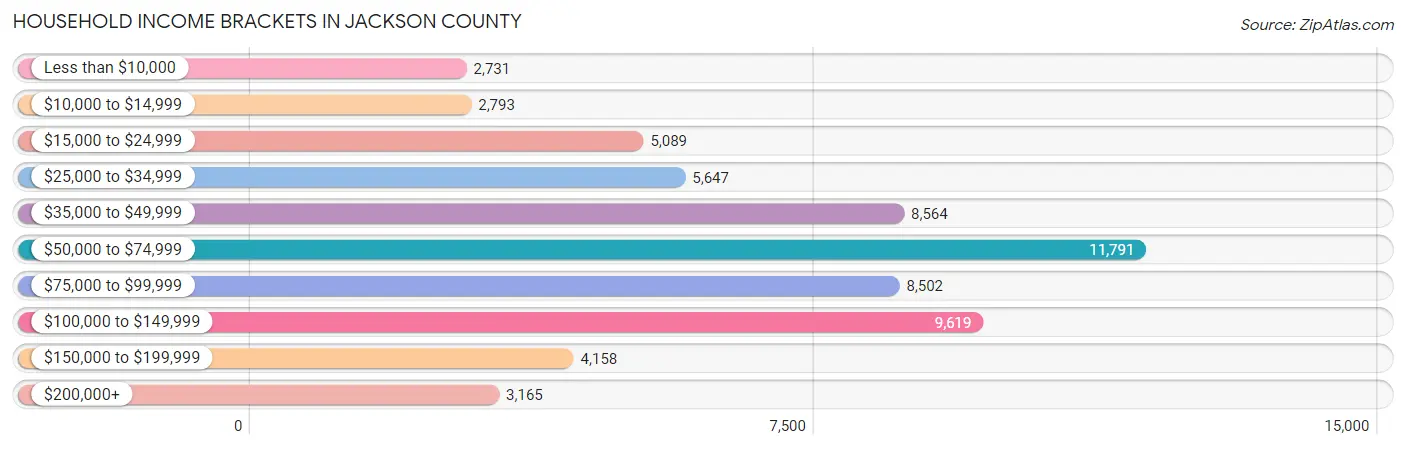
| Income Bracket | # Households | % Households |
| Less than $10,000 | 2,731 | 4.4% |
| $10,000 to $14,999 | 2,793 | 4.5% |
| $15,000 to $24,999 | 5,089 | 8.2% |
| $25,000 to $34,999 | 5,647 | 9.1% |
| $35,000 to $49,999 | 8,564 | 13.8% |
| $50,000 to $74,999 | 11,791 | 19.0% |
| $75,000 to $99,999 | 8,502 | 13.7% |
| $100,000 to $149,999 | 9,619 | 15.5% |
| $150,000 to $199,999 | 4,158 | 6.7% |
| $200,000+ | 3,165 | 5.1% |
Household Income by Householder Age in Jackson County
The median household income in Jackson County is $62,581, with the highest median household income of $76,110 found in the 45 to 64 years age bracket for the primary householder. A total of 23,648 households (38.1%) fall into this category. Meanwhile, the 15 to 24 years age bracket for the primary householder has the lowest median household income of $37,531, with 2,443 households (3.9%) in this group.
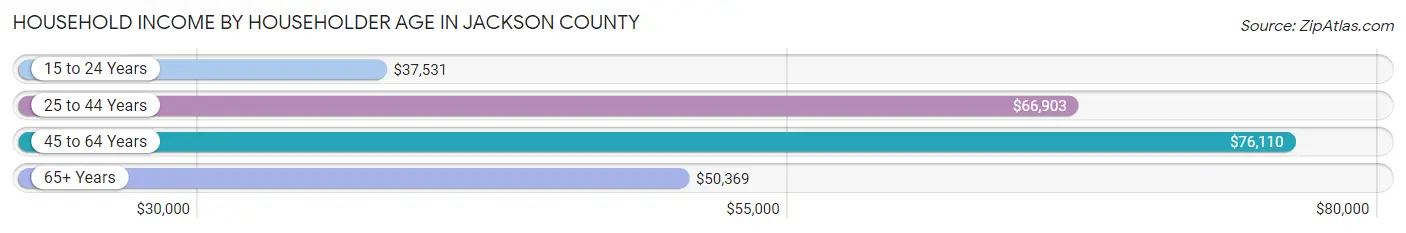
| Income Bracket | # Households | Median Income |
| 15 to 24 Years | 2,443 (3.9%) | $37,531 |
| 25 to 44 Years | 18,052 (29.1%) | $66,903 |
| 45 to 64 Years | 23,648 (38.1%) | $76,110 |
| 65+ Years | 17,916 (28.9%) | $50,369 |
| Total | 62,059 (100.0%) | $62,581 |
Poverty in Jackson County
Income Below Poverty by Sex and Age in Jackson County
With 10.8% poverty level for males and 13.4% for females among the residents of Jackson County, 5 year old males and under 5 year old females are the most vulnerable to poverty, with 287 males (29.3%) and 967 females (22.9%) in their respective age groups living below the poverty level.
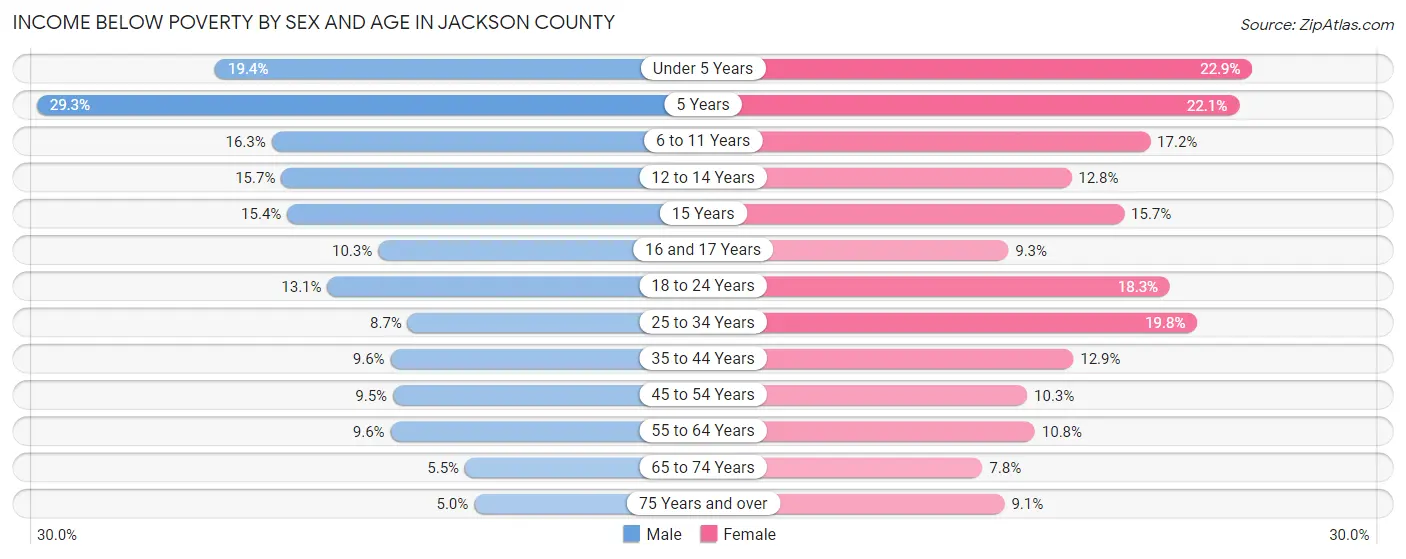
| Age Bracket | Male | Female |
| Under 5 Years | 856 (19.4%) | 967 (22.9%) |
| 5 Years | 287 (29.3%) | 117 (22.1%) |
| 6 to 11 Years | 990 (16.3%) | 854 (17.2%) |
| 12 to 14 Years | 409 (15.7%) | 442 (12.8%) |
| 15 Years | 168 (15.4%) | 163 (15.7%) |
| 16 and 17 Years | 209 (10.3%) | 175 (9.3%) |
| 18 to 24 Years | 902 (13.1%) | 1,085 (18.3%) |
| 25 to 34 Years | 789 (8.7%) | 1,847 (19.8%) |
| 35 to 44 Years | 819 (9.6%) | 1,115 (12.9%) |
| 45 to 54 Years | 880 (9.5%) | 969 (10.3%) |
| 55 to 64 Years | 1,041 (9.6%) | 1,217 (10.7%) |
| 65 to 74 Years | 441 (5.5%) | 695 (7.8%) |
| 75 Years and over | 239 (5.0%) | 600 (9.1%) |
| Total | 8,030 (10.8%) | 10,246 (13.4%) |
Income Above Poverty by Sex and Age in Jackson County
According to the poverty statistics in Jackson County, males aged 75 years and over and females aged 65 to 74 years are the age groups that are most secure financially, with 95.0% of males and 92.2% of females in these age groups living above the poverty line.
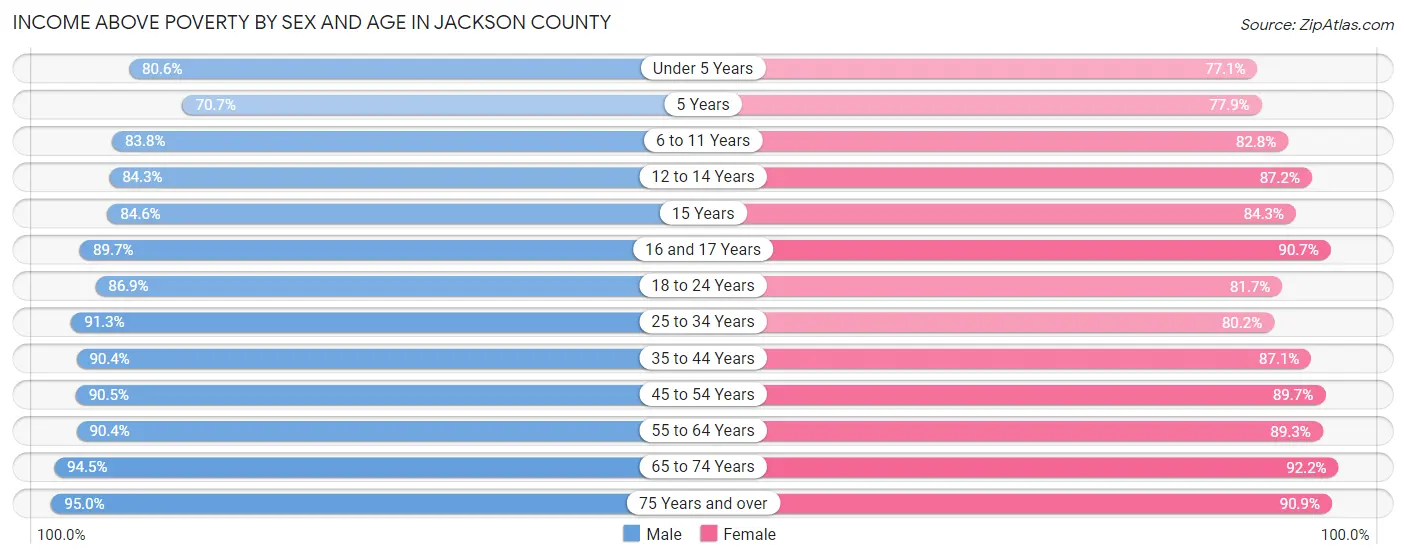
| Age Bracket | Male | Female |
| Under 5 Years | 3,558 (80.6%) | 3,263 (77.1%) |
| 5 Years | 692 (70.7%) | 412 (77.9%) |
| 6 to 11 Years | 5,103 (83.8%) | 4,121 (82.8%) |
| 12 to 14 Years | 2,194 (84.3%) | 3,017 (87.2%) |
| 15 Years | 924 (84.6%) | 874 (84.3%) |
| 16 and 17 Years | 1,817 (89.7%) | 1,713 (90.7%) |
| 18 to 24 Years | 5,965 (86.9%) | 4,855 (81.7%) |
| 25 to 34 Years | 8,307 (91.3%) | 7,486 (80.2%) |
| 35 to 44 Years | 7,686 (90.4%) | 7,535 (87.1%) |
| 45 to 54 Years | 8,396 (90.5%) | 8,418 (89.7%) |
| 55 to 64 Years | 9,772 (90.4%) | 10,106 (89.2%) |
| 65 to 74 Years | 7,610 (94.5%) | 8,179 (92.2%) |
| 75 Years and over | 4,566 (95.0%) | 6,020 (90.9%) |
| Total | 66,590 (89.2%) | 65,999 (86.6%) |
Income Below Poverty Among Married-Couple Families in Jackson County
The poverty statistics for married-couple families in Jackson County show that 3.6% or 1,028 of the total 28,533 families live below the poverty line. Families with 5 or more children have the highest poverty rate of 21.9%, comprising of 50 families. On the other hand, families with no children have the lowest poverty rate of 2.6%, which includes 497 families.
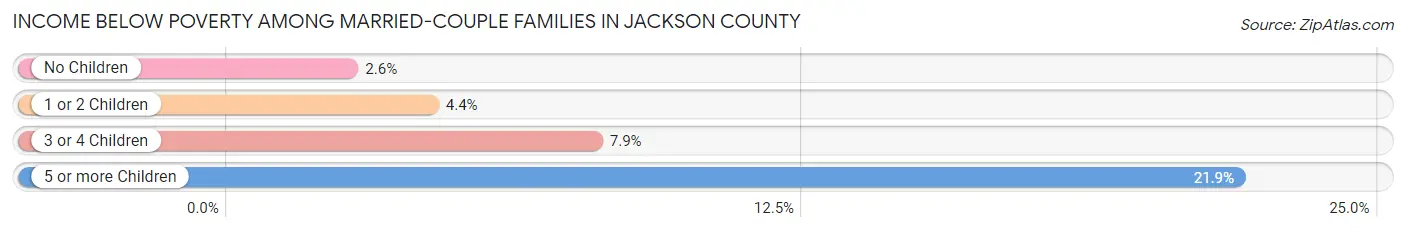
| Children | Above Poverty | Below Poverty |
| No Children | 18,477 (97.4%) | 497 (2.6%) |
| 1 or 2 Children | 6,960 (95.6%) | 318 (4.4%) |
| 3 or 4 Children | 1,890 (92.1%) | 163 (7.9%) |
| 5 or more Children | 178 (78.1%) | 50 (21.9%) |
| Total | 27,505 (96.4%) | 1,028 (3.6%) |
Income Below Poverty Among Single-Parent Households in Jackson County
According to the poverty data in Jackson County, 11.6% or 391 single-father households and 24.9% or 1,762 single-mother households are living below the poverty line. Among single-father households, those with 3 or 4 children have the highest poverty rate, with 95 households (38.0%) experiencing poverty. Likewise, among single-mother households, those with 5 or more children have the highest poverty rate, with 47 households (100.0%) falling below the poverty line.
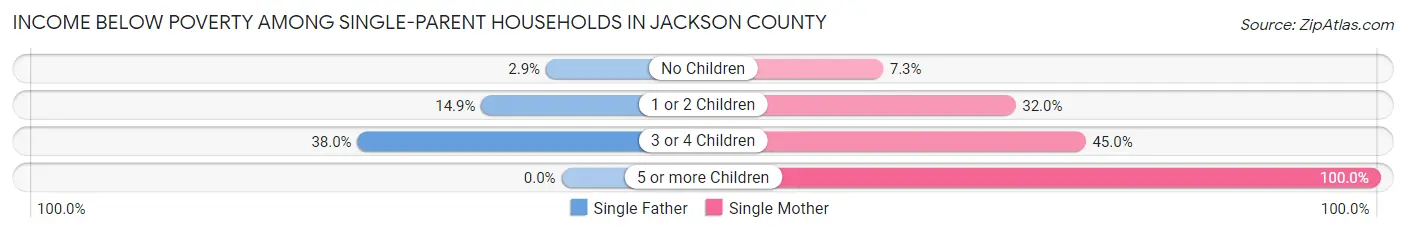
| Children | Single Father | Single Mother |
| No Children | 41 (2.9%) | 193 (7.3%) |
| 1 or 2 Children | 255 (14.9%) | 1,095 (32.0%) |
| 3 or 4 Children | 95 (38.0%) | 427 (45.0%) |
| 5 or more Children | 0 (0.0%) | 47 (100.0%) |
| Total | 391 (11.6%) | 1,762 (24.9%) |
Income Below Poverty Among Married-Couple vs Single-Parent Households in Jackson County
The poverty data for Jackson County shows that 1,028 of the married-couple family households (3.6%) and 2,153 of the single-parent households (20.6%) are living below the poverty level. Within the married-couple family households, those with 5 or more children have the highest poverty rate, with 50 households (21.9%) falling below the poverty line. Among the single-parent households, those with 5 or more children have the highest poverty rate, with 47 household (100.0%) living below poverty.
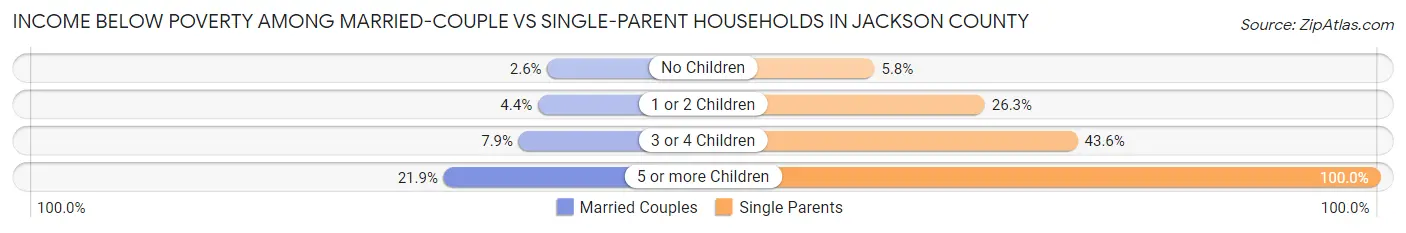
| Children | Married-Couple Families | Single-Parent Households |
| No Children | 497 (2.6%) | 234 (5.8%) |
| 1 or 2 Children | 318 (4.4%) | 1,350 (26.3%) |
| 3 or 4 Children | 163 (7.9%) | 522 (43.6%) |
| 5 or more Children | 50 (21.9%) | 47 (100.0%) |
| Total | 1,028 (3.6%) | 2,153 (20.6%) |
Employment Characteristics in Jackson County
Employment by Class of Employer in Jackson County
Among the 68,511 employed individuals in Jackson County, private company employees (47,329 | 69.1%), not-for-profit organizations (6,730 | 9.8%), and local government employees (4,710 | 6.9%) make up the most common classes of employment.
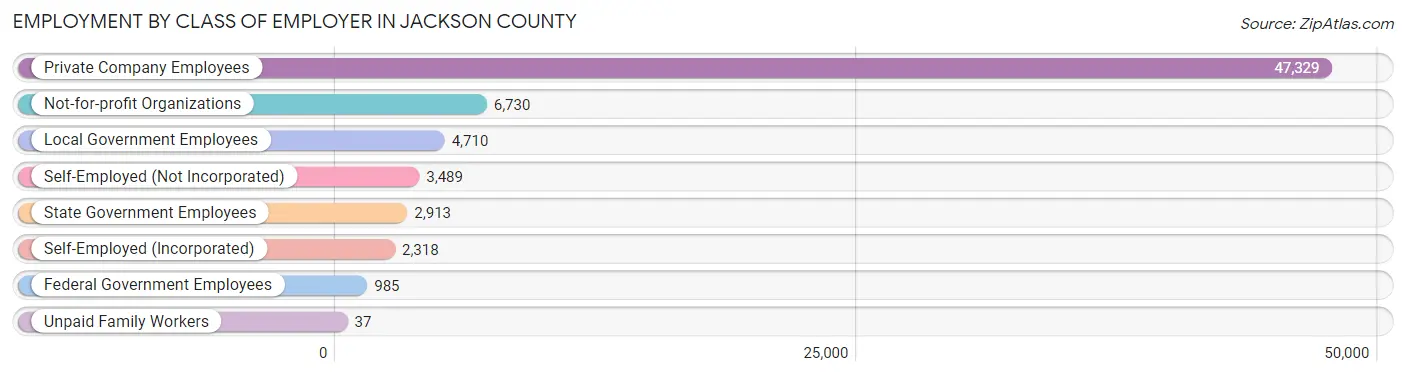
| Employer Class | # Employees | % Employees |
| Private Company Employees | 47,329 | 69.1% |
| Self-Employed (Incorporated) | 2,318 | 3.4% |
| Self-Employed (Not Incorporated) | 3,489 | 5.1% |
| Not-for-profit Organizations | 6,730 | 9.8% |
| Local Government Employees | 4,710 | 6.9% |
| State Government Employees | 2,913 | 4.3% |
| Federal Government Employees | 985 | 1.4% |
| Unpaid Family Workers | 37 | 0.1% |
| Total | 68,511 | 100.0% |
Employment Status by Age in Jackson County
According to the labor force statistics for Jackson County, out of the total population over 16 years of age (130,716), 56.7% or 74,116 individuals are in the labor force, with 6.3% or 4,669 of them unemployed. The age group with the highest labor force participation rate is 20 to 24 years, with 77.6% or 8,151 individuals in the labor force. Within the labor force, the 16 to 19 years age range has the highest percentage of unemployed individuals, with 15.6% or 568 of them being unemployed.
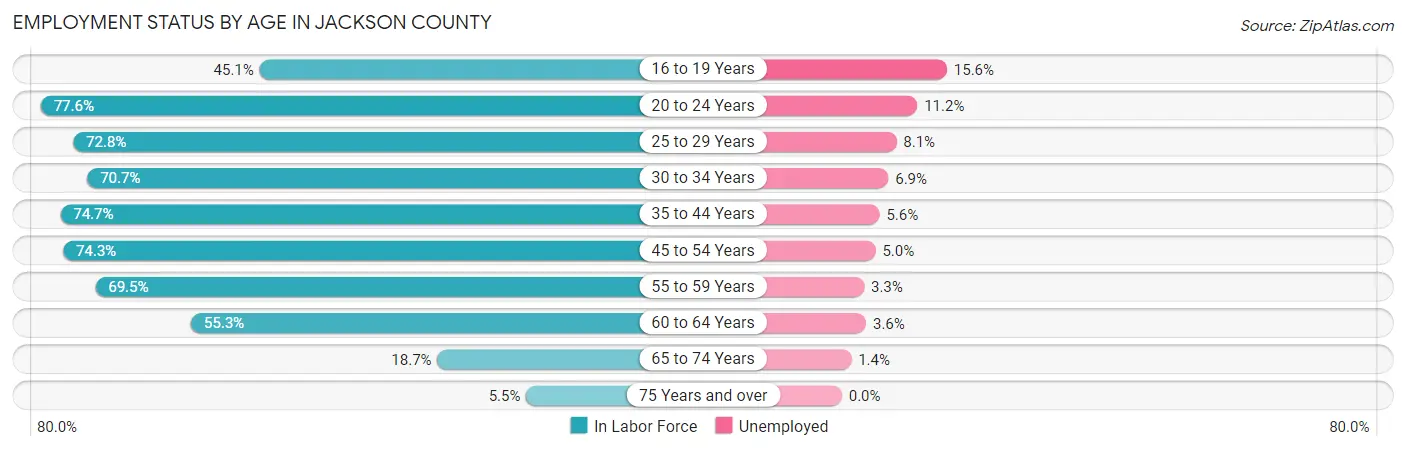
| Age Bracket | In Labor Force | Unemployed |
| 16 to 19 Years | 3,644 (45.1%) | 568 (15.6%) |
| 20 to 24 Years | 8,151 (77.6%) | 913 (11.2%) |
| 25 to 29 Years | 7,596 (72.8%) | 615 (8.1%) |
| 30 to 34 Years | 7,162 (70.7%) | 494 (6.9%) |
| 35 to 44 Years | 14,227 (74.7%) | 797 (5.6%) |
| 45 to 54 Years | 15,118 (74.3%) | 756 (5.0%) |
| 55 to 59 Years | 8,008 (69.5%) | 264 (3.3%) |
| 60 to 64 Years | 6,311 (55.3%) | 227 (3.6%) |
| 65 to 74 Years | 3,258 (18.7%) | 46 (1.4%) |
| 75 Years and over | 650 (5.5%) | 0 (0.0%) |
| Total | 74,116 (56.7%) | 4,669 (6.3%) |
Employment Status by Educational Attainment in Jackson County
According to labor force statistics for Jackson County, 70.5% of individuals (58,438) out of the total population between 25 and 64 years of age (82,891) are in the labor force, with 5.4% or 3,156 of them being unemployed. The group with the highest labor force participation rate are those with the educational attainment of bachelor's degree or higher, with 88.8% or 17,191 individuals in the labor force. Within the labor force, individuals with less than high school education have the highest percentage of unemployment, with 11.3% or 331 of them being unemployed.
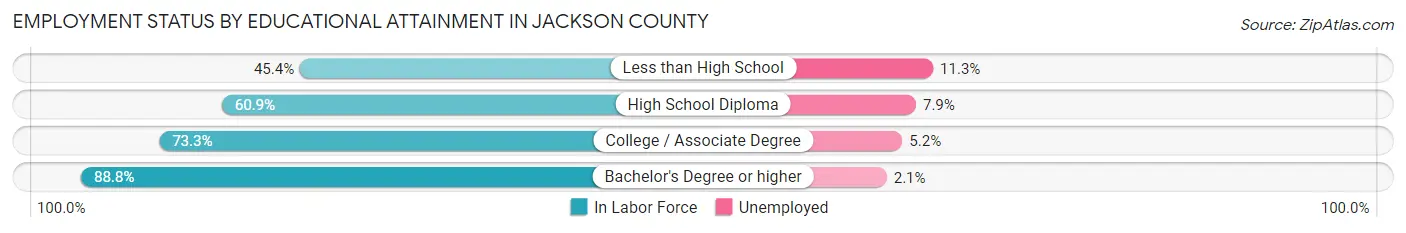
| Educational Attainment | In Labor Force | Unemployed |
| Less than High School | 2,926 (45.4%) | 728 (11.3%) |
| High School Diploma | 17,367 (60.9%) | 2,253 (7.9%) |
| College / Associate Degree | 20,943 (73.3%) | 1,486 (5.2%) |
| Bachelor's Degree or higher | 17,191 (88.8%) | 407 (2.1%) |
| Total | 58,438 (70.5%) | 4,476 (5.4%) |
Employment Occupations by Sex in Jackson County
Management, Business, Science and Arts Occupations
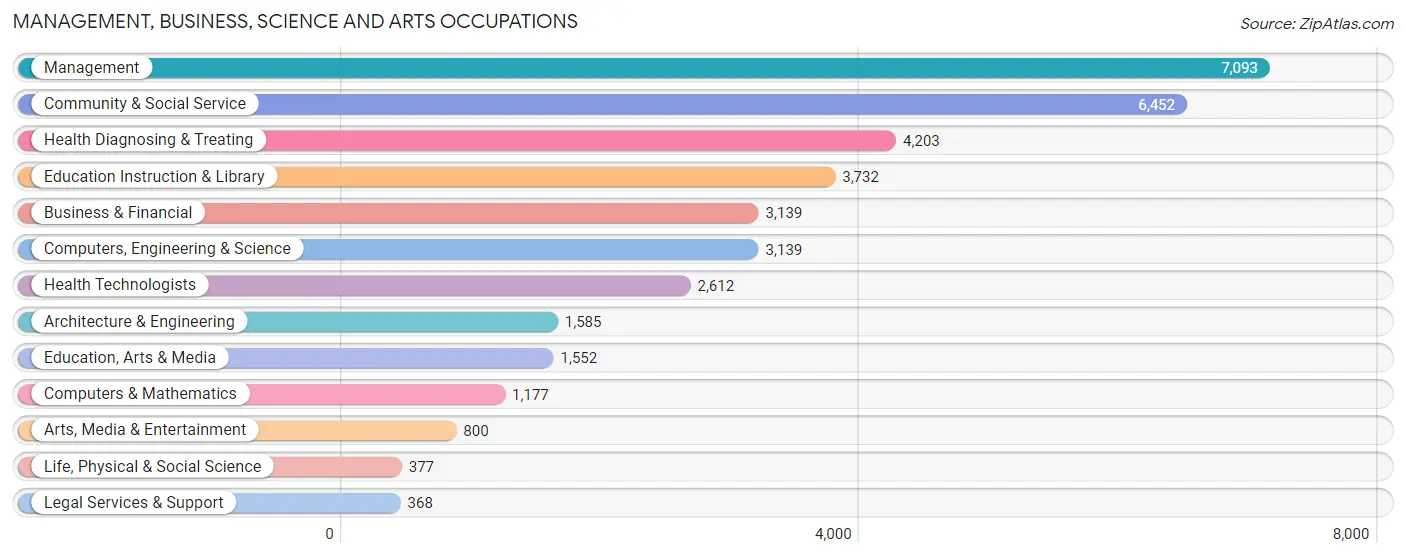
The most common Management, Business, Science and Arts occupations in Jackson County are Management (7,093 | 10.2%), Community & Social Service (6,452 | 9.3%), Health Diagnosing & Treating (4,203 | 6.1%), Education Instruction & Library (3,732 | 5.4%), and Business & Financial (3,139 | 4.5%).
Management, Business, Science and Arts Occupations by Sex
Within the Management, Business, Science and Arts occupations in Jackson County, the most male-oriented occupations are Architecture & Engineering (85.7%), Computers, Engineering & Science (75.5%), and Computers & Mathematics (67.5%), while the most female-oriented occupations are Education Instruction & Library (77.8%), Health Diagnosing & Treating (75.9%), and Community & Social Service (72.8%).
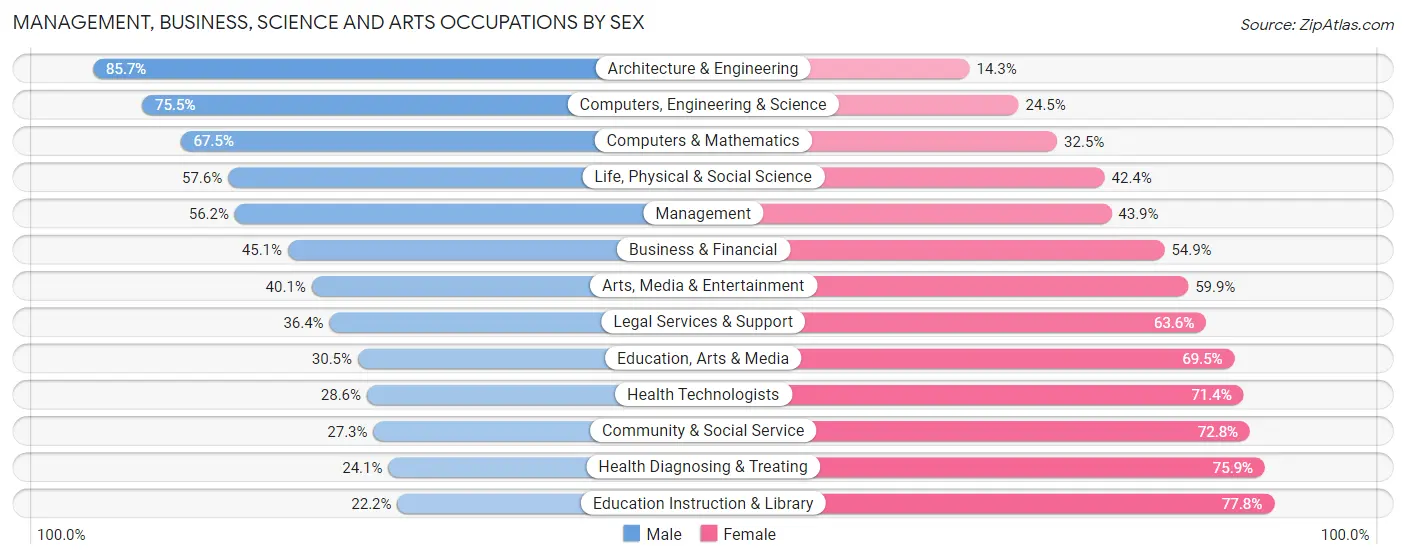
| Occupation | Male | Female |
| Management | 3,983 (56.1%) | 3,110 (43.9%) |
| Business & Financial | 1,415 (45.1%) | 1,724 (54.9%) |
| Computers, Engineering & Science | 2,370 (75.5%) | 769 (24.5%) |
| Computers & Mathematics | 794 (67.5%) | 383 (32.5%) |
| Architecture & Engineering | 1,359 (85.7%) | 226 (14.3%) |
| Life, Physical & Social Science | 217 (57.6%) | 160 (42.4%) |
| Community & Social Service | 1,758 (27.3%) | 4,694 (72.8%) |
| Education, Arts & Media | 473 (30.5%) | 1,079 (69.5%) |
| Legal Services & Support | 134 (36.4%) | 234 (63.6%) |
| Education Instruction & Library | 830 (22.2%) | 2,902 (77.8%) |
| Arts, Media & Entertainment | 321 (40.1%) | 479 (59.9%) |
| Health Diagnosing & Treating | 1,014 (24.1%) | 3,189 (75.9%) |
| Health Technologists | 747 (28.6%) | 1,865 (71.4%) |
| Total (Category) | 10,540 (43.9%) | 13,486 (56.1%) |
| Total (Overall) | 35,547 (51.3%) | 33,717 (48.7%) |
Services Occupations
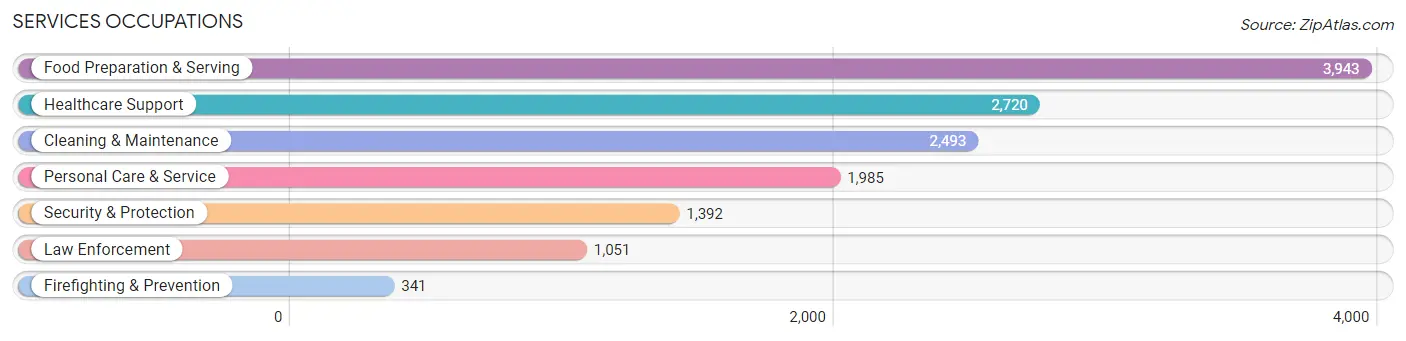
The most common Services occupations in Jackson County are Food Preparation & Serving (3,943 | 5.7%), Healthcare Support (2,720 | 3.9%), Cleaning & Maintenance (2,493 | 3.6%), Personal Care & Service (1,985 | 2.9%), and Security & Protection (1,392 | 2.0%).
Services Occupations by Sex
Within the Services occupations in Jackson County, the most male-oriented occupations are Firefighting & Prevention (80.9%), Security & Protection (79.5%), and Law Enforcement (79.1%), while the most female-oriented occupations are Healthcare Support (91.8%), Personal Care & Service (80.5%), and Food Preparation & Serving (56.1%).
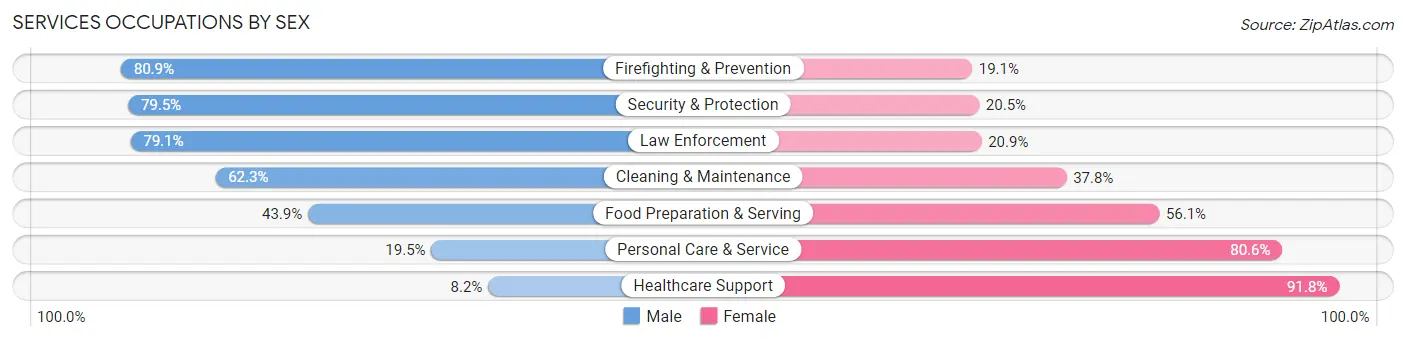
| Occupation | Male | Female |
| Healthcare Support | 223 (8.2%) | 2,497 (91.8%) |
| Security & Protection | 1,107 (79.5%) | 285 (20.5%) |
| Firefighting & Prevention | 276 (80.9%) | 65 (19.1%) |
| Law Enforcement | 831 (79.1%) | 220 (20.9%) |
| Food Preparation & Serving | 1,730 (43.9%) | 2,213 (56.1%) |
| Cleaning & Maintenance | 1,552 (62.3%) | 941 (37.8%) |
| Personal Care & Service | 386 (19.5%) | 1,599 (80.5%) |
| Total (Category) | 4,998 (39.9%) | 7,535 (60.1%) |
| Total (Overall) | 35,547 (51.3%) | 33,717 (48.7%) |
Sales and Office Occupations
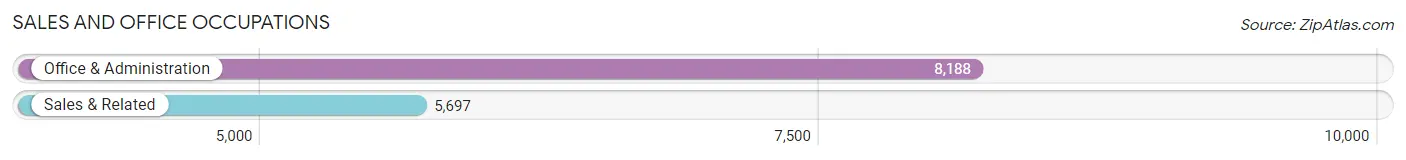
The most common Sales and Office occupations in Jackson County are Office & Administration (8,188 | 11.8%), and Sales & Related (5,697 | 8.2%).
Sales and Office Occupations by Sex

| Occupation | Male | Female |
| Sales & Related | 2,746 (48.2%) | 2,951 (51.8%) |
| Office & Administration | 1,459 (17.8%) | 6,729 (82.2%) |
| Total (Category) | 4,205 (30.3%) | 9,680 (69.7%) |
| Total (Overall) | 35,547 (51.3%) | 33,717 (48.7%) |
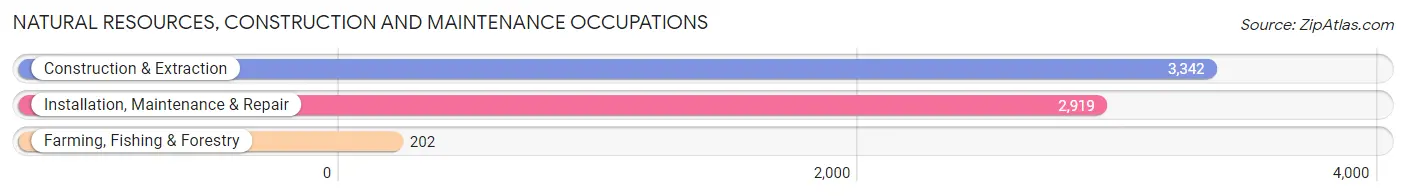
Natural Resources, Construction and Maintenance Occupations
The most common Natural Resources, Construction and Maintenance occupations in Jackson County are Construction & Extraction (3,342 | 4.8%), Installation, Maintenance & Repair (2,919 | 4.2%), and Farming, Fishing & Forestry (202 | 0.3%).
Natural Resources, Construction and Maintenance Occupations by Sex
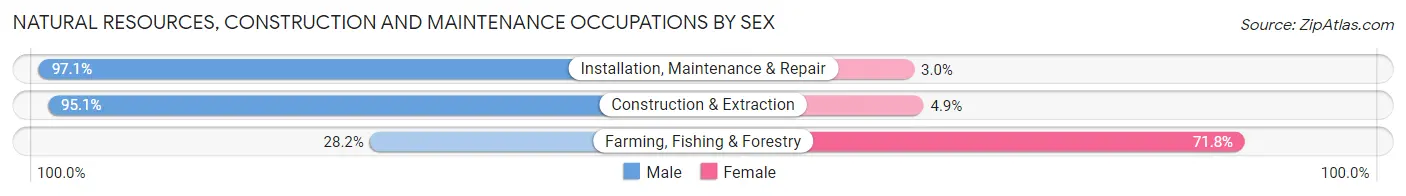
| Occupation | Male | Female |
| Farming, Fishing & Forestry | 57 (28.2%) | 145 (71.8%) |
| Construction & Extraction | 3,178 (95.1%) | 164 (4.9%) |
| Installation, Maintenance & Repair | 2,833 (97.1%) | 86 (2.9%) |
| Total (Category) | 6,068 (93.9%) | 395 (6.1%) |
| Total (Overall) | 35,547 (51.3%) | 33,717 (48.7%) |
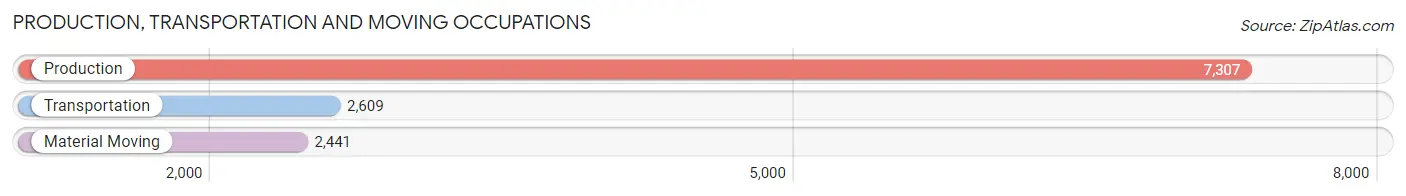
Production, Transportation and Moving Occupations
The most common Production, Transportation and Moving occupations in Jackson County are Production (7,307 | 10.5%), Transportation (2,609 | 3.8%), and Material Moving (2,441 | 3.5%).
Production, Transportation and Moving Occupations by Sex
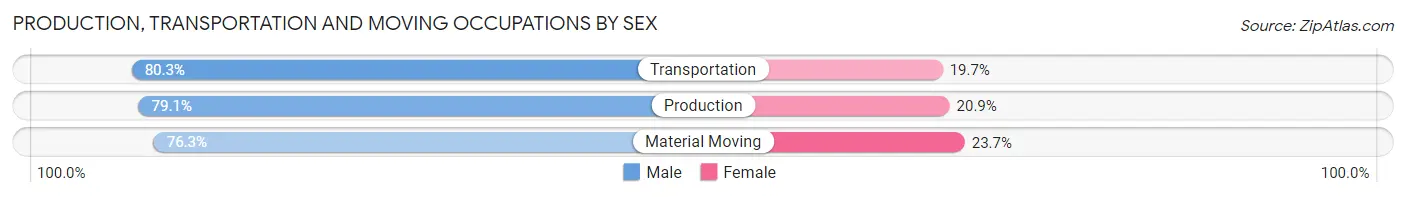
| Occupation | Male | Female |
| Production | 5,778 (79.1%) | 1,529 (20.9%) |
| Transportation | 2,096 (80.3%) | 513 (19.7%) |
| Material Moving | 1,862 (76.3%) | 579 (23.7%) |
| Total (Category) | 9,736 (78.8%) | 2,621 (21.2%) |
| Total (Overall) | 35,547 (51.3%) | 33,717 (48.7%) |
Employment Industries by Sex in Jackson County
Employment Industries in Jackson County
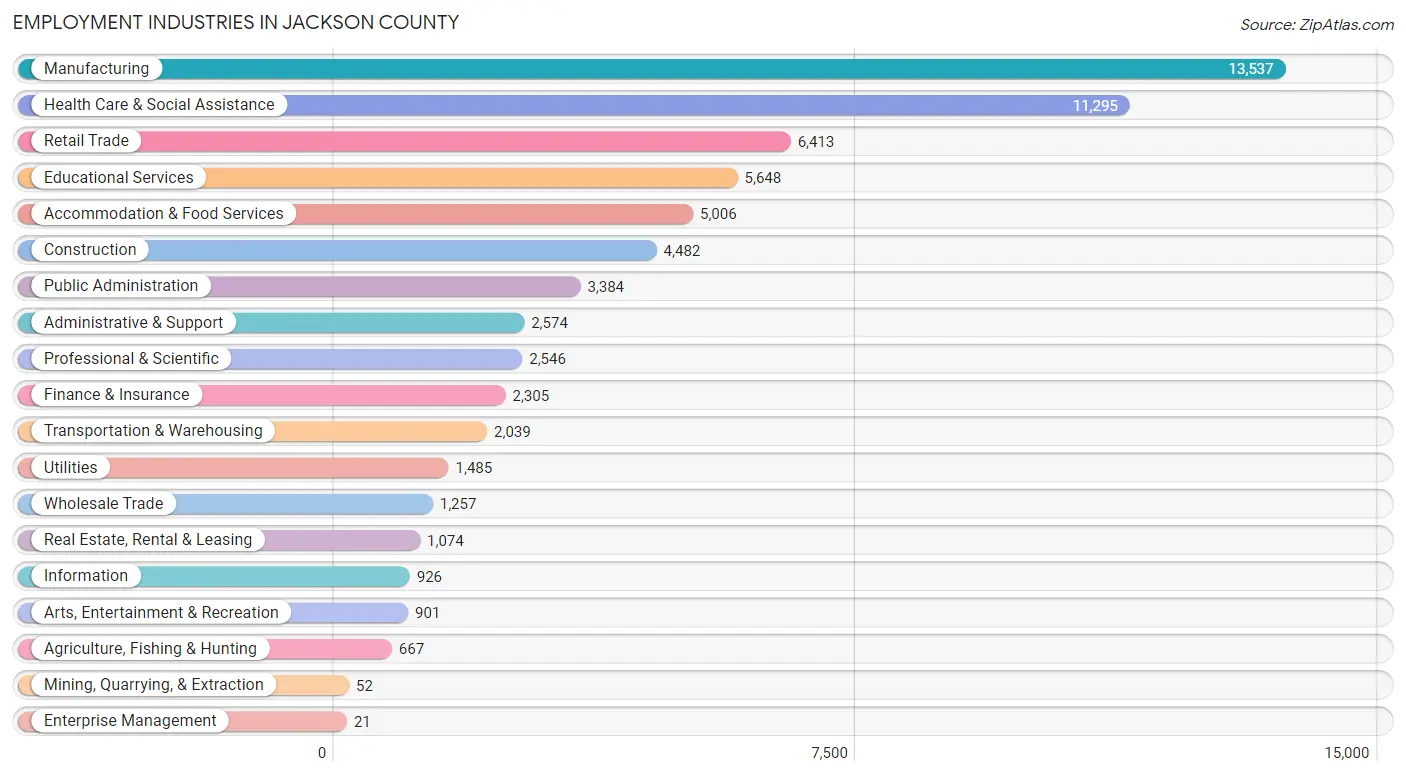
The major employment industries in Jackson County include Manufacturing (13,537 | 19.5%), Health Care & Social Assistance (11,295 | 16.3%), Retail Trade (6,413 | 9.3%), Educational Services (5,648 | 8.2%), and Accommodation & Food Services (5,006 | 7.2%).
Employment Industries by Sex in Jackson County
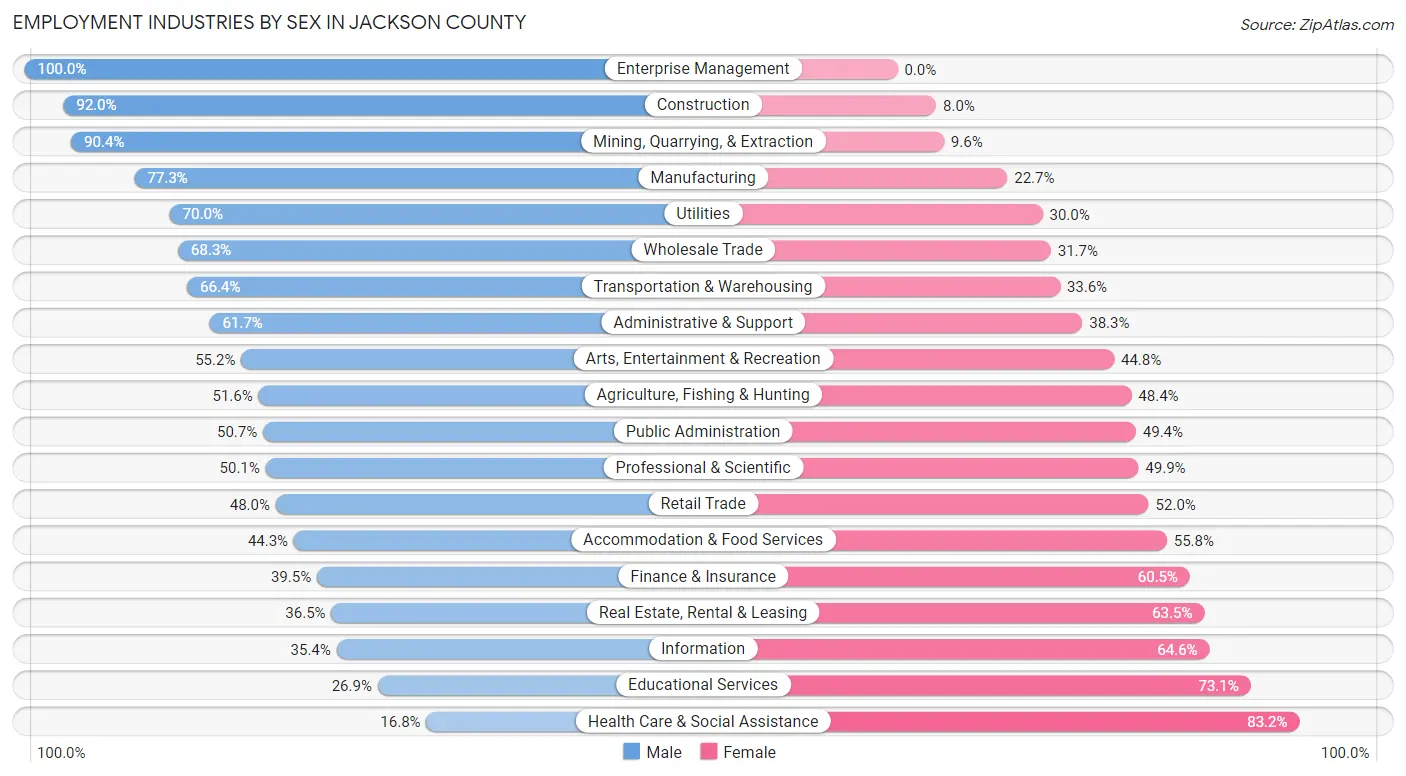
The Jackson County industries that see more men than women are Enterprise Management (100.0%), Construction (92.0%), and Mining, Quarrying, & Extraction (90.4%), whereas the industries that tend to have a higher number of women are Health Care & Social Assistance (83.2%), Educational Services (73.1%), and Information (64.6%).
| Industry | Male | Female |
| Agriculture, Fishing & Hunting | 344 (51.6%) | 323 (48.4%) |
| Mining, Quarrying, & Extraction | 47 (90.4%) | 5 (9.6%) |
| Construction | 4,123 (92.0%) | 359 (8.0%) |
| Manufacturing | 10,459 (77.3%) | 3,078 (22.7%) |
| Wholesale Trade | 858 (68.3%) | 399 (31.7%) |
| Retail Trade | 3,078 (48.0%) | 3,335 (52.0%) |
| Transportation & Warehousing | 1,353 (66.4%) | 686 (33.6%) |
| Utilities | 1,039 (70.0%) | 446 (30.0%) |
| Information | 328 (35.4%) | 598 (64.6%) |
| Finance & Insurance | 910 (39.5%) | 1,395 (60.5%) |
| Real Estate, Rental & Leasing | 392 (36.5%) | 682 (63.5%) |
| Professional & Scientific | 1,276 (50.1%) | 1,270 (49.9%) |
| Enterprise Management | 21 (100.0%) | 0 (0.0%) |
| Administrative & Support | 1,589 (61.7%) | 985 (38.3%) |
| Educational Services | 1,520 (26.9%) | 4,128 (73.1%) |
| Health Care & Social Assistance | 1,901 (16.8%) | 9,394 (83.2%) |
| Arts, Entertainment & Recreation | 497 (55.2%) | 404 (44.8%) |
| Accommodation & Food Services | 2,215 (44.3%) | 2,791 (55.7%) |
| Public Administration | 1,714 (50.6%) | 1,670 (49.3%) |
| Total | 35,547 (51.3%) | 33,717 (48.7%) |
Education in Jackson County
School Enrollment in Jackson County
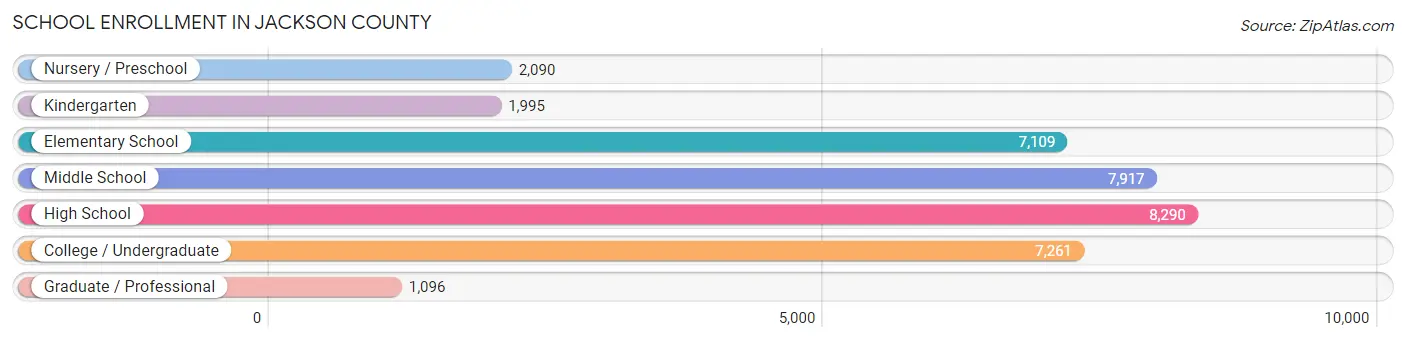
The most common levels of schooling among the 35,758 students in Jackson County are high school (8,290 | 23.2%), middle school (7,917 | 22.1%), and college / undergraduate (7,261 | 20.3%).
| School Level | # Students | % Students |
| Nursery / Preschool | 2,090 | 5.8% |
| Kindergarten | 1,995 | 5.6% |
| Elementary School | 7,109 | 19.9% |
| Middle School | 7,917 | 22.1% |
| High School | 8,290 | 23.2% |
| College / Undergraduate | 7,261 | 20.3% |
| Graduate / Professional | 1,096 | 3.1% |
| Total | 35,758 | 100.0% |
School Enrollment by Age by Funding Source in Jackson County
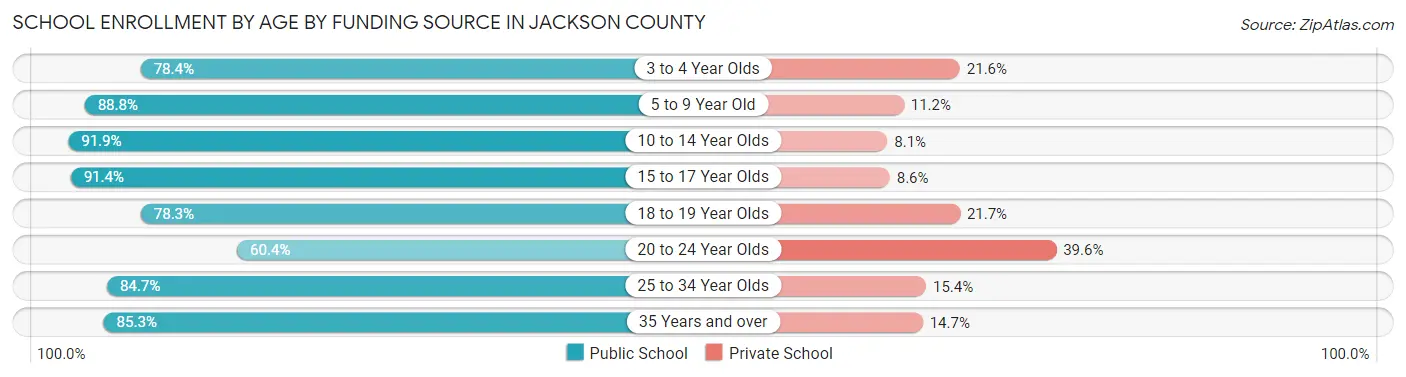
Out of a total of 35,758 students who are enrolled in schools in Jackson County, 5,078 (14.2%) attend a private institution, while the remaining 30,680 (85.8%) are enrolled in public schools. The age group of 20 to 24 year olds has the highest likelihood of being enrolled in private schools, with 1,232 (39.6% in the age bracket) enrolled. Conversely, the age group of 10 to 14 year olds has the lowest likelihood of being enrolled in a private school, with 8,736 (91.9% in the age bracket) attending a public institution.
| Age Bracket | Public School | Private School |
| 3 to 4 Year Olds | 1,264 (78.4%) | 349 (21.6%) |
| 5 to 9 Year Old | 7,882 (88.8%) | 994 (11.2%) |
| 10 to 14 Year Olds | 8,736 (91.9%) | 774 (8.1%) |
| 15 to 17 Year Olds | 5,297 (91.4%) | 498 (8.6%) |
| 18 to 19 Year Olds | 2,456 (78.3%) | 679 (21.7%) |
| 20 to 24 Year Olds | 1,880 (60.4%) | 1,232 (39.6%) |
| 25 to 34 Year Olds | 1,687 (84.7%) | 306 (15.3%) |
| 35 Years and over | 1,470 (85.3%) | 254 (14.7%) |
| Total | 30,680 (85.8%) | 5,078 (14.2%) |
Educational Attainment by Field of Study in Jackson County
Business (6,168 | 22.4%), education (4,177 | 15.1%), science & technology (2,916 | 10.6%), arts & humanities (2,589 | 9.4%), and engineering (2,031 | 7.4%) are the most common fields of study among 27,586 individuals in Jackson County who have obtained a bachelor's degree or higher.
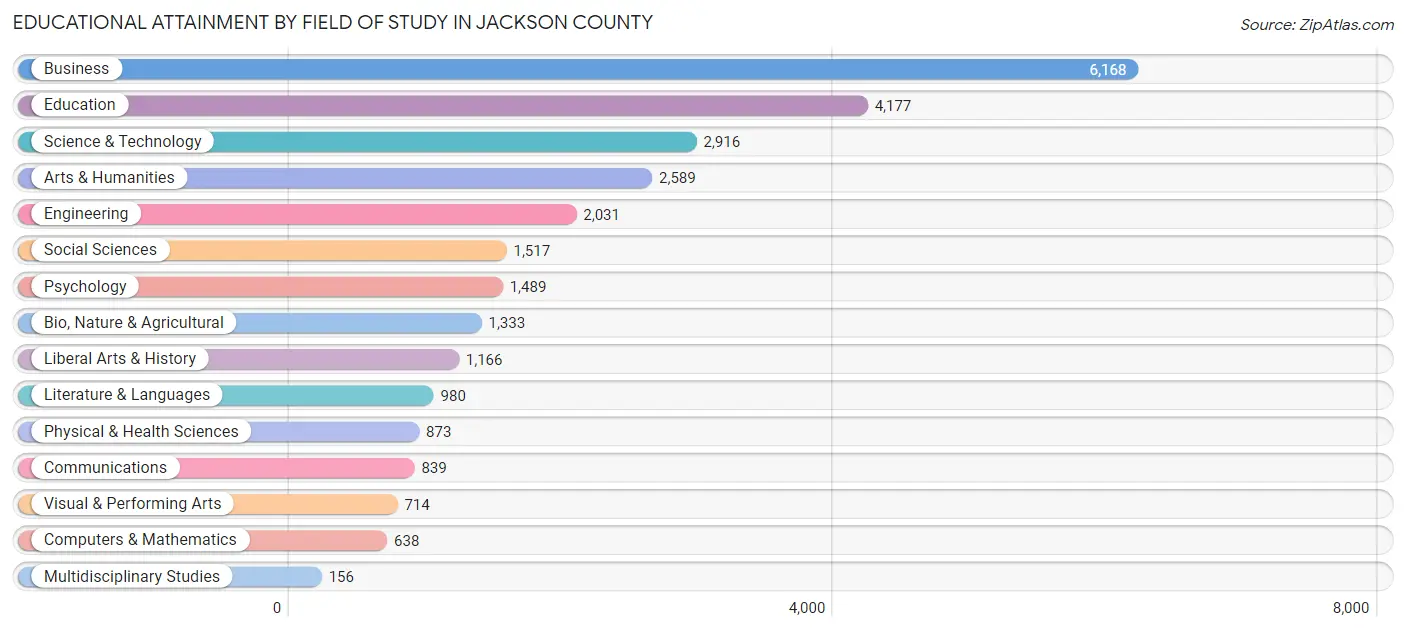
| Field of Study | # Graduates | % Graduates |
| Computers & Mathematics | 638 | 2.3% |
| Bio, Nature & Agricultural | 1,333 | 4.8% |
| Physical & Health Sciences | 873 | 3.2% |
| Psychology | 1,489 | 5.4% |
| Social Sciences | 1,517 | 5.5% |
| Engineering | 2,031 | 7.4% |
| Multidisciplinary Studies | 156 | 0.6% |
| Science & Technology | 2,916 | 10.6% |
| Business | 6,168 | 22.4% |
| Education | 4,177 | 15.1% |
| Literature & Languages | 980 | 3.5% |
| Liberal Arts & History | 1,166 | 4.2% |
| Visual & Performing Arts | 714 | 2.6% |
| Communications | 839 | 3.0% |
| Arts & Humanities | 2,589 | 9.4% |
| Total | 27,586 | 100.0% |
Transportation & Commute in Jackson County
Vehicle Availability by Sex in Jackson County
The most prevalent vehicle ownership categories in Jackson County are males with 2 vehicles (14,825, accounting for 42.3%) and females with 2 vehicles (13,347, making up 45.4%).
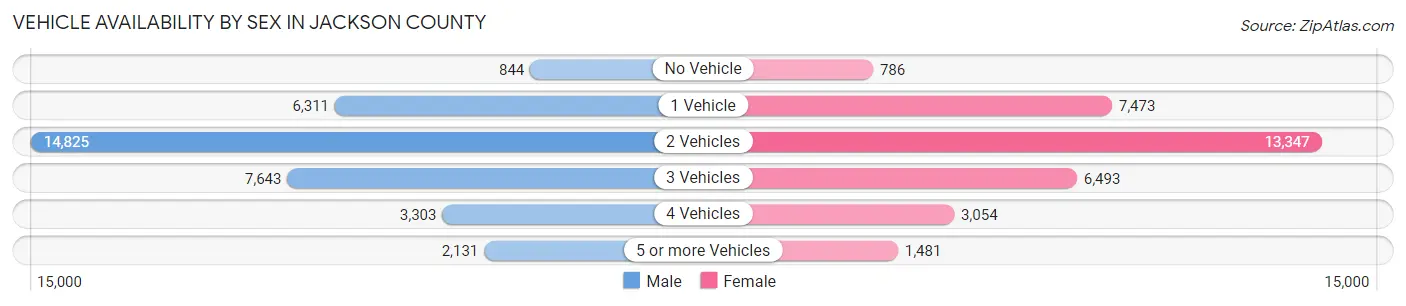
| Vehicles Available | Male | Female |
| No Vehicle | 844 (2.4%) | 786 (2.4%) |
| 1 Vehicle | 6,311 (18.0%) | 7,473 (22.9%) |
| 2 Vehicles | 14,825 (42.3%) | 13,347 (40.9%) |
| 3 Vehicles | 7,643 (21.8%) | 6,493 (19.9%) |
| 4 Vehicles | 3,303 (9.4%) | 3,054 (9.4%) |
| 5 or more Vehicles | 2,131 (6.1%) | 1,481 (4.5%) |
| Total | 35,057 (100.0%) | 32,634 (100.0%) |
Commute Time in Jackson County
The most frequently occuring commute durations in Jackson County are 10 to 14 minutes (11,589 commuters, 18.4%), 15 to 19 minutes (11,322 commuters, 18.0%), and 5 to 9 minutes (9,372 commuters, 14.9%).
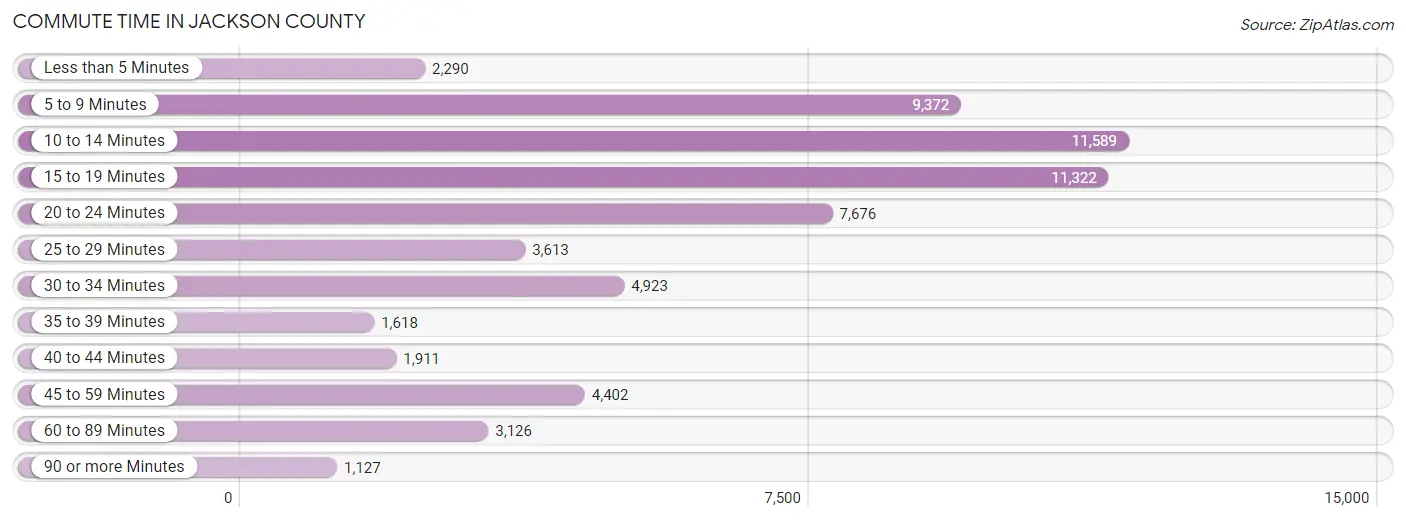
| Commute Time | # Commuters | % Commuters |
| Less than 5 Minutes | 2,290 | 3.6% |
| 5 to 9 Minutes | 9,372 | 14.9% |
| 10 to 14 Minutes | 11,589 | 18.4% |
| 15 to 19 Minutes | 11,322 | 18.0% |
| 20 to 24 Minutes | 7,676 | 12.2% |
| 25 to 29 Minutes | 3,613 | 5.7% |
| 30 to 34 Minutes | 4,923 | 7.8% |
| 35 to 39 Minutes | 1,618 | 2.6% |
| 40 to 44 Minutes | 1,911 | 3.0% |
| 45 to 59 Minutes | 4,402 | 7.0% |
| 60 to 89 Minutes | 3,126 | 5.0% |
| 90 or more Minutes | 1,127 | 1.8% |
Commute Time by Sex in Jackson County
The most common commute times in Jackson County are 15 to 19 minutes (6,175 commuters, 18.8%) for males and 10 to 14 minutes (6,082 commuters, 20.2%) for females.
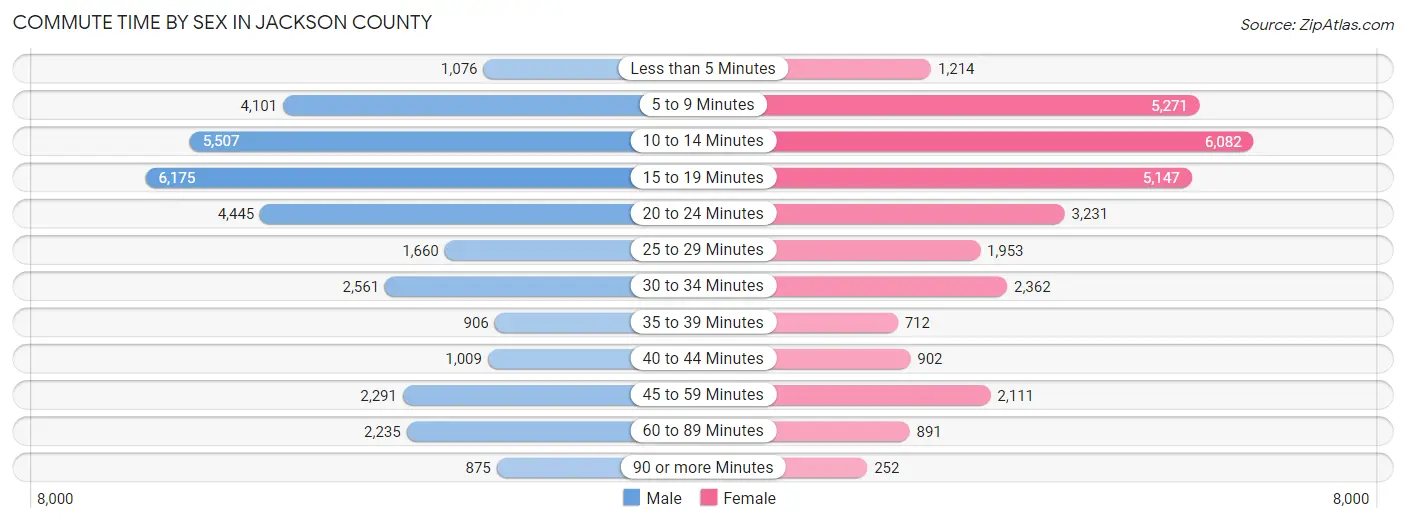
| Commute Time | Male | Female |
| Less than 5 Minutes | 1,076 (3.3%) | 1,214 (4.0%) |
| 5 to 9 Minutes | 4,101 (12.5%) | 5,271 (17.5%) |
| 10 to 14 Minutes | 5,507 (16.8%) | 6,082 (20.2%) |
| 15 to 19 Minutes | 6,175 (18.8%) | 5,147 (17.1%) |
| 20 to 24 Minutes | 4,445 (13.5%) | 3,231 (10.7%) |
| 25 to 29 Minutes | 1,660 (5.1%) | 1,953 (6.5%) |
| 30 to 34 Minutes | 2,561 (7.8%) | 2,362 (7.8%) |
| 35 to 39 Minutes | 906 (2.8%) | 712 (2.4%) |
| 40 to 44 Minutes | 1,009 (3.1%) | 902 (3.0%) |
| 45 to 59 Minutes | 2,291 (7.0%) | 2,111 (7.0%) |
| 60 to 89 Minutes | 2,235 (6.8%) | 891 (3.0%) |
| 90 or more Minutes | 875 (2.7%) | 252 (0.8%) |
Time of Departure to Work by Sex in Jackson County
The most frequent times of departure to work in Jackson County are 7:00 AM to 7:29 AM (4,015, 12.2%) for males and 7:30 AM to 7:59 AM (4,968, 16.5%) for females.
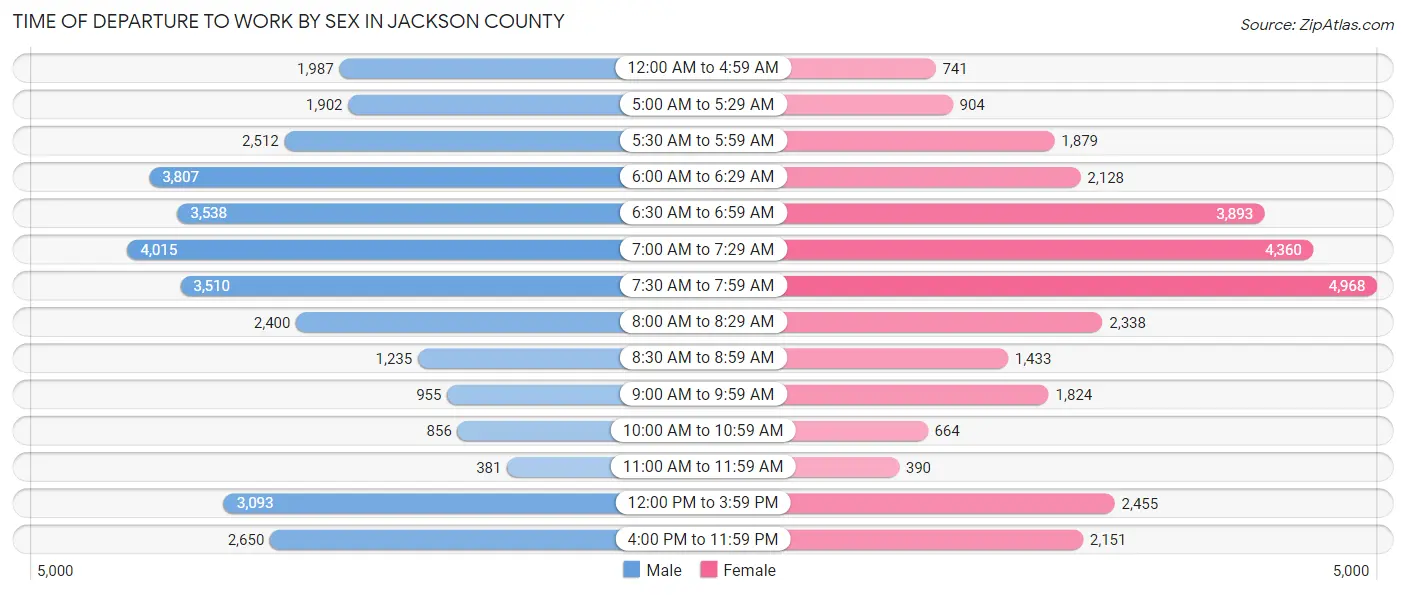
| Time of Departure | Male | Female |
| 12:00 AM to 4:59 AM | 1,987 (6.0%) | 741 (2.5%) |
| 5:00 AM to 5:29 AM | 1,902 (5.8%) | 904 (3.0%) |
| 5:30 AM to 5:59 AM | 2,512 (7.6%) | 1,879 (6.2%) |
| 6:00 AM to 6:29 AM | 3,807 (11.6%) | 2,128 (7.1%) |
| 6:30 AM to 6:59 AM | 3,538 (10.8%) | 3,893 (12.9%) |
| 7:00 AM to 7:29 AM | 4,015 (12.2%) | 4,360 (14.5%) |
| 7:30 AM to 7:59 AM | 3,510 (10.7%) | 4,968 (16.5%) |
| 8:00 AM to 8:29 AM | 2,400 (7.3%) | 2,338 (7.8%) |
| 8:30 AM to 8:59 AM | 1,235 (3.8%) | 1,433 (4.8%) |
| 9:00 AM to 9:59 AM | 955 (2.9%) | 1,824 (6.0%) |
| 10:00 AM to 10:59 AM | 856 (2.6%) | 664 (2.2%) |
| 11:00 AM to 11:59 AM | 381 (1.2%) | 390 (1.3%) |
| 12:00 PM to 3:59 PM | 3,093 (9.4%) | 2,455 (8.2%) |
| 4:00 PM to 11:59 PM | 2,650 (8.1%) | 2,151 (7.1%) |
| Total | 32,841 (100.0%) | 30,128 (100.0%) |
Housing Occupancy in Jackson County
Occupancy by Ownership in Jackson County
Of the total 62,059 dwellings in Jackson County, owner-occupied units account for 46,194 (74.4%), while renter-occupied units make up 15,865 (25.6%).
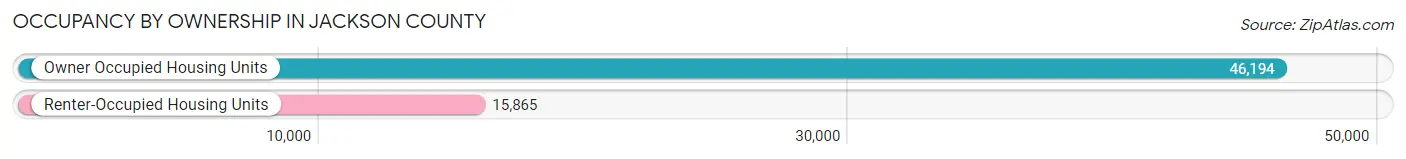
| Occupancy | # Housing Units | % Housing Units |
| Owner Occupied Housing Units | 46,194 | 74.4% |
| Renter-Occupied Housing Units | 15,865 | 25.6% |
| Total Occupied Housing Units | 62,059 | 100.0% |
Occupancy by Household Size in Jackson County
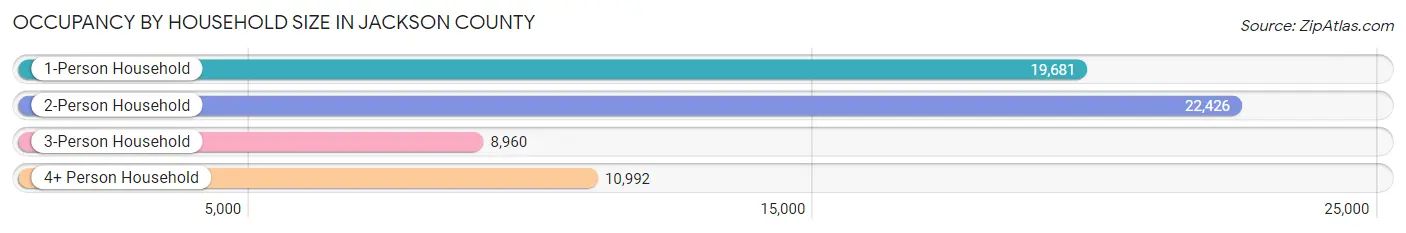
| Household Size | # Housing Units | % Housing Units |
| 1-Person Household | 19,681 | 31.7% |
| 2-Person Household | 22,426 | 36.1% |
| 3-Person Household | 8,960 | 14.4% |
| 4+ Person Household | 10,992 | 17.7% |
| Total Housing Units | 62,059 | 100.0% |
Occupancy by Ownership by Household Size in Jackson County
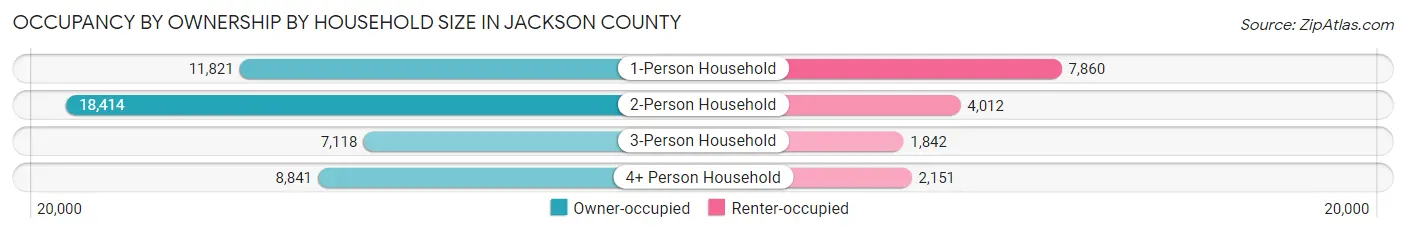
| Household Size | Owner-occupied | Renter-occupied |
| 1-Person Household | 11,821 (60.1%) | 7,860 (39.9%) |
| 2-Person Household | 18,414 (82.1%) | 4,012 (17.9%) |
| 3-Person Household | 7,118 (79.4%) | 1,842 (20.6%) |
| 4+ Person Household | 8,841 (80.4%) | 2,151 (19.6%) |
| Total Housing Units | 46,194 (74.4%) | 15,865 (25.6%) |
Occupancy by Educational Attainment in Jackson County
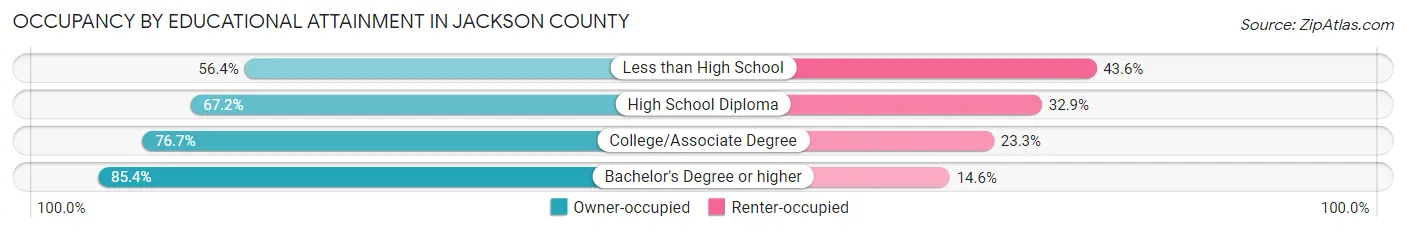
| Household Size | Owner-occupied | Renter-occupied |
| Less than High School | 2,252 (56.4%) | 1,742 (43.6%) |
| High School Diploma | 13,419 (67.1%) | 6,564 (32.9%) |
| College/Associate Degree | 17,588 (76.7%) | 5,351 (23.3%) |
| Bachelor's Degree or higher | 12,935 (85.4%) | 2,208 (14.6%) |
Occupancy by Age of Householder in Jackson County
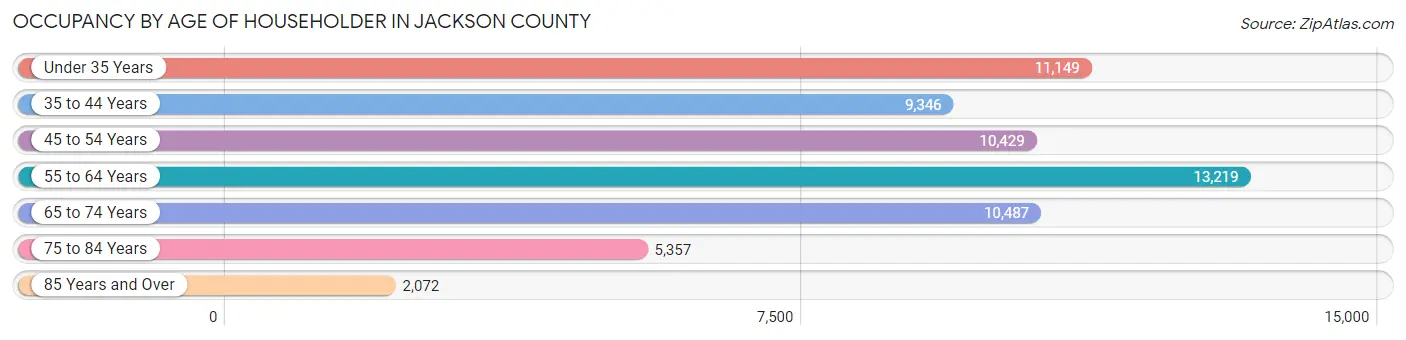
| Age Bracket | # Households | % Households |
| Under 35 Years | 11,149 | 18.0% |
| 35 to 44 Years | 9,346 | 15.1% |
| 45 to 54 Years | 10,429 | 16.8% |
| 55 to 64 Years | 13,219 | 21.3% |
| 65 to 74 Years | 10,487 | 16.9% |
| 75 to 84 Years | 5,357 | 8.6% |
| 85 Years and Over | 2,072 | 3.3% |
| Total | 62,059 | 100.0% |
Housing Finances in Jackson County
Median Income by Occupancy in Jackson County
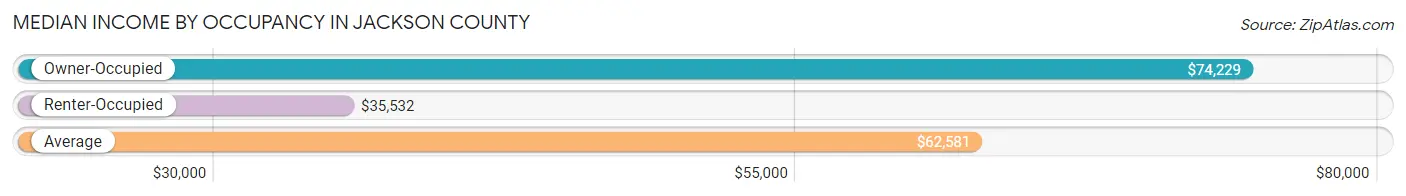
| Occupancy Type | # Households | Median Income |
| Owner-Occupied | 46,194 (74.4%) | $74,229 |
| Renter-Occupied | 15,865 (25.6%) | $35,532 |
| Average | 62,059 (100.0%) | $62,581 |
Occupancy by Householder Income Bracket in Jackson County
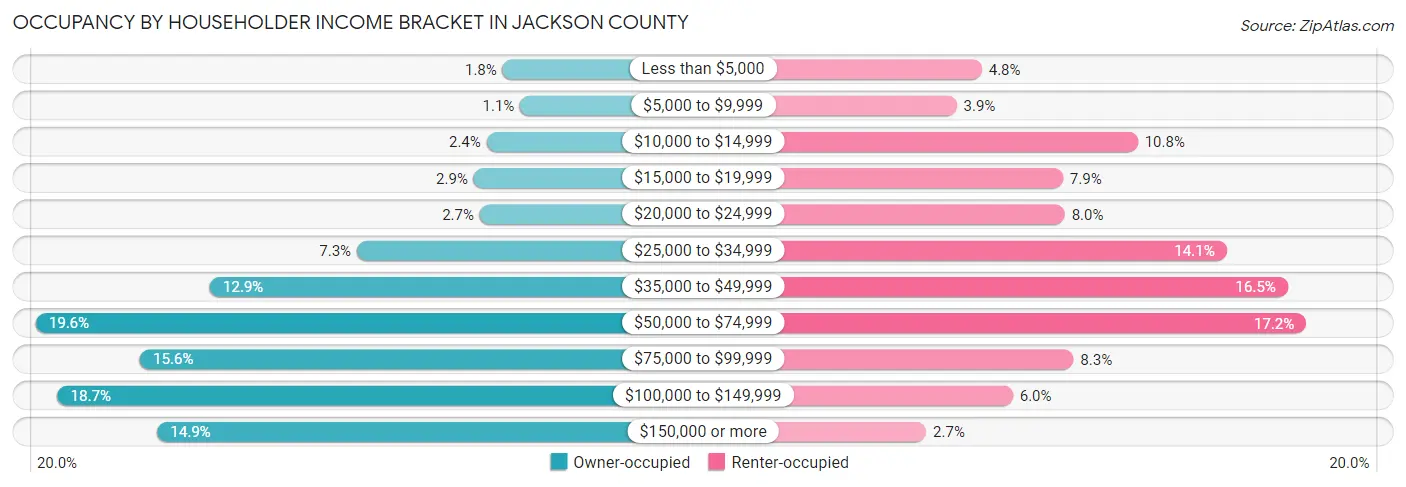
| Income Bracket | Owner-occupied | Renter-occupied |
| Less than $5,000 | 827 (1.8%) | 763 (4.8%) |
| $5,000 to $9,999 | 519 (1.1%) | 611 (3.8%) |
| $10,000 to $14,999 | 1,110 (2.4%) | 1,705 (10.7%) |
| $15,000 to $19,999 | 1,336 (2.9%) | 1,253 (7.9%) |
| $20,000 to $24,999 | 1,230 (2.7%) | 1,264 (8.0%) |
| $25,000 to $34,999 | 3,392 (7.3%) | 2,241 (14.1%) |
| $35,000 to $49,999 | 5,977 (12.9%) | 2,611 (16.5%) |
| $50,000 to $74,999 | 9,039 (19.6%) | 2,723 (17.2%) |
| $75,000 to $99,999 | 7,206 (15.6%) | 1,317 (8.3%) |
| $100,000 to $149,999 | 8,655 (18.7%) | 951 (6.0%) |
| $150,000 or more | 6,903 (14.9%) | 426 (2.7%) |
| Total | 46,194 (100.0%) | 15,865 (100.0%) |
Monthly Housing Cost Tiers in Jackson County

| Monthly Cost | Owner-occupied | Renter-occupied |
| Less than $300 | 1,949 (4.2%) | 877 (5.5%) |
| $300 to $499 | 6,974 (15.1%) | 667 (4.2%) |
| $500 to $799 | 10,797 (23.4%) | 3,862 (24.3%) |
| $800 to $999 | 6,019 (13.0%) | 3,301 (20.8%) |
| $1,000 to $1,499 | 10,826 (23.4%) | 5,334 (33.6%) |
| $1,500 to $1,999 | 5,673 (12.3%) | 567 (3.6%) |
| $2,000 to $2,499 | 2,526 (5.5%) | 133 (0.8%) |
| $2,500 to $2,999 | 839 (1.8%) | 33 (0.2%) |
| $3,000 or more | 591 (1.3%) | 104 (0.7%) |
| Total | 46,194 (100.0%) | 15,865 (100.0%) |
Physical Housing Characteristics in Jackson County
Housing Structures in Jackson County
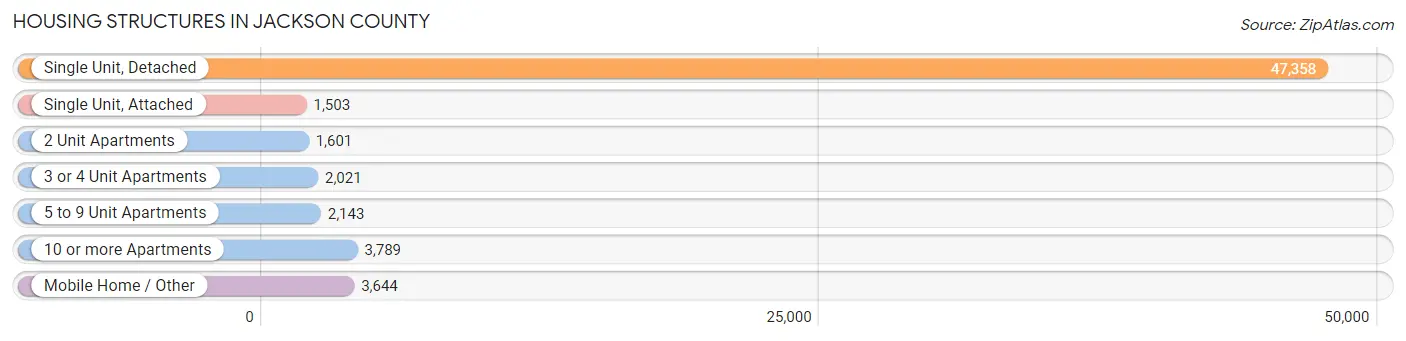
| Structure Type | # Housing Units | % Housing Units |
| Single Unit, Detached | 47,358 | 76.3% |
| Single Unit, Attached | 1,503 | 2.4% |
| 2 Unit Apartments | 1,601 | 2.6% |
| 3 or 4 Unit Apartments | 2,021 | 3.3% |
| 5 to 9 Unit Apartments | 2,143 | 3.5% |
| 10 or more Apartments | 3,789 | 6.1% |
| Mobile Home / Other | 3,644 | 5.9% |
| Total | 62,059 | 100.0% |
Housing Structures by Occupancy in Jackson County
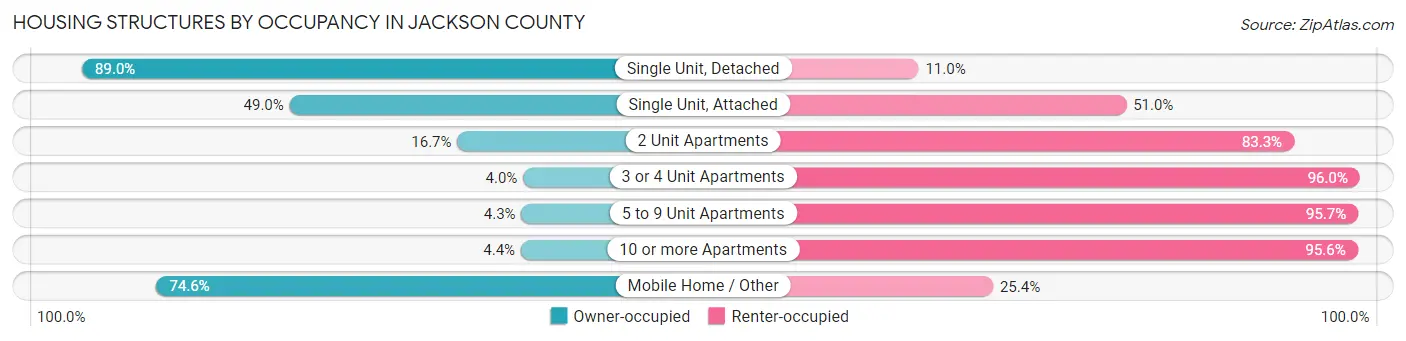
| Structure Type | Owner-occupied | Renter-occupied |
| Single Unit, Detached | 42,130 (89.0%) | 5,228 (11.0%) |
| Single Unit, Attached | 736 (49.0%) | 767 (51.0%) |
| 2 Unit Apartments | 267 (16.7%) | 1,334 (83.3%) |
| 3 or 4 Unit Apartments | 81 (4.0%) | 1,940 (96.0%) |
| 5 to 9 Unit Apartments | 93 (4.3%) | 2,050 (95.7%) |
| 10 or more Apartments | 168 (4.4%) | 3,621 (95.6%) |
| Mobile Home / Other | 2,719 (74.6%) | 925 (25.4%) |
| Total | 46,194 (74.4%) | 15,865 (25.6%) |
Housing Structures by Number of Rooms in Jackson County
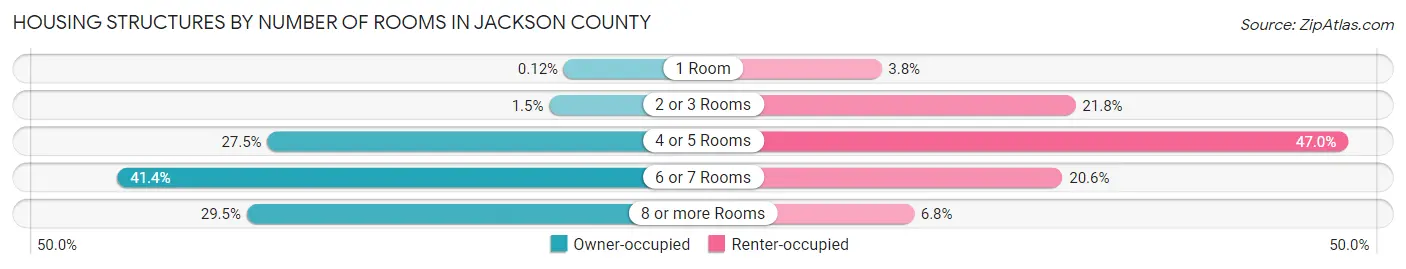
| Number of Rooms | Owner-occupied | Renter-occupied |
| 1 Room | 56 (0.1%) | 608 (3.8%) |
| 2 or 3 Rooms | 678 (1.5%) | 3,456 (21.8%) |
| 4 or 5 Rooms | 12,720 (27.5%) | 7,455 (47.0%) |
| 6 or 7 Rooms | 19,134 (41.4%) | 3,263 (20.6%) |
| 8 or more Rooms | 13,606 (29.4%) | 1,083 (6.8%) |
| Total | 46,194 (100.0%) | 15,865 (100.0%) |
Housing Structure by Heating Type in Jackson County
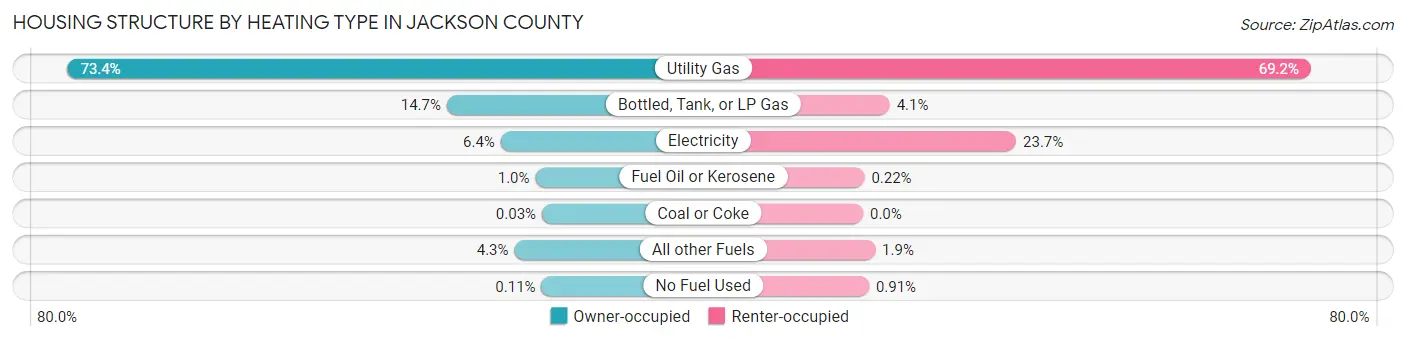
| Heating Type | Owner-occupied | Renter-occupied |
| Utility Gas | 33,892 (73.4%) | 10,980 (69.2%) |
| Bottled, Tank, or LP Gas | 6,810 (14.7%) | 656 (4.1%) |
| Electricity | 2,962 (6.4%) | 3,754 (23.7%) |
| Fuel Oil or Kerosene | 482 (1.0%) | 35 (0.2%) |
| Coal or Coke | 13 (0.0%) | 0 (0.0%) |
| All other Fuels | 1,982 (4.3%) | 296 (1.9%) |
| No Fuel Used | 53 (0.1%) | 144 (0.9%) |
| Total | 46,194 (100.0%) | 15,865 (100.0%) |
Household Vehicle Usage in Jackson County
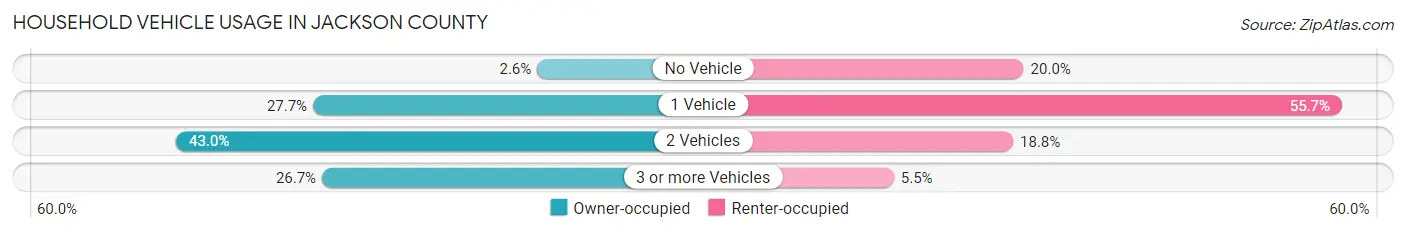
| Vehicles per Household | Owner-occupied | Renter-occupied |
| No Vehicle | 1,198 (2.6%) | 3,176 (20.0%) |
| 1 Vehicle | 12,794 (27.7%) | 8,830 (55.7%) |
| 2 Vehicles | 19,875 (43.0%) | 2,989 (18.8%) |
| 3 or more Vehicles | 12,327 (26.7%) | 870 (5.5%) |
| Total | 46,194 (100.0%) | 15,865 (100.0%) |
Real Estate & Mortgages in Jackson County
Real Estate and Mortgage Overview in Jackson County
| Characteristic | Without Mortgage | With Mortgage |
| Housing Units | 19,297 | 26,897 |
| Median Property Value | $155,300 | $173,000 |
| Median Household Income | $56,893 | $4,911 |
| Monthly Housing Costs | $529 | $565 |
| Real Estate Taxes | $2,075 | $975 |
Property Value by Mortgage Status in Jackson County

| Property Value | Without Mortgage | With Mortgage |
| Less than $50,000 | 2,459 (12.7%) | 1,489 (5.5%) |
| $50,000 to $99,999 | 3,511 (18.2%) | 4,400 (16.4%) |
| $100,000 to $299,999 | 10,353 (53.6%) | 17,037 (63.3%) |
| $300,000 to $499,999 | 2,042 (10.6%) | 3,125 (11.6%) |
| $500,000 to $749,999 | 594 (3.1%) | 454 (1.7%) |
| $750,000 to $999,999 | 153 (0.8%) | 269 (1.0%) |
| $1,000,000 or more | 185 (1.0%) | 123 (0.5%) |
| Total | 19,297 (100.0%) | 26,897 (100.0%) |
Household Income by Mortgage Status in Jackson County
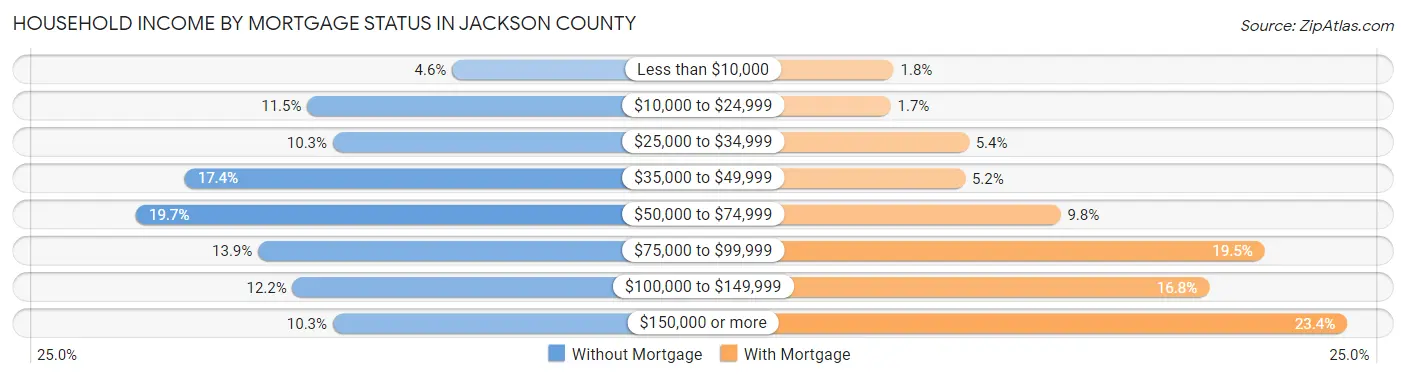
| Household Income | Without Mortgage | With Mortgage |
| Less than $10,000 | 896 (4.6%) | 486 (1.8%) |
| $10,000 to $24,999 | 2,227 (11.5%) | 450 (1.7%) |
| $25,000 to $34,999 | 1,991 (10.3%) | 1,449 (5.4%) |
| $35,000 to $49,999 | 3,351 (17.4%) | 1,401 (5.2%) |
| $50,000 to $74,999 | 3,800 (19.7%) | 2,626 (9.8%) |
| $75,000 to $99,999 | 2,678 (13.9%) | 5,239 (19.5%) |
| $100,000 to $149,999 | 2,362 (12.2%) | 4,528 (16.8%) |
| $150,000 or more | 1,992 (10.3%) | 6,293 (23.4%) |
| Total | 19,297 (100.0%) | 26,897 (100.0%) |
Property Value to Household Income Ratio in Jackson County
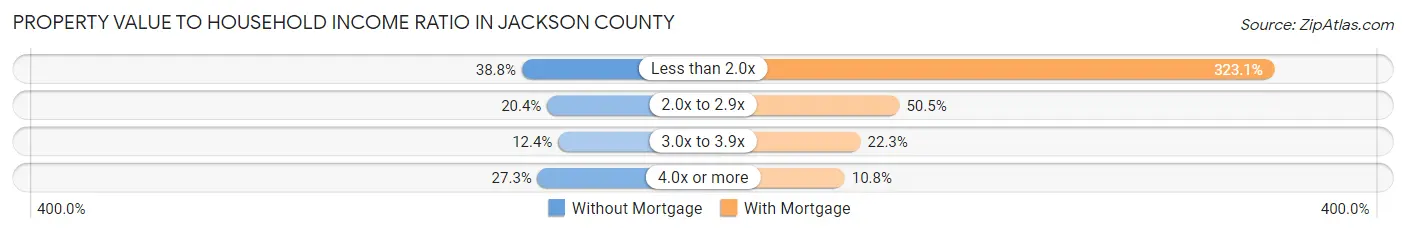
| Value-to-Income Ratio | Without Mortgage | With Mortgage |
| Less than 2.0x | 7,488 (38.8%) | 86,893 (323.1%) |
| 2.0x to 2.9x | 3,927 (20.3%) | 13,594 (50.5%) |
| 3.0x to 3.9x | 2,387 (12.4%) | 5,992 (22.3%) |
| 4.0x or more | 5,267 (27.3%) | 2,901 (10.8%) |
| Total | 19,297 (100.0%) | 26,897 (100.0%) |
Real Estate Taxes by Mortgage Status in Jackson County
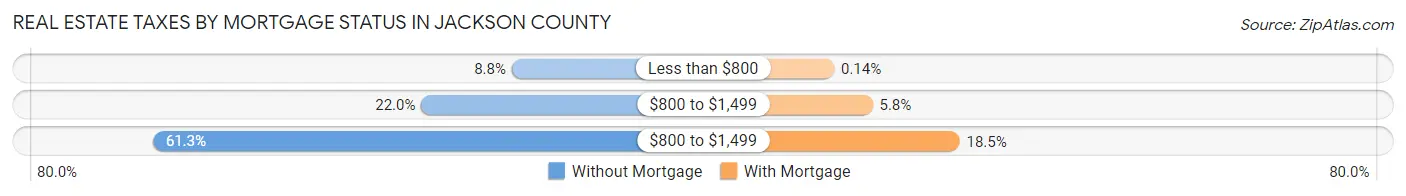
| Property Taxes | Without Mortgage | With Mortgage |
| Less than $800 | 1,700 (8.8%) | 38 (0.1%) |
| $800 to $1,499 | 4,252 (22.0%) | 1,551 (5.8%) |
| $800 to $1,499 | 11,822 (61.3%) | 4,971 (18.5%) |
| Total | 19,297 (100.0%) | 26,897 (100.0%) |
Health & Disability in Jackson County
Health Insurance Coverage by Age in Jackson County
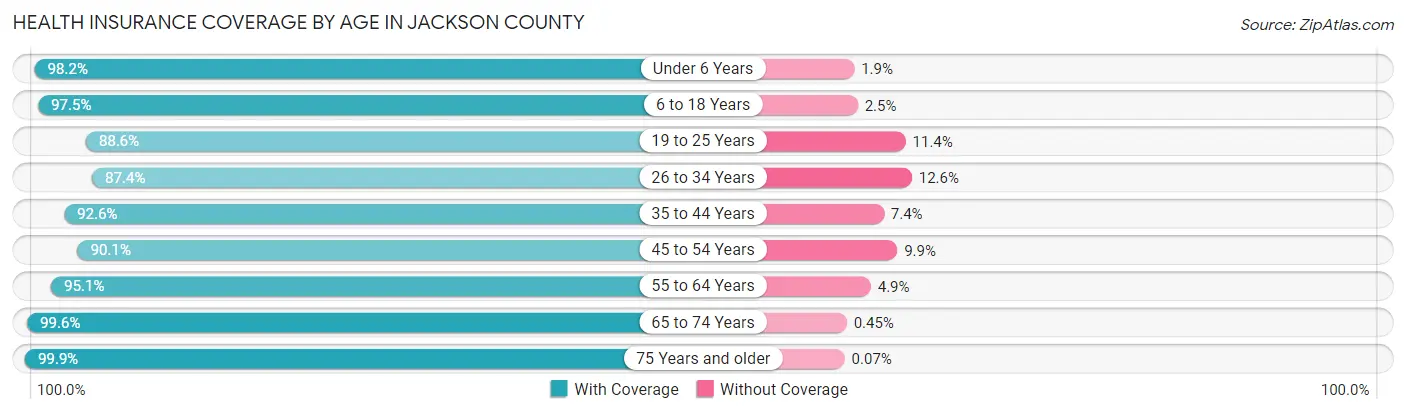
| Age Bracket | With Coverage | Without Coverage |
| Under 6 Years | 10,141 (98.2%) | 191 (1.8%) |
| 6 to 18 Years | 25,202 (97.5%) | 647 (2.5%) |
| 19 to 25 Years | 11,833 (88.6%) | 1,527 (11.4%) |
| 26 to 34 Years | 14,683 (87.4%) | 2,115 (12.6%) |
| 35 to 44 Years | 15,835 (92.6%) | 1,262 (7.4%) |
| 45 to 54 Years | 16,742 (90.1%) | 1,833 (9.9%) |
| 55 to 64 Years | 21,031 (95.1%) | 1,093 (4.9%) |
| 65 to 74 Years | 16,848 (99.6%) | 77 (0.4%) |
| 75 Years and older | 11,417 (99.9%) | 8 (0.1%) |
| Total | 143,732 (94.3%) | 8,753 (5.7%) |
Health Insurance Coverage by Citizenship Status in Jackson County
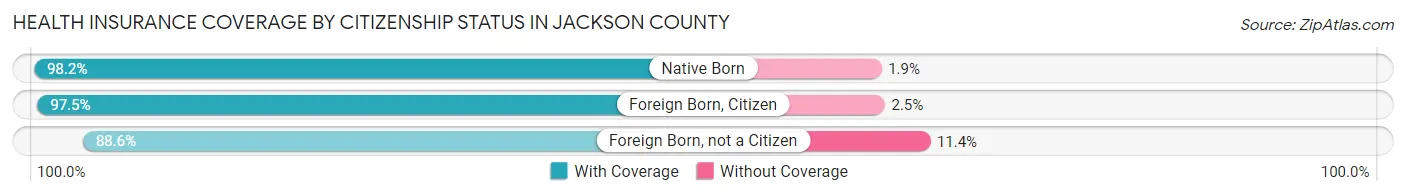
| Citizenship Status | With Coverage | Without Coverage |
| Native Born | 10,141 (98.2%) | 191 (1.8%) |
| Foreign Born, Citizen | 25,202 (97.5%) | 647 (2.5%) |
| Foreign Born, not a Citizen | 11,833 (88.6%) | 1,527 (11.4%) |
Health Insurance Coverage by Household Income in Jackson County
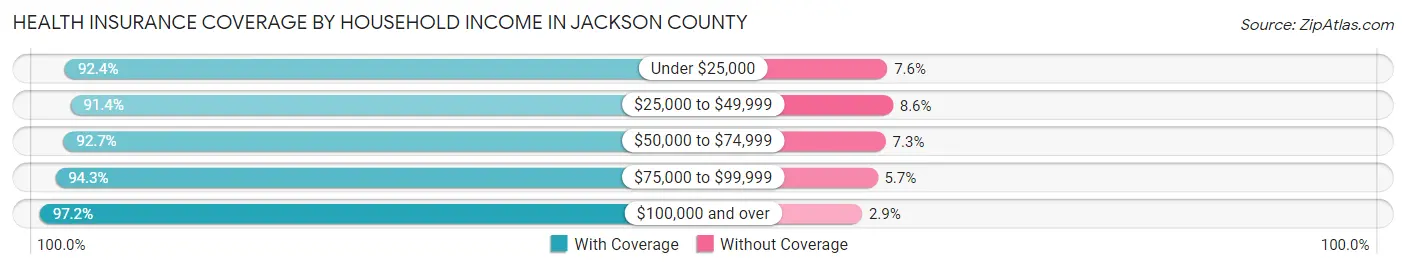
| Household Income | With Coverage | Without Coverage |
| Under $25,000 | 16,162 (92.4%) | 1,323 (7.6%) |
| $25,000 to $49,999 | 25,939 (91.4%) | 2,446 (8.6%) |
| $50,000 to $74,999 | 26,203 (92.7%) | 2,057 (7.3%) |
| $75,000 to $99,999 | 21,188 (94.3%) | 1,290 (5.7%) |
| $100,000 and over | 52,661 (97.2%) | 1,545 (2.9%) |
Public vs Private Health Insurance Coverage by Age in Jackson County
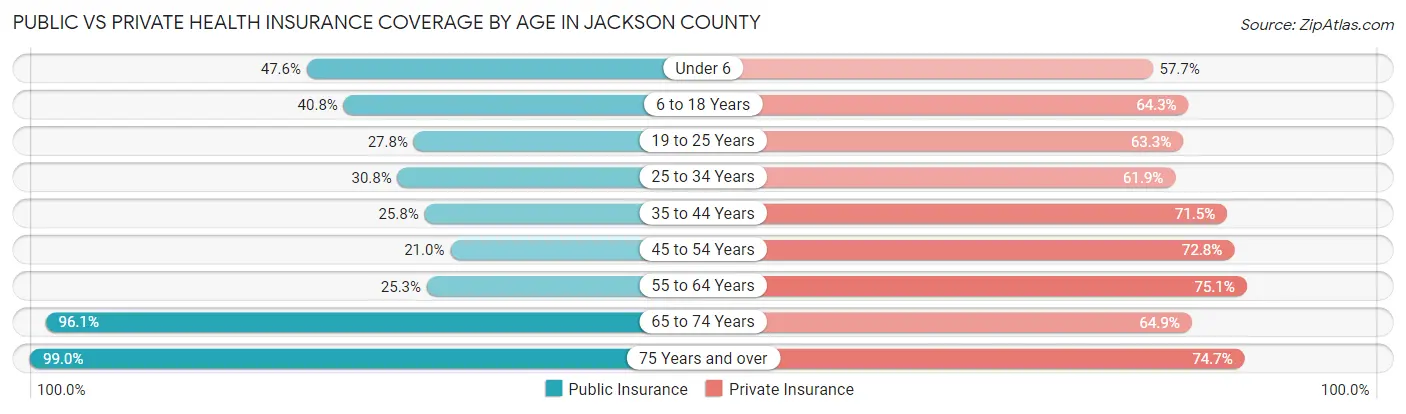
| Age Bracket | Public Insurance | Private Insurance |
| Under 6 | 4,920 (47.6%) | 5,959 (57.7%) |
| 6 to 18 Years | 10,542 (40.8%) | 16,632 (64.3%) |
| 19 to 25 Years | 3,710 (27.8%) | 8,460 (63.3%) |
| 25 to 34 Years | 5,170 (30.8%) | 10,393 (61.9%) |
| 35 to 44 Years | 4,405 (25.8%) | 12,224 (71.5%) |
| 45 to 54 Years | 3,901 (21.0%) | 13,524 (72.8%) |
| 55 to 64 Years | 5,605 (25.3%) | 16,622 (75.1%) |
| 65 to 74 Years | 16,266 (96.1%) | 10,990 (64.9%) |
| 75 Years and over | 11,309 (99.0%) | 8,539 (74.7%) |
| Total | 65,828 (43.2%) | 103,343 (67.8%) |
Disability Status by Sex by Age in Jackson County
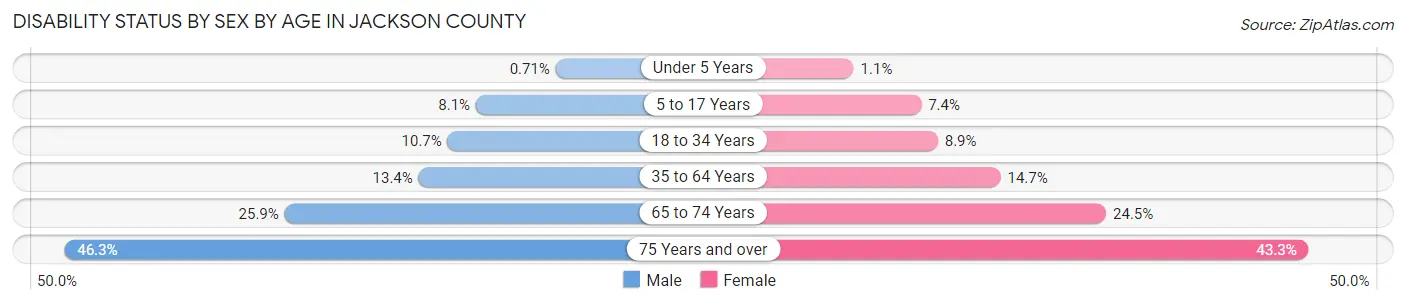
| Age Bracket | Male | Female |
| Under 5 Years | 32 (0.7%) | 47 (1.1%) |
| 5 to 17 Years | 1,053 (8.1%) | 891 (7.4%) |
| 18 to 34 Years | 1,749 (10.7%) | 1,446 (8.9%) |
| 35 to 64 Years | 3,826 (13.4%) | 4,317 (14.7%) |
| 65 to 74 Years | 2,083 (25.9%) | 2,177 (24.5%) |
| 75 Years and over | 2,225 (46.3%) | 2,868 (43.3%) |
Disability Class by Sex by Age in Jackson County
Disability Class: Hearing Difficulty
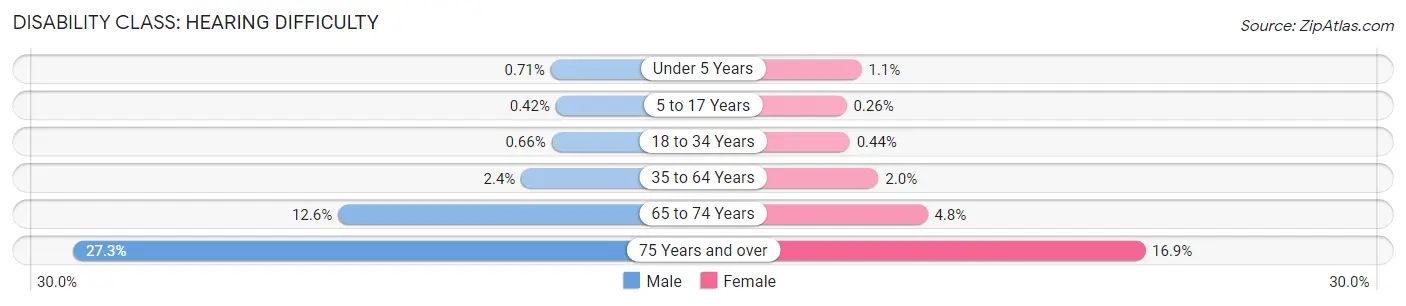
| Age Bracket | Male | Female |
| Under 5 Years | 32 (0.7%) | 47 (1.1%) |
| 5 to 17 Years | 54 (0.4%) | 32 (0.3%) |
| 18 to 34 Years | 108 (0.7%) | 72 (0.4%) |
| 35 to 64 Years | 670 (2.4%) | 597 (2.0%) |
| 65 to 74 Years | 1,010 (12.6%) | 423 (4.8%) |
| 75 Years and over | 1,312 (27.3%) | 1,118 (16.9%) |
Disability Class: Vision Difficulty
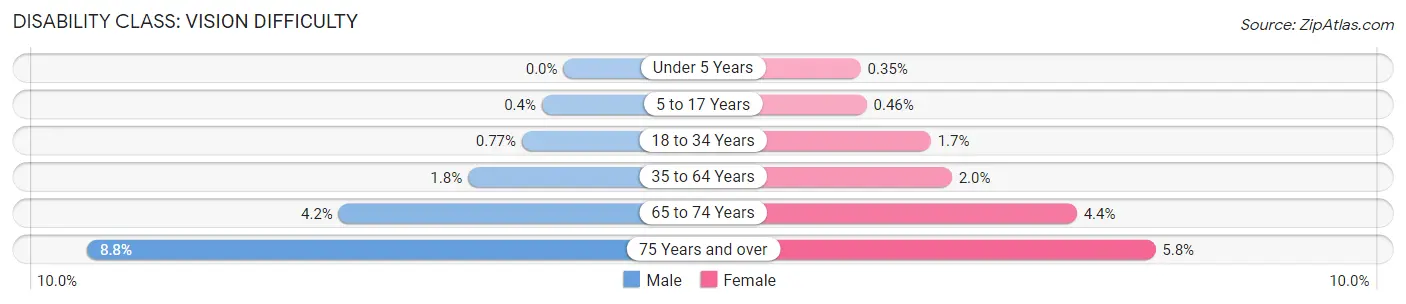
| Age Bracket | Male | Female |
| Under 5 Years | 0 (0.0%) | 15 (0.4%) |
| 5 to 17 Years | 52 (0.4%) | 56 (0.5%) |
| 18 to 34 Years | 126 (0.8%) | 267 (1.7%) |
| 35 to 64 Years | 503 (1.8%) | 597 (2.0%) |
| 65 to 74 Years | 336 (4.2%) | 387 (4.4%) |
| 75 Years and over | 425 (8.8%) | 385 (5.8%) |
Disability Class: Cognitive Difficulty
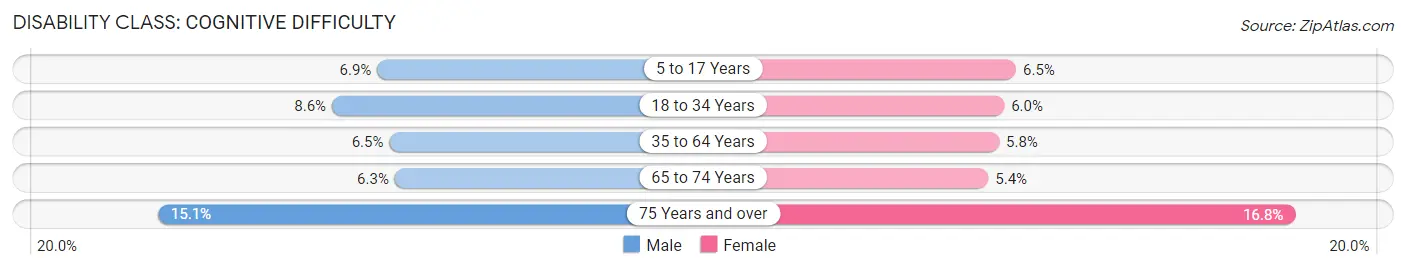
| Age Bracket | Male | Female |
| 5 to 17 Years | 898 (6.9%) | 783 (6.5%) |
| 18 to 34 Years | 1,399 (8.6%) | 978 (6.0%) |
| 35 to 64 Years | 1,841 (6.5%) | 1,711 (5.8%) |
| 65 to 74 Years | 504 (6.3%) | 483 (5.4%) |
| 75 Years and over | 723 (15.0%) | 1,114 (16.8%) |
Disability Class: Ambulatory Difficulty
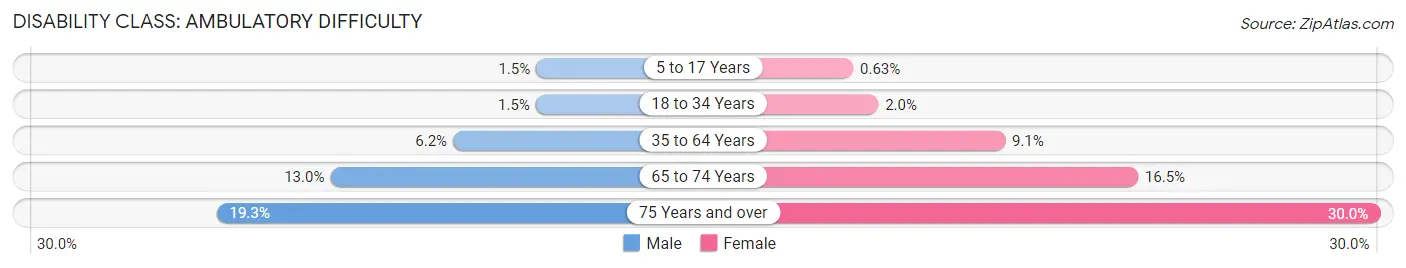
| Age Bracket | Male | Female |
| 5 to 17 Years | 198 (1.5%) | 76 (0.6%) |
| 18 to 34 Years | 251 (1.5%) | 329 (2.0%) |
| 35 to 64 Years | 1,752 (6.1%) | 2,665 (9.1%) |
| 65 to 74 Years | 1,045 (13.0%) | 1,463 (16.5%) |
| 75 Years and over | 928 (19.3%) | 1,984 (30.0%) |
Disability Class: Self-Care Difficulty
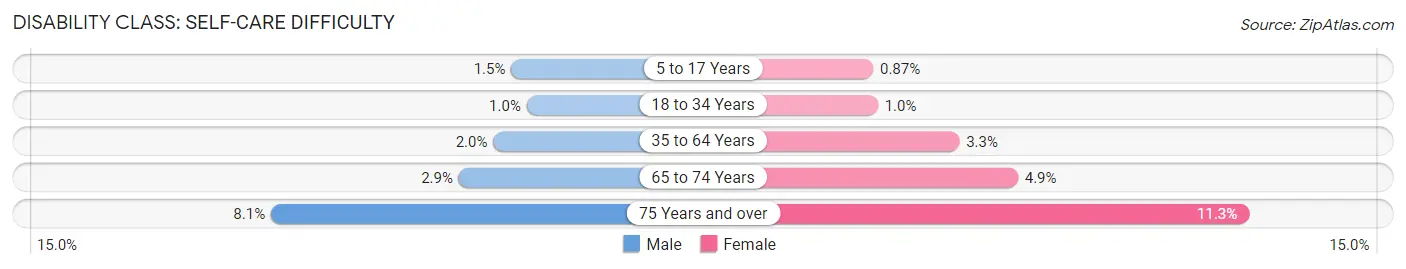
| Age Bracket | Male | Female |
| 5 to 17 Years | 188 (1.5%) | 105 (0.9%) |
| 18 to 34 Years | 166 (1.0%) | 163 (1.0%) |
| 35 to 64 Years | 555 (1.9%) | 958 (3.3%) |
| 65 to 74 Years | 234 (2.9%) | 435 (4.9%) |
| 75 Years and over | 391 (8.1%) | 751 (11.3%) |
Technology Access in Jackson County
Computing Device Access in Jackson County
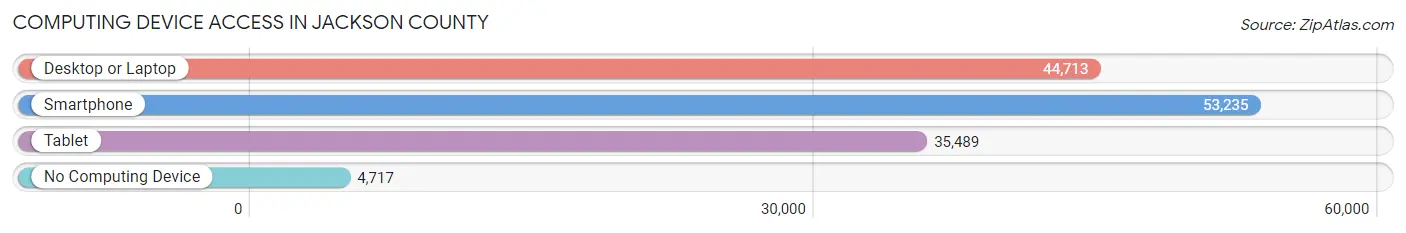
| Device Type | # Households | % Households |
| Desktop or Laptop | 44,713 | 72.1% |
| Smartphone | 53,235 | 85.8% |
| Tablet | 35,489 | 57.2% |
| No Computing Device | 4,717 | 7.6% |
| Total | 62,059 | 100.0% |
Internet Access in Jackson County

| Internet Type | # Households | % Households |
| Dial-Up Internet | 187 | 0.3% |
| Broadband Home | 40,887 | 65.9% |
| Cellular Data Only | 10,410 | 16.8% |
| Satellite Internet | 4,368 | 7.0% |
| No Internet | 6,953 | 11.2% |
| Total | 62,059 | 100.0% |
Jackson County Summary
Jackson County is located in the south-central region of Michigan, and is part of the Jackson Metropolitan Statistical Area. The county is bordered by Hillsdale County to the north, Washtenaw County to the east, Lenawee County to the south, and Calhoun County to the west. Jackson County covers an area of 577 square miles and has a population of 160,248 as of the 2020 census.
History
Jackson County was established in 1829 and was named after President Andrew Jackson. The county was originally part of the Michigan Territory, and was one of the first counties to be organized in the state. The county seat is Jackson, which was founded in 1829 and is the largest city in the county.
The county was home to several Native American tribes, including the Potawatomi, Ojibwe, and Ottawa. The first European settlers arrived in the area in the early 19th century, and the county was officially organized in 1829.
The county was an important center of the Underground Railroad, and many escaped slaves found refuge in the county. The county was also an important center of the lumber industry, and many of the county’s towns and cities were founded as lumber towns.
Geography
Jackson County is located in the south-central region of Michigan, and is part of the Jackson Metropolitan Statistical Area. The county is bordered by Hillsdale County to the north, Washtenaw County to the east, Lenawee County to the south, and Calhoun County to the west.
The county is mostly flat, with some rolling hills in the northern and western parts of the county. The Grand River runs through the county, and there are several lakes and ponds scattered throughout the county. The county is home to several state parks, including the Waterloo Recreation Area, the Michigan International Speedway, and the Cascades Falls State Park.
Economy
Jackson County’s economy is largely based on manufacturing, with several major employers in the county. The largest employers in the county include Jackson National Life Insurance Company, Consumers Energy, and the Jackson County Medical Center.
The county is also home to several colleges and universities, including Jackson College, Spring Arbor University, and Albion College. The county is also home to several tourist attractions, including the Michigan International Speedway, the Cascades Falls State Park, and the Ella Sharp Museum.
Demographics
As of the 2020 census, Jackson County had a population of 160,248. The racial makeup of the county was 79.2% White, 14.2% Black or African American, 0.5% Native American, 2.2% Asian, 0.1% Pacific Islander, 1.7% from other races, and 2.2% from two or more races. Hispanic or Latino of any race were 4.3% of the population.
The median income for a household in the county was $45,945, and the median income for a family was $54,945. The per capita income for the county was $22,945. About 11.2% of the population was below the poverty line.
Jackson County is served by several school districts, including the Jackson Public Schools, the Northwest Community Schools, and the Springport Public Schools. The county is also home to several private schools, including the Jackson Christian School and the Jackson Catholic Schools.
Common Questions
What is the Total Population of Jackson County?
Total Population of Jackson County is 160,637.
What is the Total Male Population of Jackson County?
Total Male Population of Jackson County is 82,776.
What is the Total Female Population of Jackson County?
Total Female Population of Jackson County is 77,861.
What is the Ratio of Males per 100 Females in Jackson County?
There are 106.31 Males per 100 Females in Jackson County.
What is the Ratio of Females per 100 Males in Jackson County?
There are 94.06 Females per 100 Males in Jackson County.
What is the Median Population Age in Jackson County?
Median Population Age in Jackson County is 41.1 Years.
What is the Average Family Size in Jackson County
Average Family Size in Jackson County is 3.1 People.
What is the Average Household Size in Jackson County
Average Household Size in Jackson County is 2.4 People.
What is Per Capita Income in Jackson County?
Per Capita income in Jackson County is $33,065.
What is the Median Family Income in Jackson County?
Median Family Income in Jackson County is $79,374.
What is the Median Household income in Jackson County?
Median Household Income in Jackson County is $62,581.
What is Income or Wage Gap in Jackson County?
Income or Wage Gap in Jackson County is 29.1%.
Women in Jackson County earn 70.9 cents for every dollar earned by a man.
What is Family Income Deficit in Jackson County?
Family Income Deficit in Jackson County is $10,005.
Families that are below poverty line in Jackson County earn $10,005 less on average than the poverty threshold level.
What is Inequality or Gini Index in Jackson County?
Inequality or Gini Index in Jackson County is 0.45.
How Large is the Labor Force in Jackson County?
There are 74,116 People in the Labor Forcein in Jackson County.
What is the Percentage of People in the Labor Force in Jackson County?
56.7% of People are in the Labor Force in Jackson County.
What is the Unemployment Rate in Jackson County?
Unemployment Rate in Jackson County is 6.3%.