Iosco County, MI
Iosco County Map
Iosco County Overview
25,319
TOTAL POPULATION
12,647
MALE POPULATION
12,672
FEMALE POPULATION
99.80
MALES / 100 FEMALES
100.20
FEMALES / 100 MALES
53.1
MEDIAN AGE
2.9
AVG FAMILY SIZE
2.2
AVG HOUSEHOLD SIZE
$28,301
PER CAPITA INCOME
$58,884
AVG FAMILY INCOME
$46,224
AVG HOUSEHOLD INCOME
35.6%
WAGE / INCOME GAP [ % ]
64.4¢/ $1
WAGE / INCOME GAP [ $ ]
$8,564
FAMILY INCOME DEFICIT
0.43
INEQUALITY / GINI INDEX
10,144
LABOR FORCE [ PEOPLE ]
46.9%
PERCENT IN LABOR FORCE
7.4%
UNEMPLOYMENT RATE
Iosco County Area Codes
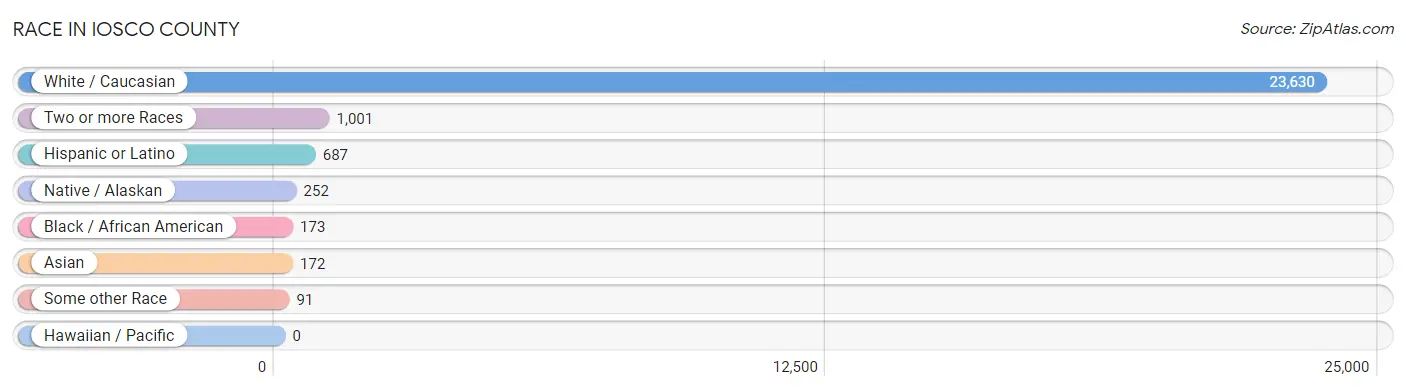
Race in Iosco County
The most populous races in Iosco County are White / Caucasian (23,630 | 93.3%), Two or more Races (1,001 | 4.0%), and Hispanic or Latino (687 | 2.7%).
| Race | # Population | % Population |
| Asian | 172 | 0.7% |
| Black / African American | 173 | 0.7% |
| Hawaiian / Pacific | 0 | 0.0% |
| Hispanic or Latino | 687 | 2.7% |
| Native / Alaskan | 252 | 1.0% |
| White / Caucasian | 23,630 | 93.3% |
| Two or more Races | 1,001 | 4.0% |
| Some other Race | 91 | 0.4% |
| Total | 25,319 | 100.0% |
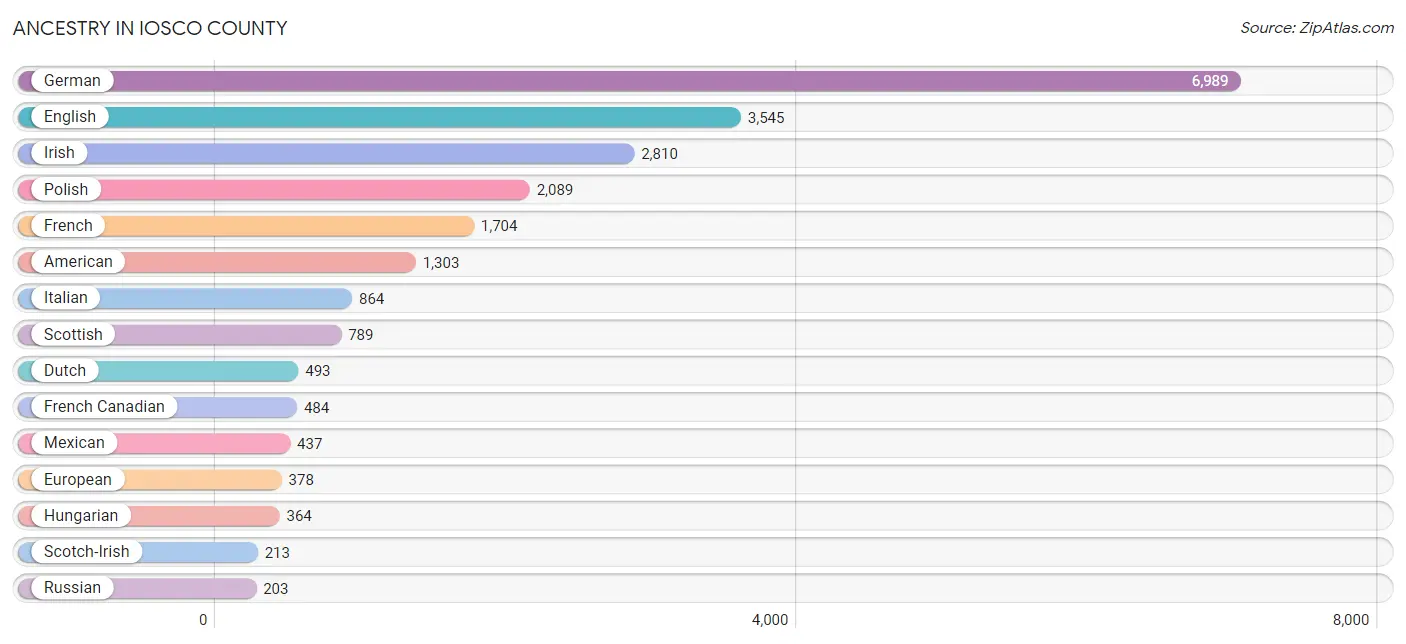
Ancestry in Iosco County
The most populous ancestries reported in Iosco County are German (6,989 | 27.6%), English (3,545 | 14.0%), Irish (2,810 | 11.1%), Polish (2,089 | 8.3%), and French (1,704 | 6.7%), together accounting for 67.7% of all Iosco County residents.
| Ancestry | # Population | % Population |
| American | 1,303 | 5.1% |
| Arab | 74 | 0.3% |
| Assyrian / Chaldean / Syriac | 52 | 0.2% |
| Austrian | 14 | 0.1% |
| Belgian | 145 | 0.6% |
| Bhutanese | 47 | 0.2% |
| Blackfeet | 47 | 0.2% |
| British | 124 | 0.5% |
| Burmese | 48 | 0.2% |
| Canadian | 156 | 0.6% |
| Central American | 49 | 0.2% |
| Cherokee | 80 | 0.3% |
| Chinese | 1 | 0.0% |
| Chippewa | 23 | 0.1% |
| Colombian | 30 | 0.1% |
| Comanche | 3 | 0.0% |
| Cree | 10 | 0.0% |
| Creek | 2 | 0.0% |
| Croatian | 40 | 0.2% |
| Cuban | 11 | 0.0% |
| Czech | 53 | 0.2% |
| Czechoslovakian | 63 | 0.3% |
| Danish | 27 | 0.1% |
| Dutch | 493 | 1.9% |
| Eastern European | 14 | 0.1% |
| Egyptian | 35 | 0.1% |
| English | 3,545 | 14.0% |
| Estonian | 14 | 0.1% |
| European | 378 | 1.5% |
| Finnish | 188 | 0.7% |
| French | 1,704 | 6.7% |
| French American Indian | 3 | 0.0% |
| French Canadian | 484 | 1.9% |
| German | 6,989 | 27.6% |
| Greek | 35 | 0.1% |
| Guamanian / Chamorro | 10 | 0.0% |
| Guatemalan | 18 | 0.1% |
| Haitian | 10 | 0.0% |
| Hungarian | 364 | 1.4% |
| Indian (Asian) | 18 | 0.1% |
| Irish | 2,810 | 11.1% |
| Italian | 864 | 3.4% |
| Jamaican | 9 | 0.0% |
| Korean | 59 | 0.2% |
| Lebanese | 13 | 0.1% |
| Lithuanian | 30 | 0.1% |
| Maltese | 2 | 0.0% |
| Mexican | 437 | 1.7% |
| Mexican American Indian | 13 | 0.1% |
| Native Hawaiian | 1 | 0.0% |
| Nigerian | 13 | 0.1% |
| Northern European | 34 | 0.1% |
| Norwegian | 108 | 0.4% |
| Ottawa | 42 | 0.2% |
| Pakistani | 24 | 0.1% |
| Pennsylvania German | 15 | 0.1% |
| Peruvian | 21 | 0.1% |
| Polish | 2,089 | 8.3% |
| Portuguese | 23 | 0.1% |
| Potawatomi | 10 | 0.0% |
| Puerto Rican | 61 | 0.2% |
| Romanian | 97 | 0.4% |
| Russian | 203 | 0.8% |
| Salvadoran | 31 | 0.1% |
| Scandinavian | 41 | 0.2% |
| Scotch-Irish | 213 | 0.8% |
| Scottish | 789 | 3.1% |
| Serbian | 10 | 0.0% |
| Sioux | 22 | 0.1% |
| Slavic | 4 | 0.0% |
| Slovak | 93 | 0.4% |
| South American | 51 | 0.2% |
| Spaniard | 7 | 0.0% |
| Spanish | 21 | 0.1% |
| Subsaharan African | 14 | 0.1% |
| Swedish | 195 | 0.8% |
| Swiss | 79 | 0.3% |
| Syrian | 11 | 0.0% |
| Ukrainian | 65 | 0.3% |
| Vietnamese | 63 | 0.3% |
| Welsh | 171 | 0.7% |
| Yugoslavian | 9 | 0.0% | View All 82 Rows |
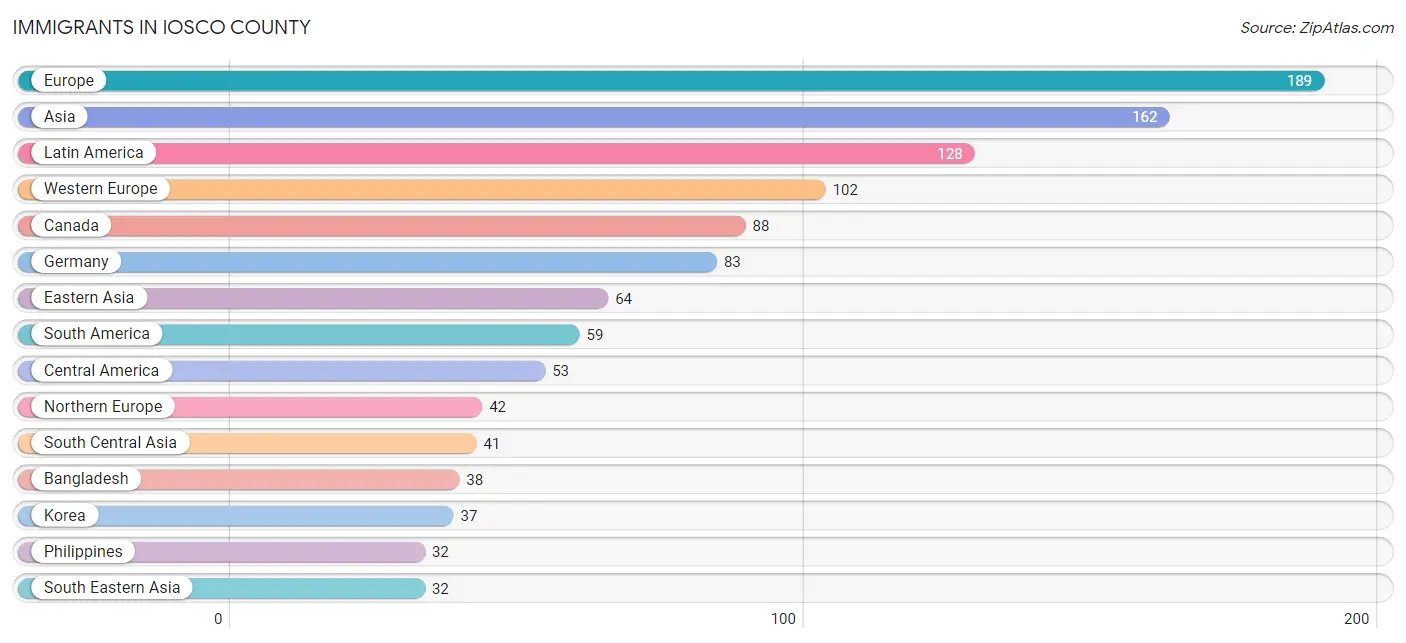
Immigrants in Iosco County
The most numerous immigrant groups reported in Iosco County came from Europe (189 | 0.7%), Asia (162 | 0.6%), Latin America (128 | 0.5%), Western Europe (102 | 0.4%), and Canada (88 | 0.4%), together accounting for 2.6% of all Iosco County residents.
| Immigration Origin | # Population | % Population |
| Africa | 5 | 0.0% |
| Argentina | 3 | 0.0% |
| Asia | 162 | 0.6% |
| Bangladesh | 38 | 0.2% |
| Canada | 88 | 0.4% |
| Caribbean | 16 | 0.1% |
| Central America | 53 | 0.2% |
| China | 9 | 0.0% |
| Colombia | 29 | 0.1% |
| Cuba | 7 | 0.0% |
| Eastern Africa | 1 | 0.0% |
| Eastern Asia | 64 | 0.3% |
| Eastern Europe | 22 | 0.1% |
| El Salvador | 31 | 0.1% |
| England | 18 | 0.1% |
| Europe | 189 | 0.7% |
| France | 8 | 0.0% |
| Germany | 83 | 0.3% |
| Iraq | 19 | 0.1% |
| Ireland | 4 | 0.0% |
| Italy | 23 | 0.1% |
| Jamaica | 9 | 0.0% |
| Japan | 18 | 0.1% |
| Kazakhstan | 3 | 0.0% |
| Kenya | 1 | 0.0% |
| Korea | 37 | 0.2% |
| Latin America | 128 | 0.5% |
| Mexico | 22 | 0.1% |
| Netherlands | 11 | 0.0% |
| Northern Africa | 4 | 0.0% |
| Northern Europe | 42 | 0.2% |
| Peru | 27 | 0.1% |
| Philippines | 32 | 0.1% |
| Poland | 15 | 0.1% |
| Romania | 7 | 0.0% |
| Scotland | 14 | 0.1% |
| South America | 59 | 0.2% |
| South Central Asia | 41 | 0.2% |
| South Eastern Asia | 32 | 0.1% |
| Southern Europe | 23 | 0.1% |
| Western Asia | 25 | 0.1% |
| Western Europe | 102 | 0.4% | View All 42 Rows |
Sex and Age in Iosco County
Sex and Age in Iosco County
The most populous age groups in Iosco County are 65 to 69 Years (1,334 | 10.5%) for men and 60 to 64 Years (1,247 | 9.8%) for women.

| Age Bracket | Male | Female |
| Under 5 Years | 639 (5.1%) | 526 (4.2%) |
| 5 to 9 Years | 497 (3.9%) | 638 (5.0%) |
| 10 to 14 Years | 593 (4.7%) | 545 (4.3%) |
| 15 to 19 Years | 601 (4.8%) | 545 (4.3%) |
| 20 to 24 Years | 630 (5.0%) | 487 (3.8%) |
| 25 to 29 Years | 649 (5.1%) | 554 (4.4%) |
| 30 to 34 Years | 570 (4.5%) | 645 (5.1%) |
| 35 to 39 Years | 647 (5.1%) | 640 (5.1%) |
| 40 to 44 Years | 587 (4.6%) | 454 (3.6%) |
| 45 to 49 Years | 565 (4.5%) | 648 (5.1%) |
| 50 to 54 Years | 792 (6.3%) | 780 (6.2%) |
| 55 to 59 Years | 1,004 (7.9%) | 1,045 (8.3%) |
| 60 to 64 Years | 1,200 (9.5%) | 1,247 (9.8%) |
| 65 to 69 Years | 1,334 (10.5%) | 1,098 (8.7%) |
| 70 to 74 Years | 923 (7.3%) | 1,098 (8.7%) |
| 75 to 79 Years | 701 (5.5%) | 769 (6.1%) |
| 80 to 84 Years | 427 (3.4%) | 484 (3.8%) |
| 85 Years and over | 288 (2.3%) | 469 (3.7%) |
| Total | 12,647 (100.0%) | 12,672 (100.0%) |
Families and Households in Iosco County
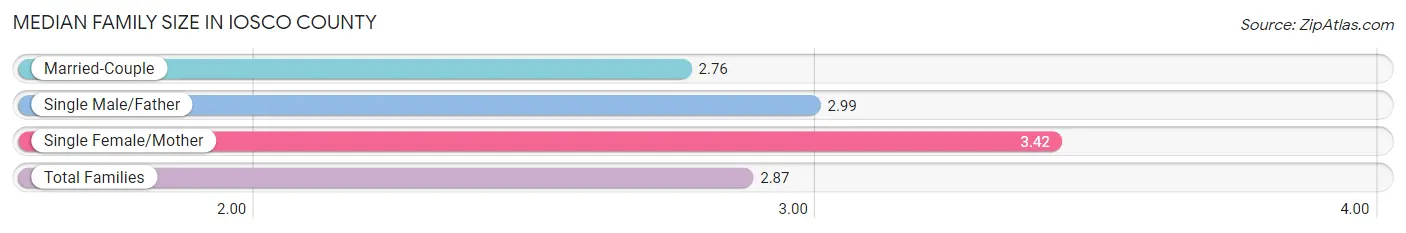
Median Family Size in Iosco County
The median family size in Iosco County is 2.87 persons per family, with single female/mother families (944 | 14.8%) accounting for the largest median family size of 3.42 persons per family. On the other hand, married-couple families (5,018 | 78.7%) represent the smallest median family size with 2.76 persons per family.
| Family Type | # Families | Family Size |
| Married-Couple | 5,018 (78.7%) | 2.76 |
| Single Male/Father | 416 (6.5%) | 2.99 |
| Single Female/Mother | 944 (14.8%) | 3.42 |
| Total Families | 6,378 (100.0%) | 2.87 |
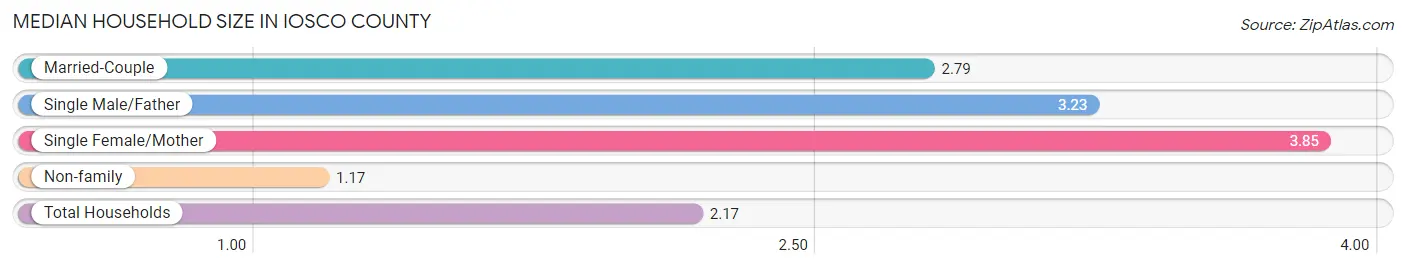
Median Household Size in Iosco County
The median household size in Iosco County is 2.17 persons per household, with single female/mother households (944 | 8.2%) accounting for the largest median household size of 3.85 persons per household. non-family households (5,180 | 44.8%) represent the smallest median household size with 1.17 persons per household.
| Household Type | # Households | Household Size |
| Married-Couple | 5,018 (43.4%) | 2.79 |
| Single Male/Father | 416 (3.6%) | 3.23 |
| Single Female/Mother | 944 (8.2%) | 3.85 |
| Non-family | 5,180 (44.8%) | 1.17 |
| Total Households | 11,558 (100.0%) | 2.17 |
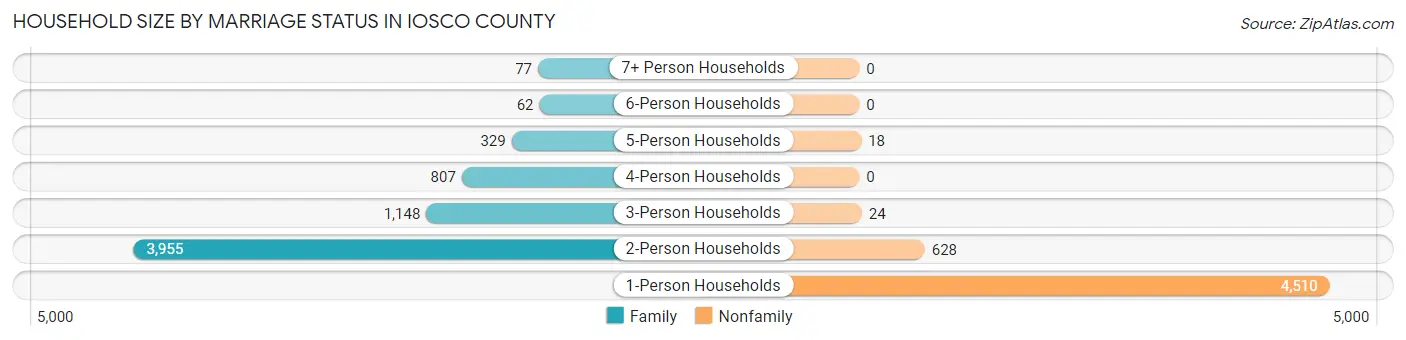
Household Size by Marriage Status in Iosco County
Out of a total of 11,558 households in Iosco County, 6,378 (55.2%) are family households, while 5,180 (44.8%) are nonfamily households. The most numerous type of family households are 2-person households, comprising 3,955, and the most common type of nonfamily households are 1-person households, comprising 4,510.
| Household Size | Family Households | Nonfamily Households |
| 1-Person Households | - | 4,510 (39.0%) |
| 2-Person Households | 3,955 (34.2%) | 628 (5.4%) |
| 3-Person Households | 1,148 (9.9%) | 24 (0.2%) |
| 4-Person Households | 807 (7.0%) | 0 (0.0%) |
| 5-Person Households | 329 (2.9%) | 18 (0.2%) |
| 6-Person Households | 62 (0.5%) | 0 (0.0%) |
| 7+ Person Households | 77 (0.7%) | 0 (0.0%) |
| Total | 6,378 (55.2%) | 5,180 (44.8%) |
Female Fertility in Iosco County
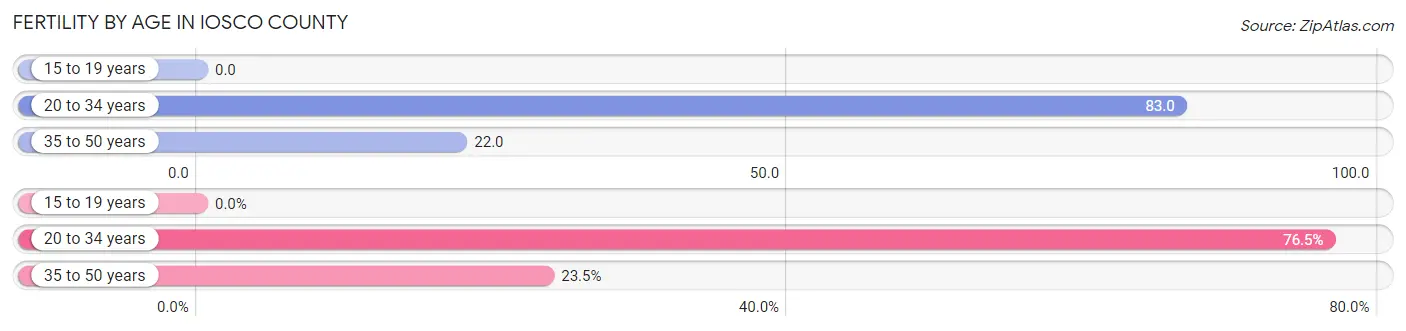
Fertility by Age in Iosco County
Average fertility rate in Iosco County is 44.0 births per 1,000 women. Women in the age bracket of 20 to 34 years have the highest fertility rate with 83.0 births per 1,000 women. Women in the age bracket of 20 to 34 years acount for 76.5% of all women with births.
| Age Bracket | Women with Births | Births / 1,000 Women |
| 15 to 19 years | 0 (0.0%) | 0.0 |
| 20 to 34 years | 140 (76.5%) | 83.0 |
| 35 to 50 years | 43 (23.5%) | 22.0 |
| Total | 183 (100.0%) | 44.0 |
Fertility by Age by Marriage Status in Iosco County
56.8% of women with births (183) in Iosco County are married. The highest percentage of unmarried women with births falls into 20 to 34 years age bracket with 52.9% of them unmarried at the time of birth, while the lowest percentage of unmarried women with births belong to 35 to 50 years age bracket with 11.6% of them unmarried.
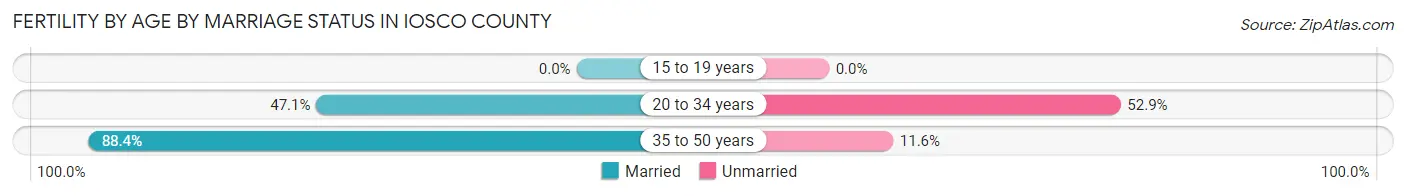
| Age Bracket | Married | Unmarried |
| 15 to 19 years | 0 (0.0%) | 0 (0.0%) |
| 20 to 34 years | 66 (47.1%) | 74 (52.9%) |
| 35 to 50 years | 38 (88.4%) | 5 (11.6%) |
| Total | 104 (56.8%) | 79 (43.2%) |
Fertility by Education in Iosco County
Average fertility rate in Iosco County is 44.0 births per 1,000 women. Women with the education attainment of graduate degree have the highest fertility rate of 88.0 births per 1,000 women, while women with the education attainment of less than high school have the lowest fertility at 16.0 births per 1,000 women. Women with the education attainment of high school diploma represent 46.5% of all women with births.
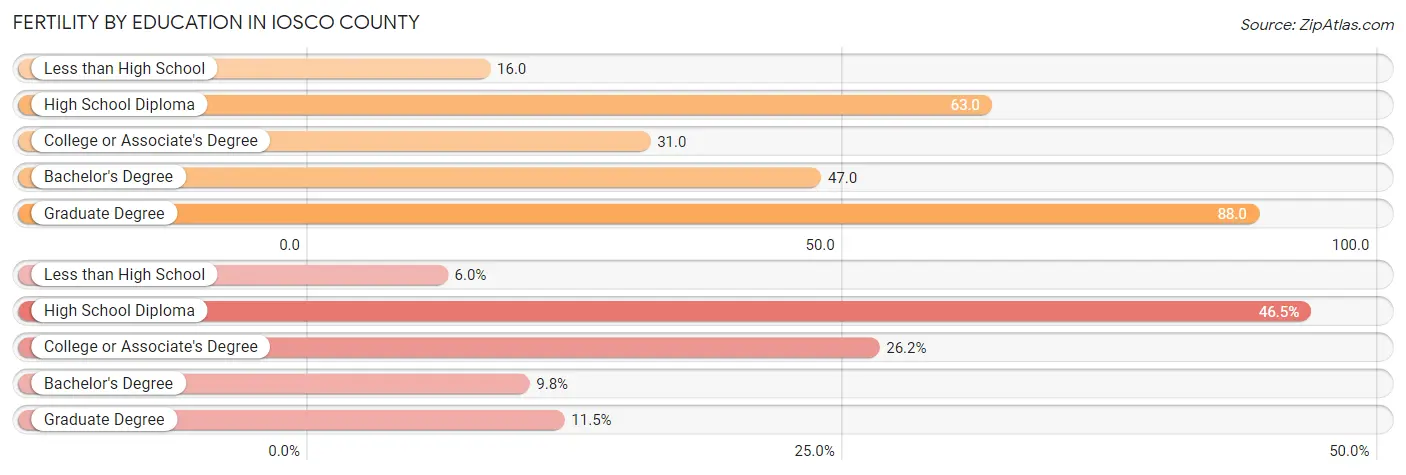
| Educational Attainment | Women with Births | Births / 1,000 Women |
| Less than High School | 11 (6.0%) | 16.0 |
| High School Diploma | 85 (46.5%) | 63.0 |
| College or Associate's Degree | 48 (26.2%) | 31.0 |
| Bachelor's Degree | 18 (9.8%) | 47.0 |
| Graduate Degree | 21 (11.5%) | 88.0 |
| Total | 183 (100.0%) | 44.0 |
Fertility by Education by Marriage Status in Iosco County
43.2% of women with births in Iosco County are unmarried. Women with the educational attainment of college or associate's degree are most likely to be married with 83.3% of them married at childbirth, while women with the educational attainment of high school diploma are least likely to be married with 65.9% of them unmarried at childbirth.
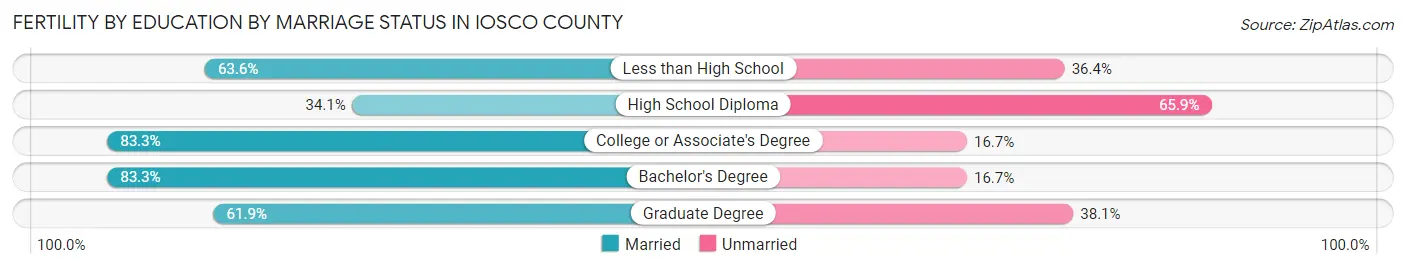
| Educational Attainment | Married | Unmarried |
| Less than High School | 7 (63.6%) | 4 (36.4%) |
| High School Diploma | 29 (34.1%) | 56 (65.9%) |
| College or Associate's Degree | 40 (83.3%) | 8 (16.7%) |
| Bachelor's Degree | 15 (83.3%) | 3 (16.7%) |
| Graduate Degree | 13 (61.9%) | 8 (38.1%) |
| Total | 104 (56.8%) | 79 (43.2%) |
Income in Iosco County
Income Overview in Iosco County
Per Capita Income in Iosco County is $28,301, while median incomes of families and households are $58,884 and $46,224 respectively.
| Characteristic | Number | Measure |
| Per Capita Income | 25,319 | $28,301 |
| Median Family Income | 6,378 | $58,884 |
| Mean Family Income | 6,378 | $72,825 |
| Median Household Income | 11,558 | $46,224 |
| Mean Household Income | 11,558 | $58,793 |
| Income Deficit | 6,378 | $8,564 |
| Wage / Income Gap (%) | 25,319 | 35.56% |
| Wage / Income Gap ($) | 25,319 | 64.44¢ per $1 |
| Gini / Inequality Index | 25,319 | 0.43 |
Earnings by Sex in Iosco County
Average Earnings in Iosco County are $30,633, $36,957 for men and $23,816 for women, a difference of 35.6%.
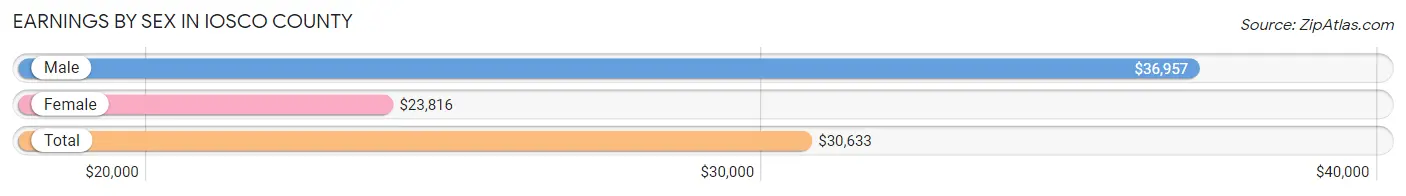
| Sex | Number | Average Earnings |
| Male | 5,616 (53.2%) | $36,957 |
| Female | 4,944 (46.8%) | $23,816 |
| Total | 10,560 (100.0%) | $30,633 |
Earnings by Sex by Income Bracket in Iosco County
The most common earnings brackets in Iosco County are $55,000 to $64,999 for men (638 | 11.4%) and $12,500 to $14,999 for women (422 | 8.5%).
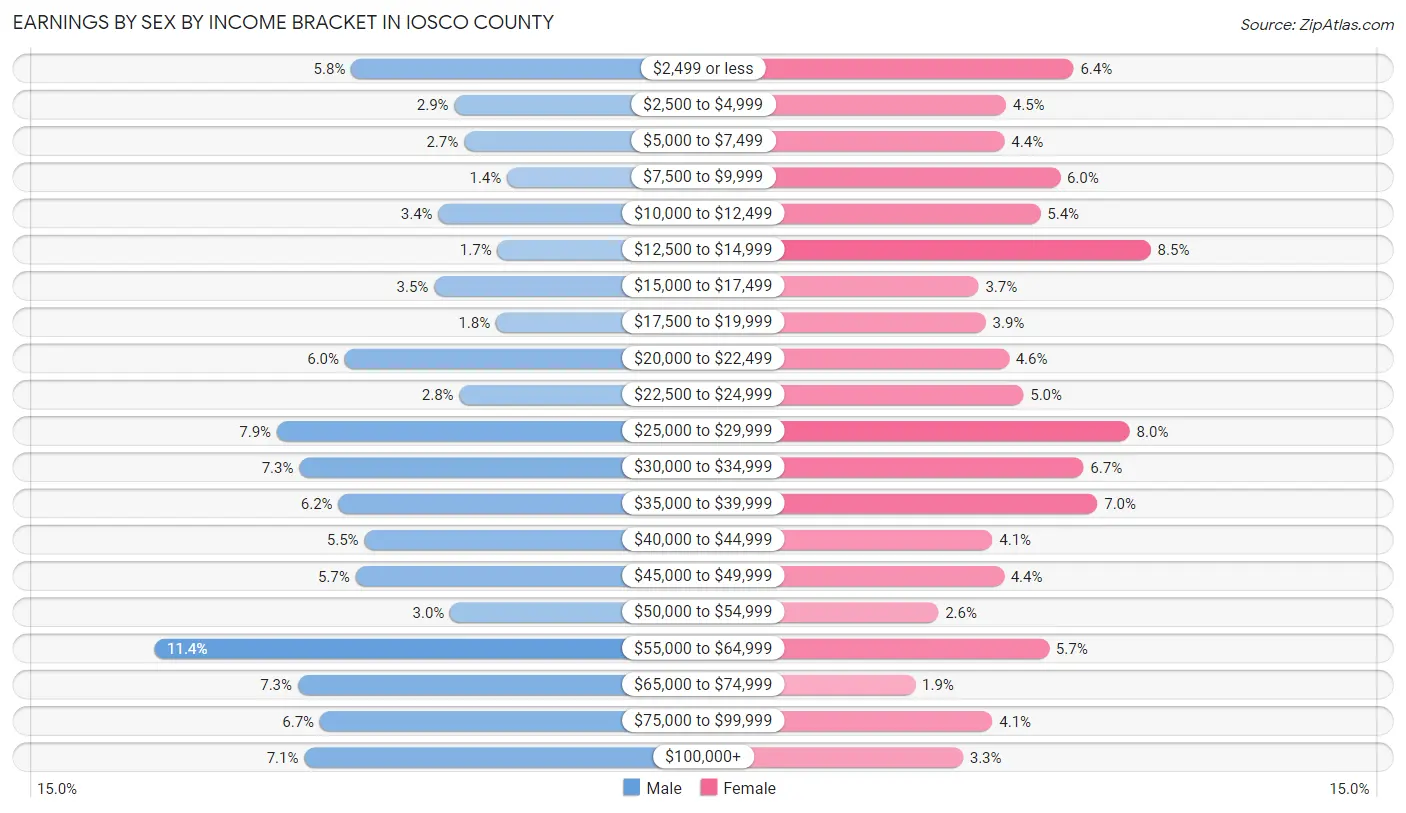
| Income | Male | Female |
| $2,499 or less | 327 (5.8%) | 315 (6.4%) |
| $2,500 to $4,999 | 164 (2.9%) | 221 (4.5%) |
| $5,000 to $7,499 | 149 (2.6%) | 219 (4.4%) |
| $7,500 to $9,999 | 81 (1.4%) | 296 (6.0%) |
| $10,000 to $12,499 | 189 (3.4%) | 269 (5.4%) |
| $12,500 to $14,999 | 96 (1.7%) | 422 (8.5%) |
| $15,000 to $17,499 | 196 (3.5%) | 183 (3.7%) |
| $17,500 to $19,999 | 98 (1.8%) | 193 (3.9%) |
| $20,000 to $22,499 | 337 (6.0%) | 225 (4.5%) |
| $22,500 to $24,999 | 156 (2.8%) | 245 (5.0%) |
| $25,000 to $29,999 | 444 (7.9%) | 393 (8.0%) |
| $30,000 to $34,999 | 409 (7.3%) | 329 (6.7%) |
| $35,000 to $39,999 | 347 (6.2%) | 348 (7.0%) |
| $40,000 to $44,999 | 306 (5.4%) | 202 (4.1%) |
| $45,000 to $49,999 | 320 (5.7%) | 218 (4.4%) |
| $50,000 to $54,999 | 171 (3.0%) | 127 (2.6%) |
| $55,000 to $64,999 | 638 (11.4%) | 281 (5.7%) |
| $65,000 to $74,999 | 411 (7.3%) | 95 (1.9%) |
| $75,000 to $99,999 | 376 (6.7%) | 202 (4.1%) |
| $100,000+ | 401 (7.1%) | 161 (3.3%) |
| Total | 5,616 (100.0%) | 4,944 (100.0%) |
Earnings by Sex by Educational Attainment in Iosco County
Average earnings in Iosco County are $39,744 for men and $26,329 for women, a difference of 33.8%. Men with an educational attainment of bachelor's degree enjoy the highest average annual earnings of $54,583, while those with high school diploma education earn the least with $34,639. Women with an educational attainment of graduate degree earn the most with the average annual earnings of $58,529, while those with less than high school education have the smallest earnings of $12,500.

| Educational Attainment | Male Income | Female Income |
| Less than High School | $35,292 | $12,500 |
| High School Diploma | $34,639 | $22,000 |
| College or Associate's Degree | $41,383 | $24,590 |
| Bachelor's Degree | $54,583 | $34,952 |
| Graduate Degree | $50,847 | $58,529 |
| Total | $39,744 | $26,329 |
Family Income in Iosco County
Family Income Brackets in Iosco County
According to the Iosco County family income data, there are 1,639 families falling into the $50,000 to $74,999 income range, which is the most common income bracket and makes up 25.7% of all families. Conversely, the $10,000 to $14,999 income bracket is the least frequent group with only 185 families (2.9%) belonging to this category.
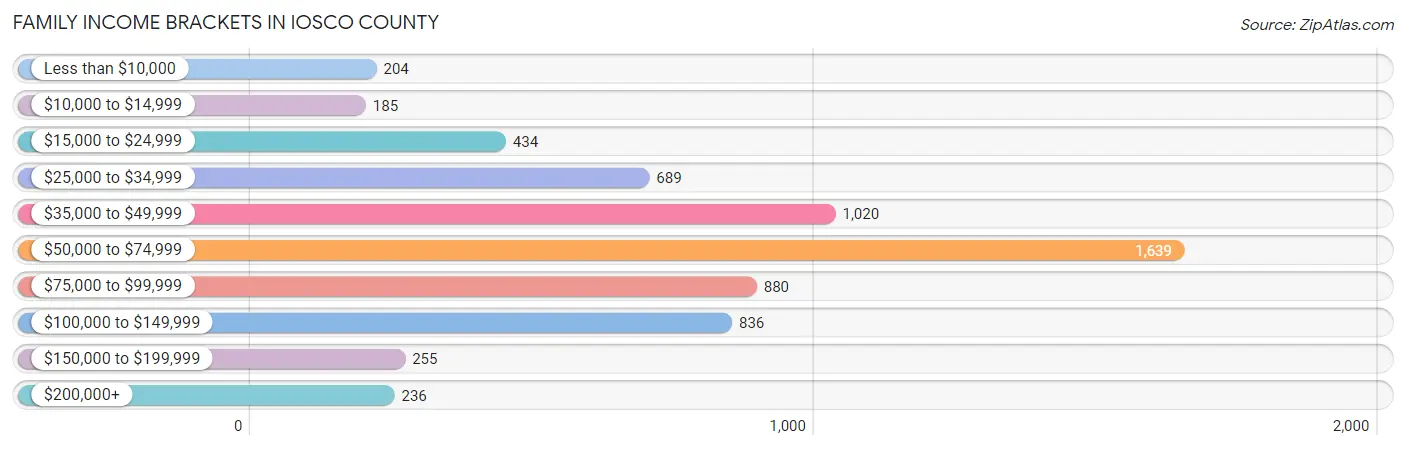
| Income Bracket | # Families | % Families |
| Less than $10,000 | 204 | 3.2% |
| $10,000 to $14,999 | 185 | 2.9% |
| $15,000 to $24,999 | 434 | 6.8% |
| $25,000 to $34,999 | 689 | 10.8% |
| $35,000 to $49,999 | 1,020 | 16.0% |
| $50,000 to $74,999 | 1,639 | 25.7% |
| $75,000 to $99,999 | 880 | 13.8% |
| $100,000 to $149,999 | 836 | 13.1% |
| $150,000 to $199,999 | 255 | 4.0% |
| $200,000+ | 236 | 3.7% |
Family Income by Famaliy Size in Iosco County
5-person families (256 | 4.0%) account for the highest median family income in Iosco County with $76,000 per family, while 2-person families (4,230 | 66.3%) have the highest median income of $28,522 per family member.
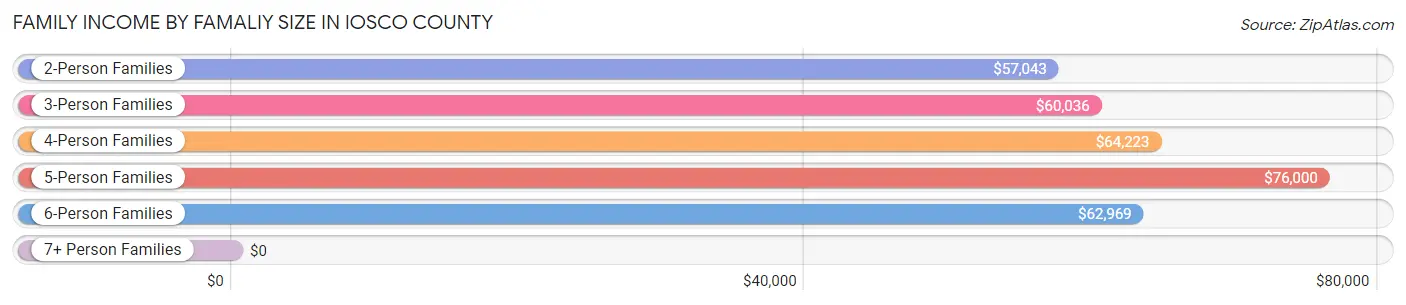
| Income Bracket | # Families | Median Income |
| 2-Person Families | 4,230 (66.3%) | $57,043 |
| 3-Person Families | 1,011 (15.9%) | $60,036 |
| 4-Person Families | 759 (11.9%) | $64,223 |
| 5-Person Families | 256 (4.0%) | $76,000 |
| 6-Person Families | 60 (0.9%) | $62,969 |
| 7+ Person Families | 62 (1.0%) | $0 |
| Total | 6,378 (100.0%) | $58,884 |
Family Income by Number of Earners in Iosco County
The median family income in Iosco County is $58,884, with families comprising 3+ earners (313) having the highest median family income of $120,268, while families with no earners (2,197) have the lowest median family income of $47,631, accounting for 4.9% and 34.4% of families, respectively.

| Number of Earners | # Families | Median Income |
| No Earners | 2,197 (34.4%) | $47,631 |
| 1 Earner | 2,116 (33.2%) | $53,511 |
| 2 Earners | 1,752 (27.5%) | $84,904 |
| 3+ Earners | 313 (4.9%) | $120,268 |
| Total | 6,378 (100.0%) | $58,884 |
Household Income in Iosco County
Household Income Brackets in Iosco County
With 2,242 households falling in the category, the $50,000 to $74,999 income range is the most frequent in Iosco County, accounting for 19.4% of all households. In contrast, only 277 households (2.4%) fall into the $200,000+ income bracket, making it the least populous group.
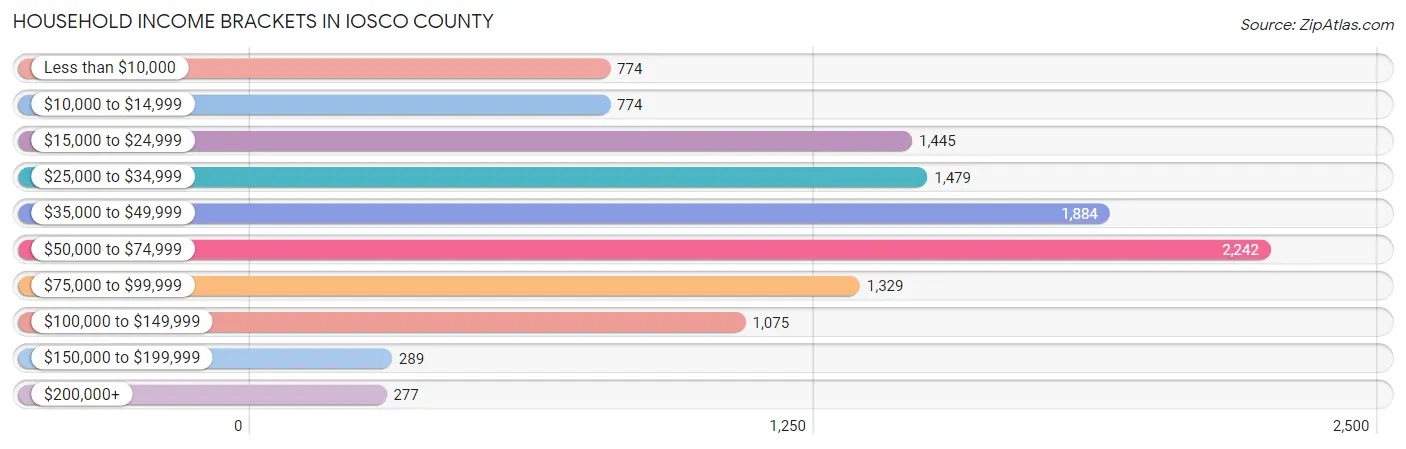
| Income Bracket | # Households | % Households |
| Less than $10,000 | 774 | 6.7% |
| $10,000 to $14,999 | 774 | 6.7% |
| $15,000 to $24,999 | 1,445 | 12.5% |
| $25,000 to $34,999 | 1,479 | 12.8% |
| $35,000 to $49,999 | 1,884 | 16.3% |
| $50,000 to $74,999 | 2,242 | 19.4% |
| $75,000 to $99,999 | 1,329 | 11.5% |
| $100,000 to $149,999 | 1,075 | 9.3% |
| $150,000 to $199,999 | 289 | 2.5% |
| $200,000+ | 277 | 2.4% |
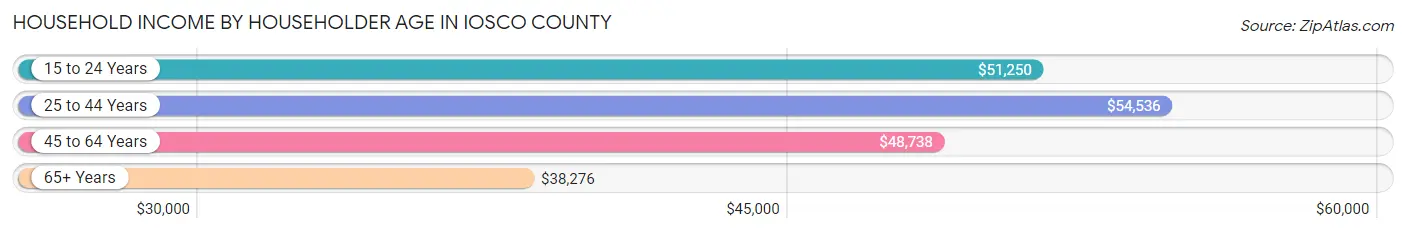
Household Income by Householder Age in Iosco County
The median household income in Iosco County is $46,224, with the highest median household income of $54,536 found in the 25 to 44 years age bracket for the primary householder. A total of 2,288 households (19.8%) fall into this category. Meanwhile, the 65+ years age bracket for the primary householder has the lowest median household income of $38,276, with 4,943 households (42.8%) in this group.
| Income Bracket | # Households | Median Income |
| 15 to 24 Years | 304 (2.6%) | $51,250 |
| 25 to 44 Years | 2,288 (19.8%) | $54,536 |
| 45 to 64 Years | 4,023 (34.8%) | $48,738 |
| 65+ Years | 4,943 (42.8%) | $38,276 |
| Total | 11,558 (100.0%) | $46,224 |
Poverty in Iosco County
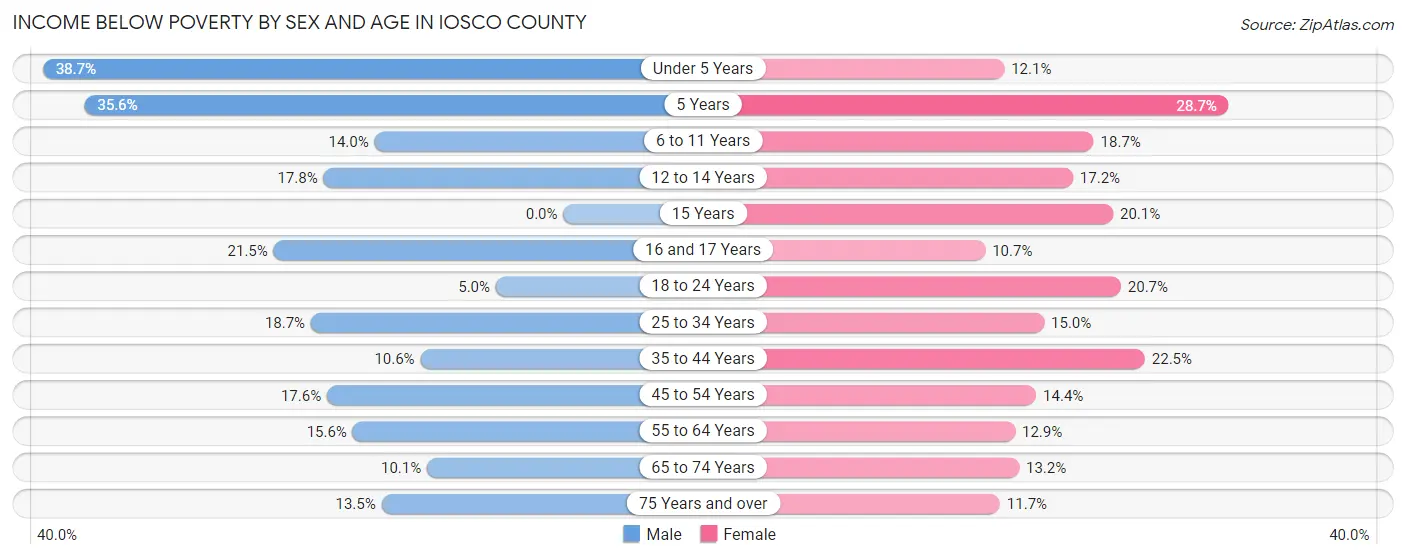
Income Below Poverty by Sex and Age in Iosco County
With 15.1% poverty level for males and 15.1% for females among the residents of Iosco County, under 5 year old males and 5 year old females are the most vulnerable to poverty, with 247 males (38.7%) and 54 females (28.7%) in their respective age groups living below the poverty level.
| Age Bracket | Male | Female |
| Under 5 Years | 247 (38.7%) | 61 (12.1%) |
| 5 Years | 48 (35.6%) | 54 (28.7%) |
| 6 to 11 Years | 76 (14.0%) | 118 (18.7%) |
| 12 to 14 Years | 65 (17.8%) | 58 (17.2%) |
| 15 Years | 0 (0.0%) | 29 (20.1%) |
| 16 and 17 Years | 57 (21.5%) | 23 (10.6%) |
| 18 to 24 Years | 42 (5.0%) | 138 (20.7%) |
| 25 to 34 Years | 223 (18.7%) | 178 (15.0%) |
| 35 to 44 Years | 130 (10.6%) | 245 (22.5%) |
| 45 to 54 Years | 238 (17.5%) | 206 (14.4%) |
| 55 to 64 Years | 344 (15.6%) | 293 (12.9%) |
| 65 to 74 Years | 226 (10.1%) | 286 (13.2%) |
| 75 Years and over | 189 (13.5%) | 193 (11.7%) |
| Total | 1,885 (15.1%) | 1,882 (15.1%) |
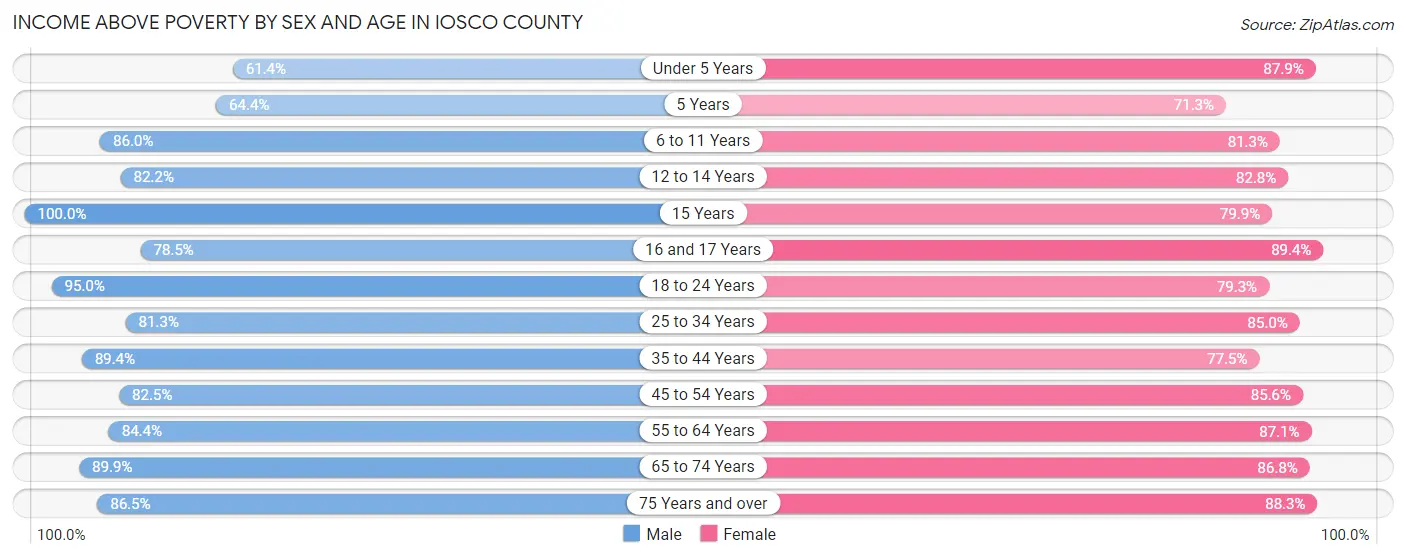
Income Above Poverty by Sex and Age in Iosco County
According to the poverty statistics in Iosco County, males aged 15 years and females aged 16 and 17 years are the age groups that are most secure financially, with 100.0% of males and 89.3% of females in these age groups living above the poverty line.
| Age Bracket | Male | Female |
| Under 5 Years | 392 (61.4%) | 445 (87.9%) |
| 5 Years | 87 (64.4%) | 134 (71.3%) |
| 6 to 11 Years | 466 (86.0%) | 513 (81.3%) |
| 12 to 14 Years | 300 (82.2%) | 280 (82.8%) |
| 15 Years | 107 (100.0%) | 115 (79.9%) |
| 16 and 17 Years | 208 (78.5%) | 193 (89.3%) |
| 18 to 24 Years | 796 (95.0%) | 528 (79.3%) |
| 25 to 34 Years | 967 (81.3%) | 1,007 (85.0%) |
| 35 to 44 Years | 1,095 (89.4%) | 844 (77.5%) |
| 45 to 54 Years | 1,118 (82.5%) | 1,222 (85.6%) |
| 55 to 64 Years | 1,856 (84.4%) | 1,985 (87.1%) |
| 65 to 74 Years | 2,008 (89.9%) | 1,887 (86.8%) |
| 75 Years and over | 1,211 (86.5%) | 1,451 (88.3%) |
| Total | 10,611 (84.9%) | 10,604 (84.9%) |
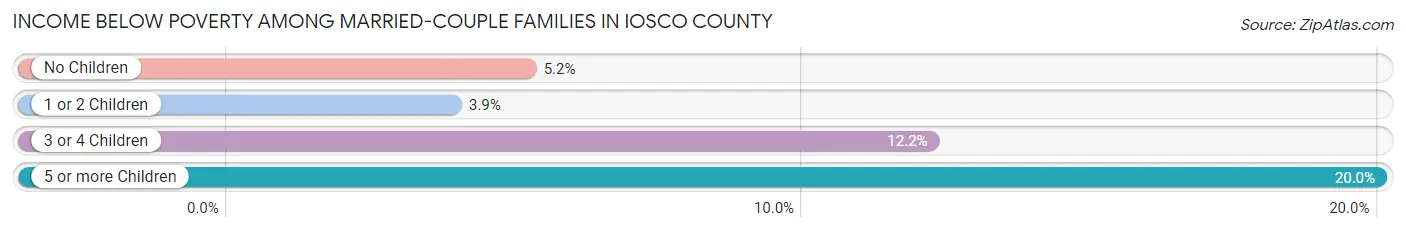
Income Below Poverty Among Married-Couple Families in Iosco County
The poverty statistics for married-couple families in Iosco County show that 5.2% or 262 of the total 5,018 families live below the poverty line. Families with 5 or more children have the highest poverty rate of 20.0%, comprising of 3 families. On the other hand, families with 1 or 2 children have the lowest poverty rate of 3.9%, which includes 40 families.
| Children | Above Poverty | Below Poverty |
| No Children | 3,607 (94.8%) | 198 (5.2%) |
| 1 or 2 Children | 986 (96.1%) | 40 (3.9%) |
| 3 or 4 Children | 151 (87.8%) | 21 (12.2%) |
| 5 or more Children | 12 (80.0%) | 3 (20.0%) |
| Total | 4,756 (94.8%) | 262 (5.2%) |
Income Below Poverty Among Single-Parent Households in Iosco County
According to the poverty data in Iosco County, 18.8% or 78 single-father households and 34.1% or 322 single-mother households are living below the poverty line. Among single-father households, those with 3 or 4 children have the highest poverty rate, with 2 households (33.3%) experiencing poverty. Likewise, among single-mother households, those with 3 or 4 children have the highest poverty rate, with 57 households (50.9%) falling below the poverty line.

| Children | Single Father | Single Mother |
| No Children | 26 (15.2%) | 28 (10.4%) |
| 1 or 2 Children | 50 (20.9%) | 237 (42.8%) |
| 3 or 4 Children | 2 (33.3%) | 57 (50.9%) |
| 5 or more Children | 0 (0.0%) | 0 (0.0%) |
| Total | 78 (18.8%) | 322 (34.1%) |
Income Below Poverty Among Married-Couple vs Single-Parent Households in Iosco County
The poverty data for Iosco County shows that 262 of the married-couple family households (5.2%) and 400 of the single-parent households (29.4%) are living below the poverty level. Within the married-couple family households, those with 5 or more children have the highest poverty rate, with 3 households (20.0%) falling below the poverty line. Among the single-parent households, those with 3 or 4 children have the highest poverty rate, with 59 household (50.0%) living below poverty.
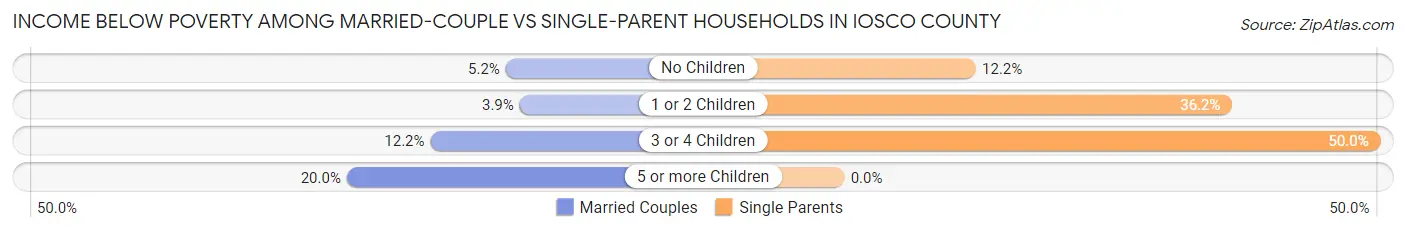
| Children | Married-Couple Families | Single-Parent Households |
| No Children | 198 (5.2%) | 54 (12.2%) |
| 1 or 2 Children | 40 (3.9%) | 287 (36.2%) |
| 3 or 4 Children | 21 (12.2%) | 59 (50.0%) |
| 5 or more Children | 3 (20.0%) | 0 (0.0%) |
| Total | 262 (5.2%) | 400 (29.4%) |
Employment Characteristics in Iosco County
Employment by Class of Employer in Iosco County
Among the 9,130 employed individuals in Iosco County, private company employees (6,261 | 68.6%), not-for-profit organizations (1,007 | 11.0%), and local government employees (595 | 6.5%) make up the most common classes of employment.
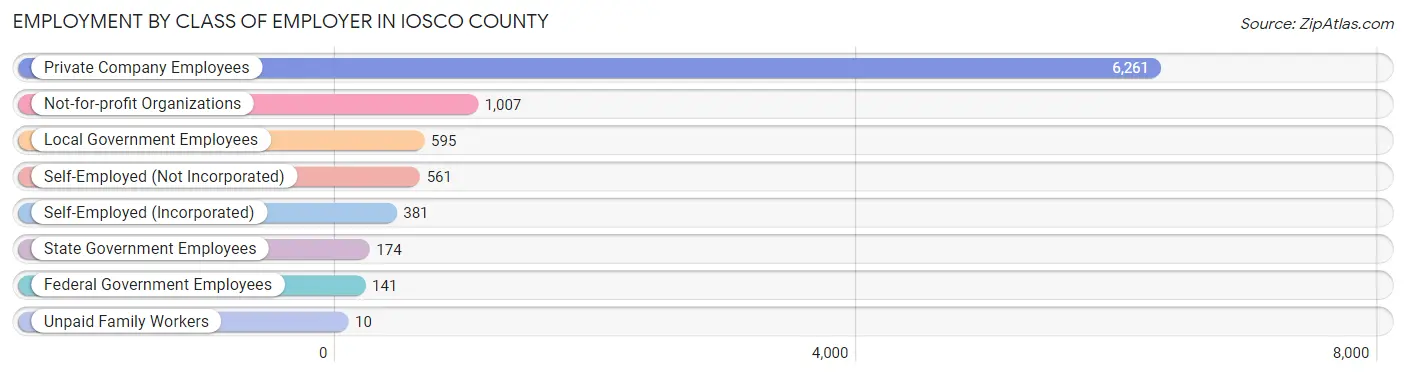
| Employer Class | # Employees | % Employees |
| Private Company Employees | 6,261 | 68.6% |
| Self-Employed (Incorporated) | 381 | 4.2% |
| Self-Employed (Not Incorporated) | 561 | 6.1% |
| Not-for-profit Organizations | 1,007 | 11.0% |
| Local Government Employees | 595 | 6.5% |
| State Government Employees | 174 | 1.9% |
| Federal Government Employees | 141 | 1.5% |
| Unpaid Family Workers | 10 | 0.1% |
| Total | 9,130 | 100.0% |
Employment Status by Age in Iosco County
According to the labor force statistics for Iosco County, out of the total population over 16 years of age (21,630), 46.9% or 10,144 individuals are in the labor force, with 7.4% or 751 of them unemployed. The age group with the highest labor force participation rate is 25 to 29 years, with 85.0% or 1,023 individuals in the labor force. Within the labor force, the 16 to 19 years age range has the highest percentage of unemployed individuals, with 16.6% or 68 of them being unemployed.
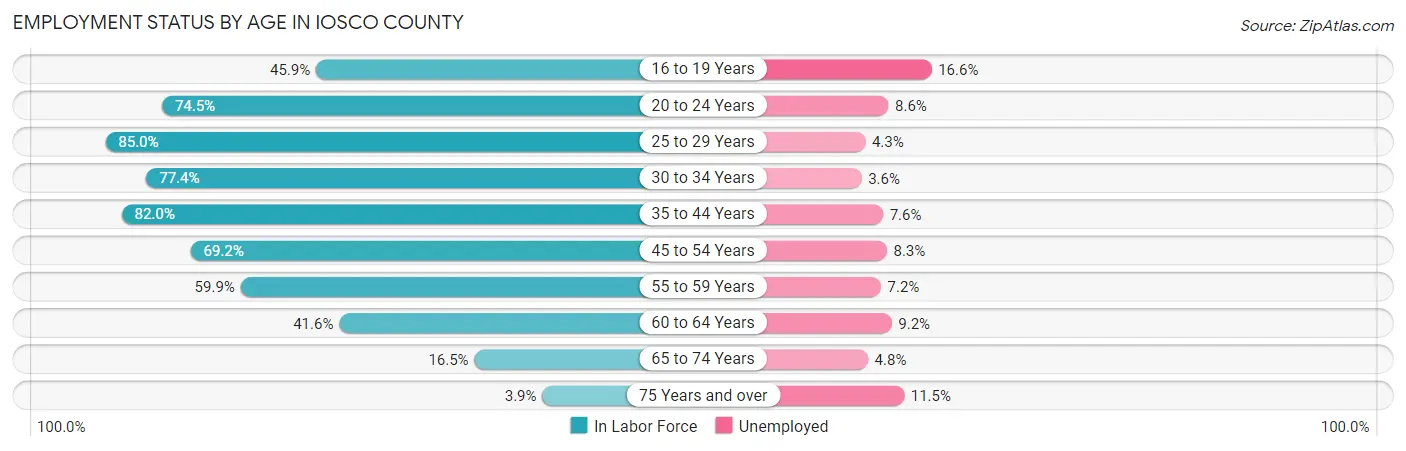
| Age Bracket | In Labor Force | Unemployed |
| 16 to 19 Years | 411 (45.9%) | 68 (16.6%) |
| 20 to 24 Years | 832 (74.5%) | 72 (8.6%) |
| 25 to 29 Years | 1,023 (85.0%) | 44 (4.3%) |
| 30 to 34 Years | 940 (77.4%) | 34 (3.6%) |
| 35 to 44 Years | 1,909 (82.0%) | 145 (7.6%) |
| 45 to 54 Years | 1,927 (69.2%) | 160 (8.3%) |
| 55 to 59 Years | 1,227 (59.9%) | 88 (7.2%) |
| 60 to 64 Years | 1,018 (41.6%) | 94 (9.2%) |
| 65 to 74 Years | 735 (16.5%) | 35 (4.8%) |
| 75 Years and over | 122 (3.9%) | 14 (11.5%) |
| Total | 10,144 (46.9%) | 751 (7.4%) |
Employment Status by Educational Attainment in Iosco County
According to labor force statistics for Iosco County, 66.9% of individuals (8,046) out of the total population between 25 and 64 years of age (12,027) are in the labor force, with 7.0% or 563 of them being unemployed. The group with the highest labor force participation rate are those with the educational attainment of bachelor's degree or higher, with 82.9% or 1,716 individuals in the labor force. Within the labor force, individuals with less than high school education have the highest percentage of unemployment, with 29.0% or 142 of them being unemployed.
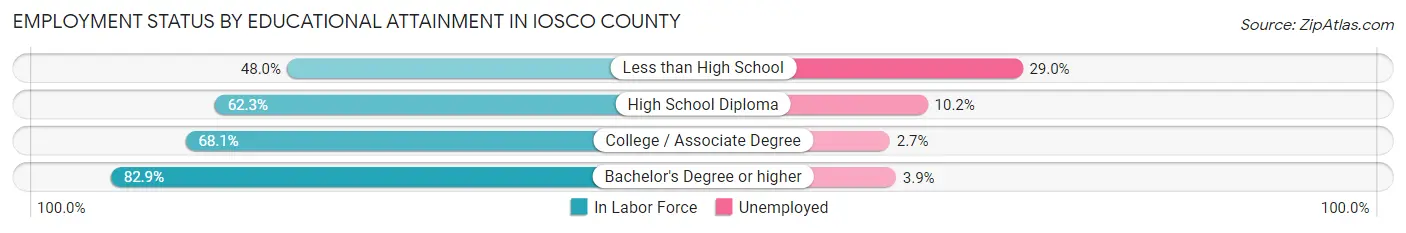
| Educational Attainment | In Labor Force | Unemployed |
| Less than High School | 489 (48.0%) | 296 (29.0%) |
| High School Diploma | 2,638 (62.3%) | 432 (10.2%) |
| College / Associate Degree | 3,203 (68.1%) | 127 (2.7%) |
| Bachelor's Degree or higher | 1,716 (82.9%) | 81 (3.9%) |
| Total | 8,046 (66.9%) | 842 (7.0%) |
Employment Occupations by Sex in Iosco County
Management, Business, Science and Arts Occupations
The most common Management, Business, Science and Arts occupations in Iosco County are Community & Social Service (723 | 7.7%), Management (711 | 7.6%), Health Diagnosing & Treating (506 | 5.4%), Education Instruction & Library (423 | 4.5%), and Health Technologists (275 | 2.9%).

Management, Business, Science and Arts Occupations by Sex
Within the Management, Business, Science and Arts occupations in Iosco County, the most male-oriented occupations are Architecture & Engineering (93.2%), Computers, Engineering & Science (90.7%), and Computers & Mathematics (88.0%), while the most female-oriented occupations are Health Diagnosing & Treating (82.2%), Health Technologists (74.2%), and Education Instruction & Library (73.3%).
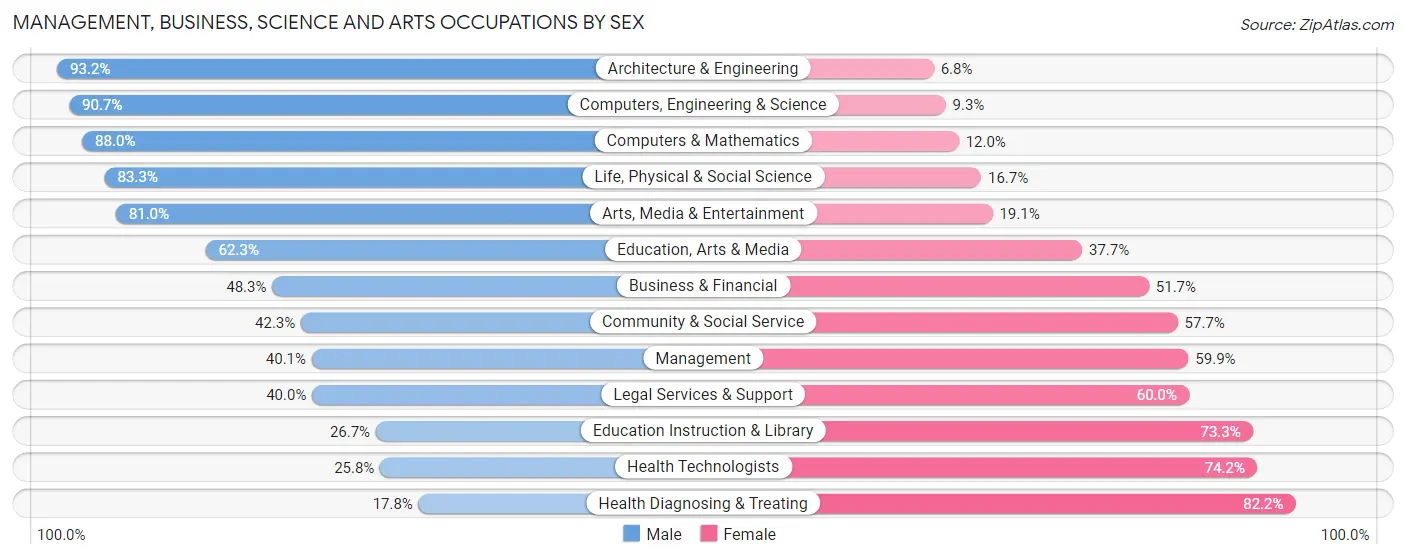
| Occupation | Male | Female |
| Management | 285 (40.1%) | 426 (59.9%) |
| Business & Financial | 116 (48.3%) | 124 (51.7%) |
| Computers, Engineering & Science | 186 (90.7%) | 19 (9.3%) |
| Computers & Mathematics | 66 (88.0%) | 9 (12.0%) |
| Architecture & Engineering | 110 (93.2%) | 8 (6.8%) |
| Life, Physical & Social Science | 10 (83.3%) | 2 (16.7%) |
| Community & Social Service | 306 (42.3%) | 417 (57.7%) |
| Education, Arts & Media | 132 (62.3%) | 80 (37.7%) |
| Legal Services & Support | 10 (40.0%) | 15 (60.0%) |
| Education Instruction & Library | 113 (26.7%) | 310 (73.3%) |
| Arts, Media & Entertainment | 51 (80.9%) | 12 (19.1%) |
| Health Diagnosing & Treating | 90 (17.8%) | 416 (82.2%) |
| Health Technologists | 71 (25.8%) | 204 (74.2%) |
| Total (Category) | 983 (41.2%) | 1,402 (58.8%) |
| Total (Overall) | 4,953 (53.0%) | 4,390 (47.0%) |
Services Occupations
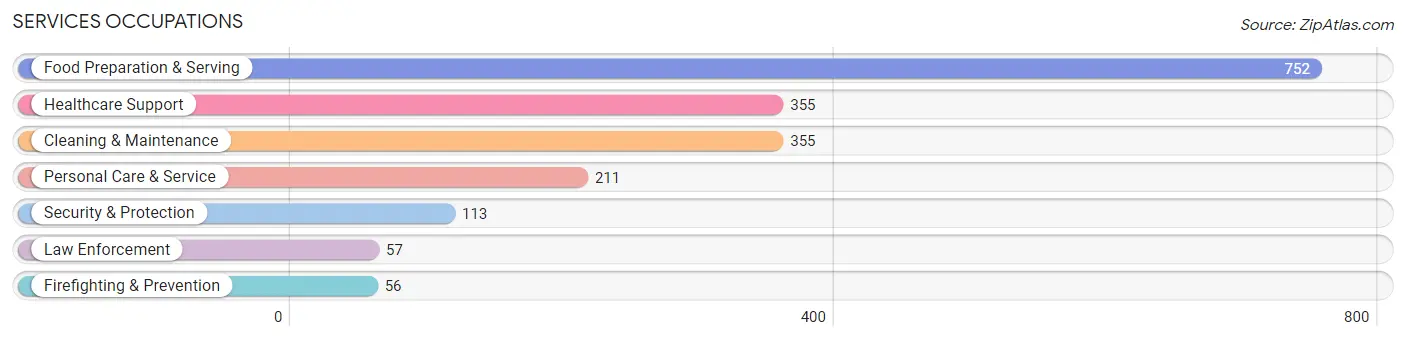
The most common Services occupations in Iosco County are Food Preparation & Serving (752 | 8.1%), Healthcare Support (355 | 3.8%), Cleaning & Maintenance (355 | 3.8%), Personal Care & Service (211 | 2.3%), and Security & Protection (113 | 1.2%).
Services Occupations by Sex
Within the Services occupations in Iosco County, the most male-oriented occupations are Firefighting & Prevention (91.1%), Security & Protection (71.7%), and Cleaning & Maintenance (61.7%), while the most female-oriented occupations are Personal Care & Service (89.6%), Healthcare Support (83.1%), and Food Preparation & Serving (64.9%).
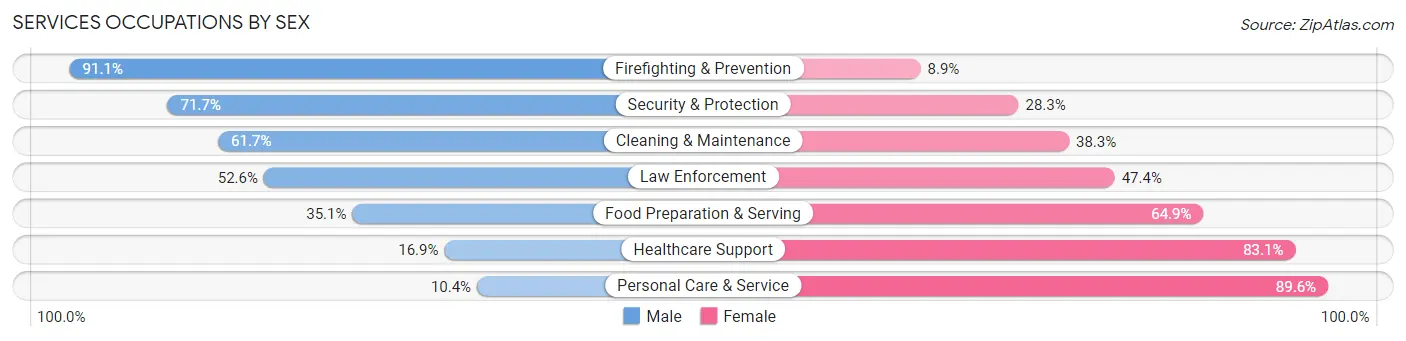
| Occupation | Male | Female |
| Healthcare Support | 60 (16.9%) | 295 (83.1%) |
| Security & Protection | 81 (71.7%) | 32 (28.3%) |
| Firefighting & Prevention | 51 (91.1%) | 5 (8.9%) |
| Law Enforcement | 30 (52.6%) | 27 (47.4%) |
| Food Preparation & Serving | 264 (35.1%) | 488 (64.9%) |
| Cleaning & Maintenance | 219 (61.7%) | 136 (38.3%) |
| Personal Care & Service | 22 (10.4%) | 189 (89.6%) |
| Total (Category) | 646 (36.2%) | 1,140 (63.8%) |
| Total (Overall) | 4,953 (53.0%) | 4,390 (47.0%) |
Sales and Office Occupations
The most common Sales and Office occupations in Iosco County are Sales & Related (991 | 10.6%), and Office & Administration (946 | 10.1%).

Sales and Office Occupations by Sex

| Occupation | Male | Female |
| Sales & Related | 412 (41.6%) | 579 (58.4%) |
| Office & Administration | 128 (13.5%) | 818 (86.5%) |
| Total (Category) | 540 (27.9%) | 1,397 (72.1%) |
| Total (Overall) | 4,953 (53.0%) | 4,390 (47.0%) |
Natural Resources, Construction and Maintenance Occupations
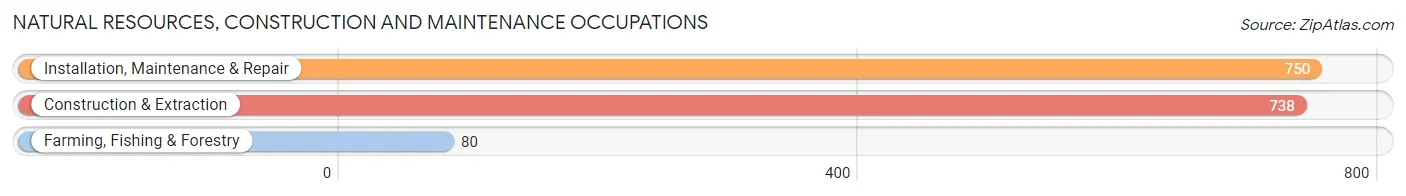
The most common Natural Resources, Construction and Maintenance occupations in Iosco County are Installation, Maintenance & Repair (750 | 8.0%), Construction & Extraction (738 | 7.9%), and Farming, Fishing & Forestry (80 | 0.9%).
Natural Resources, Construction and Maintenance Occupations by Sex

| Occupation | Male | Female |
| Farming, Fishing & Forestry | 58 (72.5%) | 22 (27.5%) |
| Construction & Extraction | 736 (99.7%) | 2 (0.3%) |
| Installation, Maintenance & Repair | 750 (100.0%) | 0 (0.0%) |
| Total (Category) | 1,544 (98.5%) | 24 (1.5%) |
| Total (Overall) | 4,953 (53.0%) | 4,390 (47.0%) |
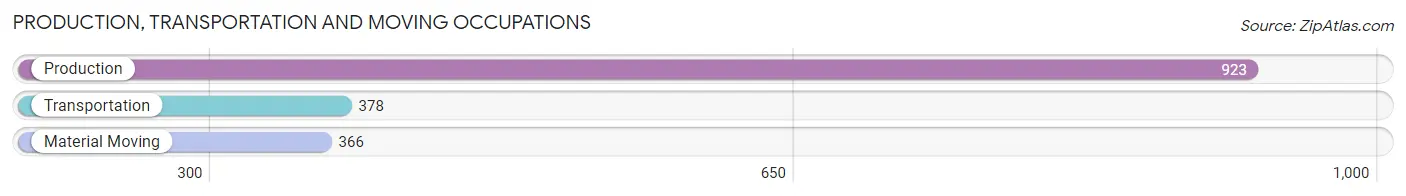
Production, Transportation and Moving Occupations
The most common Production, Transportation and Moving occupations in Iosco County are Production (923 | 9.9%), Transportation (378 | 4.1%), and Material Moving (366 | 3.9%).
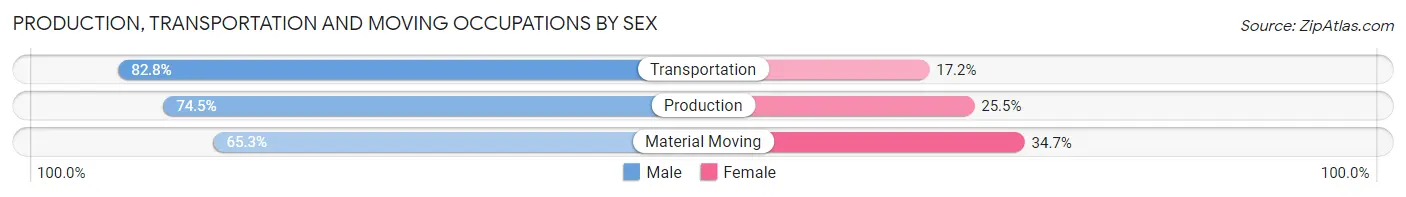
Production, Transportation and Moving Occupations by Sex
| Occupation | Male | Female |
| Production | 688 (74.5%) | 235 (25.5%) |
| Transportation | 313 (82.8%) | 65 (17.2%) |
| Material Moving | 239 (65.3%) | 127 (34.7%) |
| Total (Category) | 1,240 (74.4%) | 427 (25.6%) |
| Total (Overall) | 4,953 (53.0%) | 4,390 (47.0%) |
Employment Industries by Sex in Iosco County
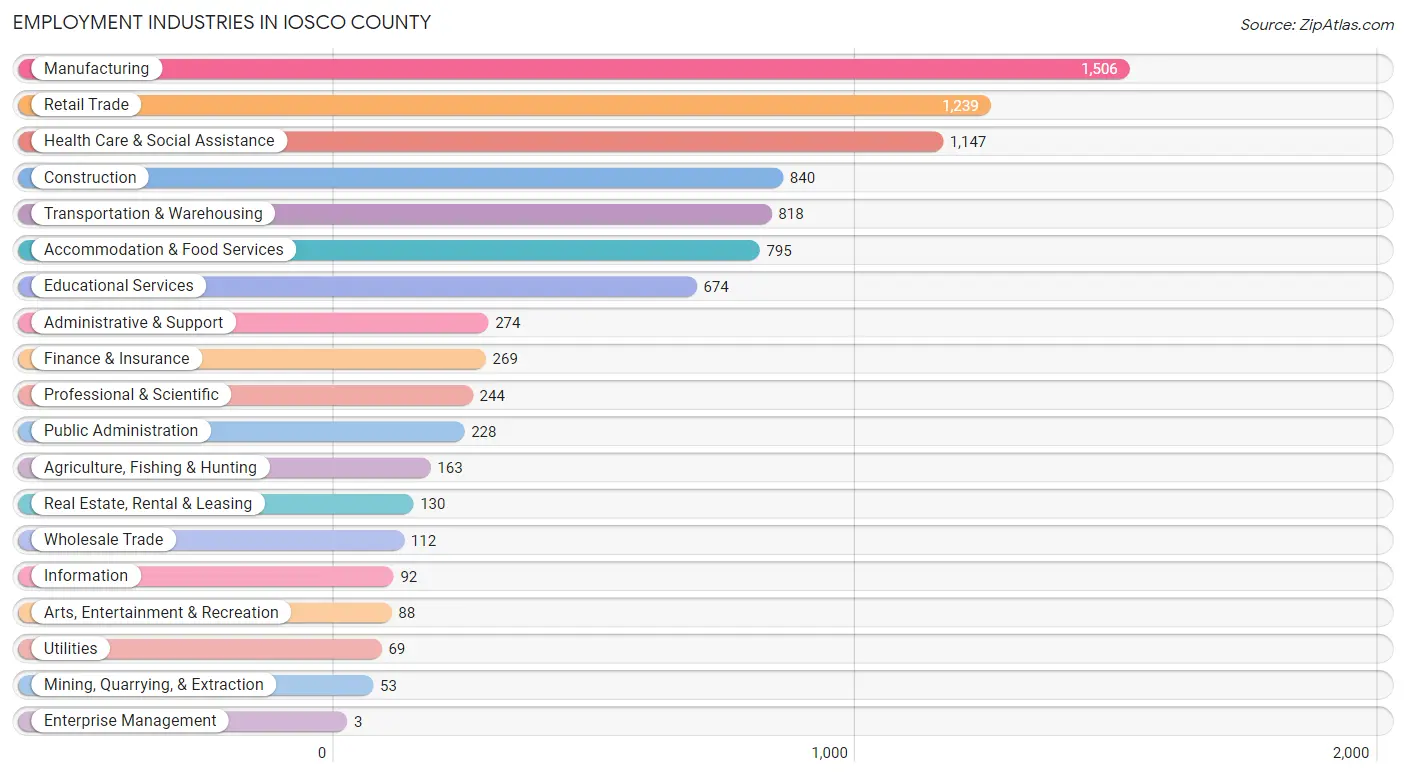
Employment Industries in Iosco County
The major employment industries in Iosco County include Manufacturing (1,506 | 16.1%), Retail Trade (1,239 | 13.3%), Health Care & Social Assistance (1,147 | 12.3%), Construction (840 | 9.0%), and Transportation & Warehousing (818 | 8.8%).
Employment Industries by Sex in Iosco County
The Iosco County industries that see more men than women are Construction (96.2%), Transportation & Warehousing (86.4%), and Mining, Quarrying, & Extraction (84.9%), whereas the industries that tend to have a higher number of women are Enterprise Management (100.0%), Educational Services (76.6%), and Health Care & Social Assistance (76.1%).

| Industry | Male | Female |
| Agriculture, Fishing & Hunting | 122 (74.9%) | 41 (25.2%) |
| Mining, Quarrying, & Extraction | 45 (84.9%) | 8 (15.1%) |
| Construction | 808 (96.2%) | 32 (3.8%) |
| Manufacturing | 1,054 (70.0%) | 452 (30.0%) |
| Wholesale Trade | 93 (83.0%) | 19 (17.0%) |
| Retail Trade | 486 (39.2%) | 753 (60.8%) |
| Transportation & Warehousing | 707 (86.4%) | 111 (13.6%) |
| Utilities | 55 (79.7%) | 14 (20.3%) |
| Information | 36 (39.1%) | 56 (60.9%) |
| Finance & Insurance | 66 (24.5%) | 203 (75.5%) |
| Real Estate, Rental & Leasing | 52 (40.0%) | 78 (60.0%) |
| Professional & Scientific | 118 (48.4%) | 126 (51.6%) |
| Enterprise Management | 0 (0.0%) | 3 (100.0%) |
| Administrative & Support | 143 (52.2%) | 131 (47.8%) |
| Educational Services | 158 (23.4%) | 516 (76.6%) |
| Health Care & Social Assistance | 274 (23.9%) | 873 (76.1%) |
| Arts, Entertainment & Recreation | 58 (65.9%) | 30 (34.1%) |
| Accommodation & Food Services | 293 (36.9%) | 502 (63.1%) |
| Public Administration | 92 (40.4%) | 136 (59.7%) |
| Total | 4,953 (53.0%) | 4,390 (47.0%) |
Education in Iosco County
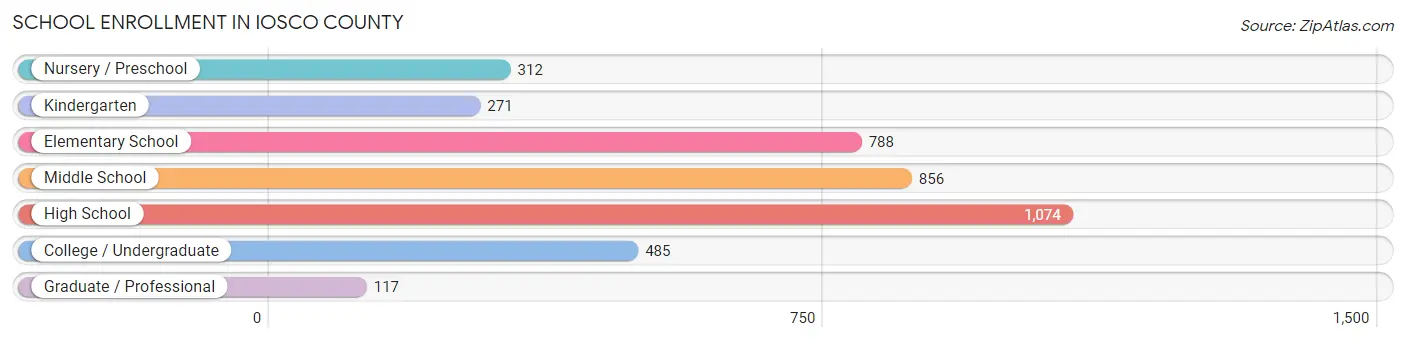
School Enrollment in Iosco County
The most common levels of schooling among the 3,903 students in Iosco County are high school (1,074 | 27.5%), middle school (856 | 21.9%), and elementary school (788 | 20.2%).
| School Level | # Students | % Students |
| Nursery / Preschool | 312 | 8.0% |
| Kindergarten | 271 | 6.9% |
| Elementary School | 788 | 20.2% |
| Middle School | 856 | 21.9% |
| High School | 1,074 | 27.5% |
| College / Undergraduate | 485 | 12.4% |
| Graduate / Professional | 117 | 3.0% |
| Total | 3,903 | 100.0% |
School Enrollment by Age by Funding Source in Iosco County
Out of a total of 3,903 students who are enrolled in schools in Iosco County, 382 (9.8%) attend a private institution, while the remaining 3,521 (90.2%) are enrolled in public schools. The age group of 35 years and over has the highest likelihood of being enrolled in private schools, with 41 (20.9% in the age bracket) enrolled. Conversely, the age group of 10 to 14 year olds has the lowest likelihood of being enrolled in a private school, with 1,069 (94.6% in the age bracket) attending a public institution.
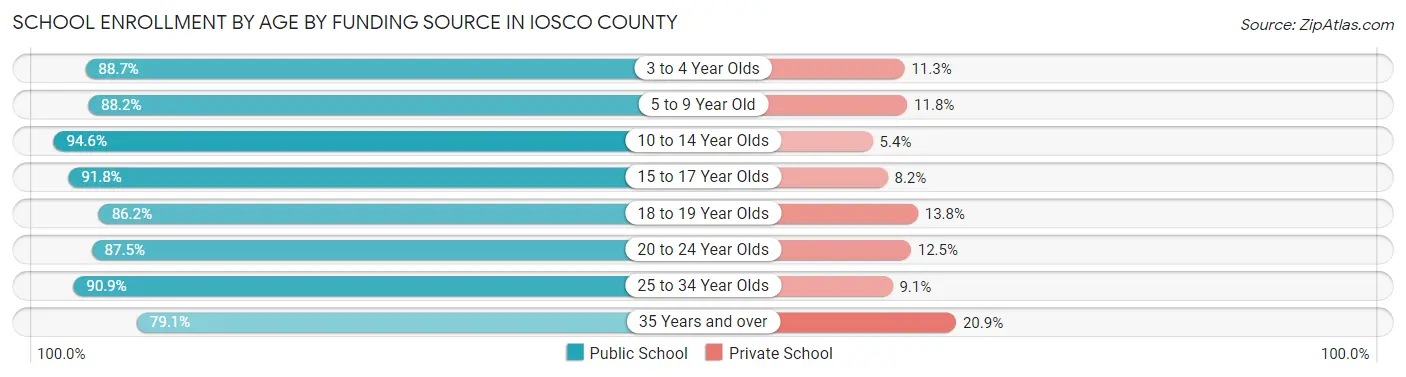
| Age Bracket | Public School | Private School |
| 3 to 4 Year Olds | 227 (88.7%) | 29 (11.3%) |
| 5 to 9 Year Old | 894 (88.2%) | 120 (11.8%) |
| 10 to 14 Year Olds | 1,069 (94.6%) | 61 (5.4%) |
| 15 to 17 Year Olds | 663 (91.8%) | 59 (8.2%) |
| 18 to 19 Year Olds | 206 (86.2%) | 33 (13.8%) |
| 20 to 24 Year Olds | 168 (87.5%) | 24 (12.5%) |
| 25 to 34 Year Olds | 140 (90.9%) | 14 (9.1%) |
| 35 Years and over | 155 (79.1%) | 41 (20.9%) |
| Total | 3,521 (90.2%) | 382 (9.8%) |
Educational Attainment by Field of Study in Iosco County
Education (856 | 24.5%), business (621 | 17.8%), science & technology (352 | 10.1%), arts & humanities (349 | 10.0%), and bio, nature & agricultural (243 | 7.0%) are the most common fields of study among 3,497 individuals in Iosco County who have obtained a bachelor's degree or higher.
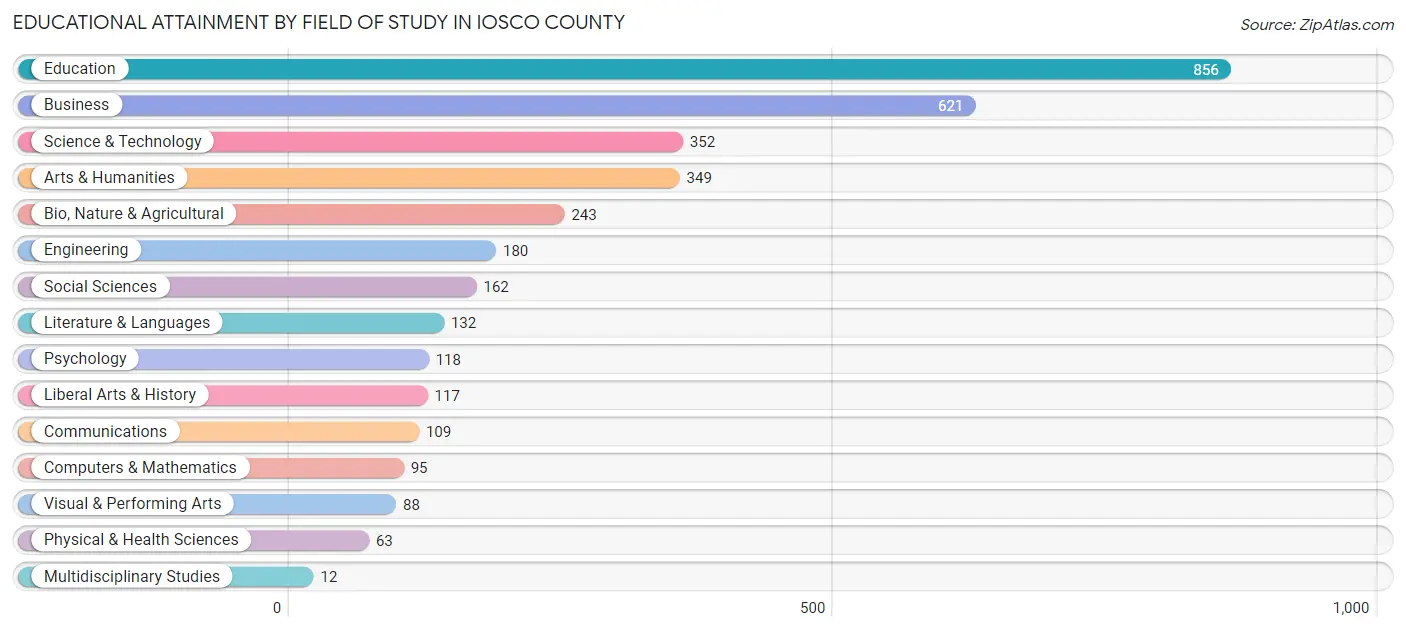
| Field of Study | # Graduates | % Graduates |
| Computers & Mathematics | 95 | 2.7% |
| Bio, Nature & Agricultural | 243 | 7.0% |
| Physical & Health Sciences | 63 | 1.8% |
| Psychology | 118 | 3.4% |
| Social Sciences | 162 | 4.6% |
| Engineering | 180 | 5.1% |
| Multidisciplinary Studies | 12 | 0.3% |
| Science & Technology | 352 | 10.1% |
| Business | 621 | 17.8% |
| Education | 856 | 24.5% |
| Literature & Languages | 132 | 3.8% |
| Liberal Arts & History | 117 | 3.4% |
| Visual & Performing Arts | 88 | 2.5% |
| Communications | 109 | 3.1% |
| Arts & Humanities | 349 | 10.0% |
| Total | 3,497 | 100.0% |
Transportation & Commute in Iosco County
Vehicle Availability by Sex in Iosco County
The most prevalent vehicle ownership categories in Iosco County are males with 2 vehicles (2,035, accounting for 41.7%) and females with 2 vehicles (1,660, making up 48.2%).
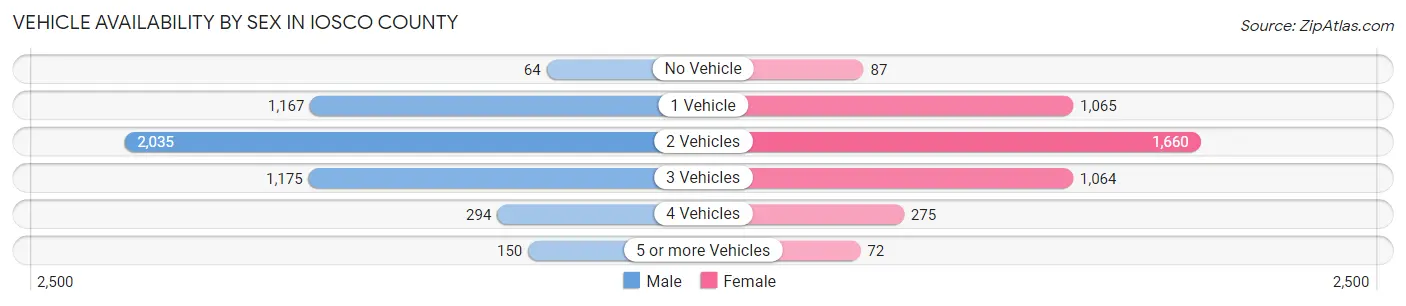
| Vehicles Available | Male | Female |
| No Vehicle | 64 (1.3%) | 87 (2.1%) |
| 1 Vehicle | 1,167 (23.9%) | 1,065 (25.2%) |
| 2 Vehicles | 2,035 (41.7%) | 1,660 (39.3%) |
| 3 Vehicles | 1,175 (24.0%) | 1,064 (25.2%) |
| 4 Vehicles | 294 (6.0%) | 275 (6.5%) |
| 5 or more Vehicles | 150 (3.1%) | 72 (1.7%) |
| Total | 4,885 (100.0%) | 4,223 (100.0%) |
Commute Time in Iosco County
The most frequently occuring commute durations in Iosco County are 5 to 9 minutes (2,058 commuters, 23.9%), 10 to 14 minutes (1,715 commuters, 20.0%), and 15 to 19 minutes (1,296 commuters, 15.1%).
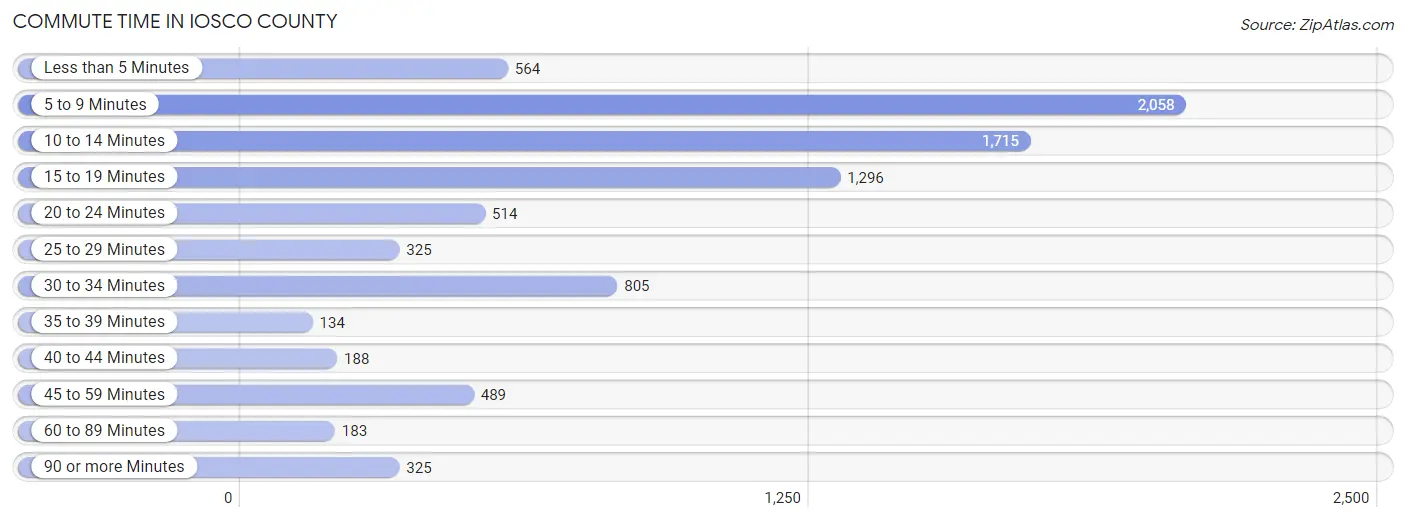
| Commute Time | # Commuters | % Commuters |
| Less than 5 Minutes | 564 | 6.6% |
| 5 to 9 Minutes | 2,058 | 23.9% |
| 10 to 14 Minutes | 1,715 | 20.0% |
| 15 to 19 Minutes | 1,296 | 15.1% |
| 20 to 24 Minutes | 514 | 6.0% |
| 25 to 29 Minutes | 325 | 3.8% |
| 30 to 34 Minutes | 805 | 9.4% |
| 35 to 39 Minutes | 134 | 1.6% |
| 40 to 44 Minutes | 188 | 2.2% |
| 45 to 59 Minutes | 489 | 5.7% |
| 60 to 89 Minutes | 183 | 2.1% |
| 90 or more Minutes | 325 | 3.8% |
Commute Time by Sex in Iosco County
The most common commute times in Iosco County are 5 to 9 minutes (1,115 commuters, 23.9%) for males and 5 to 9 minutes (943 commuters, 23.9%) for females.

| Commute Time | Male | Female |
| Less than 5 Minutes | 237 (5.1%) | 327 (8.3%) |
| 5 to 9 Minutes | 1,115 (23.9%) | 943 (23.9%) |
| 10 to 14 Minutes | 915 (19.7%) | 800 (20.3%) |
| 15 to 19 Minutes | 677 (14.5%) | 619 (15.7%) |
| 20 to 24 Minutes | 286 (6.1%) | 228 (5.8%) |
| 25 to 29 Minutes | 131 (2.8%) | 194 (4.9%) |
| 30 to 34 Minutes | 430 (9.2%) | 375 (9.5%) |
| 35 to 39 Minutes | 47 (1.0%) | 87 (2.2%) |
| 40 to 44 Minutes | 104 (2.2%) | 84 (2.1%) |
| 45 to 59 Minutes | 340 (7.3%) | 149 (3.8%) |
| 60 to 89 Minutes | 142 (3.0%) | 41 (1.0%) |
| 90 or more Minutes | 232 (5.0%) | 93 (2.4%) |
Time of Departure to Work by Sex in Iosco County
The most frequent times of departure to work in Iosco County are 7:30 AM to 7:59 AM (520, 11.2%) for males and 8:00 AM to 8:29 AM (589, 14.9%) for females.
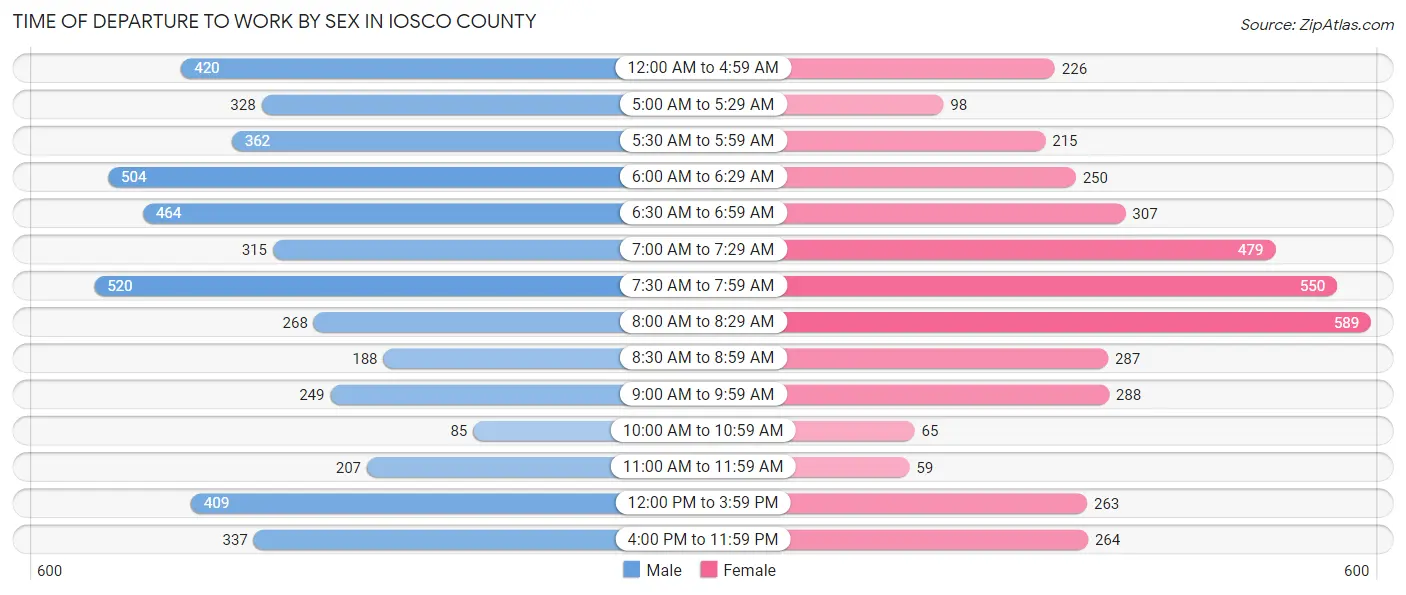
| Time of Departure | Male | Female |
| 12:00 AM to 4:59 AM | 420 (9.0%) | 226 (5.7%) |
| 5:00 AM to 5:29 AM | 328 (7.0%) | 98 (2.5%) |
| 5:30 AM to 5:59 AM | 362 (7.8%) | 215 (5.5%) |
| 6:00 AM to 6:29 AM | 504 (10.8%) | 250 (6.4%) |
| 6:30 AM to 6:59 AM | 464 (10.0%) | 307 (7.8%) |
| 7:00 AM to 7:29 AM | 315 (6.8%) | 479 (12.2%) |
| 7:30 AM to 7:59 AM | 520 (11.2%) | 550 (14.0%) |
| 8:00 AM to 8:29 AM | 268 (5.8%) | 589 (14.9%) |
| 8:30 AM to 8:59 AM | 188 (4.0%) | 287 (7.3%) |
| 9:00 AM to 9:59 AM | 249 (5.3%) | 288 (7.3%) |
| 10:00 AM to 10:59 AM | 85 (1.8%) | 65 (1.7%) |
| 11:00 AM to 11:59 AM | 207 (4.4%) | 59 (1.5%) |
| 12:00 PM to 3:59 PM | 409 (8.8%) | 263 (6.7%) |
| 4:00 PM to 11:59 PM | 337 (7.2%) | 264 (6.7%) |
| Total | 4,656 (100.0%) | 3,940 (100.0%) |
Housing Occupancy in Iosco County
Occupancy by Ownership in Iosco County
Of the total 11,558 dwellings in Iosco County, owner-occupied units account for 9,368 (81.0%), while renter-occupied units make up 2,190 (19.0%).

| Occupancy | # Housing Units | % Housing Units |
| Owner Occupied Housing Units | 9,368 | 81.0% |
| Renter-Occupied Housing Units | 2,190 | 19.0% |
| Total Occupied Housing Units | 11,558 | 100.0% |
Occupancy by Household Size in Iosco County
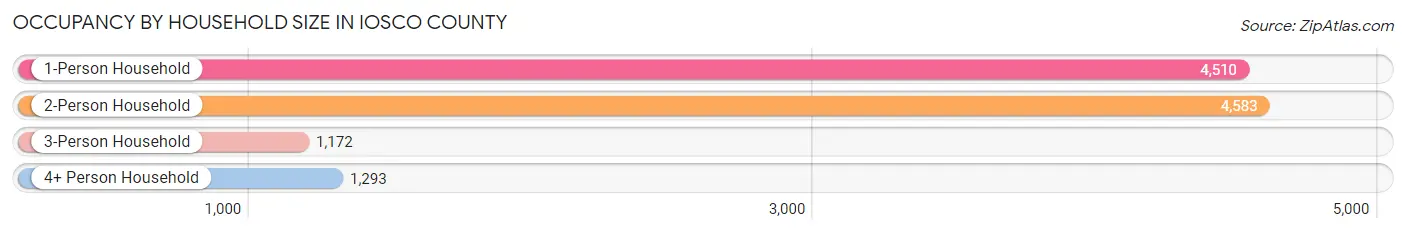
| Household Size | # Housing Units | % Housing Units |
| 1-Person Household | 4,510 | 39.0% |
| 2-Person Household | 4,583 | 39.7% |
| 3-Person Household | 1,172 | 10.1% |
| 4+ Person Household | 1,293 | 11.2% |
| Total Housing Units | 11,558 | 100.0% |
Occupancy by Ownership by Household Size in Iosco County
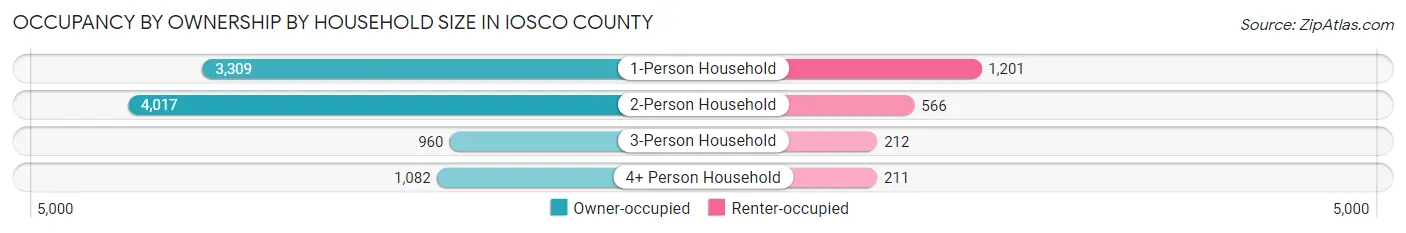
| Household Size | Owner-occupied | Renter-occupied |
| 1-Person Household | 3,309 (73.4%) | 1,201 (26.6%) |
| 2-Person Household | 4,017 (87.6%) | 566 (12.3%) |
| 3-Person Household | 960 (81.9%) | 212 (18.1%) |
| 4+ Person Household | 1,082 (83.7%) | 211 (16.3%) |
| Total Housing Units | 9,368 (81.0%) | 2,190 (19.0%) |
Occupancy by Educational Attainment in Iosco County
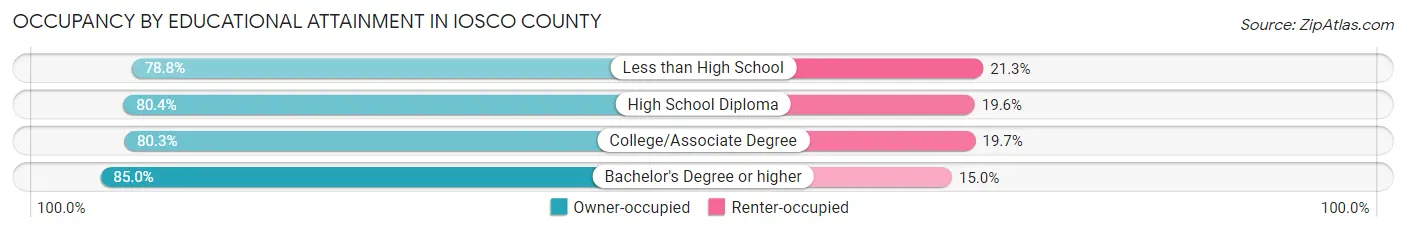
| Household Size | Owner-occupied | Renter-occupied |
| Less than High School | 860 (78.7%) | 232 (21.2%) |
| High School Diploma | 3,271 (80.4%) | 796 (19.6%) |
| College/Associate Degree | 3,429 (80.3%) | 842 (19.7%) |
| Bachelor's Degree or higher | 1,808 (85.0%) | 320 (15.0%) |
Occupancy by Age of Householder in Iosco County
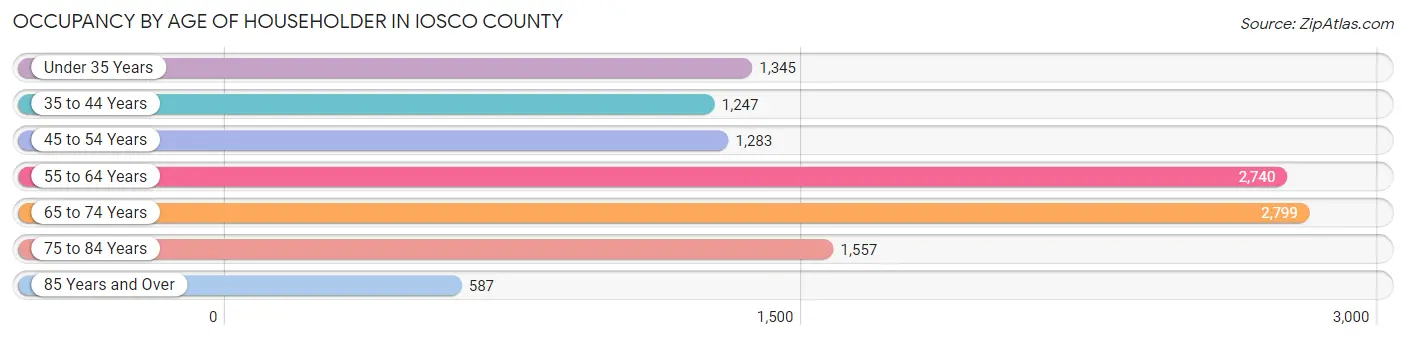
| Age Bracket | # Households | % Households |
| Under 35 Years | 1,345 | 11.6% |
| 35 to 44 Years | 1,247 | 10.8% |
| 45 to 54 Years | 1,283 | 11.1% |
| 55 to 64 Years | 2,740 | 23.7% |
| 65 to 74 Years | 2,799 | 24.2% |
| 75 to 84 Years | 1,557 | 13.5% |
| 85 Years and Over | 587 | 5.1% |
| Total | 11,558 | 100.0% |
Housing Finances in Iosco County
Median Income by Occupancy in Iosco County
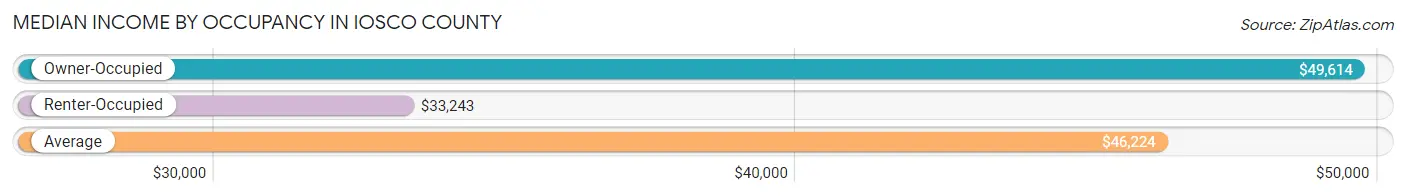
| Occupancy Type | # Households | Median Income |
| Owner-Occupied | 9,368 (81.0%) | $49,614 |
| Renter-Occupied | 2,190 (19.0%) | $33,243 |
| Average | 11,558 (100.0%) | $46,224 |
Occupancy by Householder Income Bracket in Iosco County
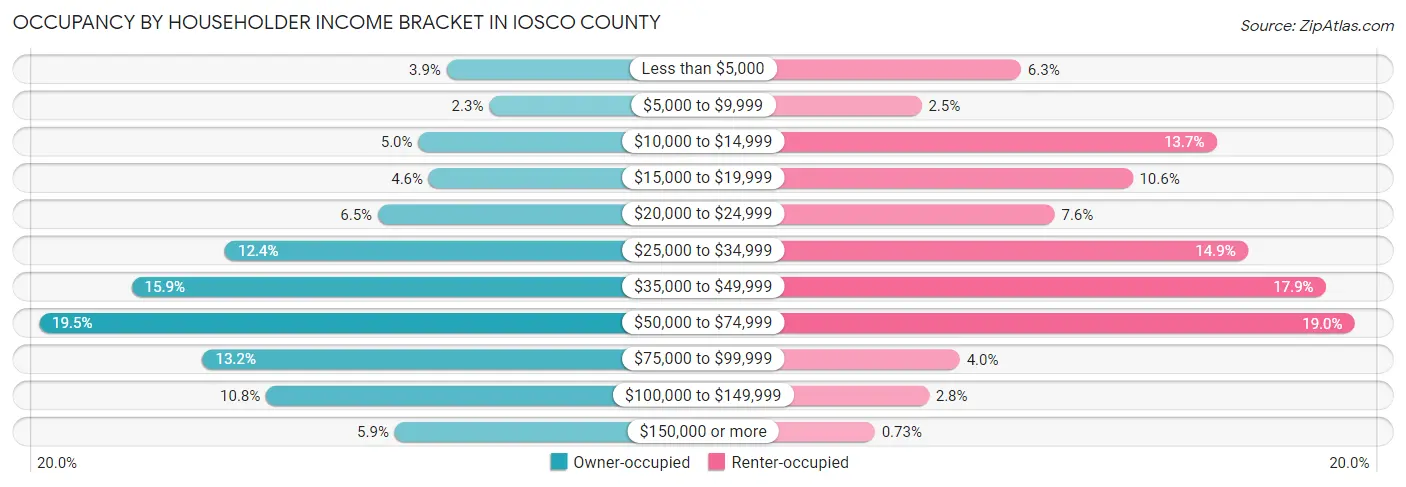
| Income Bracket | Owner-occupied | Renter-occupied |
| Less than $5,000 | 367 (3.9%) | 138 (6.3%) |
| $5,000 to $9,999 | 215 (2.3%) | 55 (2.5%) |
| $10,000 to $14,999 | 468 (5.0%) | 301 (13.7%) |
| $15,000 to $19,999 | 431 (4.6%) | 231 (10.5%) |
| $20,000 to $24,999 | 613 (6.5%) | 166 (7.6%) |
| $25,000 to $34,999 | 1,158 (12.4%) | 327 (14.9%) |
| $35,000 to $49,999 | 1,491 (15.9%) | 392 (17.9%) |
| $50,000 to $74,999 | 1,822 (19.5%) | 416 (19.0%) |
| $75,000 to $99,999 | 1,238 (13.2%) | 87 (4.0%) |
| $100,000 to $149,999 | 1,012 (10.8%) | 61 (2.8%) |
| $150,000 or more | 553 (5.9%) | 16 (0.7%) |
| Total | 9,368 (100.0%) | 2,190 (100.0%) |
Monthly Housing Cost Tiers in Iosco County
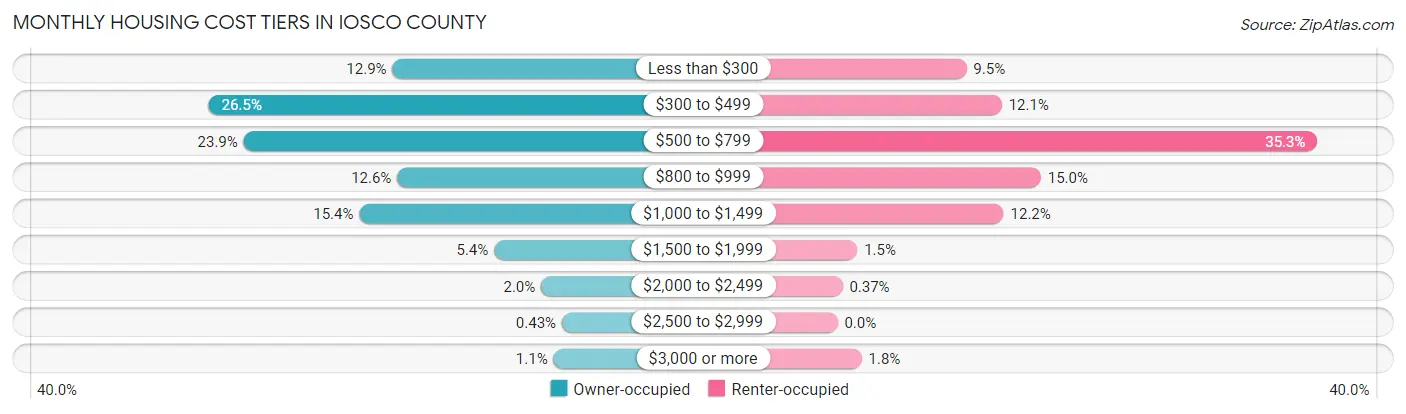
| Monthly Cost | Owner-occupied | Renter-occupied |
| Less than $300 | 1,209 (12.9%) | 208 (9.5%) |
| $300 to $499 | 2,478 (26.5%) | 265 (12.1%) |
| $500 to $799 | 2,236 (23.9%) | 774 (35.3%) |
| $800 to $999 | 1,177 (12.6%) | 328 (15.0%) |
| $1,000 to $1,499 | 1,438 (15.3%) | 268 (12.2%) |
| $1,500 to $1,999 | 508 (5.4%) | 32 (1.5%) |
| $2,000 to $2,499 | 184 (2.0%) | 8 (0.4%) |
| $2,500 to $2,999 | 40 (0.4%) | 0 (0.0%) |
| $3,000 or more | 98 (1.1%) | 39 (1.8%) |
| Total | 9,368 (100.0%) | 2,190 (100.0%) |
Physical Housing Characteristics in Iosco County
Housing Structures in Iosco County

| Structure Type | # Housing Units | % Housing Units |
| Single Unit, Detached | 9,529 | 82.5% |
| Single Unit, Attached | 383 | 3.3% |
| 2 Unit Apartments | 137 | 1.2% |
| 3 or 4 Unit Apartments | 194 | 1.7% |
| 5 to 9 Unit Apartments | 270 | 2.3% |
| 10 or more Apartments | 394 | 3.4% |
| Mobile Home / Other | 651 | 5.6% |
| Total | 11,558 | 100.0% |
Housing Structures by Occupancy in Iosco County
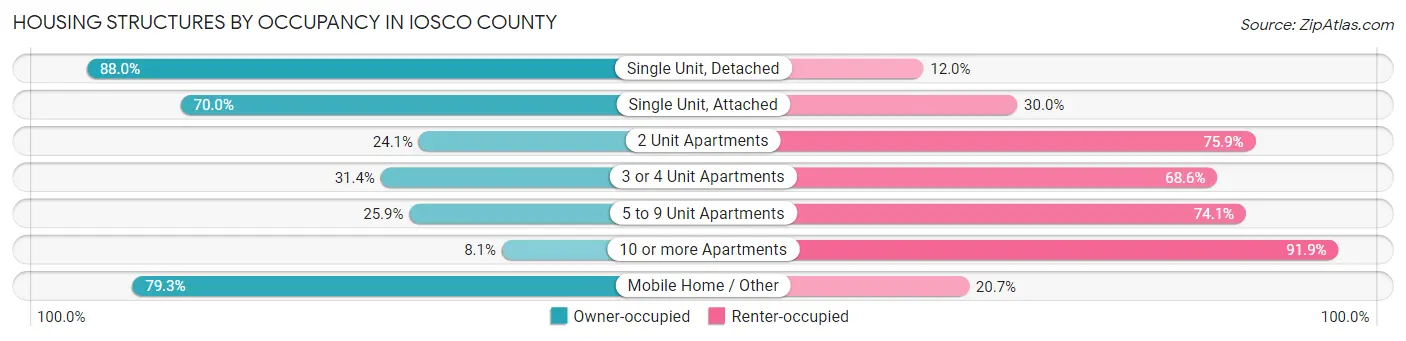
| Structure Type | Owner-occupied | Renter-occupied |
| Single Unit, Detached | 8,388 (88.0%) | 1,141 (12.0%) |
| Single Unit, Attached | 268 (70.0%) | 115 (30.0%) |
| 2 Unit Apartments | 33 (24.1%) | 104 (75.9%) |
| 3 or 4 Unit Apartments | 61 (31.4%) | 133 (68.6%) |
| 5 to 9 Unit Apartments | 70 (25.9%) | 200 (74.1%) |
| 10 or more Apartments | 32 (8.1%) | 362 (91.9%) |
| Mobile Home / Other | 516 (79.3%) | 135 (20.7%) |
| Total | 9,368 (81.0%) | 2,190 (19.0%) |
Housing Structures by Number of Rooms in Iosco County
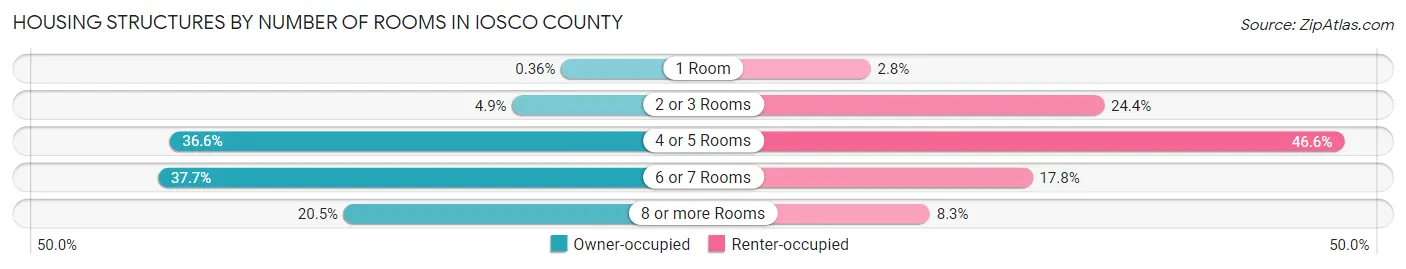
| Number of Rooms | Owner-occupied | Renter-occupied |
| 1 Room | 34 (0.4%) | 62 (2.8%) |
| 2 or 3 Rooms | 457 (4.9%) | 535 (24.4%) |
| 4 or 5 Rooms | 3,430 (36.6%) | 1,021 (46.6%) |
| 6 or 7 Rooms | 3,529 (37.7%) | 390 (17.8%) |
| 8 or more Rooms | 1,918 (20.5%) | 182 (8.3%) |
| Total | 9,368 (100.0%) | 2,190 (100.0%) |
Housing Structure by Heating Type in Iosco County
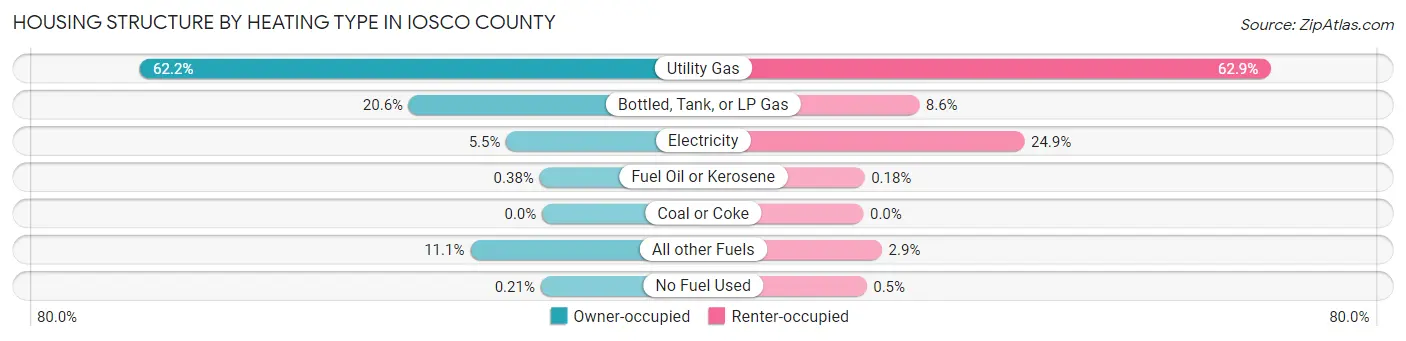
| Heating Type | Owner-occupied | Renter-occupied |
| Utility Gas | 5,823 (62.2%) | 1,378 (62.9%) |
| Bottled, Tank, or LP Gas | 1,929 (20.6%) | 189 (8.6%) |
| Electricity | 519 (5.5%) | 545 (24.9%) |
| Fuel Oil or Kerosene | 36 (0.4%) | 4 (0.2%) |
| Coal or Coke | 0 (0.0%) | 0 (0.0%) |
| All other Fuels | 1,041 (11.1%) | 63 (2.9%) |
| No Fuel Used | 20 (0.2%) | 11 (0.5%) |
| Total | 9,368 (100.0%) | 2,190 (100.0%) |
Household Vehicle Usage in Iosco County
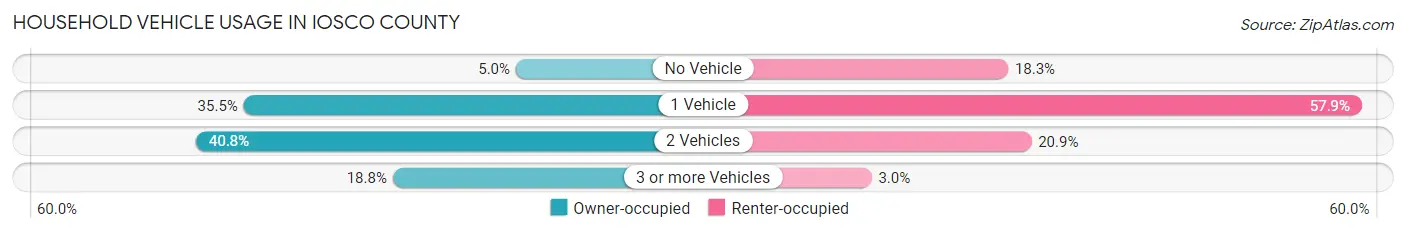
| Vehicles per Household | Owner-occupied | Renter-occupied |
| No Vehicle | 466 (5.0%) | 400 (18.3%) |
| 1 Vehicle | 3,322 (35.5%) | 1,268 (57.9%) |
| 2 Vehicles | 3,823 (40.8%) | 457 (20.9%) |
| 3 or more Vehicles | 1,757 (18.8%) | 65 (3.0%) |
| Total | 9,368 (100.0%) | 2,190 (100.0%) |
Real Estate & Mortgages in Iosco County
Real Estate and Mortgage Overview in Iosco County
| Characteristic | Without Mortgage | With Mortgage |
| Housing Units | 4,859 | 4,509 |
| Median Property Value | $111,700 | $127,600 |
| Median Household Income | $42,254 | $325 |
| Monthly Housing Costs | $385 | $91 |
| Real Estate Taxes | $1,141 | $213 |
Property Value by Mortgage Status in Iosco County
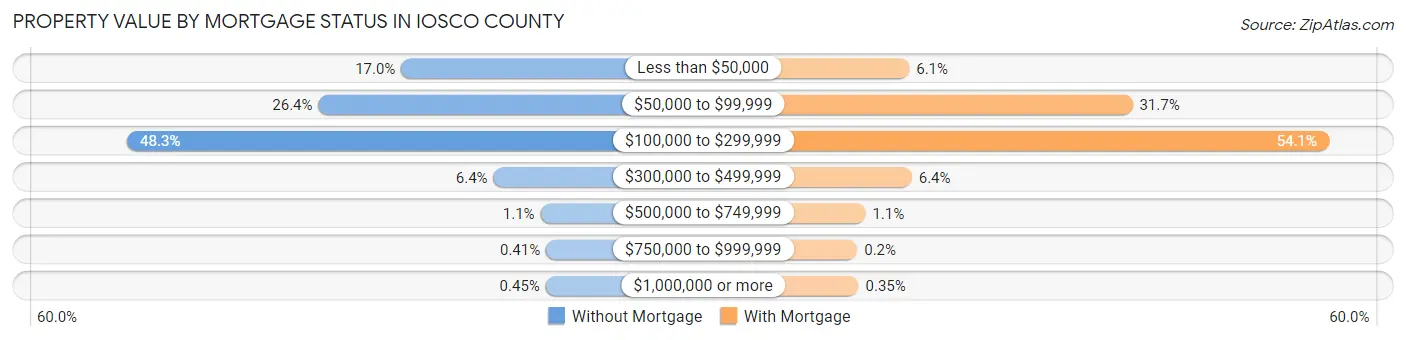
| Property Value | Without Mortgage | With Mortgage |
| Less than $50,000 | 824 (17.0%) | 277 (6.1%) |
| $50,000 to $99,999 | 1,284 (26.4%) | 1,427 (31.7%) |
| $100,000 to $299,999 | 2,346 (48.3%) | 2,439 (54.1%) |
| $300,000 to $499,999 | 312 (6.4%) | 290 (6.4%) |
| $500,000 to $749,999 | 51 (1.1%) | 51 (1.1%) |
| $750,000 to $999,999 | 20 (0.4%) | 9 (0.2%) |
| $1,000,000 or more | 22 (0.4%) | 16 (0.4%) |
| Total | 4,859 (100.0%) | 4,509 (100.0%) |
Household Income by Mortgage Status in Iosco County
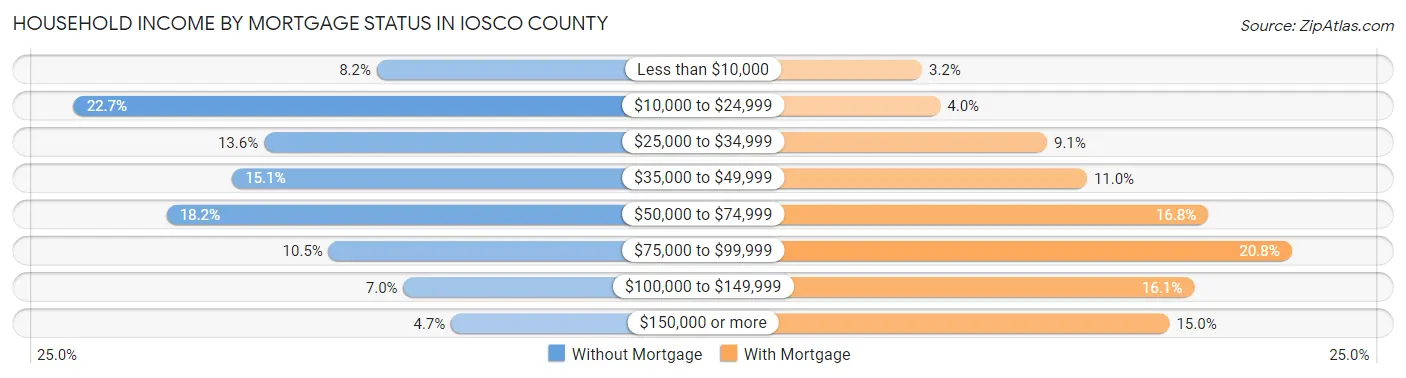
| Household Income | Without Mortgage | With Mortgage |
| Less than $10,000 | 400 (8.2%) | 143 (3.2%) |
| $10,000 to $24,999 | 1,101 (22.7%) | 182 (4.0%) |
| $25,000 to $34,999 | 661 (13.6%) | 411 (9.1%) |
| $35,000 to $49,999 | 734 (15.1%) | 497 (11.0%) |
| $50,000 to $74,999 | 886 (18.2%) | 757 (16.8%) |
| $75,000 to $99,999 | 511 (10.5%) | 936 (20.8%) |
| $100,000 to $149,999 | 338 (7.0%) | 727 (16.1%) |
| $150,000 or more | 228 (4.7%) | 674 (14.9%) |
| Total | 4,859 (100.0%) | 4,509 (100.0%) |
Property Value to Household Income Ratio in Iosco County
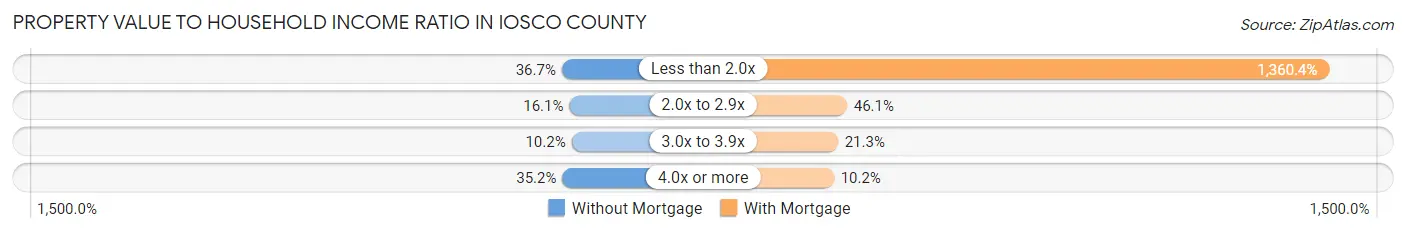
| Value-to-Income Ratio | Without Mortgage | With Mortgage |
| Less than 2.0x | 1,784 (36.7%) | 61,341 (1,360.4%) |
| 2.0x to 2.9x | 781 (16.1%) | 2,077 (46.1%) |
| 3.0x to 3.9x | 495 (10.2%) | 961 (21.3%) |
| 4.0x or more | 1,708 (35.1%) | 461 (10.2%) |
| Total | 4,859 (100.0%) | 4,509 (100.0%) |
Real Estate Taxes by Mortgage Status in Iosco County
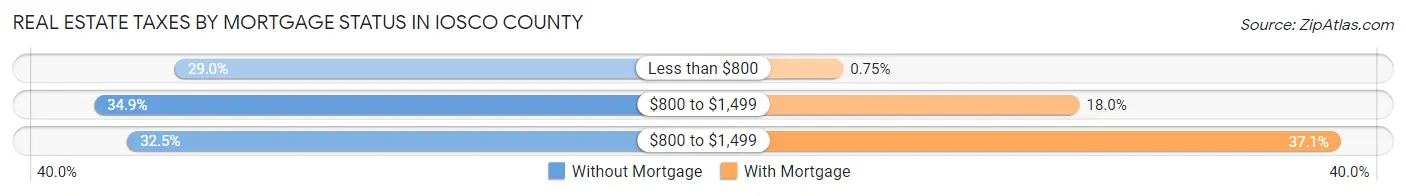
| Property Taxes | Without Mortgage | With Mortgage |
| Less than $800 | 1,410 (29.0%) | 34 (0.7%) |
| $800 to $1,499 | 1,697 (34.9%) | 812 (18.0%) |
| $800 to $1,499 | 1,579 (32.5%) | 1,673 (37.1%) |
| Total | 4,859 (100.0%) | 4,509 (100.0%) |
Health & Disability in Iosco County
Health Insurance Coverage by Age in Iosco County

| Age Bracket | With Coverage | Without Coverage |
| Under 6 Years | 1,407 (94.6%) | 81 (5.4%) |
| 6 to 18 Years | 2,772 (94.0%) | 178 (6.0%) |
| 19 to 25 Years | 1,192 (80.9%) | 281 (19.1%) |
| 26 to 34 Years | 1,910 (89.4%) | 227 (10.6%) |
| 35 to 44 Years | 2,032 (89.0%) | 250 (11.0%) |
| 45 to 54 Years | 2,529 (90.8%) | 255 (9.2%) |
| 55 to 64 Years | 4,159 (92.9%) | 319 (7.1%) |
| 65 to 74 Years | 4,386 (99.5%) | 21 (0.5%) |
| 75 Years and older | 3,041 (99.9%) | 3 (0.1%) |
| Total | 23,428 (93.5%) | 1,615 (6.5%) |
Health Insurance Coverage by Citizenship Status in Iosco County

| Citizenship Status | With Coverage | Without Coverage |
| Native Born | 1,407 (94.6%) | 81 (5.4%) |
| Foreign Born, Citizen | 2,772 (94.0%) | 178 (6.0%) |
| Foreign Born, not a Citizen | 1,192 (80.9%) | 281 (19.1%) |
Health Insurance Coverage by Household Income in Iosco County
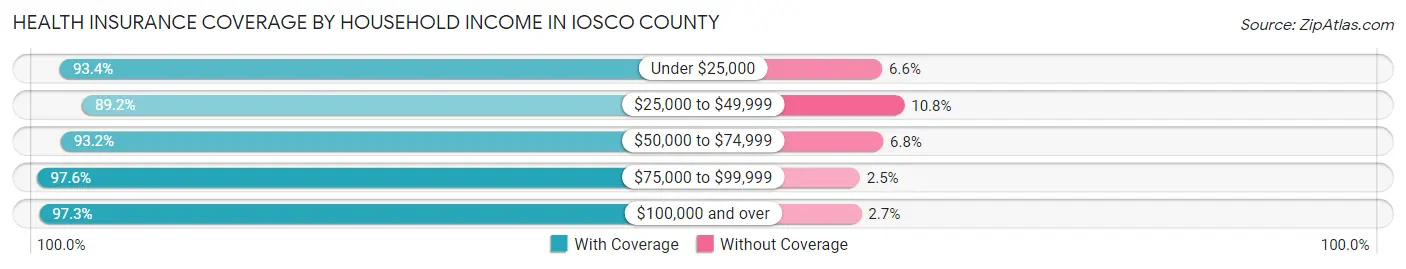
| Household Income | With Coverage | Without Coverage |
| Under $25,000 | 3,913 (93.4%) | 278 (6.6%) |
| $25,000 to $49,999 | 6,214 (89.2%) | 750 (10.8%) |
| $50,000 to $74,999 | 4,991 (93.2%) | 364 (6.8%) |
| $75,000 to $99,999 | 3,431 (97.6%) | 86 (2.5%) |
| $100,000 and over | 4,828 (97.3%) | 136 (2.7%) |
Public vs Private Health Insurance Coverage by Age in Iosco County

| Age Bracket | Public Insurance | Private Insurance |
| Under 6 | 810 (54.4%) | 784 (52.7%) |
| 6 to 18 Years | 1,451 (49.2%) | 1,555 (52.7%) |
| 19 to 25 Years | 406 (27.6%) | 824 (55.9%) |
| 25 to 34 Years | 586 (27.4%) | 1,455 (68.1%) |
| 35 to 44 Years | 709 (31.1%) | 1,466 (64.2%) |
| 45 to 54 Years | 1,007 (36.2%) | 1,669 (60.0%) |
| 55 to 64 Years | 1,636 (36.5%) | 3,038 (67.8%) |
| 65 to 74 Years | 4,303 (97.6%) | 2,740 (62.2%) |
| 75 Years and over | 2,998 (98.5%) | 2,288 (75.2%) |
| Total | 13,906 (55.5%) | 15,819 (63.2%) |
Disability Status by Sex by Age in Iosco County
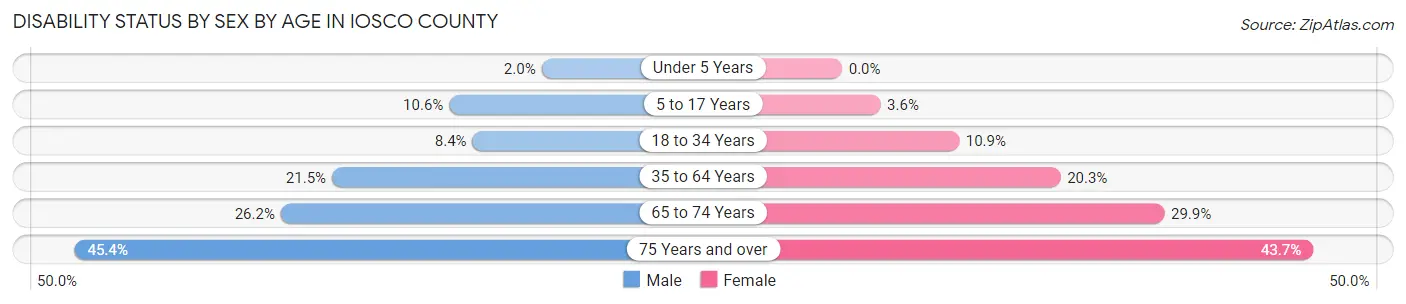
| Age Bracket | Male | Female |
| Under 5 Years | 13 (2.0%) | 0 (0.0%) |
| 5 to 17 Years | 155 (10.6%) | 55 (3.6%) |
| 18 to 34 Years | 171 (8.4%) | 201 (10.9%) |
| 35 to 64 Years | 1,020 (21.5%) | 972 (20.3%) |
| 65 to 74 Years | 586 (26.2%) | 650 (29.9%) |
| 75 Years and over | 635 (45.4%) | 719 (43.7%) |
Disability Class by Sex by Age in Iosco County
Disability Class: Hearing Difficulty
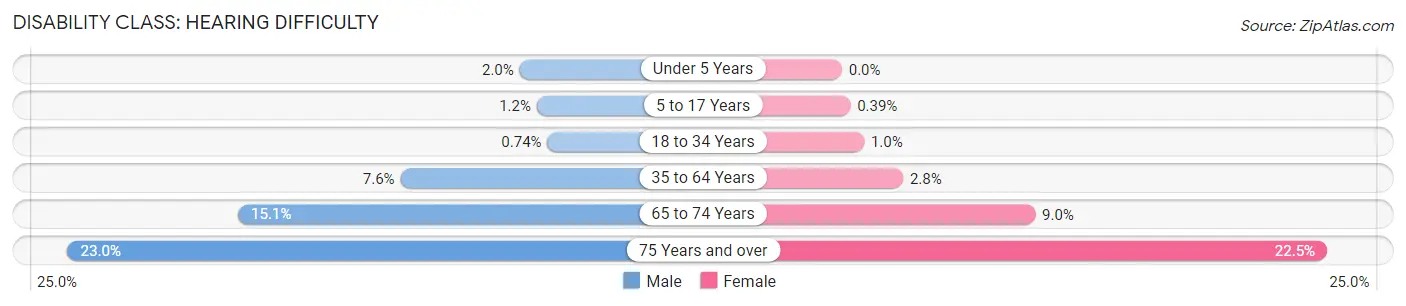
| Age Bracket | Male | Female |
| Under 5 Years | 13 (2.0%) | 0 (0.0%) |
| 5 to 17 Years | 18 (1.2%) | 6 (0.4%) |
| 18 to 34 Years | 15 (0.7%) | 19 (1.0%) |
| 35 to 64 Years | 359 (7.6%) | 136 (2.8%) |
| 65 to 74 Years | 337 (15.1%) | 195 (9.0%) |
| 75 Years and over | 322 (23.0%) | 370 (22.5%) |
Disability Class: Vision Difficulty
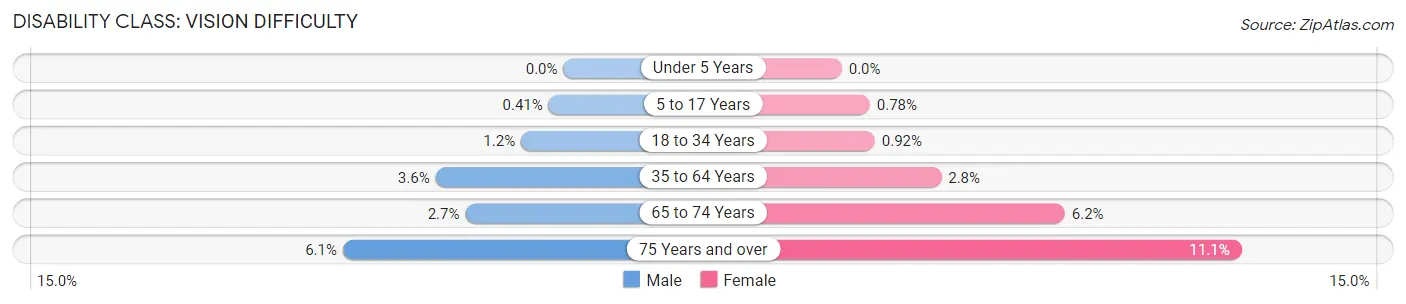
| Age Bracket | Male | Female |
| Under 5 Years | 0 (0.0%) | 0 (0.0%) |
| 5 to 17 Years | 6 (0.4%) | 12 (0.8%) |
| 18 to 34 Years | 24 (1.2%) | 17 (0.9%) |
| 35 to 64 Years | 169 (3.6%) | 133 (2.8%) |
| 65 to 74 Years | 61 (2.7%) | 135 (6.2%) |
| 75 Years and over | 86 (6.1%) | 183 (11.1%) |
Disability Class: Cognitive Difficulty
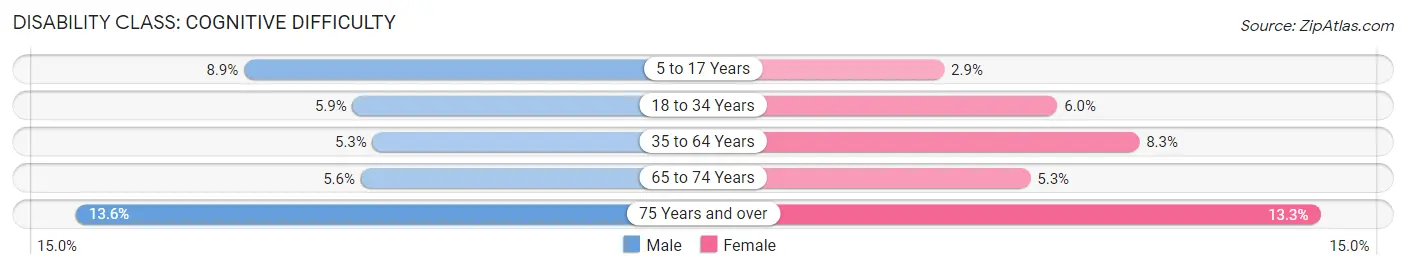
| Age Bracket | Male | Female |
| 5 to 17 Years | 130 (8.9%) | 44 (2.9%) |
| 18 to 34 Years | 119 (5.9%) | 111 (6.0%) |
| 35 to 64 Years | 252 (5.3%) | 397 (8.3%) |
| 65 to 74 Years | 126 (5.6%) | 114 (5.2%) |
| 75 Years and over | 190 (13.6%) | 219 (13.3%) |
Disability Class: Ambulatory Difficulty
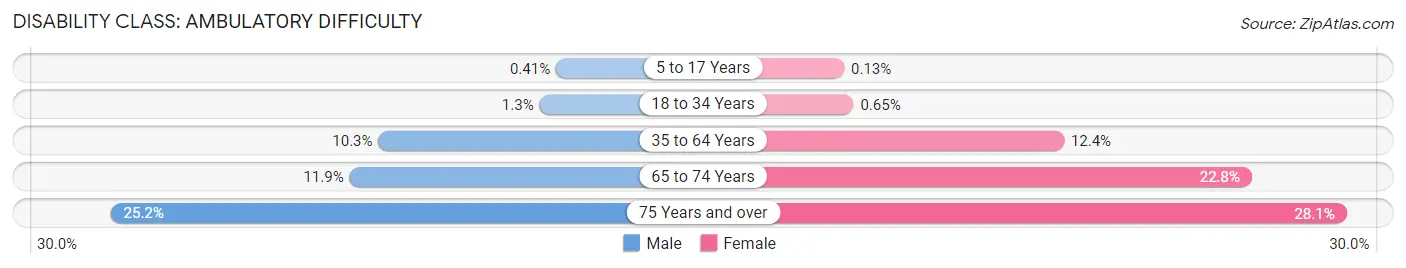
| Age Bracket | Male | Female |
| 5 to 17 Years | 6 (0.4%) | 2 (0.1%) |
| 18 to 34 Years | 27 (1.3%) | 12 (0.6%) |
| 35 to 64 Years | 489 (10.3%) | 593 (12.4%) |
| 65 to 74 Years | 266 (11.9%) | 496 (22.8%) |
| 75 Years and over | 353 (25.2%) | 462 (28.1%) |
Disability Class: Self-Care Difficulty
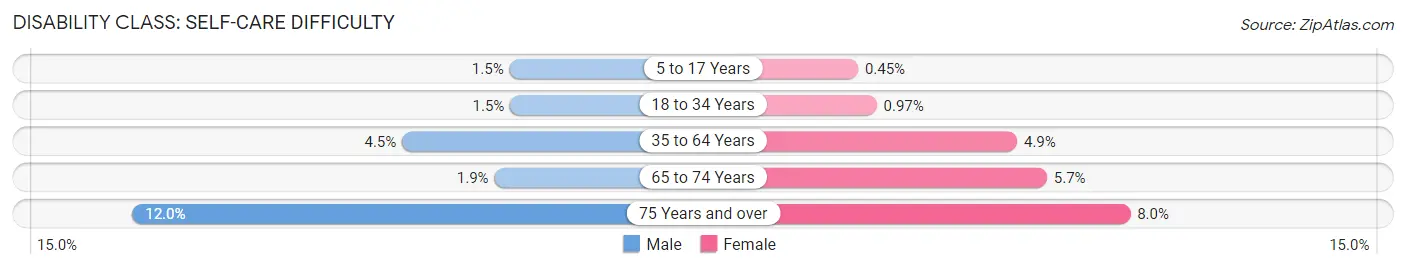
| Age Bracket | Male | Female |
| 5 to 17 Years | 22 (1.5%) | 7 (0.4%) |
| 18 to 34 Years | 30 (1.5%) | 18 (1.0%) |
| 35 to 64 Years | 213 (4.5%) | 234 (4.9%) |
| 65 to 74 Years | 43 (1.9%) | 124 (5.7%) |
| 75 Years and over | 168 (12.0%) | 132 (8.0%) |
Technology Access in Iosco County
Computing Device Access in Iosco County
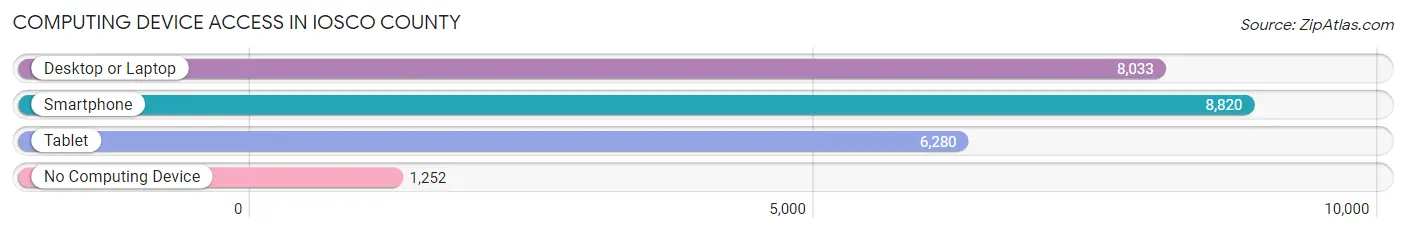
| Device Type | # Households | % Households |
| Desktop or Laptop | 8,033 | 69.5% |
| Smartphone | 8,820 | 76.3% |
| Tablet | 6,280 | 54.3% |
| No Computing Device | 1,252 | 10.8% |
| Total | 11,558 | 100.0% |
Internet Access in Iosco County

| Internet Type | # Households | % Households |
| Dial-Up Internet | 64 | 0.5% |
| Broadband Home | 6,996 | 60.5% |
| Cellular Data Only | 1,528 | 13.2% |
| Satellite Internet | 1,030 | 8.9% |
| No Internet | 2,069 | 17.9% |
| Total | 11,558 | 100.0% |
Iosco County Summary
Iosco County is located in the northeastern part of Michigan’s Lower Peninsula. It is bordered by Alcona County to the north, Alpena County to the east, Arenac County to the south, and Ogemaw County to the west. The county seat is Tawas City. Iosco County is part of the Thumb region of Michigan and is known for its natural beauty, outdoor recreation, and small-town charm.
History
Iosco County was established in 1840 and was named after the Ojibwa word for “water”. The county was originally part of Alpena County, but was split off in 1857. The county was largely rural until the late 19th century, when logging and lumbering became important industries. The county’s population grew rapidly during this period, and many small towns were established.
The county’s economy was further diversified in the early 20th century with the development of tourism and recreation. The county’s many lakes and rivers, as well as its proximity to Lake Huron, made it a popular destination for fishing, boating, and other outdoor activities.
Geography
Iosco County covers an area of 1,072 square miles and is home to numerous lakes, rivers, and streams. The Au Sable River runs through the county, and Lake Huron forms its eastern border. The county is largely forested, with large tracts of northern hardwood and coniferous trees.
The county’s highest point is located in the Huron National Forest, at an elevation of 1,945 feet. The county’s lowest point is located along the Au Sable River, at an elevation of 590 feet.
Economy
Iosco County’s economy is largely based on tourism and recreation. The county’s many lakes and rivers, as well as its proximity to Lake Huron, make it a popular destination for fishing, boating, and other outdoor activities. The county is also home to several state parks, including the Huron National Forest and the Tawas Point State Park.
The county’s economy is also supported by manufacturing, agriculture, and forestry. The county’s largest employers include the Tawas Bay Resort, the Huron National Forest, and the Iosco County Medical Center.
Demographics
As of the 2010 census, Iosco County had a population of 25,887. The county’s population is largely white (94.3%), with small percentages of African American (2.2%), Native American (1.2%), Asian (0.5%), and Hispanic or Latino (1.2%) residents.
The median household income in Iosco County is $41,945, and the median home value is $117,400. The county’s poverty rate is 13.2%, and the unemployment rate is 6.2%. The county’s largest cities are East Tawas (population 2,845) and Oscoda (population 2,717).
Common Questions
What is the Total Population of Iosco County?
Total Population of Iosco County is 25,319.
What is the Total Male Population of Iosco County?
Total Male Population of Iosco County is 12,647.
What is the Total Female Population of Iosco County?
Total Female Population of Iosco County is 12,672.
What is the Ratio of Males per 100 Females in Iosco County?
There are 99.80 Males per 100 Females in Iosco County.
What is the Ratio of Females per 100 Males in Iosco County?
There are 100.20 Females per 100 Males in Iosco County.
What is the Median Population Age in Iosco County?
Median Population Age in Iosco County is 53.1 Years.
What is the Average Family Size in Iosco County
Average Family Size in Iosco County is 2.9 People.
What is the Average Household Size in Iosco County
Average Household Size in Iosco County is 2.2 People.
What is Per Capita Income in Iosco County?
Per Capita income in Iosco County is $28,301.
What is the Median Family Income in Iosco County?
Median Family Income in Iosco County is $58,884.
What is the Median Household income in Iosco County?
Median Household Income in Iosco County is $46,224.
What is Income or Wage Gap in Iosco County?
Income or Wage Gap in Iosco County is 35.6%.
Women in Iosco County earn 64.4 cents for every dollar earned by a man.
What is Family Income Deficit in Iosco County?
Family Income Deficit in Iosco County is $8,564.
Families that are below poverty line in Iosco County earn $8,564 less on average than the poverty threshold level.
What is Inequality or Gini Index in Iosco County?
Inequality or Gini Index in Iosco County is 0.43.
How Large is the Labor Force in Iosco County?
There are 10,144 People in the Labor Forcein in Iosco County.
What is the Percentage of People in the Labor Force in Iosco County?
46.9% of People are in the Labor Force in Iosco County.
What is the Unemployment Rate in Iosco County?
Unemployment Rate in Iosco County is 7.4%.