Ionia County, MI
Ionia County Map
Ionia County Overview
66,663
TOTAL POPULATION
36,307
MALE POPULATION
30,356
FEMALE POPULATION
119.60
MALES / 100 FEMALES
83.61
FEMALES / 100 MALES
39.1
MEDIAN AGE
3.3
AVG FAMILY SIZE
2.8
AVG HOUSEHOLD SIZE
$29,736
PER CAPITA INCOME
$80,516
AVG FAMILY INCOME
$71,720
AVG HOUSEHOLD INCOME
27.7%
WAGE / INCOME GAP [ % ]
72.3¢/ $1
WAGE / INCOME GAP [ $ ]
$12,848
FAMILY INCOME DEFICIT
0.38
INEQUALITY / GINI INDEX
32,266
LABOR FORCE [ PEOPLE ]
59.5%
PERCENT IN LABOR FORCE
5.3%
UNEMPLOYMENT RATE
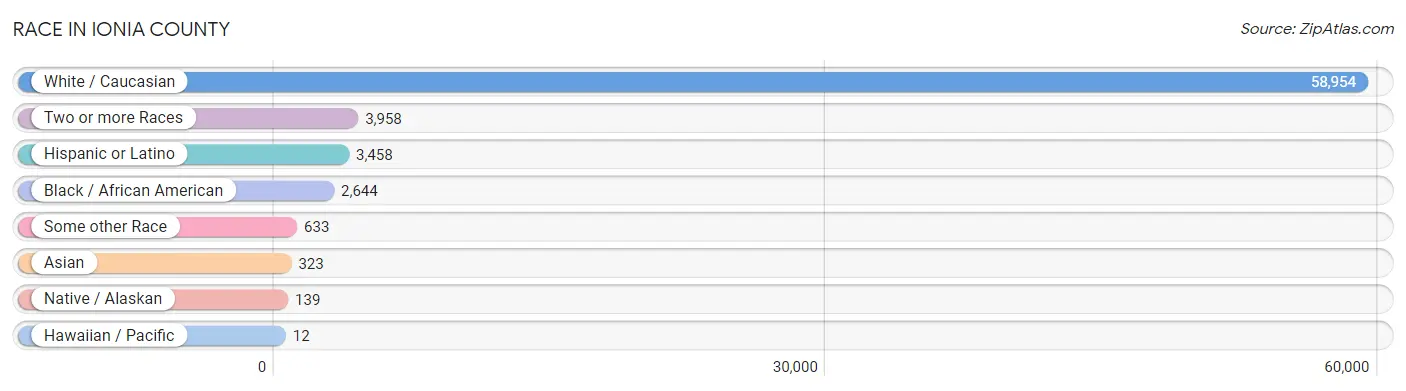
Race in Ionia County
The most populous races in Ionia County are White / Caucasian (58,954 | 88.4%), Two or more Races (3,958 | 5.9%), and Hispanic or Latino (3,458 | 5.2%).
| Race | # Population | % Population |
| Asian | 323 | 0.5% |
| Black / African American | 2,644 | 4.0% |
| Hawaiian / Pacific | 12 | 0.0% |
| Hispanic or Latino | 3,458 | 5.2% |
| Native / Alaskan | 139 | 0.2% |
| White / Caucasian | 58,954 | 88.4% |
| Two or more Races | 3,958 | 5.9% |
| Some other Race | 633 | 0.9% |
| Total | 66,663 | 100.0% |
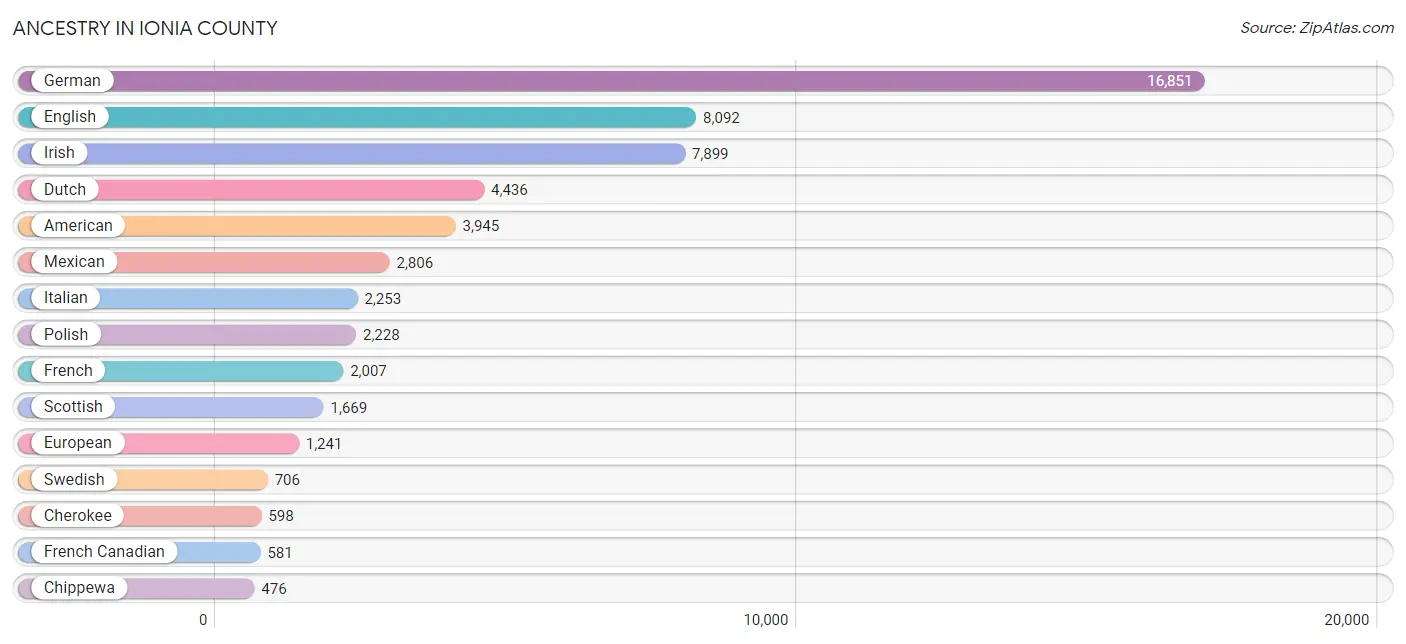
Ancestry in Ionia County
The most populous ancestries reported in Ionia County are German (16,851 | 25.3%), English (8,092 | 12.1%), Irish (7,899 | 11.8%), Dutch (4,436 | 6.7%), and American (3,945 | 5.9%), together accounting for 61.8% of all Ionia County residents.
| Ancestry | # Population | % Population |
| African | 198 | 0.3% |
| Albanian | 5 | 0.0% |
| American | 3,945 | 5.9% |
| Apache | 8 | 0.0% |
| Arab | 147 | 0.2% |
| Armenian | 27 | 0.0% |
| Austrian | 16 | 0.0% |
| Belgian | 190 | 0.3% |
| Bhutanese | 44 | 0.1% |
| Blackfeet | 174 | 0.3% |
| British | 230 | 0.4% |
| Burmese | 53 | 0.1% |
| Cambodian | 3 | 0.0% |
| Canadian | 196 | 0.3% |
| Celtic | 8 | 0.0% |
| Central American | 92 | 0.1% |
| Central American Indian | 4 | 0.0% |
| Cherokee | 598 | 0.9% |
| Chippewa | 476 | 0.7% |
| Colombian | 6 | 0.0% |
| Comanche | 2 | 0.0% |
| Croatian | 48 | 0.1% |
| Cuban | 7 | 0.0% |
| Czech | 207 | 0.3% |
| Czechoslovakian | 70 | 0.1% |
| Danish | 442 | 0.7% |
| Delaware | 48 | 0.1% |
| Dutch | 4,436 | 6.7% |
| Eastern European | 301 | 0.4% |
| Egyptian | 9 | 0.0% |
| English | 8,092 | 12.1% |
| Ethiopian | 7 | 0.0% |
| European | 1,241 | 1.9% |
| Filipino | 53 | 0.1% |
| Finnish | 165 | 0.3% |
| French | 2,007 | 3.0% |
| French American Indian | 35 | 0.1% |
| French Canadian | 581 | 0.9% |
| German | 16,851 | 25.3% |
| Greek | 15 | 0.0% |
| Guamanian / Chamorro | 65 | 0.1% |
| Guatemalan | 38 | 0.1% |
| Haitian | 11 | 0.0% |
| Hungarian | 304 | 0.5% |
| Indian (Asian) | 228 | 0.3% |
| Irish | 7,899 | 11.8% |
| Israeli | 48 | 0.1% |
| Italian | 2,253 | 3.4% |
| Jamaican | 5 | 0.0% |
| Jordanian | 22 | 0.0% |
| Korean | 72 | 0.1% |
| Latvian | 11 | 0.0% |
| Lebanese | 70 | 0.1% |
| Lithuanian | 103 | 0.2% |
| Macedonian | 6 | 0.0% |
| Malaysian | 5 | 0.0% |
| Maltese | 9 | 0.0% |
| Mexican | 2,806 | 4.2% |
| Mexican American Indian | 12 | 0.0% |
| Moroccan | 65 | 0.1% |
| Native Hawaiian | 9 | 0.0% |
| Nigerian | 15 | 0.0% |
| Northern European | 36 | 0.1% |
| Norwegian | 160 | 0.2% |
| Ottawa | 162 | 0.2% |
| Panamanian | 5 | 0.0% |
| Pennsylvania German | 23 | 0.0% |
| Polish | 2,228 | 3.3% |
| Portuguese | 15 | 0.0% |
| Potawatomi | 22 | 0.0% |
| Puerto Rican | 354 | 0.5% |
| Romanian | 25 | 0.0% |
| Russian | 239 | 0.4% |
| Salvadoran | 49 | 0.1% |
| Samoan | 55 | 0.1% |
| Scandinavian | 130 | 0.2% |
| Scotch-Irish | 340 | 0.5% |
| Scottish | 1,669 | 2.5% |
| Sioux | 83 | 0.1% |
| Slavic | 7 | 0.0% |
| Slovak | 121 | 0.2% |
| Slovene | 9 | 0.0% |
| South American | 34 | 0.1% |
| Spaniard | 13 | 0.0% |
| Spanish | 17 | 0.0% |
| Subsaharan African | 211 | 0.3% |
| Swedish | 706 | 1.1% |
| Swiss | 348 | 0.5% |
| Syrian | 3 | 0.0% |
| Thai | 73 | 0.1% |
| Ukrainian | 42 | 0.1% |
| Venezuelan | 28 | 0.0% |
| Welsh | 207 | 0.3% |
| West Indian | 1 | 0.0% |
| Yugoslavian | 25 | 0.0% | View All 95 Rows |
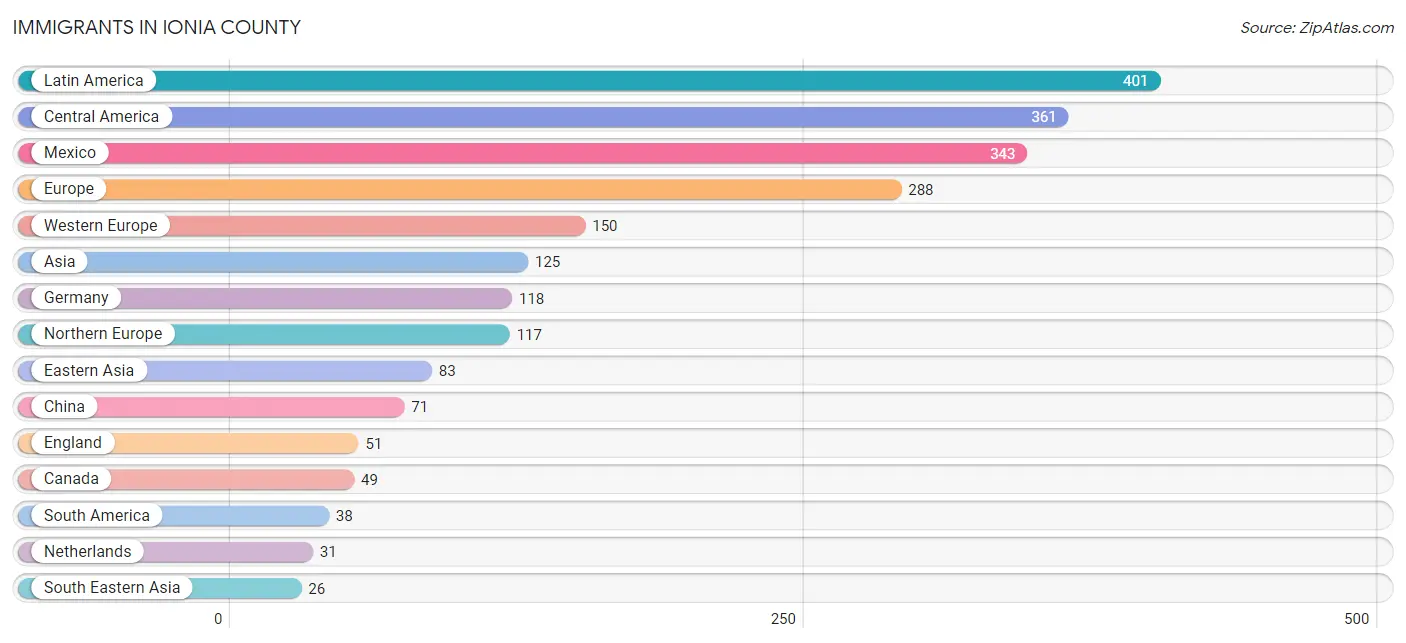
Immigrants in Ionia County
The most numerous immigrant groups reported in Ionia County came from Latin America (401 | 0.6%), Central America (361 | 0.5%), Mexico (343 | 0.5%), Europe (288 | 0.4%), and Western Europe (150 | 0.2%), together accounting for 2.3% of all Ionia County residents.
| Immigration Origin | # Population | % Population |
| Africa | 17 | 0.0% |
| Asia | 125 | 0.2% |
| Australia | 9 | 0.0% |
| Austria | 1 | 0.0% |
| Brazil | 19 | 0.0% |
| Canada | 49 | 0.1% |
| Caribbean | 2 | 0.0% |
| Central America | 361 | 0.5% |
| China | 71 | 0.1% |
| Colombia | 3 | 0.0% |
| Eastern Africa | 13 | 0.0% |
| Eastern Asia | 83 | 0.1% |
| Eastern Europe | 19 | 0.0% |
| El Salvador | 5 | 0.0% |
| England | 51 | 0.1% |
| Ethiopia | 7 | 0.0% |
| Europe | 288 | 0.4% |
| Germany | 118 | 0.2% |
| Guatemala | 13 | 0.0% |
| Guyana | 10 | 0.0% |
| India | 16 | 0.0% |
| Ireland | 13 | 0.0% |
| Jamaica | 2 | 0.0% |
| Korea | 9 | 0.0% |
| Latin America | 401 | 0.6% |
| Mexico | 343 | 0.5% |
| Netherlands | 31 | 0.1% |
| Northern Europe | 117 | 0.2% |
| Norway | 11 | 0.0% |
| Oceania | 9 | 0.0% |
| Philippines | 5 | 0.0% |
| Poland | 5 | 0.0% |
| Romania | 5 | 0.0% |
| Russia | 9 | 0.0% |
| Singapore | 14 | 0.0% |
| South Africa | 4 | 0.0% |
| South America | 38 | 0.1% |
| South Central Asia | 16 | 0.0% |
| South Eastern Asia | 26 | 0.0% |
| Southern Europe | 2 | 0.0% |
| Spain | 2 | 0.0% |
| Thailand | 5 | 0.0% |
| Vietnam | 2 | 0.0% |
| Western Europe | 150 | 0.2% | View All 44 Rows |
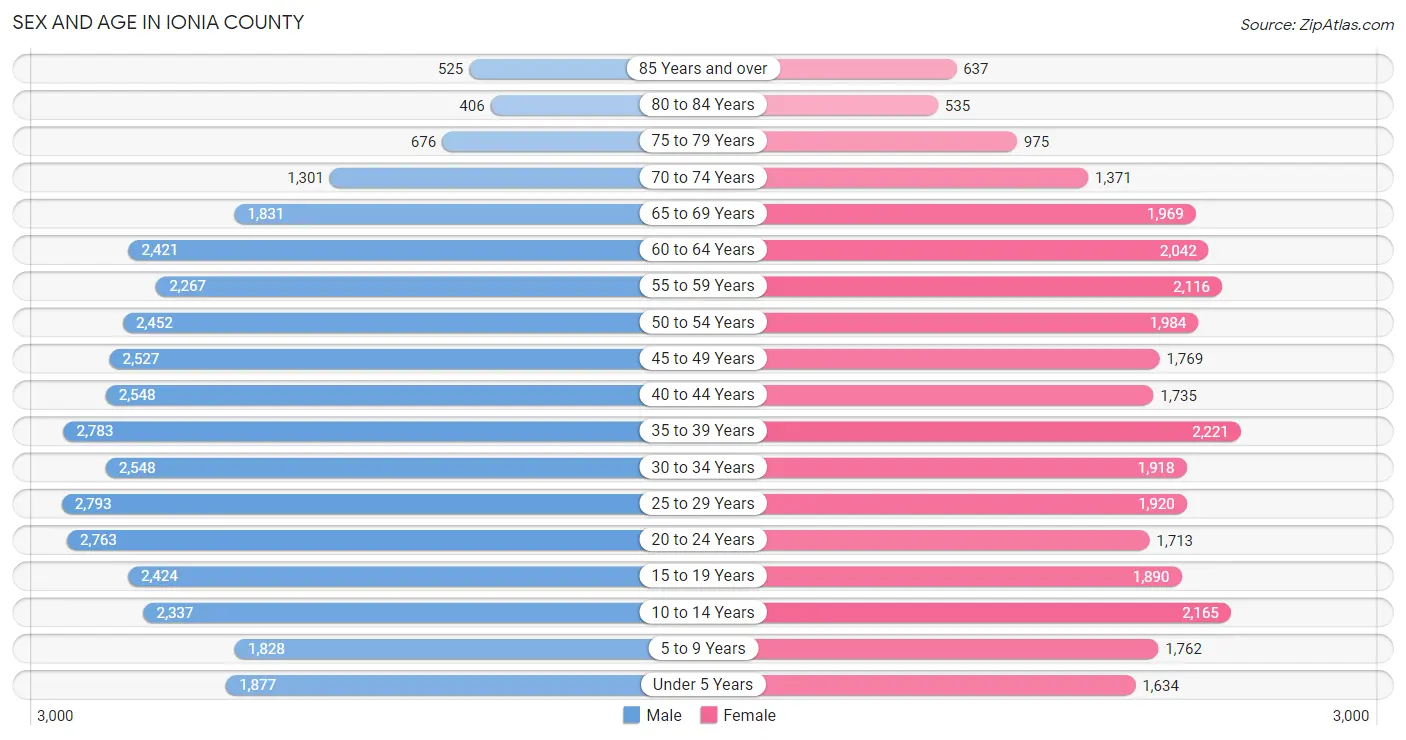
Sex and Age in Ionia County
Sex and Age in Ionia County
The most populous age groups in Ionia County are 25 to 29 Years (2,793 | 7.7%) for men and 35 to 39 Years (2,221 | 7.3%) for women.
| Age Bracket | Male | Female |
| Under 5 Years | 1,877 (5.2%) | 1,634 (5.4%) |
| 5 to 9 Years | 1,828 (5.0%) | 1,762 (5.8%) |
| 10 to 14 Years | 2,337 (6.4%) | 2,165 (7.1%) |
| 15 to 19 Years | 2,424 (6.7%) | 1,890 (6.2%) |
| 20 to 24 Years | 2,763 (7.6%) | 1,713 (5.6%) |
| 25 to 29 Years | 2,793 (7.7%) | 1,920 (6.3%) |
| 30 to 34 Years | 2,548 (7.0%) | 1,918 (6.3%) |
| 35 to 39 Years | 2,783 (7.7%) | 2,221 (7.3%) |
| 40 to 44 Years | 2,548 (7.0%) | 1,735 (5.7%) |
| 45 to 49 Years | 2,527 (7.0%) | 1,769 (5.8%) |
| 50 to 54 Years | 2,452 (6.8%) | 1,984 (6.5%) |
| 55 to 59 Years | 2,267 (6.2%) | 2,116 (7.0%) |
| 60 to 64 Years | 2,421 (6.7%) | 2,042 (6.7%) |
| 65 to 69 Years | 1,831 (5.0%) | 1,969 (6.5%) |
| 70 to 74 Years | 1,301 (3.6%) | 1,371 (4.5%) |
| 75 to 79 Years | 676 (1.9%) | 975 (3.2%) |
| 80 to 84 Years | 406 (1.1%) | 535 (1.8%) |
| 85 Years and over | 525 (1.5%) | 637 (2.1%) |
| Total | 36,307 (100.0%) | 30,356 (100.0%) |
Families and Households in Ionia County
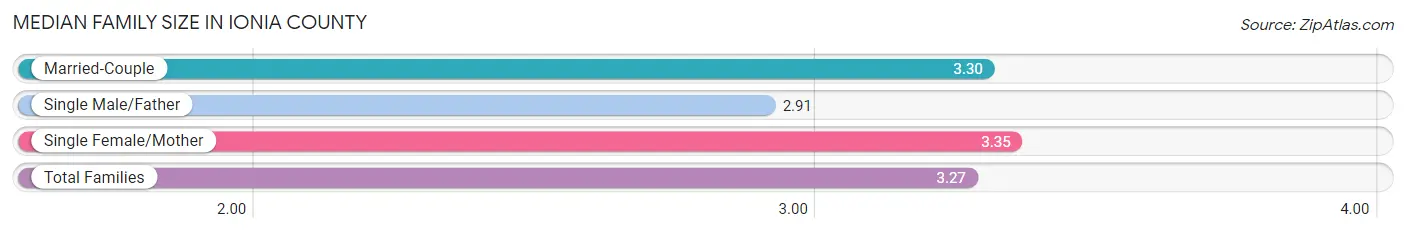
Median Family Size in Ionia County
The median family size in Ionia County is 3.27 persons per family, with single female/mother families (2,099 | 13.4%) accounting for the largest median family size of 3.35 persons per family. On the other hand, single male/father families (1,448 | 9.3%) represent the smallest median family size with 2.91 persons per family.
| Family Type | # Families | Family Size |
| Married-Couple | 12,089 (77.3%) | 3.30 |
| Single Male/Father | 1,448 (9.3%) | 2.91 |
| Single Female/Mother | 2,099 (13.4%) | 3.35 |
| Total Families | 15,636 (100.0%) | 3.27 |
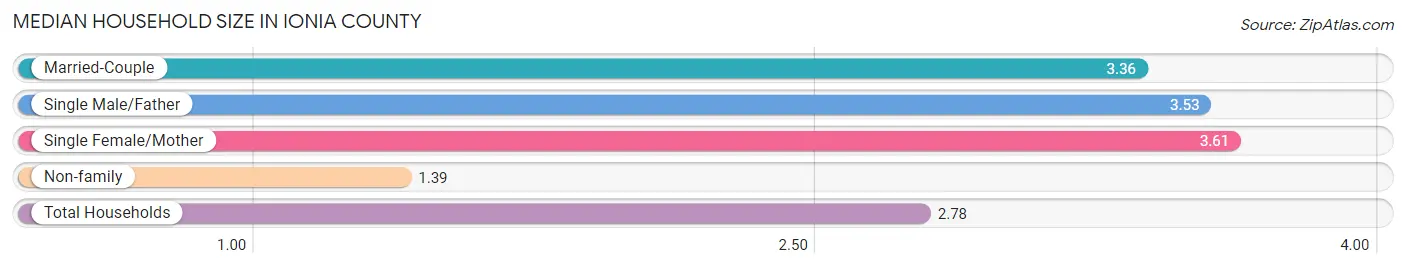
Median Household Size in Ionia County
The median household size in Ionia County is 2.78 persons per household, with single female/mother households (2,099 | 9.2%) accounting for the largest median household size of 3.61 persons per household. non-family households (7,129 | 31.3%) represent the smallest median household size with 1.39 persons per household.
| Household Type | # Households | Household Size |
| Married-Couple | 12,089 (53.1%) | 3.36 |
| Single Male/Father | 1,448 (6.4%) | 3.53 |
| Single Female/Mother | 2,099 (9.2%) | 3.61 |
| Non-family | 7,129 (31.3%) | 1.39 |
| Total Households | 22,765 (100.0%) | 2.78 |
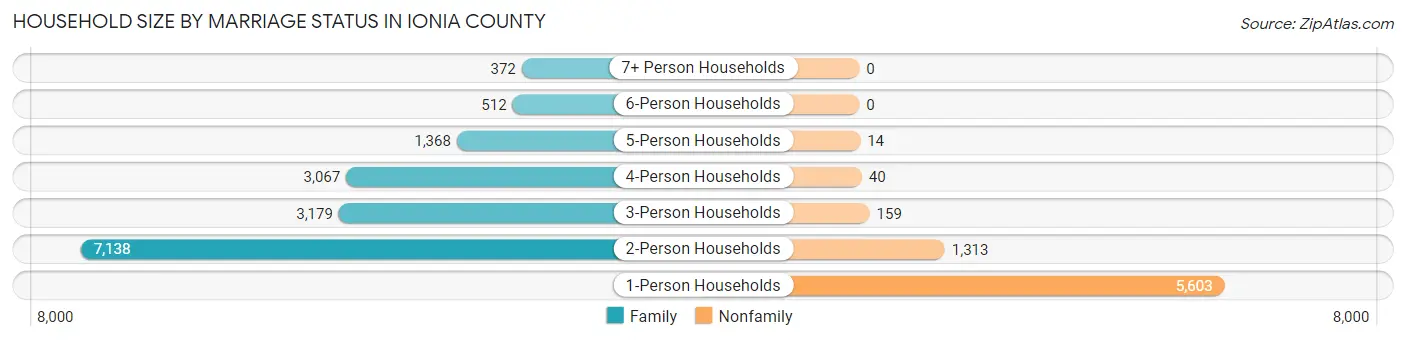
Household Size by Marriage Status in Ionia County
Out of a total of 22,765 households in Ionia County, 15,636 (68.7%) are family households, while 7,129 (31.3%) are nonfamily households. The most numerous type of family households are 2-person households, comprising 7,138, and the most common type of nonfamily households are 1-person households, comprising 5,603.
| Household Size | Family Households | Nonfamily Households |
| 1-Person Households | - | 5,603 (24.6%) |
| 2-Person Households | 7,138 (31.4%) | 1,313 (5.8%) |
| 3-Person Households | 3,179 (14.0%) | 159 (0.7%) |
| 4-Person Households | 3,067 (13.5%) | 40 (0.2%) |
| 5-Person Households | 1,368 (6.0%) | 14 (0.1%) |
| 6-Person Households | 512 (2.2%) | 0 (0.0%) |
| 7+ Person Households | 372 (1.6%) | 0 (0.0%) |
| Total | 15,636 (68.7%) | 7,129 (31.3%) |
Female Fertility in Ionia County
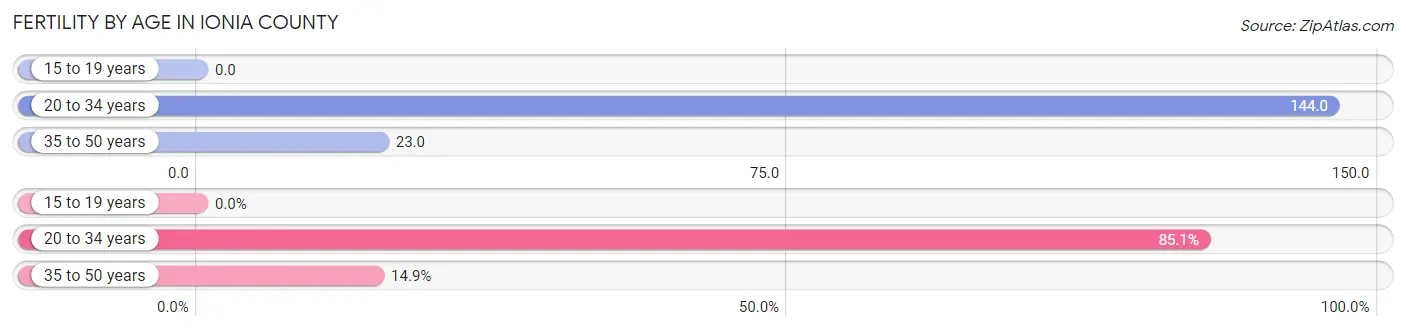
Fertility by Age in Ionia County
Average fertility rate in Ionia County is 69.0 births per 1,000 women. Women in the age bracket of 20 to 34 years have the highest fertility rate with 144.0 births per 1,000 women. Women in the age bracket of 20 to 34 years acount for 85.1% of all women with births.
| Age Bracket | Women with Births | Births / 1,000 Women |
| 15 to 19 years | 0 (0.0%) | 0.0 |
| 20 to 34 years | 797 (85.1%) | 144.0 |
| 35 to 50 years | 140 (14.9%) | 23.0 |
| Total | 937 (100.0%) | 69.0 |
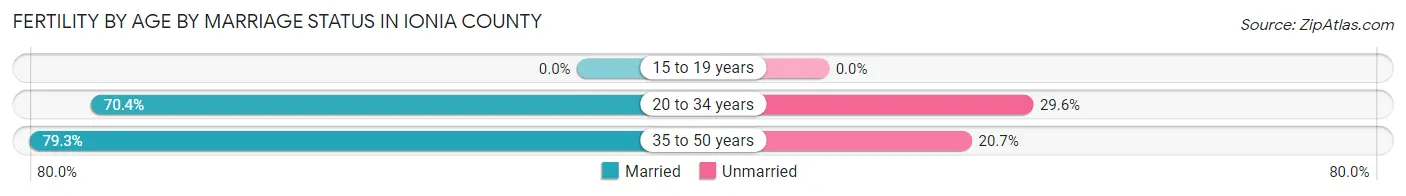
Fertility by Age by Marriage Status in Ionia County
71.7% of women with births (937) in Ionia County are married. The highest percentage of unmarried women with births falls into 20 to 34 years age bracket with 29.6% of them unmarried at the time of birth, while the lowest percentage of unmarried women with births belong to 35 to 50 years age bracket with 20.7% of them unmarried.
| Age Bracket | Married | Unmarried |
| 15 to 19 years | 0 (0.0%) | 0 (0.0%) |
| 20 to 34 years | 561 (70.4%) | 236 (29.6%) |
| 35 to 50 years | 111 (79.3%) | 29 (20.7%) |
| Total | 672 (71.7%) | 265 (28.3%) |
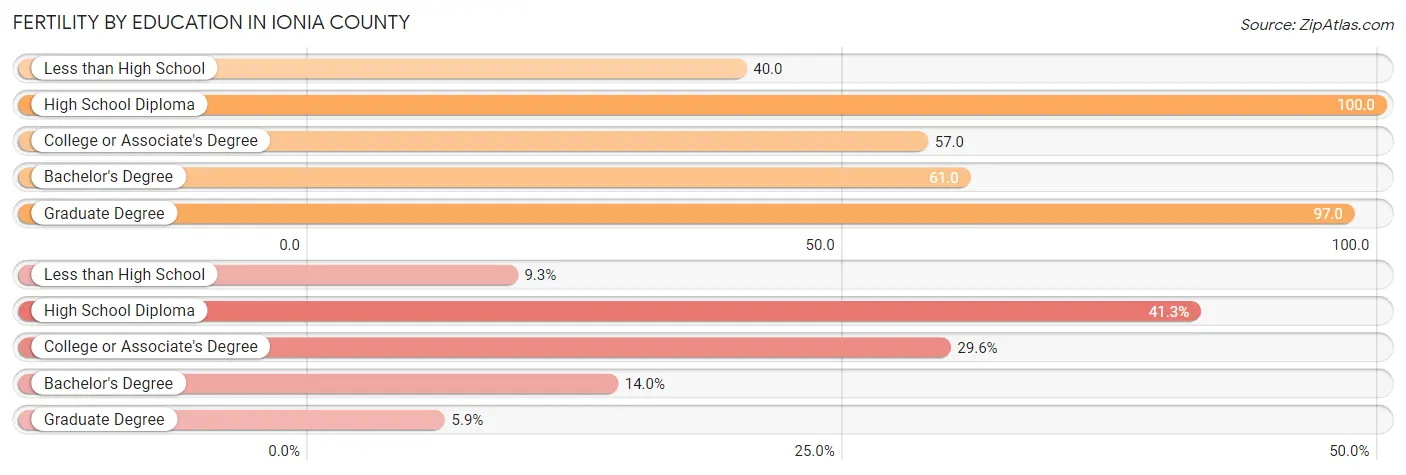
Fertility by Education in Ionia County
Average fertility rate in Ionia County is 69.0 births per 1,000 women. Women with the education attainment of high school diploma have the highest fertility rate of 100.0 births per 1,000 women, while women with the education attainment of less than high school have the lowest fertility at 40.0 births per 1,000 women. Women with the education attainment of high school diploma represent 41.3% of all women with births.
| Educational Attainment | Women with Births | Births / 1,000 Women |
| Less than High School | 87 (9.3%) | 40.0 |
| High School Diploma | 387 (41.3%) | 100.0 |
| College or Associate's Degree | 277 (29.6%) | 57.0 |
| Bachelor's Degree | 131 (14.0%) | 61.0 |
| Graduate Degree | 55 (5.9%) | 97.0 |
| Total | 937 (100.0%) | 69.0 |
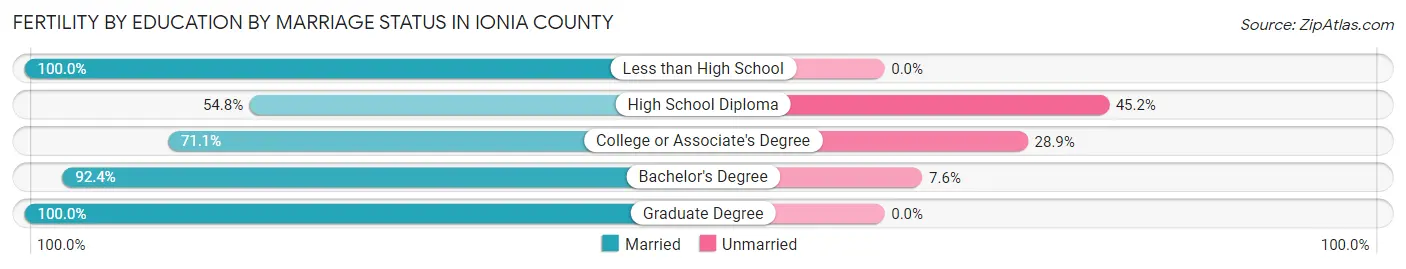
Fertility by Education by Marriage Status in Ionia County
28.3% of women with births in Ionia County are unmarried. Women with the educational attainment of less than high school are most likely to be married with 100.0% of them married at childbirth, while women with the educational attainment of high school diploma are least likely to be married with 45.2% of them unmarried at childbirth.
| Educational Attainment | Married | Unmarried |
| Less than High School | 87 (100.0%) | 0 (0.0%) |
| High School Diploma | 212 (54.8%) | 175 (45.2%) |
| College or Associate's Degree | 197 (71.1%) | 80 (28.9%) |
| Bachelor's Degree | 121 (92.4%) | 10 (7.6%) |
| Graduate Degree | 55 (100.0%) | 0 (0.0%) |
| Total | 672 (71.7%) | 265 (28.3%) |
Income in Ionia County
Income Overview in Ionia County
Per Capita Income in Ionia County is $29,736, while median incomes of families and households are $80,516 and $71,720 respectively.
| Characteristic | Number | Measure |
| Per Capita Income | 66,663 | $29,736 |
| Median Family Income | 15,636 | $80,516 |
| Mean Family Income | 15,636 | $90,092 |
| Median Household Income | 22,765 | $71,720 |
| Mean Household Income | 22,765 | $80,108 |
| Income Deficit | 15,636 | $12,848 |
| Wage / Income Gap (%) | 66,663 | 27.72% |
| Wage / Income Gap ($) | 66,663 | 72.28¢ per $1 |
| Gini / Inequality Index | 66,663 | 0.38 |
Earnings by Sex in Ionia County
Average Earnings in Ionia County are $39,121, $44,506 for men and $32,168 for women, a difference of 27.7%.
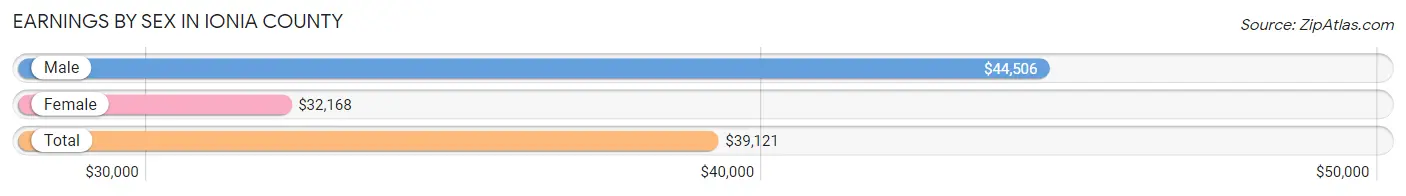
| Sex | Number | Average Earnings |
| Male | 19,628 (57.6%) | $44,506 |
| Female | 14,445 (42.4%) | $32,168 |
| Total | 34,073 (100.0%) | $39,121 |
Earnings by Sex by Income Bracket in Ionia County
The most common earnings brackets in Ionia County are $75,000 to $99,999 for men (2,253 | 11.5%) and $30,000 to $34,999 for women (1,279 | 8.8%).
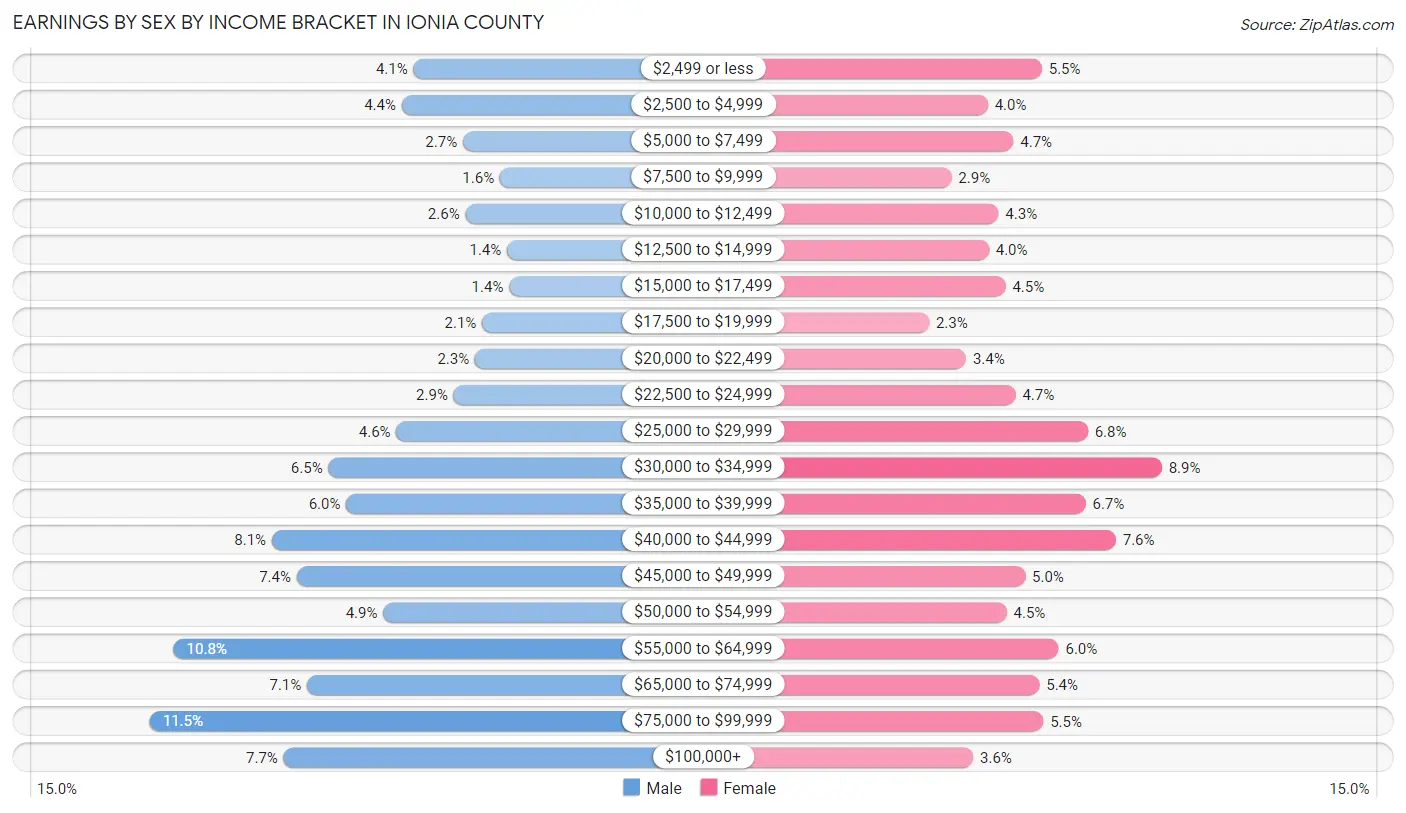
| Income | Male | Female |
| $2,499 or less | 798 (4.1%) | 792 (5.5%) |
| $2,500 to $4,999 | 864 (4.4%) | 572 (4.0%) |
| $5,000 to $7,499 | 527 (2.7%) | 676 (4.7%) |
| $7,500 to $9,999 | 322 (1.6%) | 425 (2.9%) |
| $10,000 to $12,499 | 513 (2.6%) | 616 (4.3%) |
| $12,500 to $14,999 | 283 (1.4%) | 576 (4.0%) |
| $15,000 to $17,499 | 271 (1.4%) | 644 (4.5%) |
| $17,500 to $19,999 | 420 (2.1%) | 333 (2.3%) |
| $20,000 to $22,499 | 459 (2.3%) | 484 (3.4%) |
| $22,500 to $24,999 | 578 (2.9%) | 685 (4.7%) |
| $25,000 to $29,999 | 893 (4.5%) | 978 (6.8%) |
| $30,000 to $34,999 | 1,267 (6.5%) | 1,279 (8.8%) |
| $35,000 to $39,999 | 1,169 (6.0%) | 969 (6.7%) |
| $40,000 to $44,999 | 1,581 (8.1%) | 1,092 (7.6%) |
| $45,000 to $49,999 | 1,442 (7.3%) | 724 (5.0%) |
| $50,000 to $54,999 | 966 (4.9%) | 649 (4.5%) |
| $55,000 to $64,999 | 2,122 (10.8%) | 859 (5.9%) |
| $65,000 to $74,999 | 1,385 (7.1%) | 782 (5.4%) |
| $75,000 to $99,999 | 2,253 (11.5%) | 797 (5.5%) |
| $100,000+ | 1,515 (7.7%) | 513 (3.5%) |
| Total | 19,628 (100.0%) | 14,445 (100.0%) |
Earnings by Sex by Educational Attainment in Ionia County
Average earnings in Ionia County are $49,610 for men and $35,232 for women, a difference of 29.0%. Men with an educational attainment of graduate degree enjoy the highest average annual earnings of $77,105, while those with high school diploma education earn the least with $42,439. Women with an educational attainment of graduate degree earn the most with the average annual earnings of $65,542, while those with less than high school education have the smallest earnings of $16,327.
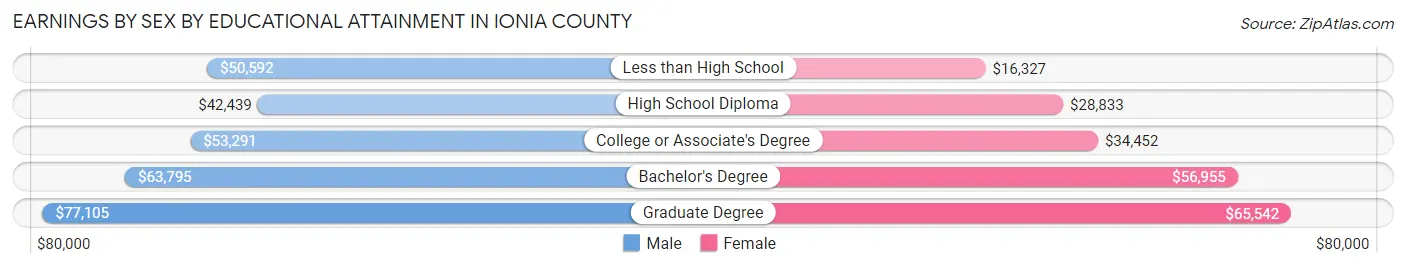
| Educational Attainment | Male Income | Female Income |
| Less than High School | $50,592 | $16,327 |
| High School Diploma | $42,439 | $28,833 |
| College or Associate's Degree | $53,291 | $34,452 |
| Bachelor's Degree | $63,795 | $56,955 |
| Graduate Degree | $77,105 | $65,542 |
| Total | $49,610 | $35,232 |
Family Income in Ionia County
Family Income Brackets in Ionia County
According to the Ionia County family income data, there are 3,440 families falling into the $100,000 to $149,999 income range, which is the most common income bracket and makes up 22.0% of all families. Conversely, the $10,000 to $14,999 income bracket is the least frequent group with only 235 families (1.5%) belonging to this category.
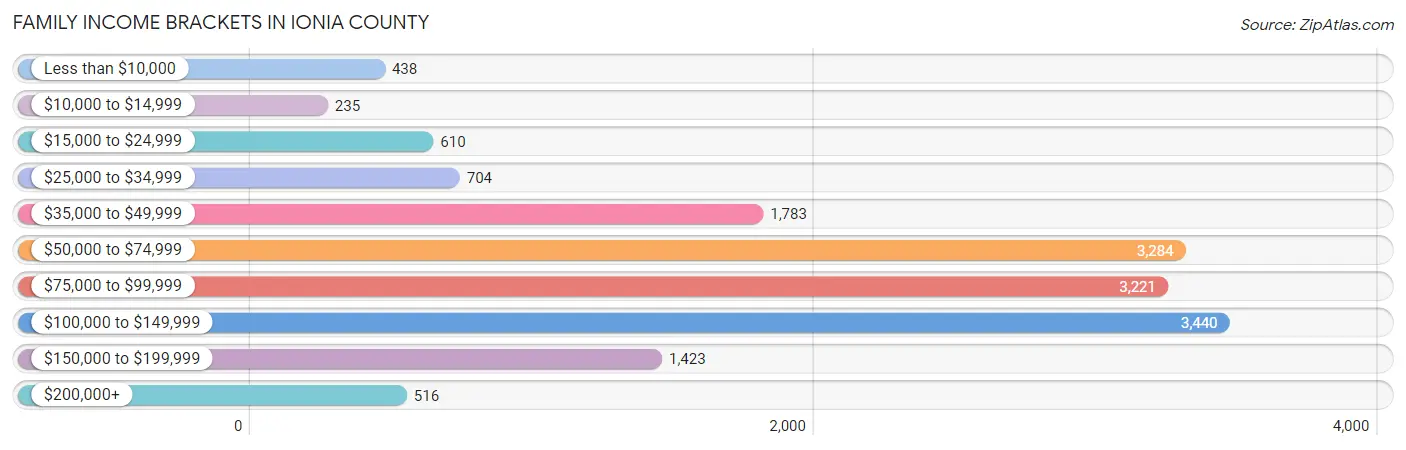
| Income Bracket | # Families | % Families |
| Less than $10,000 | 438 | 2.8% |
| $10,000 to $14,999 | 235 | 1.5% |
| $15,000 to $24,999 | 610 | 3.9% |
| $25,000 to $34,999 | 704 | 4.5% |
| $35,000 to $49,999 | 1,783 | 11.4% |
| $50,000 to $74,999 | 3,284 | 21.0% |
| $75,000 to $99,999 | 3,221 | 20.6% |
| $100,000 to $149,999 | 3,440 | 22.0% |
| $150,000 to $199,999 | 1,423 | 9.1% |
| $200,000+ | 516 | 3.3% |
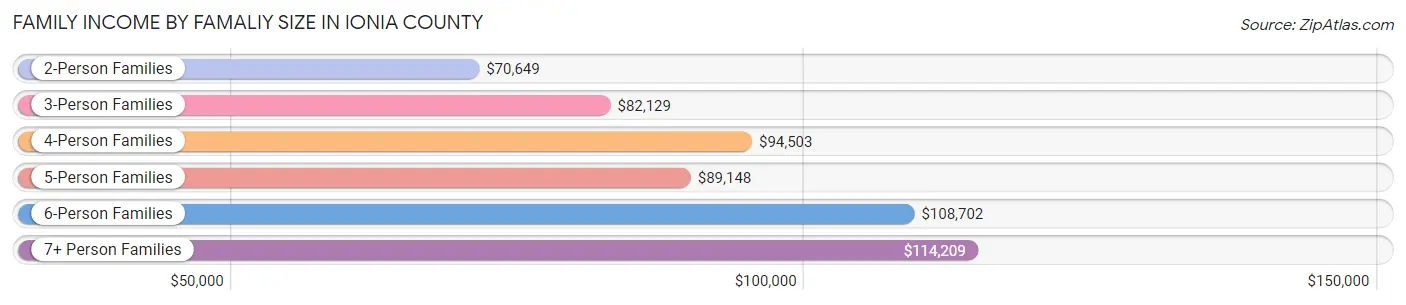
Family Income by Famaliy Size in Ionia County
7+ person families (261 | 1.7%) account for the highest median family income in Ionia County with $114,209 per family, while 2-person families (7,627 | 48.8%) have the highest median income of $35,324 per family member.
| Income Bracket | # Families | Median Income |
| 2-Person Families | 7,627 (48.8%) | $70,649 |
| 3-Person Families | 3,255 (20.8%) | $82,129 |
| 4-Person Families | 2,849 (18.2%) | $94,503 |
| 5-Person Families | 1,239 (7.9%) | $89,148 |
| 6-Person Families | 405 (2.6%) | $108,702 |
| 7+ Person Families | 261 (1.7%) | $114,209 |
| Total | 15,636 (100.0%) | $80,516 |
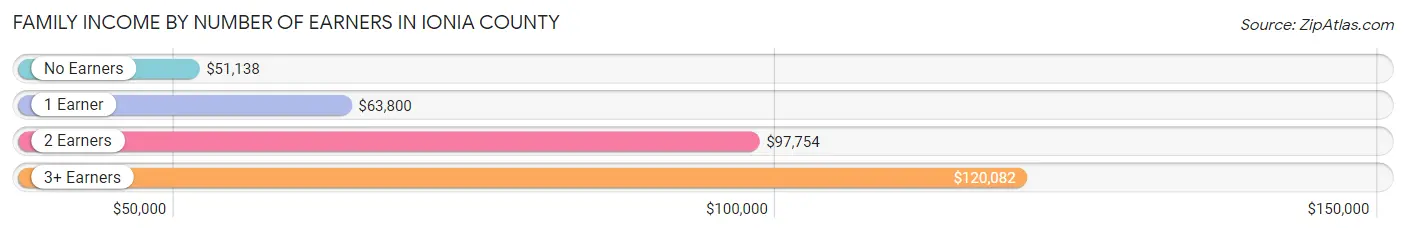
Family Income by Number of Earners in Ionia County
The median family income in Ionia County is $80,516, with families comprising 3+ earners (1,775) having the highest median family income of $120,082, while families with no earners (2,823) have the lowest median family income of $51,138, accounting for 11.4% and 18.0% of families, respectively.
| Number of Earners | # Families | Median Income |
| No Earners | 2,823 (18.0%) | $51,138 |
| 1 Earner | 4,730 (30.2%) | $63,800 |
| 2 Earners | 6,308 (40.3%) | $97,754 |
| 3+ Earners | 1,775 (11.4%) | $120,082 |
| Total | 15,636 (100.0%) | $80,516 |
Household Income in Ionia County
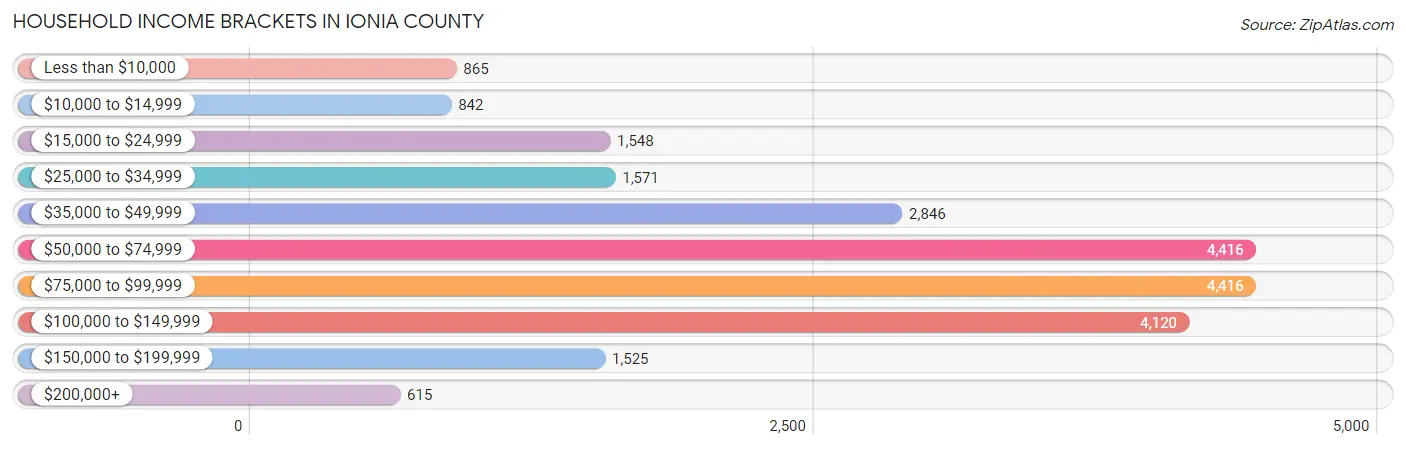
Household Income Brackets in Ionia County
With 4,416 households falling in the category, the $50,000 to $74,999 income range is the most frequent in Ionia County, accounting for 19.4% of all households. In contrast, only 615 households (2.7%) fall into the $200,000+ income bracket, making it the least populous group.
| Income Bracket | # Households | % Households |
| Less than $10,000 | 865 | 3.8% |
| $10,000 to $14,999 | 842 | 3.7% |
| $15,000 to $24,999 | 1,548 | 6.8% |
| $25,000 to $34,999 | 1,571 | 6.9% |
| $35,000 to $49,999 | 2,846 | 12.5% |
| $50,000 to $74,999 | 4,416 | 19.4% |
| $75,000 to $99,999 | 4,416 | 19.4% |
| $100,000 to $149,999 | 4,120 | 18.1% |
| $150,000 to $199,999 | 1,525 | 6.7% |
| $200,000+ | 615 | 2.7% |
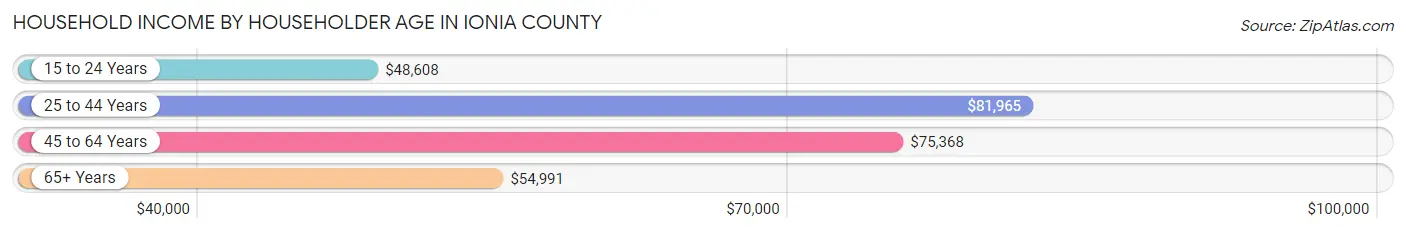
Household Income by Householder Age in Ionia County
The median household income in Ionia County is $71,720, with the highest median household income of $81,965 found in the 25 to 44 years age bracket for the primary householder. A total of 7,546 households (33.2%) fall into this category. Meanwhile, the 15 to 24 years age bracket for the primary householder has the lowest median household income of $48,608, with 624 households (2.7%) in this group.
| Income Bracket | # Households | Median Income |
| 15 to 24 Years | 624 (2.7%) | $48,608 |
| 25 to 44 Years | 7,546 (33.2%) | $81,965 |
| 45 to 64 Years | 8,630 (37.9%) | $75,368 |
| 65+ Years | 5,965 (26.2%) | $54,991 |
| Total | 22,765 (100.0%) | $71,720 |
Poverty in Ionia County
Income Below Poverty by Sex and Age in Ionia County
With 7.8% poverty level for males and 13.1% for females among the residents of Ionia County, 15 year old males and 25 to 34 year old females are the most vulnerable to poverty, with 88 males (19.6%) and 685 females (17.8%) in their respective age groups living below the poverty level.
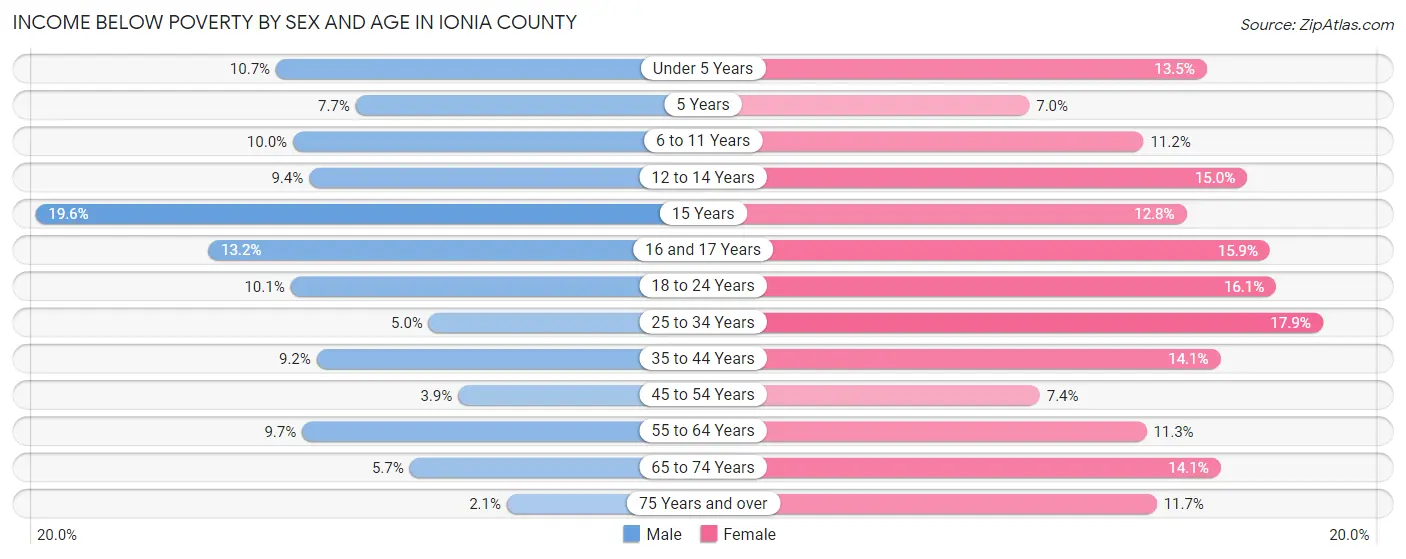
| Age Bracket | Male | Female |
| Under 5 Years | 190 (10.7%) | 214 (13.5%) |
| 5 Years | 28 (7.7%) | 19 (7.0%) |
| 6 to 11 Years | 212 (10.0%) | 246 (11.2%) |
| 12 to 14 Years | 139 (9.4%) | 201 (15.0%) |
| 15 Years | 88 (19.6%) | 49 (12.8%) |
| 16 and 17 Years | 113 (13.2%) | 137 (15.9%) |
| 18 to 24 Years | 358 (10.1%) | 380 (16.1%) |
| 25 to 34 Years | 223 (5.0%) | 685 (17.8%) |
| 35 to 44 Years | 427 (9.2%) | 554 (14.1%) |
| 45 to 54 Years | 168 (3.9%) | 275 (7.3%) |
| 55 to 64 Years | 415 (9.7%) | 470 (11.3%) |
| 65 to 74 Years | 175 (5.7%) | 466 (14.1%) |
| 75 Years and over | 32 (2.1%) | 244 (11.7%) |
| Total | 2,568 (7.8%) | 3,940 (13.1%) |
Income Above Poverty by Sex and Age in Ionia County
According to the poverty statistics in Ionia County, males aged 75 years and over and females aged 5 years are the age groups that are most secure financially, with 97.9% of males and 93.0% of females in these age groups living above the poverty line.
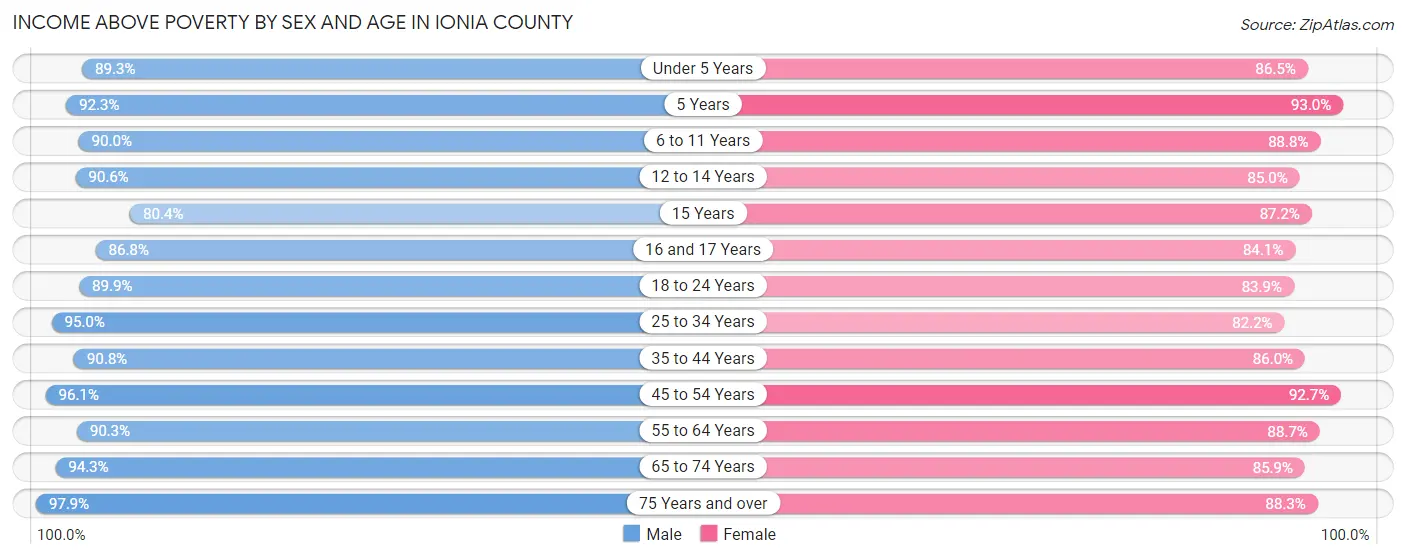
| Age Bracket | Male | Female |
| Under 5 Years | 1,591 (89.3%) | 1,367 (86.5%) |
| 5 Years | 335 (92.3%) | 254 (93.0%) |
| 6 to 11 Years | 1,900 (90.0%) | 1,950 (88.8%) |
| 12 to 14 Years | 1,334 (90.6%) | 1,135 (85.0%) |
| 15 Years | 361 (80.4%) | 334 (87.2%) |
| 16 and 17 Years | 744 (86.8%) | 725 (84.1%) |
| 18 to 24 Years | 3,176 (89.9%) | 1,978 (83.9%) |
| 25 to 34 Years | 4,234 (95.0%) | 3,153 (82.2%) |
| 35 to 44 Years | 4,237 (90.8%) | 3,388 (86.0%) |
| 45 to 54 Years | 4,134 (96.1%) | 3,468 (92.6%) |
| 55 to 64 Years | 3,865 (90.3%) | 3,684 (88.7%) |
| 65 to 74 Years | 2,890 (94.3%) | 2,848 (85.9%) |
| 75 Years and over | 1,492 (97.9%) | 1,843 (88.3%) |
| Total | 30,293 (92.2%) | 26,127 (86.9%) |
Income Below Poverty Among Married-Couple Families in Ionia County
The poverty statistics for married-couple families in Ionia County show that 2.2% or 262 of the total 12,089 families live below the poverty line. Families with 3 or 4 children have the highest poverty rate of 4.1%, comprising of 39 families. On the other hand, families with 1 or 2 children have the lowest poverty rate of 2.0%, which includes 73 families.
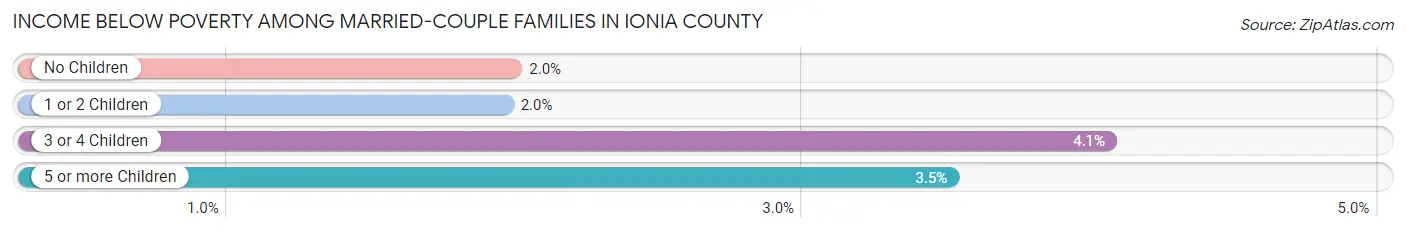
| Children | Above Poverty | Below Poverty |
| No Children | 7,094 (98.0%) | 144 (2.0%) |
| 1 or 2 Children | 3,647 (98.0%) | 73 (2.0%) |
| 3 or 4 Children | 921 (95.9%) | 39 (4.1%) |
| 5 or more Children | 165 (96.5%) | 6 (3.5%) |
| Total | 11,827 (97.8%) | 262 (2.2%) |
Income Below Poverty Among Single-Parent Households in Ionia County
According to the poverty data in Ionia County, 10.3% or 149 single-father households and 27.2% or 571 single-mother households are living below the poverty line. Among single-father households, those with 5 or more children have the highest poverty rate, with 3 households (100.0%) experiencing poverty. Likewise, among single-mother households, those with 5 or more children have the highest poverty rate, with 2 households (100.0%) falling below the poverty line.
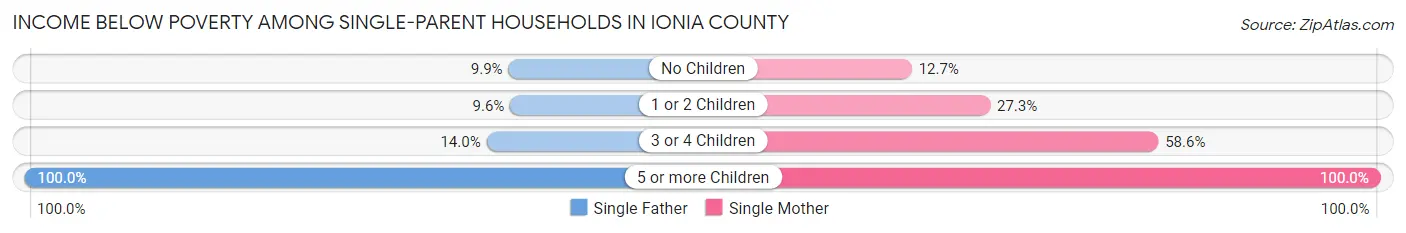
| Children | Single Father | Single Mother |
| No Children | 58 (9.9%) | 91 (12.7%) |
| 1 or 2 Children | 69 (9.6%) | 287 (27.3%) |
| 3 or 4 Children | 19 (14.0%) | 191 (58.6%) |
| 5 or more Children | 3 (100.0%) | 2 (100.0%) |
| Total | 149 (10.3%) | 571 (27.2%) |
Income Below Poverty Among Married-Couple vs Single-Parent Households in Ionia County
The poverty data for Ionia County shows that 262 of the married-couple family households (2.2%) and 720 of the single-parent households (20.3%) are living below the poverty level. Within the married-couple family households, those with 3 or 4 children have the highest poverty rate, with 39 households (4.1%) falling below the poverty line. Among the single-parent households, those with 5 or more children have the highest poverty rate, with 5 household (100.0%) living below poverty.
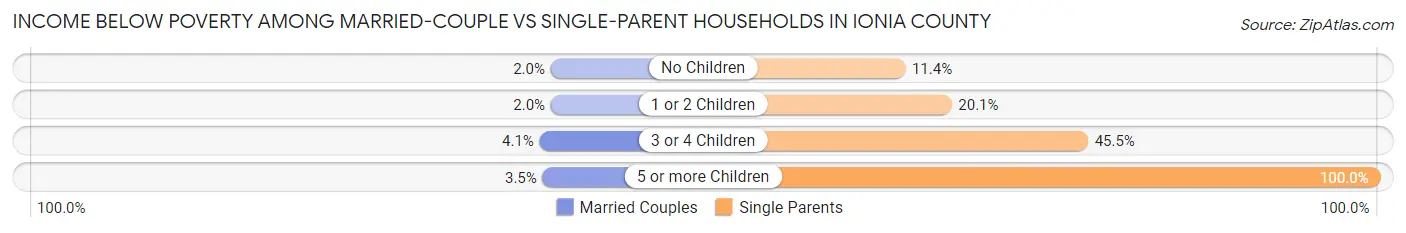
| Children | Married-Couple Families | Single-Parent Households |
| No Children | 144 (2.0%) | 149 (11.4%) |
| 1 or 2 Children | 73 (2.0%) | 356 (20.1%) |
| 3 or 4 Children | 39 (4.1%) | 210 (45.5%) |
| 5 or more Children | 6 (3.5%) | 5 (100.0%) |
| Total | 262 (2.2%) | 720 (20.3%) |
Employment Characteristics in Ionia County
Employment by Class of Employer in Ionia County
Among the 29,980 employed individuals in Ionia County, private company employees (21,722 | 72.5%), not-for-profit organizations (2,295 | 7.7%), and state government employees (1,689 | 5.6%) make up the most common classes of employment.
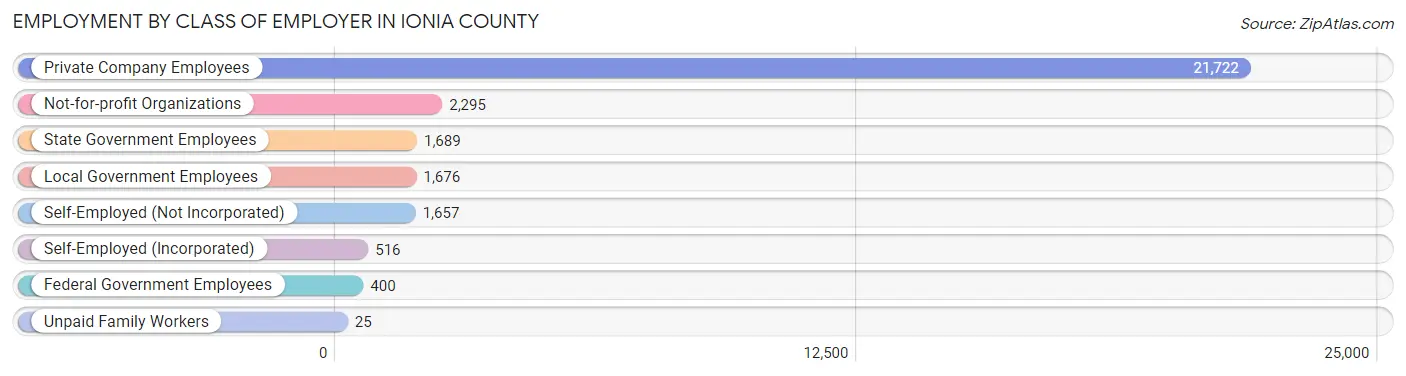
| Employer Class | # Employees | % Employees |
| Private Company Employees | 21,722 | 72.5% |
| Self-Employed (Incorporated) | 516 | 1.7% |
| Self-Employed (Not Incorporated) | 1,657 | 5.5% |
| Not-for-profit Organizations | 2,295 | 7.7% |
| Local Government Employees | 1,676 | 5.6% |
| State Government Employees | 1,689 | 5.6% |
| Federal Government Employees | 400 | 1.3% |
| Unpaid Family Workers | 25 | 0.1% |
| Total | 29,980 | 100.0% |
Employment Status by Age in Ionia County
According to the labor force statistics for Ionia County, out of the total population over 16 years of age (54,228), 59.5% or 32,266 individuals are in the labor force, with 5.3% or 1,710 of them unemployed. The age group with the highest labor force participation rate is 35 to 44 years, with 79.3% or 7,365 individuals in the labor force. Within the labor force, the 16 to 19 years age range has the highest percentage of unemployed individuals, with 21.2% or 341 of them being unemployed.
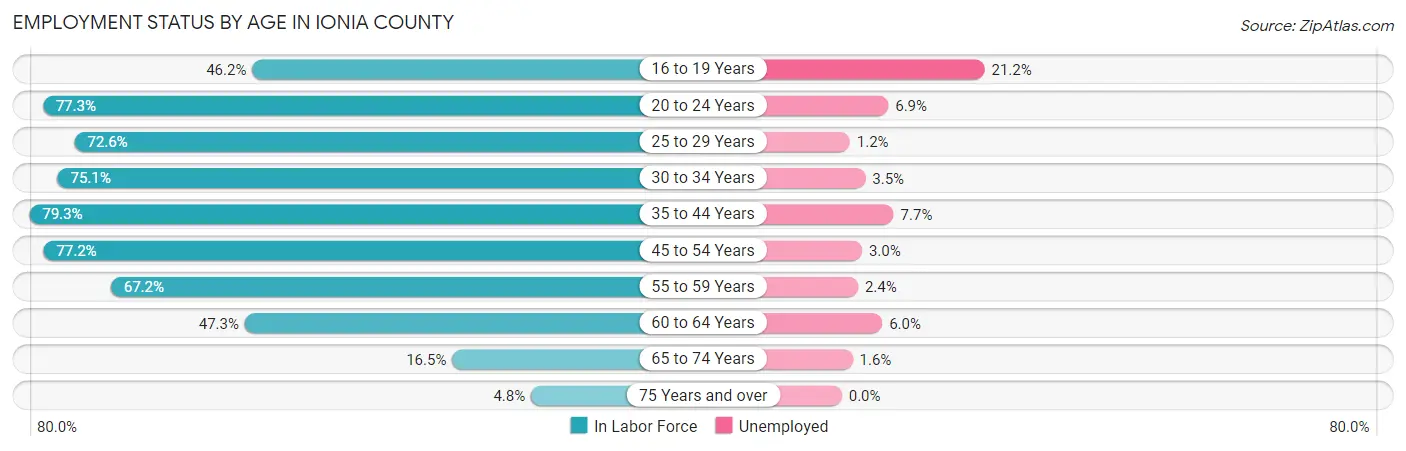
| Age Bracket | In Labor Force | Unemployed |
| 16 to 19 Years | 1,609 (46.2%) | 341 (21.2%) |
| 20 to 24 Years | 3,460 (77.3%) | 239 (6.9%) |
| 25 to 29 Years | 3,422 (72.6%) | 41 (1.2%) |
| 30 to 34 Years | 3,354 (75.1%) | 117 (3.5%) |
| 35 to 44 Years | 7,365 (79.3%) | 567 (7.7%) |
| 45 to 54 Years | 6,741 (77.2%) | 202 (3.0%) |
| 55 to 59 Years | 2,945 (67.2%) | 71 (2.4%) |
| 60 to 64 Years | 2,111 (47.3%) | 127 (6.0%) |
| 65 to 74 Years | 1,068 (16.5%) | 17 (1.6%) |
| 75 Years and over | 180 (4.8%) | 0 (0.0%) |
| Total | 32,266 (59.5%) | 1,710 (5.3%) |
Employment Status by Educational Attainment in Ionia County
According to labor force statistics for Ionia County, 72.0% of individuals (25,952) out of the total population between 25 and 64 years of age (36,044) are in the labor force, with 4.3% or 1,116 of them being unemployed. The group with the highest labor force participation rate are those with the educational attainment of bachelor's degree or higher, with 87.2% or 5,538 individuals in the labor force. Within the labor force, individuals with high school diploma education have the highest percentage of unemployment, with 7.7% or 697 of them being unemployed.
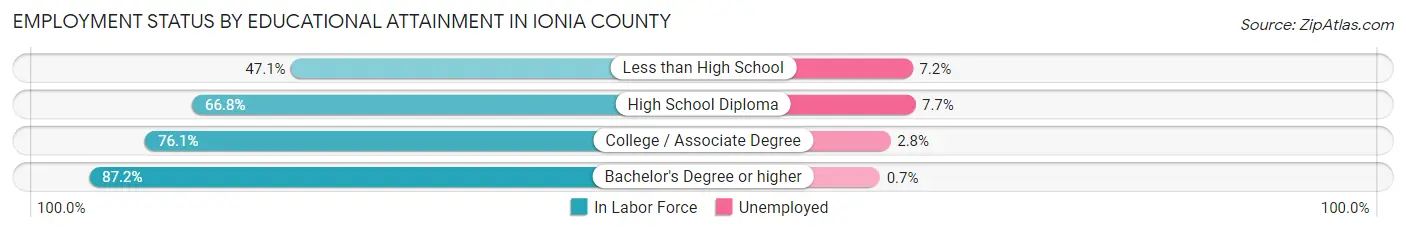
| Educational Attainment | In Labor Force | Unemployed |
| Less than High School | 1,528 (47.1%) | 234 (7.2%) |
| High School Diploma | 9,048 (66.8%) | 1,043 (7.7%) |
| College / Associate Degree | 9,820 (76.1%) | 361 (2.8%) |
| Bachelor's Degree or higher | 5,538 (87.2%) | 44 (0.7%) |
| Total | 25,952 (72.0%) | 1,550 (4.3%) |
Employment Occupations by Sex in Ionia County
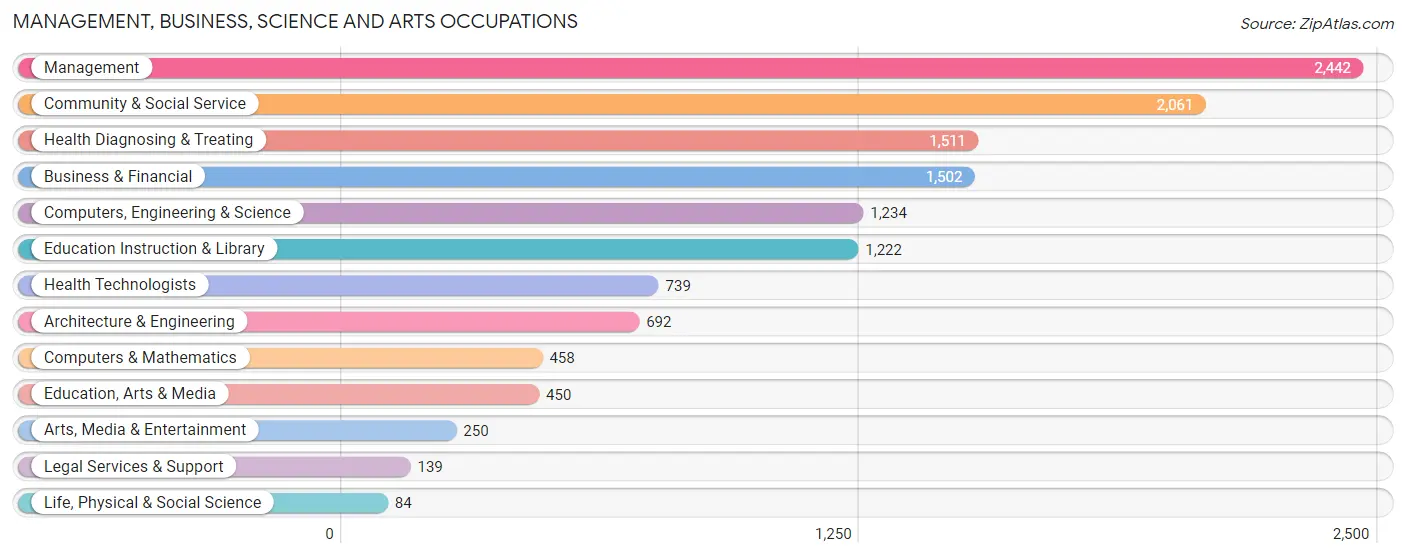
Management, Business, Science and Arts Occupations
The most common Management, Business, Science and Arts occupations in Ionia County are Management (2,442 | 8.0%), Community & Social Service (2,061 | 6.8%), Health Diagnosing & Treating (1,511 | 5.0%), Business & Financial (1,502 | 4.9%), and Computers, Engineering & Science (1,234 | 4.1%).
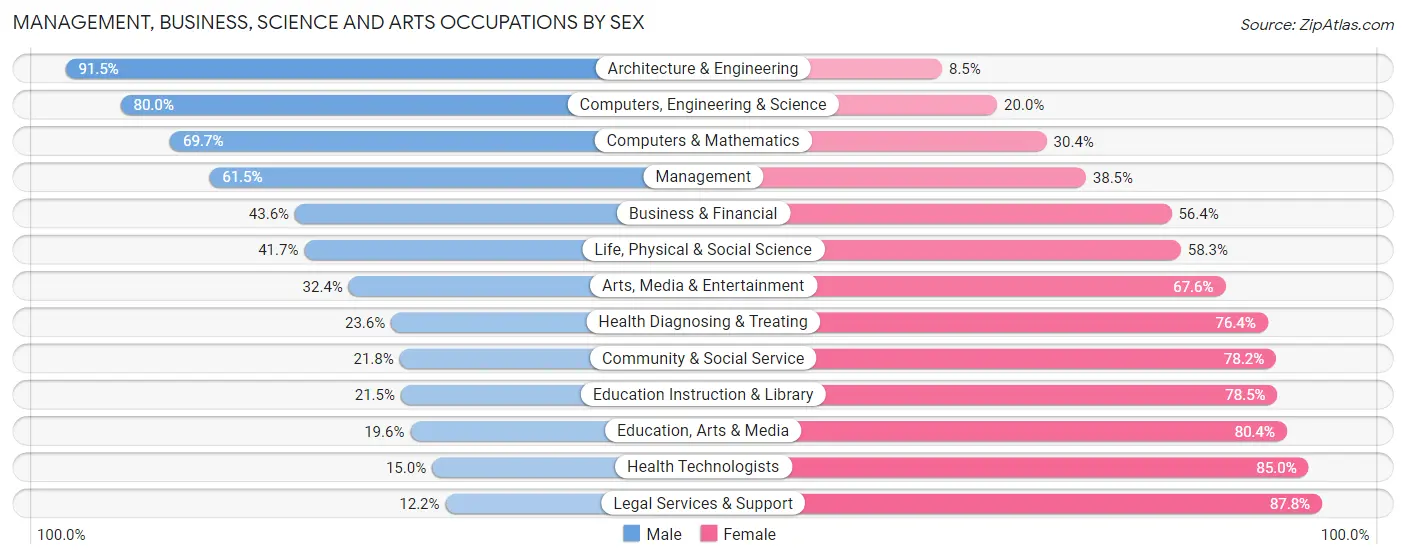
Management, Business, Science and Arts Occupations by Sex
Within the Management, Business, Science and Arts occupations in Ionia County, the most male-oriented occupations are Architecture & Engineering (91.5%), Computers, Engineering & Science (80.0%), and Computers & Mathematics (69.7%), while the most female-oriented occupations are Legal Services & Support (87.8%), Health Technologists (85.0%), and Education, Arts & Media (80.4%).
| Occupation | Male | Female |
| Management | 1,501 (61.5%) | 941 (38.5%) |
| Business & Financial | 655 (43.6%) | 847 (56.4%) |
| Computers, Engineering & Science | 987 (80.0%) | 247 (20.0%) |
| Computers & Mathematics | 319 (69.7%) | 139 (30.3%) |
| Architecture & Engineering | 633 (91.5%) | 59 (8.5%) |
| Life, Physical & Social Science | 35 (41.7%) | 49 (58.3%) |
| Community & Social Service | 449 (21.8%) | 1,612 (78.2%) |
| Education, Arts & Media | 88 (19.6%) | 362 (80.4%) |
| Legal Services & Support | 17 (12.2%) | 122 (87.8%) |
| Education Instruction & Library | 263 (21.5%) | 959 (78.5%) |
| Arts, Media & Entertainment | 81 (32.4%) | 169 (67.6%) |
| Health Diagnosing & Treating | 356 (23.6%) | 1,155 (76.4%) |
| Health Technologists | 111 (15.0%) | 628 (85.0%) |
| Total (Category) | 3,948 (45.1%) | 4,802 (54.9%) |
| Total (Overall) | 17,225 (56.5%) | 13,240 (43.5%) |
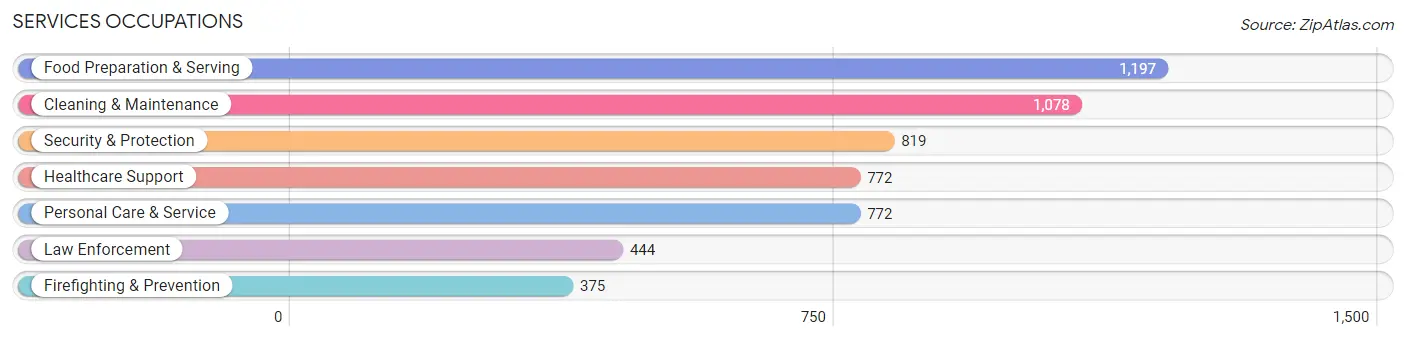
Services Occupations
The most common Services occupations in Ionia County are Food Preparation & Serving (1,197 | 3.9%), Cleaning & Maintenance (1,078 | 3.5%), Security & Protection (819 | 2.7%), Healthcare Support (772 | 2.5%), and Personal Care & Service (772 | 2.5%).
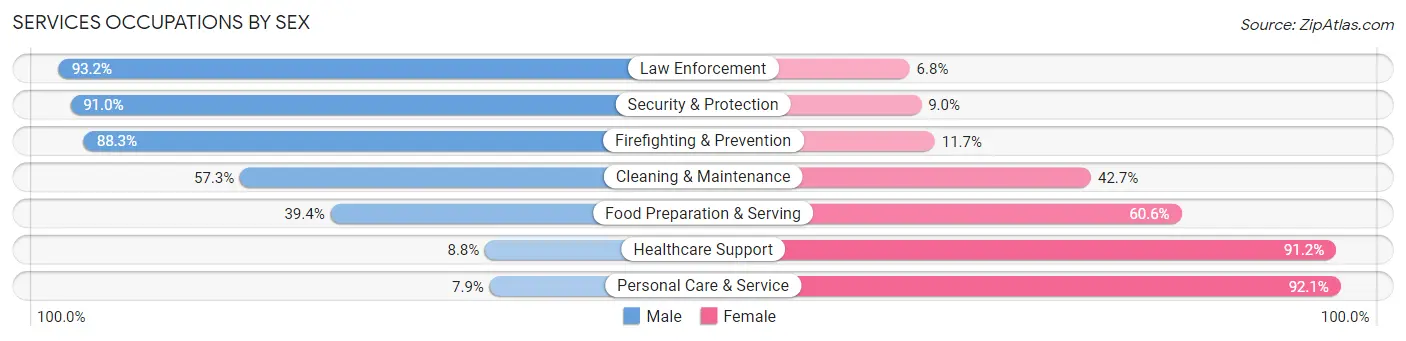
Services Occupations by Sex
Within the Services occupations in Ionia County, the most male-oriented occupations are Law Enforcement (93.2%), Security & Protection (91.0%), and Firefighting & Prevention (88.3%), while the most female-oriented occupations are Personal Care & Service (92.1%), Healthcare Support (91.2%), and Food Preparation & Serving (60.6%).
| Occupation | Male | Female |
| Healthcare Support | 68 (8.8%) | 704 (91.2%) |
| Security & Protection | 745 (91.0%) | 74 (9.0%) |
| Firefighting & Prevention | 331 (88.3%) | 44 (11.7%) |
| Law Enforcement | 414 (93.2%) | 30 (6.8%) |
| Food Preparation & Serving | 472 (39.4%) | 725 (60.6%) |
| Cleaning & Maintenance | 618 (57.3%) | 460 (42.7%) |
| Personal Care & Service | 61 (7.9%) | 711 (92.1%) |
| Total (Category) | 1,964 (42.3%) | 2,674 (57.7%) |
| Total (Overall) | 17,225 (56.5%) | 13,240 (43.5%) |
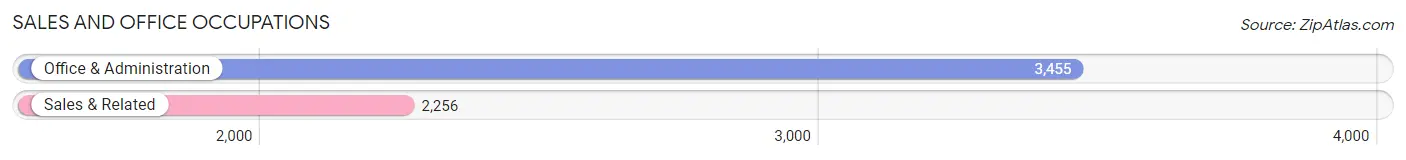
Sales and Office Occupations
The most common Sales and Office occupations in Ionia County are Office & Administration (3,455 | 11.3%), and Sales & Related (2,256 | 7.4%).
Sales and Office Occupations by Sex
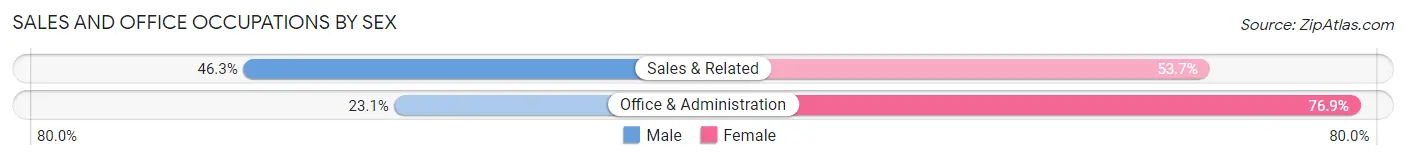
| Occupation | Male | Female |
| Sales & Related | 1,045 (46.3%) | 1,211 (53.7%) |
| Office & Administration | 797 (23.1%) | 2,658 (76.9%) |
| Total (Category) | 1,842 (32.3%) | 3,869 (67.7%) |
| Total (Overall) | 17,225 (56.5%) | 13,240 (43.5%) |
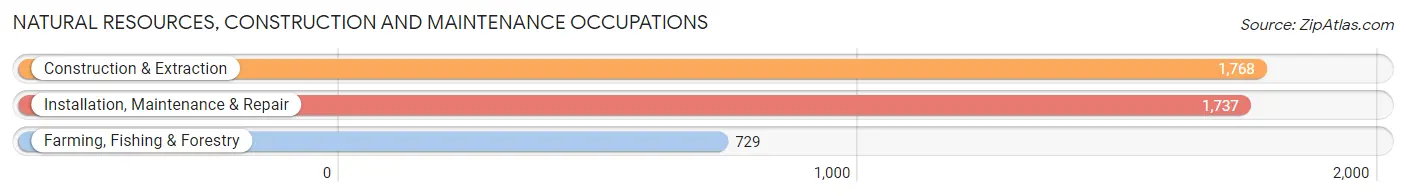
Natural Resources, Construction and Maintenance Occupations
The most common Natural Resources, Construction and Maintenance occupations in Ionia County are Construction & Extraction (1,768 | 5.8%), Installation, Maintenance & Repair (1,737 | 5.7%), and Farming, Fishing & Forestry (729 | 2.4%).
Natural Resources, Construction and Maintenance Occupations by Sex
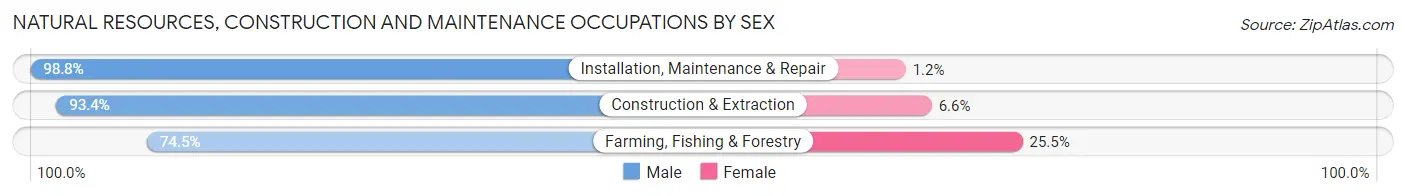
| Occupation | Male | Female |
| Farming, Fishing & Forestry | 543 (74.5%) | 186 (25.5%) |
| Construction & Extraction | 1,651 (93.4%) | 117 (6.6%) |
| Installation, Maintenance & Repair | 1,716 (98.8%) | 21 (1.2%) |
| Total (Category) | 3,910 (92.3%) | 324 (7.6%) |
| Total (Overall) | 17,225 (56.5%) | 13,240 (43.5%) |
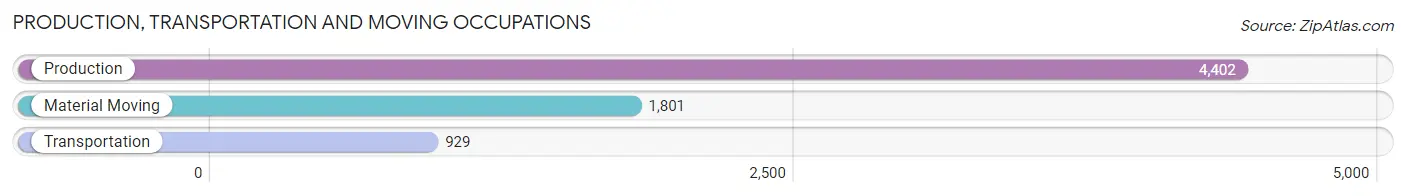
Production, Transportation and Moving Occupations
The most common Production, Transportation and Moving occupations in Ionia County are Production (4,402 | 14.4%), Material Moving (1,801 | 5.9%), and Transportation (929 | 3.0%).
Production, Transportation and Moving Occupations by Sex
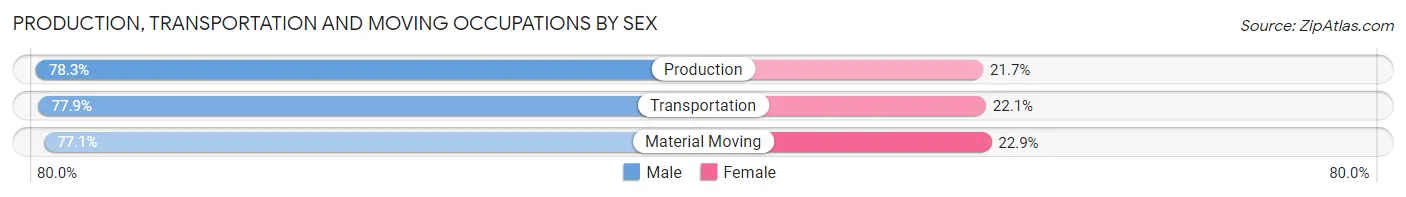
| Occupation | Male | Female |
| Production | 3,448 (78.3%) | 954 (21.7%) |
| Transportation | 724 (77.9%) | 205 (22.1%) |
| Material Moving | 1,389 (77.1%) | 412 (22.9%) |
| Total (Category) | 5,561 (78.0%) | 1,571 (22.0%) |
| Total (Overall) | 17,225 (56.5%) | 13,240 (43.5%) |
Employment Industries by Sex in Ionia County
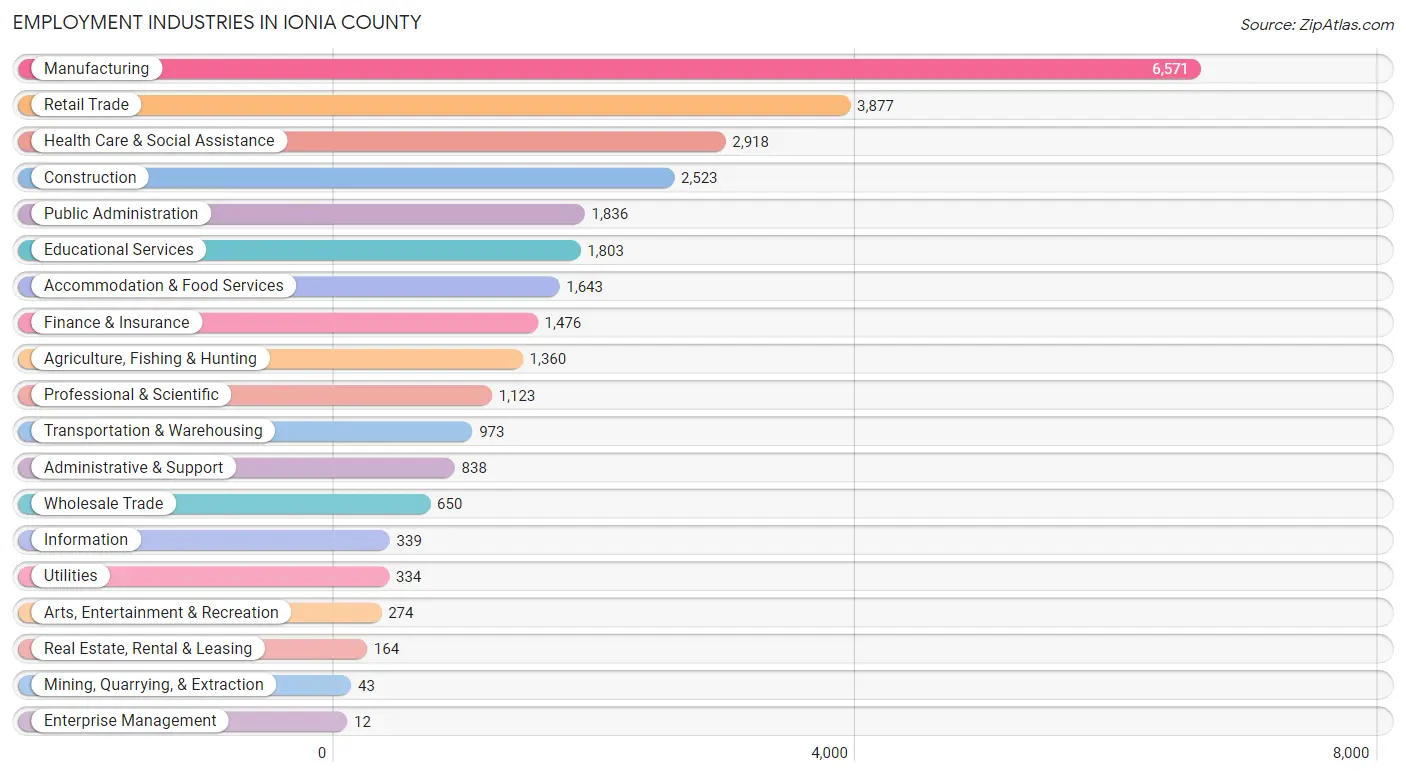
Employment Industries in Ionia County
The major employment industries in Ionia County include Manufacturing (6,571 | 21.6%), Retail Trade (3,877 | 12.7%), Health Care & Social Assistance (2,918 | 9.6%), Construction (2,523 | 8.3%), and Public Administration (1,836 | 6.0%).
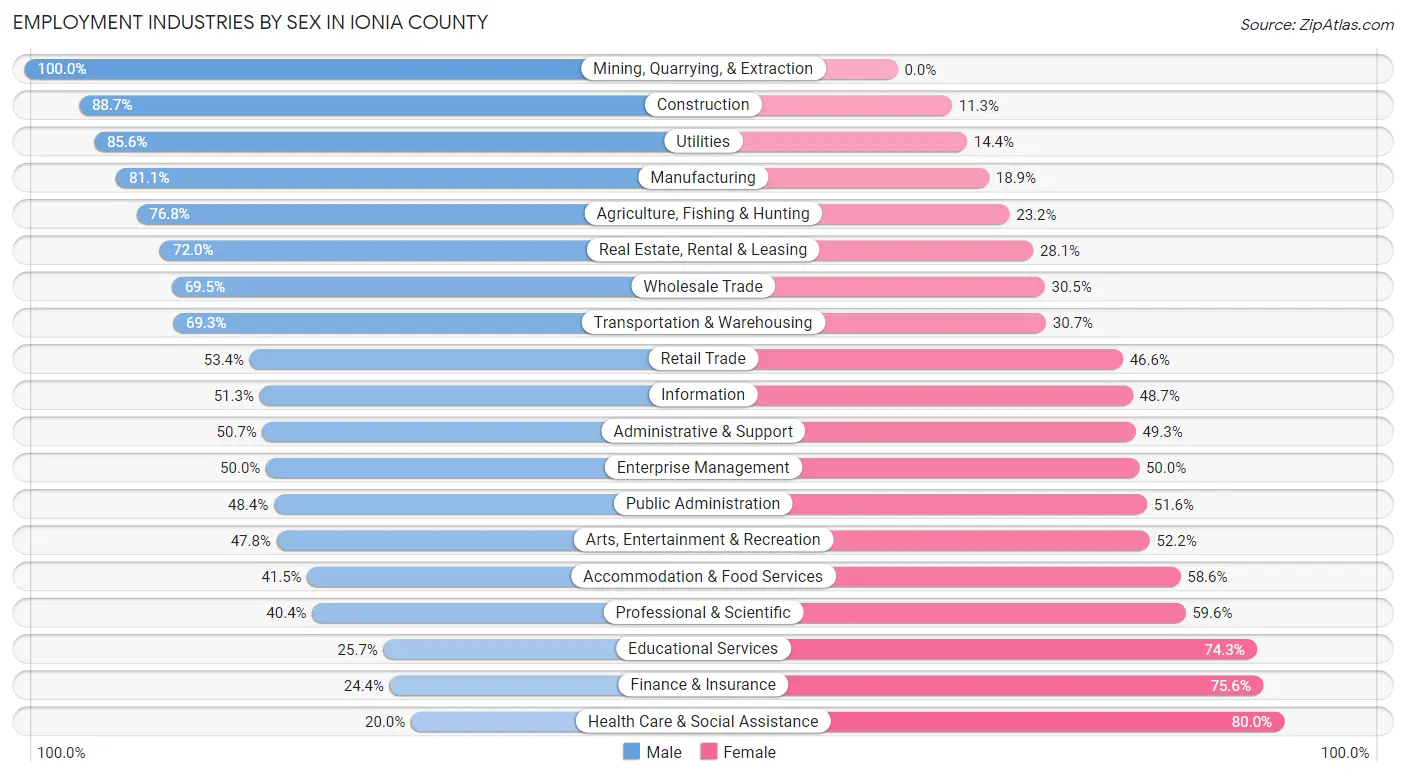
Employment Industries by Sex in Ionia County
The Ionia County industries that see more men than women are Mining, Quarrying, & Extraction (100.0%), Construction (88.7%), and Utilities (85.6%), whereas the industries that tend to have a higher number of women are Health Care & Social Assistance (80.0%), Finance & Insurance (75.6%), and Educational Services (74.3%).
| Industry | Male | Female |
| Agriculture, Fishing & Hunting | 1,045 (76.8%) | 315 (23.2%) |
| Mining, Quarrying, & Extraction | 43 (100.0%) | 0 (0.0%) |
| Construction | 2,239 (88.7%) | 284 (11.3%) |
| Manufacturing | 5,327 (81.1%) | 1,244 (18.9%) |
| Wholesale Trade | 452 (69.5%) | 198 (30.5%) |
| Retail Trade | 2,069 (53.4%) | 1,808 (46.6%) |
| Transportation & Warehousing | 674 (69.3%) | 299 (30.7%) |
| Utilities | 286 (85.6%) | 48 (14.4%) |
| Information | 174 (51.3%) | 165 (48.7%) |
| Finance & Insurance | 360 (24.4%) | 1,116 (75.6%) |
| Real Estate, Rental & Leasing | 118 (72.0%) | 46 (28.1%) |
| Professional & Scientific | 454 (40.4%) | 669 (59.6%) |
| Enterprise Management | 6 (50.0%) | 6 (50.0%) |
| Administrative & Support | 425 (50.7%) | 413 (49.3%) |
| Educational Services | 463 (25.7%) | 1,340 (74.3%) |
| Health Care & Social Assistance | 584 (20.0%) | 2,334 (80.0%) |
| Arts, Entertainment & Recreation | 131 (47.8%) | 143 (52.2%) |
| Accommodation & Food Services | 681 (41.4%) | 962 (58.6%) |
| Public Administration | 888 (48.4%) | 948 (51.6%) |
| Total | 17,225 (56.5%) | 13,240 (43.5%) |
Education in Ionia County
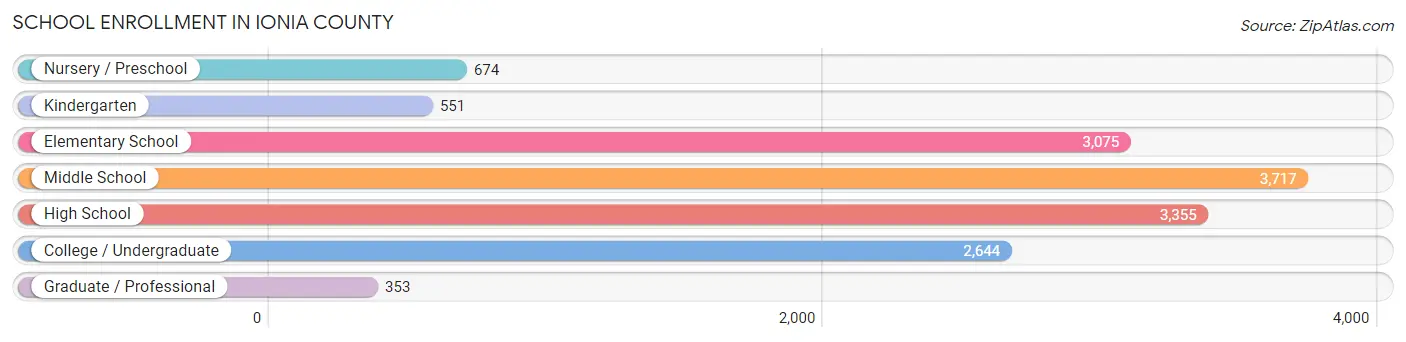
School Enrollment in Ionia County
The most common levels of schooling among the 14,369 students in Ionia County are middle school (3,717 | 25.9%), high school (3,355 | 23.4%), and elementary school (3,075 | 21.4%).
| School Level | # Students | % Students |
| Nursery / Preschool | 674 | 4.7% |
| Kindergarten | 551 | 3.8% |
| Elementary School | 3,075 | 21.4% |
| Middle School | 3,717 | 25.9% |
| High School | 3,355 | 23.4% |
| College / Undergraduate | 2,644 | 18.4% |
| Graduate / Professional | 353 | 2.5% |
| Total | 14,369 | 100.0% |
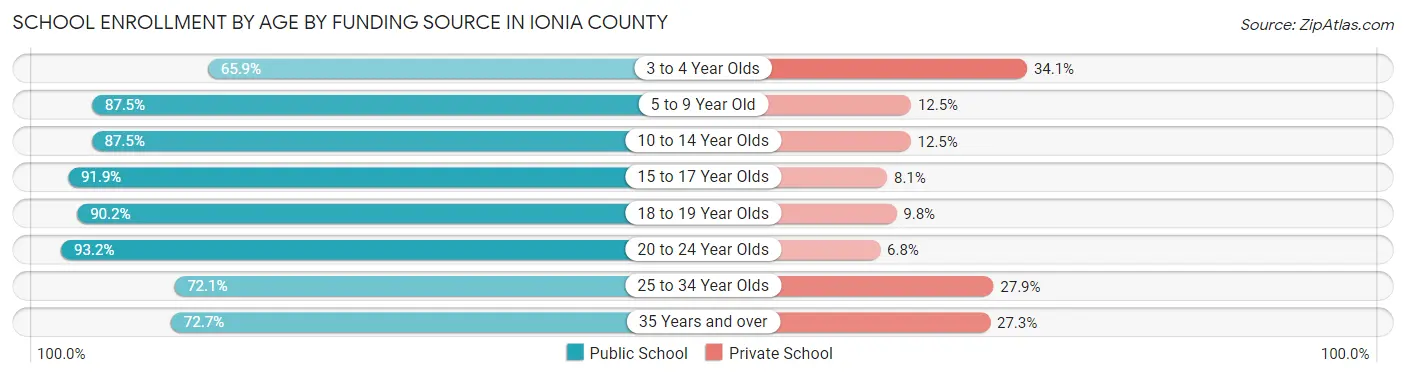
School Enrollment by Age by Funding Source in Ionia County
Out of a total of 14,369 students who are enrolled in schools in Ionia County, 1,911 (13.3%) attend a private institution, while the remaining 12,458 (86.7%) are enrolled in public schools. The age group of 3 to 4 year olds has the highest likelihood of being enrolled in private schools, with 155 (34.1% in the age bracket) enrolled. Conversely, the age group of 20 to 24 year olds has the lowest likelihood of being enrolled in a private school, with 934 (93.2% in the age bracket) attending a public institution.
| Age Bracket | Public School | Private School |
| 3 to 4 Year Olds | 299 (65.9%) | 155 (34.1%) |
| 5 to 9 Year Old | 3,022 (87.5%) | 433 (12.5%) |
| 10 to 14 Year Olds | 3,888 (87.5%) | 554 (12.5%) |
| 15 to 17 Year Olds | 2,231 (91.9%) | 196 (8.1%) |
| 18 to 19 Year Olds | 1,030 (90.2%) | 112 (9.8%) |
| 20 to 24 Year Olds | 934 (93.2%) | 68 (6.8%) |
| 25 to 34 Year Olds | 525 (72.1%) | 203 (27.9%) |
| 35 Years and over | 523 (72.7%) | 196 (27.3%) |
| Total | 12,458 (86.7%) | 1,911 (13.3%) |
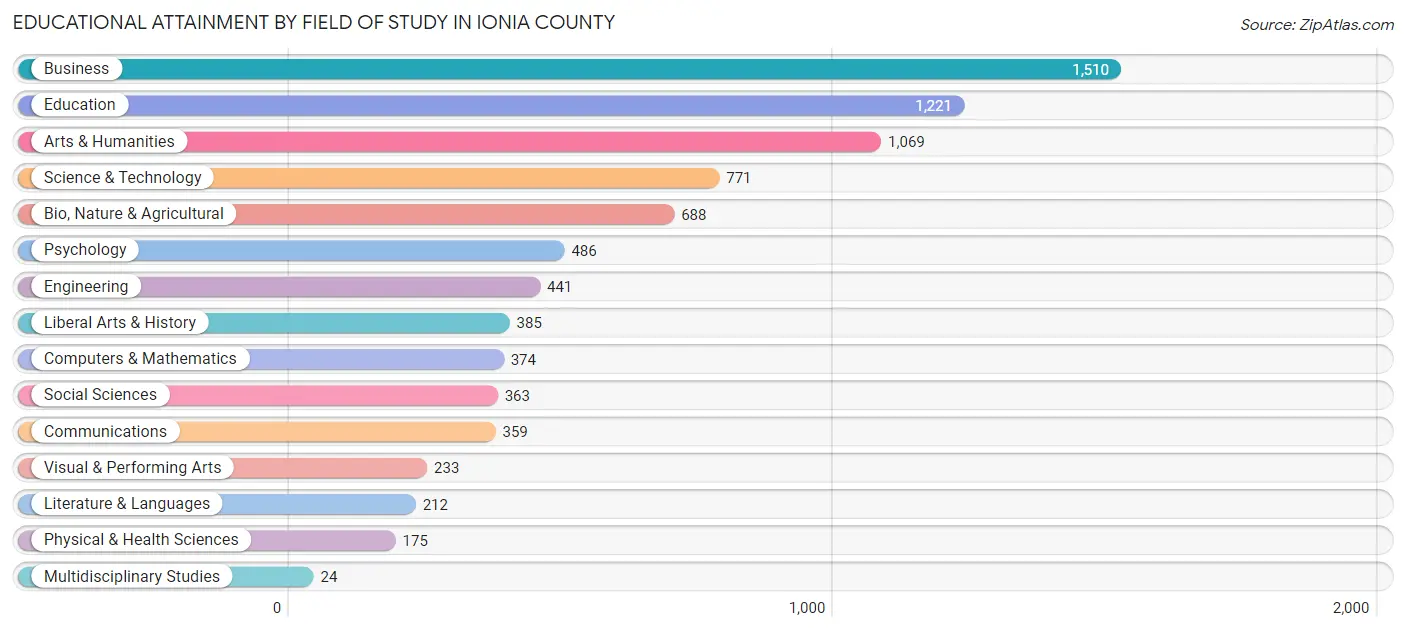
Educational Attainment by Field of Study in Ionia County
Business (1,510 | 18.2%), education (1,221 | 14.7%), arts & humanities (1,069 | 12.9%), science & technology (771 | 9.3%), and bio, nature & agricultural (688 | 8.3%) are the most common fields of study among 8,311 individuals in Ionia County who have obtained a bachelor's degree or higher.
| Field of Study | # Graduates | % Graduates |
| Computers & Mathematics | 374 | 4.5% |
| Bio, Nature & Agricultural | 688 | 8.3% |
| Physical & Health Sciences | 175 | 2.1% |
| Psychology | 486 | 5.9% |
| Social Sciences | 363 | 4.4% |
| Engineering | 441 | 5.3% |
| Multidisciplinary Studies | 24 | 0.3% |
| Science & Technology | 771 | 9.3% |
| Business | 1,510 | 18.2% |
| Education | 1,221 | 14.7% |
| Literature & Languages | 212 | 2.5% |
| Liberal Arts & History | 385 | 4.6% |
| Visual & Performing Arts | 233 | 2.8% |
| Communications | 359 | 4.3% |
| Arts & Humanities | 1,069 | 12.9% |
| Total | 8,311 | 100.0% |
Transportation & Commute in Ionia County
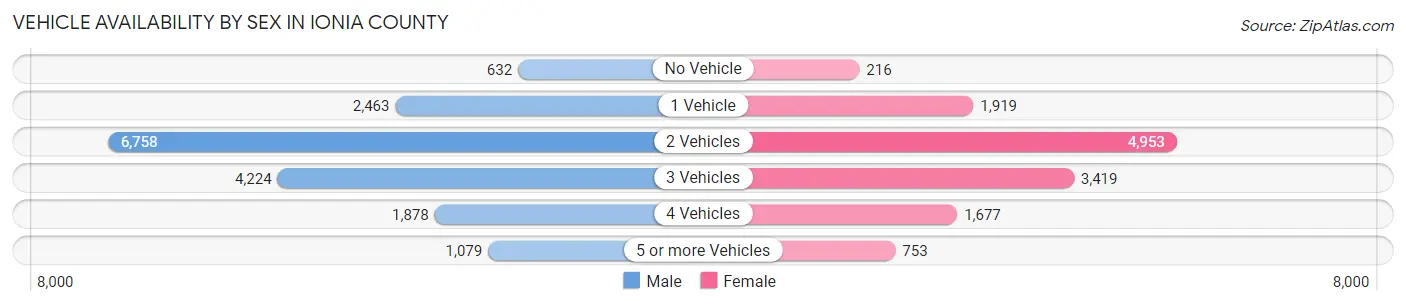
Vehicle Availability by Sex in Ionia County
The most prevalent vehicle ownership categories in Ionia County are males with 2 vehicles (6,758, accounting for 39.7%) and females with 2 vehicles (4,953, making up 52.2%).
| Vehicles Available | Male | Female |
| No Vehicle | 632 (3.7%) | 216 (1.7%) |
| 1 Vehicle | 2,463 (14.5%) | 1,919 (14.8%) |
| 2 Vehicles | 6,758 (39.7%) | 4,953 (38.3%) |
| 3 Vehicles | 4,224 (24.8%) | 3,419 (26.4%) |
| 4 Vehicles | 1,878 (11.0%) | 1,677 (13.0%) |
| 5 or more Vehicles | 1,079 (6.3%) | 753 (5.8%) |
| Total | 17,034 (100.0%) | 12,937 (100.0%) |
Commute Time in Ionia County
The most frequently occuring commute durations in Ionia County are 30 to 34 minutes (3,567 commuters, 12.8%), 5 to 9 minutes (3,346 commuters, 12.0%), and 45 to 59 minutes (3,186 commuters, 11.5%).
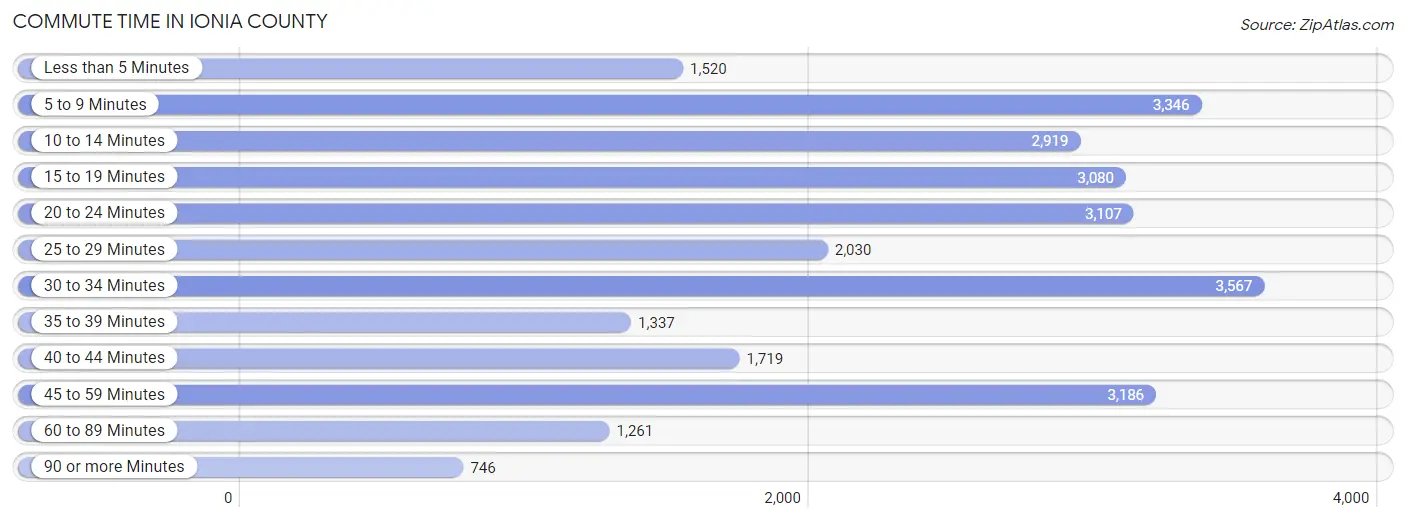
| Commute Time | # Commuters | % Commuters |
| Less than 5 Minutes | 1,520 | 5.5% |
| 5 to 9 Minutes | 3,346 | 12.0% |
| 10 to 14 Minutes | 2,919 | 10.5% |
| 15 to 19 Minutes | 3,080 | 11.1% |
| 20 to 24 Minutes | 3,107 | 11.2% |
| 25 to 29 Minutes | 2,030 | 7.3% |
| 30 to 34 Minutes | 3,567 | 12.8% |
| 35 to 39 Minutes | 1,337 | 4.8% |
| 40 to 44 Minutes | 1,719 | 6.2% |
| 45 to 59 Minutes | 3,186 | 11.5% |
| 60 to 89 Minutes | 1,261 | 4.5% |
| 90 or more Minutes | 746 | 2.7% |
Commute Time by Sex in Ionia County
The most common commute times in Ionia County are 45 to 59 minutes (2,041 commuters, 12.6%) for males and 5 to 9 minutes (1,758 commuters, 15.2%) for females.
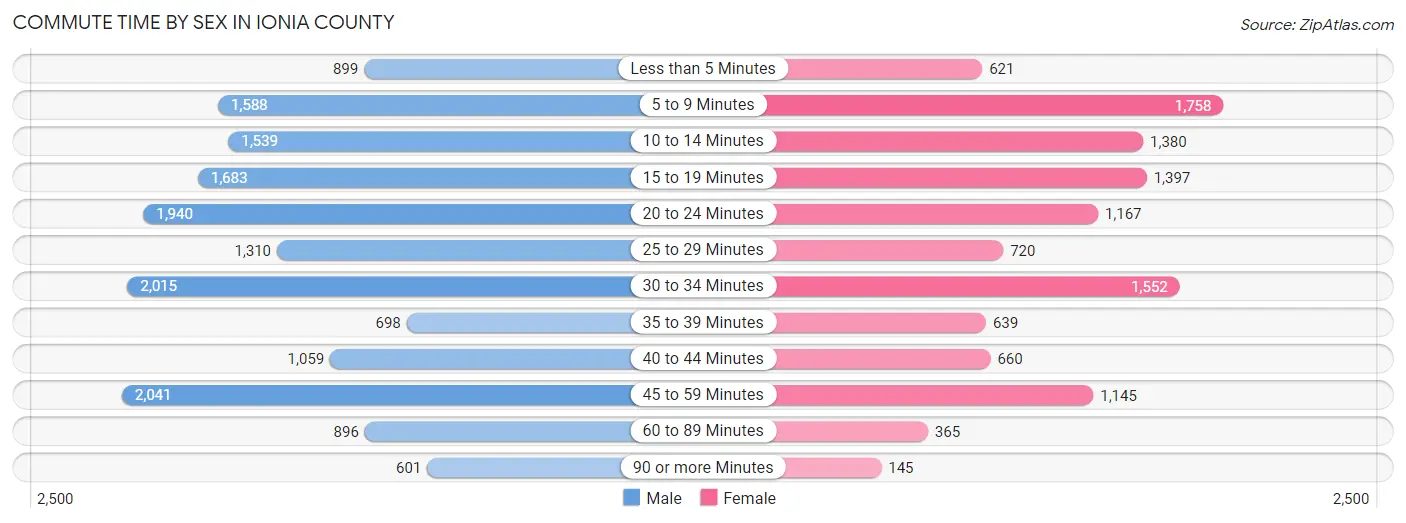
| Commute Time | Male | Female |
| Less than 5 Minutes | 899 (5.5%) | 621 (5.4%) |
| 5 to 9 Minutes | 1,588 (9.8%) | 1,758 (15.2%) |
| 10 to 14 Minutes | 1,539 (9.5%) | 1,380 (11.9%) |
| 15 to 19 Minutes | 1,683 (10.3%) | 1,397 (12.1%) |
| 20 to 24 Minutes | 1,940 (11.9%) | 1,167 (10.1%) |
| 25 to 29 Minutes | 1,310 (8.1%) | 720 (6.2%) |
| 30 to 34 Minutes | 2,015 (12.4%) | 1,552 (13.4%) |
| 35 to 39 Minutes | 698 (4.3%) | 639 (5.5%) |
| 40 to 44 Minutes | 1,059 (6.5%) | 660 (5.7%) |
| 45 to 59 Minutes | 2,041 (12.6%) | 1,145 (9.9%) |
| 60 to 89 Minutes | 896 (5.5%) | 365 (3.2%) |
| 90 or more Minutes | 601 (3.7%) | 145 (1.3%) |
Time of Departure to Work by Sex in Ionia County
The most frequent times of departure to work in Ionia County are 6:30 AM to 6:59 AM (1,988, 12.2%) for males and 7:00 AM to 7:29 AM (1,935, 16.8%) for females.
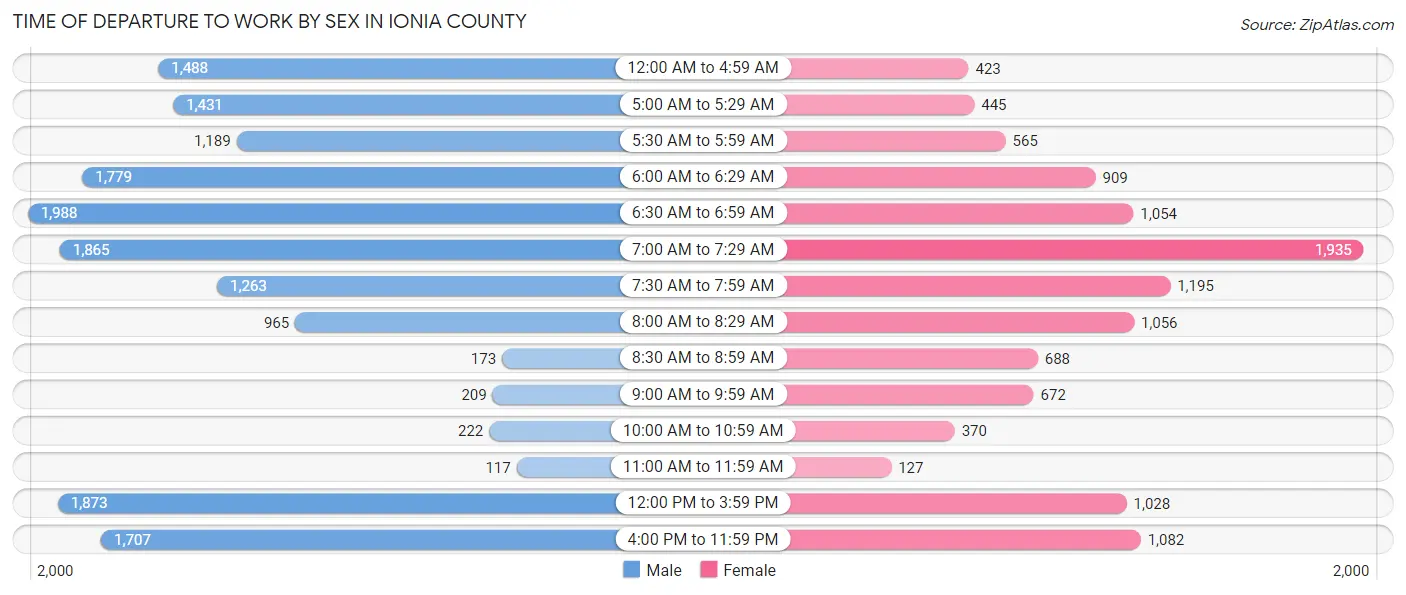
| Time of Departure | Male | Female |
| 12:00 AM to 4:59 AM | 1,488 (9.1%) | 423 (3.7%) |
| 5:00 AM to 5:29 AM | 1,431 (8.8%) | 445 (3.8%) |
| 5:30 AM to 5:59 AM | 1,189 (7.3%) | 565 (4.9%) |
| 6:00 AM to 6:29 AM | 1,779 (10.9%) | 909 (7.9%) |
| 6:30 AM to 6:59 AM | 1,988 (12.2%) | 1,054 (9.1%) |
| 7:00 AM to 7:29 AM | 1,865 (11.5%) | 1,935 (16.8%) |
| 7:30 AM to 7:59 AM | 1,263 (7.8%) | 1,195 (10.3%) |
| 8:00 AM to 8:29 AM | 965 (5.9%) | 1,056 (9.1%) |
| 8:30 AM to 8:59 AM | 173 (1.1%) | 688 (6.0%) |
| 9:00 AM to 9:59 AM | 209 (1.3%) | 672 (5.8%) |
| 10:00 AM to 10:59 AM | 222 (1.4%) | 370 (3.2%) |
| 11:00 AM to 11:59 AM | 117 (0.7%) | 127 (1.1%) |
| 12:00 PM to 3:59 PM | 1,873 (11.5%) | 1,028 (8.9%) |
| 4:00 PM to 11:59 PM | 1,707 (10.5%) | 1,082 (9.4%) |
| Total | 16,269 (100.0%) | 11,549 (100.0%) |
Housing Occupancy in Ionia County
Occupancy by Ownership in Ionia County
Of the total 22,765 dwellings in Ionia County, owner-occupied units account for 17,552 (77.1%), while renter-occupied units make up 5,213 (22.9%).
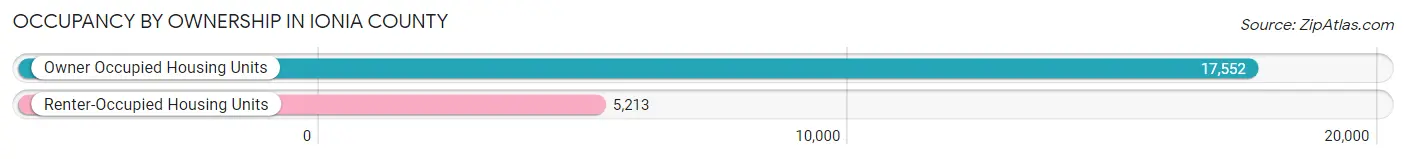
| Occupancy | # Housing Units | % Housing Units |
| Owner Occupied Housing Units | 17,552 | 77.1% |
| Renter-Occupied Housing Units | 5,213 | 22.9% |
| Total Occupied Housing Units | 22,765 | 100.0% |
Occupancy by Household Size in Ionia County
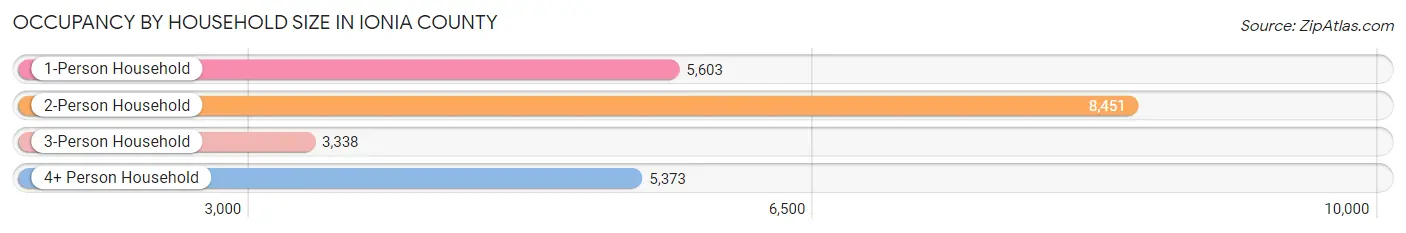
| Household Size | # Housing Units | % Housing Units |
| 1-Person Household | 5,603 | 24.6% |
| 2-Person Household | 8,451 | 37.1% |
| 3-Person Household | 3,338 | 14.7% |
| 4+ Person Household | 5,373 | 23.6% |
| Total Housing Units | 22,765 | 100.0% |
Occupancy by Ownership by Household Size in Ionia County
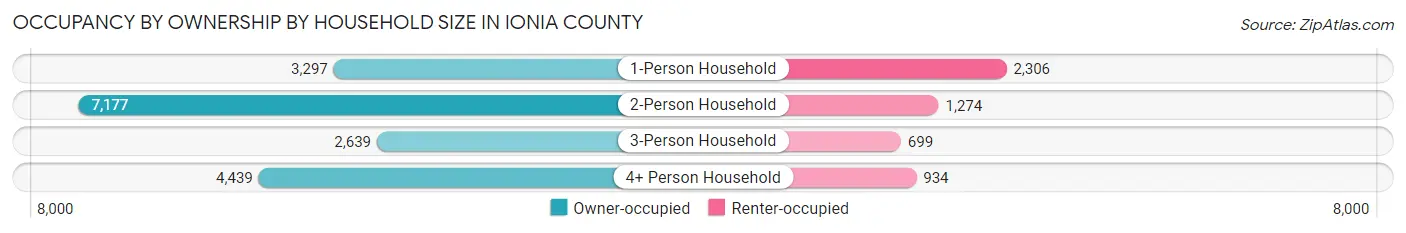
| Household Size | Owner-occupied | Renter-occupied |
| 1-Person Household | 3,297 (58.8%) | 2,306 (41.2%) |
| 2-Person Household | 7,177 (84.9%) | 1,274 (15.1%) |
| 3-Person Household | 2,639 (79.1%) | 699 (20.9%) |
| 4+ Person Household | 4,439 (82.6%) | 934 (17.4%) |
| Total Housing Units | 17,552 (77.1%) | 5,213 (22.9%) |
Occupancy by Educational Attainment in Ionia County
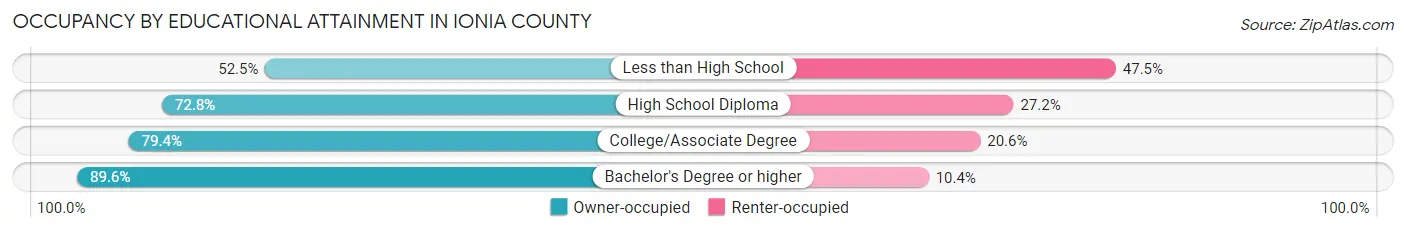
| Household Size | Owner-occupied | Renter-occupied |
| Less than High School | 848 (52.5%) | 768 (47.5%) |
| High School Diploma | 5,946 (72.8%) | 2,225 (27.2%) |
| College/Associate Degree | 6,741 (79.4%) | 1,753 (20.6%) |
| Bachelor's Degree or higher | 4,017 (89.6%) | 467 (10.4%) |
Occupancy by Age of Householder in Ionia County
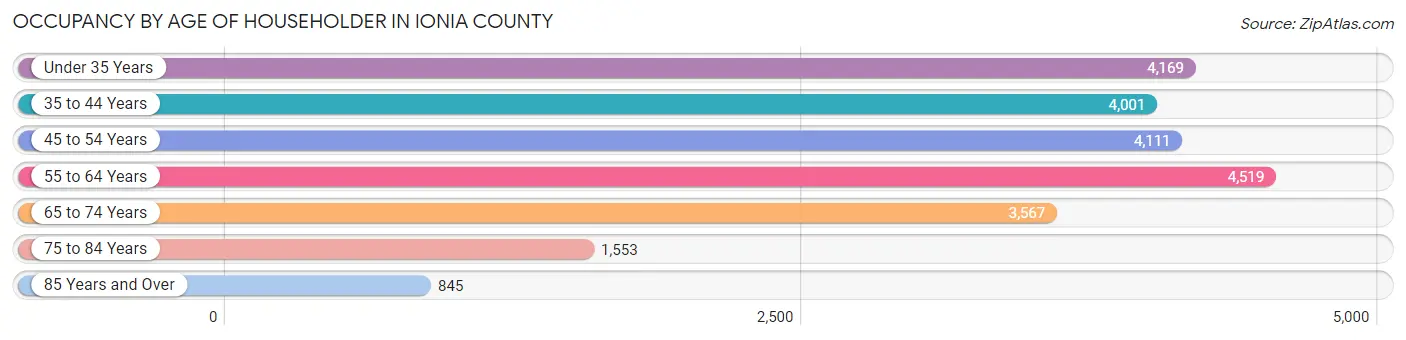
| Age Bracket | # Households | % Households |
| Under 35 Years | 4,169 | 18.3% |
| 35 to 44 Years | 4,001 | 17.6% |
| 45 to 54 Years | 4,111 | 18.1% |
| 55 to 64 Years | 4,519 | 19.9% |
| 65 to 74 Years | 3,567 | 15.7% |
| 75 to 84 Years | 1,553 | 6.8% |
| 85 Years and Over | 845 | 3.7% |
| Total | 22,765 | 100.0% |
Housing Finances in Ionia County
Median Income by Occupancy in Ionia County
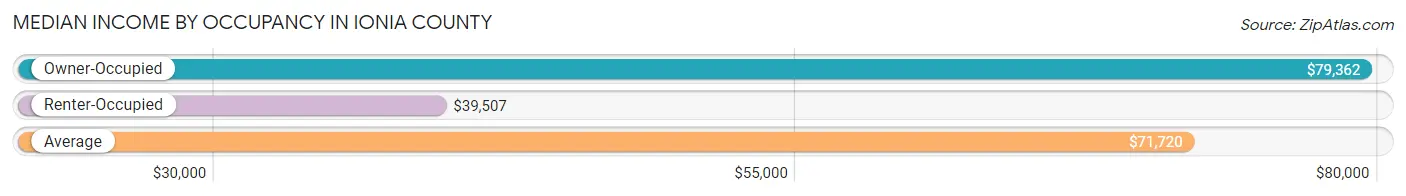
| Occupancy Type | # Households | Median Income |
| Owner-Occupied | 17,552 (77.1%) | $79,362 |
| Renter-Occupied | 5,213 (22.9%) | $39,507 |
| Average | 22,765 (100.0%) | $71,720 |
Occupancy by Householder Income Bracket in Ionia County
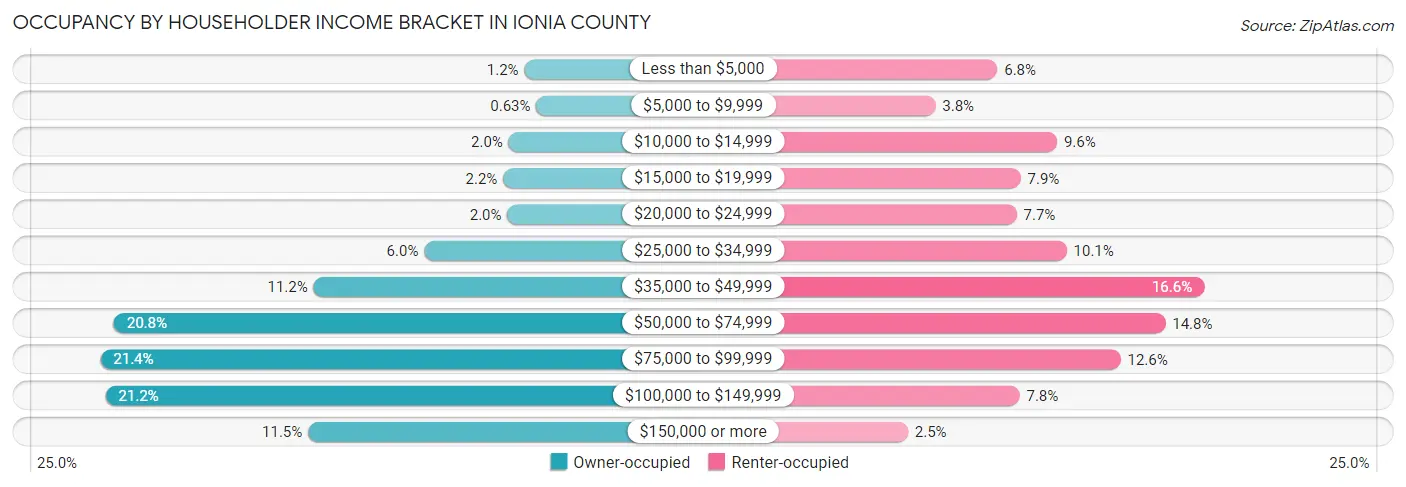
| Income Bracket | Owner-occupied | Renter-occupied |
| Less than $5,000 | 211 (1.2%) | 352 (6.8%) |
| $5,000 to $9,999 | 110 (0.6%) | 198 (3.8%) |
| $10,000 to $14,999 | 342 (1.9%) | 500 (9.6%) |
| $15,000 to $19,999 | 388 (2.2%) | 410 (7.9%) |
| $20,000 to $24,999 | 353 (2.0%) | 400 (7.7%) |
| $25,000 to $34,999 | 1,048 (6.0%) | 524 (10.1%) |
| $35,000 to $49,999 | 1,972 (11.2%) | 865 (16.6%) |
| $50,000 to $74,999 | 3,642 (20.7%) | 769 (14.7%) |
| $75,000 to $99,999 | 3,755 (21.4%) | 658 (12.6%) |
| $100,000 to $149,999 | 3,712 (21.1%) | 407 (7.8%) |
| $150,000 or more | 2,019 (11.5%) | 130 (2.5%) |
| Total | 17,552 (100.0%) | 5,213 (100.0%) |
Monthly Housing Cost Tiers in Ionia County
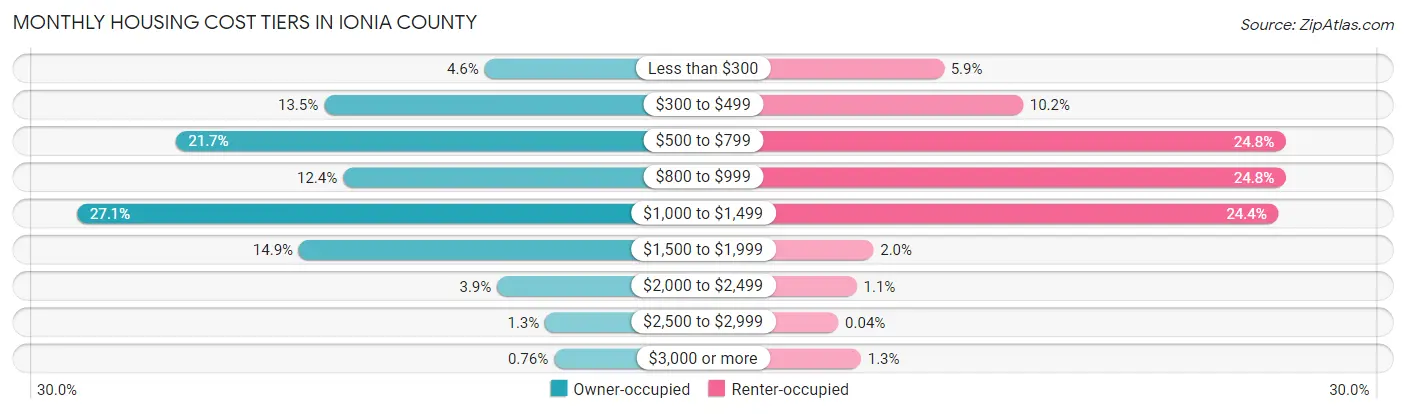
| Monthly Cost | Owner-occupied | Renter-occupied |
| Less than $300 | 805 (4.6%) | 306 (5.9%) |
| $300 to $499 | 2,362 (13.5%) | 534 (10.2%) |
| $500 to $799 | 3,803 (21.7%) | 1,292 (24.8%) |
| $800 to $999 | 2,178 (12.4%) | 1,292 (24.8%) |
| $1,000 to $1,499 | 4,758 (27.1%) | 1,270 (24.4%) |
| $1,500 to $1,999 | 2,607 (14.8%) | 103 (2.0%) |
| $2,000 to $2,499 | 685 (3.9%) | 55 (1.1%) |
| $2,500 to $2,999 | 220 (1.3%) | 2 (0.0%) |
| $3,000 or more | 134 (0.8%) | 67 (1.3%) |
| Total | 17,552 (100.0%) | 5,213 (100.0%) |
Physical Housing Characteristics in Ionia County
Housing Structures in Ionia County
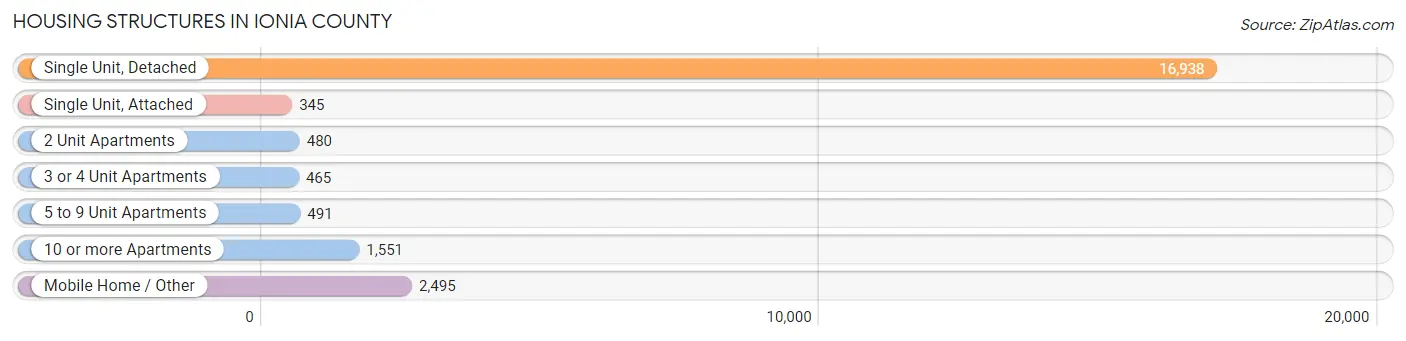
| Structure Type | # Housing Units | % Housing Units |
| Single Unit, Detached | 16,938 | 74.4% |
| Single Unit, Attached | 345 | 1.5% |
| 2 Unit Apartments | 480 | 2.1% |
| 3 or 4 Unit Apartments | 465 | 2.0% |
| 5 to 9 Unit Apartments | 491 | 2.2% |
| 10 or more Apartments | 1,551 | 6.8% |
| Mobile Home / Other | 2,495 | 11.0% |
| Total | 22,765 | 100.0% |
Housing Structures by Occupancy in Ionia County
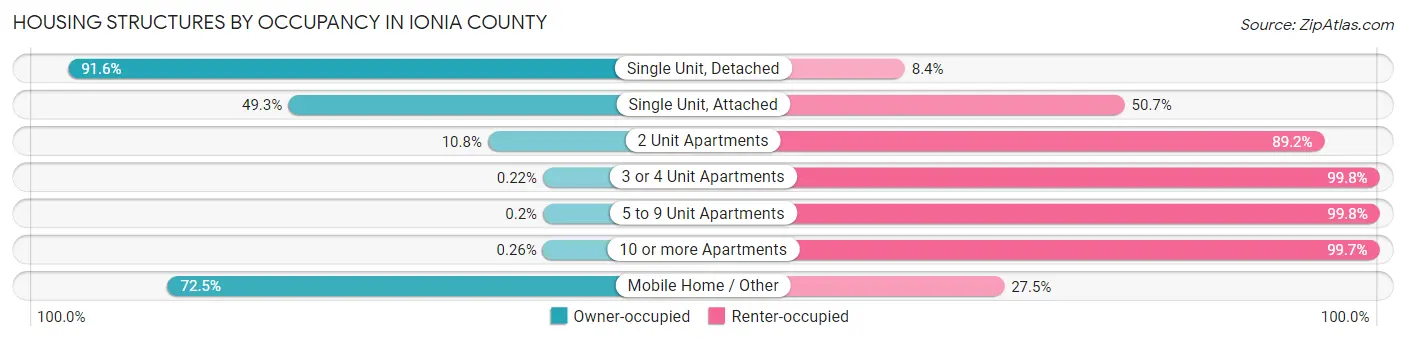
| Structure Type | Owner-occupied | Renter-occupied |
| Single Unit, Detached | 15,516 (91.6%) | 1,422 (8.4%) |
| Single Unit, Attached | 170 (49.3%) | 175 (50.7%) |
| 2 Unit Apartments | 52 (10.8%) | 428 (89.2%) |
| 3 or 4 Unit Apartments | 1 (0.2%) | 464 (99.8%) |
| 5 to 9 Unit Apartments | 1 (0.2%) | 490 (99.8%) |
| 10 or more Apartments | 4 (0.3%) | 1,547 (99.7%) |
| Mobile Home / Other | 1,808 (72.5%) | 687 (27.5%) |
| Total | 17,552 (77.1%) | 5,213 (22.9%) |
Housing Structures by Number of Rooms in Ionia County
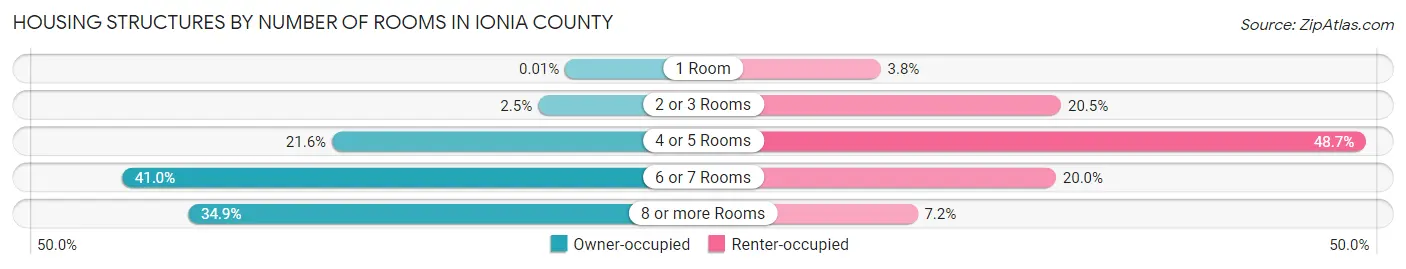
| Number of Rooms | Owner-occupied | Renter-occupied |
| 1 Room | 2 (0.0%) | 196 (3.8%) |
| 2 or 3 Rooms | 443 (2.5%) | 1,066 (20.4%) |
| 4 or 5 Rooms | 3,787 (21.6%) | 2,536 (48.6%) |
| 6 or 7 Rooms | 7,197 (41.0%) | 1,041 (20.0%) |
| 8 or more Rooms | 6,123 (34.9%) | 374 (7.2%) |
| Total | 17,552 (100.0%) | 5,213 (100.0%) |
Housing Structure by Heating Type in Ionia County
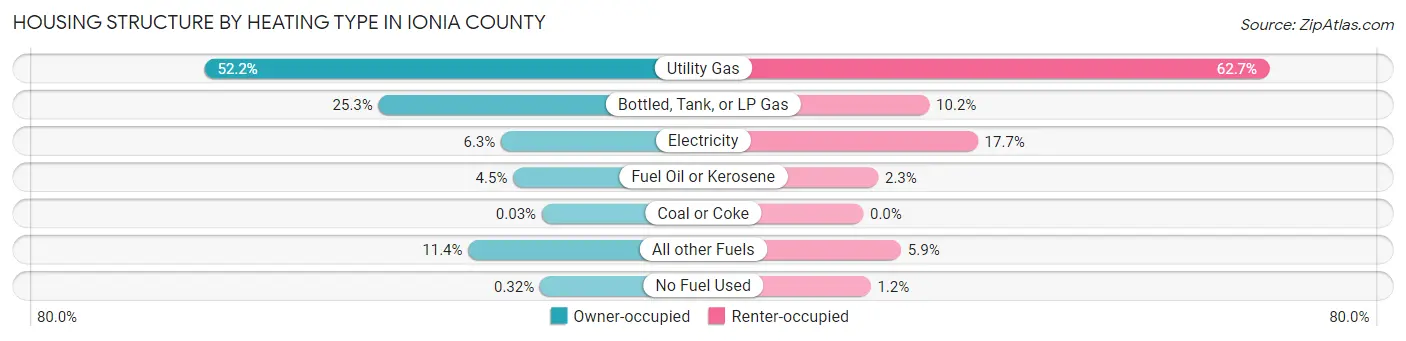
| Heating Type | Owner-occupied | Renter-occupied |
| Utility Gas | 9,160 (52.2%) | 3,270 (62.7%) |
| Bottled, Tank, or LP Gas | 4,435 (25.3%) | 533 (10.2%) |
| Electricity | 1,112 (6.3%) | 924 (17.7%) |
| Fuel Oil or Kerosene | 782 (4.5%) | 121 (2.3%) |
| Coal or Coke | 6 (0.0%) | 0 (0.0%) |
| All other Fuels | 2,001 (11.4%) | 305 (5.9%) |
| No Fuel Used | 56 (0.3%) | 60 (1.1%) |
| Total | 17,552 (100.0%) | 5,213 (100.0%) |
Household Vehicle Usage in Ionia County
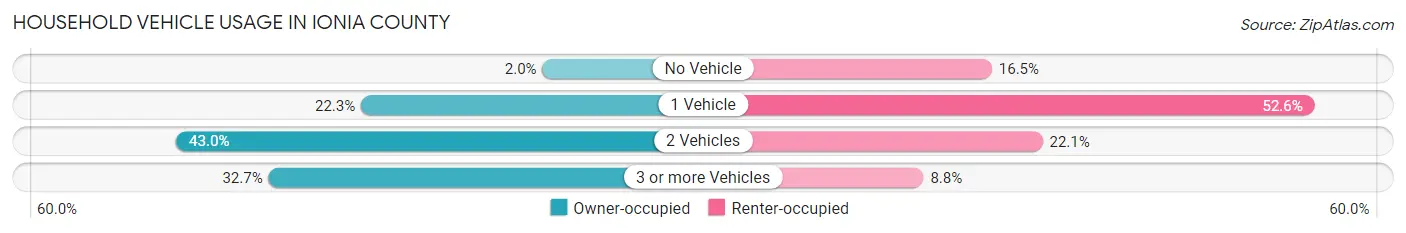
| Vehicles per Household | Owner-occupied | Renter-occupied |
| No Vehicle | 349 (2.0%) | 858 (16.5%) |
| 1 Vehicle | 3,916 (22.3%) | 2,742 (52.6%) |
| 2 Vehicles | 7,551 (43.0%) | 1,154 (22.1%) |
| 3 or more Vehicles | 5,736 (32.7%) | 459 (8.8%) |
| Total | 17,552 (100.0%) | 5,213 (100.0%) |
Real Estate & Mortgages in Ionia County
Real Estate and Mortgage Overview in Ionia County
| Characteristic | Without Mortgage | With Mortgage |
| Housing Units | 6,785 | 10,767 |
| Median Property Value | $155,900 | $179,700 |
| Median Household Income | $65,872 | $1,271 |
| Monthly Housing Costs | $525 | $118 |
| Real Estate Taxes | $1,920 | $447 |
Property Value by Mortgage Status in Ionia County
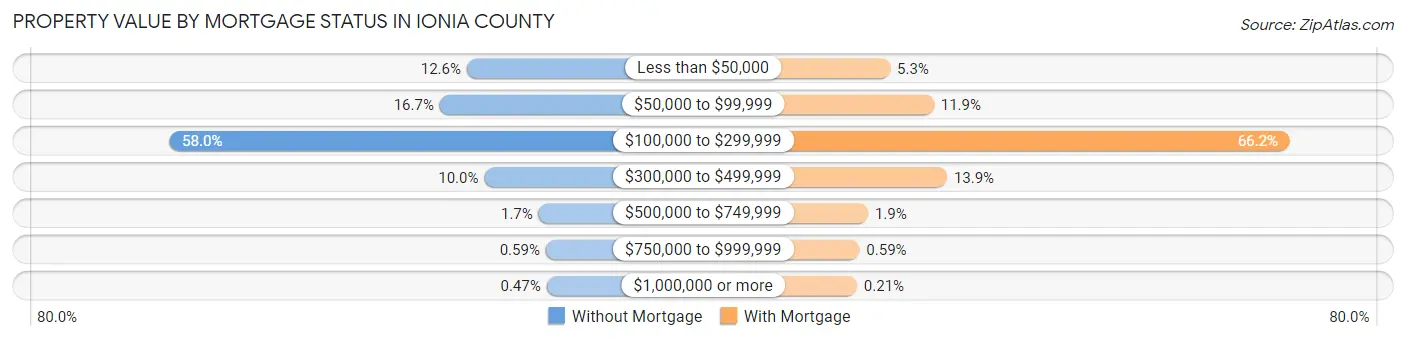
| Property Value | Without Mortgage | With Mortgage |
| Less than $50,000 | 856 (12.6%) | 567 (5.3%) |
| $50,000 to $99,999 | 1,136 (16.7%) | 1,283 (11.9%) |
| $100,000 to $299,999 | 3,933 (58.0%) | 7,127 (66.2%) |
| $300,000 to $499,999 | 675 (10.0%) | 1,500 (13.9%) |
| $500,000 to $749,999 | 113 (1.7%) | 203 (1.9%) |
| $750,000 to $999,999 | 40 (0.6%) | 64 (0.6%) |
| $1,000,000 or more | 32 (0.5%) | 23 (0.2%) |
| Total | 6,785 (100.0%) | 10,767 (100.0%) |
Household Income by Mortgage Status in Ionia County
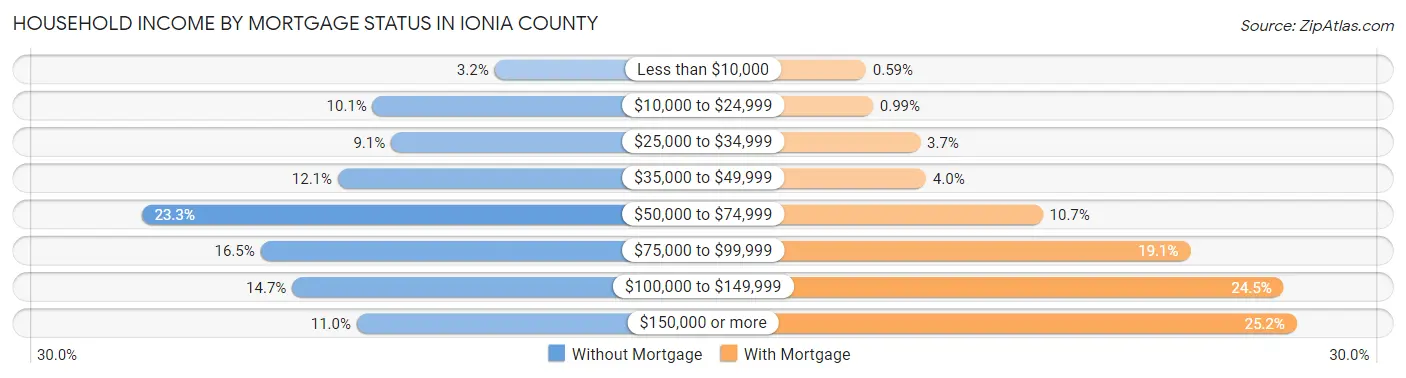
| Household Income | Without Mortgage | With Mortgage |
| Less than $10,000 | 214 (3.2%) | 64 (0.6%) |
| $10,000 to $24,999 | 686 (10.1%) | 107 (1.0%) |
| $25,000 to $34,999 | 615 (9.1%) | 397 (3.7%) |
| $35,000 to $49,999 | 821 (12.1%) | 433 (4.0%) |
| $50,000 to $74,999 | 1,582 (23.3%) | 1,151 (10.7%) |
| $75,000 to $99,999 | 1,121 (16.5%) | 2,060 (19.1%) |
| $100,000 to $149,999 | 998 (14.7%) | 2,634 (24.5%) |
| $150,000 or more | 748 (11.0%) | 2,714 (25.2%) |
| Total | 6,785 (100.0%) | 10,767 (100.0%) |
Property Value to Household Income Ratio in Ionia County
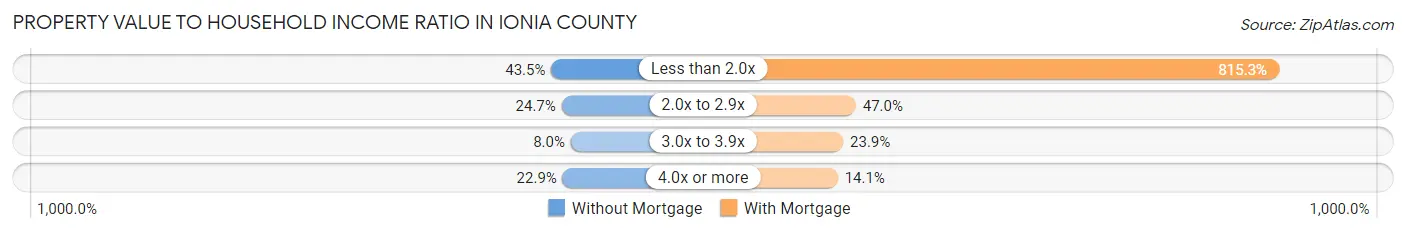
| Value-to-Income Ratio | Without Mortgage | With Mortgage |
| Less than 2.0x | 2,948 (43.4%) | 87,786 (815.3%) |
| 2.0x to 2.9x | 1,678 (24.7%) | 5,062 (47.0%) |
| 3.0x to 3.9x | 542 (8.0%) | 2,575 (23.9%) |
| 4.0x or more | 1,551 (22.9%) | 1,520 (14.1%) |
| Total | 6,785 (100.0%) | 10,767 (100.0%) |
Real Estate Taxes by Mortgage Status in Ionia County
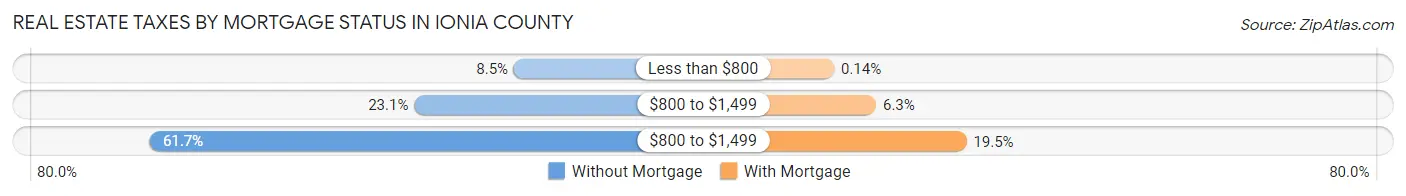
| Property Taxes | Without Mortgage | With Mortgage |
| Less than $800 | 577 (8.5%) | 15 (0.1%) |
| $800 to $1,499 | 1,565 (23.1%) | 676 (6.3%) |
| $800 to $1,499 | 4,185 (61.7%) | 2,098 (19.5%) |
| Total | 6,785 (100.0%) | 10,767 (100.0%) |
Health & Disability in Ionia County
Health Insurance Coverage by Age in Ionia County
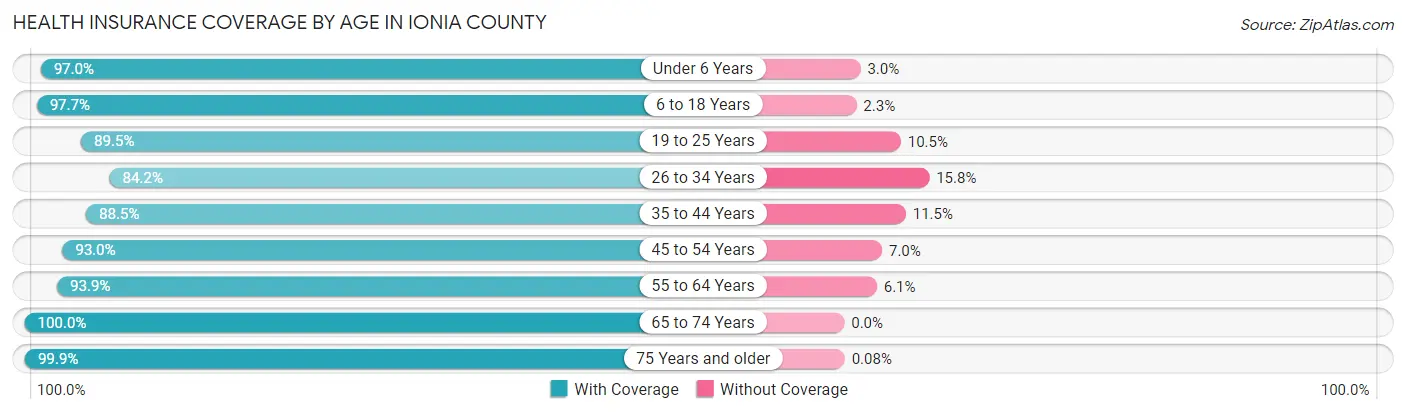
| Age Bracket | With Coverage | Without Coverage |
| Under 6 Years | 4,025 (97.0%) | 125 (3.0%) |
| 6 to 18 Years | 10,507 (97.7%) | 243 (2.3%) |
| 19 to 25 Years | 5,236 (89.5%) | 616 (10.5%) |
| 26 to 34 Years | 6,371 (84.2%) | 1,199 (15.8%) |
| 35 to 44 Years | 7,594 (88.5%) | 984 (11.5%) |
| 45 to 54 Years | 7,450 (93.0%) | 564 (7.0%) |
| 55 to 64 Years | 7,923 (93.9%) | 511 (6.1%) |
| 65 to 74 Years | 6,379 (100.0%) | 0 (0.0%) |
| 75 Years and older | 3,608 (99.9%) | 3 (0.1%) |
| Total | 59,093 (93.3%) | 4,245 (6.7%) |
Health Insurance Coverage by Citizenship Status in Ionia County
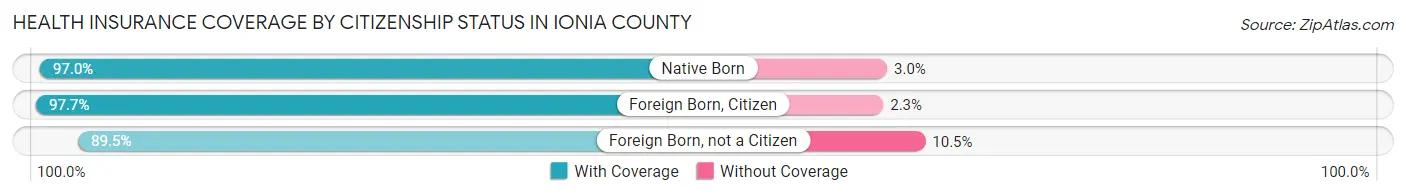
| Citizenship Status | With Coverage | Without Coverage |
| Native Born | 4,025 (97.0%) | 125 (3.0%) |
| Foreign Born, Citizen | 10,507 (97.7%) | 243 (2.3%) |
| Foreign Born, not a Citizen | 5,236 (89.5%) | 616 (10.5%) |
Health Insurance Coverage by Household Income in Ionia County
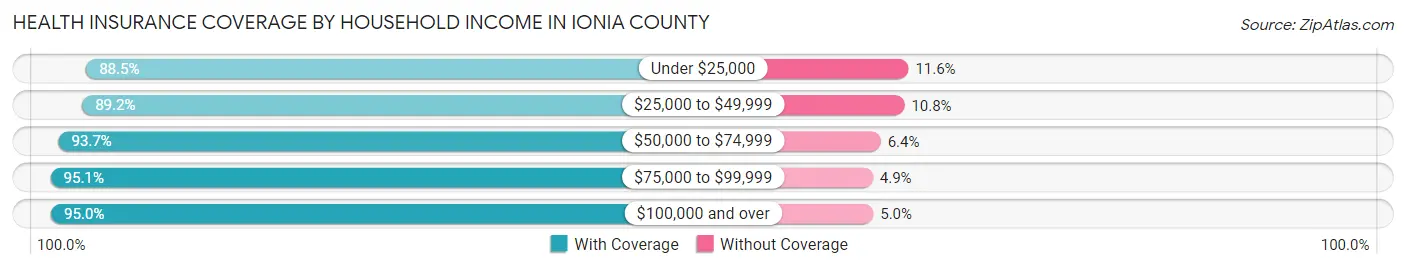
| Household Income | With Coverage | Without Coverage |
| Under $25,000 | 5,125 (88.4%) | 669 (11.6%) |
| $25,000 to $49,999 | 8,894 (89.2%) | 1,077 (10.8%) |
| $50,000 to $74,999 | 10,509 (93.6%) | 713 (6.4%) |
| $75,000 to $99,999 | 12,524 (95.1%) | 642 (4.9%) |
| $100,000 and over | 21,872 (95.0%) | 1,141 (5.0%) |
Public vs Private Health Insurance Coverage by Age in Ionia County
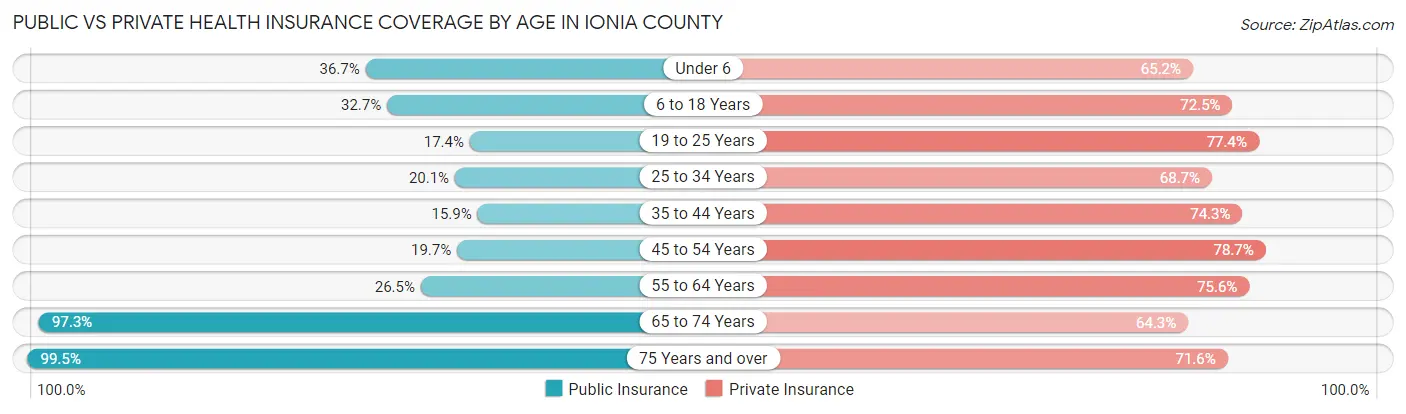
| Age Bracket | Public Insurance | Private Insurance |
| Under 6 | 1,524 (36.7%) | 2,704 (65.2%) |
| 6 to 18 Years | 3,519 (32.7%) | 7,794 (72.5%) |
| 19 to 25 Years | 1,016 (17.4%) | 4,528 (77.4%) |
| 25 to 34 Years | 1,523 (20.1%) | 5,199 (68.7%) |
| 35 to 44 Years | 1,366 (15.9%) | 6,376 (74.3%) |
| 45 to 54 Years | 1,581 (19.7%) | 6,304 (78.7%) |
| 55 to 64 Years | 2,232 (26.5%) | 6,377 (75.6%) |
| 65 to 74 Years | 6,209 (97.3%) | 4,100 (64.3%) |
| 75 Years and over | 3,591 (99.5%) | 2,585 (71.6%) |
| Total | 22,561 (35.6%) | 45,967 (72.6%) |
Disability Status by Sex by Age in Ionia County
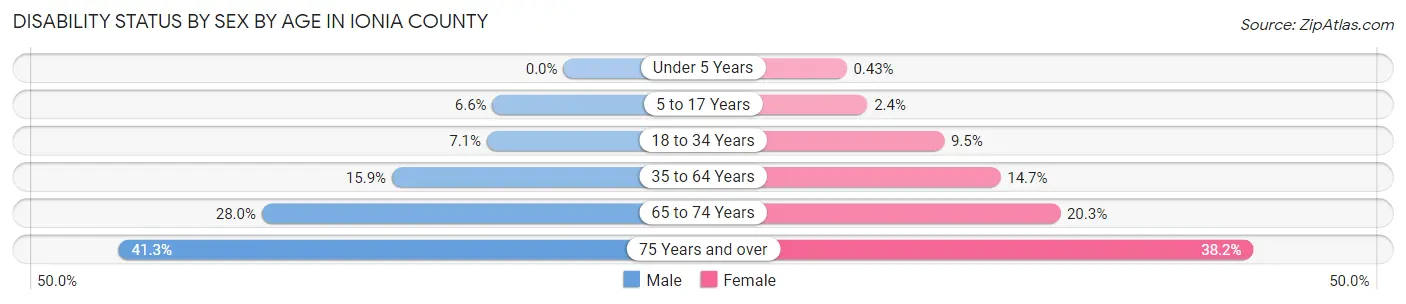
| Age Bracket | Male | Female |
| Under 5 Years | 0 (0.0%) | 7 (0.4%) |
| 5 to 17 Years | 360 (6.6%) | 122 (2.4%) |
| 18 to 34 Years | 566 (7.1%) | 587 (9.5%) |
| 35 to 64 Years | 2,100 (15.9%) | 1,740 (14.7%) |
| 65 to 74 Years | 858 (28.0%) | 671 (20.3%) |
| 75 Years and over | 629 (41.3%) | 797 (38.2%) |
Disability Class by Sex by Age in Ionia County
Disability Class: Hearing Difficulty
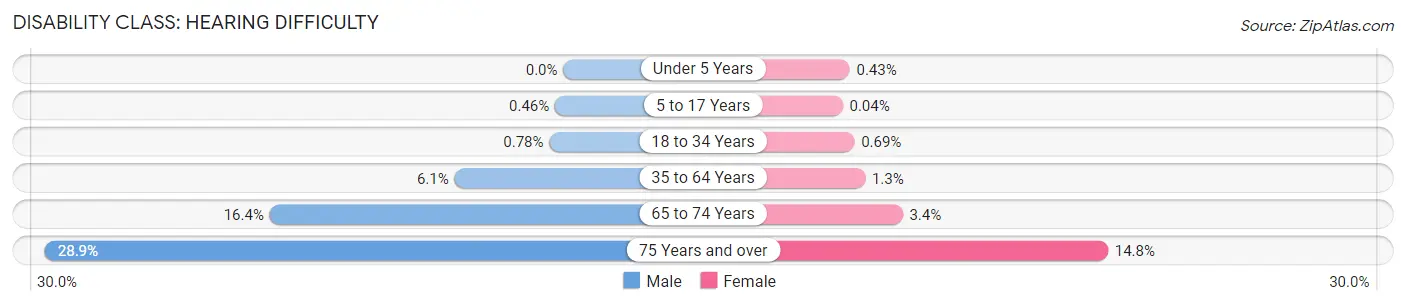
| Age Bracket | Male | Female |
| Under 5 Years | 0 (0.0%) | 7 (0.4%) |
| 5 to 17 Years | 25 (0.5%) | 2 (0.0%) |
| 18 to 34 Years | 62 (0.8%) | 43 (0.7%) |
| 35 to 64 Years | 800 (6.1%) | 153 (1.3%) |
| 65 to 74 Years | 501 (16.4%) | 112 (3.4%) |
| 75 Years and over | 440 (28.9%) | 309 (14.8%) |
Disability Class: Vision Difficulty
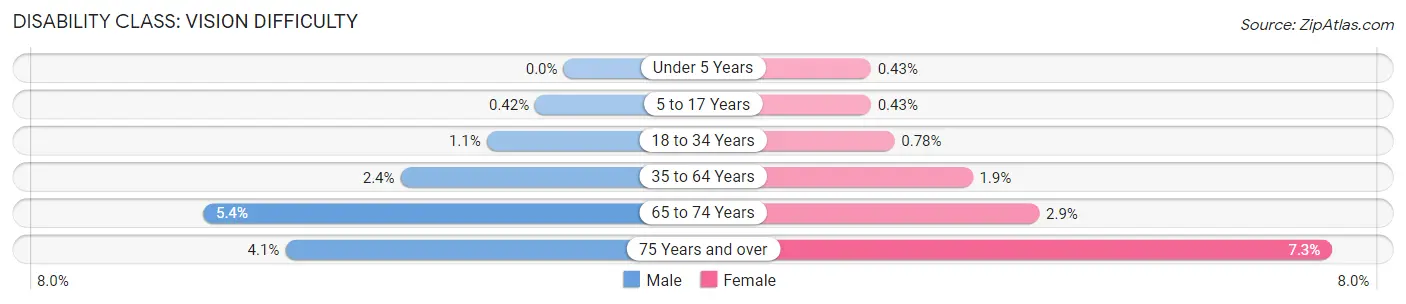
| Age Bracket | Male | Female |
| Under 5 Years | 0 (0.0%) | 7 (0.4%) |
| 5 to 17 Years | 23 (0.4%) | 22 (0.4%) |
| 18 to 34 Years | 91 (1.1%) | 48 (0.8%) |
| 35 to 64 Years | 320 (2.4%) | 230 (1.9%) |
| 65 to 74 Years | 164 (5.3%) | 97 (2.9%) |
| 75 Years and over | 63 (4.1%) | 152 (7.3%) |
Disability Class: Cognitive Difficulty
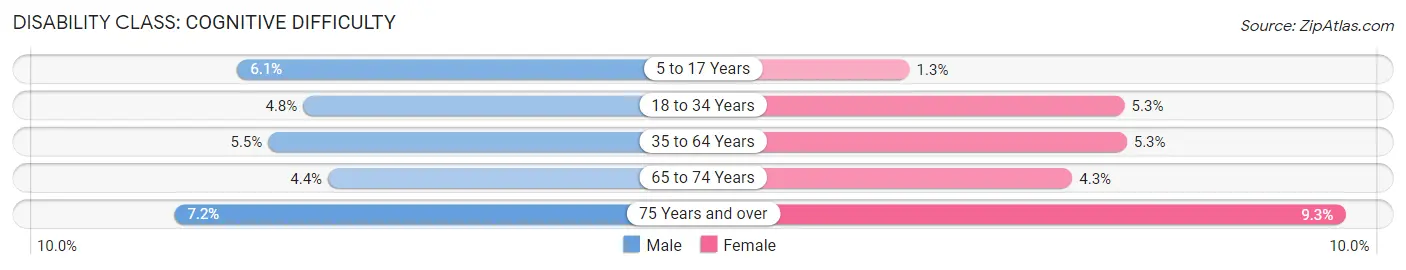
| Age Bracket | Male | Female |
| 5 to 17 Years | 331 (6.0%) | 65 (1.3%) |
| 18 to 34 Years | 385 (4.8%) | 325 (5.2%) |
| 35 to 64 Years | 723 (5.5%) | 626 (5.3%) |
| 65 to 74 Years | 134 (4.4%) | 142 (4.3%) |
| 75 Years and over | 110 (7.2%) | 195 (9.3%) |
Disability Class: Ambulatory Difficulty
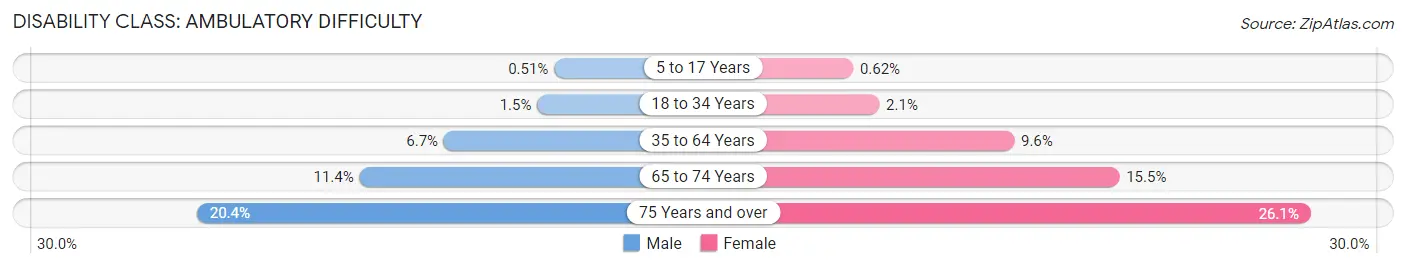
| Age Bracket | Male | Female |
| 5 to 17 Years | 28 (0.5%) | 32 (0.6%) |
| 18 to 34 Years | 116 (1.5%) | 129 (2.1%) |
| 35 to 64 Years | 878 (6.7%) | 1,134 (9.6%) |
| 65 to 74 Years | 348 (11.4%) | 512 (15.4%) |
| 75 Years and over | 311 (20.4%) | 545 (26.1%) |
Disability Class: Self-Care Difficulty
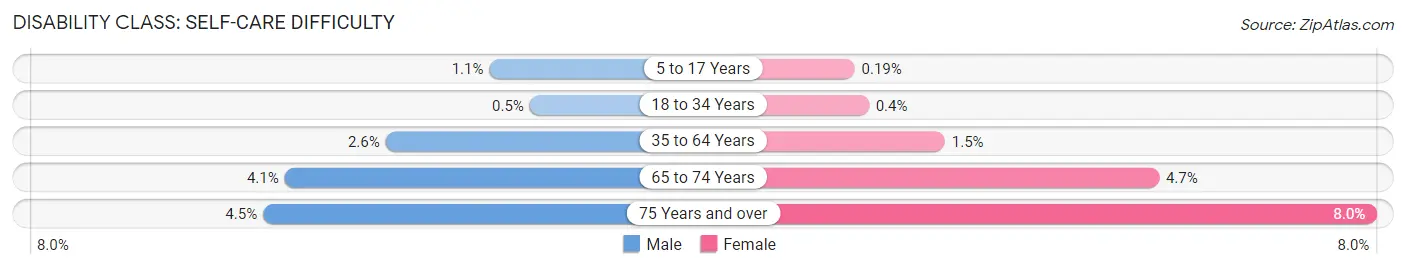
| Age Bracket | Male | Female |
| 5 to 17 Years | 60 (1.1%) | 10 (0.2%) |
| 18 to 34 Years | 40 (0.5%) | 25 (0.4%) |
| 35 to 64 Years | 349 (2.6%) | 181 (1.5%) |
| 65 to 74 Years | 127 (4.1%) | 156 (4.7%) |
| 75 Years and over | 68 (4.5%) | 166 (8.0%) |
Technology Access in Ionia County
Computing Device Access in Ionia County
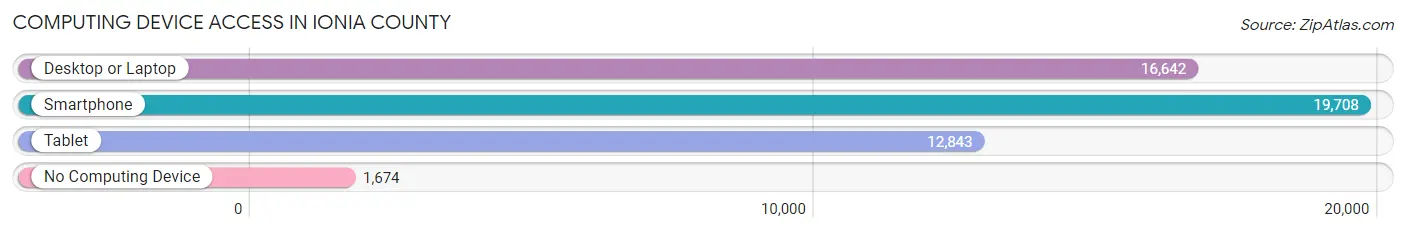
| Device Type | # Households | % Households |
| Desktop or Laptop | 16,642 | 73.1% |
| Smartphone | 19,708 | 86.6% |
| Tablet | 12,843 | 56.4% |
| No Computing Device | 1,674 | 7.3% |
| Total | 22,765 | 100.0% |
Internet Access in Ionia County
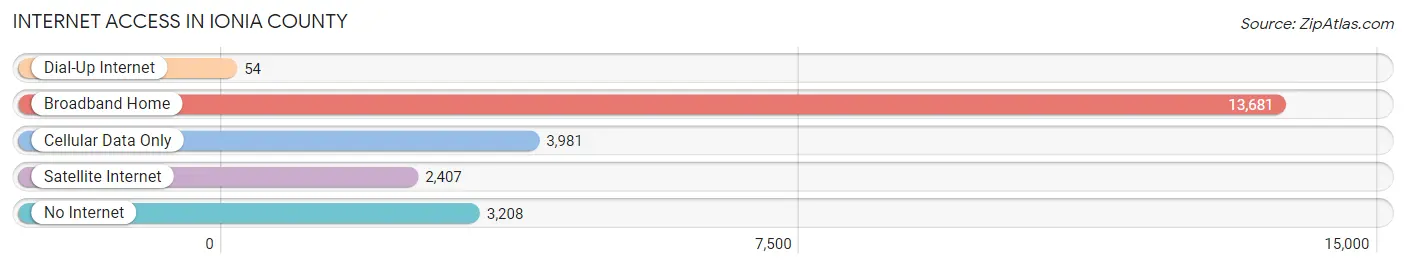
| Internet Type | # Households | % Households |
| Dial-Up Internet | 54 | 0.2% |
| Broadband Home | 13,681 | 60.1% |
| Cellular Data Only | 3,981 | 17.5% |
| Satellite Internet | 2,407 | 10.6% |
| No Internet | 3,208 | 14.1% |
| Total | 22,765 | 100.0% |
Ionia County Summary
Ionia County is located in the central part of the Lower Peninsula of Michigan. It is bordered by Montcalm County to the north, Clinton County to the east, Eaton County to the south, and Kent County to the west. The county seat is Ionia. The county was established in 1831 and named after the ancient Greek region of Ionia.
Geography
Ionia County covers an area of 576 square miles and is located in the Grand River Valley. The terrain is mostly flat with some rolling hills. The highest point in the county is located in the northwest corner at an elevation of 1,068 feet. The Grand River flows through the county and is the main source of water for the area. Other major waterways include the Flat River, Looking Glass River, and Maple River.
The county is home to several state parks and recreation areas, including Ionia State Recreation Area, Portland State Game Area, and Grand River State Game Area. The county also contains several small lakes, including Lake Odessa, Lake Montcalm, and Lake Ionia.
Demographics
As of the 2010 census, Ionia County had a population of 63,905. The racial makeup of the county was 94.2% White, 2.3% African American, 0.5% Native American, 0.7% Asian, 0.1% Pacific Islander, 0.9% from other races, and 1.3% from two or more races. Hispanic or Latino of any race were 2.7% of the population.
The median household income in the county was $45,945 and the median family income was $54,945. The per capita income was $21,945. About 11.2% of families and 14.3% of the population were below the poverty line, including 19.2% of those under age 18 and 8.2% of those age 65 or over.
Economy
Ionia County is home to several industries, including manufacturing, agriculture, and tourism. The county is home to several large manufacturing companies, including Amway, Spartan Motors, and Ionia Manufacturing. Agriculture is also an important part of the economy, with the county producing corn, soybeans, wheat, and other crops.
Tourism is also an important part of the economy, with the county being home to several popular attractions, including the Ionia Free Fair, the Ionia County Historical Museum, and the Ionia County Courthouse.
Conclusion
Ionia County is a rural county located in the central part of the Lower Peninsula of Michigan. It is home to several industries, including manufacturing, agriculture, and tourism. The county has a population of 63,905 and a median household income of $45,945. Ionia County is home to several state parks and recreation areas, as well as several popular attractions.
Common Questions
What is the Total Population of Ionia County?
Total Population of Ionia County is 66,663.
What is the Total Male Population of Ionia County?
Total Male Population of Ionia County is 36,307.
What is the Total Female Population of Ionia County?
Total Female Population of Ionia County is 30,356.
What is the Ratio of Males per 100 Females in Ionia County?
There are 119.60 Males per 100 Females in Ionia County.
What is the Ratio of Females per 100 Males in Ionia County?
There are 83.61 Females per 100 Males in Ionia County.
What is the Median Population Age in Ionia County?
Median Population Age in Ionia County is 39.1 Years.
What is the Average Family Size in Ionia County
Average Family Size in Ionia County is 3.3 People.
What is the Average Household Size in Ionia County
Average Household Size in Ionia County is 2.8 People.
What is Per Capita Income in Ionia County?
Per Capita income in Ionia County is $29,736.
What is the Median Family Income in Ionia County?
Median Family Income in Ionia County is $80,516.
What is the Median Household income in Ionia County?
Median Household Income in Ionia County is $71,720.
What is Income or Wage Gap in Ionia County?
Income or Wage Gap in Ionia County is 27.7%.
Women in Ionia County earn 72.3 cents for every dollar earned by a man.
What is Family Income Deficit in Ionia County?
Family Income Deficit in Ionia County is $12,848.
Families that are below poverty line in Ionia County earn $12,848 less on average than the poverty threshold level.
What is Inequality or Gini Index in Ionia County?
Inequality or Gini Index in Ionia County is 0.38.
How Large is the Labor Force in Ionia County?
There are 32,266 People in the Labor Forcein in Ionia County.
What is the Percentage of People in the Labor Force in Ionia County?
59.5% of People are in the Labor Force in Ionia County.
What is the Unemployment Rate in Ionia County?
Unemployment Rate in Ionia County is 5.3%.