Ingham County, MI
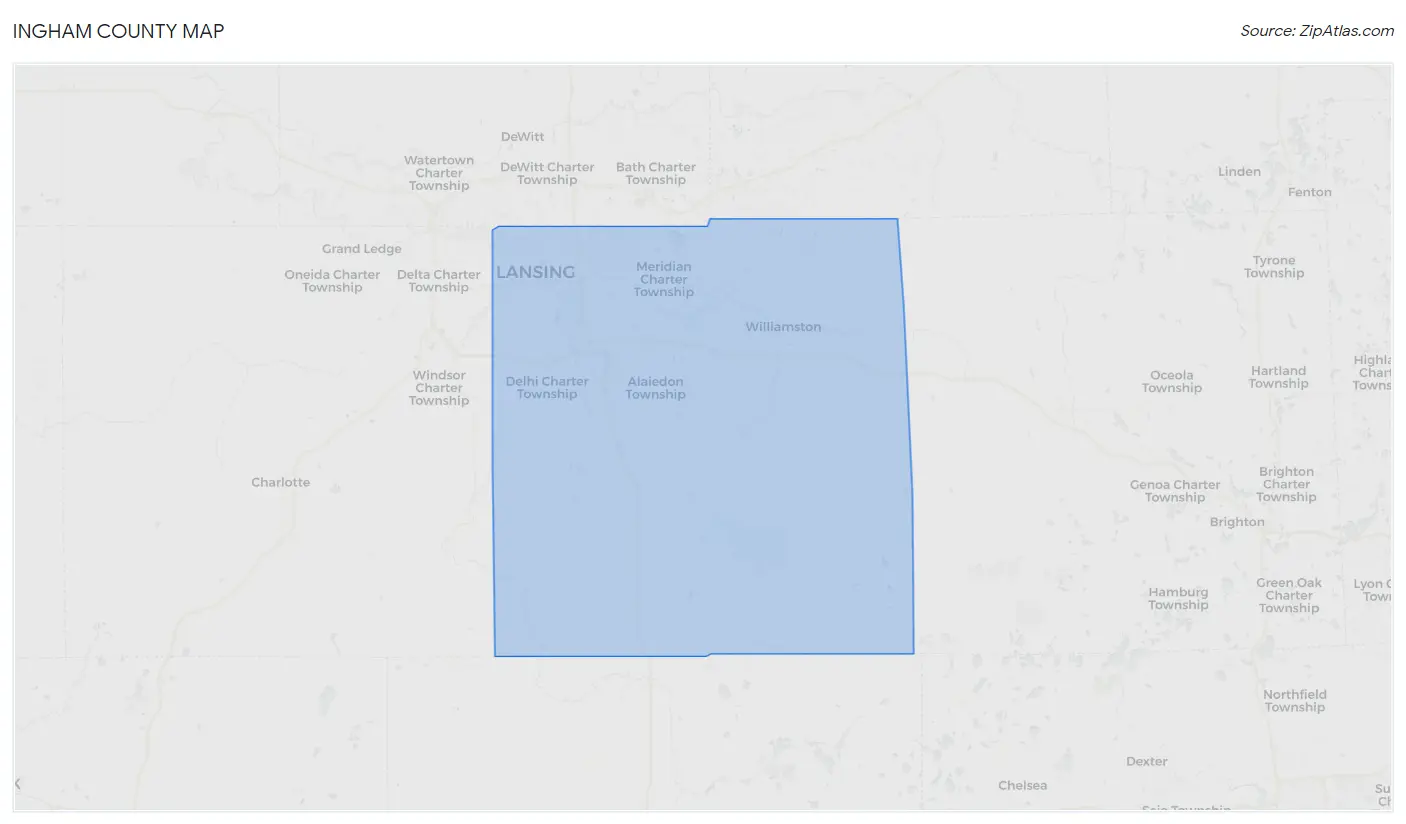
Ingham County Map
Ingham County Overview
282,540
TOTAL POPULATION
138,535
MALE POPULATION
144,005
FEMALE POPULATION
96.20
MALES / 100 FEMALES
103.95
FEMALES / 100 MALES
33.0
MEDIAN AGE
3.0
AVG FAMILY SIZE
2.3
AVG HOUSEHOLD SIZE
$36,077
PER CAPITA INCOME
$88,320
AVG FAMILY INCOME
$62,548
AVG HOUSEHOLD INCOME
30.3%
WAGE / INCOME GAP [ % ]
69.7¢/ $1
WAGE / INCOME GAP [ $ ]
$9,980
FAMILY INCOME DEFICIT
0.48
INEQUALITY / GINI INDEX
150,953
LABOR FORCE [ PEOPLE ]
64.6%
PERCENT IN LABOR FORCE
6.4%
UNEMPLOYMENT RATE
Ingham County Area Codes
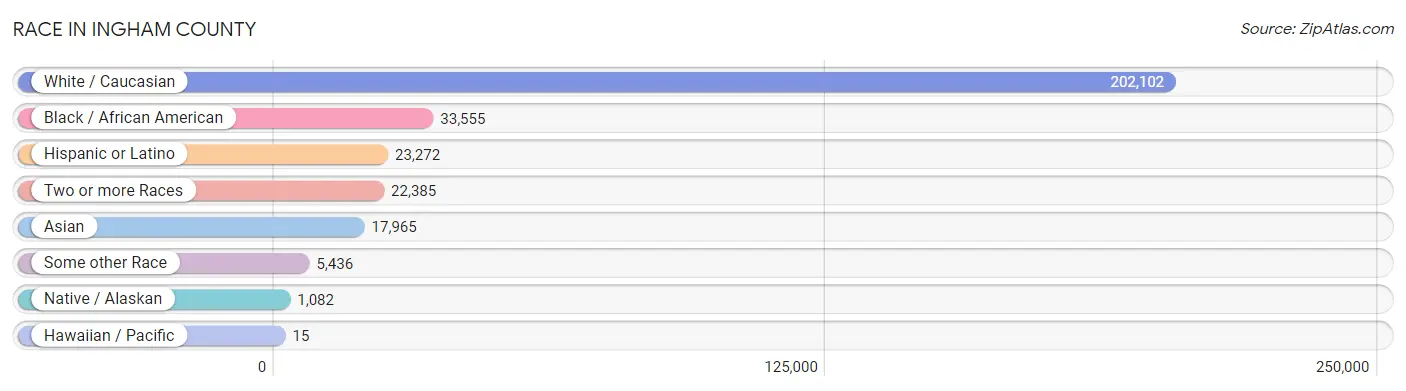
Race in Ingham County
The most populous races in Ingham County are White / Caucasian (202,102 | 71.5%), Black / African American (33,555 | 11.9%), and Hispanic or Latino (23,272 | 8.2%).
| Race | # Population | % Population |
| Asian | 17,965 | 6.4% |
| Black / African American | 33,555 | 11.9% |
| Hawaiian / Pacific | 15 | 0.0% |
| Hispanic or Latino | 23,272 | 8.2% |
| Native / Alaskan | 1,082 | 0.4% |
| White / Caucasian | 202,102 | 71.5% |
| Two or more Races | 22,385 | 7.9% |
| Some other Race | 5,436 | 1.9% |
| Total | 282,540 | 100.0% |
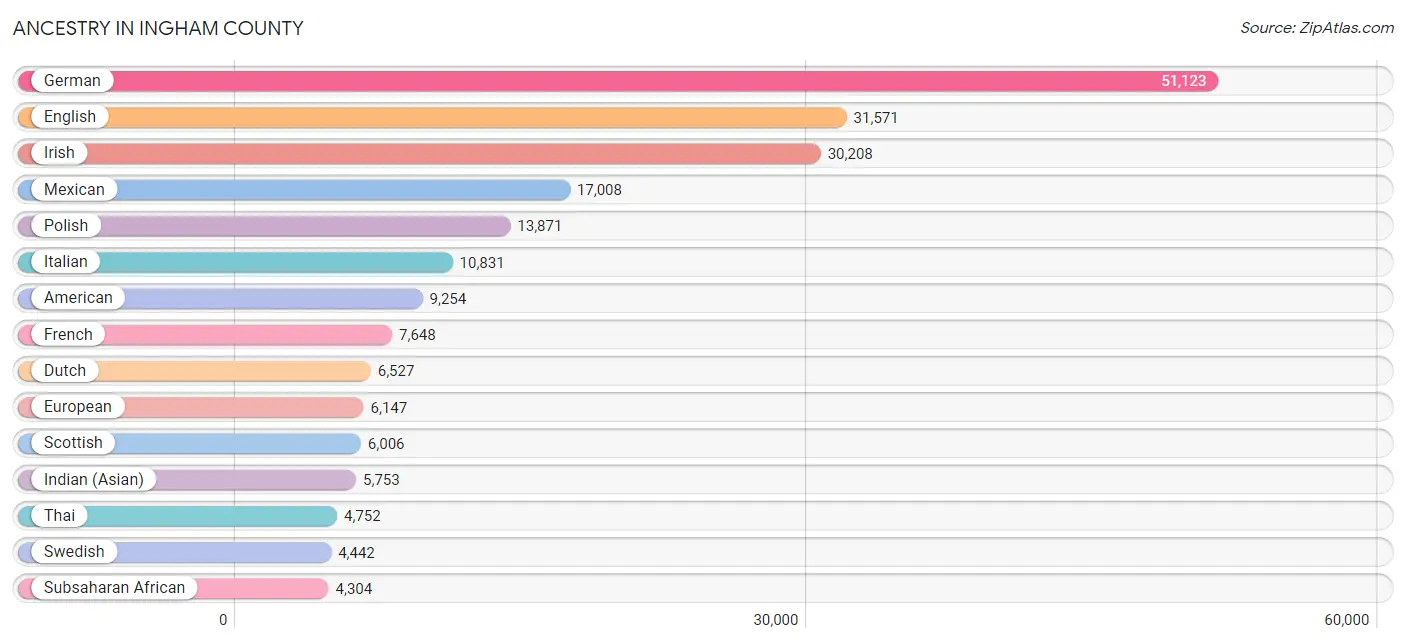
Ancestry in Ingham County
The most populous ancestries reported in Ingham County are German (51,123 | 18.1%), English (31,571 | 11.2%), Irish (30,208 | 10.7%), Mexican (17,008 | 6.0%), and Polish (13,871 | 4.9%), together accounting for 50.9% of all Ingham County residents.
| Ancestry | # Population | % Population |
| Afghan | 263 | 0.1% |
| African | 1,625 | 0.6% |
| Alaska Native | 11 | 0.0% |
| Albanian | 324 | 0.1% |
| Alsatian | 13 | 0.0% |
| American | 9,254 | 3.3% |
| Apache | 149 | 0.1% |
| Arab | 3,431 | 1.2% |
| Arapaho | 13 | 0.0% |
| Argentinean | 153 | 0.1% |
| Armenian | 203 | 0.1% |
| Assyrian / Chaldean / Syriac | 106 | 0.0% |
| Australian | 66 | 0.0% |
| Austrian | 502 | 0.2% |
| Bahamian | 7 | 0.0% |
| Bangladeshi | 316 | 0.1% |
| Belgian | 851 | 0.3% |
| Belizean | 7 | 0.0% |
| Bhutanese | 939 | 0.3% |
| Blackfeet | 192 | 0.1% |
| Bolivian | 7 | 0.0% |
| Brazilian | 395 | 0.1% |
| British | 1,945 | 0.7% |
| British West Indian | 25 | 0.0% |
| Bulgarian | 136 | 0.1% |
| Burmese | 2,250 | 0.8% |
| Cambodian | 5 | 0.0% |
| Canadian | 1,059 | 0.4% |
| Celtic | 21 | 0.0% |
| Central American | 570 | 0.2% |
| Central American Indian | 41 | 0.0% |
| Cherokee | 574 | 0.2% |
| Chickasaw | 16 | 0.0% |
| Chilean | 93 | 0.0% |
| Chippewa | 698 | 0.3% |
| Choctaw | 85 | 0.0% |
| Colombian | 149 | 0.1% |
| Costa Rican | 86 | 0.0% |
| Cree | 11 | 0.0% |
| Creek | 11 | 0.0% |
| Croatian | 590 | 0.2% |
| Crow | 1 | 0.0% |
| Cuban | 1,791 | 0.6% |
| Cypriot | 15 | 0.0% |
| Czech | 1,262 | 0.4% |
| Czechoslovakian | 222 | 0.1% |
| Danish | 1,039 | 0.4% |
| Dominican | 110 | 0.0% |
| Dutch | 6,527 | 2.3% |
| Eastern European | 788 | 0.3% |
| Ecuadorian | 114 | 0.0% |
| Egyptian | 384 | 0.1% |
| English | 31,571 | 11.2% |
| Ethiopian | 307 | 0.1% |
| European | 6,147 | 2.2% |
| Filipino | 278 | 0.1% |
| Finnish | 1,276 | 0.4% |
| French | 7,648 | 2.7% |
| French American Indian | 73 | 0.0% |
| French Canadian | 3,253 | 1.1% |
| German | 51,123 | 18.1% |
| Ghanaian | 86 | 0.0% |
| Greek | 1,348 | 0.5% |
| Guamanian / Chamorro | 17 | 0.0% |
| Guatemalan | 167 | 0.1% |
| Haitian | 278 | 0.1% |
| Honduran | 110 | 0.0% |
| Hopi | 8 | 0.0% |
| Houma | 12 | 0.0% |
| Hungarian | 1,438 | 0.5% |
| Icelander | 19 | 0.0% |
| Indian (Asian) | 5,753 | 2.0% |
| Indonesian | 727 | 0.3% |
| Iranian | 554 | 0.2% |
| Iraqi | 484 | 0.2% |
| Irish | 30,208 | 10.7% |
| Iroquois | 140 | 0.1% |
| Israeli | 9 | 0.0% |
| Italian | 10,831 | 3.8% |
| Jamaican | 581 | 0.2% |
| Japanese | 8 | 0.0% |
| Jordanian | 123 | 0.0% |
| Kenyan | 53 | 0.0% |
| Korean | 1,615 | 0.6% |
| Laotian | 120 | 0.0% |
| Latvian | 79 | 0.0% |
| Lebanese | 1,148 | 0.4% |
| Liberian | 37 | 0.0% |
| Lithuanian | 712 | 0.3% |
| Luxembourger | 20 | 0.0% |
| Macedonian | 42 | 0.0% |
| Malaysian | 171 | 0.1% |
| Maltese | 105 | 0.0% |
| Mexican | 17,008 | 6.0% |
| Mexican American Indian | 134 | 0.1% |
| Mongolian | 7 | 0.0% |
| Moroccan | 204 | 0.1% |
| Native Hawaiian | 208 | 0.1% |
| Navajo | 65 | 0.0% |
| Nicaraguan | 4 | 0.0% |
| Nigerian | 470 | 0.2% |
| Northern European | 458 | 0.2% |
| Norwegian | 1,859 | 0.7% |
| Ottawa | 287 | 0.1% |
| Pakistani | 434 | 0.2% |
| Palestinian | 297 | 0.1% |
| Panamanian | 113 | 0.0% |
| Pennsylvania German | 153 | 0.1% |
| Peruvian | 138 | 0.1% |
| Polish | 13,871 | 4.9% |
| Portuguese | 237 | 0.1% |
| Potawatomi | 185 | 0.1% |
| Puerto Rican | 1,457 | 0.5% |
| Romanian | 543 | 0.2% |
| Russian | 1,377 | 0.5% |
| Salvadoran | 90 | 0.0% |
| Samoan | 109 | 0.0% |
| Scandinavian | 791 | 0.3% |
| Scotch-Irish | 1,677 | 0.6% |
| Scottish | 6,006 | 2.1% |
| Seminole | 6 | 0.0% |
| Serbian | 234 | 0.1% |
| Sioux | 142 | 0.1% |
| Slavic | 184 | 0.1% |
| Slovak | 470 | 0.2% |
| Slovene | 34 | 0.0% |
| Somali | 464 | 0.2% |
| South African | 4 | 0.0% |
| South American | 808 | 0.3% |
| South American Indian | 38 | 0.0% |
| Soviet Union | 16 | 0.0% |
| Spaniard | 343 | 0.1% |
| Spanish | 206 | 0.1% |
| Spanish American | 116 | 0.0% |
| Sri Lankan | 1,804 | 0.6% |
| Subsaharan African | 4,304 | 1.5% |
| Sudanese | 615 | 0.2% |
| Swedish | 4,442 | 1.6% |
| Swiss | 873 | 0.3% |
| Syrian | 310 | 0.1% |
| Thai | 4,752 | 1.7% |
| Trinidadian and Tobagonian | 85 | 0.0% |
| Turkish | 601 | 0.2% |
| Ukrainian | 818 | 0.3% |
| Uruguayan | 13 | 0.0% |
| Venezuelan | 113 | 0.0% |
| Vietnamese | 22 | 0.0% |
| Welsh | 1,866 | 0.7% |
| West Indian | 69 | 0.0% |
| Yugoslavian | 144 | 0.1% |
| Yup'ik | 7 | 0.0% |
| Zimbabwean | 31 | 0.0% | View All 152 Rows |
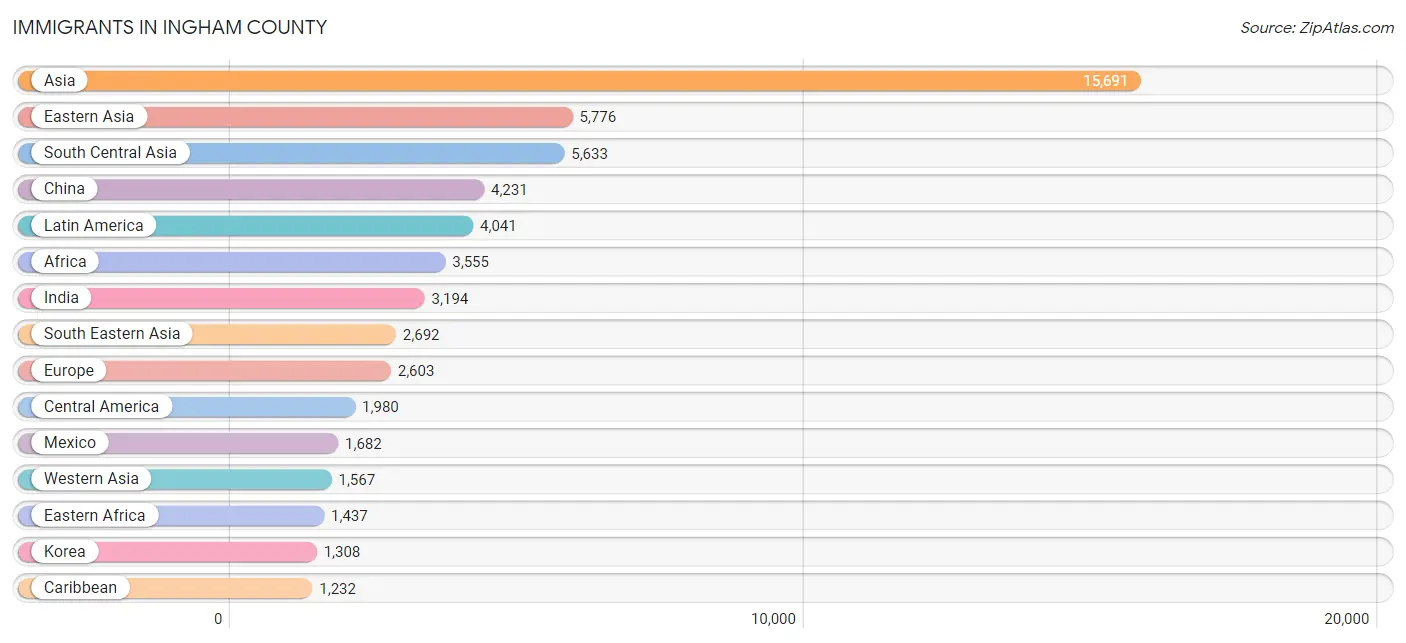
Immigrants in Ingham County
The most numerous immigrant groups reported in Ingham County came from Asia (15,691 | 5.6%), Eastern Asia (5,776 | 2.0%), South Central Asia (5,633 | 2.0%), China (4,231 | 1.5%), and Latin America (4,041 | 1.4%), together accounting for 12.5% of all Ingham County residents.
| Immigration Origin | # Population | % Population |
| Afghanistan | 169 | 0.1% |
| Africa | 3,555 | 1.3% |
| Albania | 134 | 0.1% |
| Argentina | 74 | 0.0% |
| Armenia | 9 | 0.0% |
| Asia | 15,691 | 5.6% |
| Australia | 26 | 0.0% |
| Bangladesh | 125 | 0.0% |
| Belarus | 12 | 0.0% |
| Belgium | 12 | 0.0% |
| Belize | 2 | 0.0% |
| Bolivia | 7 | 0.0% |
| Bosnia and Herzegovina | 104 | 0.0% |
| Brazil | 460 | 0.2% |
| Bulgaria | 92 | 0.0% |
| Cambodia | 12 | 0.0% |
| Cameroon | 9 | 0.0% |
| Canada | 760 | 0.3% |
| Caribbean | 1,232 | 0.4% |
| Central America | 1,980 | 0.7% |
| Chile | 34 | 0.0% |
| China | 4,231 | 1.5% |
| Colombia | 89 | 0.0% |
| Congo | 76 | 0.0% |
| Costa Rica | 51 | 0.0% |
| Cuba | 897 | 0.3% |
| Czechoslovakia | 43 | 0.0% |
| Denmark | 32 | 0.0% |
| Dominican Republic | 9 | 0.0% |
| Eastern Africa | 1,437 | 0.5% |
| Eastern Asia | 5,776 | 2.0% |
| Eastern Europe | 1,185 | 0.4% |
| Ecuador | 49 | 0.0% |
| Egypt | 293 | 0.1% |
| El Salvador | 39 | 0.0% |
| England | 177 | 0.1% |
| Ethiopia | 154 | 0.1% |
| Europe | 2,603 | 0.9% |
| France | 176 | 0.1% |
| Germany | 463 | 0.2% |
| Ghana | 279 | 0.1% |
| Greece | 44 | 0.0% |
| Guatemala | 140 | 0.1% |
| Haiti | 111 | 0.0% |
| Honduras | 62 | 0.0% |
| Hong Kong | 88 | 0.0% |
| Hungary | 26 | 0.0% |
| India | 3,194 | 1.1% |
| Indonesia | 54 | 0.0% |
| Iran | 444 | 0.2% |
| Iraq | 461 | 0.2% |
| Ireland | 27 | 0.0% |
| Israel | 105 | 0.0% |
| Italy | 104 | 0.0% |
| Jamaica | 130 | 0.1% |
| Japan | 223 | 0.1% |
| Jordan | 72 | 0.0% |
| Kazakhstan | 30 | 0.0% |
| Kenya | 59 | 0.0% |
| Korea | 1,308 | 0.5% |
| Kuwait | 19 | 0.0% |
| Laos | 96 | 0.0% |
| Latin America | 4,041 | 1.4% |
| Latvia | 25 | 0.0% |
| Lebanon | 239 | 0.1% |
| Liberia | 69 | 0.0% |
| Lithuania | 17 | 0.0% |
| Mexico | 1,682 | 0.6% |
| Micronesia | 7 | 0.0% |
| Middle Africa | 268 | 0.1% |
| Moldova | 18 | 0.0% |
| Morocco | 80 | 0.0% |
| Nepal | 647 | 0.2% |
| Netherlands | 54 | 0.0% |
| Nicaragua | 4 | 0.0% |
| Nigeria | 175 | 0.1% |
| Northern Africa | 1,046 | 0.4% |
| Northern Europe | 485 | 0.2% |
| Norway | 18 | 0.0% |
| Oceania | 33 | 0.0% |
| Pakistan | 411 | 0.2% |
| Peru | 21 | 0.0% |
| Philippines | 611 | 0.2% |
| Poland | 124 | 0.0% |
| Portugal | 21 | 0.0% |
| Romania | 214 | 0.1% |
| Russia | 219 | 0.1% |
| Saudi Arabia | 93 | 0.0% |
| Scotland | 19 | 0.0% |
| Senegal | 39 | 0.0% |
| Singapore | 14 | 0.0% |
| Somalia | 524 | 0.2% |
| South Africa | 19 | 0.0% |
| South America | 829 | 0.3% |
| South Central Asia | 5,633 | 2.0% |
| South Eastern Asia | 2,692 | 0.9% |
| Southern Europe | 215 | 0.1% |
| Spain | 39 | 0.0% |
| Sri Lanka | 142 | 0.1% |
| Sudan | 666 | 0.2% |
| Sweden | 8 | 0.0% |
| Switzerland | 13 | 0.0% |
| Syria | 21 | 0.0% |
| Taiwan | 346 | 0.1% |
| Thailand | 307 | 0.1% |
| Trinidad and Tobago | 85 | 0.0% |
| Turkey | 247 | 0.1% |
| Ukraine | 117 | 0.0% |
| Uruguay | 13 | 0.0% |
| Uzbekistan | 214 | 0.1% |
| Venezuela | 82 | 0.0% |
| Vietnam | 1,059 | 0.4% |
| Western Africa | 623 | 0.2% |
| Western Asia | 1,567 | 0.5% |
| Western Europe | 718 | 0.3% |
| Zaire | 16 | 0.0% |
| Zimbabwe | 38 | 0.0% | View All 117 Rows |
Sex and Age in Ingham County
Sex and Age in Ingham County
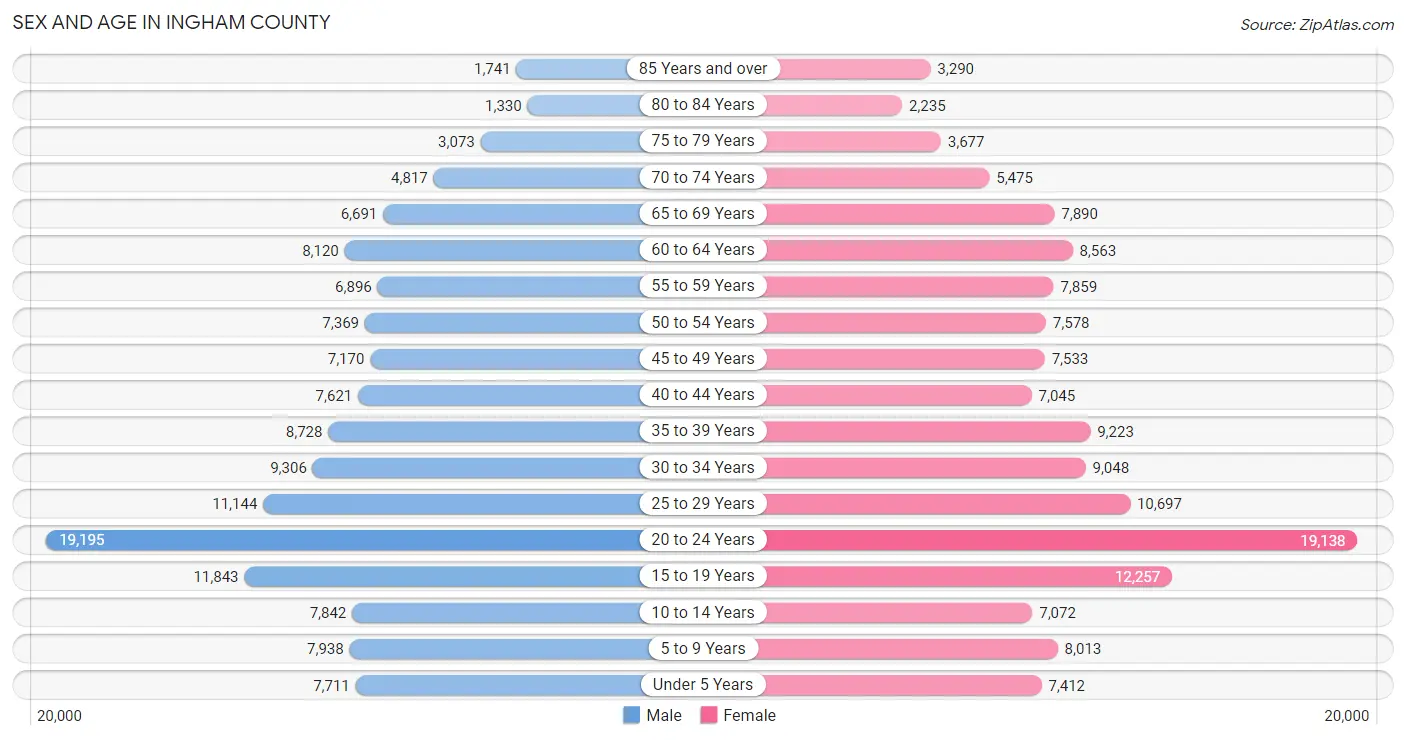
The most populous age groups in Ingham County are 20 to 24 Years (19,195 | 13.9%) for men and 20 to 24 Years (19,138 | 13.3%) for women.
| Age Bracket | Male | Female |
| Under 5 Years | 7,711 (5.6%) | 7,412 (5.1%) |
| 5 to 9 Years | 7,938 (5.7%) | 8,013 (5.6%) |
| 10 to 14 Years | 7,842 (5.7%) | 7,072 (4.9%) |
| 15 to 19 Years | 11,843 (8.6%) | 12,257 (8.5%) |
| 20 to 24 Years | 19,195 (13.9%) | 19,138 (13.3%) |
| 25 to 29 Years | 11,144 (8.0%) | 10,697 (7.4%) |
| 30 to 34 Years | 9,306 (6.7%) | 9,048 (6.3%) |
| 35 to 39 Years | 8,728 (6.3%) | 9,223 (6.4%) |
| 40 to 44 Years | 7,621 (5.5%) | 7,045 (4.9%) |
| 45 to 49 Years | 7,170 (5.2%) | 7,533 (5.2%) |
| 50 to 54 Years | 7,369 (5.3%) | 7,578 (5.3%) |
| 55 to 59 Years | 6,896 (5.0%) | 7,859 (5.5%) |
| 60 to 64 Years | 8,120 (5.9%) | 8,563 (5.9%) |
| 65 to 69 Years | 6,691 (4.8%) | 7,890 (5.5%) |
| 70 to 74 Years | 4,817 (3.5%) | 5,475 (3.8%) |
| 75 to 79 Years | 3,073 (2.2%) | 3,677 (2.5%) |
| 80 to 84 Years | 1,330 (1.0%) | 2,235 (1.5%) |
| 85 Years and over | 1,741 (1.3%) | 3,290 (2.3%) |
| Total | 138,535 (100.0%) | 144,005 (100.0%) |
Families and Households in Ingham County
Median Family Size in Ingham County
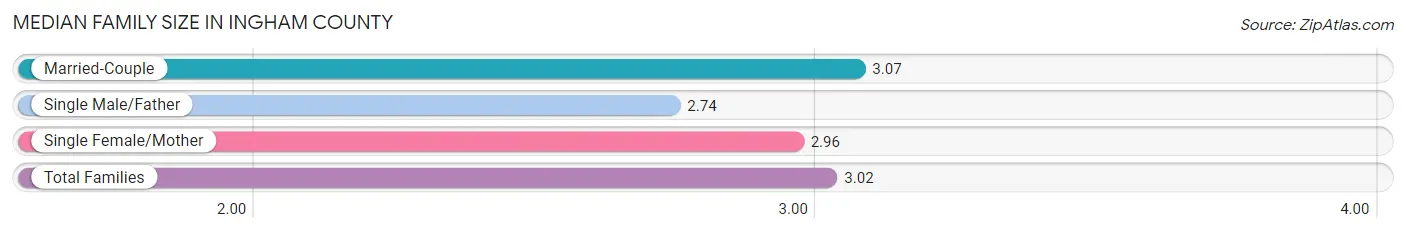
The median family size in Ingham County is 3.02 persons per family, with married-couple families (44,062 | 72.1%) accounting for the largest median family size of 3.07 persons per family. On the other hand, single male/father families (4,762 | 7.8%) represent the smallest median family size with 2.74 persons per family.
| Family Type | # Families | Family Size |
| Married-Couple | 44,062 (72.1%) | 3.07 |
| Single Male/Father | 4,762 (7.8%) | 2.74 |
| Single Female/Mother | 12,292 (20.1%) | 2.96 |
| Total Families | 61,116 (100.0%) | 3.02 |
Median Household Size in Ingham County
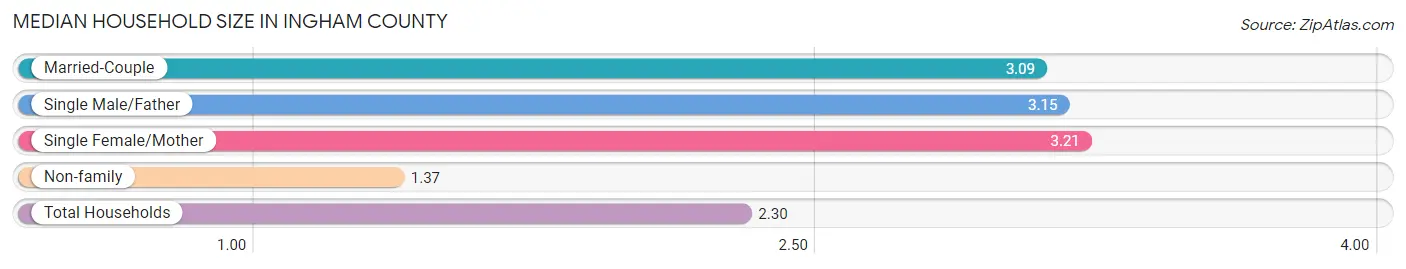
The median household size in Ingham County is 2.30 persons per household, with single female/mother households (12,292 | 10.6%) accounting for the largest median household size of 3.21 persons per household. non-family households (54,532 | 47.1%) represent the smallest median household size with 1.37 persons per household.
| Household Type | # Households | Household Size |
| Married-Couple | 44,062 (38.1%) | 3.09 |
| Single Male/Father | 4,762 (4.1%) | 3.15 |
| Single Female/Mother | 12,292 (10.6%) | 3.21 |
| Non-family | 54,532 (47.1%) | 1.37 |
| Total Households | 115,648 (100.0%) | 2.30 |
Household Size by Marriage Status in Ingham County
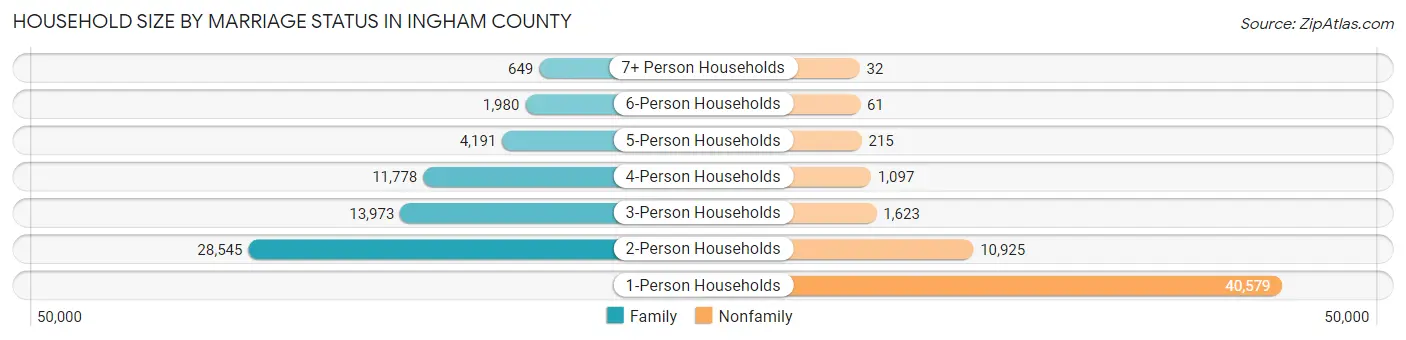
Out of a total of 115,648 households in Ingham County, 61,116 (52.8%) are family households, while 54,532 (47.1%) are nonfamily households. The most numerous type of family households are 2-person households, comprising 28,545, and the most common type of nonfamily households are 1-person households, comprising 40,579.
| Household Size | Family Households | Nonfamily Households |
| 1-Person Households | - | 40,579 (35.1%) |
| 2-Person Households | 28,545 (24.7%) | 10,925 (9.5%) |
| 3-Person Households | 13,973 (12.1%) | 1,623 (1.4%) |
| 4-Person Households | 11,778 (10.2%) | 1,097 (0.9%) |
| 5-Person Households | 4,191 (3.6%) | 215 (0.2%) |
| 6-Person Households | 1,980 (1.7%) | 61 (0.1%) |
| 7+ Person Households | 649 (0.6%) | 32 (0.0%) |
| Total | 61,116 (52.8%) | 54,532 (47.1%) |
Female Fertility in Ingham County
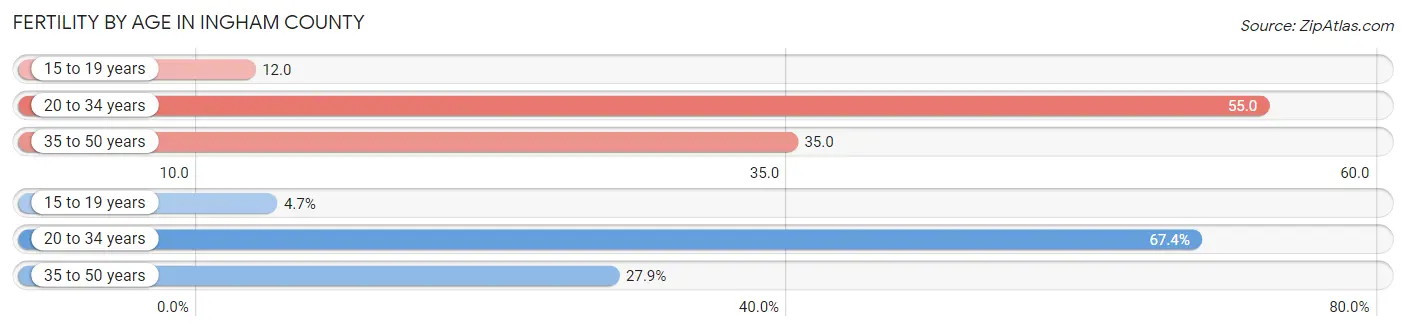
Fertility by Age in Ingham County
Average fertility rate in Ingham County is 42.0 births per 1,000 women. Women in the age bracket of 20 to 34 years have the highest fertility rate with 55.0 births per 1,000 women. Women in the age bracket of 20 to 34 years acount for 67.4% of all women with births.
| Age Bracket | Women with Births | Births / 1,000 Women |
| 15 to 19 years | 149 (4.7%) | 12.0 |
| 20 to 34 years | 2,148 (67.4%) | 55.0 |
| 35 to 50 years | 889 (27.9%) | 35.0 |
| Total | 3,186 (100.0%) | 42.0 |
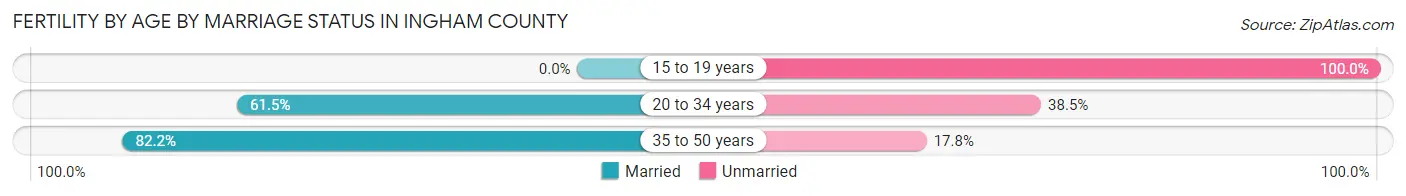
Fertility by Age by Marriage Status in Ingham County
64.4% of women with births (3,186) in Ingham County are married. The highest percentage of unmarried women with births falls into 15 to 19 years age bracket with 100.0% of them unmarried at the time of birth, while the lowest percentage of unmarried women with births belong to 35 to 50 years age bracket with 17.8% of them unmarried.
| Age Bracket | Married | Unmarried |
| 15 to 19 years | 0 (0.0%) | 149 (100.0%) |
| 20 to 34 years | 1,321 (61.5%) | 827 (38.5%) |
| 35 to 50 years | 731 (82.2%) | 158 (17.8%) |
| Total | 2,052 (64.4%) | 1,134 (35.6%) |
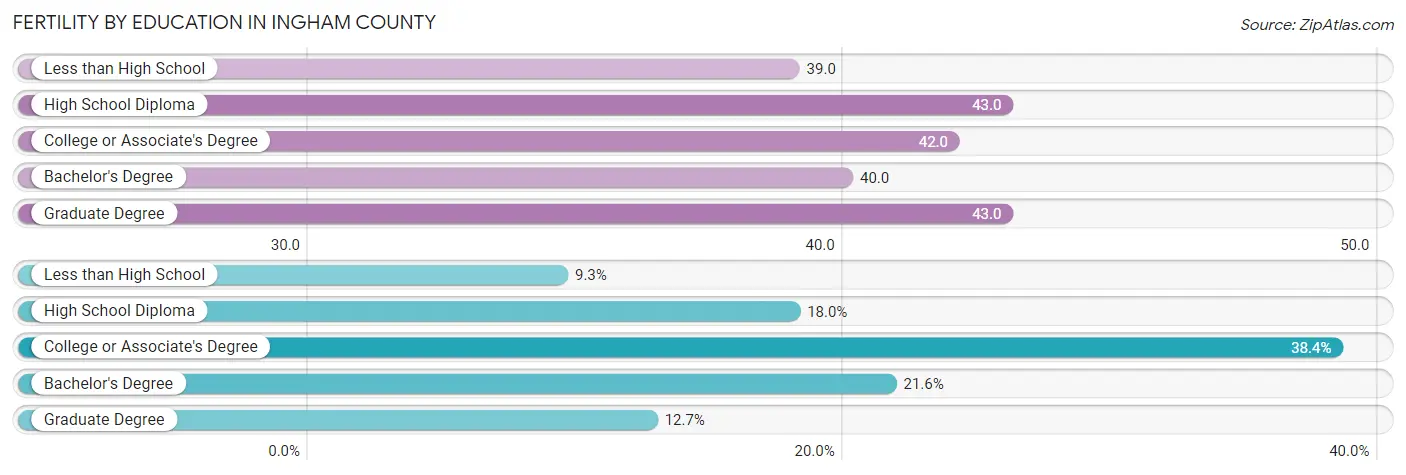
Fertility by Education in Ingham County
Average fertility rate in Ingham County is 42.0 births per 1,000 women. Women with the education attainment of high school diploma have the highest fertility rate of 43.0 births per 1,000 women, while women with the education attainment of less than high school have the lowest fertility at 39.0 births per 1,000 women. Women with the education attainment of college or associate's degree represent 38.4% of all women with births.
| Educational Attainment | Women with Births | Births / 1,000 Women |
| Less than High School | 297 (9.3%) | 39.0 |
| High School Diploma | 574 (18.0%) | 43.0 |
| College or Associate's Degree | 1,222 (38.4%) | 42.0 |
| Bachelor's Degree | 689 (21.6%) | 40.0 |
| Graduate Degree | 404 (12.7%) | 43.0 |
| Total | 3,186 (100.0%) | 42.0 |
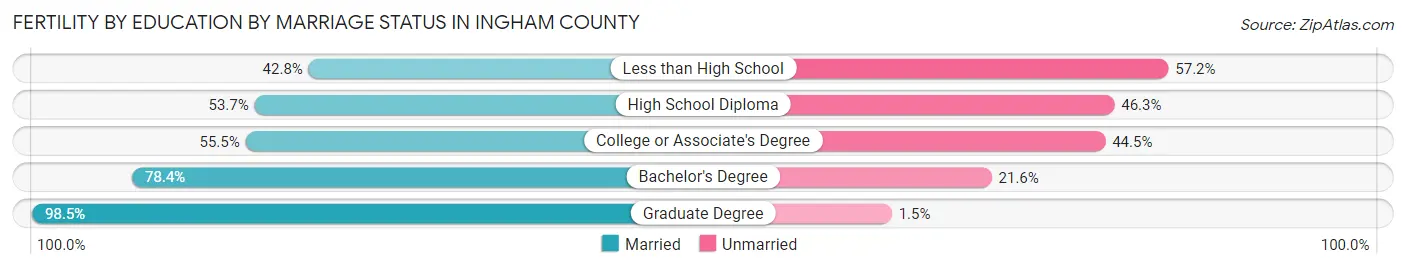
Fertility by Education by Marriage Status in Ingham County
35.6% of women with births in Ingham County are unmarried. Women with the educational attainment of graduate degree are most likely to be married with 98.5% of them married at childbirth, while women with the educational attainment of less than high school are least likely to be married with 57.2% of them unmarried at childbirth.
| Educational Attainment | Married | Unmarried |
| Less than High School | 127 (42.8%) | 170 (57.2%) |
| High School Diploma | 308 (53.7%) | 266 (46.3%) |
| College or Associate's Degree | 678 (55.5%) | 544 (44.5%) |
| Bachelor's Degree | 540 (78.4%) | 149 (21.6%) |
| Graduate Degree | 398 (98.5%) | 6 (1.5%) |
| Total | 2,052 (64.4%) | 1,134 (35.6%) |
Income in Ingham County
Income Overview in Ingham County
Per Capita Income in Ingham County is $36,077, while median incomes of families and households are $88,320 and $62,548 respectively.
| Characteristic | Number | Measure |
| Per Capita Income | 282,540 | $36,077 |
| Median Family Income | 61,116 | $88,320 |
| Mean Family Income | 61,116 | $112,947 |
| Median Household Income | 115,648 | $62,548 |
| Mean Household Income | 115,648 | $85,939 |
| Income Deficit | 61,116 | $9,980 |
| Wage / Income Gap (%) | 282,540 | 30.27% |
| Wage / Income Gap ($) | 282,540 | 69.73¢ per $1 |
| Gini / Inequality Index | 282,540 | 0.48 |
Earnings by Sex in Ingham County
Average Earnings in Ingham County are $33,199, $39,604 for men and $27,615 for women, a difference of 30.3%.
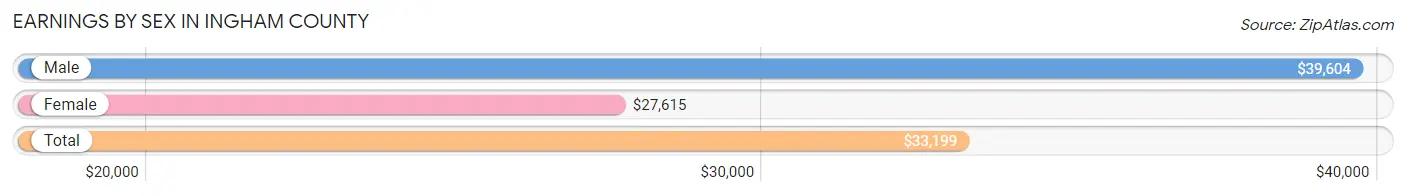
| Sex | Number | Average Earnings |
| Male | 83,269 (50.0%) | $39,604 |
| Female | 83,206 (50.0%) | $27,615 |
| Total | 166,475 (100.0%) | $33,199 |
Earnings by Sex by Income Bracket in Ingham County
The most common earnings brackets in Ingham County are $100,000+ for men (10,712 | 12.9%) and $2,499 or less for women (7,122 | 8.6%).
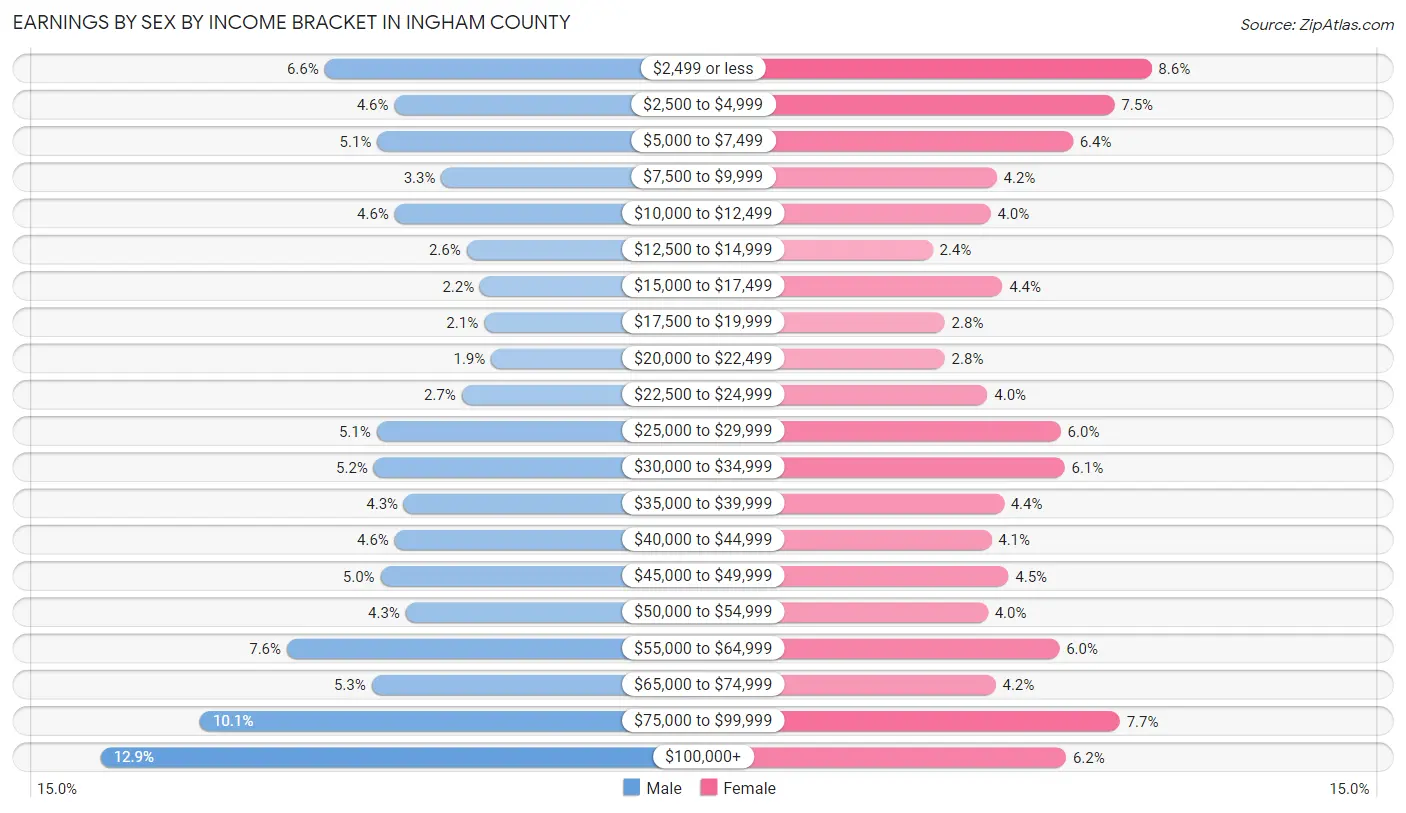
| Income | Male | Female |
| $2,499 or less | 5,472 (6.6%) | 7,122 (8.6%) |
| $2,500 to $4,999 | 3,837 (4.6%) | 6,259 (7.5%) |
| $5,000 to $7,499 | 4,239 (5.1%) | 5,281 (6.4%) |
| $7,500 to $9,999 | 2,738 (3.3%) | 3,499 (4.2%) |
| $10,000 to $12,499 | 3,834 (4.6%) | 3,358 (4.0%) |
| $12,500 to $14,999 | 2,152 (2.6%) | 2,008 (2.4%) |
| $15,000 to $17,499 | 1,830 (2.2%) | 3,635 (4.4%) |
| $17,500 to $19,999 | 1,737 (2.1%) | 2,290 (2.8%) |
| $20,000 to $22,499 | 1,576 (1.9%) | 2,291 (2.8%) |
| $22,500 to $24,999 | 2,266 (2.7%) | 3,290 (4.0%) |
| $25,000 to $29,999 | 4,255 (5.1%) | 5,001 (6.0%) |
| $30,000 to $34,999 | 4,318 (5.2%) | 5,090 (6.1%) |
| $35,000 to $39,999 | 3,618 (4.3%) | 3,669 (4.4%) |
| $40,000 to $44,999 | 3,831 (4.6%) | 3,378 (4.1%) |
| $45,000 to $49,999 | 4,164 (5.0%) | 3,779 (4.5%) |
| $50,000 to $54,999 | 3,575 (4.3%) | 3,298 (4.0%) |
| $55,000 to $64,999 | 6,354 (7.6%) | 4,967 (6.0%) |
| $65,000 to $74,999 | 4,372 (5.2%) | 3,482 (4.2%) |
| $75,000 to $99,999 | 8,389 (10.1%) | 6,385 (7.7%) |
| $100,000+ | 10,712 (12.9%) | 5,124 (6.2%) |
| Total | 83,269 (100.0%) | 83,206 (100.0%) |
Earnings by Sex by Educational Attainment in Ingham County
Average earnings in Ingham County are $52,336 for men and $40,454 for women, a difference of 22.7%. Men with an educational attainment of graduate degree enjoy the highest average annual earnings of $89,390, while those with less than high school education earn the least with $28,695. Women with an educational attainment of graduate degree earn the most with the average annual earnings of $64,584, while those with less than high school education have the smallest earnings of $20,457.
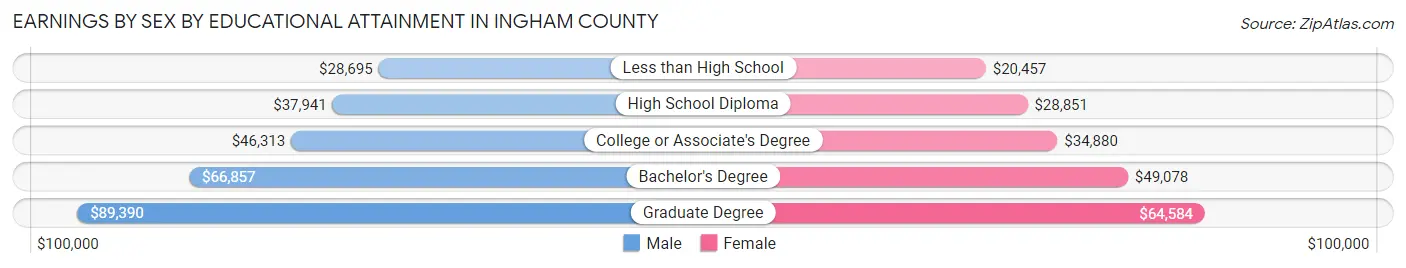
| Educational Attainment | Male Income | Female Income |
| Less than High School | $28,695 | $20,457 |
| High School Diploma | $37,941 | $28,851 |
| College or Associate's Degree | $46,313 | $34,880 |
| Bachelor's Degree | $66,857 | $49,078 |
| Graduate Degree | $89,390 | $64,584 |
| Total | $52,336 | $40,454 |
Family Income in Ingham County
Family Income Brackets in Ingham County
According to the Ingham County family income data, there are 13,507 families falling into the $100,000 to $149,999 income range, which is the most common income bracket and makes up 22.1% of all families. Conversely, the $10,000 to $14,999 income bracket is the least frequent group with only 1,100 families (1.8%) belonging to this category.
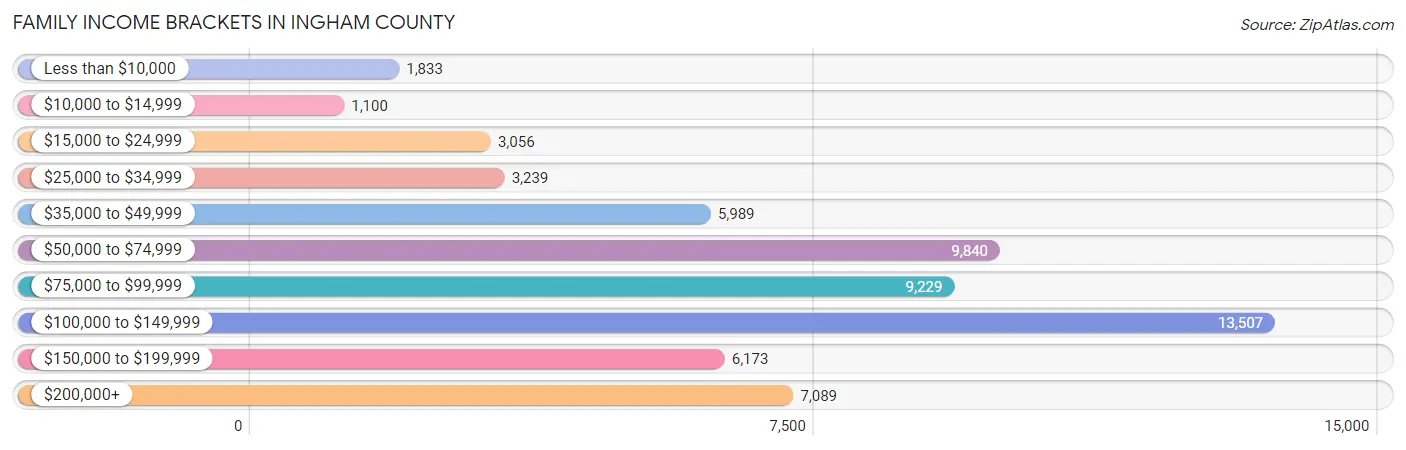
| Income Bracket | # Families | % Families |
| Less than $10,000 | 1,833 | 3.0% |
| $10,000 to $14,999 | 1,100 | 1.8% |
| $15,000 to $24,999 | 3,056 | 5.0% |
| $25,000 to $34,999 | 3,239 | 5.3% |
| $35,000 to $49,999 | 5,989 | 9.8% |
| $50,000 to $74,999 | 9,840 | 16.1% |
| $75,000 to $99,999 | 9,229 | 15.1% |
| $100,000 to $149,999 | 13,507 | 22.1% |
| $150,000 to $199,999 | 6,173 | 10.1% |
| $200,000+ | 7,089 | 11.6% |
Family Income by Famaliy Size in Ingham County
5-person families (3,693 | 6.0%) account for the highest median family income in Ingham County with $108,862 per family, while 2-person families (31,104 | 50.9%) have the highest median income of $40,688 per family member.
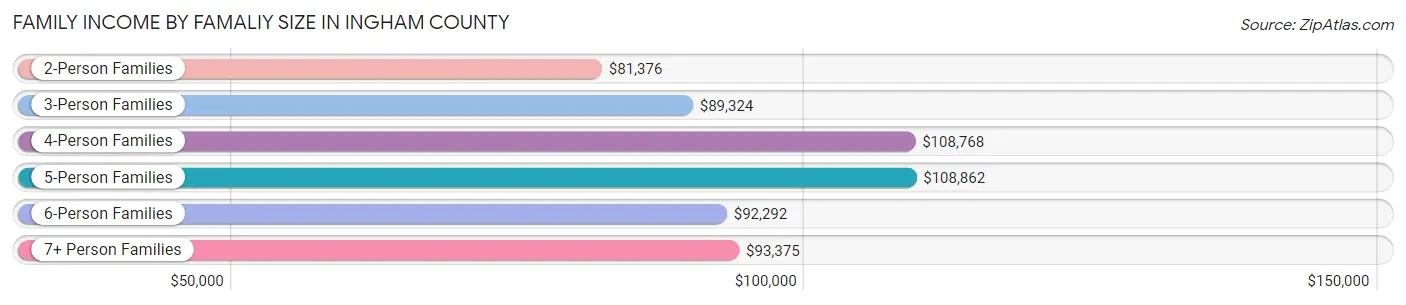
| Income Bracket | # Families | Median Income |
| 2-Person Families | 31,104 (50.9%) | $81,376 |
| 3-Person Families | 13,157 (21.5%) | $89,324 |
| 4-Person Families | 10,918 (17.9%) | $108,768 |
| 5-Person Families | 3,693 (6.0%) | $108,862 |
| 6-Person Families | 1,760 (2.9%) | $92,292 |
| 7+ Person Families | 484 (0.8%) | $93,375 |
| Total | 61,116 (100.0%) | $88,320 |
Family Income by Number of Earners in Ingham County
The median family income in Ingham County is $88,320, with families comprising 3+ earners (5,996) having the highest median family income of $132,433, while families with 1 earner (19,071) have the lowest median family income of $59,310, accounting for 9.8% and 31.2% of families, respectively.
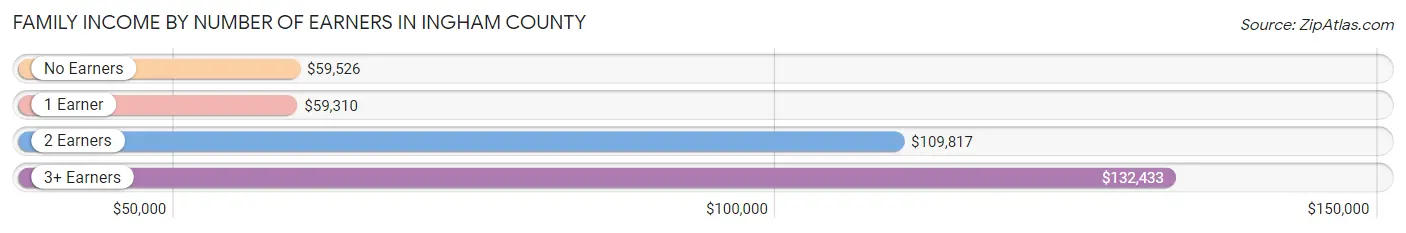
| Number of Earners | # Families | Median Income |
| No Earners | 8,624 (14.1%) | $59,526 |
| 1 Earner | 19,071 (31.2%) | $59,310 |
| 2 Earners | 27,425 (44.9%) | $109,817 |
| 3+ Earners | 5,996 (9.8%) | $132,433 |
| Total | 61,116 (100.0%) | $88,320 |
Household Income in Ingham County
Household Income Brackets in Ingham County
With 20,354 households falling in the category, the $50,000 to $74,999 income range is the most frequent in Ingham County, accounting for 17.6% of all households. In contrast, only 5,667 households (4.9%) fall into the $10,000 to $14,999 income bracket, making it the least populous group.
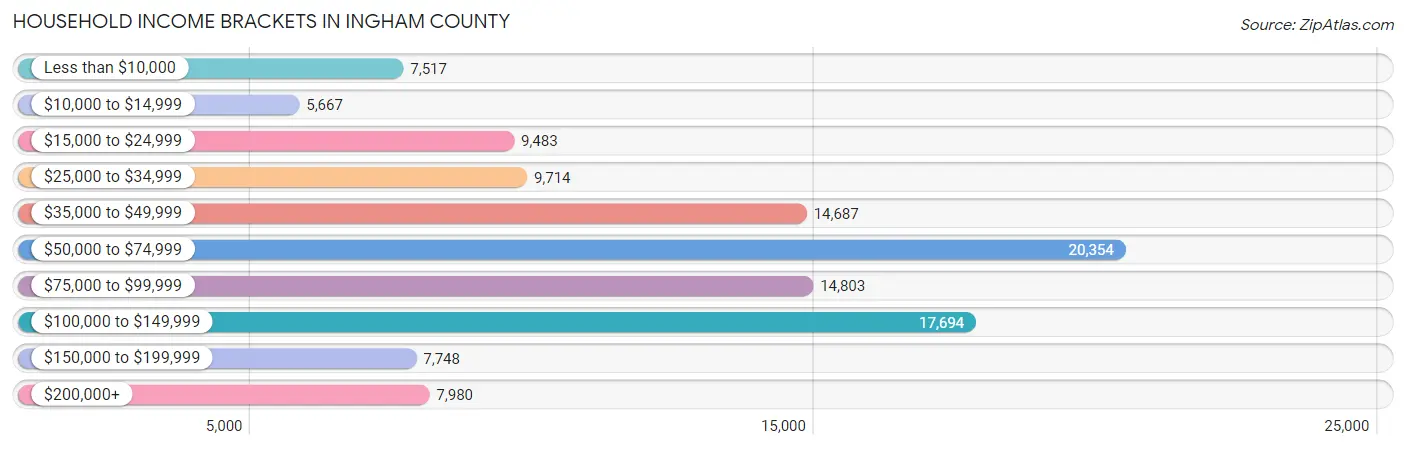
| Income Bracket | # Households | % Households |
| Less than $10,000 | 7,517 | 6.5% |
| $10,000 to $14,999 | 5,667 | 4.9% |
| $15,000 to $24,999 | 9,483 | 8.2% |
| $25,000 to $34,999 | 9,714 | 8.4% |
| $35,000 to $49,999 | 14,687 | 12.7% |
| $50,000 to $74,999 | 20,354 | 17.6% |
| $75,000 to $99,999 | 14,803 | 12.8% |
| $100,000 to $149,999 | 17,694 | 15.3% |
| $150,000 to $199,999 | 7,748 | 6.7% |
| $200,000+ | 7,980 | 6.9% |
Household Income by Householder Age in Ingham County
The median household income in Ingham County is $62,548, with the highest median household income of $80,685 found in the 45 to 64 years age bracket for the primary householder. A total of 36,335 households (31.4%) fall into this category. Meanwhile, the 15 to 24 years age bracket for the primary householder has the lowest median household income of $27,816, with 13,745 households (11.9%) in this group.
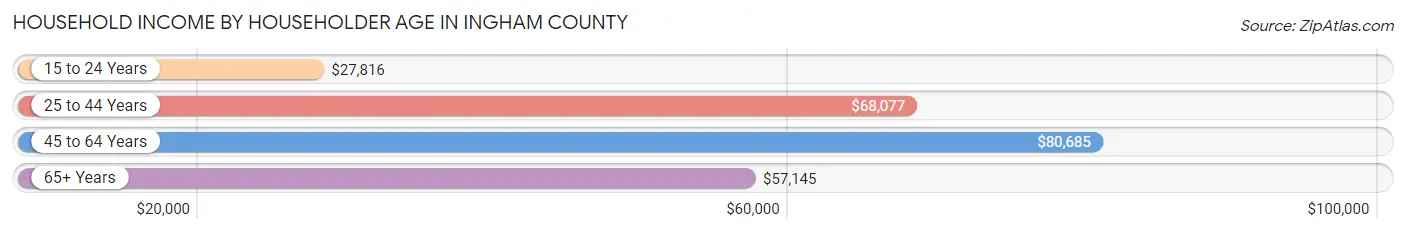
| Income Bracket | # Households | Median Income |
| 15 to 24 Years | 13,745 (11.9%) | $27,816 |
| 25 to 44 Years | 38,690 (33.5%) | $68,077 |
| 45 to 64 Years | 36,335 (31.4%) | $80,685 |
| 65+ Years | 26,878 (23.2%) | $57,145 |
| Total | 115,648 (100.0%) | $62,548 |
Poverty in Ingham County
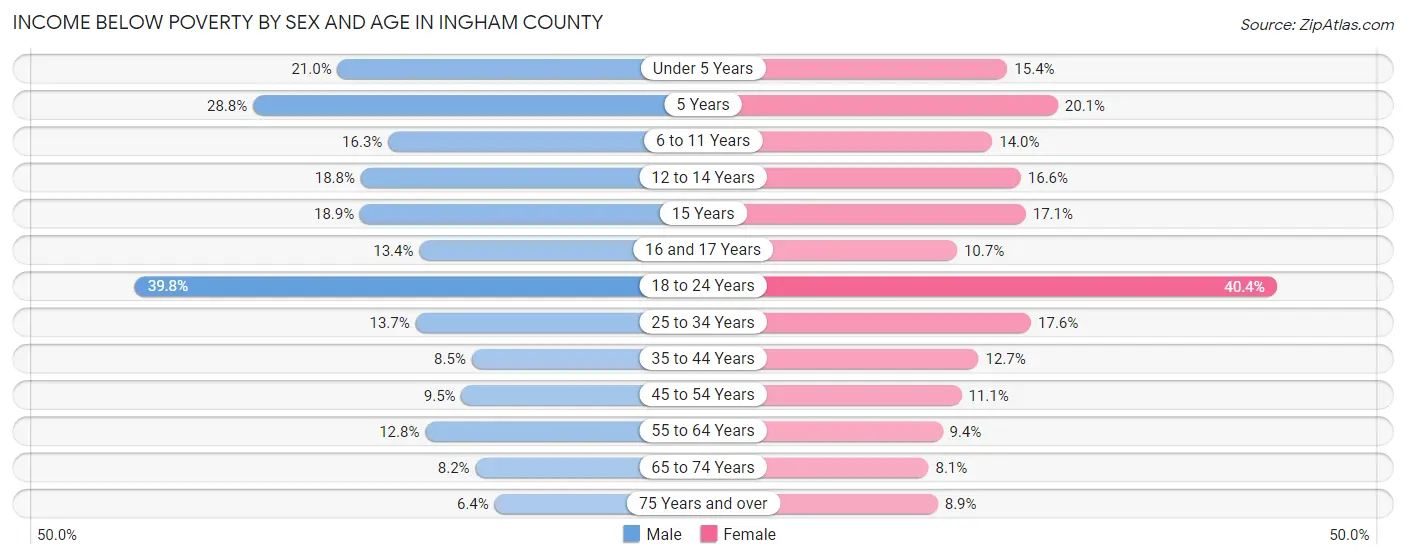
Income Below Poverty by Sex and Age in Ingham County
With 16.5% poverty level for males and 16.5% for females among the residents of Ingham County, 18 to 24 year old males and 18 to 24 year old females are the most vulnerable to poverty, with 7,691 males (39.8%) and 7,849 females (40.4%) in their respective age groups living below the poverty level.
| Age Bracket | Male | Female |
| Under 5 Years | 1,551 (21.0%) | 1,090 (15.4%) |
| 5 Years | 424 (28.8%) | 338 (20.1%) |
| 6 to 11 Years | 1,493 (16.3%) | 1,213 (14.0%) |
| 12 to 14 Years | 859 (18.8%) | 721 (16.6%) |
| 15 Years | 320 (18.9%) | 200 (17.1%) |
| 16 and 17 Years | 407 (13.4%) | 349 (10.7%) |
| 18 to 24 Years | 7,691 (39.8%) | 7,849 (40.4%) |
| 25 to 34 Years | 2,770 (13.7%) | 3,455 (17.6%) |
| 35 to 44 Years | 1,378 (8.5%) | 2,060 (12.7%) |
| 45 to 54 Years | 1,369 (9.5%) | 1,678 (11.1%) |
| 55 to 64 Years | 1,919 (12.8%) | 1,531 (9.3%) |
| 65 to 74 Years | 933 (8.2%) | 1,068 (8.1%) |
| 75 Years and over | 384 (6.4%) | 775 (8.9%) |
| Total | 21,498 (16.5%) | 22,327 (16.5%) |
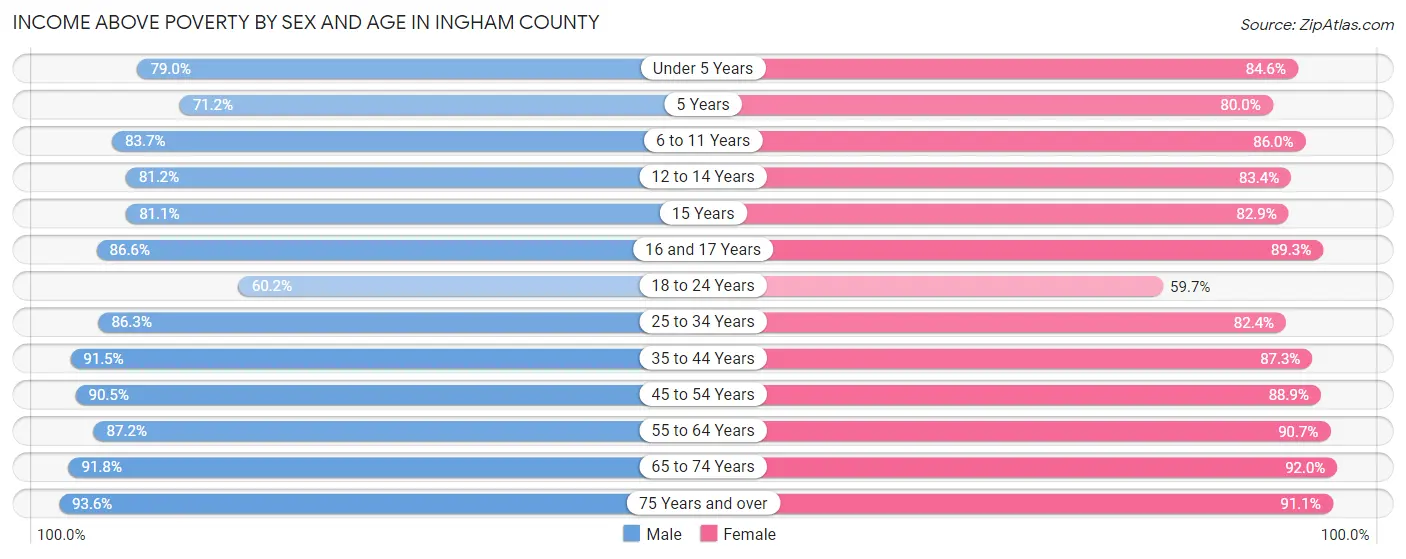
Income Above Poverty by Sex and Age in Ingham County
According to the poverty statistics in Ingham County, males aged 75 years and over and females aged 65 to 74 years are the age groups that are most secure financially, with 93.6% of males and 91.9% of females in these age groups living above the poverty line.
| Age Bracket | Male | Female |
| Under 5 Years | 5,849 (79.0%) | 6,004 (84.6%) |
| 5 Years | 1,048 (71.2%) | 1,348 (79.9%) |
| 6 to 11 Years | 7,690 (83.7%) | 7,469 (86.0%) |
| 12 to 14 Years | 3,711 (81.2%) | 3,617 (83.4%) |
| 15 Years | 1,376 (81.1%) | 971 (82.9%) |
| 16 and 17 Years | 2,636 (86.6%) | 2,916 (89.3%) |
| 18 to 24 Years | 11,650 (60.2%) | 11,602 (59.7%) |
| 25 to 34 Years | 17,423 (86.3%) | 16,204 (82.4%) |
| 35 to 44 Years | 14,831 (91.5%) | 14,175 (87.3%) |
| 45 to 54 Years | 13,104 (90.5%) | 13,423 (88.9%) |
| 55 to 64 Years | 13,049 (87.2%) | 14,847 (90.6%) |
| 65 to 74 Years | 10,506 (91.8%) | 12,195 (91.9%) |
| 75 Years and over | 5,634 (93.6%) | 7,919 (91.1%) |
| Total | 108,507 (83.5%) | 112,690 (83.5%) |
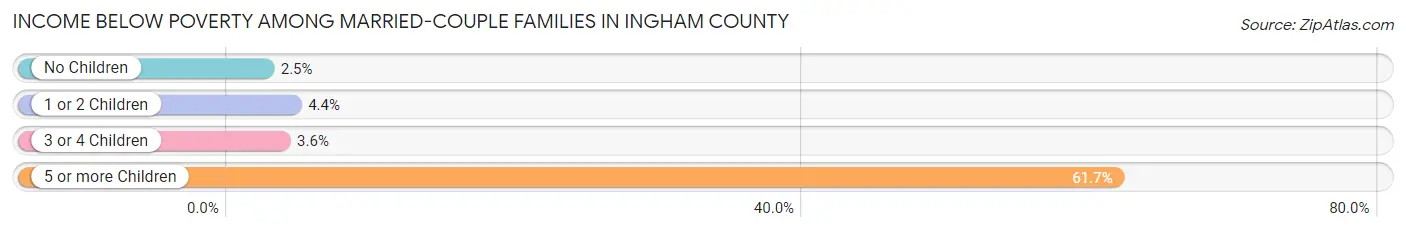
Income Below Poverty Among Married-Couple Families in Ingham County
The poverty statistics for married-couple families in Ingham County show that 3.4% or 1,493 of the total 44,062 families live below the poverty line. Families with 5 or more children have the highest poverty rate of 61.7%, comprising of 100 families. On the other hand, families with no children have the lowest poverty rate of 2.5%, which includes 664 families.
| Children | Above Poverty | Below Poverty |
| No Children | 26,052 (97.5%) | 664 (2.5%) |
| 1 or 2 Children | 13,081 (95.6%) | 602 (4.4%) |
| 3 or 4 Children | 3,374 (96.4%) | 127 (3.6%) |
| 5 or more Children | 62 (38.3%) | 100 (61.7%) |
| Total | 42,569 (96.6%) | 1,493 (3.4%) |
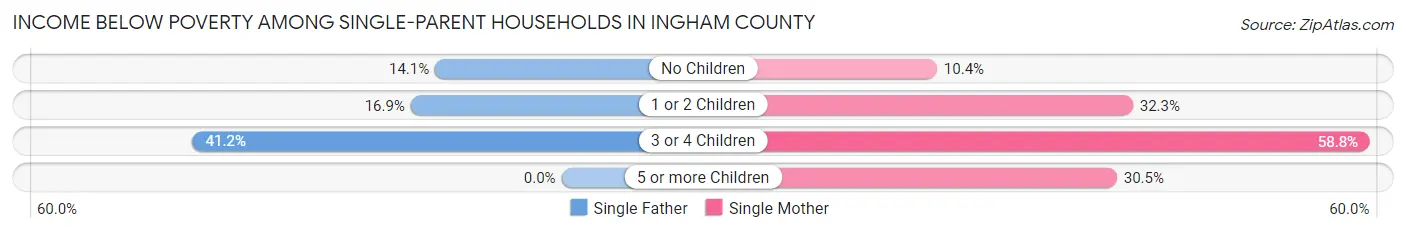
Income Below Poverty Among Single-Parent Households in Ingham County
According to the poverty data in Ingham County, 17.8% or 847 single-father households and 26.1% or 3,213 single-mother households are living below the poverty line. Among single-father households, those with 3 or 4 children have the highest poverty rate, with 169 households (41.2%) experiencing poverty. Likewise, among single-mother households, those with 3 or 4 children have the highest poverty rate, with 634 households (58.8%) falling below the poverty line.
| Children | Single Father | Single Mother |
| No Children | 278 (14.1%) | 496 (10.4%) |
| 1 or 2 Children | 400 (16.9%) | 2,036 (32.3%) |
| 3 or 4 Children | 169 (41.2%) | 634 (58.8%) |
| 5 or more Children | 0 (0.0%) | 47 (30.5%) |
| Total | 847 (17.8%) | 3,213 (26.1%) |
Income Below Poverty Among Married-Couple vs Single-Parent Households in Ingham County
The poverty data for Ingham County shows that 1,493 of the married-couple family households (3.4%) and 4,060 of the single-parent households (23.8%) are living below the poverty level. Within the married-couple family households, those with 5 or more children have the highest poverty rate, with 100 households (61.7%) falling below the poverty line. Among the single-parent households, those with 3 or 4 children have the highest poverty rate, with 803 household (54.0%) living below poverty.
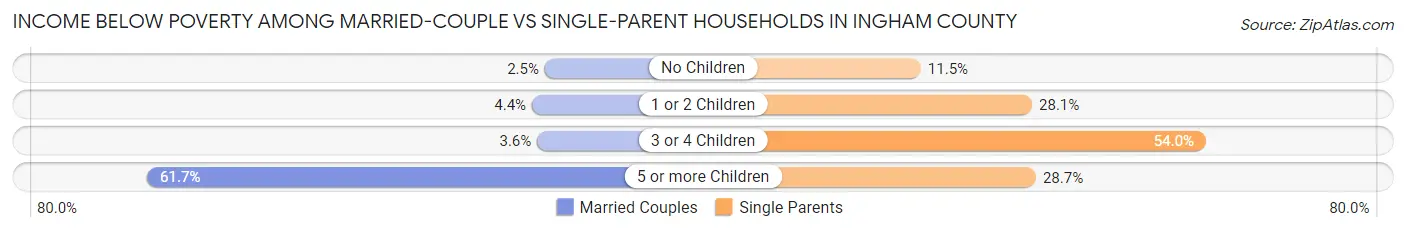
| Children | Married-Couple Families | Single-Parent Households |
| No Children | 664 (2.5%) | 774 (11.5%) |
| 1 or 2 Children | 602 (4.4%) | 2,436 (28.1%) |
| 3 or 4 Children | 127 (3.6%) | 803 (54.0%) |
| 5 or more Children | 100 (61.7%) | 47 (28.7%) |
| Total | 1,493 (3.4%) | 4,060 (23.8%) |
Employment Characteristics in Ingham County
Employment by Class of Employer in Ingham County
Among the 137,987 employed individuals in Ingham County, private company employees (82,202 | 59.6%), state government employees (19,738 | 14.3%), and not-for-profit organizations (17,332 | 12.6%) make up the most common classes of employment.
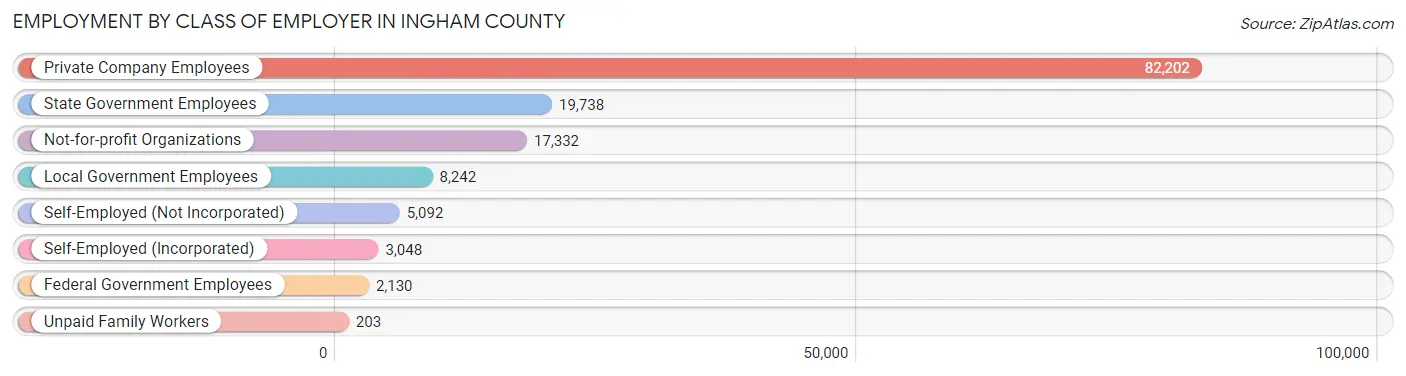
| Employer Class | # Employees | % Employees |
| Private Company Employees | 82,202 | 59.6% |
| Self-Employed (Incorporated) | 3,048 | 2.2% |
| Self-Employed (Not Incorporated) | 5,092 | 3.7% |
| Not-for-profit Organizations | 17,332 | 12.6% |
| Local Government Employees | 8,242 | 6.0% |
| State Government Employees | 19,738 | 14.3% |
| Federal Government Employees | 2,130 | 1.5% |
| Unpaid Family Workers | 203 | 0.2% |
| Total | 137,987 | 100.0% |
Employment Status by Age in Ingham County
According to the labor force statistics for Ingham County, out of the total population over 16 years of age (233,674), 64.6% or 150,953 individuals are in the labor force, with 6.4% or 9,661 of them unemployed. The age group with the highest labor force participation rate is 30 to 34 years, with 87.0% or 15,968 individuals in the labor force. Within the labor force, the 16 to 19 years age range has the highest percentage of unemployed individuals, with 19.1% or 1,767 of them being unemployed.
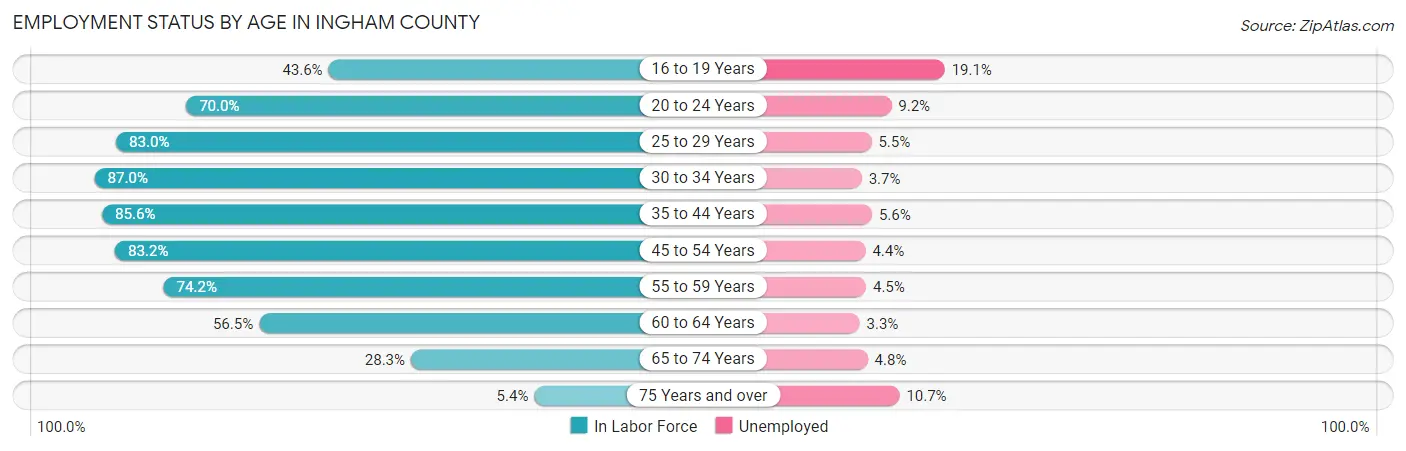
| Age Bracket | In Labor Force | Unemployed |
| 16 to 19 Years | 9,253 (43.6%) | 1,767 (19.1%) |
| 20 to 24 Years | 26,833 (70.0%) | 2,469 (9.2%) |
| 25 to 29 Years | 18,128 (83.0%) | 997 (5.5%) |
| 30 to 34 Years | 15,968 (87.0%) | 591 (3.7%) |
| 35 to 44 Years | 27,920 (85.6%) | 1,564 (5.6%) |
| 45 to 54 Years | 24,669 (83.2%) | 1,085 (4.4%) |
| 55 to 59 Years | 10,948 (74.2%) | 493 (4.5%) |
| 60 to 64 Years | 9,426 (56.5%) | 311 (3.3%) |
| 65 to 74 Years | 7,039 (28.3%) | 338 (4.8%) |
| 75 Years and over | 829 (5.4%) | 89 (10.7%) |
| Total | 150,953 (64.6%) | 9,661 (6.4%) |
Employment Status by Educational Attainment in Ingham County
According to labor force statistics for Ingham County, 79.9% of individuals (106,986) out of the total population between 25 and 64 years of age (133,900) are in the labor force, with 4.7% or 5,028 of them being unemployed. The group with the highest labor force participation rate are those with the educational attainment of bachelor's degree or higher, with 87.0% or 48,841 individuals in the labor force. Within the labor force, individuals with less than high school education have the highest percentage of unemployment, with 16.0% or 726 of them being unemployed.
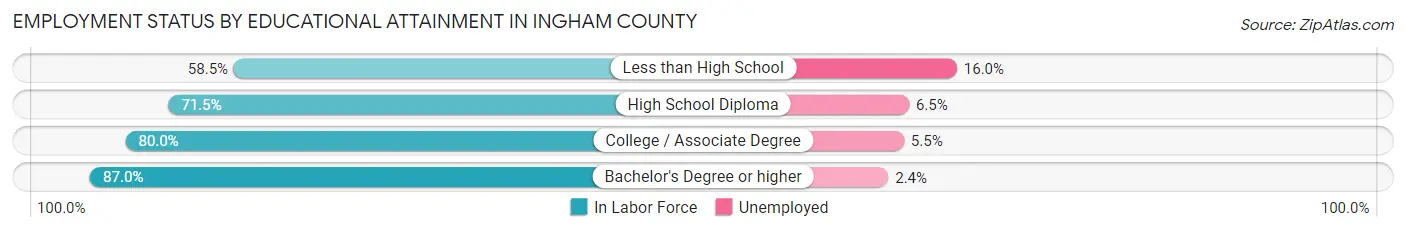
| Educational Attainment | In Labor Force | Unemployed |
| Less than High School | 4,536 (58.5%) | 1,240 (16.0%) |
| High School Diploma | 19,565 (71.5%) | 1,779 (6.5%) |
| College / Associate Degree | 34,116 (80.0%) | 2,345 (5.5%) |
| Bachelor's Degree or higher | 48,841 (87.0%) | 1,347 (2.4%) |
| Total | 106,986 (79.9%) | 6,293 (4.7%) |
Employment Occupations by Sex in Ingham County
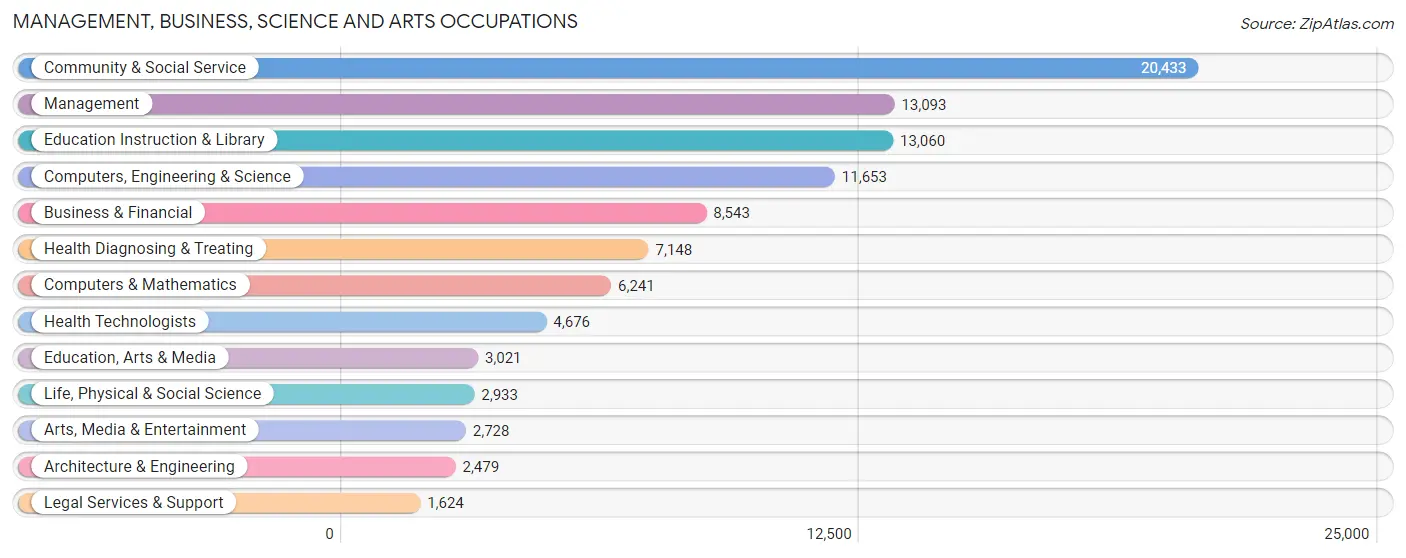
Management, Business, Science and Arts Occupations
The most common Management, Business, Science and Arts occupations in Ingham County are Community & Social Service (20,433 | 14.5%), Management (13,093 | 9.3%), Education Instruction & Library (13,060 | 9.2%), Computers, Engineering & Science (11,653 | 8.3%), and Business & Financial (8,543 | 6.0%).
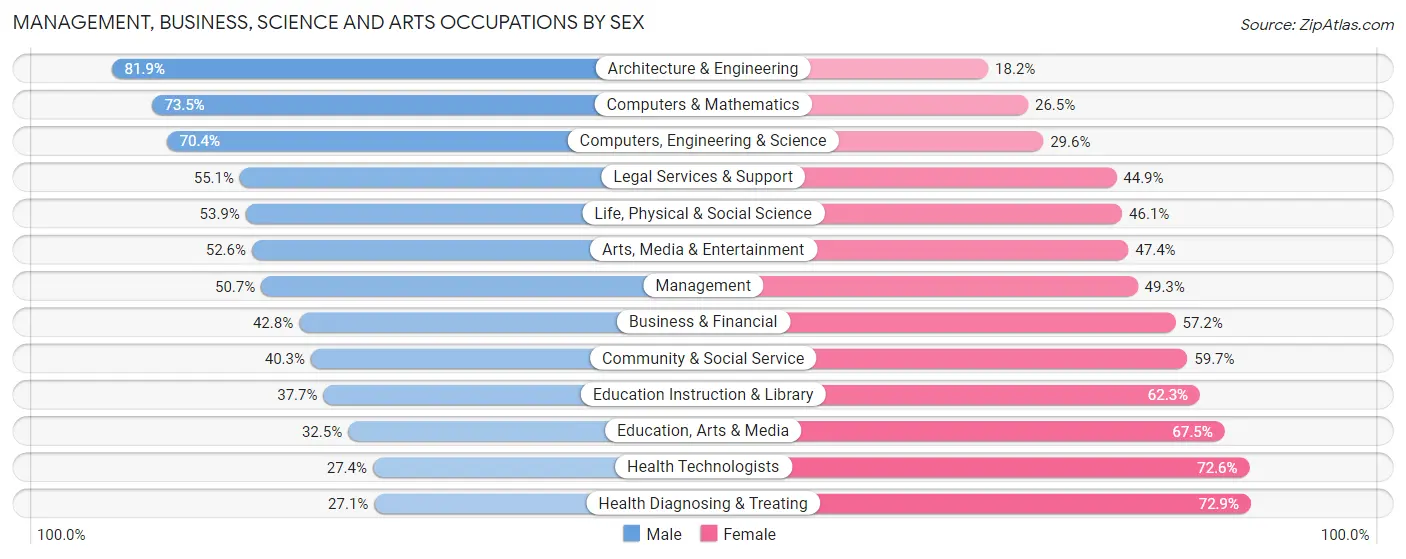
Management, Business, Science and Arts Occupations by Sex
Within the Management, Business, Science and Arts occupations in Ingham County, the most male-oriented occupations are Architecture & Engineering (81.9%), Computers & Mathematics (73.5%), and Computers, Engineering & Science (70.4%), while the most female-oriented occupations are Health Diagnosing & Treating (72.9%), Health Technologists (72.6%), and Education, Arts & Media (67.5%).
| Occupation | Male | Female |
| Management | 6,635 (50.7%) | 6,458 (49.3%) |
| Business & Financial | 3,653 (42.8%) | 4,890 (57.2%) |
| Computers, Engineering & Science | 8,199 (70.4%) | 3,454 (29.6%) |
| Computers & Mathematics | 4,589 (73.5%) | 1,652 (26.5%) |
| Architecture & Engineering | 2,029 (81.9%) | 450 (18.1%) |
| Life, Physical & Social Science | 1,581 (53.9%) | 1,352 (46.1%) |
| Community & Social Service | 8,235 (40.3%) | 12,198 (59.7%) |
| Education, Arts & Media | 983 (32.5%) | 2,038 (67.5%) |
| Legal Services & Support | 895 (55.1%) | 729 (44.9%) |
| Education Instruction & Library | 4,922 (37.7%) | 8,138 (62.3%) |
| Arts, Media & Entertainment | 1,435 (52.6%) | 1,293 (47.4%) |
| Health Diagnosing & Treating | 1,936 (27.1%) | 5,212 (72.9%) |
| Health Technologists | 1,280 (27.4%) | 3,396 (72.6%) |
| Total (Category) | 28,658 (47.1%) | 32,212 (52.9%) |
| Total (Overall) | 70,976 (50.3%) | 70,154 (49.7%) |
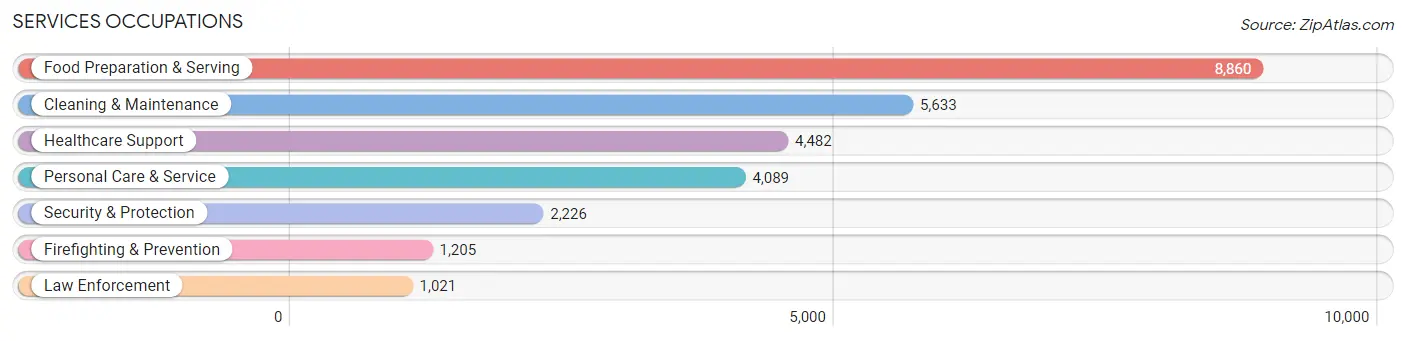
Services Occupations
The most common Services occupations in Ingham County are Food Preparation & Serving (8,860 | 6.3%), Cleaning & Maintenance (5,633 | 4.0%), Healthcare Support (4,482 | 3.2%), Personal Care & Service (4,089 | 2.9%), and Security & Protection (2,226 | 1.6%).
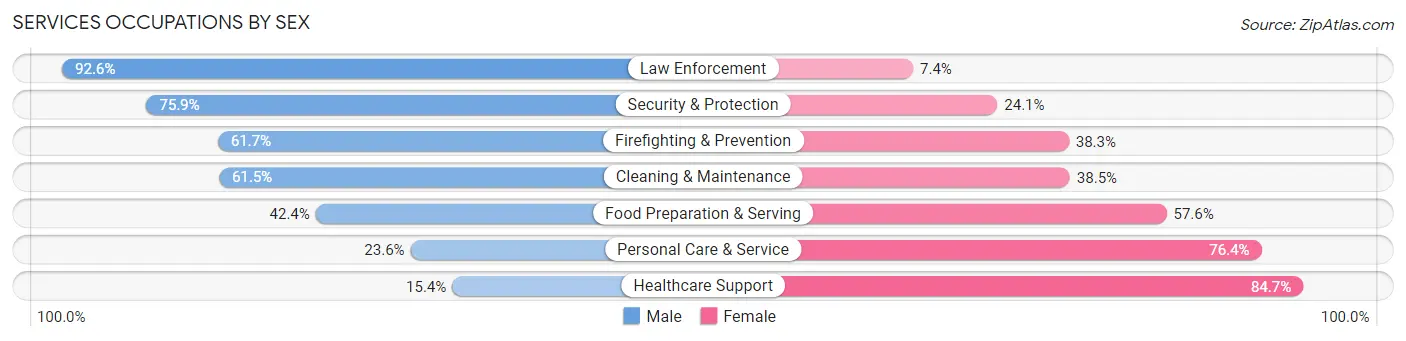
Services Occupations by Sex
Within the Services occupations in Ingham County, the most male-oriented occupations are Law Enforcement (92.6%), Security & Protection (75.9%), and Firefighting & Prevention (61.7%), while the most female-oriented occupations are Healthcare Support (84.7%), Personal Care & Service (76.4%), and Food Preparation & Serving (57.6%).
| Occupation | Male | Female |
| Healthcare Support | 688 (15.3%) | 3,794 (84.7%) |
| Security & Protection | 1,689 (75.9%) | 537 (24.1%) |
| Firefighting & Prevention | 744 (61.7%) | 461 (38.3%) |
| Law Enforcement | 945 (92.6%) | 76 (7.4%) |
| Food Preparation & Serving | 3,755 (42.4%) | 5,105 (57.6%) |
| Cleaning & Maintenance | 3,465 (61.5%) | 2,168 (38.5%) |
| Personal Care & Service | 965 (23.6%) | 3,124 (76.4%) |
| Total (Category) | 10,562 (41.8%) | 14,728 (58.2%) |
| Total (Overall) | 70,976 (50.3%) | 70,154 (49.7%) |
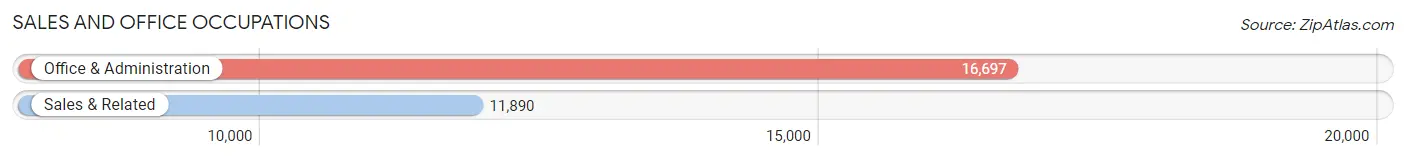
Sales and Office Occupations
The most common Sales and Office occupations in Ingham County are Office & Administration (16,697 | 11.8%), and Sales & Related (11,890 | 8.4%).
Sales and Office Occupations by Sex
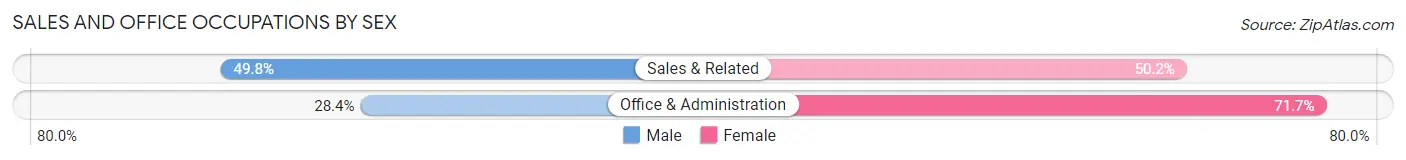
| Occupation | Male | Female |
| Sales & Related | 5,925 (49.8%) | 5,965 (50.2%) |
| Office & Administration | 4,734 (28.3%) | 11,963 (71.7%) |
| Total (Category) | 10,659 (37.3%) | 17,928 (62.7%) |
| Total (Overall) | 70,976 (50.3%) | 70,154 (49.7%) |
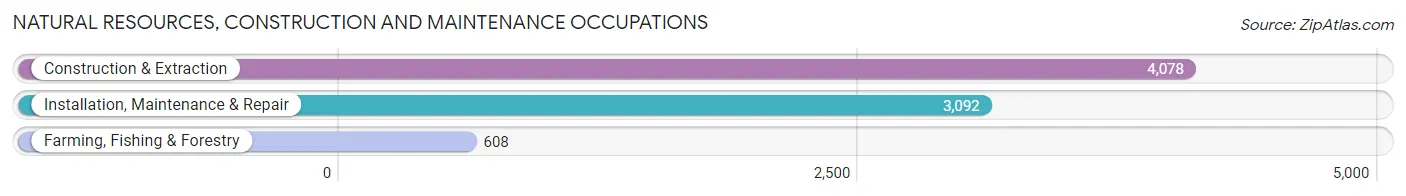
Natural Resources, Construction and Maintenance Occupations
The most common Natural Resources, Construction and Maintenance occupations in Ingham County are Construction & Extraction (4,078 | 2.9%), Installation, Maintenance & Repair (3,092 | 2.2%), and Farming, Fishing & Forestry (608 | 0.4%).
Natural Resources, Construction and Maintenance Occupations by Sex
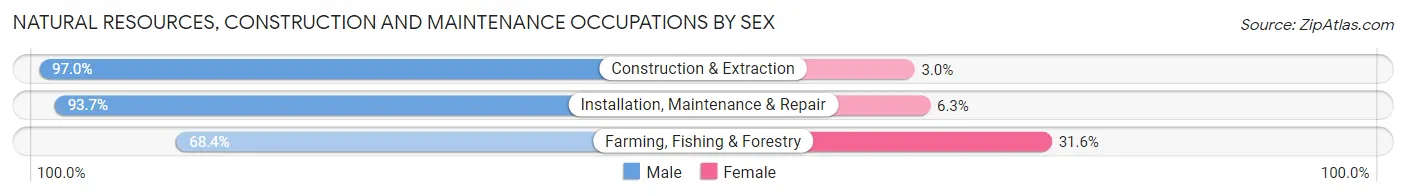
| Occupation | Male | Female |
| Farming, Fishing & Forestry | 416 (68.4%) | 192 (31.6%) |
| Construction & Extraction | 3,955 (97.0%) | 123 (3.0%) |
| Installation, Maintenance & Repair | 2,898 (93.7%) | 194 (6.3%) |
| Total (Category) | 7,269 (93.5%) | 509 (6.5%) |
| Total (Overall) | 70,976 (50.3%) | 70,154 (49.7%) |
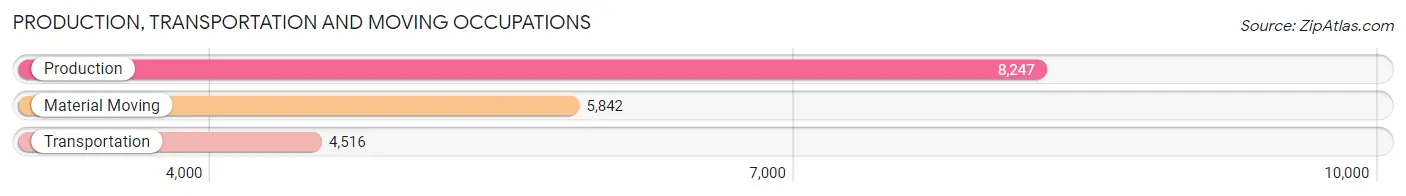
Production, Transportation and Moving Occupations
The most common Production, Transportation and Moving occupations in Ingham County are Production (8,247 | 5.8%), Material Moving (5,842 | 4.1%), and Transportation (4,516 | 3.2%).
Production, Transportation and Moving Occupations by Sex
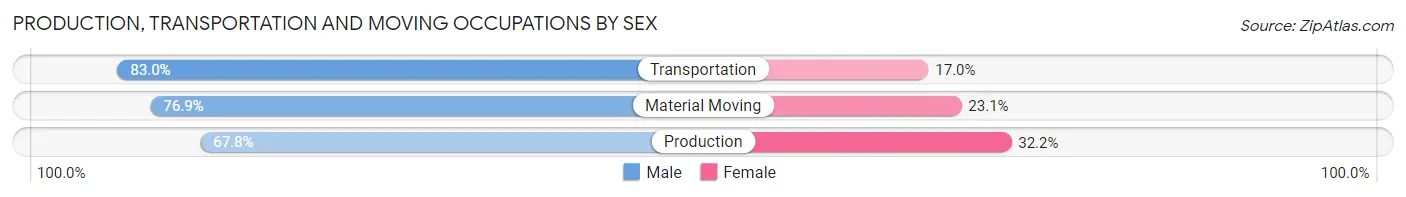
| Occupation | Male | Female |
| Production | 5,588 (67.8%) | 2,659 (32.2%) |
| Transportation | 3,747 (83.0%) | 769 (17.0%) |
| Material Moving | 4,493 (76.9%) | 1,349 (23.1%) |
| Total (Category) | 13,828 (74.3%) | 4,777 (25.7%) |
| Total (Overall) | 70,976 (50.3%) | 70,154 (49.7%) |
Employment Industries by Sex in Ingham County
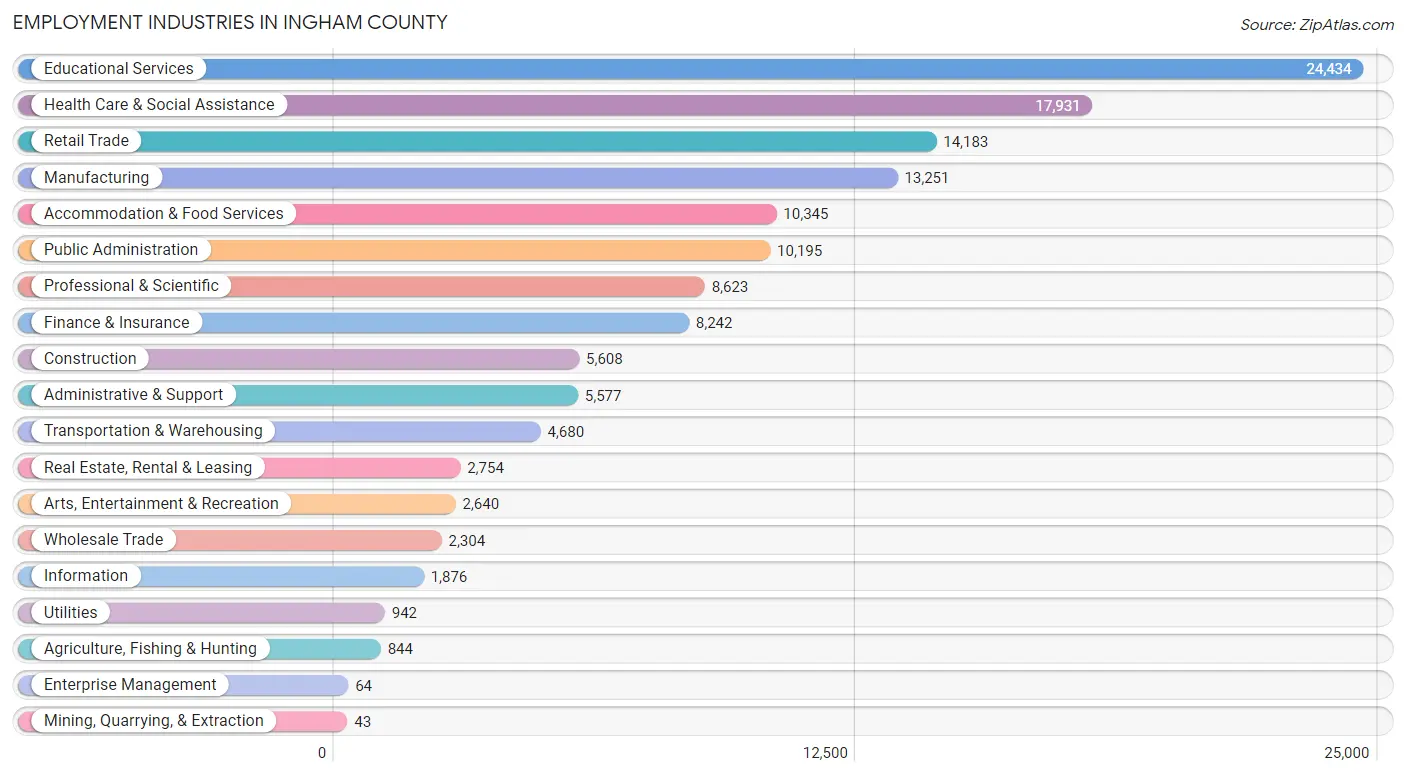
Employment Industries in Ingham County
The major employment industries in Ingham County include Educational Services (24,434 | 17.3%), Health Care & Social Assistance (17,931 | 12.7%), Retail Trade (14,183 | 10.1%), Manufacturing (13,251 | 9.4%), and Accommodation & Food Services (10,345 | 7.3%).
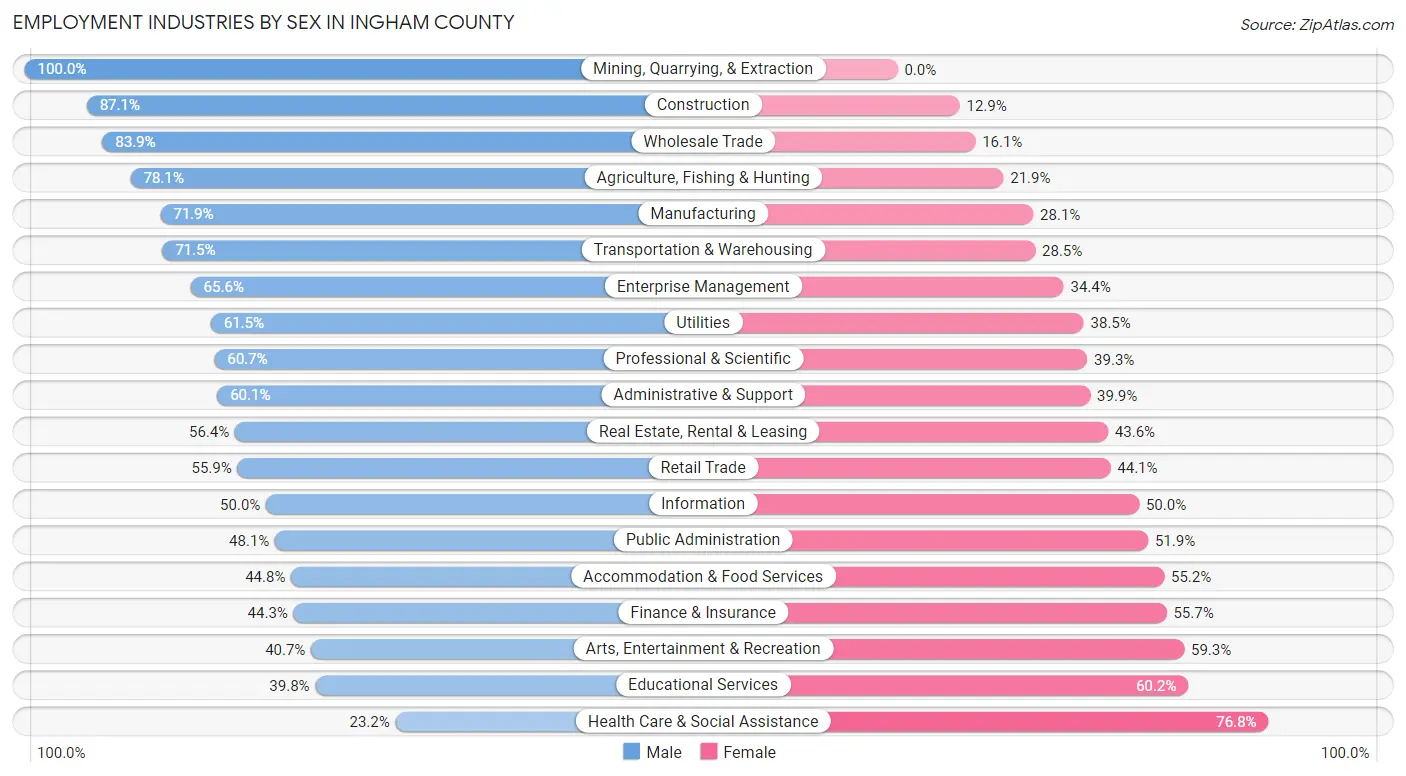
Employment Industries by Sex in Ingham County
The Ingham County industries that see more men than women are Mining, Quarrying, & Extraction (100.0%), Construction (87.1%), and Wholesale Trade (83.9%), whereas the industries that tend to have a higher number of women are Health Care & Social Assistance (76.8%), Educational Services (60.2%), and Arts, Entertainment & Recreation (59.3%).
| Industry | Male | Female |
| Agriculture, Fishing & Hunting | 659 (78.1%) | 185 (21.9%) |
| Mining, Quarrying, & Extraction | 43 (100.0%) | 0 (0.0%) |
| Construction | 4,887 (87.1%) | 721 (12.9%) |
| Manufacturing | 9,528 (71.9%) | 3,723 (28.1%) |
| Wholesale Trade | 1,933 (83.9%) | 371 (16.1%) |
| Retail Trade | 7,932 (55.9%) | 6,251 (44.1%) |
| Transportation & Warehousing | 3,346 (71.5%) | 1,334 (28.5%) |
| Utilities | 579 (61.5%) | 363 (38.5%) |
| Information | 938 (50.0%) | 938 (50.0%) |
| Finance & Insurance | 3,652 (44.3%) | 4,590 (55.7%) |
| Real Estate, Rental & Leasing | 1,554 (56.4%) | 1,200 (43.6%) |
| Professional & Scientific | 5,237 (60.7%) | 3,386 (39.3%) |
| Enterprise Management | 42 (65.6%) | 22 (34.4%) |
| Administrative & Support | 3,353 (60.1%) | 2,224 (39.9%) |
| Educational Services | 9,727 (39.8%) | 14,707 (60.2%) |
| Health Care & Social Assistance | 4,164 (23.2%) | 13,767 (76.8%) |
| Arts, Entertainment & Recreation | 1,074 (40.7%) | 1,566 (59.3%) |
| Accommodation & Food Services | 4,636 (44.8%) | 5,709 (55.2%) |
| Public Administration | 4,908 (48.1%) | 5,287 (51.9%) |
| Total | 70,976 (50.3%) | 70,154 (49.7%) |
Education in Ingham County
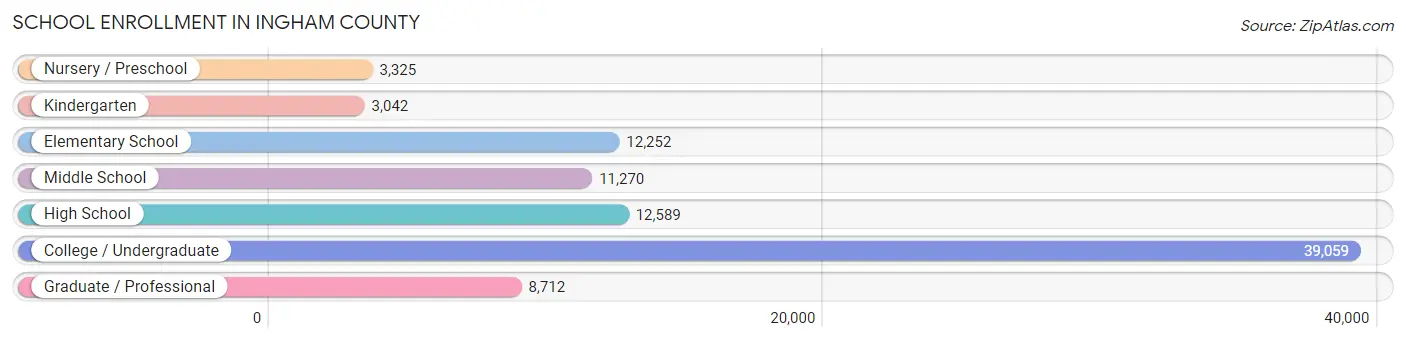
School Enrollment in Ingham County
The most common levels of schooling among the 90,249 students in Ingham County are college / undergraduate (39,059 | 43.3%), high school (12,589 | 14.0%), and elementary school (12,252 | 13.6%).
| School Level | # Students | % Students |
| Nursery / Preschool | 3,325 | 3.7% |
| Kindergarten | 3,042 | 3.4% |
| Elementary School | 12,252 | 13.6% |
| Middle School | 11,270 | 12.5% |
| High School | 12,589 | 14.0% |
| College / Undergraduate | 39,059 | 43.3% |
| Graduate / Professional | 8,712 | 9.7% |
| Total | 90,249 | 100.0% |
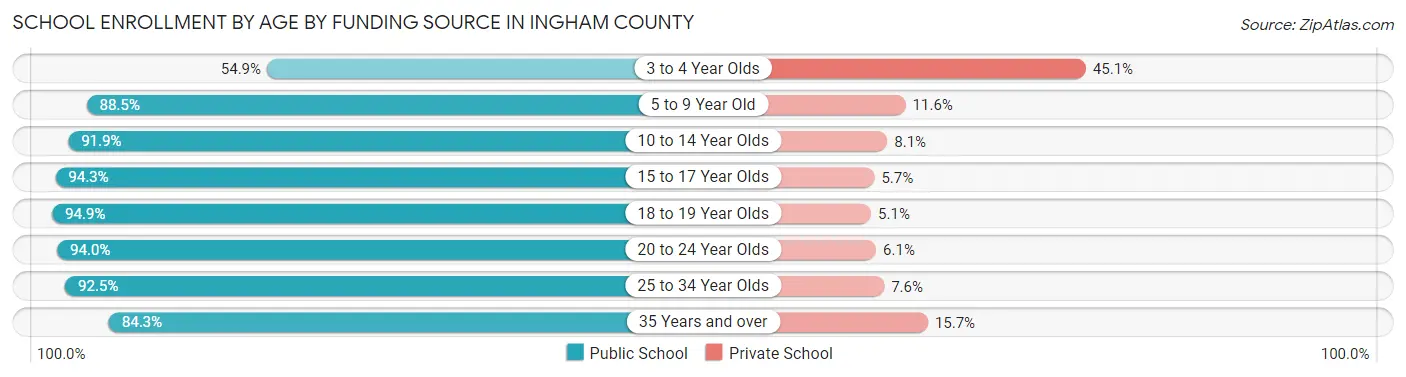
School Enrollment by Age by Funding Source in Ingham County
Out of a total of 90,249 students who are enrolled in schools in Ingham County, 7,942 (8.8%) attend a private institution, while the remaining 82,307 (91.2%) are enrolled in public schools. The age group of 3 to 4 year olds has the highest likelihood of being enrolled in private schools, with 1,215 (45.1% in the age bracket) enrolled. Conversely, the age group of 18 to 19 year olds has the lowest likelihood of being enrolled in a private school, with 12,760 (94.9% in the age bracket) attending a public institution.
| Age Bracket | Public School | Private School |
| 3 to 4 Year Olds | 1,478 (54.9%) | 1,215 (45.1%) |
| 5 to 9 Year Old | 13,080 (88.4%) | 1,708 (11.6%) |
| 10 to 14 Year Olds | 13,170 (91.9%) | 1,165 (8.1%) |
| 15 to 17 Year Olds | 8,669 (94.3%) | 527 (5.7%) |
| 18 to 19 Year Olds | 12,760 (94.9%) | 689 (5.1%) |
| 20 to 24 Year Olds | 22,443 (94.0%) | 1,445 (6.0%) |
| 25 to 34 Year Olds | 7,491 (92.4%) | 612 (7.5%) |
| 35 Years and over | 3,201 (84.3%) | 596 (15.7%) |
| Total | 82,307 (91.2%) | 7,942 (8.8%) |
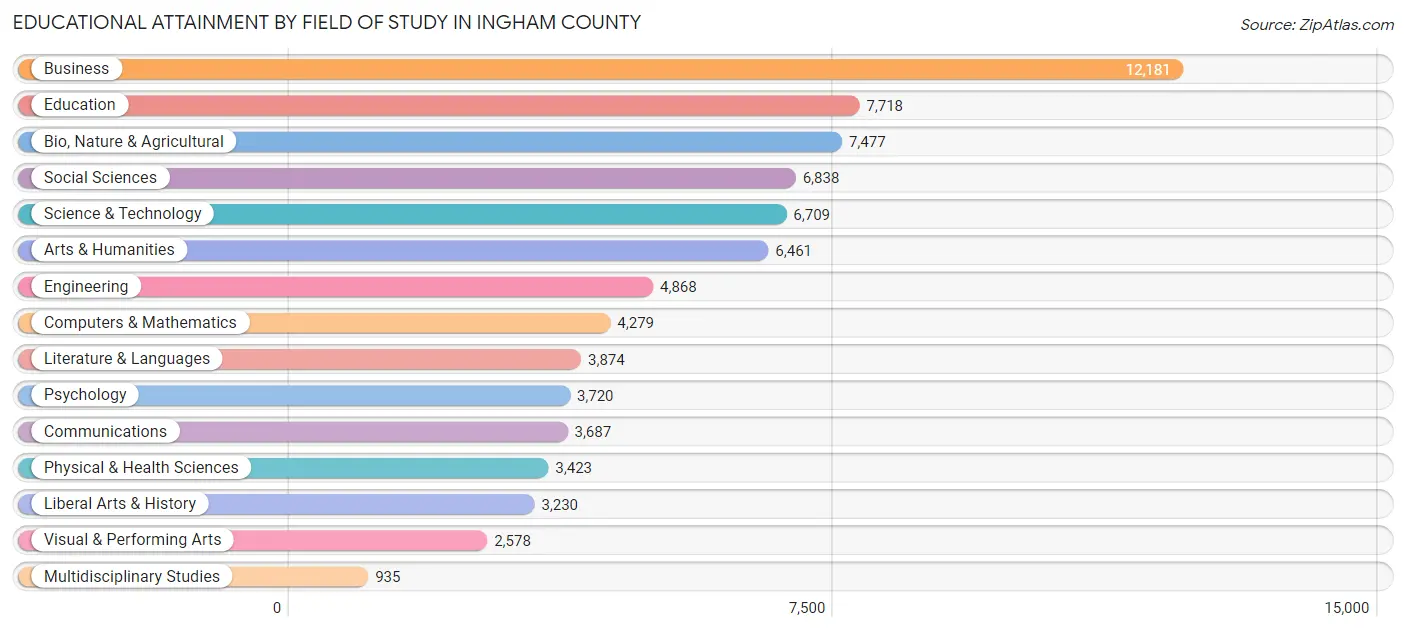
Educational Attainment by Field of Study in Ingham County
Business (12,181 | 15.6%), education (7,718 | 9.9%), bio, nature & agricultural (7,477 | 9.6%), social sciences (6,838 | 8.8%), and science & technology (6,709 | 8.6%) are the most common fields of study among 77,978 individuals in Ingham County who have obtained a bachelor's degree or higher.
| Field of Study | # Graduates | % Graduates |
| Computers & Mathematics | 4,279 | 5.5% |
| Bio, Nature & Agricultural | 7,477 | 9.6% |
| Physical & Health Sciences | 3,423 | 4.4% |
| Psychology | 3,720 | 4.8% |
| Social Sciences | 6,838 | 8.8% |
| Engineering | 4,868 | 6.2% |
| Multidisciplinary Studies | 935 | 1.2% |
| Science & Technology | 6,709 | 8.6% |
| Business | 12,181 | 15.6% |
| Education | 7,718 | 9.9% |
| Literature & Languages | 3,874 | 5.0% |
| Liberal Arts & History | 3,230 | 4.1% |
| Visual & Performing Arts | 2,578 | 3.3% |
| Communications | 3,687 | 4.7% |
| Arts & Humanities | 6,461 | 8.3% |
| Total | 77,978 | 100.0% |
Transportation & Commute in Ingham County
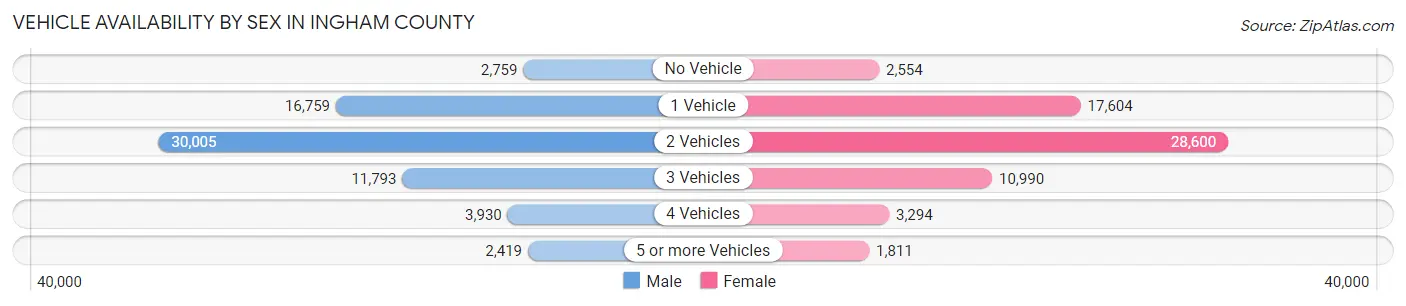
Vehicle Availability by Sex in Ingham County
The most prevalent vehicle ownership categories in Ingham County are males with 2 vehicles (30,005, accounting for 44.3%) and females with 2 vehicles (28,600, making up 46.3%).
| Vehicles Available | Male | Female |
| No Vehicle | 2,759 (4.1%) | 2,554 (3.9%) |
| 1 Vehicle | 16,759 (24.8%) | 17,604 (27.1%) |
| 2 Vehicles | 30,005 (44.3%) | 28,600 (44.1%) |
| 3 Vehicles | 11,793 (17.4%) | 10,990 (17.0%) |
| 4 Vehicles | 3,930 (5.8%) | 3,294 (5.1%) |
| 5 or more Vehicles | 2,419 (3.6%) | 1,811 (2.8%) |
| Total | 67,665 (100.0%) | 64,853 (100.0%) |
Commute Time in Ingham County
The most frequently occuring commute durations in Ingham County are 15 to 19 minutes (27,606 commuters, 23.0%), 10 to 14 minutes (24,088 commuters, 20.0%), and 20 to 24 minutes (21,389 commuters, 17.8%).
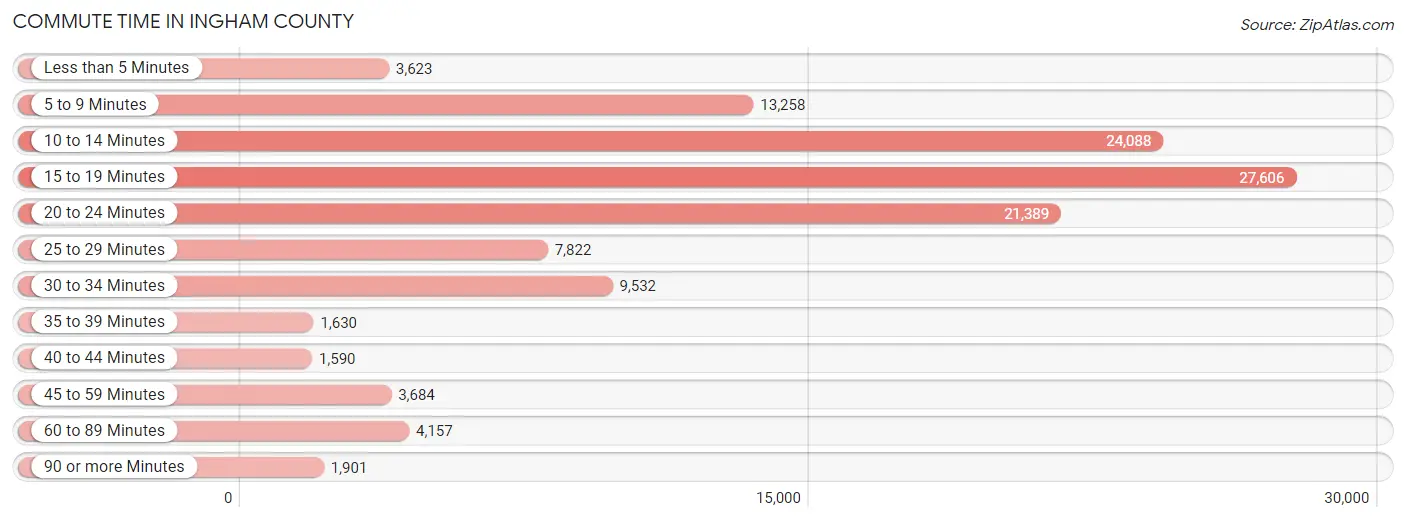
| Commute Time | # Commuters | % Commuters |
| Less than 5 Minutes | 3,623 | 3.0% |
| 5 to 9 Minutes | 13,258 | 11.0% |
| 10 to 14 Minutes | 24,088 | 20.0% |
| 15 to 19 Minutes | 27,606 | 23.0% |
| 20 to 24 Minutes | 21,389 | 17.8% |
| 25 to 29 Minutes | 7,822 | 6.5% |
| 30 to 34 Minutes | 9,532 | 7.9% |
| 35 to 39 Minutes | 1,630 | 1.4% |
| 40 to 44 Minutes | 1,590 | 1.3% |
| 45 to 59 Minutes | 3,684 | 3.1% |
| 60 to 89 Minutes | 4,157 | 3.5% |
| 90 or more Minutes | 1,901 | 1.6% |
Commute Time by Sex in Ingham County
The most common commute times in Ingham County are 15 to 19 minutes (13,381 commuters, 21.9%) for males and 15 to 19 minutes (14,225 commuters, 24.0%) for females.
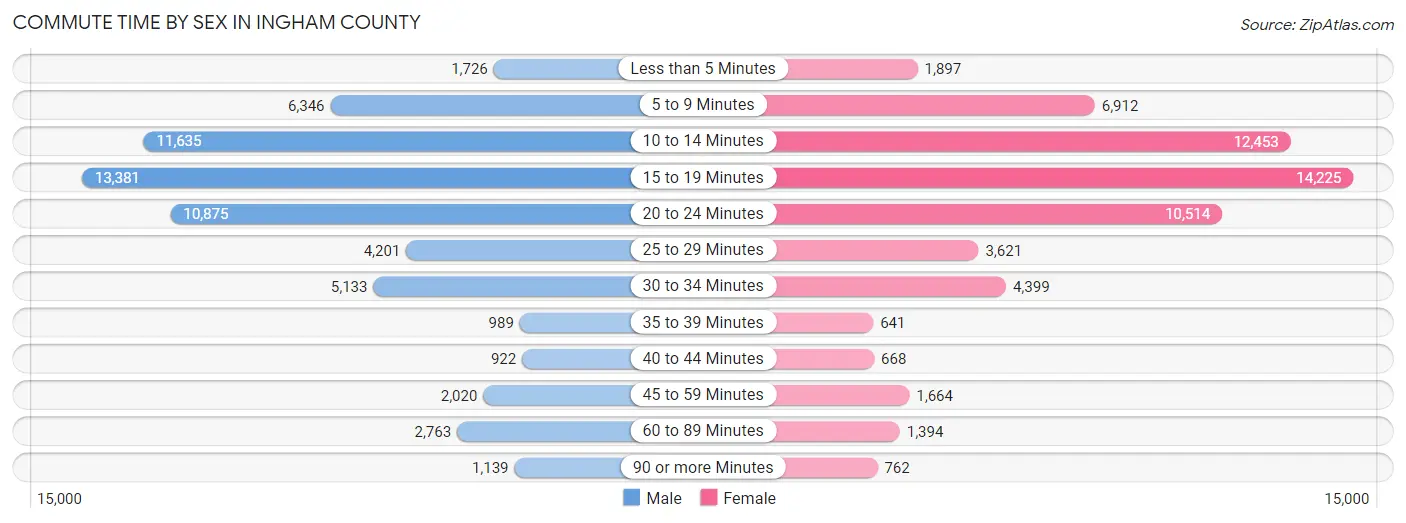
| Commute Time | Male | Female |
| Less than 5 Minutes | 1,726 (2.8%) | 1,897 (3.2%) |
| 5 to 9 Minutes | 6,346 (10.4%) | 6,912 (11.7%) |
| 10 to 14 Minutes | 11,635 (19.0%) | 12,453 (21.0%) |
| 15 to 19 Minutes | 13,381 (21.9%) | 14,225 (24.0%) |
| 20 to 24 Minutes | 10,875 (17.8%) | 10,514 (17.8%) |
| 25 to 29 Minutes | 4,201 (6.9%) | 3,621 (6.1%) |
| 30 to 34 Minutes | 5,133 (8.4%) | 4,399 (7.4%) |
| 35 to 39 Minutes | 989 (1.6%) | 641 (1.1%) |
| 40 to 44 Minutes | 922 (1.5%) | 668 (1.1%) |
| 45 to 59 Minutes | 2,020 (3.3%) | 1,664 (2.8%) |
| 60 to 89 Minutes | 2,763 (4.5%) | 1,394 (2.4%) |
| 90 or more Minutes | 1,139 (1.9%) | 762 (1.3%) |
Time of Departure to Work by Sex in Ingham County
The most frequent times of departure to work in Ingham County are 7:30 AM to 7:59 AM (7,887, 12.9%) for males and 7:30 AM to 7:59 AM (9,787, 16.6%) for females.
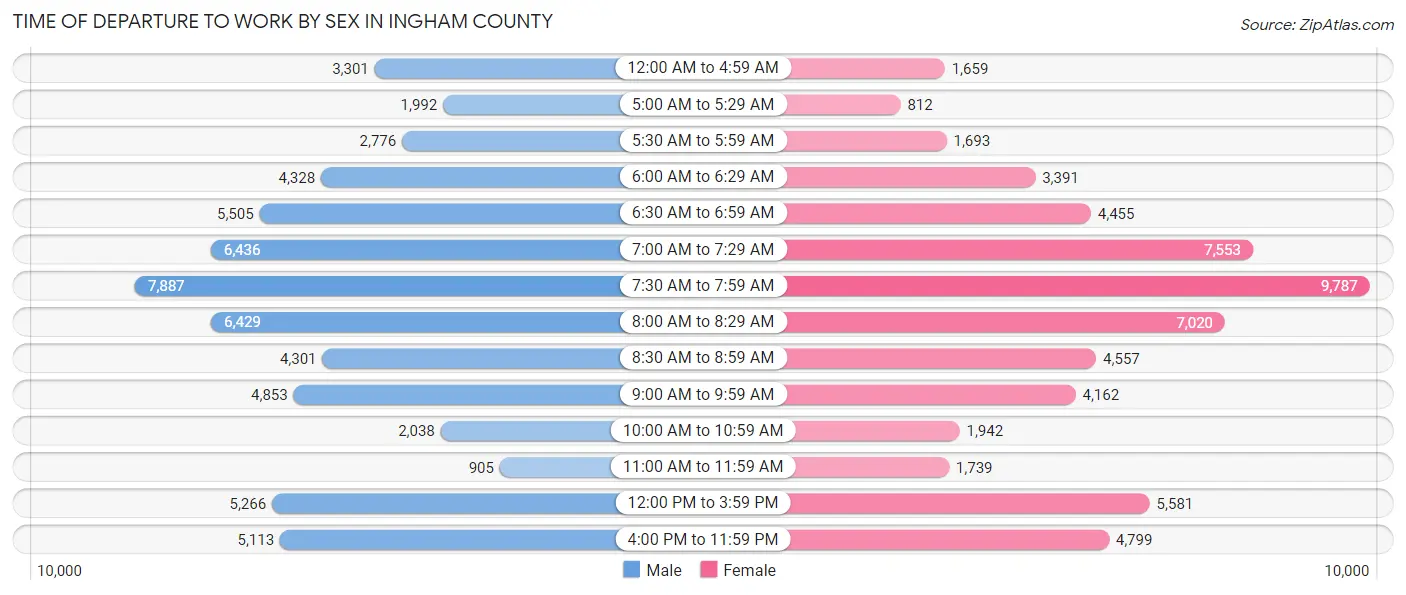
| Time of Departure | Male | Female |
| 12:00 AM to 4:59 AM | 3,301 (5.4%) | 1,659 (2.8%) |
| 5:00 AM to 5:29 AM | 1,992 (3.3%) | 812 (1.4%) |
| 5:30 AM to 5:59 AM | 2,776 (4.5%) | 1,693 (2.9%) |
| 6:00 AM to 6:29 AM | 4,328 (7.1%) | 3,391 (5.7%) |
| 6:30 AM to 6:59 AM | 5,505 (9.0%) | 4,455 (7.5%) |
| 7:00 AM to 7:29 AM | 6,436 (10.5%) | 7,553 (12.8%) |
| 7:30 AM to 7:59 AM | 7,887 (12.9%) | 9,787 (16.6%) |
| 8:00 AM to 8:29 AM | 6,429 (10.5%) | 7,020 (11.9%) |
| 8:30 AM to 8:59 AM | 4,301 (7.0%) | 4,557 (7.7%) |
| 9:00 AM to 9:59 AM | 4,853 (7.9%) | 4,162 (7.0%) |
| 10:00 AM to 10:59 AM | 2,038 (3.3%) | 1,942 (3.3%) |
| 11:00 AM to 11:59 AM | 905 (1.5%) | 1,739 (2.9%) |
| 12:00 PM to 3:59 PM | 5,266 (8.6%) | 5,581 (9.4%) |
| 4:00 PM to 11:59 PM | 5,113 (8.4%) | 4,799 (8.1%) |
| Total | 61,130 (100.0%) | 59,150 (100.0%) |
Housing Occupancy in Ingham County
Occupancy by Ownership in Ingham County
Of the total 115,648 dwellings in Ingham County, owner-occupied units account for 67,988 (58.8%), while renter-occupied units make up 47,660 (41.2%).
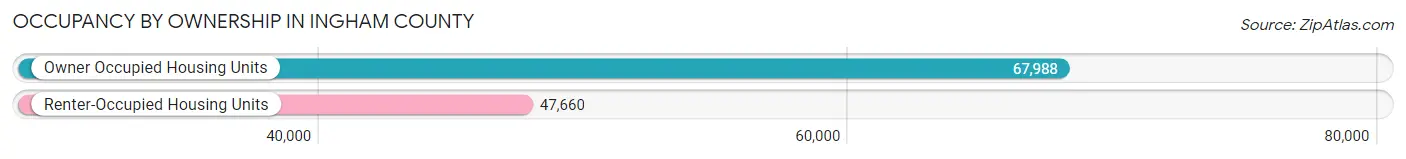
| Occupancy | # Housing Units | % Housing Units |
| Owner Occupied Housing Units | 67,988 | 58.8% |
| Renter-Occupied Housing Units | 47,660 | 41.2% |
| Total Occupied Housing Units | 115,648 | 100.0% |
Occupancy by Household Size in Ingham County
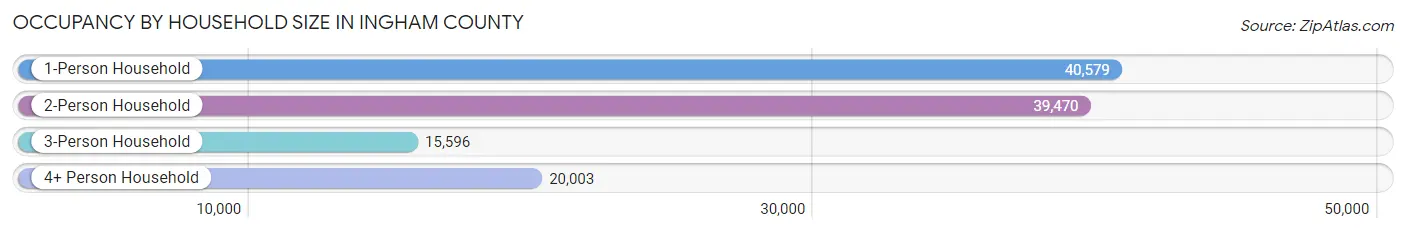
| Household Size | # Housing Units | % Housing Units |
| 1-Person Household | 40,579 | 35.1% |
| 2-Person Household | 39,470 | 34.1% |
| 3-Person Household | 15,596 | 13.5% |
| 4+ Person Household | 20,003 | 17.3% |
| Total Housing Units | 115,648 | 100.0% |
Occupancy by Ownership by Household Size in Ingham County
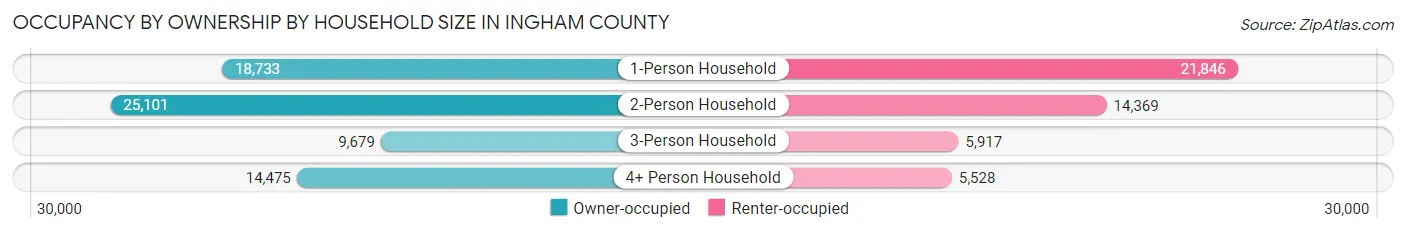
| Household Size | Owner-occupied | Renter-occupied |
| 1-Person Household | 18,733 (46.2%) | 21,846 (53.8%) |
| 2-Person Household | 25,101 (63.6%) | 14,369 (36.4%) |
| 3-Person Household | 9,679 (62.1%) | 5,917 (37.9%) |
| 4+ Person Household | 14,475 (72.4%) | 5,528 (27.6%) |
| Total Housing Units | 67,988 (58.8%) | 47,660 (41.2%) |
Occupancy by Educational Attainment in Ingham County
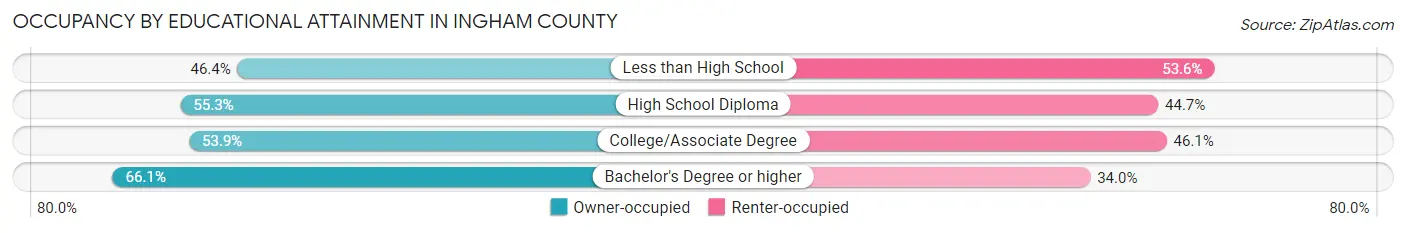
| Household Size | Owner-occupied | Renter-occupied |
| Less than High School | 3,040 (46.4%) | 3,514 (53.6%) |
| High School Diploma | 11,800 (55.3%) | 9,546 (44.7%) |
| College/Associate Degree | 21,409 (53.9%) | 18,287 (46.1%) |
| Bachelor's Degree or higher | 31,739 (66.0%) | 16,313 (34.0%) |
Occupancy by Age of Householder in Ingham County
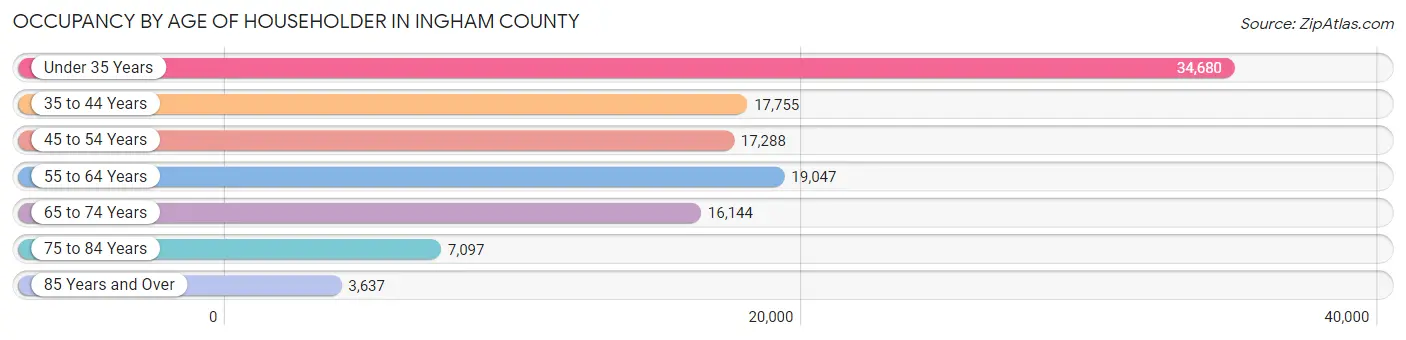
| Age Bracket | # Households | % Households |
| Under 35 Years | 34,680 | 30.0% |
| 35 to 44 Years | 17,755 | 15.3% |
| 45 to 54 Years | 17,288 | 14.9% |
| 55 to 64 Years | 19,047 | 16.5% |
| 65 to 74 Years | 16,144 | 14.0% |
| 75 to 84 Years | 7,097 | 6.1% |
| 85 Years and Over | 3,637 | 3.1% |
| Total | 115,648 | 100.0% |
Housing Finances in Ingham County
Median Income by Occupancy in Ingham County
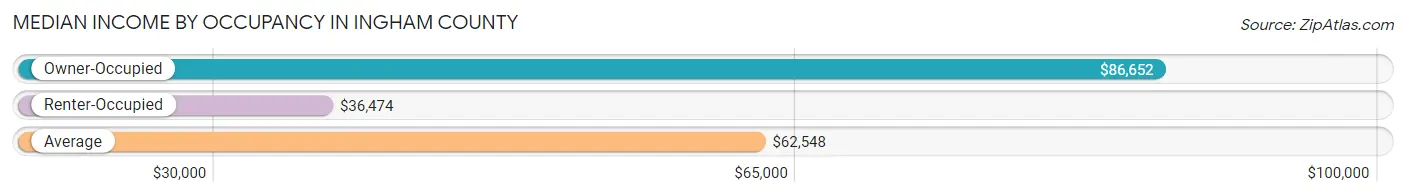
| Occupancy Type | # Households | Median Income |
| Owner-Occupied | 67,988 (58.8%) | $86,652 |
| Renter-Occupied | 47,660 (41.2%) | $36,474 |
| Average | 115,648 (100.0%) | $62,548 |
Occupancy by Householder Income Bracket in Ingham County
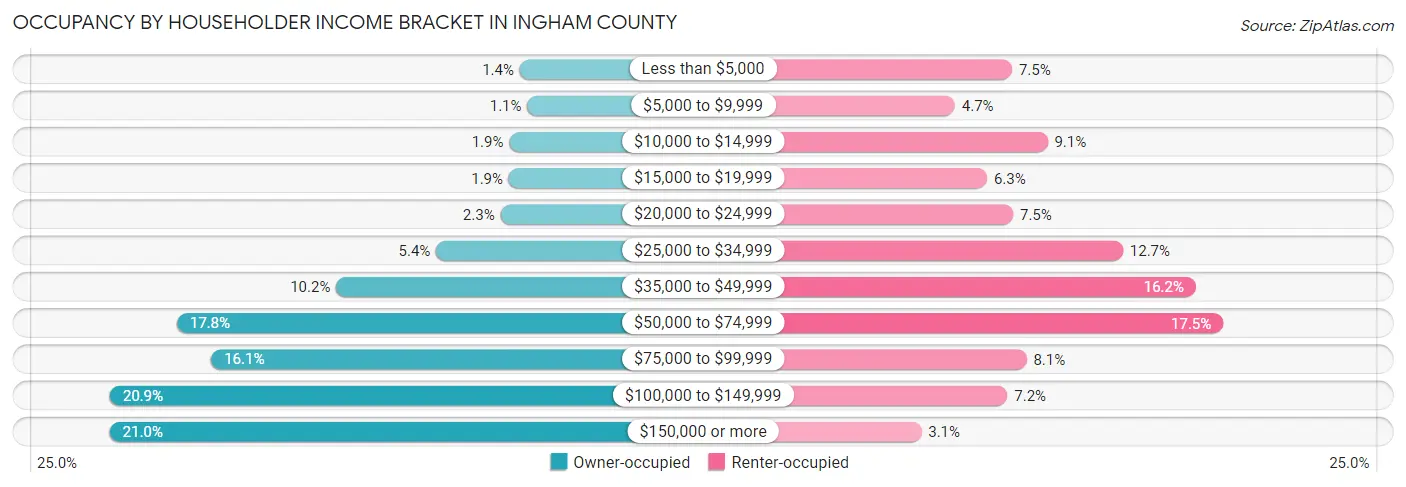
| Income Bracket | Owner-occupied | Renter-occupied |
| Less than $5,000 | 968 (1.4%) | 3,551 (7.4%) |
| $5,000 to $9,999 | 724 (1.1%) | 2,255 (4.7%) |
| $10,000 to $14,999 | 1,307 (1.9%) | 4,358 (9.1%) |
| $15,000 to $19,999 | 1,320 (1.9%) | 2,982 (6.3%) |
| $20,000 to $24,999 | 1,589 (2.3%) | 3,575 (7.5%) |
| $25,000 to $34,999 | 3,673 (5.4%) | 6,067 (12.7%) |
| $35,000 to $49,999 | 6,910 (10.2%) | 7,720 (16.2%) |
| $50,000 to $74,999 | 12,065 (17.7%) | 8,340 (17.5%) |
| $75,000 to $99,999 | 10,952 (16.1%) | 3,878 (8.1%) |
| $100,000 to $149,999 | 14,237 (20.9%) | 3,444 (7.2%) |
| $150,000 or more | 14,243 (20.9%) | 1,490 (3.1%) |
| Total | 67,988 (100.0%) | 47,660 (100.0%) |
Monthly Housing Cost Tiers in Ingham County
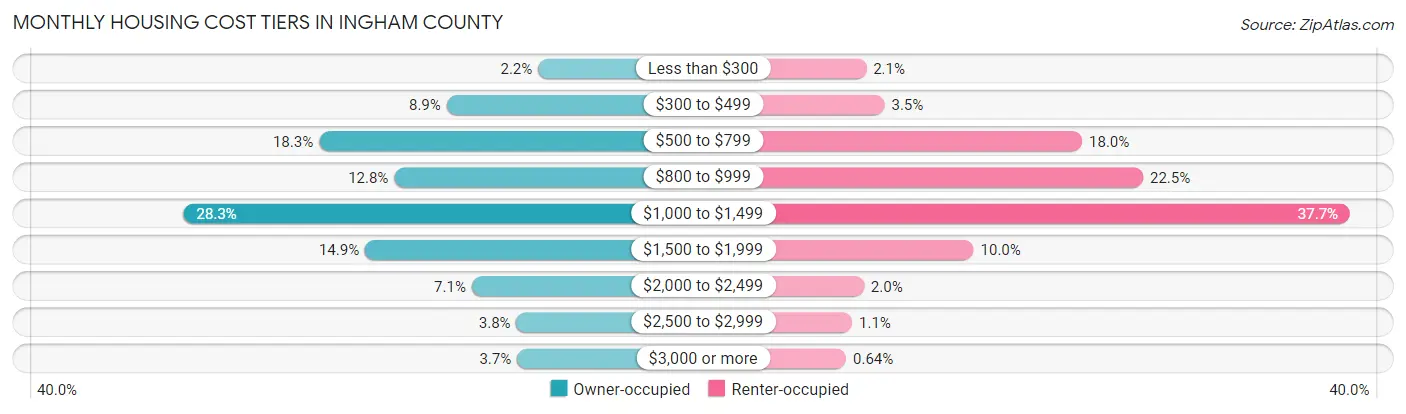
| Monthly Cost | Owner-occupied | Renter-occupied |
| Less than $300 | 1,484 (2.2%) | 1,009 (2.1%) |
| $300 to $499 | 6,063 (8.9%) | 1,654 (3.5%) |
| $500 to $799 | 12,453 (18.3%) | 8,589 (18.0%) |
| $800 to $999 | 8,690 (12.8%) | 10,727 (22.5%) |
| $1,000 to $1,499 | 19,240 (28.3%) | 17,987 (37.7%) |
| $1,500 to $1,999 | 10,149 (14.9%) | 4,780 (10.0%) |
| $2,000 to $2,499 | 4,806 (7.1%) | 929 (1.9%) |
| $2,500 to $2,999 | 2,567 (3.8%) | 515 (1.1%) |
| $3,000 or more | 2,536 (3.7%) | 305 (0.6%) |
| Total | 67,988 (100.0%) | 47,660 (100.0%) |
Physical Housing Characteristics in Ingham County
Housing Structures in Ingham County
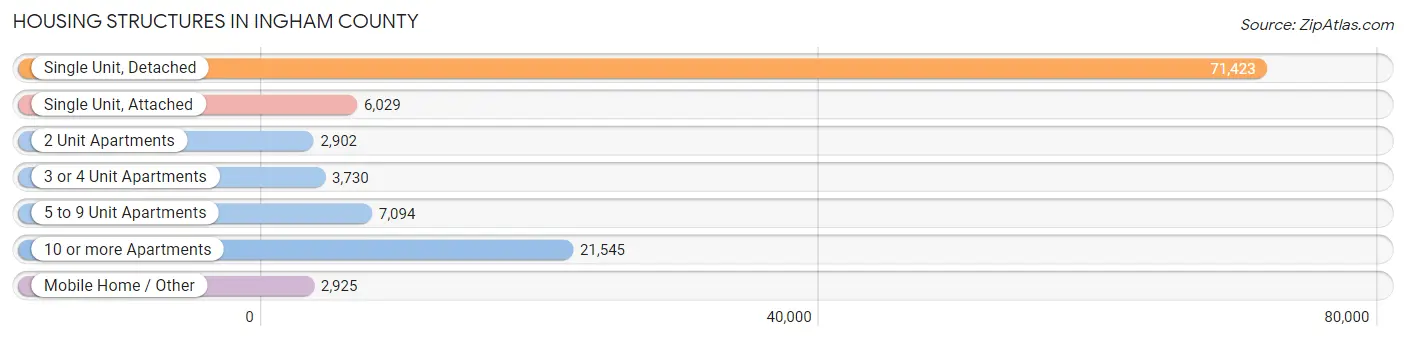
| Structure Type | # Housing Units | % Housing Units |
| Single Unit, Detached | 71,423 | 61.8% |
| Single Unit, Attached | 6,029 | 5.2% |
| 2 Unit Apartments | 2,902 | 2.5% |
| 3 or 4 Unit Apartments | 3,730 | 3.2% |
| 5 to 9 Unit Apartments | 7,094 | 6.1% |
| 10 or more Apartments | 21,545 | 18.6% |
| Mobile Home / Other | 2,925 | 2.5% |
| Total | 115,648 | 100.0% |
Housing Structures by Occupancy in Ingham County
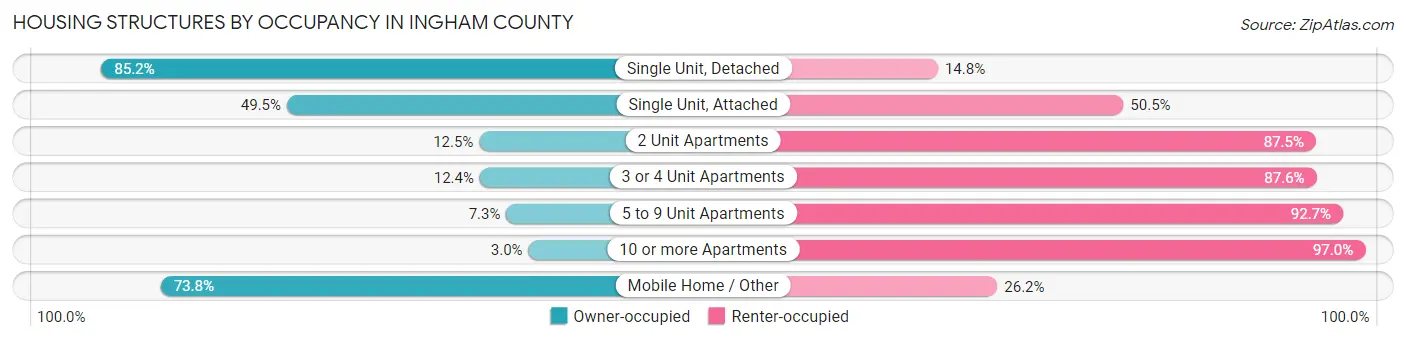
| Structure Type | Owner-occupied | Renter-occupied |
| Single Unit, Detached | 60,860 (85.2%) | 10,563 (14.8%) |
| Single Unit, Attached | 2,985 (49.5%) | 3,044 (50.5%) |
| 2 Unit Apartments | 362 (12.5%) | 2,540 (87.5%) |
| 3 or 4 Unit Apartments | 461 (12.4%) | 3,269 (87.6%) |
| 5 to 9 Unit Apartments | 515 (7.3%) | 6,579 (92.7%) |
| 10 or more Apartments | 647 (3.0%) | 20,898 (97.0%) |
| Mobile Home / Other | 2,158 (73.8%) | 767 (26.2%) |
| Total | 67,988 (58.8%) | 47,660 (41.2%) |
Housing Structures by Number of Rooms in Ingham County
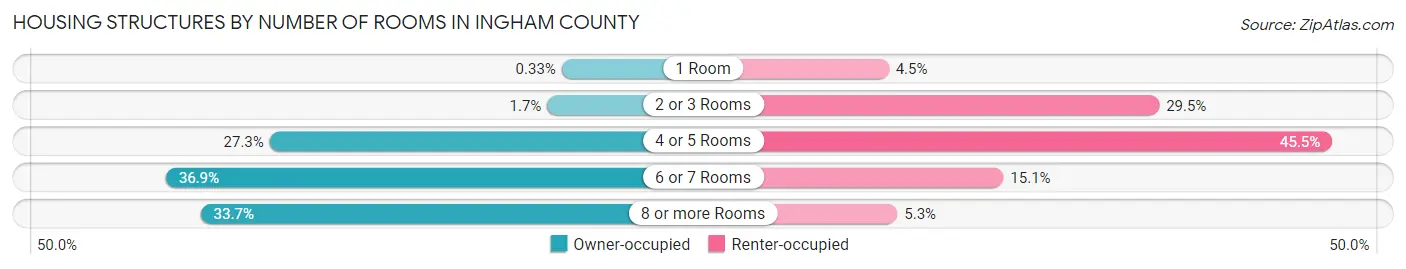
| Number of Rooms | Owner-occupied | Renter-occupied |
| 1 Room | 226 (0.3%) | 2,150 (4.5%) |
| 2 or 3 Rooms | 1,134 (1.7%) | 14,076 (29.5%) |
| 4 or 5 Rooms | 18,588 (27.3%) | 21,697 (45.5%) |
| 6 or 7 Rooms | 25,116 (36.9%) | 7,206 (15.1%) |
| 8 or more Rooms | 22,924 (33.7%) | 2,531 (5.3%) |
| Total | 67,988 (100.0%) | 47,660 (100.0%) |
Housing Structure by Heating Type in Ingham County
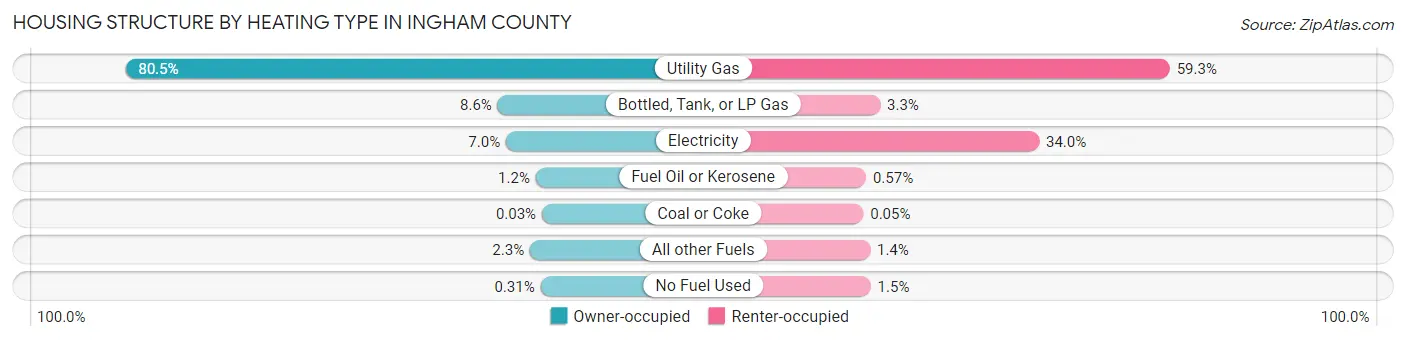
| Heating Type | Owner-occupied | Renter-occupied |
| Utility Gas | 54,752 (80.5%) | 28,241 (59.3%) |
| Bottled, Tank, or LP Gas | 5,831 (8.6%) | 1,571 (3.3%) |
| Electricity | 4,748 (7.0%) | 16,209 (34.0%) |
| Fuel Oil or Kerosene | 834 (1.2%) | 273 (0.6%) |
| Coal or Coke | 21 (0.0%) | 24 (0.1%) |
| All other Fuels | 1,594 (2.3%) | 643 (1.3%) |
| No Fuel Used | 208 (0.3%) | 699 (1.5%) |
| Total | 67,988 (100.0%) | 47,660 (100.0%) |
Household Vehicle Usage in Ingham County
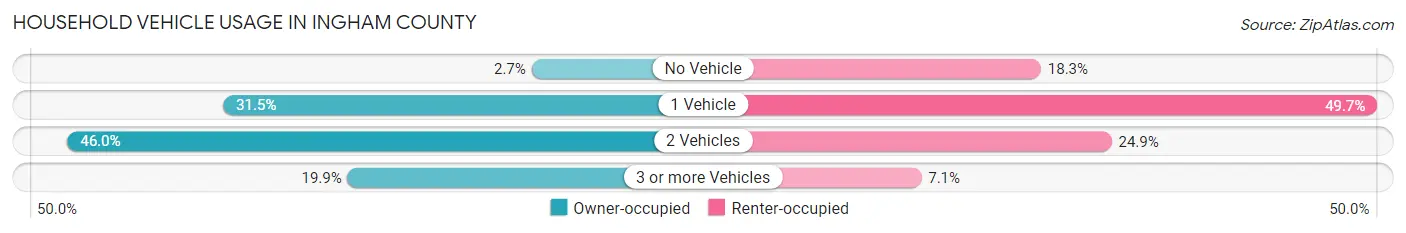
| Vehicles per Household | Owner-occupied | Renter-occupied |
| No Vehicle | 1,818 (2.7%) | 8,718 (18.3%) |
| 1 Vehicle | 21,397 (31.5%) | 23,680 (49.7%) |
| 2 Vehicles | 31,279 (46.0%) | 11,862 (24.9%) |
| 3 or more Vehicles | 13,494 (19.9%) | 3,400 (7.1%) |
| Total | 67,988 (100.0%) | 47,660 (100.0%) |
Real Estate & Mortgages in Ingham County
Real Estate and Mortgage Overview in Ingham County
| Characteristic | Without Mortgage | With Mortgage |
| Housing Units | 24,642 | 43,346 |
| Median Property Value | $160,600 | $181,300 |
| Median Household Income | $70,481 | $10,006 |
| Monthly Housing Costs | $635 | $2,489 |
| Real Estate Taxes | $3,133 | $1,168 |
Property Value by Mortgage Status in Ingham County
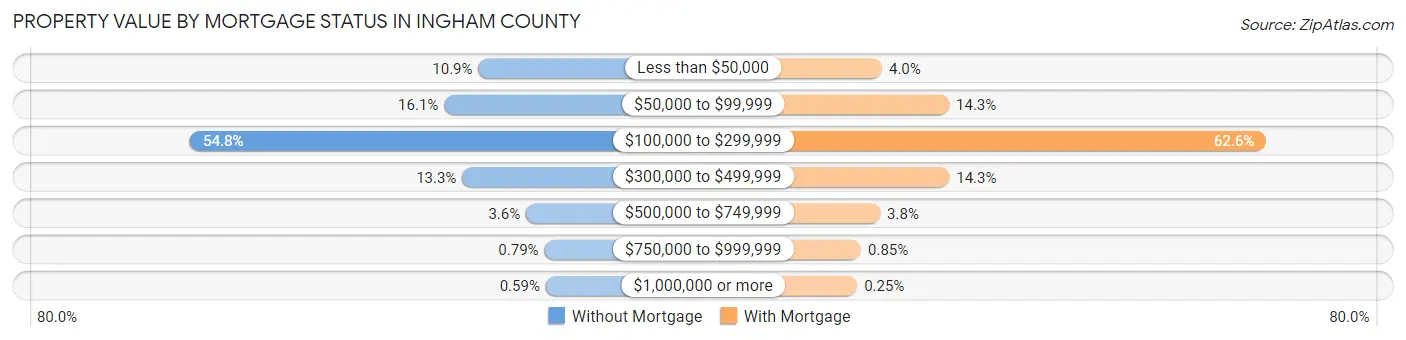
| Property Value | Without Mortgage | With Mortgage |
| Less than $50,000 | 2,677 (10.9%) | 1,751 (4.0%) |
| $50,000 to $99,999 | 3,961 (16.1%) | 6,182 (14.3%) |
| $100,000 to $299,999 | 13,496 (54.8%) | 27,118 (62.6%) |
| $300,000 to $499,999 | 3,283 (13.3%) | 6,192 (14.3%) |
| $500,000 to $749,999 | 885 (3.6%) | 1,625 (3.7%) |
| $750,000 to $999,999 | 195 (0.8%) | 369 (0.9%) |
| $1,000,000 or more | 145 (0.6%) | 109 (0.3%) |
| Total | 24,642 (100.0%) | 43,346 (100.0%) |
Household Income by Mortgage Status in Ingham County
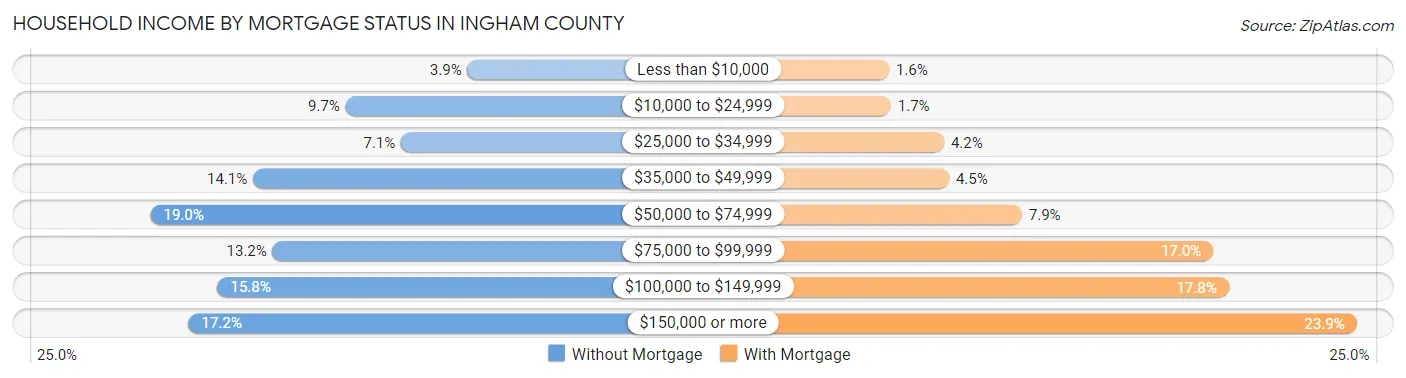
| Household Income | Without Mortgage | With Mortgage |
| Less than $10,000 | 964 (3.9%) | 691 (1.6%) |
| $10,000 to $24,999 | 2,392 (9.7%) | 728 (1.7%) |
| $25,000 to $34,999 | 1,743 (7.1%) | 1,824 (4.2%) |
| $35,000 to $49,999 | 3,479 (14.1%) | 1,930 (4.4%) |
| $50,000 to $74,999 | 4,682 (19.0%) | 3,431 (7.9%) |
| $75,000 to $99,999 | 3,250 (13.2%) | 7,383 (17.0%) |
| $100,000 to $149,999 | 3,895 (15.8%) | 7,702 (17.8%) |
| $150,000 or more | 4,237 (17.2%) | 10,342 (23.9%) |
| Total | 24,642 (100.0%) | 43,346 (100.0%) |
Property Value to Household Income Ratio in Ingham County
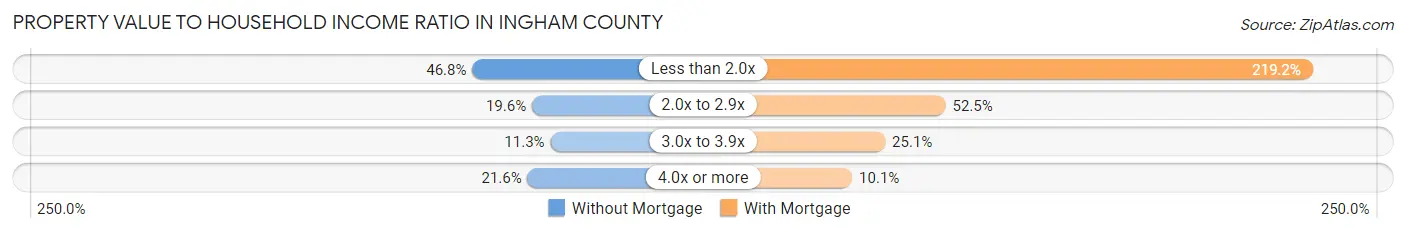
| Value-to-Income Ratio | Without Mortgage | With Mortgage |
| Less than 2.0x | 11,520 (46.8%) | 95,026 (219.2%) |
| 2.0x to 2.9x | 4,838 (19.6%) | 22,757 (52.5%) |
| 3.0x to 3.9x | 2,778 (11.3%) | 10,873 (25.1%) |
| 4.0x or more | 5,332 (21.6%) | 4,378 (10.1%) |
| Total | 24,642 (100.0%) | 43,346 (100.0%) |
Real Estate Taxes by Mortgage Status in Ingham County
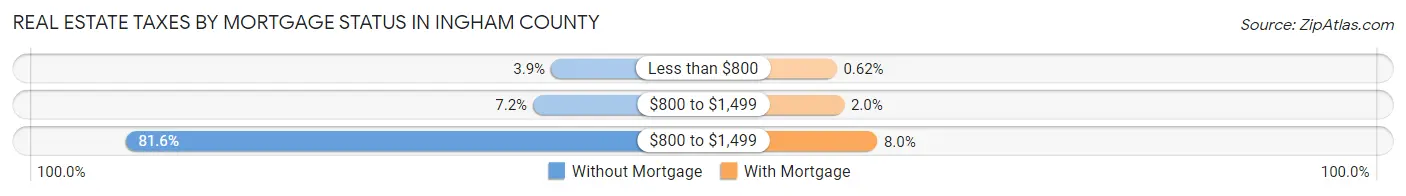
| Property Taxes | Without Mortgage | With Mortgage |
| Less than $800 | 952 (3.9%) | 269 (0.6%) |
| $800 to $1,499 | 1,763 (7.1%) | 869 (2.0%) |
| $800 to $1,499 | 20,101 (81.6%) | 3,476 (8.0%) |
| Total | 24,642 (100.0%) | 43,346 (100.0%) |
Health & Disability in Ingham County
Health Insurance Coverage by Age in Ingham County
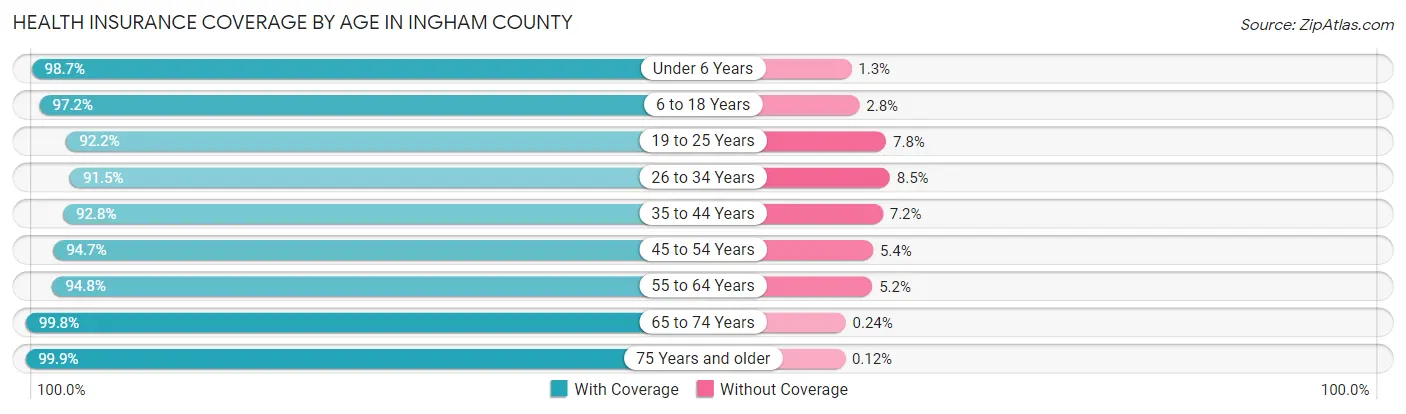
| Age Bracket | With Coverage | Without Coverage |
| Under 6 Years | 18,170 (98.7%) | 242 (1.3%) |
| 6 to 18 Years | 42,780 (97.2%) | 1,236 (2.8%) |
| 19 to 25 Years | 46,667 (92.2%) | 3,941 (7.8%) |
| 26 to 34 Years | 32,104 (91.5%) | 2,984 (8.5%) |
| 35 to 44 Years | 30,088 (92.8%) | 2,329 (7.2%) |
| 45 to 54 Years | 27,994 (94.7%) | 1,581 (5.3%) |
| 55 to 64 Years | 29,712 (94.8%) | 1,634 (5.2%) |
| 65 to 74 Years | 24,643 (99.8%) | 59 (0.2%) |
| 75 Years and older | 14,694 (99.9%) | 18 (0.1%) |
| Total | 266,852 (95.0%) | 14,024 (5.0%) |
Health Insurance Coverage by Citizenship Status in Ingham County
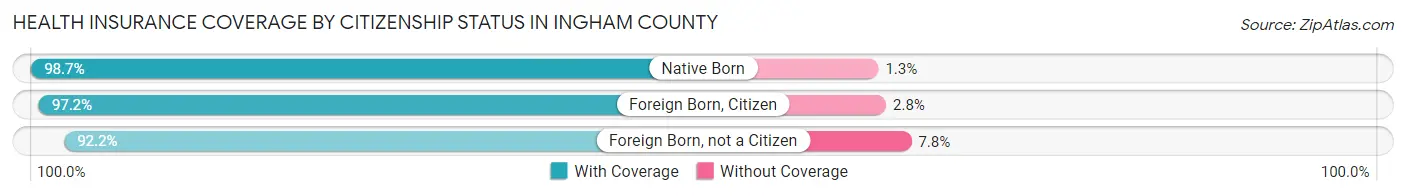
| Citizenship Status | With Coverage | Without Coverage |
| Native Born | 18,170 (98.7%) | 242 (1.3%) |
| Foreign Born, Citizen | 42,780 (97.2%) | 1,236 (2.8%) |
| Foreign Born, not a Citizen | 46,667 (92.2%) | 3,941 (7.8%) |
Health Insurance Coverage by Household Income in Ingham County
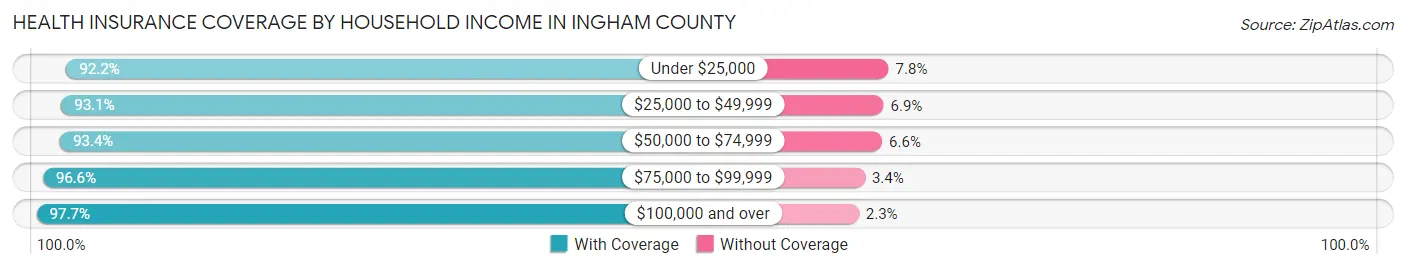
| Household Income | With Coverage | Without Coverage |
| Under $25,000 | 33,893 (92.2%) | 2,884 (7.8%) |
| $25,000 to $49,999 | 45,314 (93.1%) | 3,353 (6.9%) |
| $50,000 to $74,999 | 41,814 (93.4%) | 2,967 (6.6%) |
| $75,000 to $99,999 | 35,841 (96.6%) | 1,264 (3.4%) |
| $100,000 and over | 95,708 (97.7%) | 2,214 (2.3%) |
Public vs Private Health Insurance Coverage by Age in Ingham County
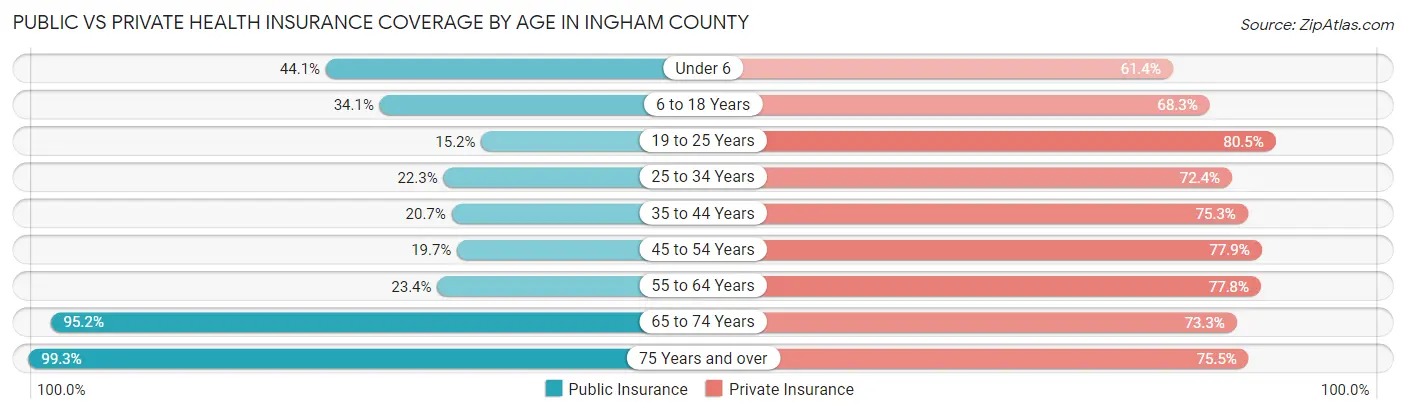
| Age Bracket | Public Insurance | Private Insurance |
| Under 6 | 8,114 (44.1%) | 11,310 (61.4%) |
| 6 to 18 Years | 15,001 (34.1%) | 30,051 (68.3%) |
| 19 to 25 Years | 7,705 (15.2%) | 40,750 (80.5%) |
| 25 to 34 Years | 7,806 (22.3%) | 25,406 (72.4%) |
| 35 to 44 Years | 6,723 (20.7%) | 24,421 (75.3%) |
| 45 to 54 Years | 5,825 (19.7%) | 23,041 (77.9%) |
| 55 to 64 Years | 7,329 (23.4%) | 24,381 (77.8%) |
| 65 to 74 Years | 23,513 (95.2%) | 18,105 (73.3%) |
| 75 Years and over | 14,609 (99.3%) | 11,111 (75.5%) |
| Total | 96,625 (34.4%) | 208,576 (74.3%) |
Disability Status by Sex by Age in Ingham County
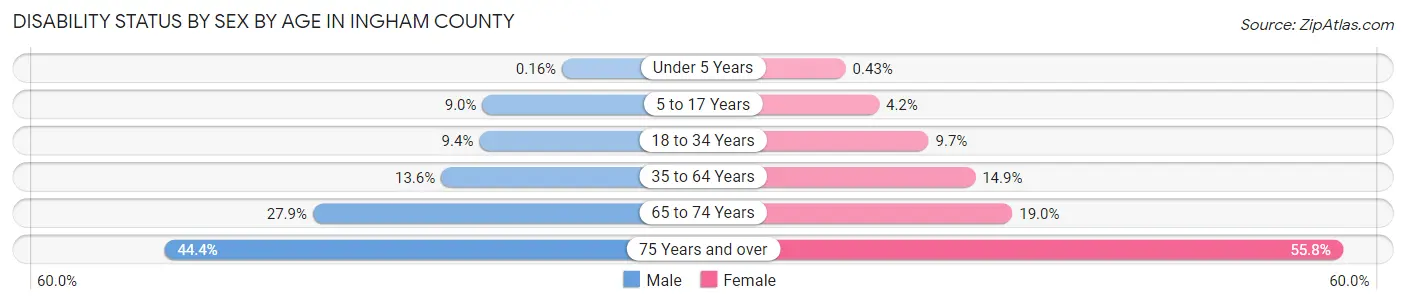
| Age Bracket | Male | Female |
| Under 5 Years | 12 (0.2%) | 32 (0.4%) |
| 5 to 17 Years | 1,857 (9.0%) | 815 (4.2%) |
| 18 to 34 Years | 4,333 (9.4%) | 4,498 (9.7%) |
| 35 to 64 Years | 6,212 (13.6%) | 7,088 (14.9%) |
| 65 to 74 Years | 3,191 (27.9%) | 2,518 (19.0%) |
| 75 Years and over | 2,673 (44.4%) | 4,848 (55.8%) |
Disability Class by Sex by Age in Ingham County
Disability Class: Hearing Difficulty
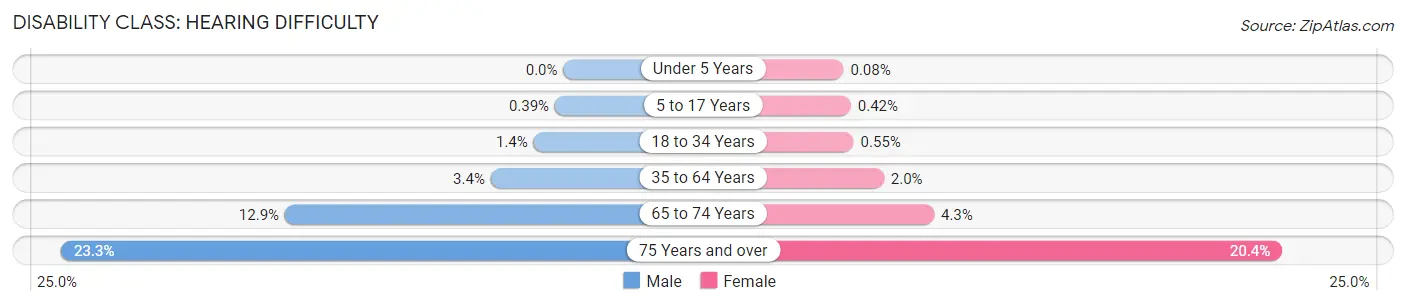
| Age Bracket | Male | Female |
| Under 5 Years | 0 (0.0%) | 6 (0.1%) |
| 5 to 17 Years | 80 (0.4%) | 83 (0.4%) |
| 18 to 34 Years | 637 (1.4%) | 258 (0.5%) |
| 35 to 64 Years | 1,539 (3.4%) | 930 (1.9%) |
| 65 to 74 Years | 1,478 (12.9%) | 568 (4.3%) |
| 75 Years and over | 1,403 (23.3%) | 1,776 (20.4%) |
Disability Class: Vision Difficulty
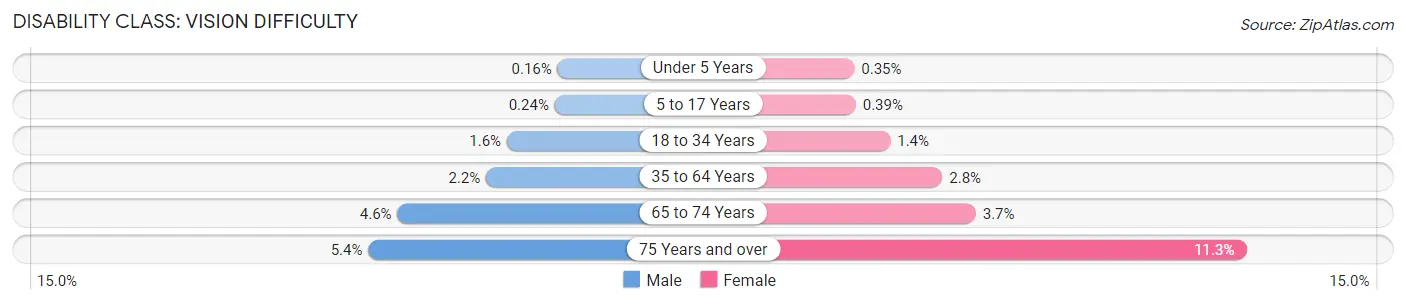
| Age Bracket | Male | Female |
| Under 5 Years | 12 (0.2%) | 26 (0.4%) |
| 5 to 17 Years | 49 (0.2%) | 76 (0.4%) |
| 18 to 34 Years | 725 (1.6%) | 627 (1.3%) |
| 35 to 64 Years | 983 (2.1%) | 1,336 (2.8%) |
| 65 to 74 Years | 529 (4.6%) | 495 (3.7%) |
| 75 Years and over | 327 (5.4%) | 979 (11.3%) |
Disability Class: Cognitive Difficulty
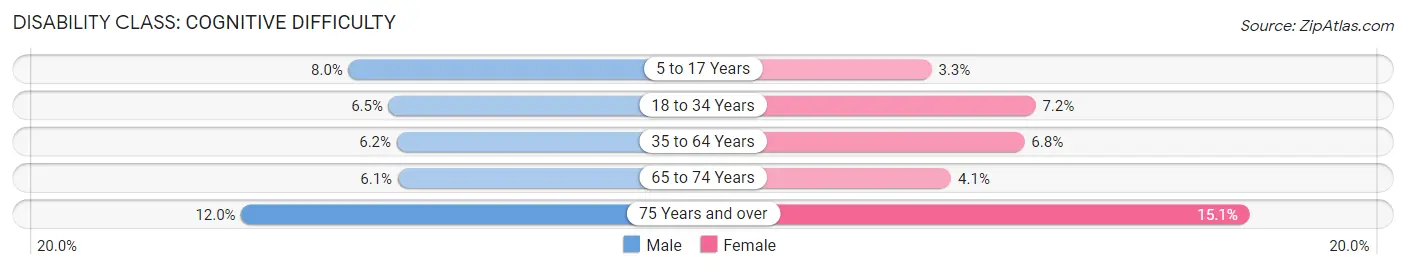
| Age Bracket | Male | Female |
| 5 to 17 Years | 1,641 (8.0%) | 654 (3.3%) |
| 18 to 34 Years | 2,997 (6.5%) | 3,344 (7.2%) |
| 35 to 64 Years | 2,818 (6.2%) | 3,233 (6.8%) |
| 65 to 74 Years | 702 (6.1%) | 538 (4.1%) |
| 75 Years and over | 719 (11.9%) | 1,316 (15.1%) |
Disability Class: Ambulatory Difficulty
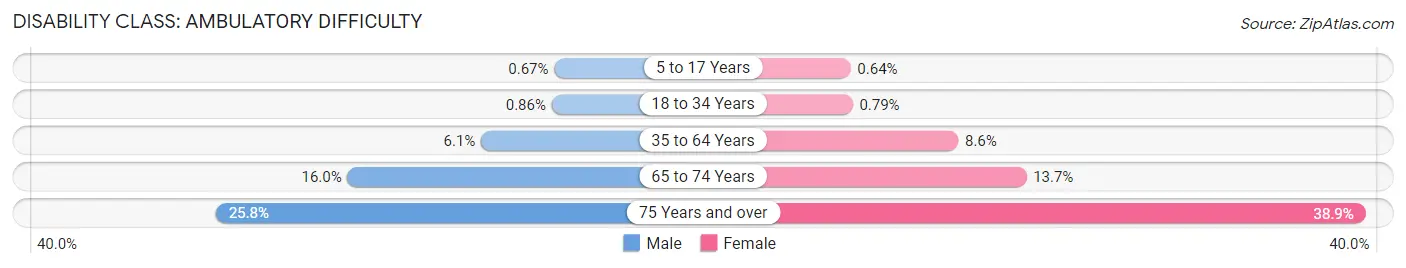
| Age Bracket | Male | Female |
| 5 to 17 Years | 137 (0.7%) | 126 (0.6%) |
| 18 to 34 Years | 400 (0.9%) | 366 (0.8%) |
| 35 to 64 Years | 2,782 (6.1%) | 4,119 (8.6%) |
| 65 to 74 Years | 1,833 (16.0%) | 1,816 (13.7%) |
| 75 Years and over | 1,553 (25.8%) | 3,381 (38.9%) |
Disability Class: Self-Care Difficulty
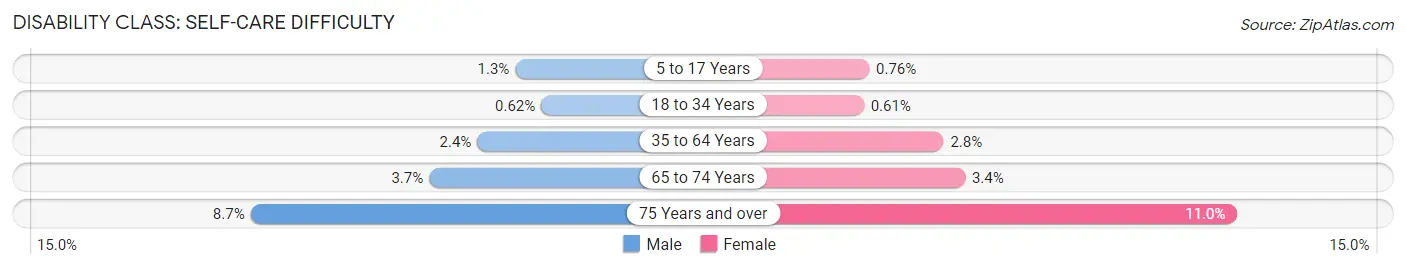
| Age Bracket | Male | Female |
| 5 to 17 Years | 277 (1.3%) | 150 (0.8%) |
| 18 to 34 Years | 289 (0.6%) | 286 (0.6%) |
| 35 to 64 Years | 1,095 (2.4%) | 1,350 (2.8%) |
| 65 to 74 Years | 428 (3.7%) | 455 (3.4%) |
| 75 Years and over | 524 (8.7%) | 957 (11.0%) |
Technology Access in Ingham County
Computing Device Access in Ingham County
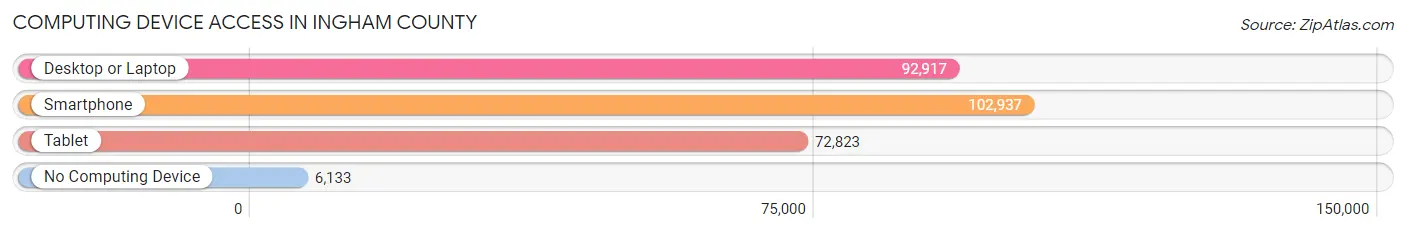
| Device Type | # Households | % Households |
| Desktop or Laptop | 92,917 | 80.3% |
| Smartphone | 102,937 | 89.0% |
| Tablet | 72,823 | 63.0% |
| No Computing Device | 6,133 | 5.3% |
| Total | 115,648 | 100.0% |
Internet Access in Ingham County
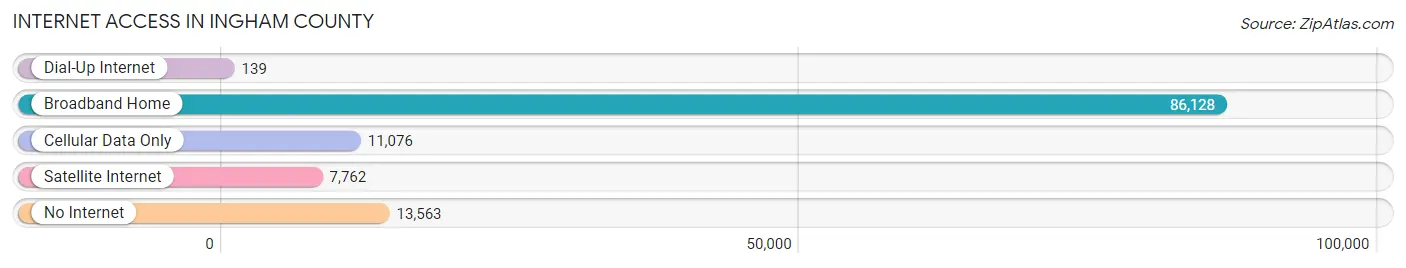
| Internet Type | # Households | % Households |
| Dial-Up Internet | 139 | 0.1% |
| Broadband Home | 86,128 | 74.5% |
| Cellular Data Only | 11,076 | 9.6% |
| Satellite Internet | 7,762 | 6.7% |
| No Internet | 13,563 | 11.7% |
| Total | 115,648 | 100.0% |
Ingham County Summary
Ingham County is located in the south-central region of Michigan, and is part of the Lansing-East Lansing Metropolitan Statistical Area. The county seat is Mason, and the county is named after Samuel D. Ingham, the Secretary of the Treasury under President Andrew Jackson. Ingham County is home to a population of 280,895 people, as of the 2010 census.
Geography
Ingham County is located in the south-central region of Michigan, and is bordered by Clinton County to the north, Eaton County to the east, Jackson County to the south, and Shiawassee County to the west. The county covers an area of 577 square miles, and is home to a variety of terrain, including rolling hills, forests, and wetlands. The county is home to several rivers, including the Grand River, the Red Cedar River, and the Sycamore Creek. The county is also home to several lakes, including Lake Lansing, Lake Ovid, and Lake Wamplers.
The county is home to several cities and towns, including the cities of Lansing, East Lansing, Mason, Williamston, and Leslie, as well as the townships of Delhi, Ingham, Lansing, Meridian, and Vevay. The county is also home to several unincorporated communities, including Dansville, Edgemont Park, and Webberville.
History
Ingham County was established in 1829, and was named after Samuel D. Ingham, the Secretary of the Treasury under President Andrew Jackson. The county was originally part of the Michigan Territory, and was later part of the Michigan Territory when it was established in 1805. The county was initially divided into two townships, Lansing and Meridian, and was later divided into several other townships.
In the early 19th century, the county was home to several Native American tribes, including the Ojibwe, Ottawa, and Potawatomi. The county was also home to several early settlers, including the Lansing family, who founded the city of Lansing in 1836.
In the late 19th century, the county was home to several industries, including lumber, paper, and furniture manufacturing. The county was also home to several railroads, which helped to spur economic growth in the area.
Economy
Ingham County is home to a diverse economy, with a variety of industries, including manufacturing, healthcare, education, and government. The county is home to several major employers, including Michigan State University, Sparrow Health System, and the State of Michigan.
The county is also home to several major industries, including automotive, aerospace, and defense. The county is home to several automotive suppliers, including Delphi, Lear, and Magna. The county is also home to several aerospace and defense companies, including General Dynamics, Lockheed Martin, and Northrop Grumman.
Demographics
As of the 2010 census, Ingham County had a population of 280,895 people. The population was spread out, with 24.3% under the age of 18, 11.3% from 18 to 24, 28.2% from 25 to 44, 22.7% from 45 to 64, and 13.5% who were 65 years of age or older. The median age was 35.7 years.
The racial makeup of the county was 79.2% White, 11.7% African American, 0.5% Native American, 3.2% Asian, 0.1% Pacific Islander, 2.2% from other races, and 3.1% from two or more races. Hispanic or Latino of any race were 5.2% of the population.
In terms of education, the county had a high school graduation rate of 87.2%, and a bachelor's degree or higher rate of 33.2%. The median household income was $50,867, and the median family income was $63,945. The poverty rate was 15.2%.
Common Questions
What is the Total Population of Ingham County?
Total Population of Ingham County is 282,540.
What is the Total Male Population of Ingham County?
Total Male Population of Ingham County is 138,535.
What is the Total Female Population of Ingham County?
Total Female Population of Ingham County is 144,005.
What is the Ratio of Males per 100 Females in Ingham County?
There are 96.20 Males per 100 Females in Ingham County.
What is the Ratio of Females per 100 Males in Ingham County?
There are 103.95 Females per 100 Males in Ingham County.
What is the Median Population Age in Ingham County?
Median Population Age in Ingham County is 33.0 Years.
What is the Average Family Size in Ingham County
Average Family Size in Ingham County is 3.0 People.
What is the Average Household Size in Ingham County
Average Household Size in Ingham County is 2.3 People.
What is Per Capita Income in Ingham County?
Per Capita income in Ingham County is $36,077.
What is the Median Family Income in Ingham County?
Median Family Income in Ingham County is $88,320.
What is the Median Household income in Ingham County?
Median Household Income in Ingham County is $62,548.
What is Income or Wage Gap in Ingham County?
Income or Wage Gap in Ingham County is 30.3%.
Women in Ingham County earn 69.7 cents for every dollar earned by a man.
What is Family Income Deficit in Ingham County?
Family Income Deficit in Ingham County is $9,980.
Families that are below poverty line in Ingham County earn $9,980 less on average than the poverty threshold level.
What is Inequality or Gini Index in Ingham County?
Inequality or Gini Index in Ingham County is 0.48.
How Large is the Labor Force in Ingham County?
There are 150,953 People in the Labor Forcein in Ingham County.
What is the Percentage of People in the Labor Force in Ingham County?
64.6% of People are in the Labor Force in Ingham County.
What is the Unemployment Rate in Ingham County?
Unemployment Rate in Ingham County is 6.4%.