Gogebic County, MI
Gogebic County Map
Gogebic County Overview
14,597
TOTAL POPULATION
7,649
MALE POPULATION
6,948
FEMALE POPULATION
110.09
MALES / 100 FEMALES
90.84
FEMALES / 100 MALES
50.6
MEDIAN AGE
2.7
AVG FAMILY SIZE
2.0
AVG HOUSEHOLD SIZE
$33,516
PER CAPITA INCOME
$67,215
AVG FAMILY INCOME
$47,913
AVG HOUSEHOLD INCOME
29.6%
WAGE / INCOME GAP [ % ]
70.4¢/ $1
WAGE / INCOME GAP [ $ ]
$9,075
FAMILY INCOME DEFICIT
0.48
INEQUALITY / GINI INDEX
6,482
LABOR FORCE [ PEOPLE ]
51.9%
PERCENT IN LABOR FORCE
6.0%
UNEMPLOYMENT RATE
Gogebic County Area Codes
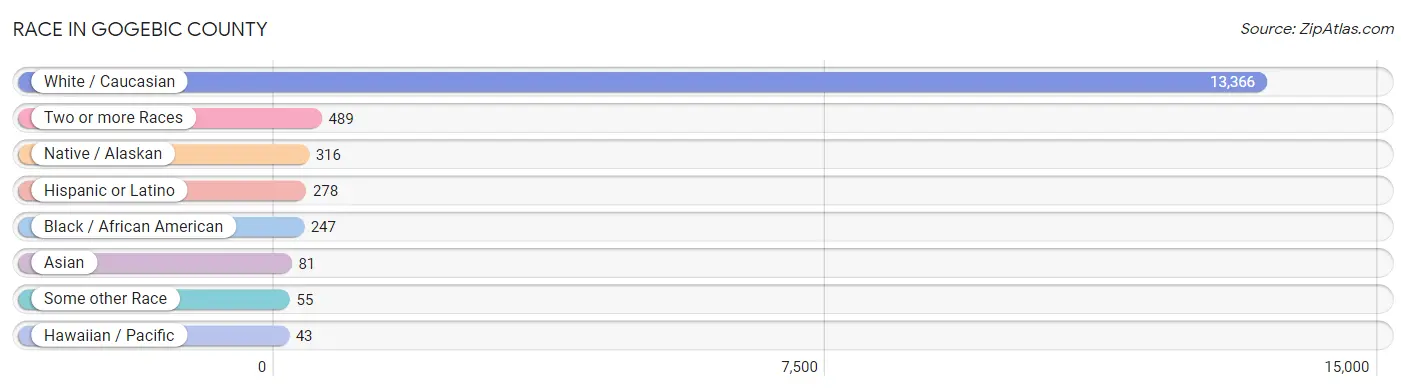
Race in Gogebic County
The most populous races in Gogebic County are White / Caucasian (13,366 | 91.6%), Two or more Races (489 | 3.4%), and Native / Alaskan (316 | 2.2%).
| Race | # Population | % Population |
| Asian | 81 | 0.5% |
| Black / African American | 247 | 1.7% |
| Hawaiian / Pacific | 43 | 0.3% |
| Hispanic or Latino | 278 | 1.9% |
| Native / Alaskan | 316 | 2.2% |
| White / Caucasian | 13,366 | 91.6% |
| Two or more Races | 489 | 3.4% |
| Some other Race | 55 | 0.4% |
| Total | 14,597 | 100.0% |
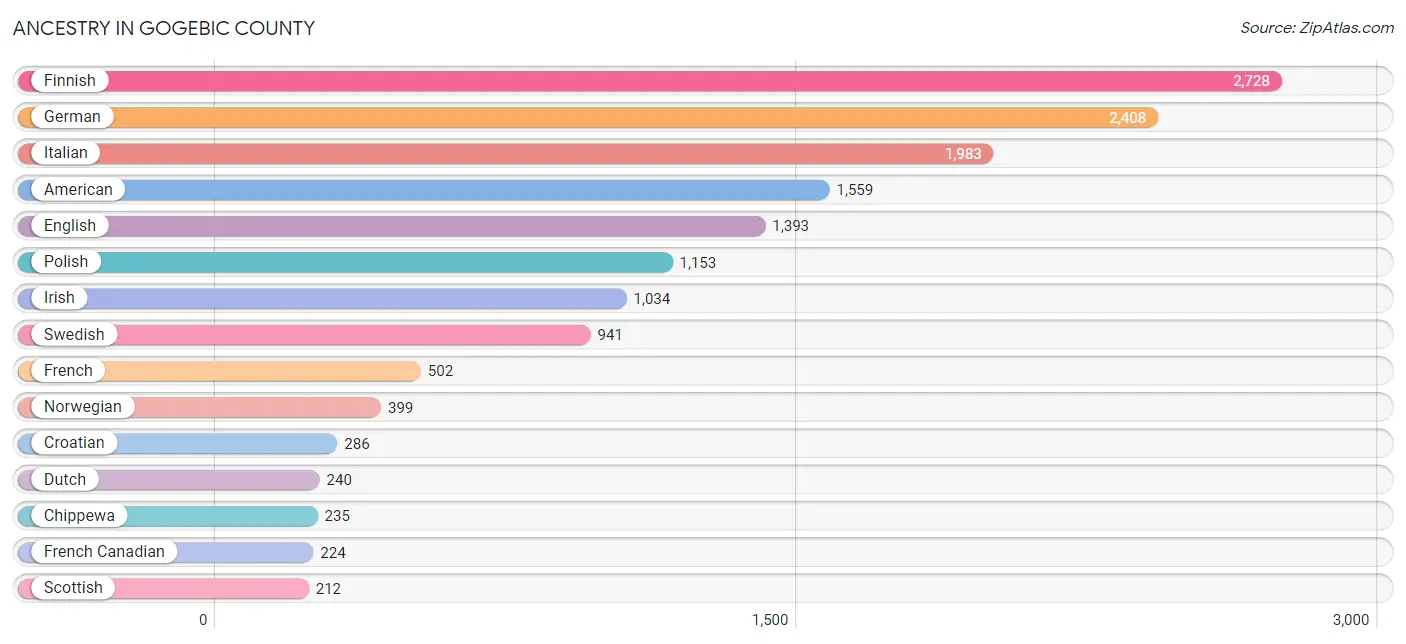
Ancestry in Gogebic County
The most populous ancestries reported in Gogebic County are Finnish (2,728 | 18.7%), German (2,408 | 16.5%), Italian (1,983 | 13.6%), American (1,559 | 10.7%), and English (1,393 | 9.5%), together accounting for 69.0% of all Gogebic County residents.
| Ancestry | # Population | % Population |
| American | 1,559 | 10.7% |
| Armenian | 4 | 0.0% |
| Austrian | 68 | 0.5% |
| Belgian | 66 | 0.4% |
| Bhutanese | 1 | 0.0% |
| Bolivian | 22 | 0.2% |
| British | 22 | 0.2% |
| Bulgarian | 4 | 0.0% |
| Burmese | 17 | 0.1% |
| Central American | 9 | 0.1% |
| Cherokee | 30 | 0.2% |
| Chippewa | 235 | 1.6% |
| Comanche | 6 | 0.0% |
| Cree | 15 | 0.1% |
| Creek | 10 | 0.1% |
| Croatian | 286 | 2.0% |
| Cuban | 9 | 0.1% |
| Czech | 71 | 0.5% |
| Czechoslovakian | 94 | 0.6% |
| Danish | 102 | 0.7% |
| Dutch | 240 | 1.6% |
| Eastern European | 13 | 0.1% |
| English | 1,393 | 9.5% |
| European | 106 | 0.7% |
| Finnish | 2,728 | 18.7% |
| French | 502 | 3.4% |
| French Canadian | 224 | 1.5% |
| German | 2,408 | 16.5% |
| Greek | 19 | 0.1% |
| Guamanian / Chamorro | 1 | 0.0% |
| Guatemalan | 9 | 0.1% |
| Hungarian | 49 | 0.3% |
| Indian (Asian) | 9 | 0.1% |
| Irish | 1,034 | 7.1% |
| Iroquois | 30 | 0.2% |
| Italian | 1,983 | 13.6% |
| Jamaican | 23 | 0.2% |
| Korean | 11 | 0.1% |
| Lithuanian | 28 | 0.2% |
| Luxembourger | 8 | 0.1% |
| Mexican | 195 | 1.3% |
| Native Hawaiian | 39 | 0.3% |
| Northern European | 60 | 0.4% |
| Norwegian | 399 | 2.7% |
| Ottawa | 32 | 0.2% |
| Pennsylvania German | 34 | 0.2% |
| Polish | 1,153 | 7.9% |
| Puerto Rican | 26 | 0.2% |
| Romanian | 13 | 0.1% |
| Russian | 8 | 0.1% |
| Samoan | 9 | 0.1% |
| Scandinavian | 67 | 0.5% |
| Scotch-Irish | 169 | 1.2% |
| Scottish | 212 | 1.5% |
| Serbian | 76 | 0.5% |
| Slavic | 21 | 0.1% |
| Slovak | 115 | 0.8% |
| Slovene | 11 | 0.1% |
| South American | 22 | 0.2% |
| Spaniard | 7 | 0.1% |
| Spanish | 3 | 0.0% |
| Sri Lankan | 7 | 0.1% |
| Swedish | 941 | 6.5% |
| Swiss | 21 | 0.1% |
| Thai | 49 | 0.3% |
| Ukrainian | 17 | 0.1% |
| Welsh | 38 | 0.3% |
| Yugoslavian | 33 | 0.2% | View All 68 Rows |
Immigrants in Gogebic County
The most numerous immigrant groups reported in Gogebic County came from Europe (68 | 0.5%), Northern Europe (51 | 0.4%), Asia (49 | 0.3%), South Central Asia (22 | 0.2%), and Pakistan (17 | 0.1%), together accounting for 1.4% of all Gogebic County residents.

| Immigration Origin | # Population | % Population |
| Asia | 49 | 0.3% |
| Bolivia | 10 | 0.1% |
| Canada | 14 | 0.1% |
| Central America | 1 | 0.0% |
| China | 6 | 0.0% |
| Eastern Asia | 12 | 0.1% |
| Eastern Europe | 9 | 0.1% |
| England | 3 | 0.0% |
| Europe | 68 | 0.5% |
| France | 2 | 0.0% |
| Germany | 6 | 0.0% |
| Guatemala | 1 | 0.0% |
| India | 5 | 0.0% |
| Ireland | 12 | 0.1% |
| Japan | 1 | 0.0% |
| Korea | 5 | 0.0% |
| Latin America | 11 | 0.1% |
| Northern Europe | 51 | 0.4% |
| Pakistan | 17 | 0.1% |
| Philippines | 8 | 0.1% |
| Poland | 4 | 0.0% |
| Russia | 5 | 0.0% |
| South America | 10 | 0.1% |
| South Central Asia | 22 | 0.2% |
| South Eastern Asia | 15 | 0.1% |
| Sweden | 15 | 0.1% |
| Taiwan | 4 | 0.0% |
| Vietnam | 7 | 0.1% |
| Western Europe | 8 | 0.1% | View All 29 Rows |
Sex and Age in Gogebic County
Sex and Age in Gogebic County
The most populous age groups in Gogebic County are 65 to 69 Years (716 | 9.4%) for men and 55 to 59 Years (675 | 9.7%) for women.

| Age Bracket | Male | Female |
| Under 5 Years | 305 (4.0%) | 263 (3.8%) |
| 5 to 9 Years | 328 (4.3%) | 303 (4.4%) |
| 10 to 14 Years | 415 (5.4%) | 337 (4.9%) |
| 15 to 19 Years | 357 (4.7%) | 306 (4.4%) |
| 20 to 24 Years | 364 (4.8%) | 294 (4.2%) |
| 25 to 29 Years | 427 (5.6%) | 375 (5.4%) |
| 30 to 34 Years | 404 (5.3%) | 380 (5.5%) |
| 35 to 39 Years | 508 (6.6%) | 326 (4.7%) |
| 40 to 44 Years | 341 (4.5%) | 347 (5.0%) |
| 45 to 49 Years | 389 (5.1%) | 350 (5.0%) |
| 50 to 54 Years | 467 (6.1%) | 433 (6.2%) |
| 55 to 59 Years | 646 (8.5%) | 675 (9.7%) |
| 60 to 64 Years | 699 (9.1%) | 511 (7.3%) |
| 65 to 69 Years | 716 (9.4%) | 626 (9.0%) |
| 70 to 74 Years | 541 (7.1%) | 476 (6.9%) |
| 75 to 79 Years | 340 (4.4%) | 367 (5.3%) |
| 80 to 84 Years | 182 (2.4%) | 192 (2.8%) |
| 85 Years and over | 220 (2.9%) | 387 (5.6%) |
| Total | 7,649 (100.0%) | 6,948 (100.0%) |
Families and Households in Gogebic County
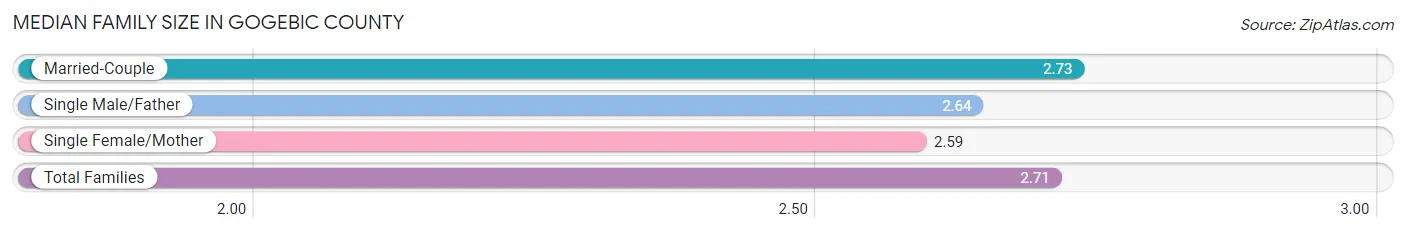
Median Family Size in Gogebic County
The median family size in Gogebic County is 2.71 persons per family, with married-couple families (3,028 | 80.0%) accounting for the largest median family size of 2.73 persons per family. On the other hand, single female/mother families (529 | 14.0%) represent the smallest median family size with 2.59 persons per family.
| Family Type | # Families | Family Size |
| Married-Couple | 3,028 (80.0%) | 2.73 |
| Single Male/Father | 227 (6.0%) | 2.64 |
| Single Female/Mother | 529 (14.0%) | 2.59 |
| Total Families | 3,784 (100.0%) | 2.71 |
Median Household Size in Gogebic County
The median household size in Gogebic County is 2.04 persons per household, with single male/father households (227 | 3.3%) accounting for the largest median household size of 3.09 persons per household. non-family households (3,153 | 45.5%) represent the smallest median household size with 1.13 persons per household.
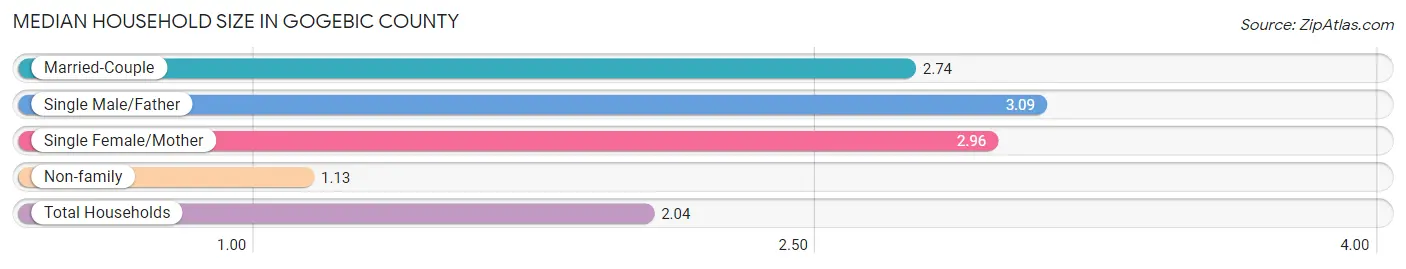
| Household Type | # Households | Household Size |
| Married-Couple | 3,028 (43.6%) | 2.74 |
| Single Male/Father | 227 (3.3%) | 3.09 |
| Single Female/Mother | 529 (7.6%) | 2.96 |
| Non-family | 3,153 (45.5%) | 1.13 |
| Total Households | 6,937 (100.0%) | 2.04 |
Household Size by Marriage Status in Gogebic County
Out of a total of 6,937 households in Gogebic County, 3,784 (54.5%) are family households, while 3,153 (45.5%) are nonfamily households. The most numerous type of family households are 2-person households, comprising 2,300, and the most common type of nonfamily households are 1-person households, comprising 2,808.
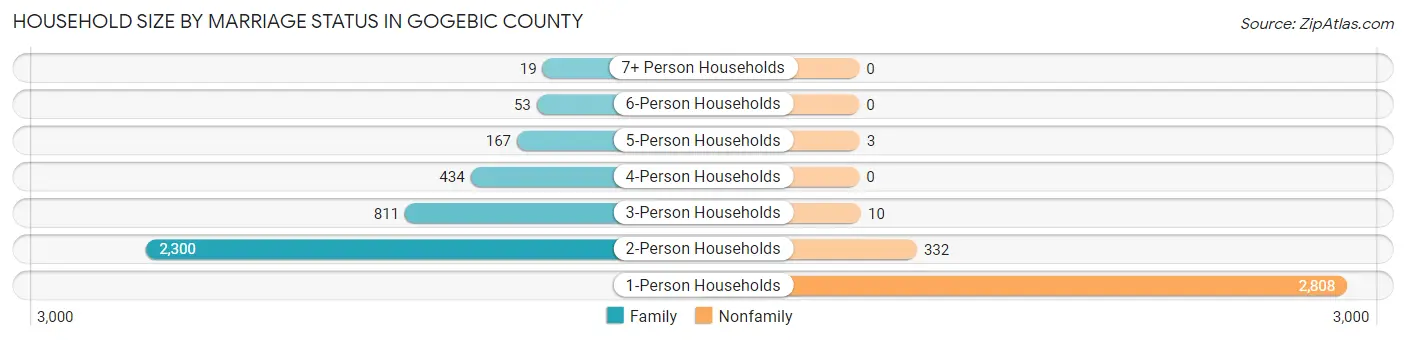
| Household Size | Family Households | Nonfamily Households |
| 1-Person Households | - | 2,808 (40.5%) |
| 2-Person Households | 2,300 (33.2%) | 332 (4.8%) |
| 3-Person Households | 811 (11.7%) | 10 (0.1%) |
| 4-Person Households | 434 (6.3%) | 0 (0.0%) |
| 5-Person Households | 167 (2.4%) | 3 (0.0%) |
| 6-Person Households | 53 (0.8%) | 0 (0.0%) |
| 7+ Person Households | 19 (0.3%) | 0 (0.0%) |
| Total | 3,784 (54.5%) | 3,153 (45.5%) |
Female Fertility in Gogebic County
Fertility by Age in Gogebic County
Average fertility rate in Gogebic County is 69.0 births per 1,000 women. Women in the age bracket of 20 to 34 years have the highest fertility rate with 123.0 births per 1,000 women. Women in the age bracket of 20 to 34 years acount for 73.7% of all women with births.

| Age Bracket | Women with Births | Births / 1,000 Women |
| 15 to 19 years | 0 (0.0%) | 0.0 |
| 20 to 34 years | 129 (73.7%) | 123.0 |
| 35 to 50 years | 46 (26.3%) | 38.0 |
| Total | 175 (100.0%) | 69.0 |
Fertility by Age by Marriage Status in Gogebic County
74.3% of women with births (175) in Gogebic County are married. The highest percentage of unmarried women with births falls into 35 to 50 years age bracket with 34.8% of them unmarried at the time of birth, while the lowest percentage of unmarried women with births belong to 20 to 34 years age bracket with 22.5% of them unmarried.
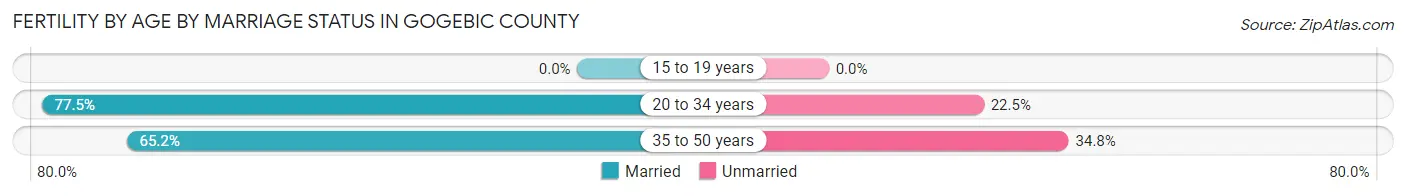
| Age Bracket | Married | Unmarried |
| 15 to 19 years | 0 (0.0%) | 0 (0.0%) |
| 20 to 34 years | 100 (77.5%) | 29 (22.5%) |
| 35 to 50 years | 30 (65.2%) | 16 (34.8%) |
| Total | 130 (74.3%) | 45 (25.7%) |
Fertility by Education in Gogebic County
Average fertility rate in Gogebic County is 69.0 births per 1,000 women. Women with the education attainment of bachelor's degree have the highest fertility rate of 108.0 births per 1,000 women, while women with the education attainment of graduate degree have the lowest fertility at 34.0 births per 1,000 women. Women with the education attainment of college or associate's degree represent 34.9% of all women with births.
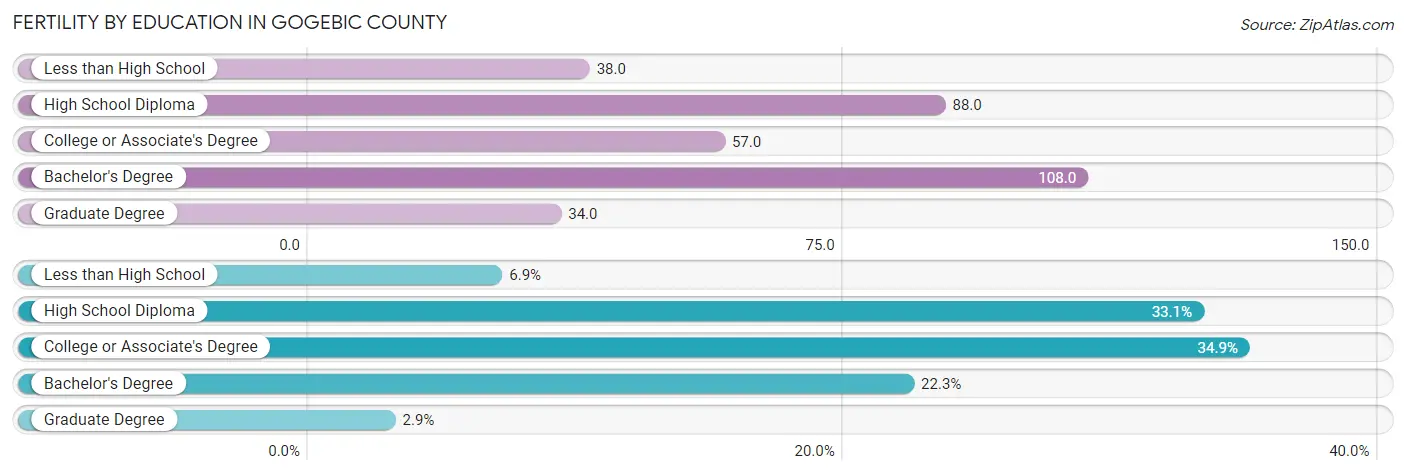
| Educational Attainment | Women with Births | Births / 1,000 Women |
| Less than High School | 12 (6.9%) | 38.0 |
| High School Diploma | 58 (33.1%) | 88.0 |
| College or Associate's Degree | 61 (34.9%) | 57.0 |
| Bachelor's Degree | 39 (22.3%) | 108.0 |
| Graduate Degree | 5 (2.9%) | 34.0 |
| Total | 175 (100.0%) | 69.0 |
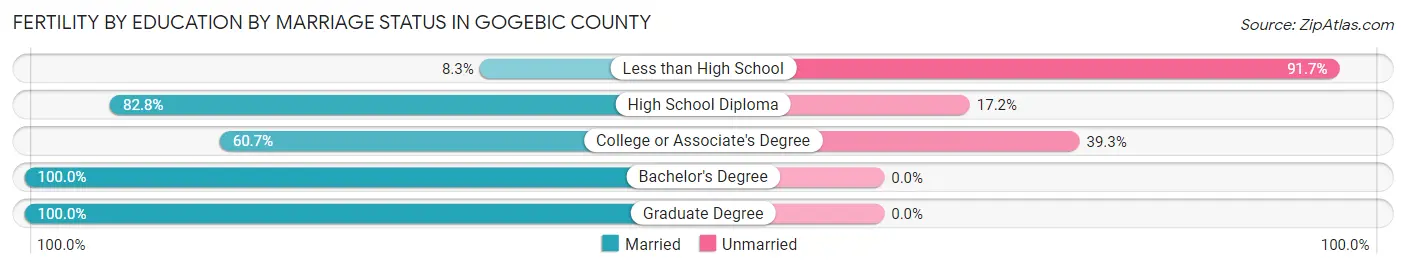
Fertility by Education by Marriage Status in Gogebic County
25.7% of women with births in Gogebic County are unmarried. Women with the educational attainment of bachelor's degree are most likely to be married with 100.0% of them married at childbirth, while women with the educational attainment of less than high school are least likely to be married with 91.7% of them unmarried at childbirth.
| Educational Attainment | Married | Unmarried |
| Less than High School | 1 (8.3%) | 11 (91.7%) |
| High School Diploma | 48 (82.8%) | 10 (17.2%) |
| College or Associate's Degree | 37 (60.7%) | 24 (39.3%) |
| Bachelor's Degree | 39 (100.0%) | 0 (0.0%) |
| Graduate Degree | 5 (100.0%) | 0 (0.0%) |
| Total | 130 (74.3%) | 45 (25.7%) |
Income in Gogebic County
Income Overview in Gogebic County
Per Capita Income in Gogebic County is $33,516, while median incomes of families and households are $67,215 and $47,913 respectively.
| Characteristic | Number | Measure |
| Per Capita Income | 14,597 | $33,516 |
| Median Family Income | 3,784 | $67,215 |
| Mean Family Income | 3,784 | $85,230 |
| Median Household Income | 6,937 | $47,913 |
| Mean Household Income | 6,937 | $68,140 |
| Income Deficit | 3,784 | $9,075 |
| Wage / Income Gap (%) | 14,597 | 29.61% |
| Wage / Income Gap ($) | 14,597 | 70.39¢ per $1 |
| Gini / Inequality Index | 14,597 | 0.48 |
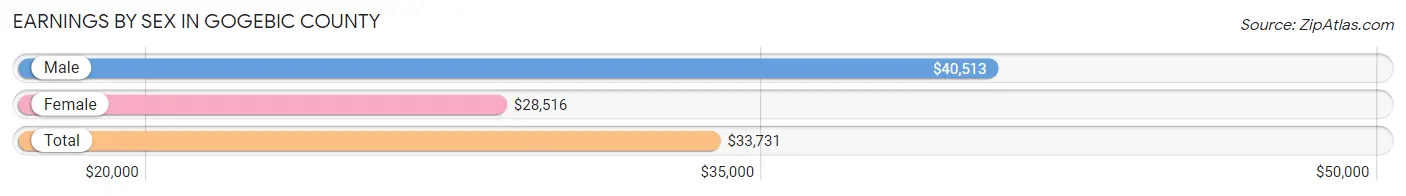
Earnings by Sex in Gogebic County
Average Earnings in Gogebic County are $33,731, $40,513 for men and $28,516 for women, a difference of 29.6%.
| Sex | Number | Average Earnings |
| Male | 3,686 (53.1%) | $40,513 |
| Female | 3,257 (46.9%) | $28,516 |
| Total | 6,943 (100.0%) | $33,731 |
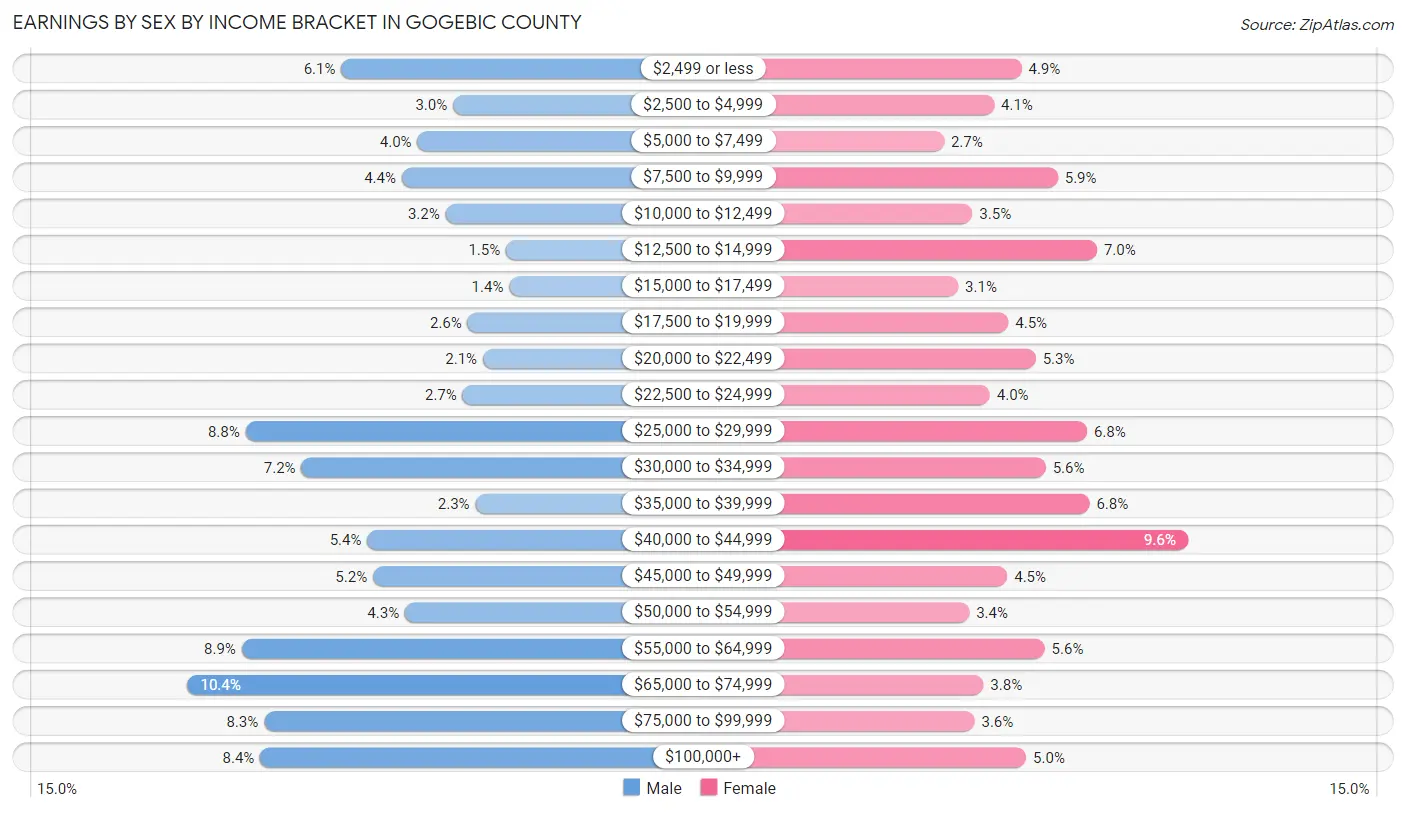
Earnings by Sex by Income Bracket in Gogebic County
The most common earnings brackets in Gogebic County are $65,000 to $74,999 for men (384 | 10.4%) and $40,000 to $44,999 for women (312 | 9.6%).
| Income | Male | Female |
| $2,499 or less | 225 (6.1%) | 160 (4.9%) |
| $2,500 to $4,999 | 109 (3.0%) | 135 (4.1%) |
| $5,000 to $7,499 | 146 (4.0%) | 89 (2.7%) |
| $7,500 to $9,999 | 162 (4.4%) | 193 (5.9%) |
| $10,000 to $12,499 | 117 (3.2%) | 115 (3.5%) |
| $12,500 to $14,999 | 54 (1.5%) | 229 (7.0%) |
| $15,000 to $17,499 | 51 (1.4%) | 102 (3.1%) |
| $17,500 to $19,999 | 94 (2.5%) | 148 (4.5%) |
| $20,000 to $22,499 | 78 (2.1%) | 173 (5.3%) |
| $22,500 to $24,999 | 99 (2.7%) | 131 (4.0%) |
| $25,000 to $29,999 | 324 (8.8%) | 220 (6.8%) |
| $30,000 to $34,999 | 266 (7.2%) | 182 (5.6%) |
| $35,000 to $39,999 | 86 (2.3%) | 222 (6.8%) |
| $40,000 to $44,999 | 198 (5.4%) | 312 (9.6%) |
| $45,000 to $49,999 | 192 (5.2%) | 147 (4.5%) |
| $50,000 to $54,999 | 159 (4.3%) | 112 (3.4%) |
| $55,000 to $64,999 | 328 (8.9%) | 181 (5.6%) |
| $65,000 to $74,999 | 384 (10.4%) | 125 (3.8%) |
| $75,000 to $99,999 | 305 (8.3%) | 117 (3.6%) |
| $100,000+ | 309 (8.4%) | 164 (5.0%) |
| Total | 3,686 (100.0%) | 3,257 (100.0%) |
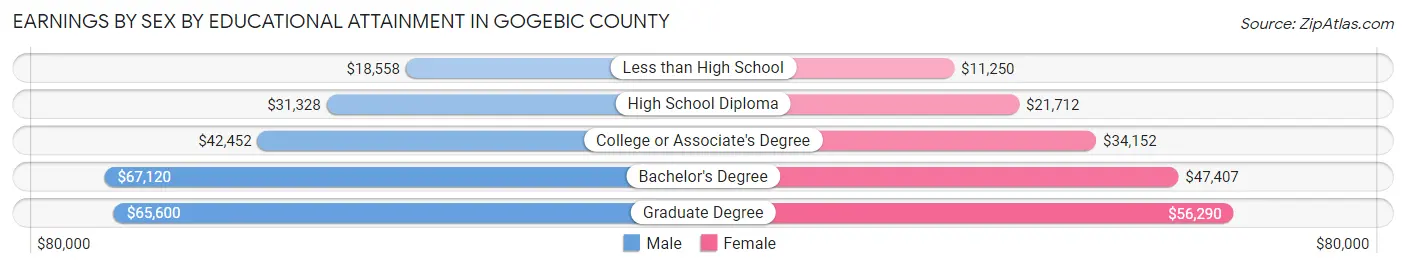
Earnings by Sex by Educational Attainment in Gogebic County
Average earnings in Gogebic County are $45,461 for men and $31,835 for women, a difference of 30.0%. Men with an educational attainment of bachelor's degree enjoy the highest average annual earnings of $67,120, while those with less than high school education earn the least with $18,558. Women with an educational attainment of graduate degree earn the most with the average annual earnings of $56,290, while those with less than high school education have the smallest earnings of $11,250.
| Educational Attainment | Male Income | Female Income |
| Less than High School | $18,558 | $11,250 |
| High School Diploma | $31,328 | $21,712 |
| College or Associate's Degree | $42,452 | $34,152 |
| Bachelor's Degree | $67,120 | $47,407 |
| Graduate Degree | $65,600 | $56,290 |
| Total | $45,461 | $31,835 |
Family Income in Gogebic County
Family Income Brackets in Gogebic County
According to the Gogebic County family income data, there are 832 families falling into the $50,000 to $74,999 income range, which is the most common income bracket and makes up 22.0% of all families. Conversely, the $10,000 to $14,999 income bracket is the least frequent group with only 91 families (2.4%) belonging to this category.
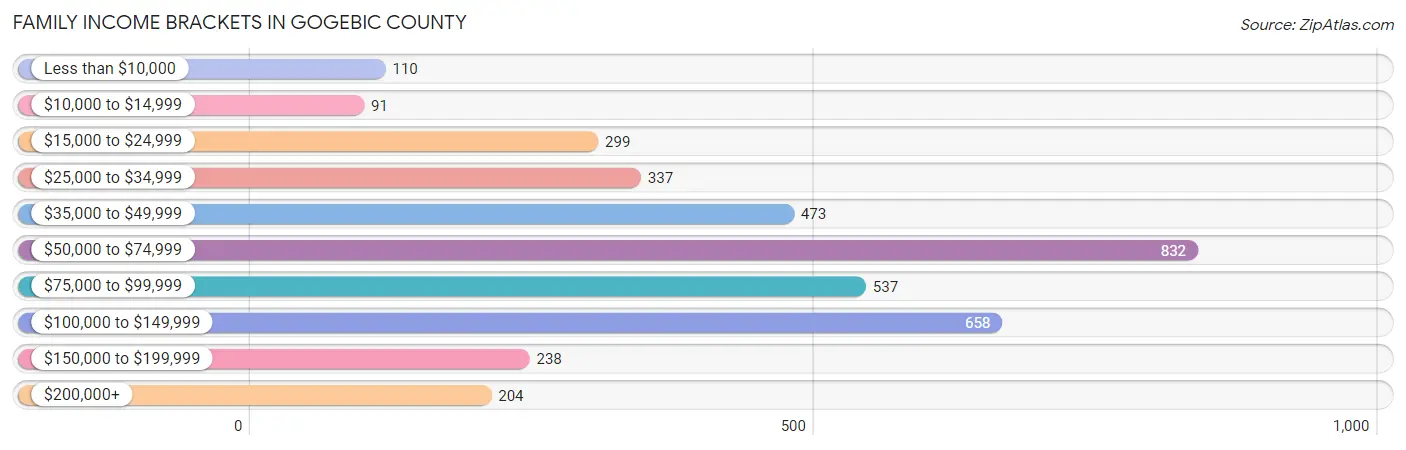
| Income Bracket | # Families | % Families |
| Less than $10,000 | 110 | 2.9% |
| $10,000 to $14,999 | 91 | 2.4% |
| $15,000 to $24,999 | 299 | 7.9% |
| $25,000 to $34,999 | 337 | 8.9% |
| $35,000 to $49,999 | 473 | 12.5% |
| $50,000 to $74,999 | 832 | 22.0% |
| $75,000 to $99,999 | 537 | 14.2% |
| $100,000 to $149,999 | 658 | 17.4% |
| $150,000 to $199,999 | 238 | 6.3% |
| $200,000+ | 204 | 5.4% |
Family Income by Famaliy Size in Gogebic County
4-person families (383 | 10.1%) account for the highest median family income in Gogebic County with $116,125 per family, while 3-person families (679 | 17.9%) have the highest median income of $31,068 per family member.
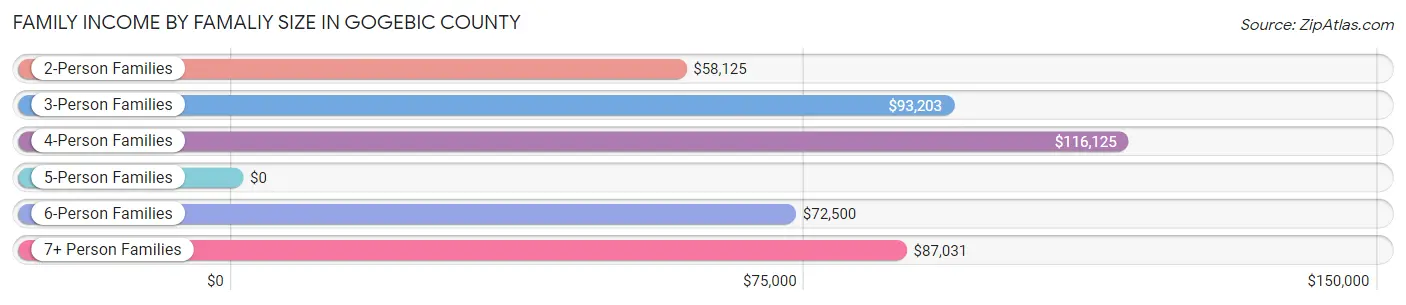
| Income Bracket | # Families | Median Income |
| 2-Person Families | 2,502 (66.1%) | $58,125 |
| 3-Person Families | 679 (17.9%) | $93,203 |
| 4-Person Families | 383 (10.1%) | $116,125 |
| 5-Person Families | 153 (4.0%) | $0 |
| 6-Person Families | 48 (1.3%) | $72,500 |
| 7+ Person Families | 19 (0.5%) | $87,031 |
| Total | 3,784 (100.0%) | $67,215 |
Family Income by Number of Earners in Gogebic County
The median family income in Gogebic County is $67,215, with families comprising 3+ earners (414) having the highest median family income of $133,992, while families with 1 earner (1,120) have the lowest median family income of $46,471, accounting for 10.9% and 29.6% of families, respectively.

| Number of Earners | # Families | Median Income |
| No Earners | 1,016 (26.9%) | $51,651 |
| 1 Earner | 1,120 (29.6%) | $46,471 |
| 2 Earners | 1,234 (32.6%) | $93,346 |
| 3+ Earners | 414 (10.9%) | $133,992 |
| Total | 3,784 (100.0%) | $67,215 |
Household Income in Gogebic County
Household Income Brackets in Gogebic County
With 1,269 households falling in the category, the $50,000 to $74,999 income range is the most frequent in Gogebic County, accounting for 18.3% of all households. In contrast, only 264 households (3.8%) fall into the $200,000+ income bracket, making it the least populous group.
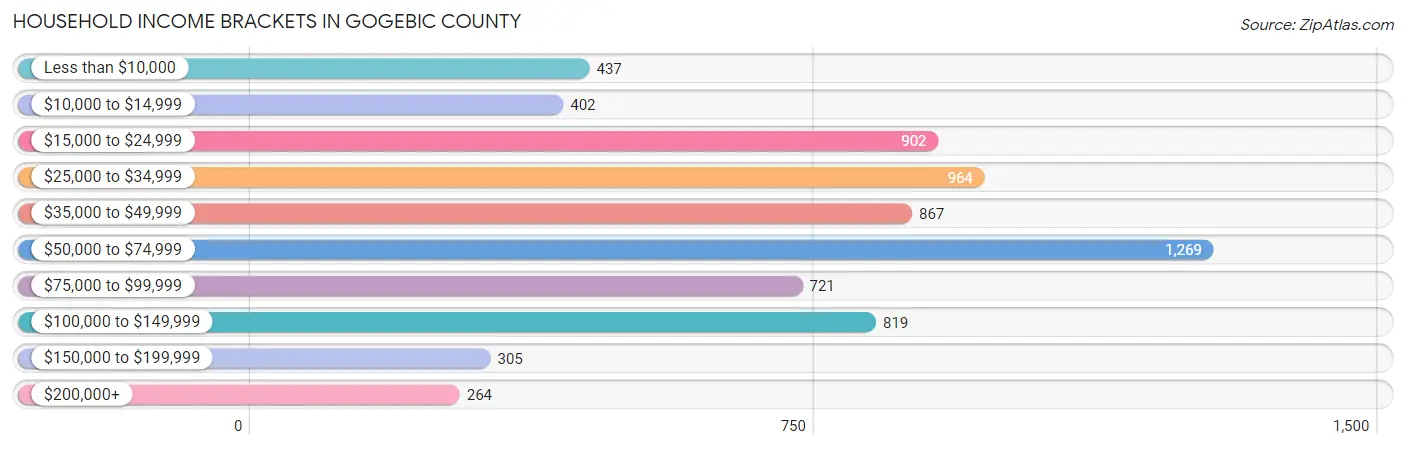
| Income Bracket | # Households | % Households |
| Less than $10,000 | 437 | 6.3% |
| $10,000 to $14,999 | 402 | 5.8% |
| $15,000 to $24,999 | 902 | 13.0% |
| $25,000 to $34,999 | 964 | 13.9% |
| $35,000 to $49,999 | 867 | 12.5% |
| $50,000 to $74,999 | 1,269 | 18.3% |
| $75,000 to $99,999 | 721 | 10.4% |
| $100,000 to $149,999 | 819 | 11.8% |
| $150,000 to $199,999 | 305 | 4.4% |
| $200,000+ | 264 | 3.8% |
Household Income by Householder Age in Gogebic County
The median household income in Gogebic County is $47,913, with the highest median household income of $63,087 found in the 45 to 64 years age bracket for the primary householder. A total of 2,555 households (36.8%) fall into this category. Meanwhile, the 15 to 24 years age bracket for the primary householder has the lowest median household income of $30,987, with 125 households (1.8%) in this group.

| Income Bracket | # Households | Median Income |
| 15 to 24 Years | 125 (1.8%) | $30,987 |
| 25 to 44 Years | 1,605 (23.1%) | $45,938 |
| 45 to 64 Years | 2,555 (36.8%) | $63,087 |
| 65+ Years | 2,652 (38.2%) | $37,412 |
| Total | 6,937 (100.0%) | $47,913 |
Poverty in Gogebic County
Income Below Poverty by Sex and Age in Gogebic County
With 13.3% poverty level for males and 14.9% for females among the residents of Gogebic County, 25 to 34 year old males and 5 year old females are the most vulnerable to poverty, with 218 males (28.1%) and 37 females (47.4%) in their respective age groups living below the poverty level.
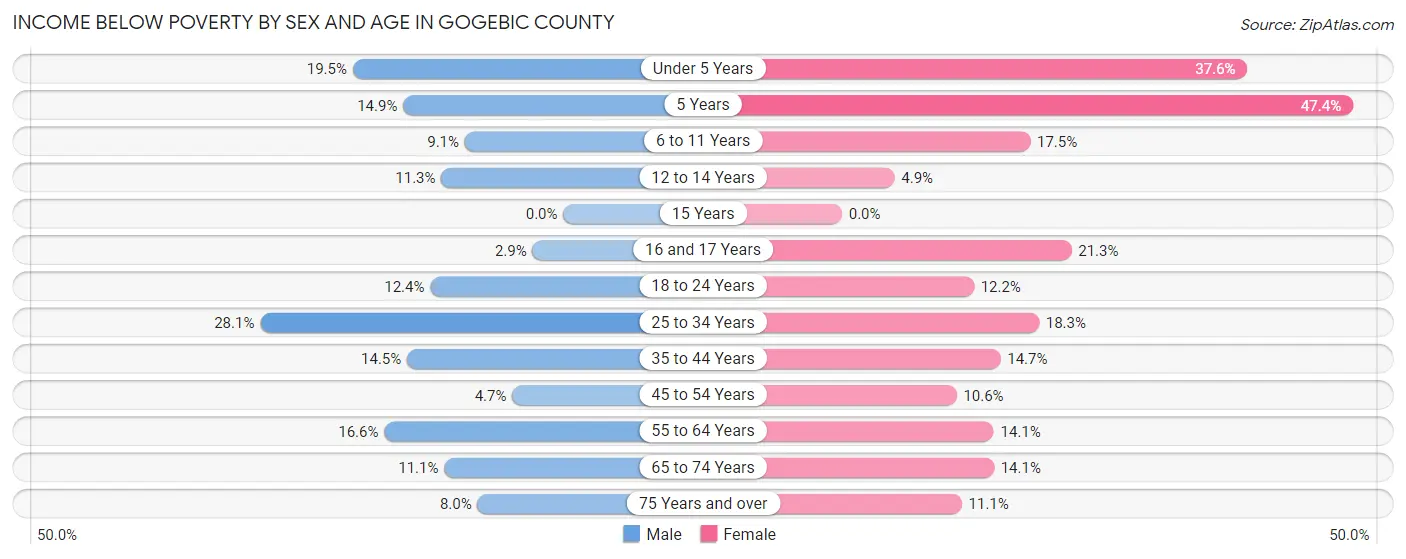
| Age Bracket | Male | Female |
| Under 5 Years | 59 (19.5%) | 99 (37.6%) |
| 5 Years | 11 (14.9%) | 37 (47.4%) |
| 6 to 11 Years | 36 (9.1%) | 65 (17.5%) |
| 12 to 14 Years | 30 (11.3%) | 8 (4.9%) |
| 15 Years | 0 (0.0%) | 0 (0.0%) |
| 16 and 17 Years | 5 (2.9%) | 23 (21.3%) |
| 18 to 24 Years | 52 (12.3%) | 48 (12.2%) |
| 25 to 34 Years | 218 (28.1%) | 138 (18.3%) |
| 35 to 44 Years | 118 (14.5%) | 99 (14.7%) |
| 45 to 54 Years | 39 (4.7%) | 83 (10.6%) |
| 55 to 64 Years | 220 (16.6%) | 167 (14.1%) |
| 65 to 74 Years | 138 (11.1%) | 155 (14.1%) |
| 75 Years and over | 52 (8.0%) | 93 (11.1%) |
| Total | 978 (13.3%) | 1,015 (14.9%) |
Income Above Poverty by Sex and Age in Gogebic County
According to the poverty statistics in Gogebic County, males aged 15 years and females aged 15 years are the age groups that are most secure financially, with 100.0% of males and 100.0% of females in these age groups living above the poverty line.
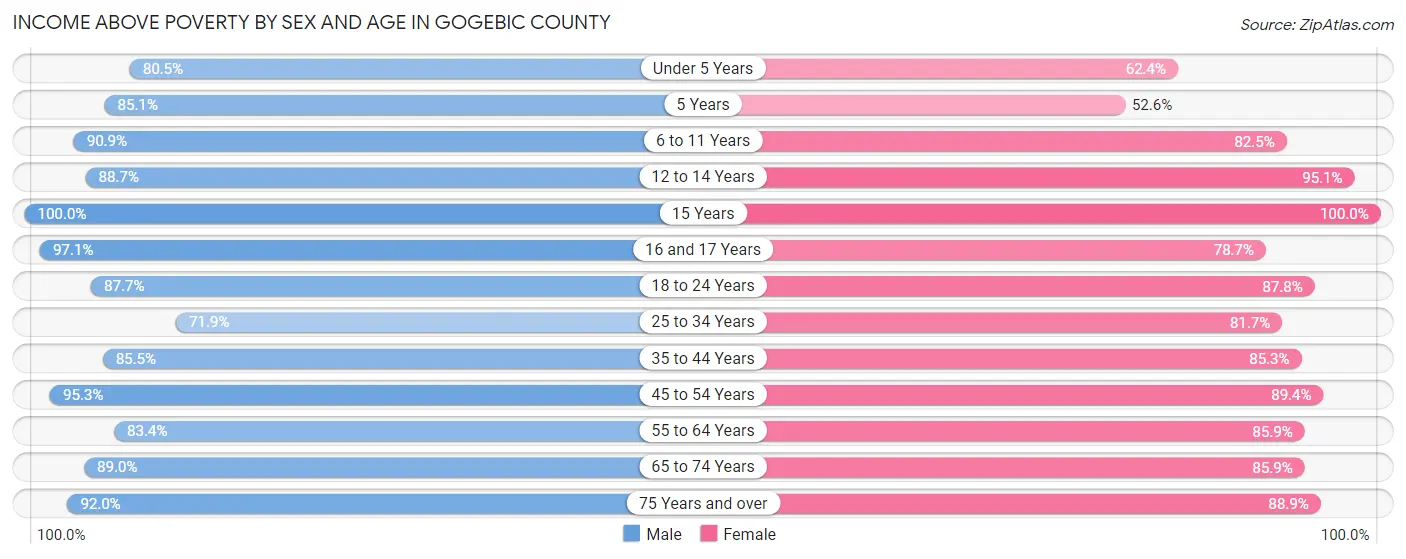
| Age Bracket | Male | Female |
| Under 5 Years | 243 (80.5%) | 164 (62.4%) |
| 5 Years | 63 (85.1%) | 41 (52.6%) |
| 6 to 11 Years | 358 (90.9%) | 307 (82.5%) |
| 12 to 14 Years | 235 (88.7%) | 156 (95.1%) |
| 15 Years | 66 (100.0%) | 91 (100.0%) |
| 16 and 17 Years | 170 (97.1%) | 85 (78.7%) |
| 18 to 24 Years | 369 (87.6%) | 344 (87.8%) |
| 25 to 34 Years | 557 (71.9%) | 617 (81.7%) |
| 35 to 44 Years | 696 (85.5%) | 574 (85.3%) |
| 45 to 54 Years | 784 (95.3%) | 697 (89.4%) |
| 55 to 64 Years | 1,104 (83.4%) | 1,018 (85.9%) |
| 65 to 74 Years | 1,111 (88.9%) | 944 (85.9%) |
| 75 Years and over | 601 (92.0%) | 743 (88.9%) |
| Total | 6,357 (86.7%) | 5,781 (85.1%) |
Income Below Poverty Among Married-Couple Families in Gogebic County
The poverty statistics for married-couple families in Gogebic County show that 6.1% or 186 of the total 3,028 families live below the poverty line. Families with 3 or 4 children have the highest poverty rate of 33.1%, comprising of 44 families. On the other hand, families with 5 or more children have the lowest poverty rate of 0.0%, which includes 0 families.
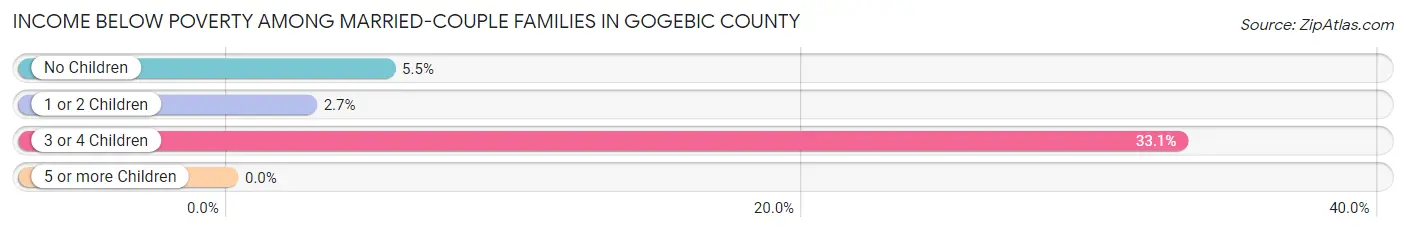
| Children | Above Poverty | Below Poverty |
| No Children | 2,178 (94.5%) | 126 (5.5%) |
| 1 or 2 Children | 567 (97.3%) | 16 (2.7%) |
| 3 or 4 Children | 89 (66.9%) | 44 (33.1%) |
| 5 or more Children | 8 (100.0%) | 0 (0.0%) |
| Total | 2,842 (93.9%) | 186 (6.1%) |
Income Below Poverty Among Single-Parent Households in Gogebic County
According to the poverty data in Gogebic County, 25.1% or 57 single-father households and 12.7% or 67 single-mother households are living below the poverty line. Among single-father households, those with 1 or 2 children have the highest poverty rate, with 45 households (27.8%) experiencing poverty. Likewise, among single-mother households, those with 3 or 4 children have the highest poverty rate, with 6 households (22.2%) falling below the poverty line.
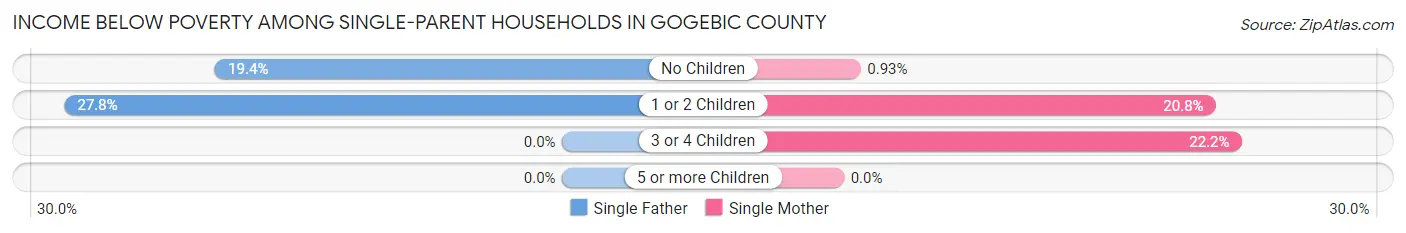
| Children | Single Father | Single Mother |
| No Children | 12 (19.4%) | 2 (0.9%) |
| 1 or 2 Children | 45 (27.8%) | 59 (20.8%) |
| 3 or 4 Children | 0 (0.0%) | 6 (22.2%) |
| 5 or more Children | 0 (0.0%) | 0 (0.0%) |
| Total | 57 (25.1%) | 67 (12.7%) |
Income Below Poverty Among Married-Couple vs Single-Parent Households in Gogebic County
The poverty data for Gogebic County shows that 186 of the married-couple family households (6.1%) and 124 of the single-parent households (16.4%) are living below the poverty level. Within the married-couple family households, those with 3 or 4 children have the highest poverty rate, with 44 households (33.1%) falling below the poverty line. Among the single-parent households, those with 1 or 2 children have the highest poverty rate, with 104 household (23.3%) living below poverty.
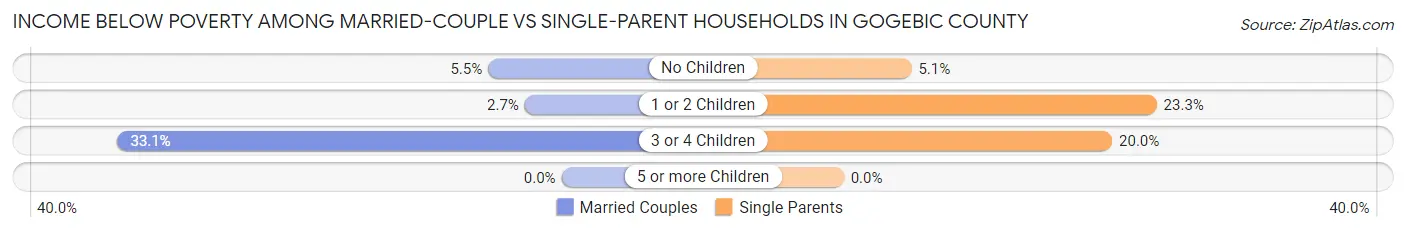
| Children | Married-Couple Families | Single-Parent Households |
| No Children | 126 (5.5%) | 14 (5.1%) |
| 1 or 2 Children | 16 (2.7%) | 104 (23.3%) |
| 3 or 4 Children | 44 (33.1%) | 6 (20.0%) |
| 5 or more Children | 0 (0.0%) | 0 (0.0%) |
| Total | 186 (6.1%) | 124 (16.4%) |
Employment Characteristics in Gogebic County
Employment by Class of Employer in Gogebic County
Among the 6,038 employed individuals in Gogebic County, private company employees (4,063 | 67.3%), local government employees (562 | 9.3%), and not-for-profit organizations (444 | 7.3%) make up the most common classes of employment.
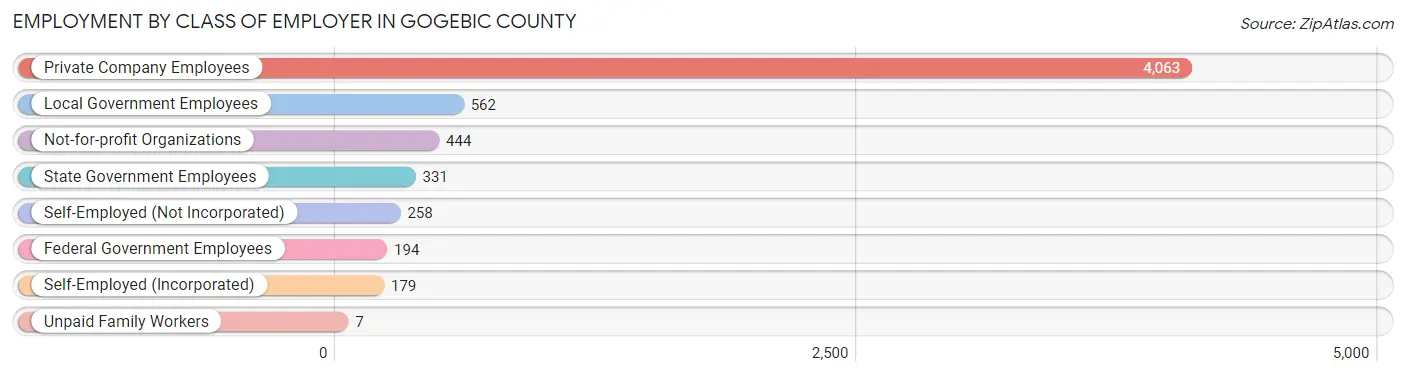
| Employer Class | # Employees | % Employees |
| Private Company Employees | 4,063 | 67.3% |
| Self-Employed (Incorporated) | 179 | 3.0% |
| Self-Employed (Not Incorporated) | 258 | 4.3% |
| Not-for-profit Organizations | 444 | 7.3% |
| Local Government Employees | 562 | 9.3% |
| State Government Employees | 331 | 5.5% |
| Federal Government Employees | 194 | 3.2% |
| Unpaid Family Workers | 7 | 0.1% |
| Total | 6,038 | 100.0% |
Employment Status by Age in Gogebic County
According to the labor force statistics for Gogebic County, out of the total population over 16 years of age (12,489), 51.9% or 6,482 individuals are in the labor force, with 6.0% or 389 of them unemployed. The age group with the highest labor force participation rate is 45 to 54 years, with 87.0% or 1,426 individuals in the labor force. Within the labor force, the 60 to 64 years age range has the highest percentage of unemployed individuals, with 12.8% or 76 of them being unemployed.

| Age Bracket | In Labor Force | Unemployed |
| 16 to 19 Years | 237 (46.8%) | 8 (3.4%) |
| 20 to 24 Years | 514 (78.1%) | 34 (6.6%) |
| 25 to 29 Years | 641 (79.9%) | 34 (5.3%) |
| 30 to 34 Years | 497 (63.4%) | 32 (6.4%) |
| 35 to 44 Years | 1,233 (81.0%) | 80 (6.5%) |
| 45 to 54 Years | 1,426 (87.0%) | 76 (5.3%) |
| 55 to 59 Years | 859 (65.0%) | 21 (2.4%) |
| 60 to 64 Years | 595 (49.2%) | 76 (12.8%) |
| 65 to 74 Years | 406 (17.2%) | 28 (6.9%) |
| 75 Years and over | 79 (4.7%) | 0 (0.0%) |
| Total | 6,482 (51.9%) | 389 (6.0%) |
Employment Status by Educational Attainment in Gogebic County
According to labor force statistics for Gogebic County, 72.1% of individuals (5,247) out of the total population between 25 and 64 years of age (7,278) are in the labor force, with 6.1% or 320 of them being unemployed. The group with the highest labor force participation rate are those with the educational attainment of bachelor's degree or higher, with 83.2% or 1,320 individuals in the labor force. Within the labor force, individuals with less than high school education have the highest percentage of unemployment, with 25.9% or 21 of them being unemployed.
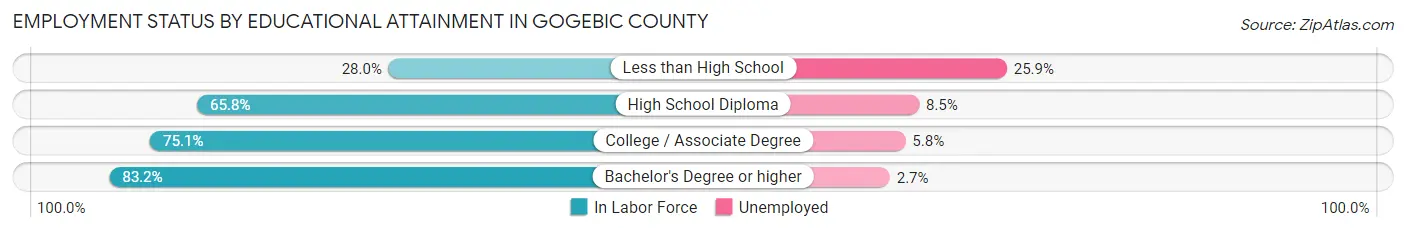
| Educational Attainment | In Labor Force | Unemployed |
| Less than High School | 81 (28.0%) | 75 (25.9%) |
| High School Diploma | 1,476 (65.8%) | 191 (8.5%) |
| College / Associate Degree | 2,373 (75.1%) | 183 (5.8%) |
| Bachelor's Degree or higher | 1,320 (83.2%) | 43 (2.7%) |
| Total | 5,247 (72.1%) | 444 (6.1%) |
Employment Occupations by Sex in Gogebic County
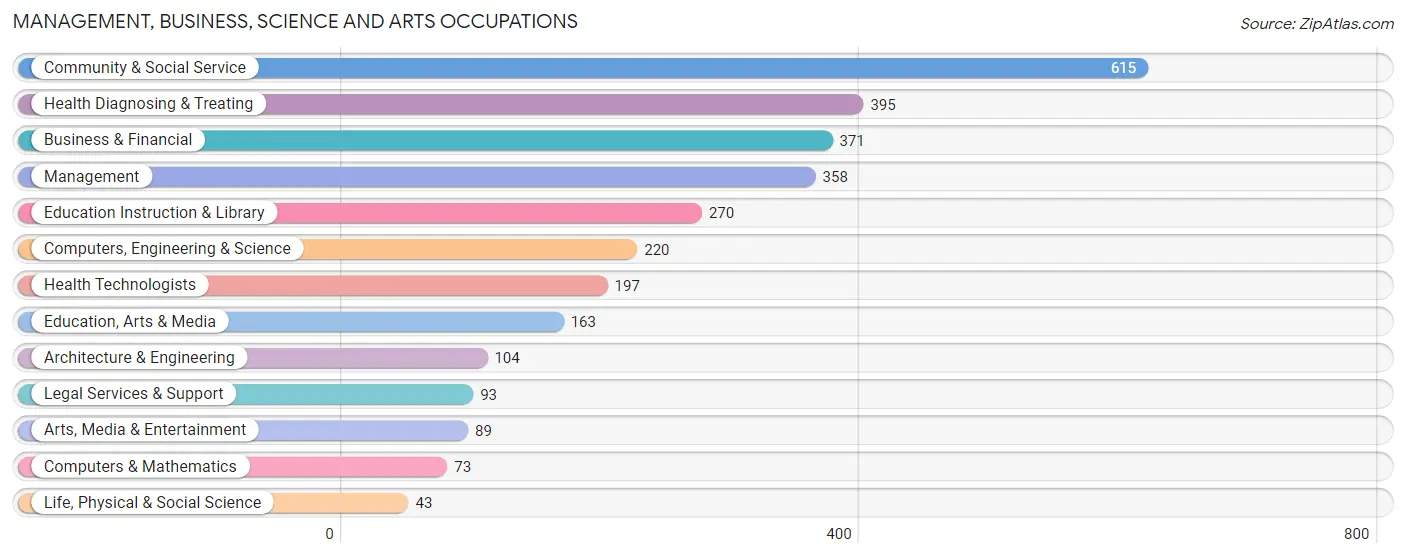
Management, Business, Science and Arts Occupations
The most common Management, Business, Science and Arts occupations in Gogebic County are Community & Social Service (615 | 10.1%), Health Diagnosing & Treating (395 | 6.5%), Business & Financial (371 | 6.1%), Management (358 | 5.9%), and Education Instruction & Library (270 | 4.4%).
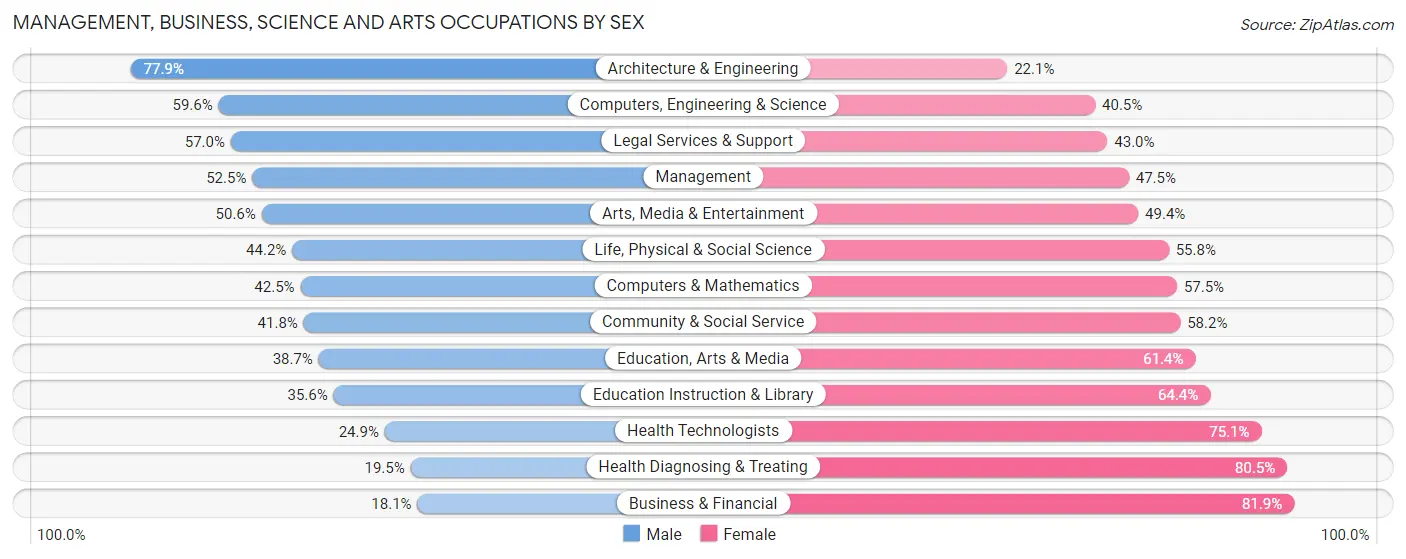
Management, Business, Science and Arts Occupations by Sex
Within the Management, Business, Science and Arts occupations in Gogebic County, the most male-oriented occupations are Architecture & Engineering (77.9%), Computers, Engineering & Science (59.6%), and Legal Services & Support (57.0%), while the most female-oriented occupations are Business & Financial (81.9%), Health Diagnosing & Treating (80.5%), and Health Technologists (75.1%).
| Occupation | Male | Female |
| Management | 188 (52.5%) | 170 (47.5%) |
| Business & Financial | 67 (18.1%) | 304 (81.9%) |
| Computers, Engineering & Science | 131 (59.6%) | 89 (40.5%) |
| Computers & Mathematics | 31 (42.5%) | 42 (57.5%) |
| Architecture & Engineering | 81 (77.9%) | 23 (22.1%) |
| Life, Physical & Social Science | 19 (44.2%) | 24 (55.8%) |
| Community & Social Service | 257 (41.8%) | 358 (58.2%) |
| Education, Arts & Media | 63 (38.7%) | 100 (61.4%) |
| Legal Services & Support | 53 (57.0%) | 40 (43.0%) |
| Education Instruction & Library | 96 (35.6%) | 174 (64.4%) |
| Arts, Media & Entertainment | 45 (50.6%) | 44 (49.4%) |
| Health Diagnosing & Treating | 77 (19.5%) | 318 (80.5%) |
| Health Technologists | 49 (24.9%) | 148 (75.1%) |
| Total (Category) | 720 (36.7%) | 1,239 (63.2%) |
| Total (Overall) | 3,143 (51.7%) | 2,938 (48.3%) |
Services Occupations
The most common Services occupations in Gogebic County are Food Preparation & Serving (329 | 5.4%), Cleaning & Maintenance (276 | 4.5%), Healthcare Support (275 | 4.5%), Security & Protection (153 | 2.5%), and Law Enforcement (112 | 1.8%).

Services Occupations by Sex
Within the Services occupations in Gogebic County, the most male-oriented occupations are Law Enforcement (91.1%), Security & Protection (86.9%), and Firefighting & Prevention (75.6%), while the most female-oriented occupations are Healthcare Support (83.6%), Personal Care & Service (66.7%), and Food Preparation & Serving (66.3%).

| Occupation | Male | Female |
| Healthcare Support | 45 (16.4%) | 230 (83.6%) |
| Security & Protection | 133 (86.9%) | 20 (13.1%) |
| Firefighting & Prevention | 31 (75.6%) | 10 (24.4%) |
| Law Enforcement | 102 (91.1%) | 10 (8.9%) |
| Food Preparation & Serving | 111 (33.7%) | 218 (66.3%) |
| Cleaning & Maintenance | 153 (55.4%) | 123 (44.6%) |
| Personal Care & Service | 37 (33.3%) | 74 (66.7%) |
| Total (Category) | 479 (41.9%) | 665 (58.1%) |
| Total (Overall) | 3,143 (51.7%) | 2,938 (48.3%) |
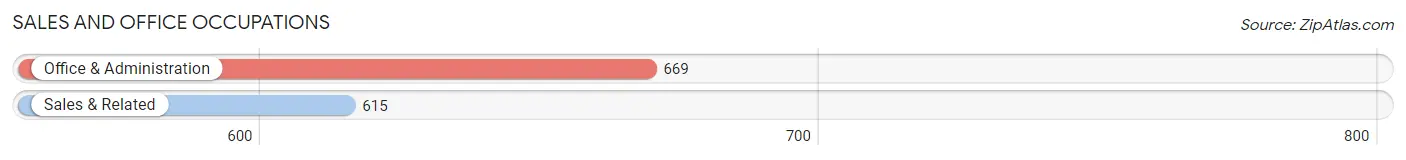
Sales and Office Occupations
The most common Sales and Office occupations in Gogebic County are Office & Administration (669 | 11.0%), and Sales & Related (615 | 10.1%).
Sales and Office Occupations by Sex
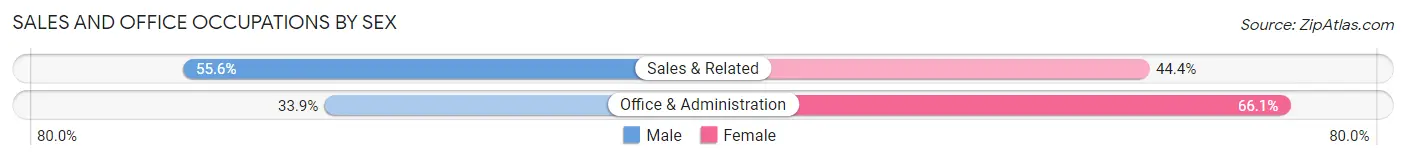
| Occupation | Male | Female |
| Sales & Related | 342 (55.6%) | 273 (44.4%) |
| Office & Administration | 227 (33.9%) | 442 (66.1%) |
| Total (Category) | 569 (44.3%) | 715 (55.7%) |
| Total (Overall) | 3,143 (51.7%) | 2,938 (48.3%) |
Natural Resources, Construction and Maintenance Occupations
The most common Natural Resources, Construction and Maintenance occupations in Gogebic County are Construction & Extraction (478 | 7.9%), Installation, Maintenance & Repair (228 | 3.7%), and Farming, Fishing & Forestry (68 | 1.1%).

Natural Resources, Construction and Maintenance Occupations by Sex
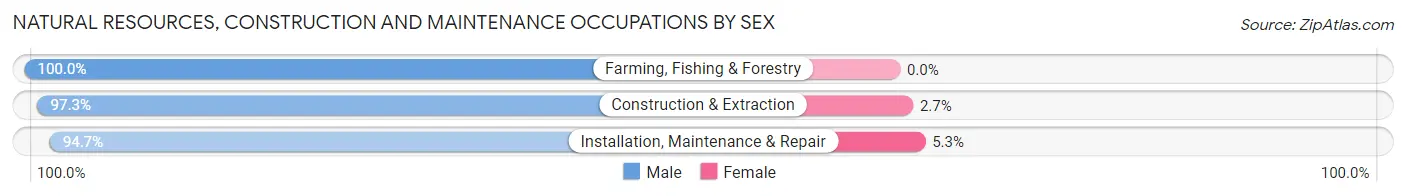
| Occupation | Male | Female |
| Farming, Fishing & Forestry | 68 (100.0%) | 0 (0.0%) |
| Construction & Extraction | 465 (97.3%) | 13 (2.7%) |
| Installation, Maintenance & Repair | 216 (94.7%) | 12 (5.3%) |
| Total (Category) | 749 (96.8%) | 25 (3.2%) |
| Total (Overall) | 3,143 (51.7%) | 2,938 (48.3%) |
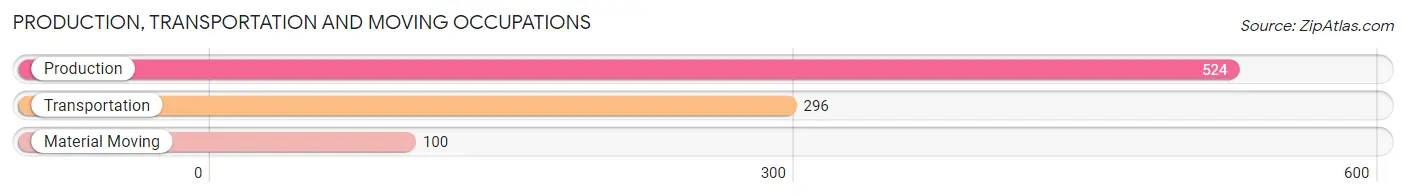
Production, Transportation and Moving Occupations
The most common Production, Transportation and Moving occupations in Gogebic County are Production (524 | 8.6%), Transportation (296 | 4.9%), and Material Moving (100 | 1.6%).
Production, Transportation and Moving Occupations by Sex

| Occupation | Male | Female |
| Production | 302 (57.6%) | 222 (42.4%) |
| Transportation | 265 (89.5%) | 31 (10.5%) |
| Material Moving | 59 (59.0%) | 41 (41.0%) |
| Total (Category) | 626 (68.0%) | 294 (32.0%) |
| Total (Overall) | 3,143 (51.7%) | 2,938 (48.3%) |
Employment Industries by Sex in Gogebic County
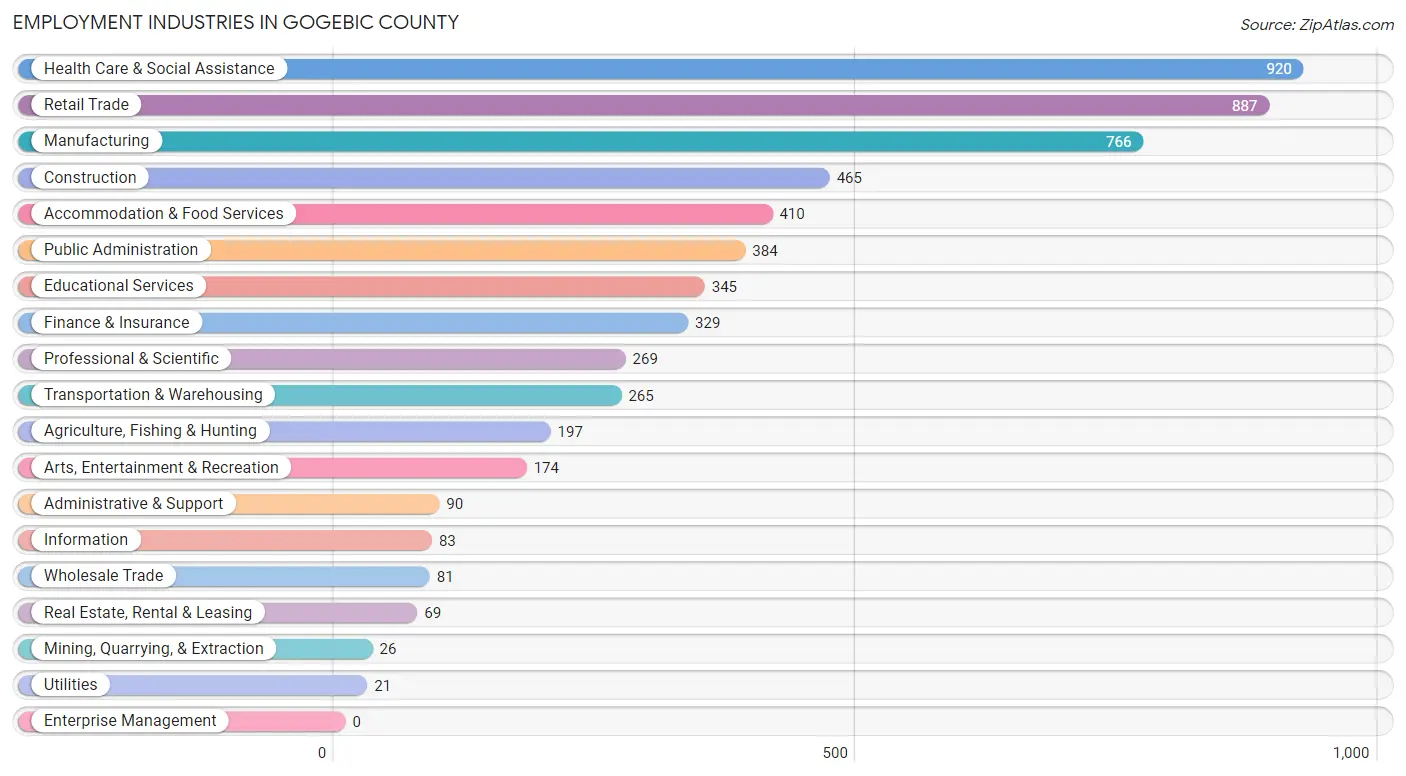
Employment Industries in Gogebic County
The major employment industries in Gogebic County include Health Care & Social Assistance (920 | 15.1%), Retail Trade (887 | 14.6%), Manufacturing (766 | 12.6%), Construction (465 | 7.6%), and Accommodation & Food Services (410 | 6.7%).
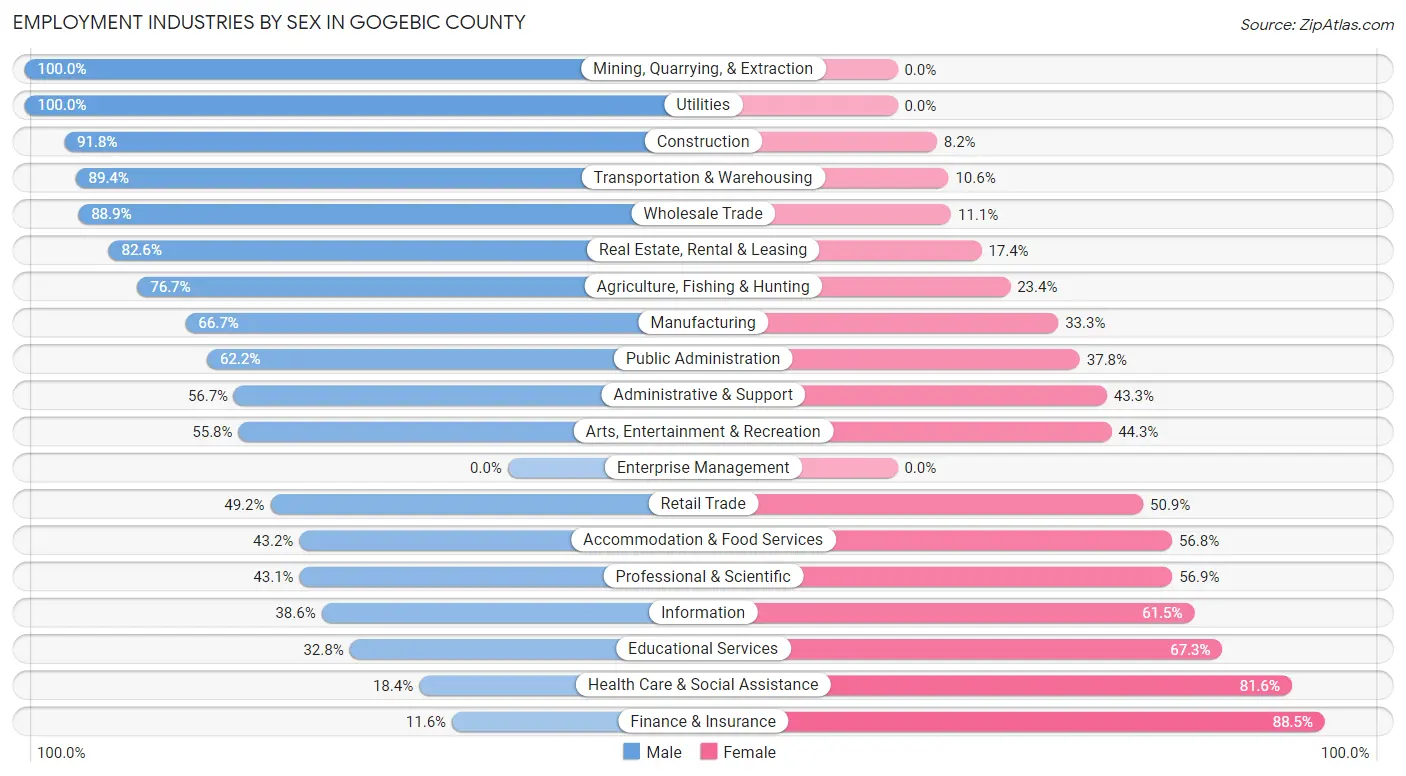
Employment Industries by Sex in Gogebic County
The Gogebic County industries that see more men than women are Mining, Quarrying, & Extraction (100.0%), Utilities (100.0%), and Construction (91.8%), whereas the industries that tend to have a higher number of women are Finance & Insurance (88.4%), Health Care & Social Assistance (81.6%), and Educational Services (67.2%).
| Industry | Male | Female |
| Agriculture, Fishing & Hunting | 151 (76.6%) | 46 (23.4%) |
| Mining, Quarrying, & Extraction | 26 (100.0%) | 0 (0.0%) |
| Construction | 427 (91.8%) | 38 (8.2%) |
| Manufacturing | 511 (66.7%) | 255 (33.3%) |
| Wholesale Trade | 72 (88.9%) | 9 (11.1%) |
| Retail Trade | 436 (49.1%) | 451 (50.8%) |
| Transportation & Warehousing | 237 (89.4%) | 28 (10.6%) |
| Utilities | 21 (100.0%) | 0 (0.0%) |
| Information | 32 (38.6%) | 51 (61.5%) |
| Finance & Insurance | 38 (11.6%) | 291 (88.4%) |
| Real Estate, Rental & Leasing | 57 (82.6%) | 12 (17.4%) |
| Professional & Scientific | 116 (43.1%) | 153 (56.9%) |
| Enterprise Management | 0 (0.0%) | 0 (0.0%) |
| Administrative & Support | 51 (56.7%) | 39 (43.3%) |
| Educational Services | 113 (32.8%) | 232 (67.2%) |
| Health Care & Social Assistance | 169 (18.4%) | 751 (81.6%) |
| Arts, Entertainment & Recreation | 97 (55.7%) | 77 (44.3%) |
| Accommodation & Food Services | 177 (43.2%) | 233 (56.8%) |
| Public Administration | 239 (62.2%) | 145 (37.8%) |
| Total | 3,143 (51.7%) | 2,938 (48.3%) |
Education in Gogebic County
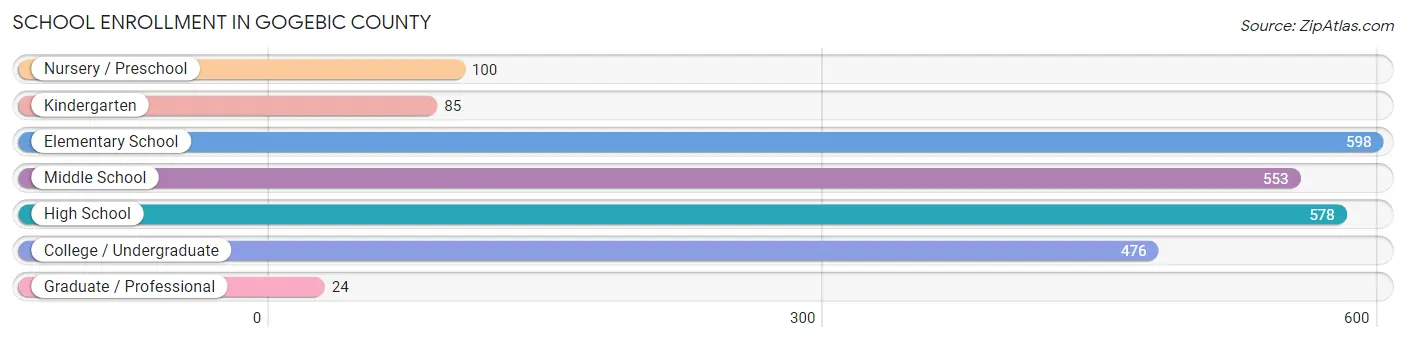
School Enrollment in Gogebic County
The most common levels of schooling among the 2,414 students in Gogebic County are elementary school (598 | 24.8%), high school (578 | 23.9%), and middle school (553 | 22.9%).
| School Level | # Students | % Students |
| Nursery / Preschool | 100 | 4.1% |
| Kindergarten | 85 | 3.5% |
| Elementary School | 598 | 24.8% |
| Middle School | 553 | 22.9% |
| High School | 578 | 23.9% |
| College / Undergraduate | 476 | 19.7% |
| Graduate / Professional | 24 | 1.0% |
| Total | 2,414 | 100.0% |
School Enrollment by Age by Funding Source in Gogebic County
Out of a total of 2,414 students who are enrolled in schools in Gogebic County, 299 (12.4%) attend a private institution, while the remaining 2,115 (87.6%) are enrolled in public schools. The age group of 3 to 4 year olds has the highest likelihood of being enrolled in private schools, with 14 (32.6% in the age bracket) enrolled. Conversely, the age group of 18 to 19 year olds has the lowest likelihood of being enrolled in a private school, with 145 (96.7% in the age bracket) attending a public institution.

| Age Bracket | Public School | Private School |
| 3 to 4 Year Olds | 29 (67.4%) | 14 (32.6%) |
| 5 to 9 Year Old | 504 (83.0%) | 103 (17.0%) |
| 10 to 14 Year Olds | 666 (89.0%) | 82 (11.0%) |
| 15 to 17 Year Olds | 395 (90.4%) | 42 (9.6%) |
| 18 to 19 Year Olds | 145 (96.7%) | 5 (3.3%) |
| 20 to 24 Year Olds | 223 (91.8%) | 20 (8.2%) |
| 25 to 34 Year Olds | 52 (82.5%) | 11 (17.5%) |
| 35 Years and over | 100 (81.3%) | 23 (18.7%) |
| Total | 2,115 (87.6%) | 299 (12.4%) |
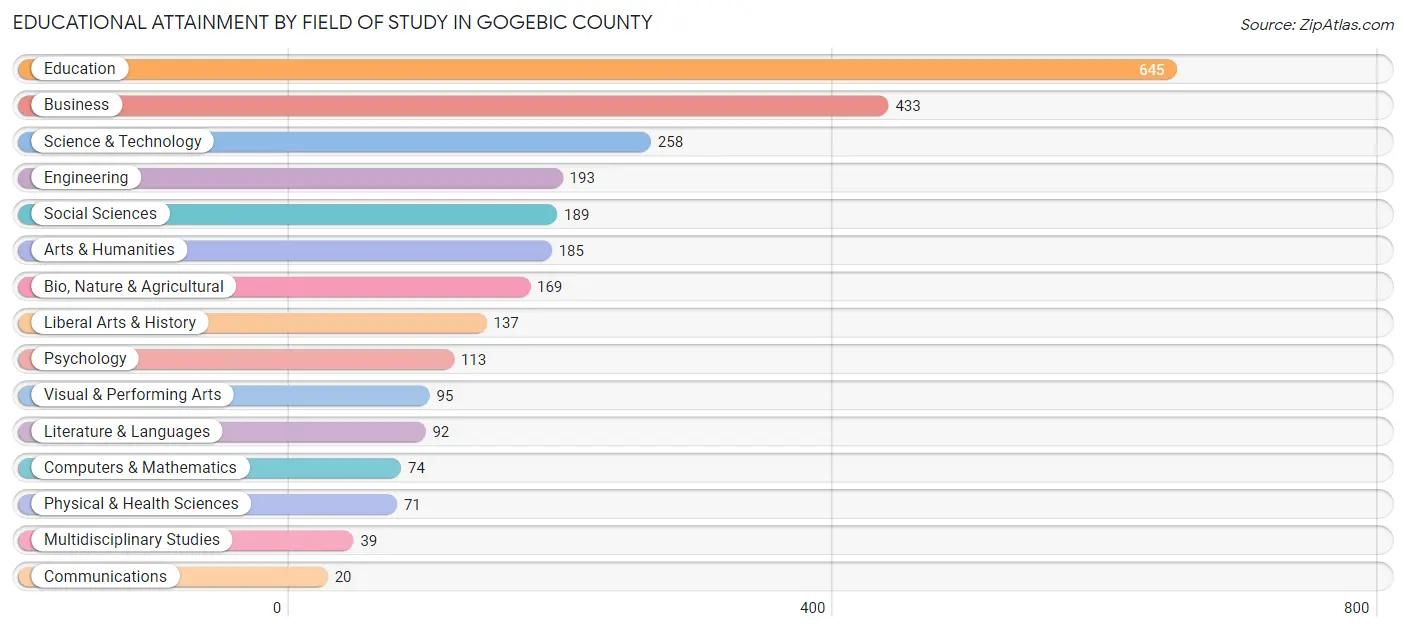
Educational Attainment by Field of Study in Gogebic County
Education (645 | 23.8%), business (433 | 16.0%), science & technology (258 | 9.5%), engineering (193 | 7.1%), and social sciences (189 | 7.0%) are the most common fields of study among 2,713 individuals in Gogebic County who have obtained a bachelor's degree or higher.
| Field of Study | # Graduates | % Graduates |
| Computers & Mathematics | 74 | 2.7% |
| Bio, Nature & Agricultural | 169 | 6.2% |
| Physical & Health Sciences | 71 | 2.6% |
| Psychology | 113 | 4.2% |
| Social Sciences | 189 | 7.0% |
| Engineering | 193 | 7.1% |
| Multidisciplinary Studies | 39 | 1.4% |
| Science & Technology | 258 | 9.5% |
| Business | 433 | 16.0% |
| Education | 645 | 23.8% |
| Literature & Languages | 92 | 3.4% |
| Liberal Arts & History | 137 | 5.1% |
| Visual & Performing Arts | 95 | 3.5% |
| Communications | 20 | 0.7% |
| Arts & Humanities | 185 | 6.8% |
| Total | 2,713 | 100.0% |
Transportation & Commute in Gogebic County
Vehicle Availability by Sex in Gogebic County
The most prevalent vehicle ownership categories in Gogebic County are males with 2 vehicles (1,583, accounting for 50.9%) and females with 2 vehicles (1,305, making up 54.5%).
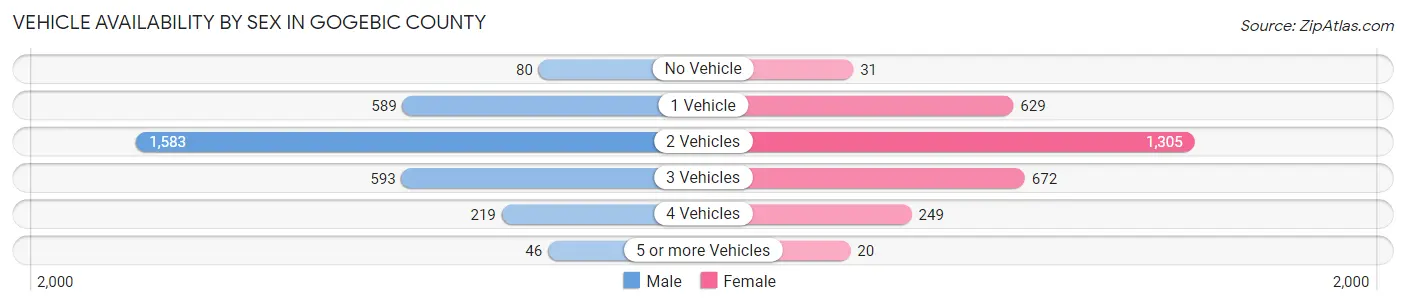
| Vehicles Available | Male | Female |
| No Vehicle | 80 (2.6%) | 31 (1.1%) |
| 1 Vehicle | 589 (18.9%) | 629 (21.6%) |
| 2 Vehicles | 1,583 (50.9%) | 1,305 (44.9%) |
| 3 Vehicles | 593 (19.1%) | 672 (23.1%) |
| 4 Vehicles | 219 (7.0%) | 249 (8.6%) |
| 5 or more Vehicles | 46 (1.5%) | 20 (0.7%) |
| Total | 3,110 (100.0%) | 2,906 (100.0%) |
Commute Time in Gogebic County
The most frequently occuring commute durations in Gogebic County are 5 to 9 minutes (1,323 commuters, 23.4%), 10 to 14 minutes (1,102 commuters, 19.5%), and 15 to 19 minutes (885 commuters, 15.7%).
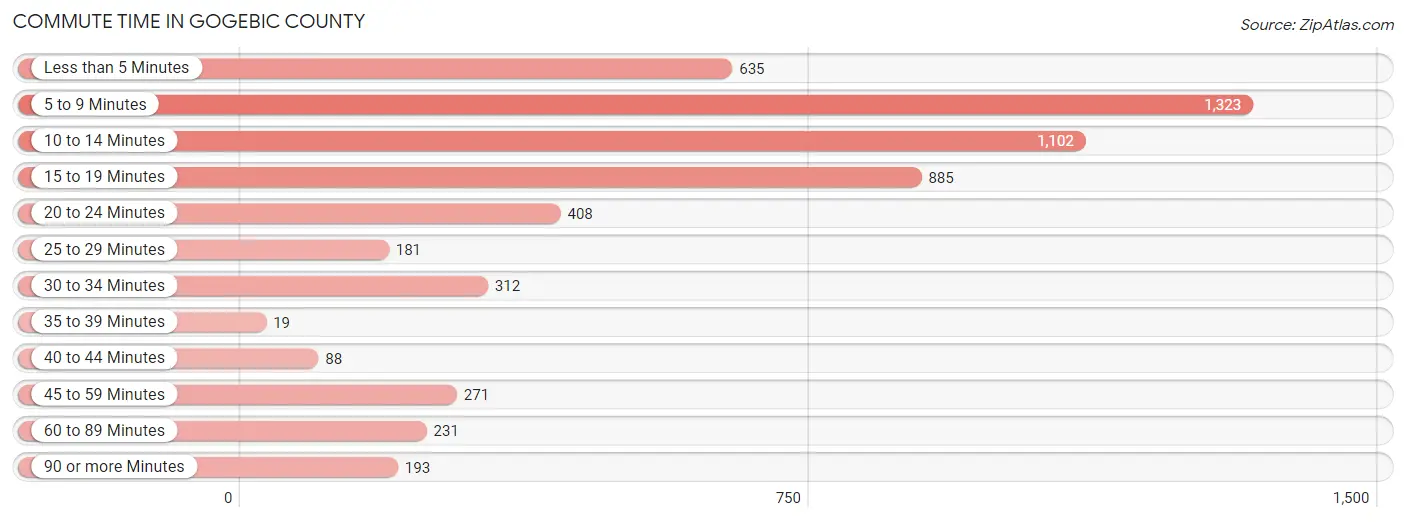
| Commute Time | # Commuters | % Commuters |
| Less than 5 Minutes | 635 | 11.2% |
| 5 to 9 Minutes | 1,323 | 23.4% |
| 10 to 14 Minutes | 1,102 | 19.5% |
| 15 to 19 Minutes | 885 | 15.7% |
| 20 to 24 Minutes | 408 | 7.2% |
| 25 to 29 Minutes | 181 | 3.2% |
| 30 to 34 Minutes | 312 | 5.5% |
| 35 to 39 Minutes | 19 | 0.3% |
| 40 to 44 Minutes | 88 | 1.6% |
| 45 to 59 Minutes | 271 | 4.8% |
| 60 to 89 Minutes | 231 | 4.1% |
| 90 or more Minutes | 193 | 3.4% |
Commute Time by Sex in Gogebic County
The most common commute times in Gogebic County are 5 to 9 minutes (636 commuters, 21.1%) for males and 5 to 9 minutes (687 commuters, 26.1%) for females.

| Commute Time | Male | Female |
| Less than 5 Minutes | 270 (8.9%) | 365 (13.9%) |
| 5 to 9 Minutes | 636 (21.1%) | 687 (26.1%) |
| 10 to 14 Minutes | 605 (20.0%) | 497 (18.9%) |
| 15 to 19 Minutes | 392 (13.0%) | 493 (18.8%) |
| 20 to 24 Minutes | 182 (6.0%) | 226 (8.6%) |
| 25 to 29 Minutes | 112 (3.7%) | 69 (2.6%) |
| 30 to 34 Minutes | 231 (7.6%) | 81 (3.1%) |
| 35 to 39 Minutes | 3 (0.1%) | 16 (0.6%) |
| 40 to 44 Minutes | 83 (2.8%) | 5 (0.2%) |
| 45 to 59 Minutes | 203 (6.7%) | 68 (2.6%) |
| 60 to 89 Minutes | 160 (5.3%) | 71 (2.7%) |
| 90 or more Minutes | 143 (4.7%) | 50 (1.9%) |
Time of Departure to Work by Sex in Gogebic County
The most frequent times of departure to work in Gogebic County are 6:00 AM to 6:29 AM (381, 12.6%) for males and 7:30 AM to 7:59 AM (467, 17.8%) for females.
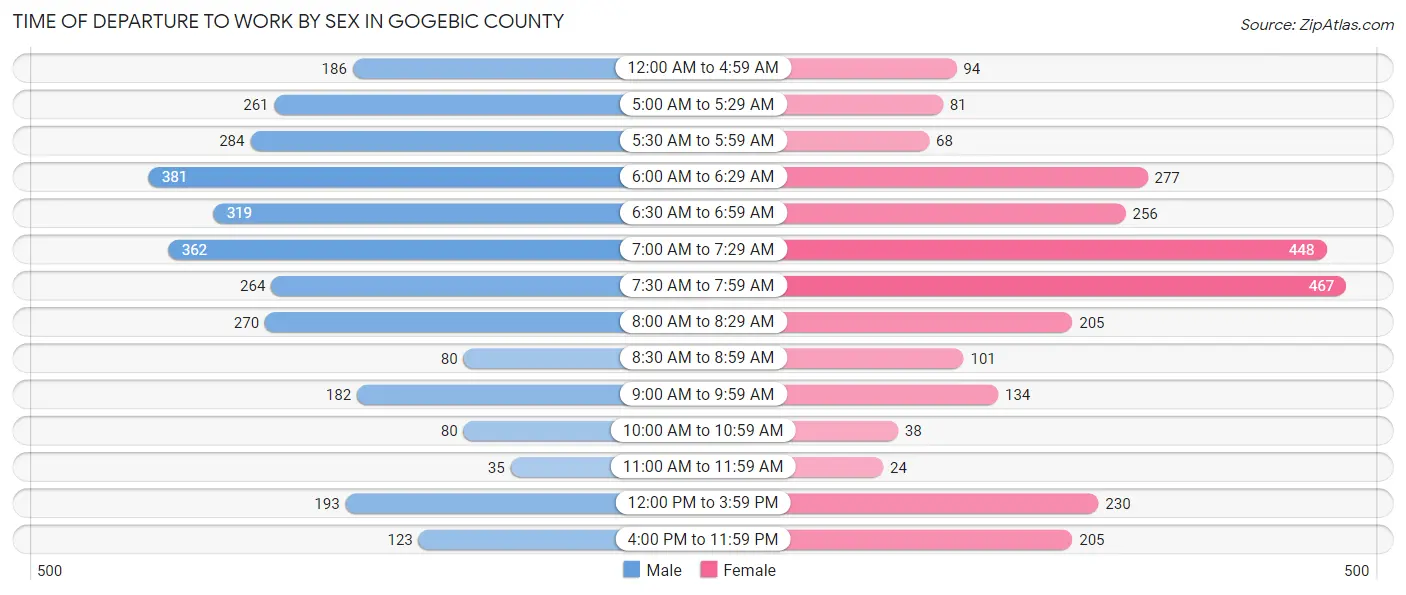
| Time of Departure | Male | Female |
| 12:00 AM to 4:59 AM | 186 (6.2%) | 94 (3.6%) |
| 5:00 AM to 5:29 AM | 261 (8.6%) | 81 (3.1%) |
| 5:30 AM to 5:59 AM | 284 (9.4%) | 68 (2.6%) |
| 6:00 AM to 6:29 AM | 381 (12.6%) | 277 (10.5%) |
| 6:30 AM to 6:59 AM | 319 (10.6%) | 256 (9.7%) |
| 7:00 AM to 7:29 AM | 362 (12.0%) | 448 (17.1%) |
| 7:30 AM to 7:59 AM | 264 (8.7%) | 467 (17.8%) |
| 8:00 AM to 8:29 AM | 270 (8.9%) | 205 (7.8%) |
| 8:30 AM to 8:59 AM | 80 (2.6%) | 101 (3.8%) |
| 9:00 AM to 9:59 AM | 182 (6.0%) | 134 (5.1%) |
| 10:00 AM to 10:59 AM | 80 (2.6%) | 38 (1.5%) |
| 11:00 AM to 11:59 AM | 35 (1.2%) | 24 (0.9%) |
| 12:00 PM to 3:59 PM | 193 (6.4%) | 230 (8.7%) |
| 4:00 PM to 11:59 PM | 123 (4.1%) | 205 (7.8%) |
| Total | 3,020 (100.0%) | 2,628 (100.0%) |
Housing Occupancy in Gogebic County
Occupancy by Ownership in Gogebic County
Of the total 6,937 dwellings in Gogebic County, owner-occupied units account for 5,732 (82.6%), while renter-occupied units make up 1,205 (17.4%).
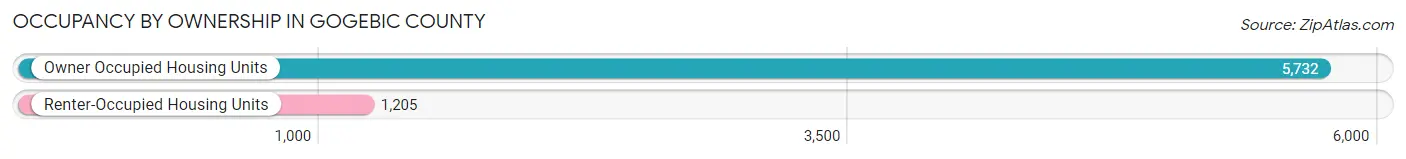
| Occupancy | # Housing Units | % Housing Units |
| Owner Occupied Housing Units | 5,732 | 82.6% |
| Renter-Occupied Housing Units | 1,205 | 17.4% |
| Total Occupied Housing Units | 6,937 | 100.0% |
Occupancy by Household Size in Gogebic County
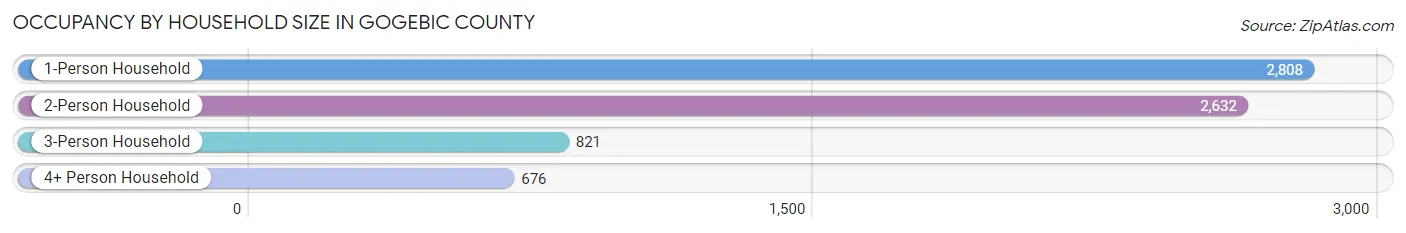
| Household Size | # Housing Units | % Housing Units |
| 1-Person Household | 2,808 | 40.5% |
| 2-Person Household | 2,632 | 37.9% |
| 3-Person Household | 821 | 11.8% |
| 4+ Person Household | 676 | 9.7% |
| Total Housing Units | 6,937 | 100.0% |
Occupancy by Ownership by Household Size in Gogebic County

| Household Size | Owner-occupied | Renter-occupied |
| 1-Person Household | 2,103 (74.9%) | 705 (25.1%) |
| 2-Person Household | 2,352 (89.4%) | 280 (10.6%) |
| 3-Person Household | 717 (87.3%) | 104 (12.7%) |
| 4+ Person Household | 560 (82.8%) | 116 (17.2%) |
| Total Housing Units | 5,732 (82.6%) | 1,205 (17.4%) |
Occupancy by Educational Attainment in Gogebic County
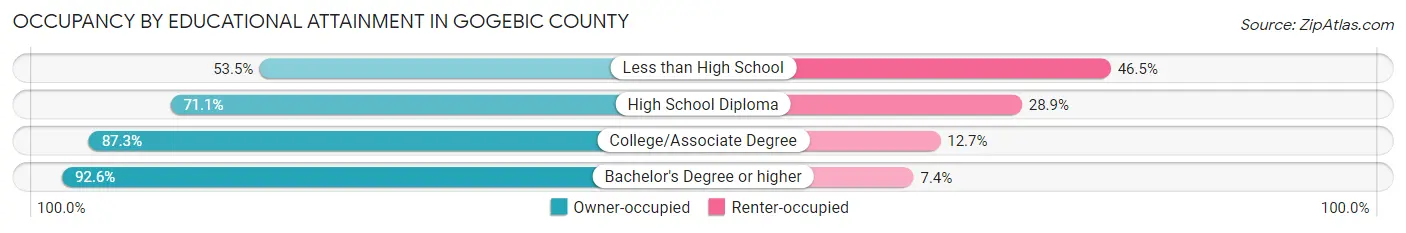
| Household Size | Owner-occupied | Renter-occupied |
| Less than High School | 115 (53.5%) | 100 (46.5%) |
| High School Diploma | 1,471 (71.1%) | 597 (28.9%) |
| College/Associate Degree | 2,683 (87.3%) | 391 (12.7%) |
| Bachelor's Degree or higher | 1,463 (92.6%) | 117 (7.4%) |
Occupancy by Age of Householder in Gogebic County
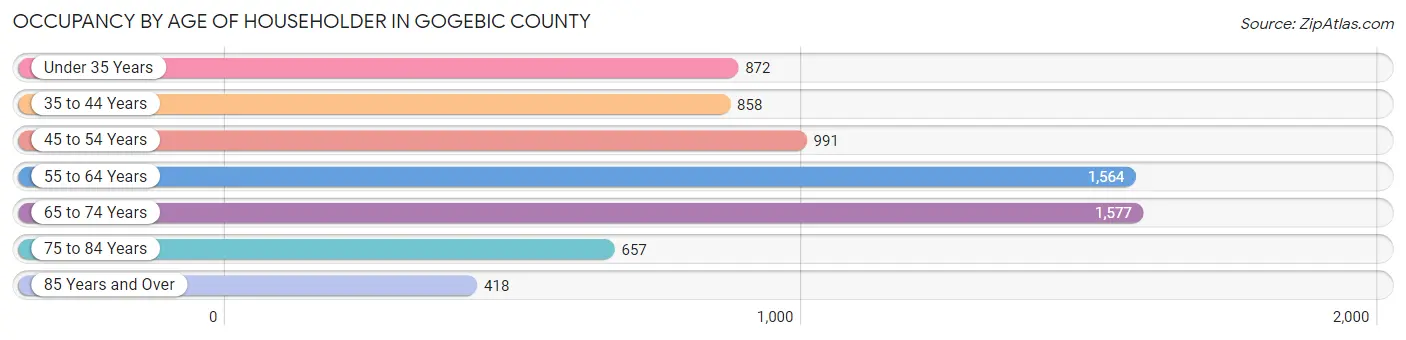
| Age Bracket | # Households | % Households |
| Under 35 Years | 872 | 12.6% |
| 35 to 44 Years | 858 | 12.4% |
| 45 to 54 Years | 991 | 14.3% |
| 55 to 64 Years | 1,564 | 22.6% |
| 65 to 74 Years | 1,577 | 22.7% |
| 75 to 84 Years | 657 | 9.5% |
| 85 Years and Over | 418 | 6.0% |
| Total | 6,937 | 100.0% |
Housing Finances in Gogebic County
Median Income by Occupancy in Gogebic County

| Occupancy Type | # Households | Median Income |
| Owner-Occupied | 5,732 (82.6%) | $55,548 |
| Renter-Occupied | 1,205 (17.4%) | $21,345 |
| Average | 6,937 (100.0%) | $47,913 |
Occupancy by Householder Income Bracket in Gogebic County
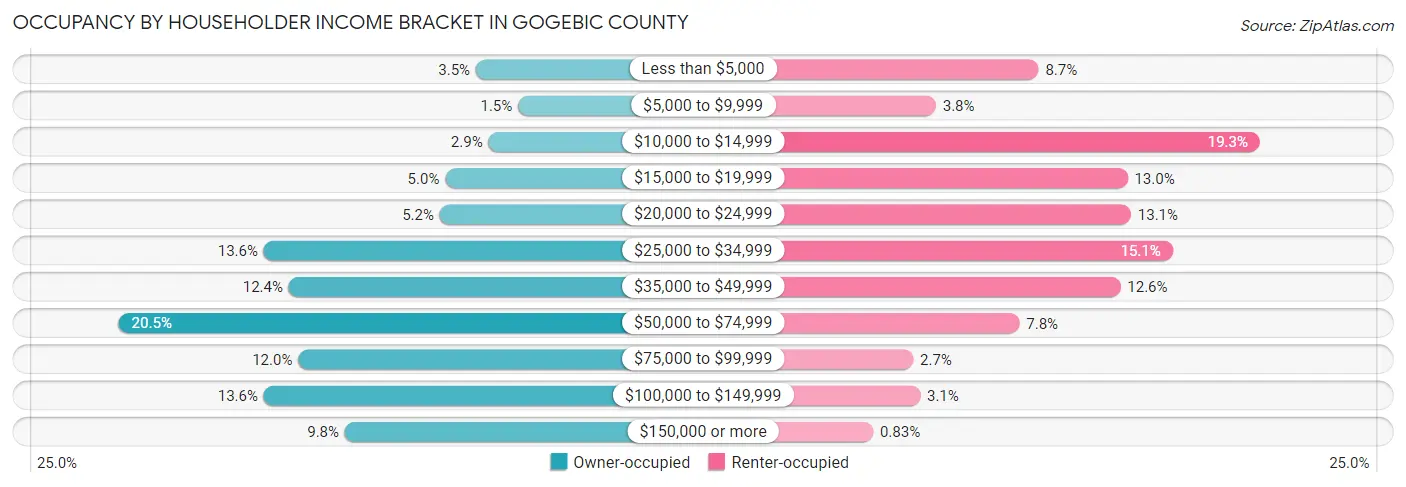
| Income Bracket | Owner-occupied | Renter-occupied |
| Less than $5,000 | 201 (3.5%) | 105 (8.7%) |
| $5,000 to $9,999 | 86 (1.5%) | 46 (3.8%) |
| $10,000 to $14,999 | 167 (2.9%) | 232 (19.3%) |
| $15,000 to $19,999 | 285 (5.0%) | 156 (13.0%) |
| $20,000 to $24,999 | 300 (5.2%) | 158 (13.1%) |
| $25,000 to $34,999 | 780 (13.6%) | 182 (15.1%) |
| $35,000 to $49,999 | 712 (12.4%) | 152 (12.6%) |
| $50,000 to $74,999 | 1,176 (20.5%) | 94 (7.8%) |
| $75,000 to $99,999 | 686 (12.0%) | 33 (2.7%) |
| $100,000 to $149,999 | 780 (13.6%) | 37 (3.1%) |
| $150,000 or more | 559 (9.8%) | 10 (0.8%) |
| Total | 5,732 (100.0%) | 1,205 (100.0%) |
Monthly Housing Cost Tiers in Gogebic County
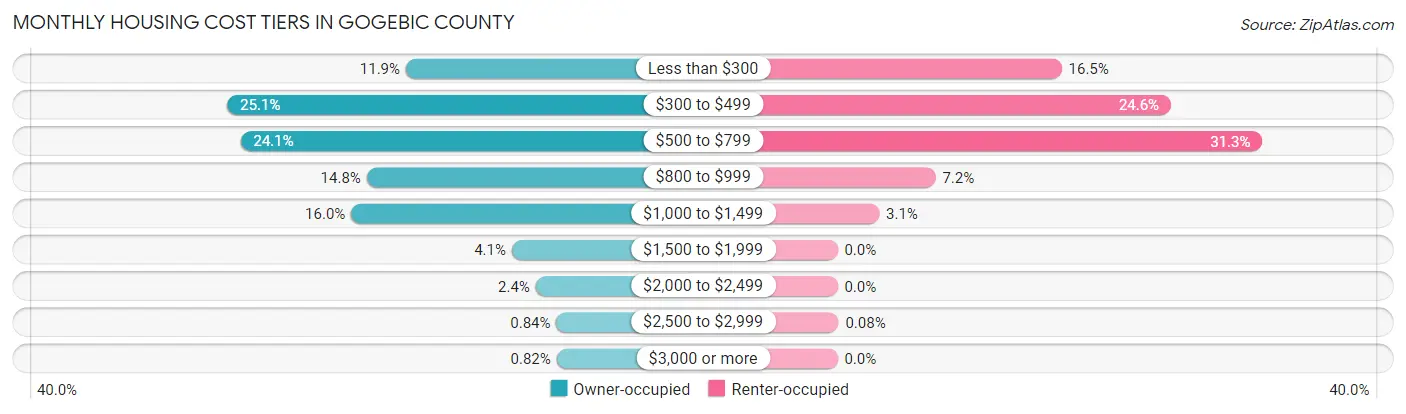
| Monthly Cost | Owner-occupied | Renter-occupied |
| Less than $300 | 683 (11.9%) | 199 (16.5%) |
| $300 to $499 | 1,438 (25.1%) | 296 (24.6%) |
| $500 to $799 | 1,382 (24.1%) | 377 (31.3%) |
| $800 to $999 | 849 (14.8%) | 87 (7.2%) |
| $1,000 to $1,499 | 914 (16.0%) | 37 (3.1%) |
| $1,500 to $1,999 | 236 (4.1%) | 0 (0.0%) |
| $2,000 to $2,499 | 135 (2.4%) | 0 (0.0%) |
| $2,500 to $2,999 | 48 (0.8%) | 1 (0.1%) |
| $3,000 or more | 47 (0.8%) | 0 (0.0%) |
| Total | 5,732 (100.0%) | 1,205 (100.0%) |
Physical Housing Characteristics in Gogebic County
Housing Structures in Gogebic County
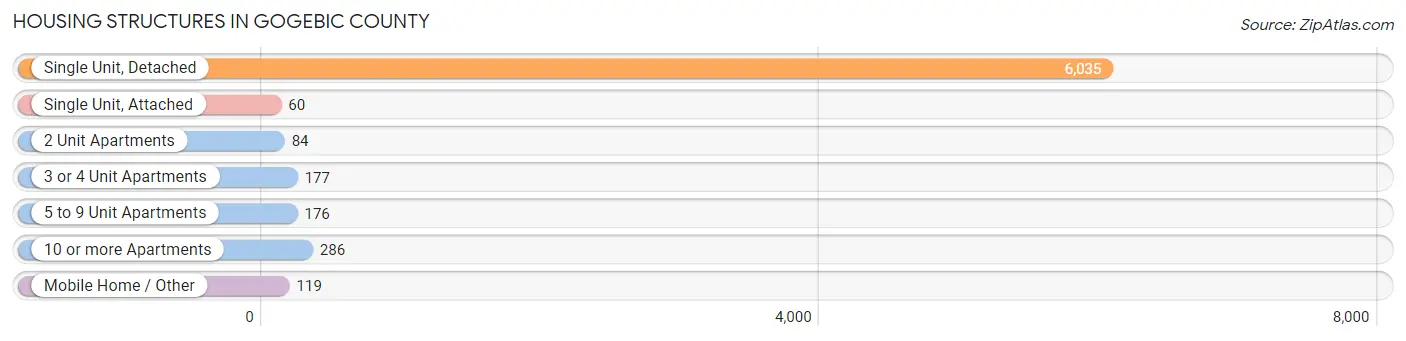
| Structure Type | # Housing Units | % Housing Units |
| Single Unit, Detached | 6,035 | 87.0% |
| Single Unit, Attached | 60 | 0.9% |
| 2 Unit Apartments | 84 | 1.2% |
| 3 or 4 Unit Apartments | 177 | 2.5% |
| 5 to 9 Unit Apartments | 176 | 2.5% |
| 10 or more Apartments | 286 | 4.1% |
| Mobile Home / Other | 119 | 1.7% |
| Total | 6,937 | 100.0% |
Housing Structures by Occupancy in Gogebic County
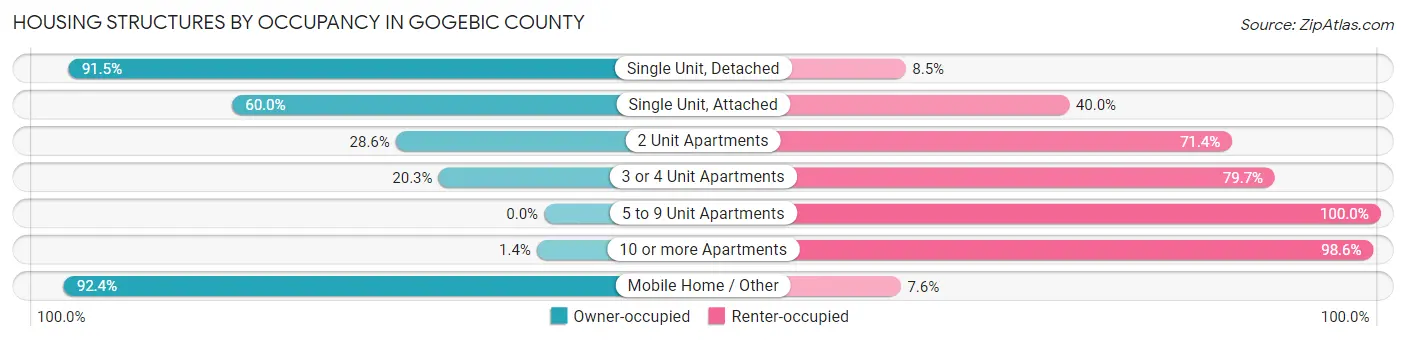
| Structure Type | Owner-occupied | Renter-occupied |
| Single Unit, Detached | 5,522 (91.5%) | 513 (8.5%) |
| Single Unit, Attached | 36 (60.0%) | 24 (40.0%) |
| 2 Unit Apartments | 24 (28.6%) | 60 (71.4%) |
| 3 or 4 Unit Apartments | 36 (20.3%) | 141 (79.7%) |
| 5 to 9 Unit Apartments | 0 (0.0%) | 176 (100.0%) |
| 10 or more Apartments | 4 (1.4%) | 282 (98.6%) |
| Mobile Home / Other | 110 (92.4%) | 9 (7.6%) |
| Total | 5,732 (82.6%) | 1,205 (17.4%) |
Housing Structures by Number of Rooms in Gogebic County
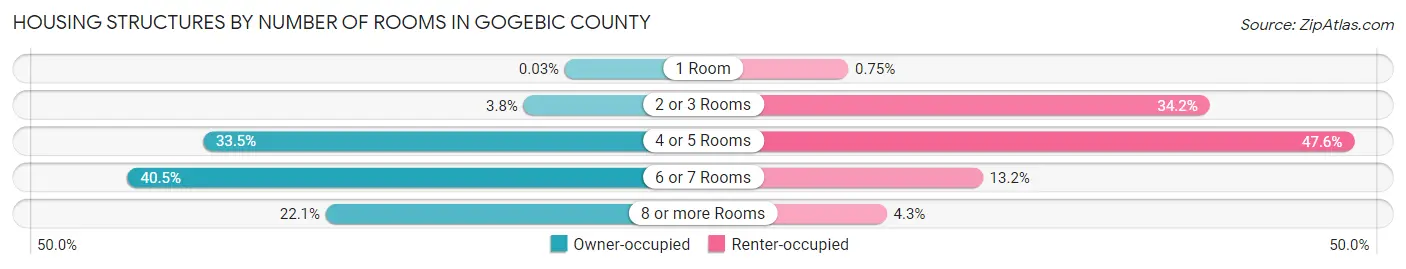
| Number of Rooms | Owner-occupied | Renter-occupied |
| 1 Room | 2 (0.0%) | 9 (0.7%) |
| 2 or 3 Rooms | 220 (3.8%) | 412 (34.2%) |
| 4 or 5 Rooms | 1,921 (33.5%) | 573 (47.5%) |
| 6 or 7 Rooms | 2,320 (40.5%) | 159 (13.2%) |
| 8 or more Rooms | 1,269 (22.1%) | 52 (4.3%) |
| Total | 5,732 (100.0%) | 1,205 (100.0%) |
Housing Structure by Heating Type in Gogebic County
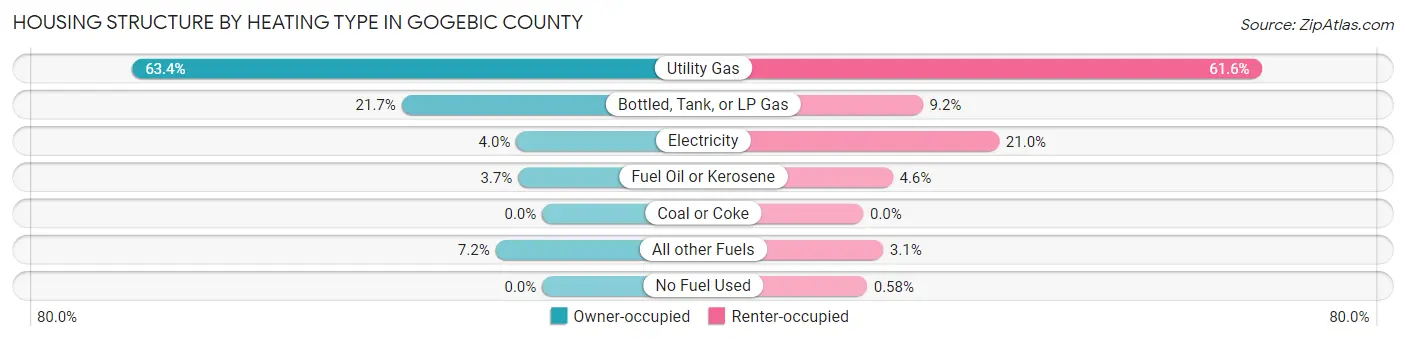
| Heating Type | Owner-occupied | Renter-occupied |
| Utility Gas | 3,632 (63.4%) | 742 (61.6%) |
| Bottled, Tank, or LP Gas | 1,245 (21.7%) | 111 (9.2%) |
| Electricity | 229 (4.0%) | 253 (21.0%) |
| Fuel Oil or Kerosene | 213 (3.7%) | 55 (4.6%) |
| Coal or Coke | 0 (0.0%) | 0 (0.0%) |
| All other Fuels | 413 (7.2%) | 37 (3.1%) |
| No Fuel Used | 0 (0.0%) | 7 (0.6%) |
| Total | 5,732 (100.0%) | 1,205 (100.0%) |
Household Vehicle Usage in Gogebic County

| Vehicles per Household | Owner-occupied | Renter-occupied |
| No Vehicle | 221 (3.9%) | 355 (29.5%) |
| 1 Vehicle | 1,850 (32.3%) | 611 (50.7%) |
| 2 Vehicles | 2,517 (43.9%) | 204 (16.9%) |
| 3 or more Vehicles | 1,144 (20.0%) | 35 (2.9%) |
| Total | 5,732 (100.0%) | 1,205 (100.0%) |
Real Estate & Mortgages in Gogebic County
Real Estate and Mortgage Overview in Gogebic County
| Characteristic | Without Mortgage | With Mortgage |
| Housing Units | 3,272 | 2,460 |
| Median Property Value | $72,000 | $111,100 |
| Median Household Income | $43,836 | $326 |
| Monthly Housing Costs | $435 | $47 |
| Real Estate Taxes | $1,280 | $14 |
Property Value by Mortgage Status in Gogebic County

| Property Value | Without Mortgage | With Mortgage |
| Less than $50,000 | 1,130 (34.5%) | 453 (18.4%) |
| $50,000 to $99,999 | 962 (29.4%) | 635 (25.8%) |
| $100,000 to $299,999 | 969 (29.6%) | 1,046 (42.5%) |
| $300,000 to $499,999 | 127 (3.9%) | 244 (9.9%) |
| $500,000 to $749,999 | 42 (1.3%) | 38 (1.5%) |
| $750,000 to $999,999 | 26 (0.8%) | 35 (1.4%) |
| $1,000,000 or more | 16 (0.5%) | 9 (0.4%) |
| Total | 3,272 (100.0%) | 2,460 (100.0%) |
Household Income by Mortgage Status in Gogebic County
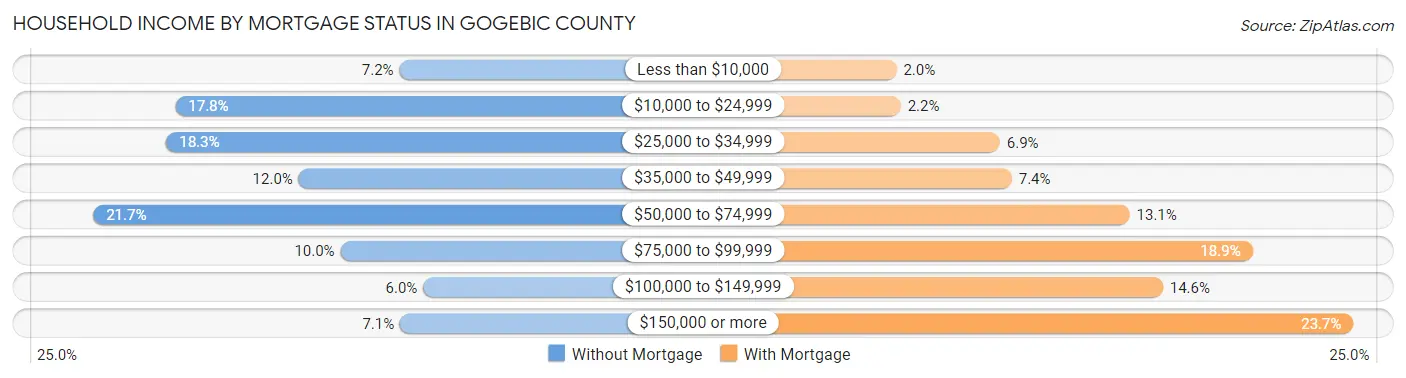
| Household Income | Without Mortgage | With Mortgage |
| Less than $10,000 | 234 (7.1%) | 48 (1.9%) |
| $10,000 to $24,999 | 583 (17.8%) | 53 (2.1%) |
| $25,000 to $34,999 | 597 (18.2%) | 169 (6.9%) |
| $35,000 to $49,999 | 391 (11.9%) | 183 (7.4%) |
| $50,000 to $74,999 | 711 (21.7%) | 321 (13.1%) |
| $75,000 to $99,999 | 326 (10.0%) | 465 (18.9%) |
| $100,000 to $149,999 | 197 (6.0%) | 360 (14.6%) |
| $150,000 or more | 233 (7.1%) | 583 (23.7%) |
| Total | 3,272 (100.0%) | 2,460 (100.0%) |
Property Value to Household Income Ratio in Gogebic County
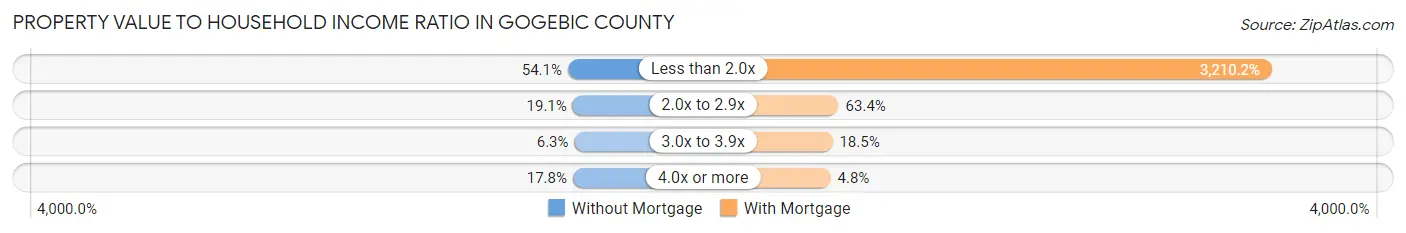
| Value-to-Income Ratio | Without Mortgage | With Mortgage |
| Less than 2.0x | 1,769 (54.1%) | 78,971 (3,210.2%) |
| 2.0x to 2.9x | 624 (19.1%) | 1,560 (63.4%) |
| 3.0x to 3.9x | 206 (6.3%) | 454 (18.5%) |
| 4.0x or more | 582 (17.8%) | 119 (4.8%) |
| Total | 3,272 (100.0%) | 2,460 (100.0%) |
Real Estate Taxes by Mortgage Status in Gogebic County

| Property Taxes | Without Mortgage | With Mortgage |
| Less than $800 | 851 (26.0%) | 0 (0.0%) |
| $800 to $1,499 | 1,058 (32.3%) | 324 (13.2%) |
| $800 to $1,499 | 1,255 (38.4%) | 671 (27.3%) |
| Total | 3,272 (100.0%) | 2,460 (100.0%) |
Health & Disability in Gogebic County
Health Insurance Coverage by Age in Gogebic County
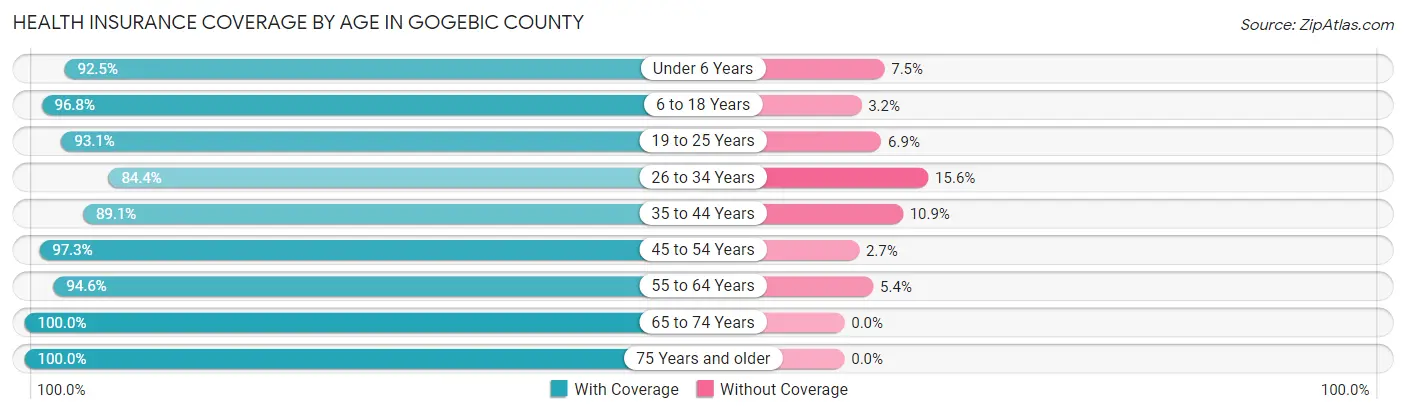
| Age Bracket | With Coverage | Without Coverage |
| Under 6 Years | 670 (92.5%) | 54 (7.5%) |
| 6 to 18 Years | 1,745 (96.8%) | 57 (3.2%) |
| 19 to 25 Years | 841 (93.1%) | 62 (6.9%) |
| 26 to 34 Years | 1,122 (84.4%) | 208 (15.6%) |
| 35 to 44 Years | 1,325 (89.1%) | 162 (10.9%) |
| 45 to 54 Years | 1,562 (97.3%) | 44 (2.7%) |
| 55 to 64 Years | 2,374 (94.6%) | 135 (5.4%) |
| 65 to 74 Years | 2,348 (100.0%) | 0 (0.0%) |
| 75 Years and older | 1,489 (100.0%) | 0 (0.0%) |
| Total | 13,476 (94.9%) | 722 (5.1%) |
Health Insurance Coverage by Citizenship Status in Gogebic County
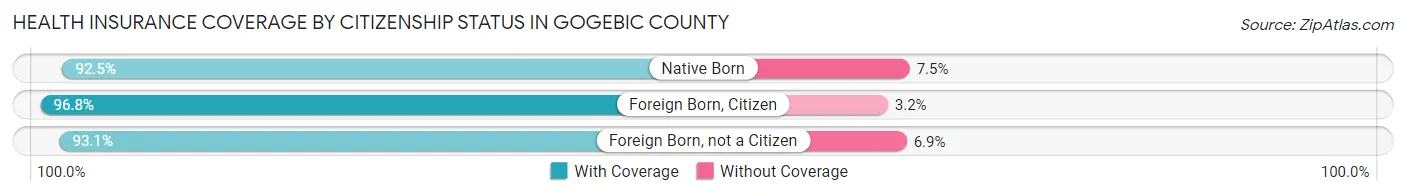
| Citizenship Status | With Coverage | Without Coverage |
| Native Born | 670 (92.5%) | 54 (7.5%) |
| Foreign Born, Citizen | 1,745 (96.8%) | 57 (3.2%) |
| Foreign Born, not a Citizen | 841 (93.1%) | 62 (6.9%) |
Health Insurance Coverage by Household Income in Gogebic County
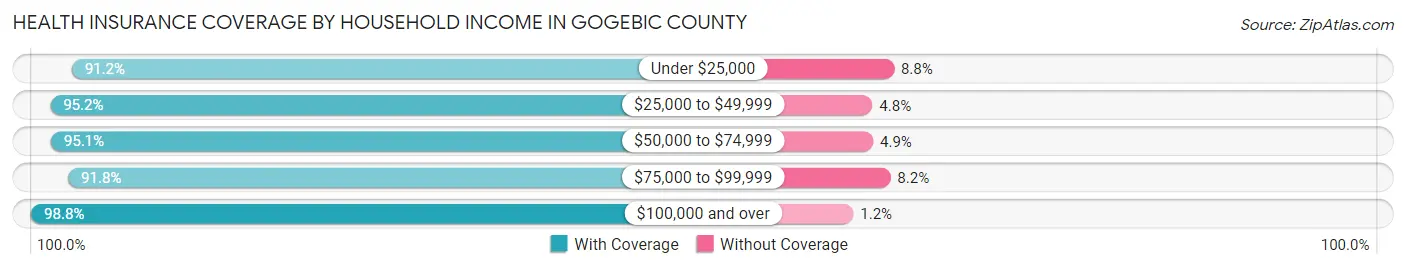
| Household Income | With Coverage | Without Coverage |
| Under $25,000 | 2,323 (91.2%) | 225 (8.8%) |
| $25,000 to $49,999 | 3,037 (95.2%) | 153 (4.8%) |
| $50,000 to $74,999 | 2,466 (95.1%) | 128 (4.9%) |
| $75,000 to $99,999 | 1,732 (91.8%) | 154 (8.2%) |
| $100,000 and over | 3,848 (98.8%) | 48 (1.2%) |
Public vs Private Health Insurance Coverage by Age in Gogebic County
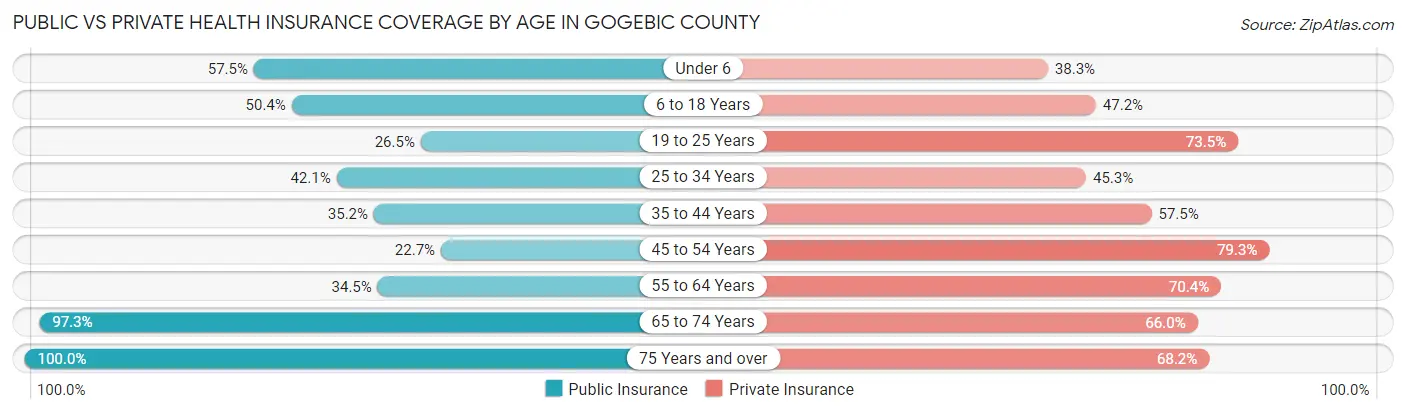
| Age Bracket | Public Insurance | Private Insurance |
| Under 6 | 416 (57.5%) | 277 (38.3%) |
| 6 to 18 Years | 909 (50.4%) | 850 (47.2%) |
| 19 to 25 Years | 239 (26.5%) | 664 (73.5%) |
| 25 to 34 Years | 560 (42.1%) | 603 (45.3%) |
| 35 to 44 Years | 523 (35.2%) | 855 (57.5%) |
| 45 to 54 Years | 365 (22.7%) | 1,274 (79.3%) |
| 55 to 64 Years | 865 (34.5%) | 1,766 (70.4%) |
| 65 to 74 Years | 2,284 (97.3%) | 1,550 (66.0%) |
| 75 Years and over | 1,489 (100.0%) | 1,015 (68.2%) |
| Total | 7,650 (53.9%) | 8,854 (62.4%) |
Disability Status by Sex by Age in Gogebic County
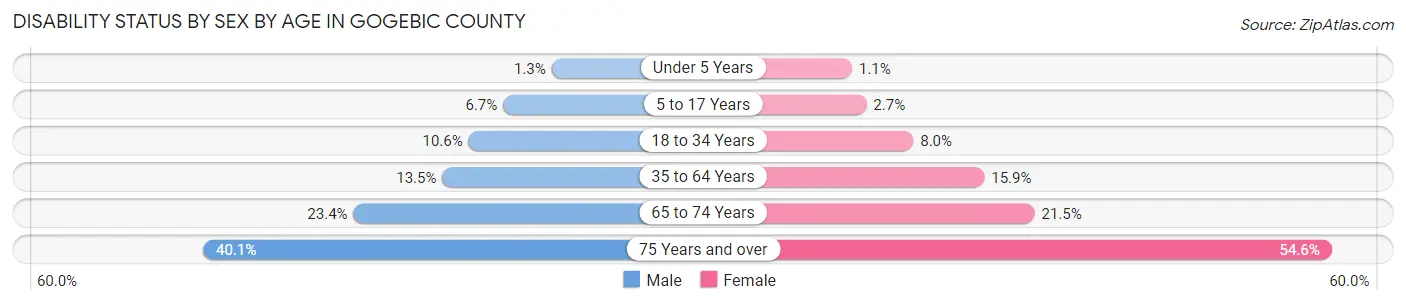
| Age Bracket | Male | Female |
| Under 5 Years | 4 (1.3%) | 3 (1.1%) |
| 5 to 17 Years | 66 (6.7%) | 23 (2.7%) |
| 18 to 34 Years | 128 (10.6%) | 92 (8.0%) |
| 35 to 64 Years | 399 (13.5%) | 419 (15.9%) |
| 65 to 74 Years | 292 (23.4%) | 236 (21.5%) |
| 75 Years and over | 262 (40.1%) | 456 (54.5%) |
Disability Class by Sex by Age in Gogebic County
Disability Class: Hearing Difficulty
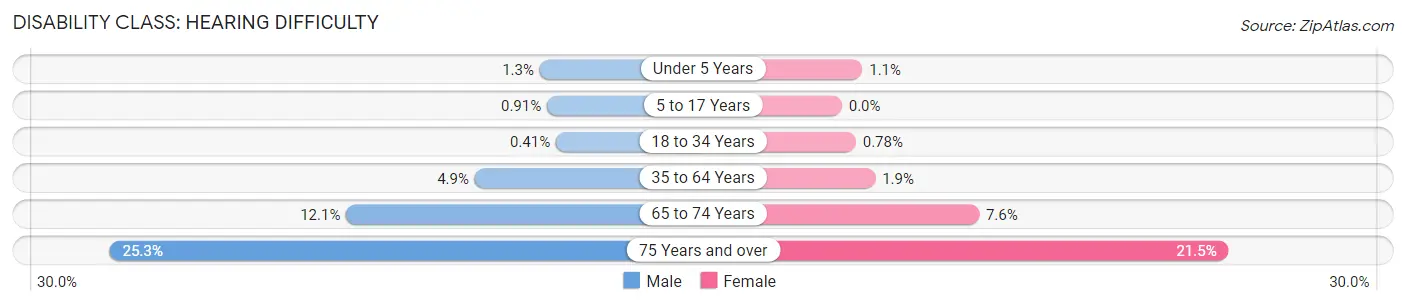
| Age Bracket | Male | Female |
| Under 5 Years | 4 (1.3%) | 3 (1.1%) |
| 5 to 17 Years | 9 (0.9%) | 0 (0.0%) |
| 18 to 34 Years | 5 (0.4%) | 9 (0.8%) |
| 35 to 64 Years | 146 (4.9%) | 49 (1.9%) |
| 65 to 74 Years | 151 (12.1%) | 84 (7.6%) |
| 75 Years and over | 165 (25.3%) | 180 (21.5%) |
Disability Class: Vision Difficulty
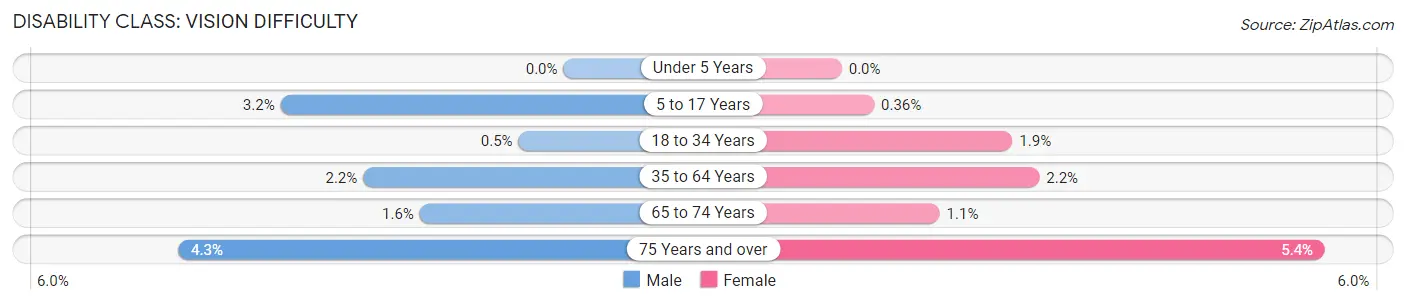
| Age Bracket | Male | Female |
| Under 5 Years | 0 (0.0%) | 0 (0.0%) |
| 5 to 17 Years | 31 (3.2%) | 3 (0.4%) |
| 18 to 34 Years | 6 (0.5%) | 22 (1.9%) |
| 35 to 64 Years | 66 (2.2%) | 58 (2.2%) |
| 65 to 74 Years | 20 (1.6%) | 12 (1.1%) |
| 75 Years and over | 28 (4.3%) | 45 (5.4%) |
Disability Class: Cognitive Difficulty
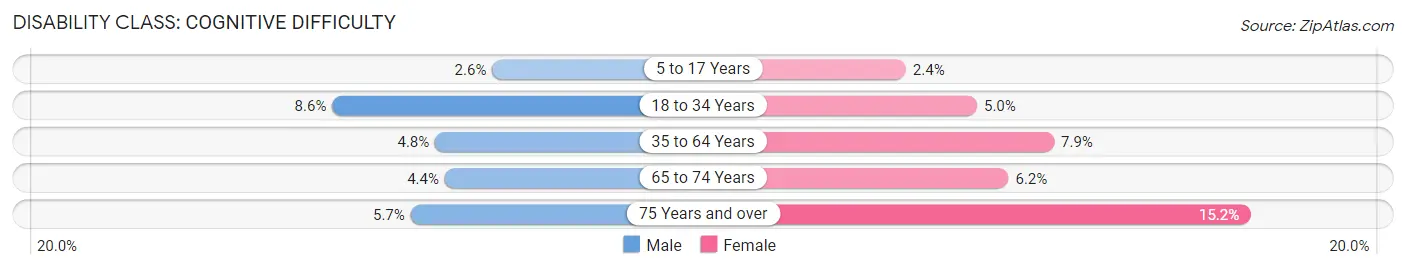
| Age Bracket | Male | Female |
| 5 to 17 Years | 26 (2.6%) | 20 (2.4%) |
| 18 to 34 Years | 104 (8.6%) | 58 (5.0%) |
| 35 to 64 Years | 141 (4.8%) | 208 (7.9%) |
| 65 to 74 Years | 55 (4.4%) | 68 (6.2%) |
| 75 Years and over | 37 (5.7%) | 127 (15.2%) |
Disability Class: Ambulatory Difficulty
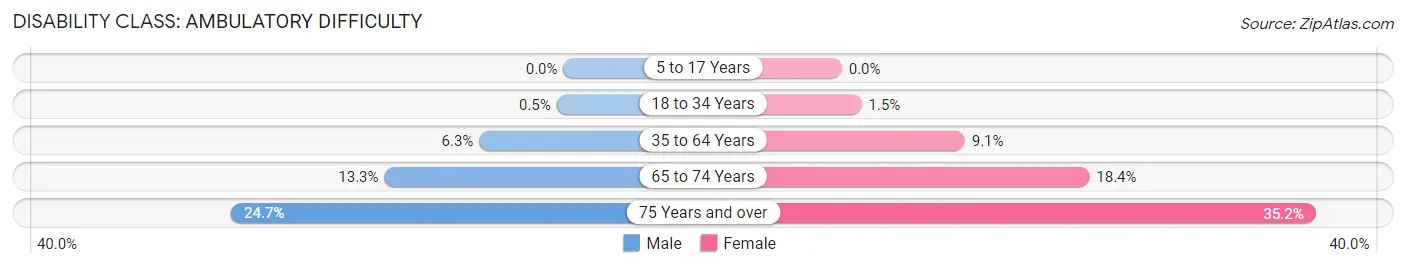
| Age Bracket | Male | Female |
| 5 to 17 Years | 0 (0.0%) | 0 (0.0%) |
| 18 to 34 Years | 6 (0.5%) | 17 (1.5%) |
| 35 to 64 Years | 185 (6.2%) | 241 (9.1%) |
| 65 to 74 Years | 166 (13.3%) | 202 (18.4%) |
| 75 Years and over | 161 (24.7%) | 294 (35.2%) |
Disability Class: Self-Care Difficulty

| Age Bracket | Male | Female |
| 5 to 17 Years | 8 (0.8%) | 0 (0.0%) |
| 18 to 34 Years | 0 (0.0%) | 12 (1.0%) |
| 35 to 64 Years | 51 (1.7%) | 80 (3.0%) |
| 65 to 74 Years | 73 (5.8%) | 59 (5.4%) |
| 75 Years and over | 25 (3.8%) | 105 (12.6%) |
Technology Access in Gogebic County
Computing Device Access in Gogebic County
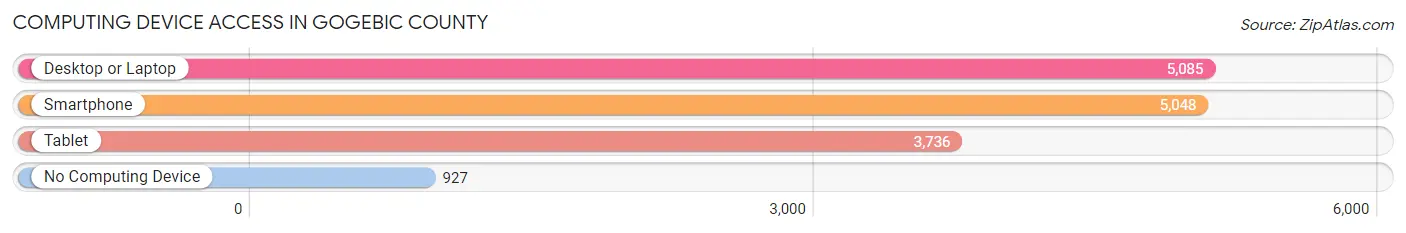
| Device Type | # Households | % Households |
| Desktop or Laptop | 5,085 | 73.3% |
| Smartphone | 5,048 | 72.8% |
| Tablet | 3,736 | 53.9% |
| No Computing Device | 927 | 13.4% |
| Total | 6,937 | 100.0% |
Internet Access in Gogebic County
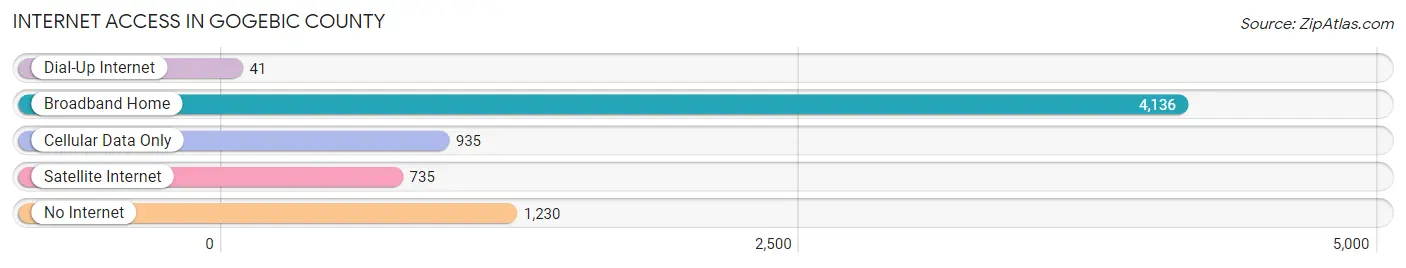
| Internet Type | # Households | % Households |
| Dial-Up Internet | 41 | 0.6% |
| Broadband Home | 4,136 | 59.6% |
| Cellular Data Only | 935 | 13.5% |
| Satellite Internet | 735 | 10.6% |
| No Internet | 1,230 | 17.7% |
| Total | 6,937 | 100.0% |
Gogebic County Summary
Gogebic County is located in the Upper Peninsula of Michigan, and is bordered by Iron County to the east, Ontonagon County to the north, and Ironwood Township to the south. The county seat is Bessemer, and the county is home to a population of 16,427 people, according to the 2010 census.
History
Gogebic County was established in 1887, and was named after the Gogebic Range, a mountain range located in the area. The county was originally part of Iron County, and was created to provide better access to the area’s natural resources. The county was originally populated by Native Americans, and the first European settlers arrived in the area in the late 1800s. The area was heavily logged in the late 19th and early 20th centuries, and the logging industry was the primary source of employment for many of the county’s residents.
Geography
Gogebic County is located in the western part of the Upper Peninsula of Michigan, and is bordered by Iron County to the east, Ontonagon County to the north, and Ironwood Township to the south. The county is home to a total area of 1,845 square miles, of which 1,837 square miles is land and 8 square miles is water. The county is home to several lakes, including Lake Gogebic, which is the largest lake in the county. The county is also home to the Porcupine Mountains State Park, which is a popular destination for outdoor recreation.
Economy
The economy of Gogebic County is largely based on tourism and natural resources. The county is home to several ski resorts, which attract visitors from all over the Midwest. The county is also home to several mining operations, which provide employment for many of the county’s residents. The county is also home to several manufacturing companies, which produce a variety of products, including furniture, paper products, and automotive parts.
Demographics
According to the 2010 census, Gogebic County had a population of 16,427 people. The population was spread out with a median age of 44.7 years. The racial makeup of the county was 95.2% White, 0.7% African American, 0.7% Native American, 0.3% Asian, 0.1% Pacific Islander, 1.2% from other races, and 1.9% from two or more races. Hispanic or Latino of any race were 3.2% of the population.
The median income for a household in the county was $37,945, and the median income for a family was $45,945. The per capita income for the county was $20,845. About 11.2% of families and 14.7% of the population were below the poverty line, including 19.2% of those under age 18 and 8.2% of those age 65 or over.
Gogebic County is a rural area with a strong sense of community. The county is home to a variety of outdoor activities, including skiing, fishing, and camping. The county is also home to several manufacturing companies, which provide employment for many of the county’s residents. The county is also home to several mining operations, which provide employment for many of the county’s residents. The county is also home to several ski resorts, which attract visitors from all over the Midwest.
Common Questions
What is the Total Population of Gogebic County?
Total Population of Gogebic County is 14,597.
What is the Total Male Population of Gogebic County?
Total Male Population of Gogebic County is 7,649.
What is the Total Female Population of Gogebic County?
Total Female Population of Gogebic County is 6,948.
What is the Ratio of Males per 100 Females in Gogebic County?
There are 110.09 Males per 100 Females in Gogebic County.
What is the Ratio of Females per 100 Males in Gogebic County?
There are 90.84 Females per 100 Males in Gogebic County.
What is the Median Population Age in Gogebic County?
Median Population Age in Gogebic County is 50.6 Years.
What is the Average Family Size in Gogebic County
Average Family Size in Gogebic County is 2.7 People.
What is the Average Household Size in Gogebic County
Average Household Size in Gogebic County is 2.0 People.
What is Per Capita Income in Gogebic County?
Per Capita income in Gogebic County is $33,516.
What is the Median Family Income in Gogebic County?
Median Family Income in Gogebic County is $67,215.
What is the Median Household income in Gogebic County?
Median Household Income in Gogebic County is $47,913.
What is Income or Wage Gap in Gogebic County?
Income or Wage Gap in Gogebic County is 29.6%.
Women in Gogebic County earn 70.4 cents for every dollar earned by a man.
What is Family Income Deficit in Gogebic County?
Family Income Deficit in Gogebic County is $9,075.
Families that are below poverty line in Gogebic County earn $9,075 less on average than the poverty threshold level.
What is Inequality or Gini Index in Gogebic County?
Inequality or Gini Index in Gogebic County is 0.48.
How Large is the Labor Force in Gogebic County?
There are 6,482 People in the Labor Forcein in Gogebic County.
What is the Percentage of People in the Labor Force in Gogebic County?
51.9% of People are in the Labor Force in Gogebic County.
What is the Unemployment Rate in Gogebic County?
Unemployment Rate in Gogebic County is 6.0%.