Genesee County, MI
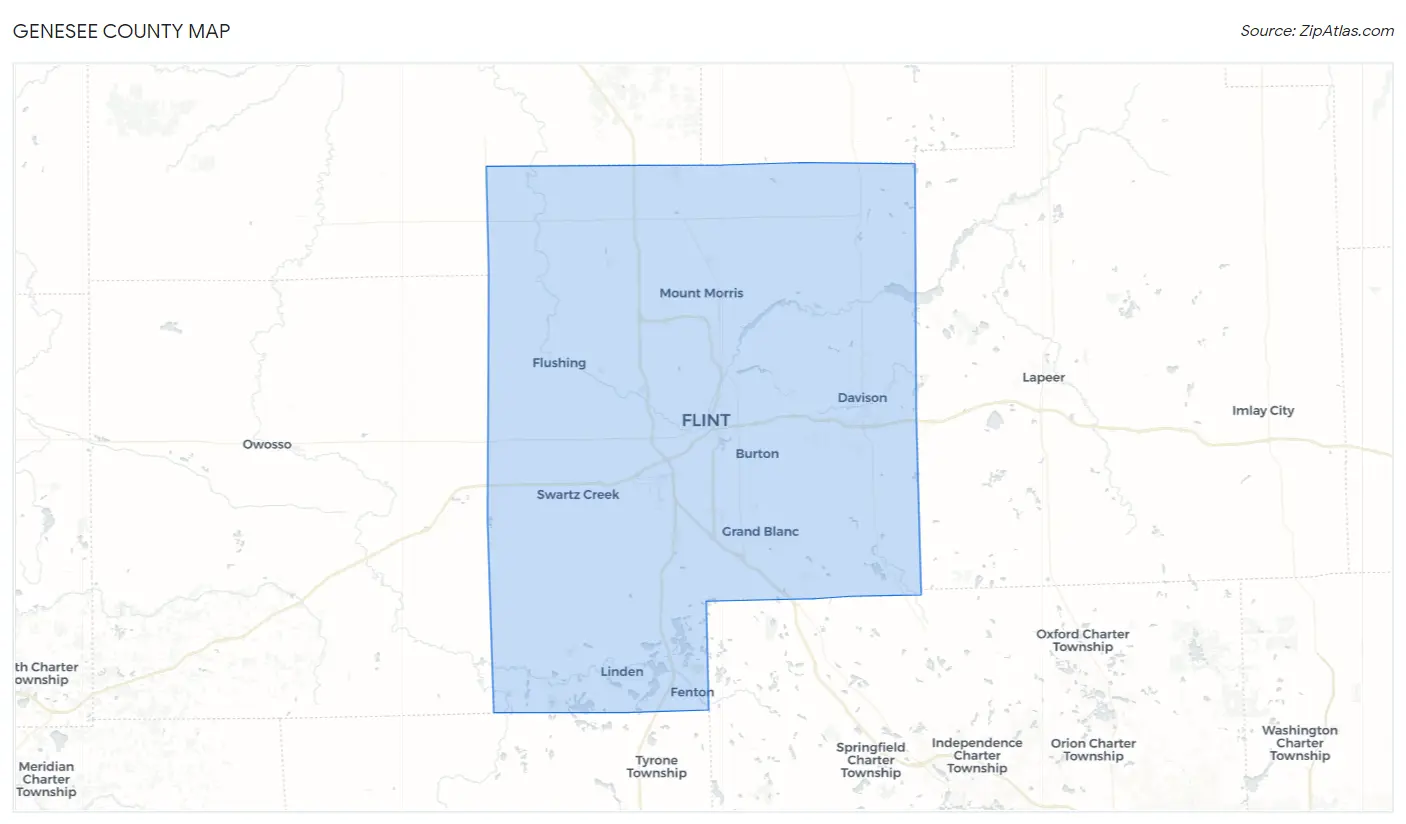
Genesee County Map
Genesee County Overview
405,280
TOTAL POPULATION
196,717
MALE POPULATION
208,563
FEMALE POPULATION
94.32
MALES / 100 FEMALES
106.02
FEMALES / 100 MALES
40.5
MEDIAN AGE
3.0
AVG FAMILY SIZE
2.4
AVG HOUSEHOLD SIZE
$33,562
PER CAPITA INCOME
$75,461
AVG FAMILY INCOME
$58,594
AVG HOUSEHOLD INCOME
33.3%
WAGE / INCOME GAP [ % ]
66.7¢/ $1
WAGE / INCOME GAP [ $ ]
$11,196
FAMILY INCOME DEFICIT
0.47
INEQUALITY / GINI INDEX
189,641
LABOR FORCE [ PEOPLE ]
58.2%
PERCENT IN LABOR FORCE
8.5%
UNEMPLOYMENT RATE
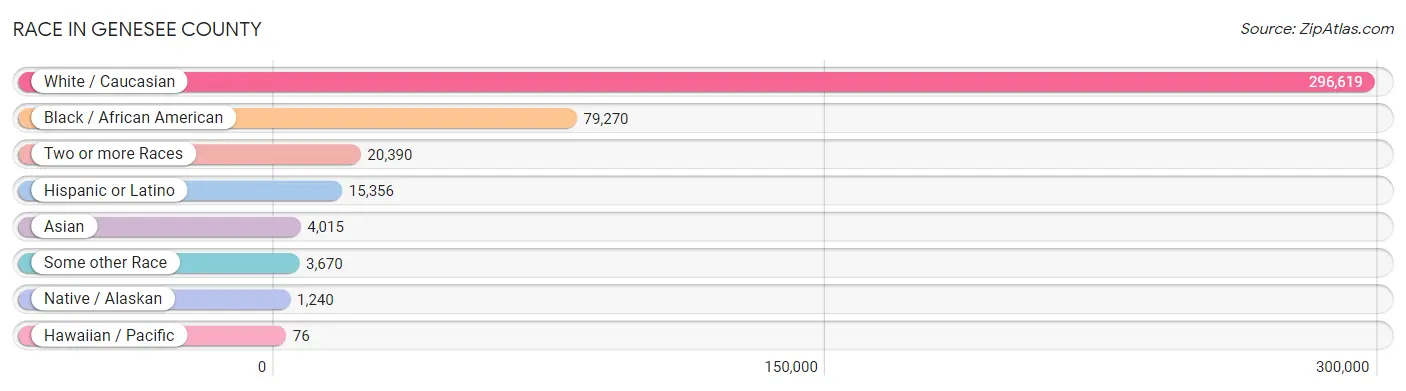
Race in Genesee County
The most populous races in Genesee County are White / Caucasian (296,619 | 73.2%), Black / African American (79,270 | 19.6%), and Two or more Races (20,390 | 5.0%).
| Race | # Population | % Population |
| Asian | 4,015 | 1.0% |
| Black / African American | 79,270 | 19.6% |
| Hawaiian / Pacific | 76 | 0.0% |
| Hispanic or Latino | 15,356 | 3.8% |
| Native / Alaskan | 1,240 | 0.3% |
| White / Caucasian | 296,619 | 73.2% |
| Two or more Races | 20,390 | 5.0% |
| Some other Race | 3,670 | 0.9% |
| Total | 405,280 | 100.0% |
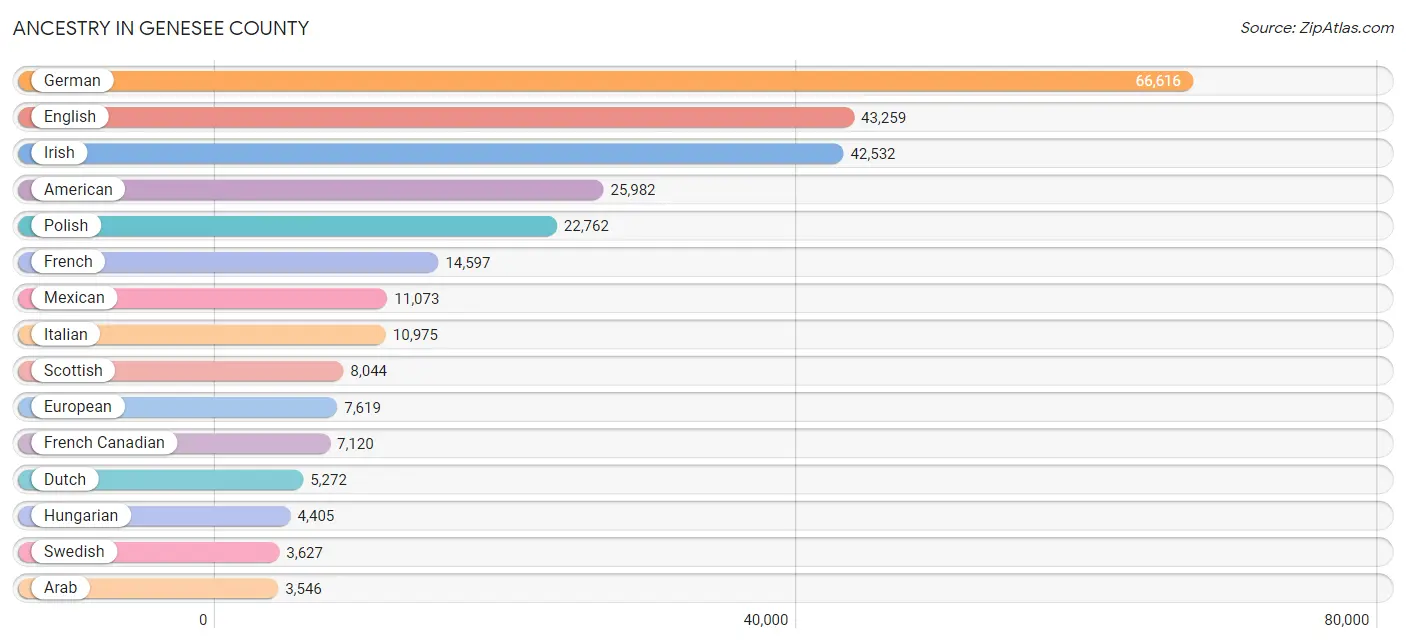
Ancestry in Genesee County
The most populous ancestries reported in Genesee County are German (66,616 | 16.4%), English (43,259 | 10.7%), Irish (42,532 | 10.5%), American (25,982 | 6.4%), and Polish (22,762 | 5.6%), together accounting for 49.6% of all Genesee County residents.
| Ancestry | # Population | % Population |
| African | 1,741 | 0.4% |
| Alaskan Athabascan | 5 | 0.0% |
| Albanian | 24 | 0.0% |
| Aleut | 5 | 0.0% |
| American | 25,982 | 6.4% |
| Apache | 244 | 0.1% |
| Arab | 3,546 | 0.9% |
| Armenian | 306 | 0.1% |
| Assyrian / Chaldean / Syriac | 423 | 0.1% |
| Australian | 48 | 0.0% |
| Austrian | 317 | 0.1% |
| Bangladeshi | 87 | 0.0% |
| Belgian | 833 | 0.2% |
| Bhutanese | 431 | 0.1% |
| Blackfeet | 371 | 0.1% |
| Brazilian | 54 | 0.0% |
| British | 1,768 | 0.4% |
| British West Indian | 16 | 0.0% |
| Bulgarian | 71 | 0.0% |
| Burmese | 858 | 0.2% |
| Canadian | 1,795 | 0.4% |
| Carpatho Rusyn | 8 | 0.0% |
| Celtic | 62 | 0.0% |
| Central American | 437 | 0.1% |
| Central American Indian | 19 | 0.0% |
| Cherokee | 1,309 | 0.3% |
| Cheyenne | 26 | 0.0% |
| Chickasaw | 207 | 0.1% |
| Chippewa | 1,520 | 0.4% |
| Choctaw | 105 | 0.0% |
| Colombian | 170 | 0.0% |
| Costa Rican | 7 | 0.0% |
| Cree | 117 | 0.0% |
| Croatian | 435 | 0.1% |
| Crow | 20 | 0.0% |
| Cuban | 1,013 | 0.3% |
| Czech | 2,416 | 0.6% |
| Czechoslovakian | 886 | 0.2% |
| Danish | 1,216 | 0.3% |
| Dominican | 295 | 0.1% |
| Dutch | 5,272 | 1.3% |
| Eastern European | 827 | 0.2% |
| Ecuadorian | 105 | 0.0% |
| Egyptian | 165 | 0.0% |
| English | 43,259 | 10.7% |
| Estonian | 62 | 0.0% |
| Ethiopian | 220 | 0.1% |
| European | 7,619 | 1.9% |
| Filipino | 61 | 0.0% |
| Finnish | 1,665 | 0.4% |
| French | 14,597 | 3.6% |
| French American Indian | 113 | 0.0% |
| French Canadian | 7,120 | 1.8% |
| German | 66,616 | 16.4% |
| German Russian | 25 | 0.0% |
| Ghanaian | 10 | 0.0% |
| Greek | 1,613 | 0.4% |
| Guamanian / Chamorro | 34 | 0.0% |
| Guatemalan | 117 | 0.0% |
| Guyanese | 13 | 0.0% |
| Haitian | 36 | 0.0% |
| Honduran | 24 | 0.0% |
| Hopi | 51 | 0.0% |
| Hungarian | 4,405 | 1.1% |
| Icelander | 53 | 0.0% |
| Indian (Asian) | 1,309 | 0.3% |
| Inupiat | 10 | 0.0% |
| Iranian | 43 | 0.0% |
| Iraqi | 43 | 0.0% |
| Irish | 42,532 | 10.5% |
| Iroquois | 23 | 0.0% |
| Israeli | 105 | 0.0% |
| Italian | 10,975 | 2.7% |
| Jamaican | 146 | 0.0% |
| Japanese | 14 | 0.0% |
| Jordanian | 23 | 0.0% |
| Korean | 923 | 0.2% |
| Latvian | 22 | 0.0% |
| Lebanese | 1,249 | 0.3% |
| Lithuanian | 811 | 0.2% |
| Lumbee | 18 | 0.0% |
| Macedonian | 228 | 0.1% |
| Malaysian | 65 | 0.0% |
| Maltese | 198 | 0.1% |
| Menominee | 4 | 0.0% |
| Mexican | 11,073 | 2.7% |
| Mexican American Indian | 95 | 0.0% |
| Mongolian | 110 | 0.0% |
| Moroccan | 37 | 0.0% |
| Native Hawaiian | 70 | 0.0% |
| Navajo | 77 | 0.0% |
| Nicaraguan | 29 | 0.0% |
| Nigerian | 188 | 0.1% |
| Northern European | 251 | 0.1% |
| Norwegian | 2,721 | 0.7% |
| Osage | 38 | 0.0% |
| Ottawa | 197 | 0.1% |
| Pakistani | 244 | 0.1% |
| Palestinian | 188 | 0.1% |
| Panamanian | 137 | 0.0% |
| Pennsylvania German | 216 | 0.1% |
| Peruvian | 17 | 0.0% |
| Polish | 22,762 | 5.6% |
| Portuguese | 185 | 0.1% |
| Potawatomi | 25 | 0.0% |
| Pueblo | 9 | 0.0% |
| Puerto Rican | 1,132 | 0.3% |
| Romanian | 369 | 0.1% |
| Russian | 2,063 | 0.5% |
| Salvadoran | 123 | 0.0% |
| Samoan | 42 | 0.0% |
| Scandinavian | 734 | 0.2% |
| Scotch-Irish | 2,692 | 0.7% |
| Scottish | 8,044 | 2.0% |
| Serbian | 206 | 0.1% |
| Shoshone | 25 | 0.0% |
| Sioux | 31 | 0.0% |
| Slavic | 157 | 0.0% |
| Slovak | 892 | 0.2% |
| Slovene | 35 | 0.0% |
| South African | 16 | 0.0% |
| South American | 382 | 0.1% |
| South American Indian | 59 | 0.0% |
| Spaniard | 478 | 0.1% |
| Spanish | 244 | 0.1% |
| Sri Lankan | 668 | 0.2% |
| Subsaharan African | 2,961 | 0.7% |
| Sudanese | 670 | 0.2% |
| Swedish | 3,627 | 0.9% |
| Swiss | 502 | 0.1% |
| Syrian | 286 | 0.1% |
| Thai | 1,571 | 0.4% |
| Trinidadian and Tobagonian | 9 | 0.0% |
| Turkish | 56 | 0.0% |
| Ukrainian | 752 | 0.2% |
| Uruguayan | 4 | 0.0% |
| Venezuelan | 86 | 0.0% |
| Welsh | 2,131 | 0.5% |
| West Indian | 11 | 0.0% |
| Yugoslavian | 87 | 0.0% |
| Zimbabwean | 8 | 0.0% | View All 141 Rows |
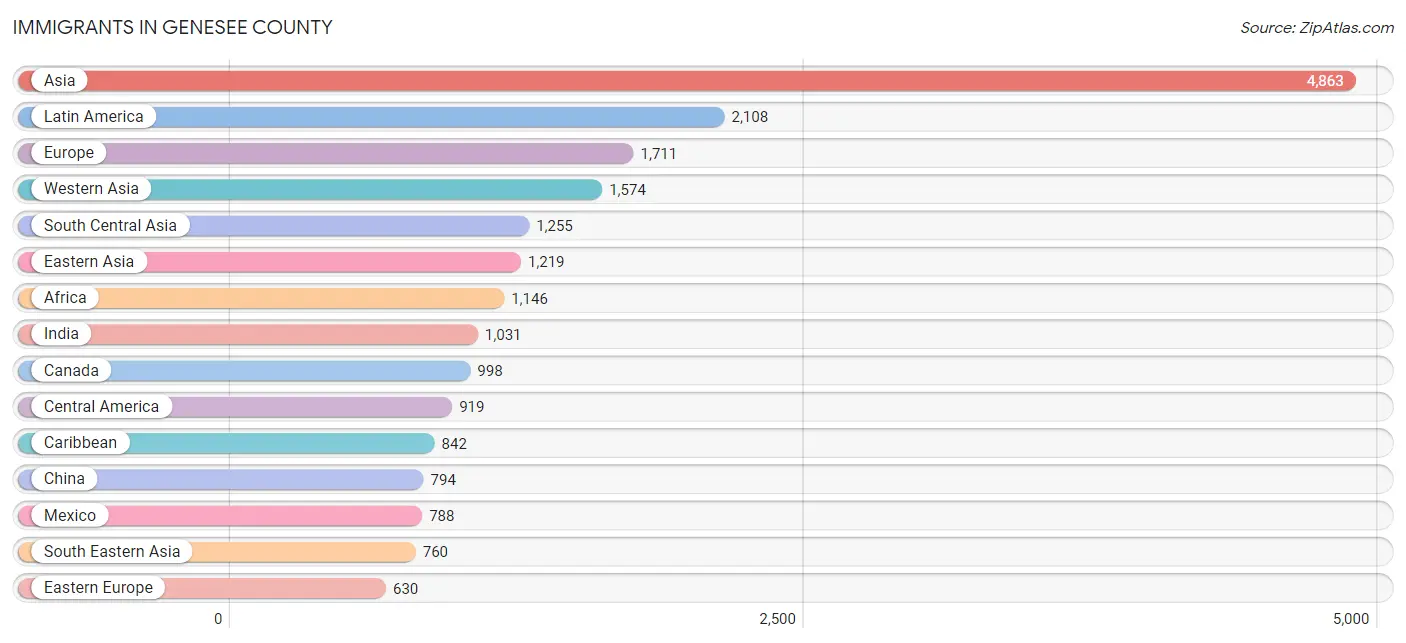
Immigrants in Genesee County
The most numerous immigrant groups reported in Genesee County came from Asia (4,863 | 1.2%), Latin America (2,108 | 0.5%), Europe (1,711 | 0.4%), Western Asia (1,574 | 0.4%), and South Central Asia (1,255 | 0.3%), together accounting for 2.8% of all Genesee County residents.
| Immigration Origin | # Population | % Population |
| Africa | 1,146 | 0.3% |
| Albania | 1 | 0.0% |
| Armenia | 60 | 0.0% |
| Asia | 4,863 | 1.2% |
| Austria | 26 | 0.0% |
| Belgium | 13 | 0.0% |
| Belize | 19 | 0.0% |
| Bosnia and Herzegovina | 5 | 0.0% |
| Brazil | 47 | 0.0% |
| Bulgaria | 49 | 0.0% |
| Cambodia | 14 | 0.0% |
| Canada | 998 | 0.3% |
| Caribbean | 842 | 0.2% |
| Central America | 919 | 0.2% |
| China | 794 | 0.2% |
| Colombia | 162 | 0.0% |
| Congo | 43 | 0.0% |
| Croatia | 12 | 0.0% |
| Cuba | 618 | 0.2% |
| Czechoslovakia | 8 | 0.0% |
| Denmark | 8 | 0.0% |
| Dominican Republic | 60 | 0.0% |
| Eastern Africa | 331 | 0.1% |
| Eastern Asia | 1,219 | 0.3% |
| Eastern Europe | 630 | 0.2% |
| Ecuador | 15 | 0.0% |
| Egypt | 149 | 0.0% |
| England | 181 | 0.0% |
| Eritrea | 172 | 0.0% |
| Ethiopia | 97 | 0.0% |
| Europe | 1,711 | 0.4% |
| Fiji | 14 | 0.0% |
| France | 22 | 0.0% |
| Germany | 369 | 0.1% |
| Greece | 49 | 0.0% |
| Guatemala | 41 | 0.0% |
| Guyana | 32 | 0.0% |
| Haiti | 8 | 0.0% |
| Honduras | 30 | 0.0% |
| Hong Kong | 100 | 0.0% |
| Hungary | 14 | 0.0% |
| India | 1,031 | 0.3% |
| Indonesia | 38 | 0.0% |
| Iran | 190 | 0.1% |
| Iraq | 61 | 0.0% |
| Ireland | 7 | 0.0% |
| Israel | 214 | 0.1% |
| Italy | 86 | 0.0% |
| Jamaica | 115 | 0.0% |
| Japan | 44 | 0.0% |
| Jordan | 57 | 0.0% |
| Kenya | 17 | 0.0% |
| Korea | 381 | 0.1% |
| Kuwait | 4 | 0.0% |
| Laos | 35 | 0.0% |
| Latin America | 2,108 | 0.5% |
| Latvia | 7 | 0.0% |
| Lebanon | 121 | 0.0% |
| Lithuania | 19 | 0.0% |
| Malaysia | 105 | 0.0% |
| Mexico | 788 | 0.2% |
| Middle Africa | 43 | 0.0% |
| Moldova | 42 | 0.0% |
| Morocco | 21 | 0.0% |
| Netherlands | 83 | 0.0% |
| Nicaragua | 12 | 0.0% |
| Nigeria | 198 | 0.1% |
| Northern Africa | 486 | 0.1% |
| Northern Europe | 401 | 0.1% |
| Norway | 120 | 0.0% |
| Oceania | 14 | 0.0% |
| Pakistan | 34 | 0.0% |
| Panama | 29 | 0.0% |
| Philippines | 254 | 0.1% |
| Poland | 72 | 0.0% |
| Portugal | 27 | 0.0% |
| Romania | 54 | 0.0% |
| Russia | 194 | 0.1% |
| Saudi Arabia | 317 | 0.1% |
| Scotland | 11 | 0.0% |
| Senegal | 21 | 0.0% |
| Serbia | 22 | 0.0% |
| Somalia | 8 | 0.0% |
| South Africa | 55 | 0.0% |
| South America | 347 | 0.1% |
| South Central Asia | 1,255 | 0.3% |
| South Eastern Asia | 760 | 0.2% |
| Southern Europe | 162 | 0.0% |
| St. Vincent and the Grenadines | 4 | 0.0% |
| Sudan | 295 | 0.1% |
| Syria | 246 | 0.1% |
| Taiwan | 60 | 0.0% |
| Thailand | 86 | 0.0% |
| Trinidad and Tobago | 37 | 0.0% |
| Turkey | 27 | 0.0% |
| Uganda | 6 | 0.0% |
| Ukraine | 36 | 0.0% |
| Uruguay | 2 | 0.0% |
| Venezuela | 89 | 0.0% |
| Vietnam | 228 | 0.1% |
| Western Africa | 219 | 0.1% |
| Western Asia | 1,574 | 0.4% |
| Western Europe | 518 | 0.1% |
| Yemen | 467 | 0.1% |
| Zimbabwe | 8 | 0.0% | View All 105 Rows |
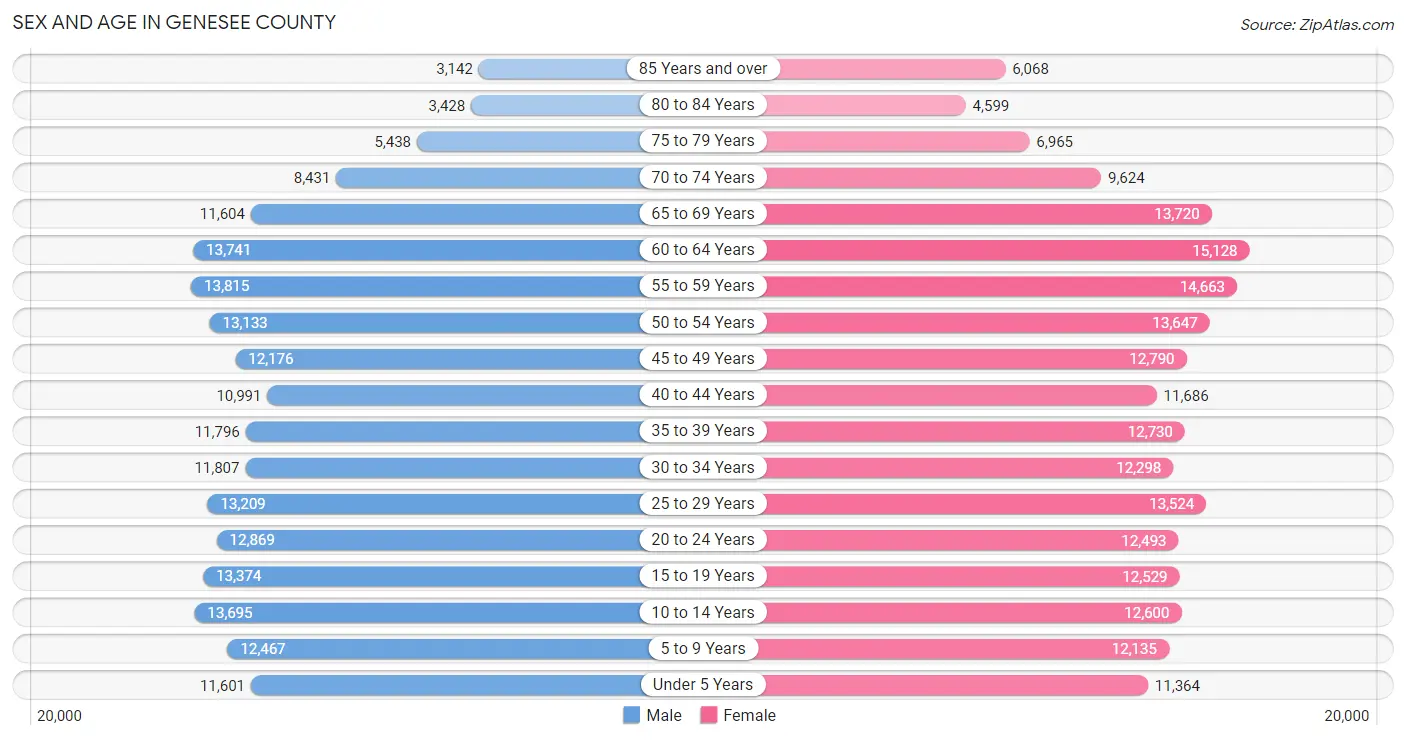
Sex and Age in Genesee County
Sex and Age in Genesee County
The most populous age groups in Genesee County are 55 to 59 Years (13,815 | 7.0%) for men and 60 to 64 Years (15,128 | 7.2%) for women.
| Age Bracket | Male | Female |
| Under 5 Years | 11,601 (5.9%) | 11,364 (5.4%) |
| 5 to 9 Years | 12,467 (6.3%) | 12,135 (5.8%) |
| 10 to 14 Years | 13,695 (7.0%) | 12,600 (6.0%) |
| 15 to 19 Years | 13,374 (6.8%) | 12,529 (6.0%) |
| 20 to 24 Years | 12,869 (6.5%) | 12,493 (6.0%) |
| 25 to 29 Years | 13,209 (6.7%) | 13,524 (6.5%) |
| 30 to 34 Years | 11,807 (6.0%) | 12,298 (5.9%) |
| 35 to 39 Years | 11,796 (6.0%) | 12,730 (6.1%) |
| 40 to 44 Years | 10,991 (5.6%) | 11,686 (5.6%) |
| 45 to 49 Years | 12,176 (6.2%) | 12,790 (6.1%) |
| 50 to 54 Years | 13,133 (6.7%) | 13,647 (6.5%) |
| 55 to 59 Years | 13,815 (7.0%) | 14,663 (7.0%) |
| 60 to 64 Years | 13,741 (7.0%) | 15,128 (7.2%) |
| 65 to 69 Years | 11,604 (5.9%) | 13,720 (6.6%) |
| 70 to 74 Years | 8,431 (4.3%) | 9,624 (4.6%) |
| 75 to 79 Years | 5,438 (2.8%) | 6,965 (3.3%) |
| 80 to 84 Years | 3,428 (1.7%) | 4,599 (2.2%) |
| 85 Years and over | 3,142 (1.6%) | 6,068 (2.9%) |
| Total | 196,717 (100.0%) | 208,563 (100.0%) |
Families and Households in Genesee County
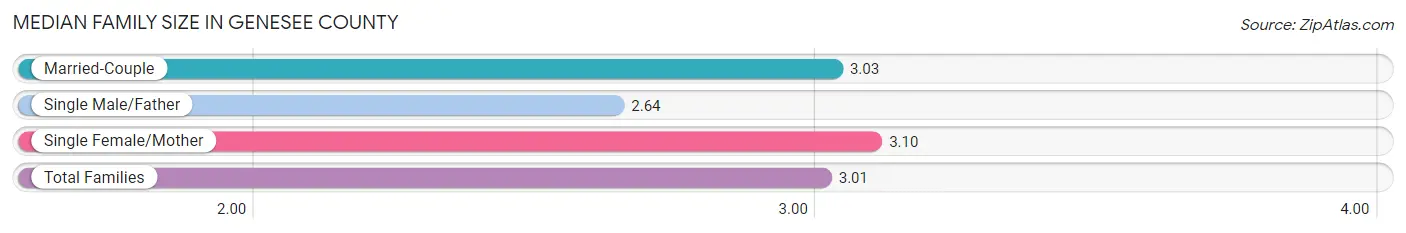
Median Family Size in Genesee County
The median family size in Genesee County is 3.01 persons per family, with single female/mother families (25,327 | 24.3%) accounting for the largest median family size of 3.1 persons per family. On the other hand, single male/father families (9,639 | 9.3%) represent the smallest median family size with 2.64 persons per family.
| Family Type | # Families | Family Size |
| Married-Couple | 69,160 (66.4%) | 3.03 |
| Single Male/Father | 9,639 (9.3%) | 2.64 |
| Single Female/Mother | 25,327 (24.3%) | 3.10 |
| Total Families | 104,126 (100.0%) | 3.01 |
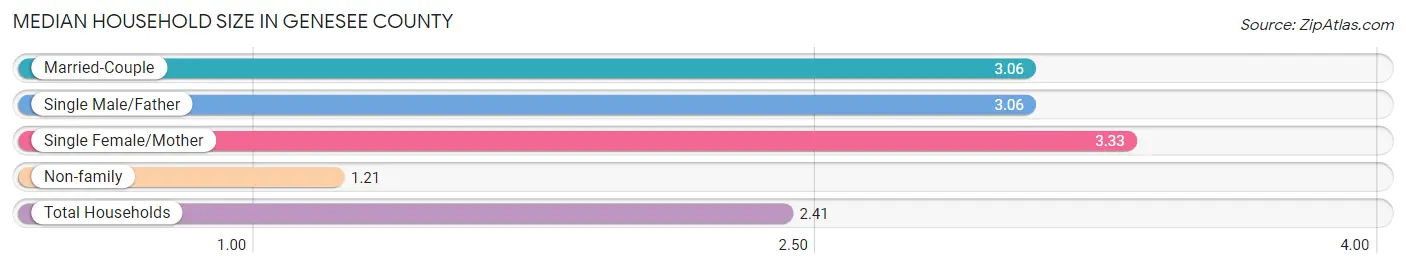
Median Household Size in Genesee County
The median household size in Genesee County is 2.41 persons per household, with single female/mother households (25,327 | 15.2%) accounting for the largest median household size of 3.33 persons per household. non-family households (61,934 | 37.3%) represent the smallest median household size with 1.21 persons per household.
| Household Type | # Households | Household Size |
| Married-Couple | 69,160 (41.6%) | 3.06 |
| Single Male/Father | 9,639 (5.8%) | 3.06 |
| Single Female/Mother | 25,327 (15.2%) | 3.33 |
| Non-family | 61,934 (37.3%) | 1.21 |
| Total Households | 166,060 (100.0%) | 2.41 |
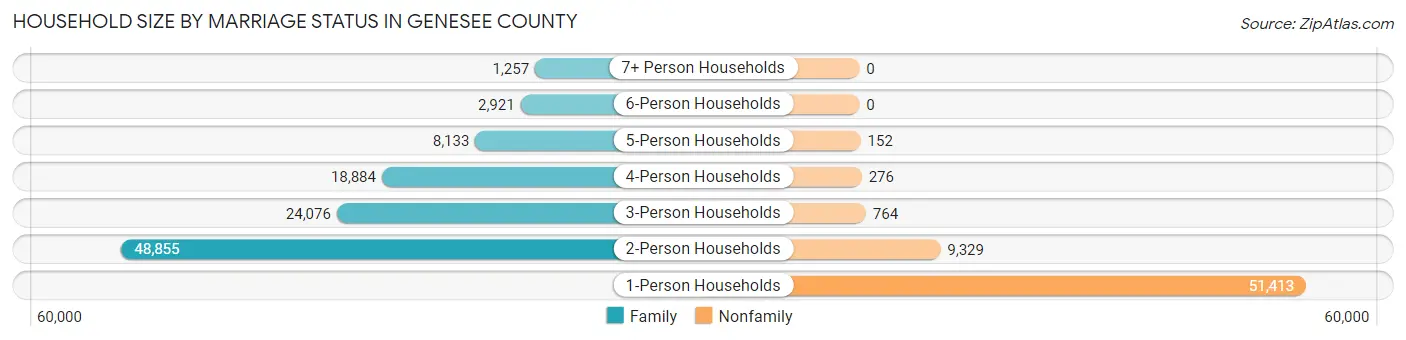
Household Size by Marriage Status in Genesee County
Out of a total of 166,060 households in Genesee County, 104,126 (62.7%) are family households, while 61,934 (37.3%) are nonfamily households. The most numerous type of family households are 2-person households, comprising 48,855, and the most common type of nonfamily households are 1-person households, comprising 51,413.
| Household Size | Family Households | Nonfamily Households |
| 1-Person Households | - | 51,413 (31.0%) |
| 2-Person Households | 48,855 (29.4%) | 9,329 (5.6%) |
| 3-Person Households | 24,076 (14.5%) | 764 (0.5%) |
| 4-Person Households | 18,884 (11.4%) | 276 (0.2%) |
| 5-Person Households | 8,133 (4.9%) | 152 (0.1%) |
| 6-Person Households | 2,921 (1.8%) | 0 (0.0%) |
| 7+ Person Households | 1,257 (0.8%) | 0 (0.0%) |
| Total | 104,126 (62.7%) | 61,934 (37.3%) |
Female Fertility in Genesee County
Fertility by Age in Genesee County
Average fertility rate in Genesee County is 54.0 births per 1,000 women. Women in the age bracket of 20 to 34 years have the highest fertility rate with 103.0 births per 1,000 women. Women in the age bracket of 20 to 34 years acount for 80.5% of all women with births.
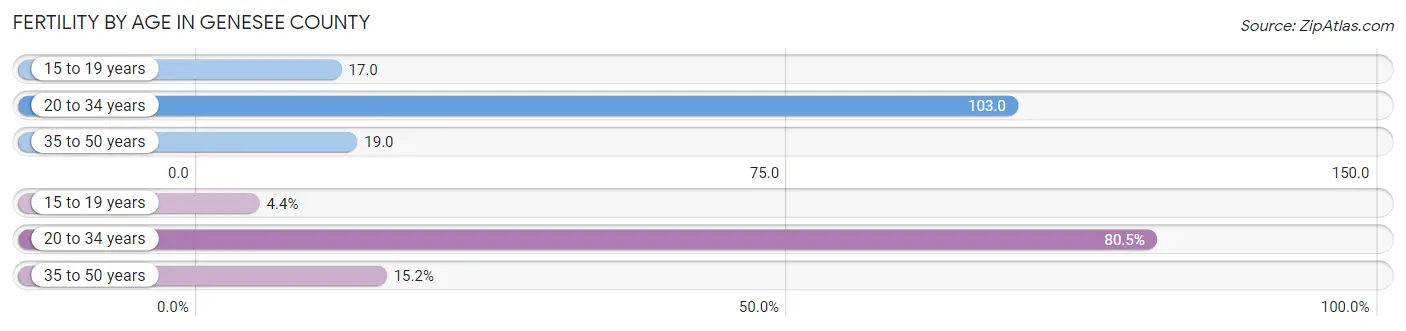
| Age Bracket | Women with Births | Births / 1,000 Women |
| 15 to 19 years | 214 (4.4%) | 17.0 |
| 20 to 34 years | 3,932 (80.5%) | 103.0 |
| 35 to 50 years | 741 (15.2%) | 19.0 |
| Total | 4,887 (100.0%) | 54.0 |
Fertility by Age by Marriage Status in Genesee County
47.6% of women with births (4,887) in Genesee County are married. The highest percentage of unmarried women with births falls into 15 to 19 years age bracket with 91.6% of them unmarried at the time of birth, while the lowest percentage of unmarried women with births belong to 35 to 50 years age bracket with 32.0% of them unmarried.
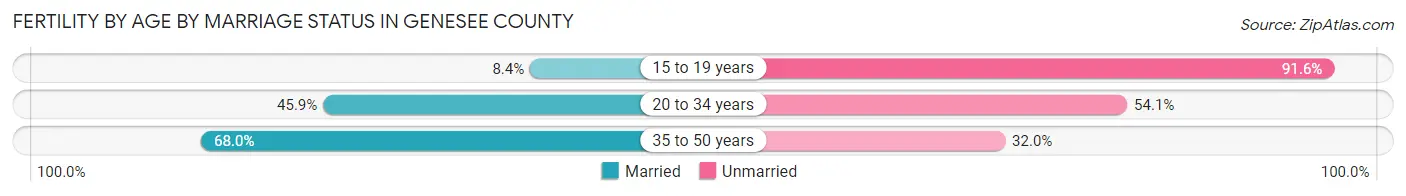
| Age Bracket | Married | Unmarried |
| 15 to 19 years | 18 (8.4%) | 196 (91.6%) |
| 20 to 34 years | 1,805 (45.9%) | 2,127 (54.1%) |
| 35 to 50 years | 504 (68.0%) | 237 (32.0%) |
| Total | 2,326 (47.6%) | 2,561 (52.4%) |
Fertility by Education in Genesee County
Average fertility rate in Genesee County is 54.0 births per 1,000 women. Women with the education attainment of graduate degree have the highest fertility rate of 79.0 births per 1,000 women, while women with the education attainment of less than high school have the lowest fertility at 42.0 births per 1,000 women. Women with the education attainment of college or associate's degree represent 31.8% of all women with births.
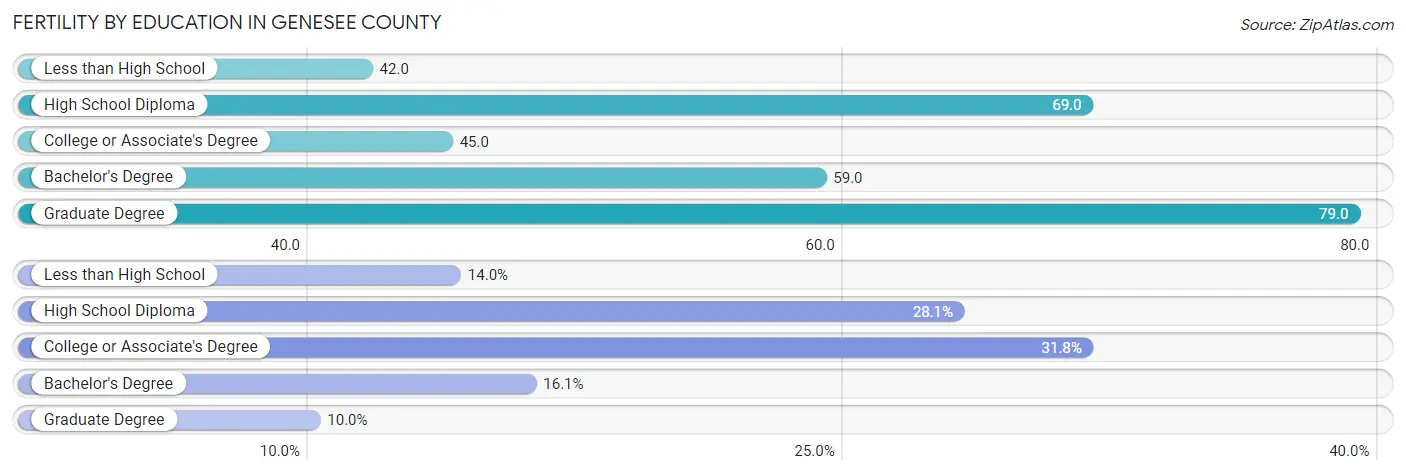
| Educational Attainment | Women with Births | Births / 1,000 Women |
| Less than High School | 683 (14.0%) | 42.0 |
| High School Diploma | 1,375 (28.1%) | 69.0 |
| College or Associate's Degree | 1,552 (31.8%) | 45.0 |
| Bachelor's Degree | 787 (16.1%) | 59.0 |
| Graduate Degree | 490 (10.0%) | 79.0 |
| Total | 4,887 (100.0%) | 54.0 |
Fertility by Education by Marriage Status in Genesee County
52.4% of women with births in Genesee County are unmarried. Women with the educational attainment of graduate degree are most likely to be married with 84.9% of them married at childbirth, while women with the educational attainment of less than high school are least likely to be married with 94.3% of them unmarried at childbirth.
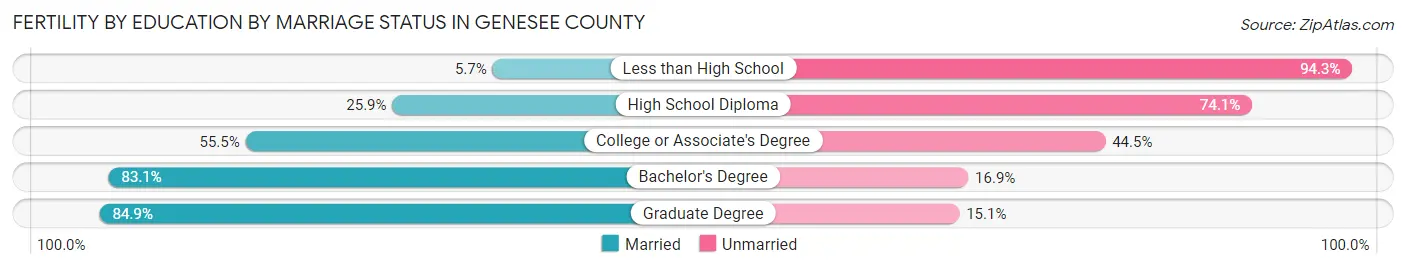
| Educational Attainment | Married | Unmarried |
| Less than High School | 39 (5.7%) | 644 (94.3%) |
| High School Diploma | 356 (25.9%) | 1,019 (74.1%) |
| College or Associate's Degree | 861 (55.5%) | 691 (44.5%) |
| Bachelor's Degree | 654 (83.1%) | 133 (16.9%) |
| Graduate Degree | 416 (84.9%) | 74 (15.1%) |
| Total | 2,326 (47.6%) | 2,561 (52.4%) |
Income in Genesee County
Income Overview in Genesee County
Per Capita Income in Genesee County is $33,562, while median incomes of families and households are $75,461 and $58,594 respectively.
| Characteristic | Number | Measure |
| Per Capita Income | 405,280 | $33,562 |
| Median Family Income | 104,126 | $75,461 |
| Mean Family Income | 104,126 | $96,556 |
| Median Household Income | 166,060 | $58,594 |
| Mean Household Income | 166,060 | $80,414 |
| Income Deficit | 104,126 | $11,196 |
| Wage / Income Gap (%) | 405,280 | 33.25% |
| Wage / Income Gap ($) | 405,280 | 66.75¢ per $1 |
| Gini / Inequality Index | 405,280 | 0.47 |
Earnings by Sex in Genesee County
Average Earnings in Genesee County are $34,720, $43,835 for men and $29,259 for women, a difference of 33.3%.
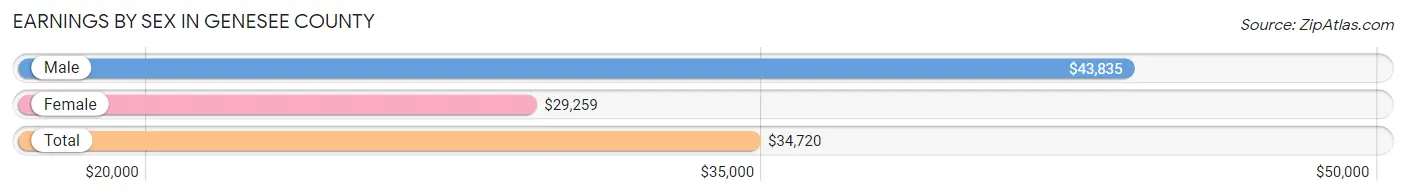
| Sex | Number | Average Earnings |
| Male | 98,632 (50.8%) | $43,835 |
| Female | 95,675 (49.2%) | $29,259 |
| Total | 194,307 (100.0%) | $34,720 |
Earnings by Sex by Income Bracket in Genesee County
The most common earnings brackets in Genesee County are $100,000+ for men (14,514 | 14.7%) and $25,000 to $29,999 for women (7,715 | 8.1%).
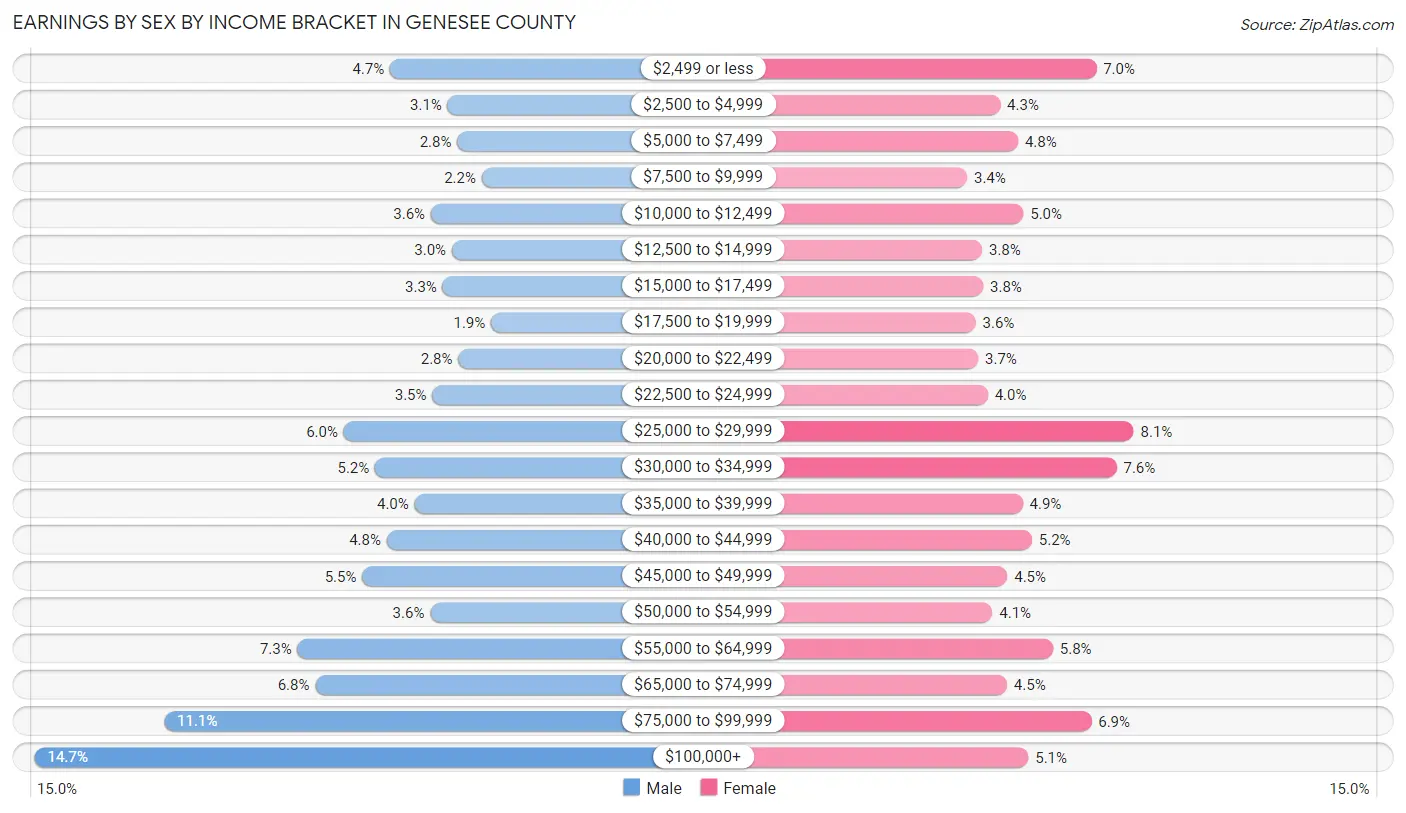
| Income | Male | Female |
| $2,499 or less | 4,665 (4.7%) | 6,711 (7.0%) |
| $2,500 to $4,999 | 3,072 (3.1%) | 4,125 (4.3%) |
| $5,000 to $7,499 | 2,805 (2.8%) | 4,602 (4.8%) |
| $7,500 to $9,999 | 2,123 (2.1%) | 3,231 (3.4%) |
| $10,000 to $12,499 | 3,532 (3.6%) | 4,745 (5.0%) |
| $12,500 to $14,999 | 2,950 (3.0%) | 3,633 (3.8%) |
| $15,000 to $17,499 | 3,208 (3.3%) | 3,661 (3.8%) |
| $17,500 to $19,999 | 1,860 (1.9%) | 3,466 (3.6%) |
| $20,000 to $22,499 | 2,772 (2.8%) | 3,534 (3.7%) |
| $22,500 to $24,999 | 3,493 (3.5%) | 3,786 (4.0%) |
| $25,000 to $29,999 | 5,950 (6.0%) | 7,715 (8.1%) |
| $30,000 to $34,999 | 5,084 (5.1%) | 7,248 (7.6%) |
| $35,000 to $39,999 | 3,984 (4.0%) | 4,724 (4.9%) |
| $40,000 to $44,999 | 4,751 (4.8%) | 4,972 (5.2%) |
| $45,000 to $49,999 | 5,430 (5.5%) | 4,318 (4.5%) |
| $50,000 to $54,999 | 3,548 (3.6%) | 3,911 (4.1%) |
| $55,000 to $64,999 | 7,229 (7.3%) | 5,537 (5.8%) |
| $65,000 to $74,999 | 6,734 (6.8%) | 4,309 (4.5%) |
| $75,000 to $99,999 | 10,928 (11.1%) | 6,572 (6.9%) |
| $100,000+ | 14,514 (14.7%) | 4,875 (5.1%) |
| Total | 98,632 (100.0%) | 95,675 (100.0%) |
Earnings by Sex by Educational Attainment in Genesee County
Average earnings in Genesee County are $50,426 for men and $33,279 for women, a difference of 34.0%. Men with an educational attainment of graduate degree enjoy the highest average annual earnings of $94,227, while those with less than high school education earn the least with $28,127. Women with an educational attainment of graduate degree earn the most with the average annual earnings of $66,012, while those with less than high school education have the smallest earnings of $17,791.
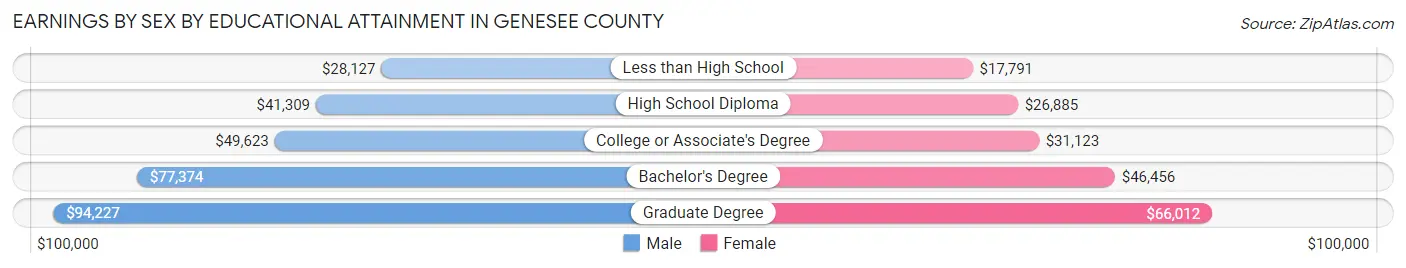
| Educational Attainment | Male Income | Female Income |
| Less than High School | $28,127 | $17,791 |
| High School Diploma | $41,309 | $26,885 |
| College or Associate's Degree | $49,623 | $31,123 |
| Bachelor's Degree | $77,374 | $46,456 |
| Graduate Degree | $94,227 | $66,012 |
| Total | $50,426 | $33,279 |
Family Income in Genesee County
Family Income Brackets in Genesee County
According to the Genesee County family income data, there are 19,576 families falling into the $50,000 to $74,999 income range, which is the most common income bracket and makes up 18.8% of all families. Conversely, the $10,000 to $14,999 income bracket is the least frequent group with only 2,395 families (2.3%) belonging to this category.
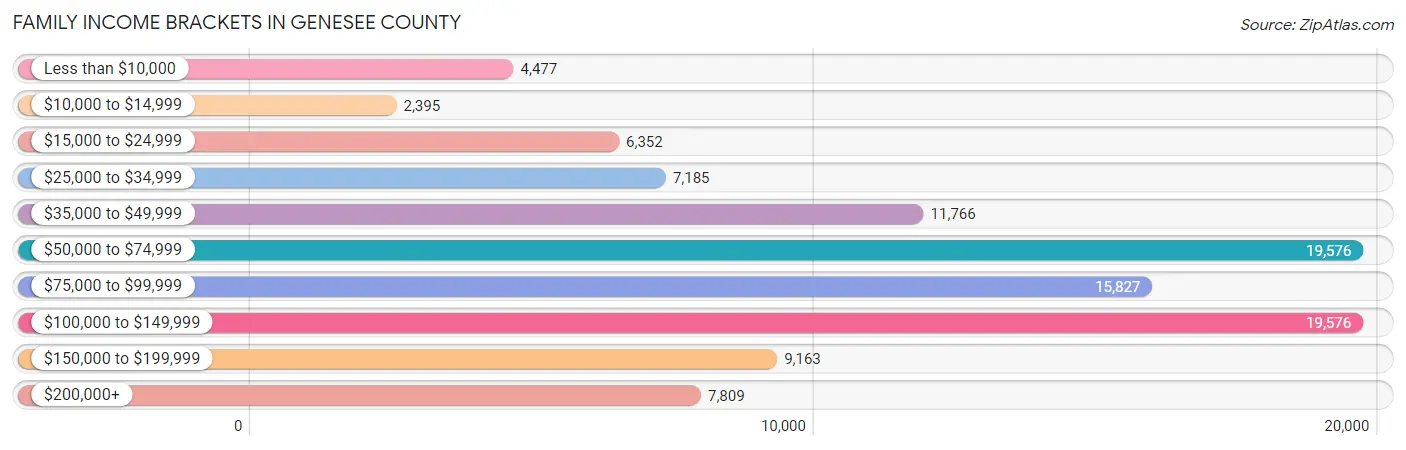
| Income Bracket | # Families | % Families |
| Less than $10,000 | 4,477 | 4.3% |
| $10,000 to $14,999 | 2,395 | 2.3% |
| $15,000 to $24,999 | 6,352 | 6.1% |
| $25,000 to $34,999 | 7,185 | 6.9% |
| $35,000 to $49,999 | 11,766 | 11.3% |
| $50,000 to $74,999 | 19,576 | 18.8% |
| $75,000 to $99,999 | 15,827 | 15.2% |
| $100,000 to $149,999 | 19,576 | 18.8% |
| $150,000 to $199,999 | 9,163 | 8.8% |
| $200,000+ | 7,809 | 7.5% |
Family Income by Famaliy Size in Genesee County
6-person families (2,264 | 2.2%) account for the highest median family income in Genesee County with $100,000 per family, while 2-person families (53,057 | 50.9%) have the highest median income of $34,104 per family member.
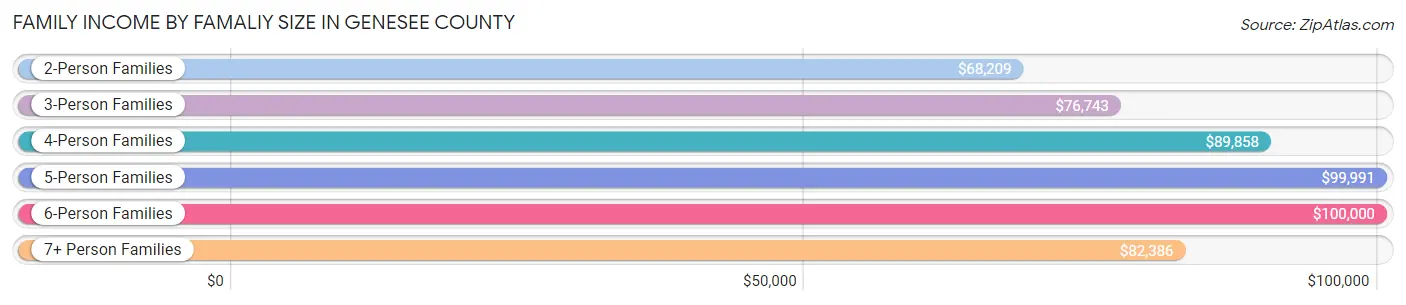
| Income Bracket | # Families | Median Income |
| 2-Person Families | 53,057 (50.9%) | $68,209 |
| 3-Person Families | 23,770 (22.8%) | $76,743 |
| 4-Person Families | 16,803 (16.1%) | $89,858 |
| 5-Person Families | 7,213 (6.9%) | $99,991 |
| 6-Person Families | 2,264 (2.2%) | $100,000 |
| 7+ Person Families | 1,019 (1.0%) | $82,386 |
| Total | 104,126 (100.0%) | $75,461 |
Family Income by Number of Earners in Genesee County
The median family income in Genesee County is $75,461, with families comprising 3+ earners (9,824) having the highest median family income of $136,055, while families with no earners (21,107) have the lowest median family income of $49,423, accounting for 9.4% and 20.3% of families, respectively.
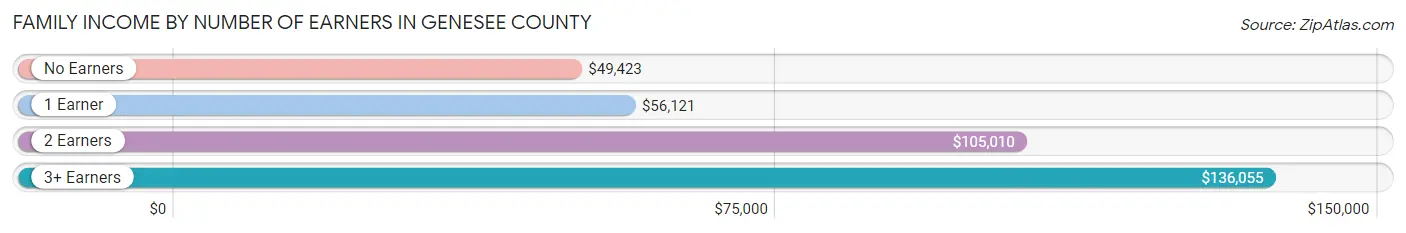
| Number of Earners | # Families | Median Income |
| No Earners | 21,107 (20.3%) | $49,423 |
| 1 Earner | 38,146 (36.6%) | $56,121 |
| 2 Earners | 35,049 (33.7%) | $105,010 |
| 3+ Earners | 9,824 (9.4%) | $136,055 |
| Total | 104,126 (100.0%) | $75,461 |
Household Income in Genesee County
Household Income Brackets in Genesee County
With 29,559 households falling in the category, the $50,000 to $74,999 income range is the most frequent in Genesee County, accounting for 17.8% of all households. In contrast, only 7,805 households (4.7%) fall into the $10,000 to $14,999 income bracket, making it the least populous group.
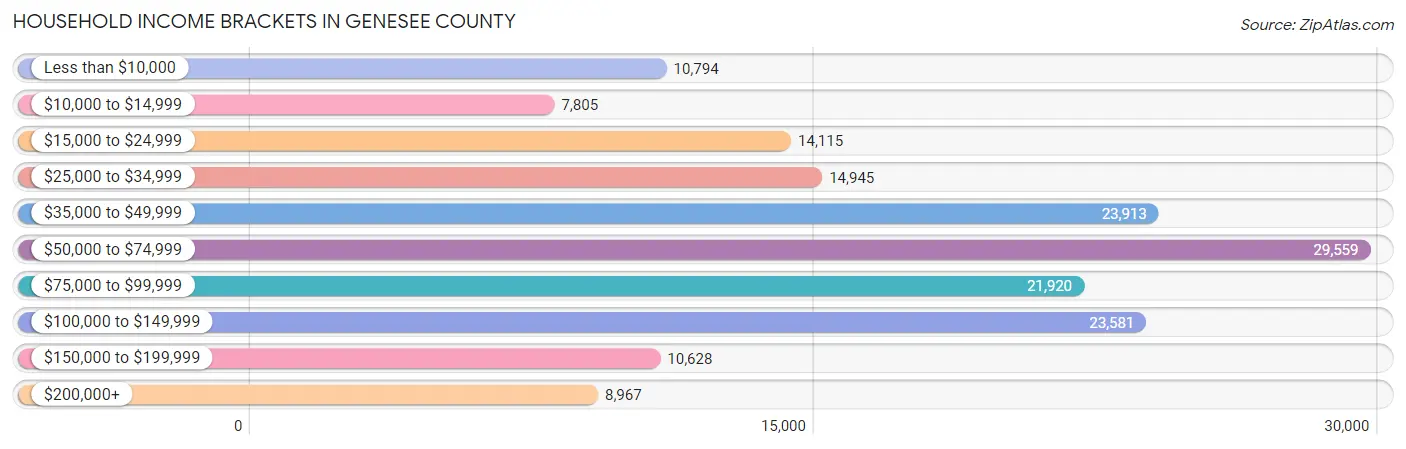
| Income Bracket | # Households | % Households |
| Less than $10,000 | 10,794 | 6.5% |
| $10,000 to $14,999 | 7,805 | 4.7% |
| $15,000 to $24,999 | 14,115 | 8.5% |
| $25,000 to $34,999 | 14,945 | 9.0% |
| $35,000 to $49,999 | 23,913 | 14.4% |
| $50,000 to $74,999 | 29,559 | 17.8% |
| $75,000 to $99,999 | 21,920 | 13.2% |
| $100,000 to $149,999 | 23,581 | 14.2% |
| $150,000 to $199,999 | 10,628 | 6.4% |
| $200,000+ | 8,967 | 5.4% |
Household Income by Householder Age in Genesee County
The median household income in Genesee County is $58,594, with the highest median household income of $69,206 found in the 45 to 64 years age bracket for the primary householder. A total of 63,235 households (38.1%) fall into this category. Meanwhile, the 15 to 24 years age bracket for the primary householder has the lowest median household income of $41,879, with 5,638 households (3.4%) in this group.
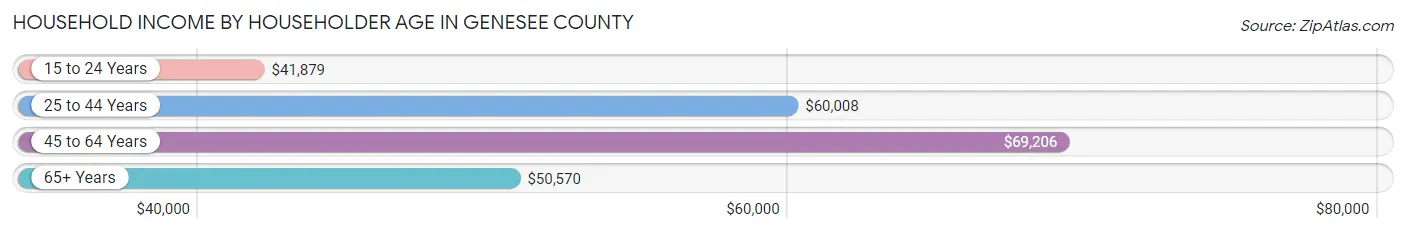
| Income Bracket | # Households | Median Income |
| 15 to 24 Years | 5,638 (3.4%) | $41,879 |
| 25 to 44 Years | 48,725 (29.3%) | $60,008 |
| 45 to 64 Years | 63,235 (38.1%) | $69,206 |
| 65+ Years | 48,462 (29.2%) | $50,570 |
| Total | 166,060 (100.0%) | $58,594 |
Poverty in Genesee County
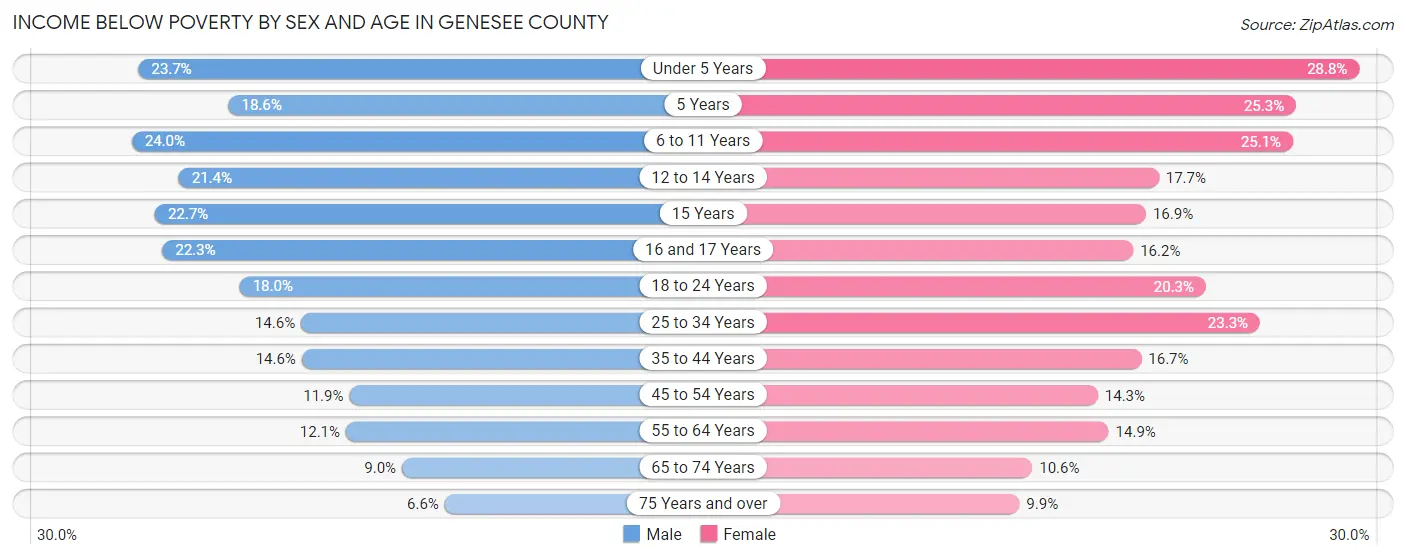
Income Below Poverty by Sex and Age in Genesee County
With 15.1% poverty level for males and 17.3% for females among the residents of Genesee County, 6 to 11 year old males and under 5 year old females are the most vulnerable to poverty, with 3,598 males (24.0%) and 3,236 females (28.8%) in their respective age groups living below the poverty level.
| Age Bracket | Male | Female |
| Under 5 Years | 2,702 (23.7%) | 3,236 (28.8%) |
| 5 Years | 428 (18.6%) | 570 (25.3%) |
| 6 to 11 Years | 3,598 (24.0%) | 3,657 (25.1%) |
| 12 to 14 Years | 1,729 (21.4%) | 1,302 (17.6%) |
| 15 Years | 655 (22.7%) | 454 (16.9%) |
| 16 and 17 Years | 1,237 (22.3%) | 852 (16.2%) |
| 18 to 24 Years | 3,073 (18.0%) | 3,380 (20.3%) |
| 25 to 34 Years | 3,622 (14.6%) | 5,995 (23.3%) |
| 35 to 44 Years | 3,287 (14.6%) | 4,066 (16.7%) |
| 45 to 54 Years | 3,006 (11.9%) | 3,767 (14.3%) |
| 55 to 64 Years | 3,315 (12.1%) | 4,416 (14.9%) |
| 65 to 74 Years | 1,783 (9.0%) | 2,458 (10.6%) |
| 75 Years and over | 781 (6.6%) | 1,687 (9.9%) |
| Total | 29,216 (15.1%) | 35,840 (17.3%) |
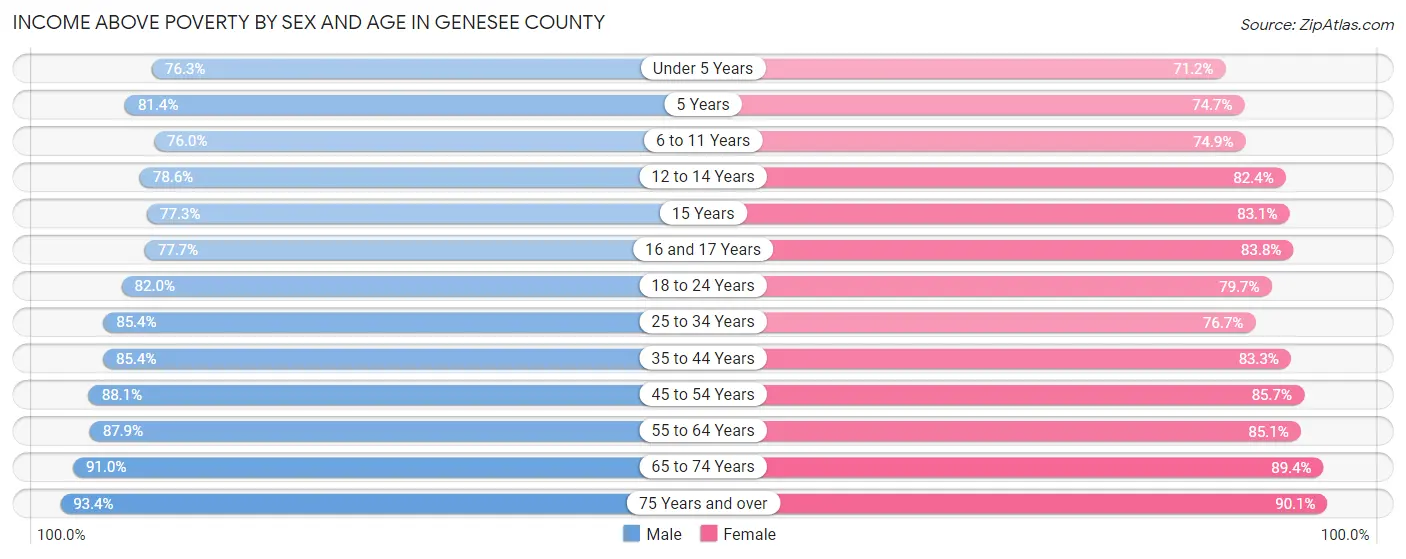
Income Above Poverty by Sex and Age in Genesee County
According to the poverty statistics in Genesee County, males aged 75 years and over and females aged 75 years and over are the age groups that are most secure financially, with 93.4% of males and 90.1% of females in these age groups living above the poverty line.
| Age Bracket | Male | Female |
| Under 5 Years | 8,720 (76.3%) | 7,996 (71.2%) |
| 5 Years | 1,868 (81.4%) | 1,684 (74.7%) |
| 6 to 11 Years | 11,372 (76.0%) | 10,904 (74.9%) |
| 12 to 14 Years | 6,346 (78.6%) | 6,075 (82.4%) |
| 15 Years | 2,225 (77.3%) | 2,226 (83.1%) |
| 16 and 17 Years | 4,303 (77.7%) | 4,398 (83.8%) |
| 18 to 24 Years | 13,976 (82.0%) | 13,295 (79.7%) |
| 25 to 34 Years | 21,166 (85.4%) | 19,753 (76.7%) |
| 35 to 44 Years | 19,274 (85.4%) | 20,310 (83.3%) |
| 45 to 54 Years | 22,208 (88.1%) | 22,656 (85.7%) |
| 55 to 64 Years | 24,066 (87.9%) | 25,309 (85.1%) |
| 65 to 74 Years | 18,054 (91.0%) | 20,711 (89.4%) |
| 75 Years and over | 11,035 (93.4%) | 15,364 (90.1%) |
| Total | 164,613 (84.9%) | 170,681 (82.7%) |
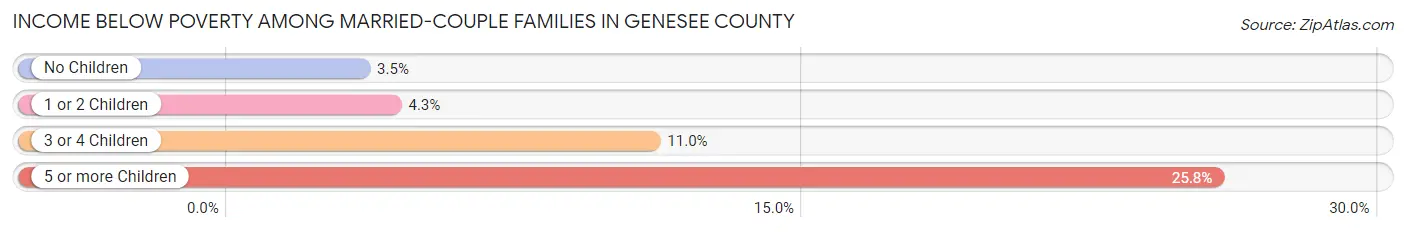
Income Below Poverty Among Married-Couple Families in Genesee County
The poverty statistics for married-couple families in Genesee County show that 4.4% or 3,013 of the total 69,160 families live below the poverty line. Families with 5 or more children have the highest poverty rate of 25.8%, comprising of 94 families. On the other hand, families with no children have the lowest poverty rate of 3.5%, which includes 1,536 families.
| Children | Above Poverty | Below Poverty |
| No Children | 42,990 (96.6%) | 1,536 (3.5%) |
| 1 or 2 Children | 18,330 (95.7%) | 818 (4.3%) |
| 3 or 4 Children | 4,556 (89.0%) | 565 (11.0%) |
| 5 or more Children | 271 (74.3%) | 94 (25.8%) |
| Total | 66,147 (95.6%) | 3,013 (4.4%) |
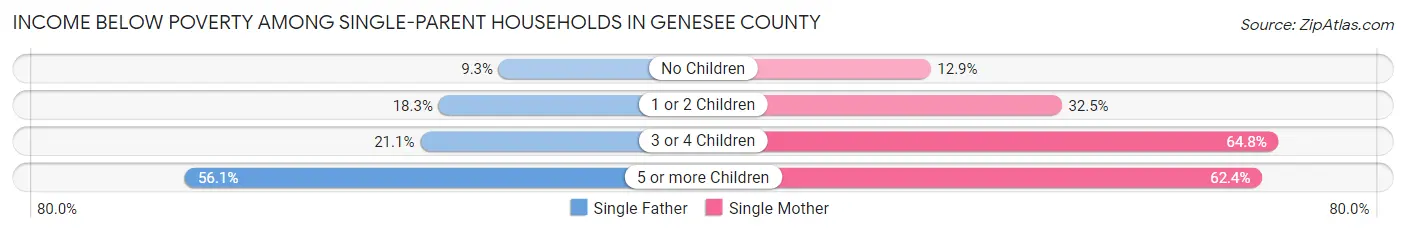
Income Below Poverty Among Single-Parent Households in Genesee County
According to the poverty data in Genesee County, 14.8% or 1,426 single-father households and 29.2% or 7,391 single-mother households are living below the poverty line. Among single-father households, those with 5 or more children have the highest poverty rate, with 46 households (56.1%) experiencing poverty. Likewise, among single-mother households, those with 3 or 4 children have the highest poverty rate, with 1,818 households (64.8%) falling below the poverty line.
| Children | Single Father | Single Mother |
| No Children | 397 (9.3%) | 1,188 (12.9%) |
| 1 or 2 Children | 883 (18.3%) | 4,259 (32.5%) |
| 3 or 4 Children | 100 (21.0%) | 1,818 (64.8%) |
| 5 or more Children | 46 (56.1%) | 126 (62.4%) |
| Total | 1,426 (14.8%) | 7,391 (29.2%) |
Income Below Poverty Among Married-Couple vs Single-Parent Households in Genesee County
The poverty data for Genesee County shows that 3,013 of the married-couple family households (4.4%) and 8,817 of the single-parent households (25.2%) are living below the poverty level. Within the married-couple family households, those with 5 or more children have the highest poverty rate, with 94 households (25.8%) falling below the poverty line. Among the single-parent households, those with 5 or more children have the highest poverty rate, with 172 household (60.6%) living below poverty.
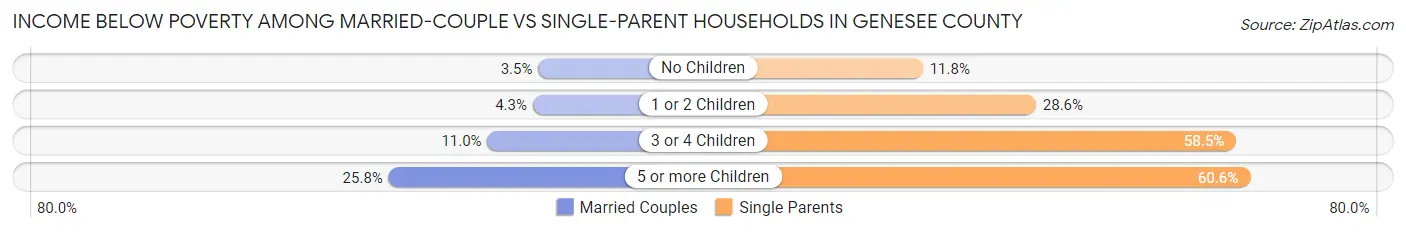
| Children | Married-Couple Families | Single-Parent Households |
| No Children | 1,536 (3.5%) | 1,585 (11.8%) |
| 1 or 2 Children | 818 (4.3%) | 5,142 (28.6%) |
| 3 or 4 Children | 565 (11.0%) | 1,918 (58.5%) |
| 5 or more Children | 94 (25.8%) | 172 (60.6%) |
| Total | 3,013 (4.4%) | 8,817 (25.2%) |
Employment Characteristics in Genesee County
Employment by Class of Employer in Genesee County
Among the 170,085 employed individuals in Genesee County, private company employees (123,938 | 72.9%), not-for-profit organizations (15,634 | 9.2%), and local government employees (9,164 | 5.4%) make up the most common classes of employment.
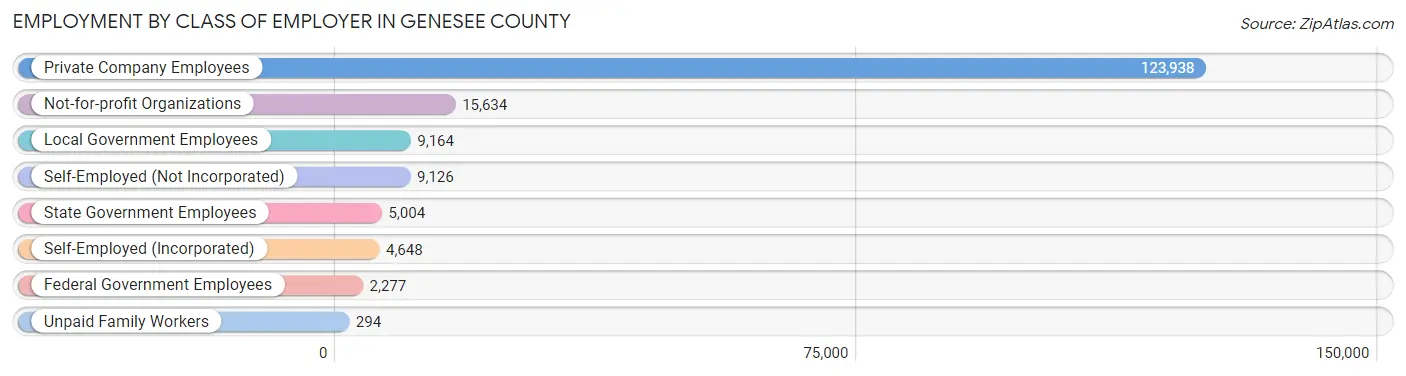
| Employer Class | # Employees | % Employees |
| Private Company Employees | 123,938 | 72.9% |
| Self-Employed (Incorporated) | 4,648 | 2.7% |
| Self-Employed (Not Incorporated) | 9,126 | 5.4% |
| Not-for-profit Organizations | 15,634 | 9.2% |
| Local Government Employees | 9,164 | 5.4% |
| State Government Employees | 5,004 | 2.9% |
| Federal Government Employees | 2,277 | 1.3% |
| Unpaid Family Workers | 294 | 0.2% |
| Total | 170,085 | 100.0% |
Employment Status by Age in Genesee County
According to the labor force statistics for Genesee County, out of the total population over 16 years of age (325,844), 58.2% or 189,641 individuals are in the labor force, with 8.5% or 16,119 of them unemployed. The age group with the highest labor force participation rate is 25 to 29 years, with 80.9% or 21,627 individuals in the labor force. Within the labor force, the 16 to 19 years age range has the highest percentage of unemployed individuals, with 20.2% or 1,873 of them being unemployed.
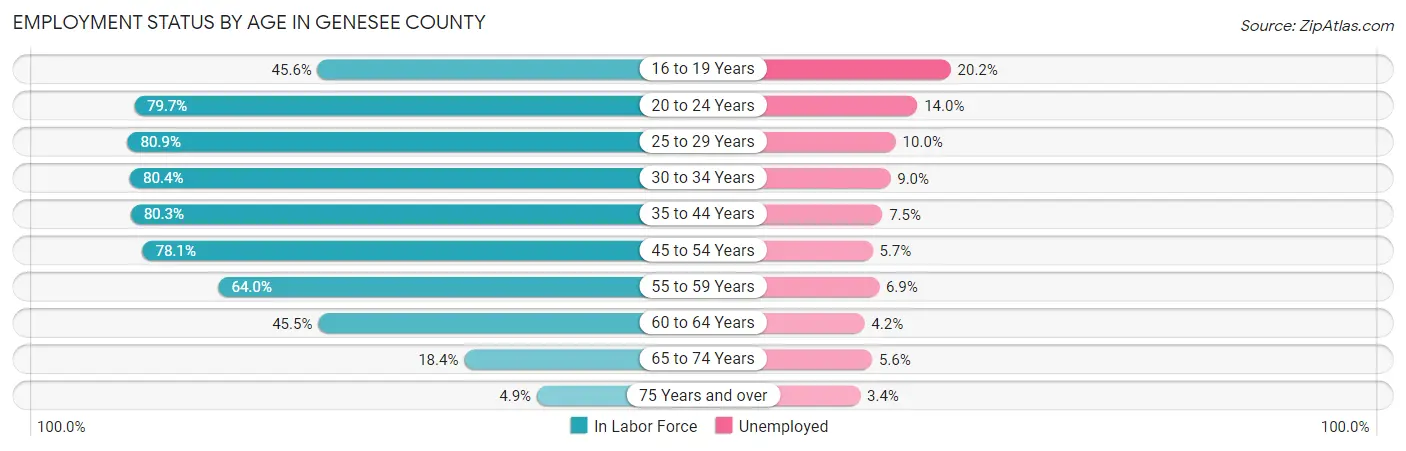
| Age Bracket | In Labor Force | Unemployed |
| 16 to 19 Years | 9,270 (45.6%) | 1,873 (20.2%) |
| 20 to 24 Years | 20,214 (79.7%) | 2,830 (14.0%) |
| 25 to 29 Years | 21,627 (80.9%) | 2,163 (10.0%) |
| 30 to 34 Years | 19,380 (80.4%) | 1,744 (9.0%) |
| 35 to 44 Years | 37,904 (80.3%) | 2,843 (7.5%) |
| 45 to 54 Years | 40,414 (78.1%) | 2,304 (5.7%) |
| 55 to 59 Years | 18,226 (64.0%) | 1,258 (6.9%) |
| 60 to 64 Years | 13,135 (45.5%) | 552 (4.2%) |
| 65 to 74 Years | 7,982 (18.4%) | 447 (5.6%) |
| 75 Years and over | 1,452 (4.9%) | 49 (3.4%) |
| Total | 189,641 (58.2%) | 16,119 (8.5%) |
Employment Status by Educational Attainment in Genesee County
According to labor force statistics for Genesee County, 72.7% of individuals (150,586) out of the total population between 25 and 64 years of age (207,134) are in the labor force, with 7.2% or 10,842 of them being unemployed. The group with the highest labor force participation rate are those with the educational attainment of bachelor's degree or higher, with 84.5% or 41,131 individuals in the labor force. Within the labor force, individuals with less than high school education have the highest percentage of unemployment, with 15.7% or 1,304 of them being unemployed.
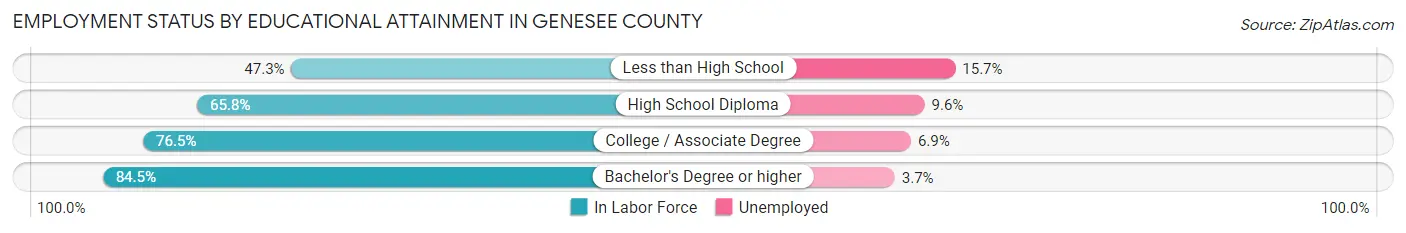
| Educational Attainment | In Labor Force | Unemployed |
| Less than High School | 8,304 (47.3%) | 2,756 (15.7%) |
| High School Diploma | 40,324 (65.8%) | 5,883 (9.6%) |
| College / Associate Degree | 60,909 (76.5%) | 5,494 (6.9%) |
| Bachelor's Degree or higher | 41,131 (84.5%) | 1,801 (3.7%) |
| Total | 150,586 (72.7%) | 14,914 (7.2%) |
Employment Occupations by Sex in Genesee County
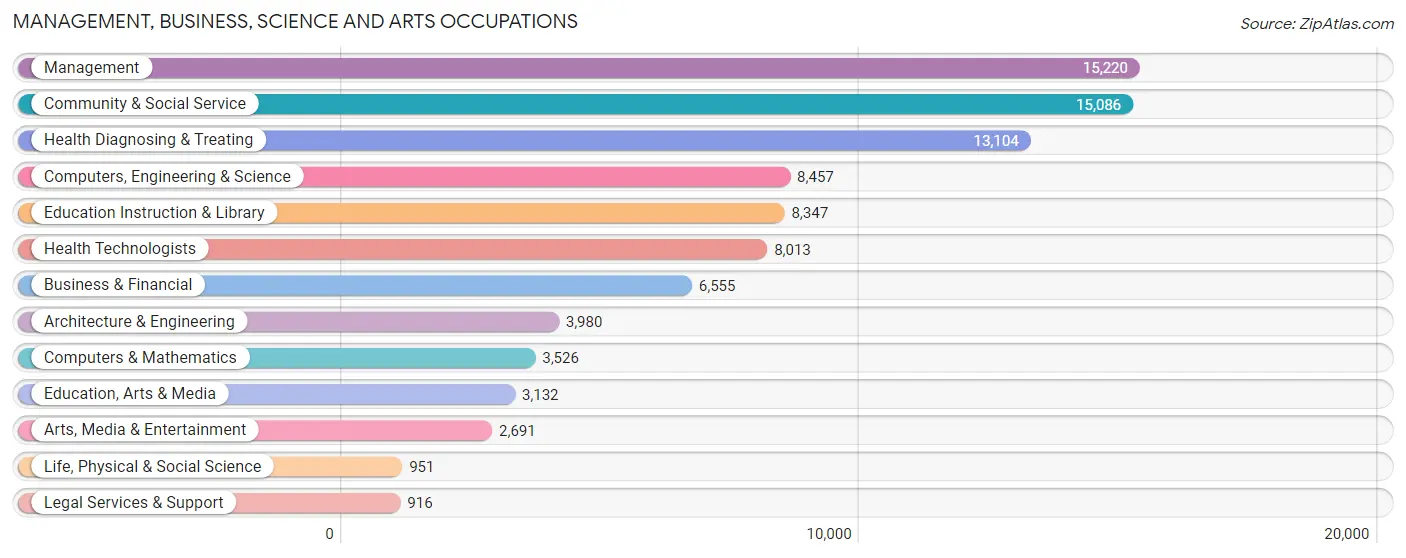
Management, Business, Science and Arts Occupations
The most common Management, Business, Science and Arts occupations in Genesee County are Management (15,220 | 8.8%), Community & Social Service (15,086 | 8.7%), Health Diagnosing & Treating (13,104 | 7.6%), Computers, Engineering & Science (8,457 | 4.9%), and Education Instruction & Library (8,347 | 4.8%).
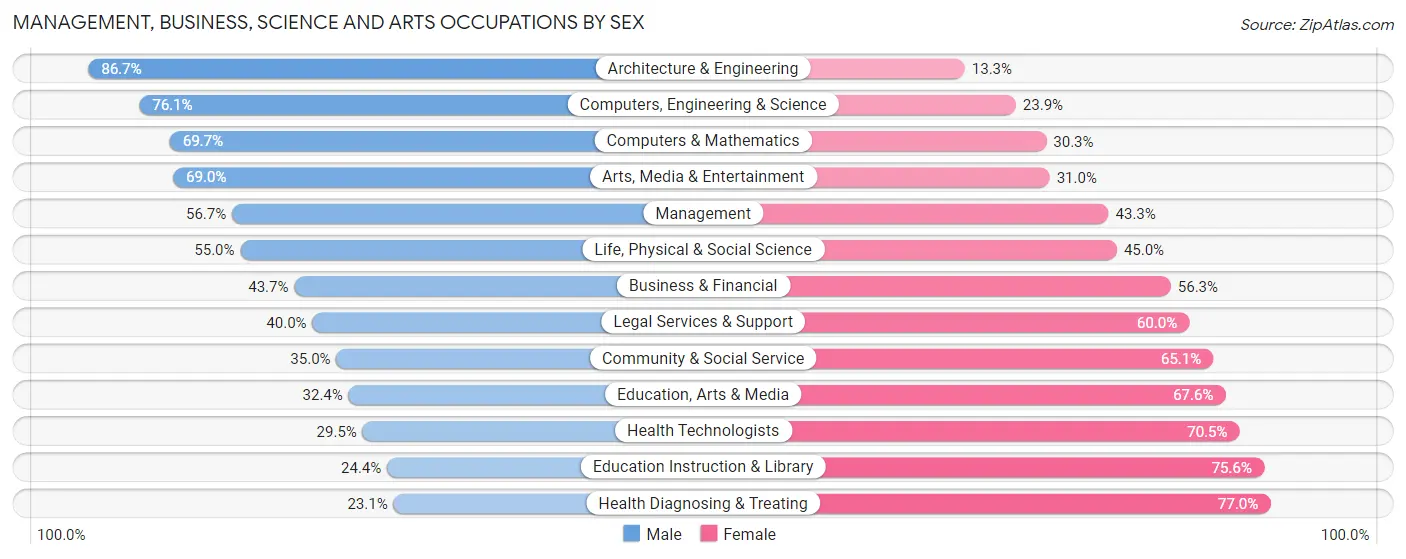
Management, Business, Science and Arts Occupations by Sex
Within the Management, Business, Science and Arts occupations in Genesee County, the most male-oriented occupations are Architecture & Engineering (86.7%), Computers, Engineering & Science (76.1%), and Computers & Mathematics (69.7%), while the most female-oriented occupations are Health Diagnosing & Treating (76.9%), Education Instruction & Library (75.6%), and Health Technologists (70.5%).
| Occupation | Male | Female |
| Management | 8,635 (56.7%) | 6,585 (43.3%) |
| Business & Financial | 2,867 (43.7%) | 3,688 (56.3%) |
| Computers, Engineering & Science | 6,432 (76.1%) | 2,025 (23.9%) |
| Computers & Mathematics | 2,458 (69.7%) | 1,068 (30.3%) |
| Architecture & Engineering | 3,451 (86.7%) | 529 (13.3%) |
| Life, Physical & Social Science | 523 (55.0%) | 428 (45.0%) |
| Community & Social Service | 5,273 (34.9%) | 9,813 (65.0%) |
| Education, Arts & Media | 1,015 (32.4%) | 2,117 (67.6%) |
| Legal Services & Support | 366 (40.0%) | 550 (60.0%) |
| Education Instruction & Library | 2,035 (24.4%) | 6,312 (75.6%) |
| Arts, Media & Entertainment | 1,857 (69.0%) | 834 (31.0%) |
| Health Diagnosing & Treating | 3,020 (23.1%) | 10,084 (76.9%) |
| Health Technologists | 2,362 (29.5%) | 5,651 (70.5%) |
| Total (Category) | 26,227 (44.9%) | 32,195 (55.1%) |
| Total (Overall) | 88,361 (50.9%) | 85,083 (49.1%) |
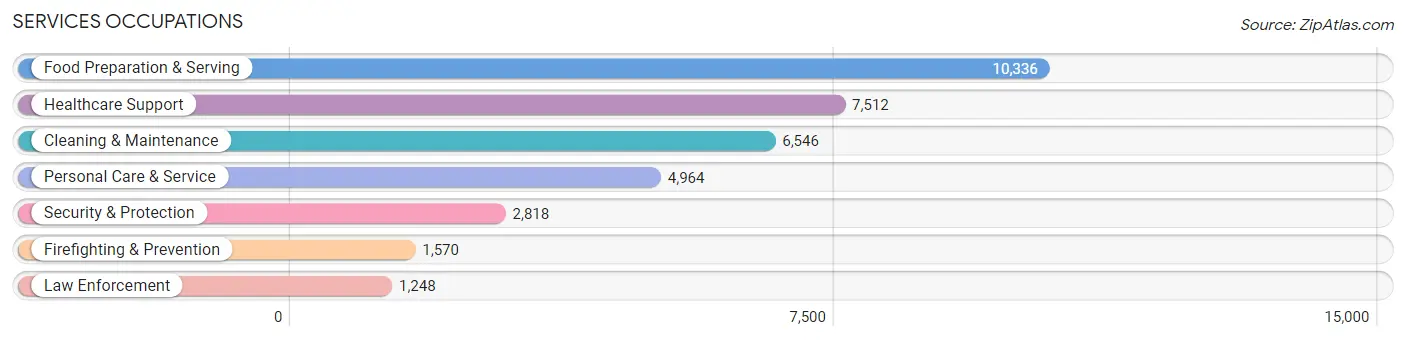
Services Occupations
The most common Services occupations in Genesee County are Food Preparation & Serving (10,336 | 6.0%), Healthcare Support (7,512 | 4.3%), Cleaning & Maintenance (6,546 | 3.8%), Personal Care & Service (4,964 | 2.9%), and Security & Protection (2,818 | 1.6%).
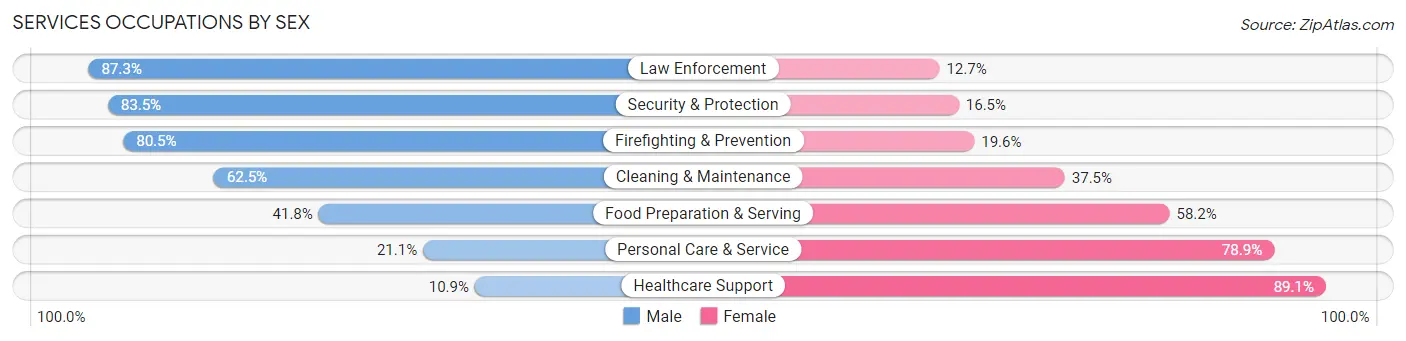
Services Occupations by Sex
Within the Services occupations in Genesee County, the most male-oriented occupations are Law Enforcement (87.3%), Security & Protection (83.5%), and Firefighting & Prevention (80.4%), while the most female-oriented occupations are Healthcare Support (89.1%), Personal Care & Service (78.9%), and Food Preparation & Serving (58.2%).
| Occupation | Male | Female |
| Healthcare Support | 816 (10.9%) | 6,696 (89.1%) |
| Security & Protection | 2,353 (83.5%) | 465 (16.5%) |
| Firefighting & Prevention | 1,263 (80.4%) | 307 (19.6%) |
| Law Enforcement | 1,090 (87.3%) | 158 (12.7%) |
| Food Preparation & Serving | 4,318 (41.8%) | 6,018 (58.2%) |
| Cleaning & Maintenance | 4,092 (62.5%) | 2,454 (37.5%) |
| Personal Care & Service | 1,048 (21.1%) | 3,916 (78.9%) |
| Total (Category) | 12,627 (39.2%) | 19,549 (60.8%) |
| Total (Overall) | 88,361 (50.9%) | 85,083 (49.1%) |
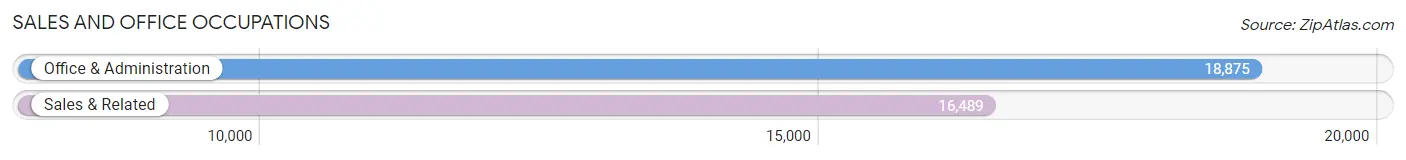
Sales and Office Occupations
The most common Sales and Office occupations in Genesee County are Office & Administration (18,875 | 10.9%), and Sales & Related (16,489 | 9.5%).
Sales and Office Occupations by Sex
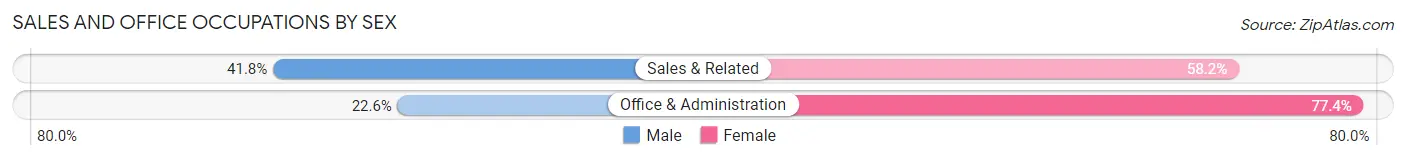
| Occupation | Male | Female |
| Sales & Related | 6,887 (41.8%) | 9,602 (58.2%) |
| Office & Administration | 4,266 (22.6%) | 14,609 (77.4%) |
| Total (Category) | 11,153 (31.5%) | 24,211 (68.5%) |
| Total (Overall) | 88,361 (50.9%) | 85,083 (49.1%) |
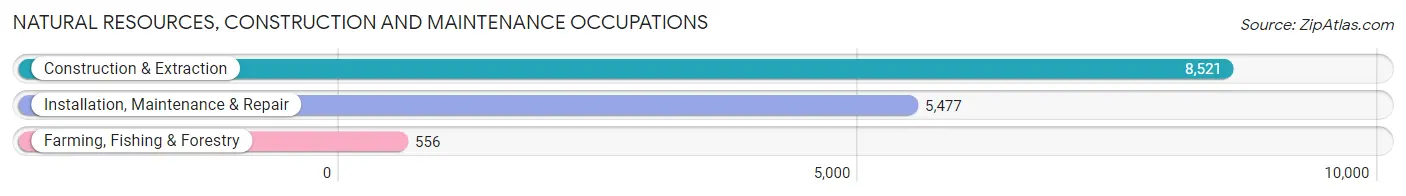
Natural Resources, Construction and Maintenance Occupations
The most common Natural Resources, Construction and Maintenance occupations in Genesee County are Construction & Extraction (8,521 | 4.9%), Installation, Maintenance & Repair (5,477 | 3.2%), and Farming, Fishing & Forestry (556 | 0.3%).
Natural Resources, Construction and Maintenance Occupations by Sex
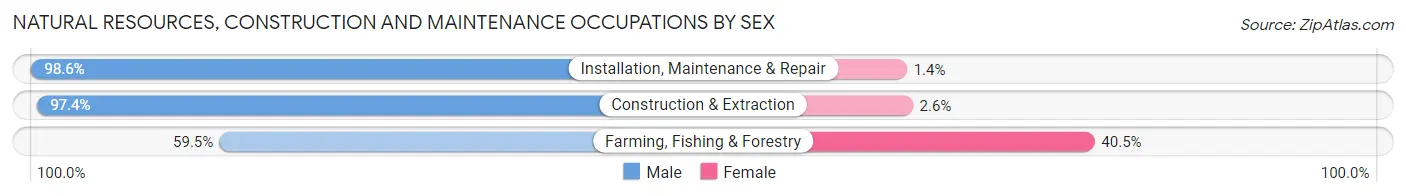
| Occupation | Male | Female |
| Farming, Fishing & Forestry | 331 (59.5%) | 225 (40.5%) |
| Construction & Extraction | 8,297 (97.4%) | 224 (2.6%) |
| Installation, Maintenance & Repair | 5,399 (98.6%) | 78 (1.4%) |
| Total (Category) | 14,027 (96.4%) | 527 (3.6%) |
| Total (Overall) | 88,361 (50.9%) | 85,083 (49.1%) |
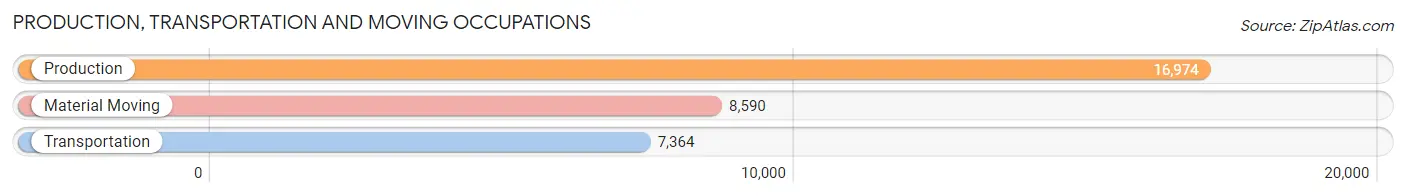
Production, Transportation and Moving Occupations
The most common Production, Transportation and Moving occupations in Genesee County are Production (16,974 | 9.8%), Material Moving (8,590 | 5.0%), and Transportation (7,364 | 4.3%).
Production, Transportation and Moving Occupations by Sex
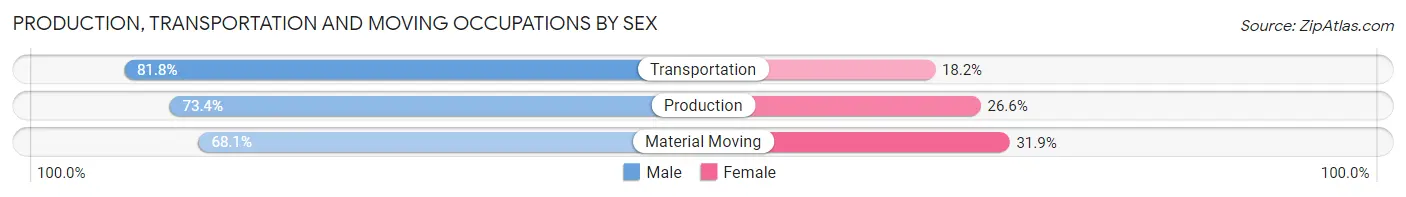
| Occupation | Male | Female |
| Production | 12,458 (73.4%) | 4,516 (26.6%) |
| Transportation | 6,021 (81.8%) | 1,343 (18.2%) |
| Material Moving | 5,848 (68.1%) | 2,742 (31.9%) |
| Total (Category) | 24,327 (73.9%) | 8,601 (26.1%) |
| Total (Overall) | 88,361 (50.9%) | 85,083 (49.1%) |
Employment Industries by Sex in Genesee County
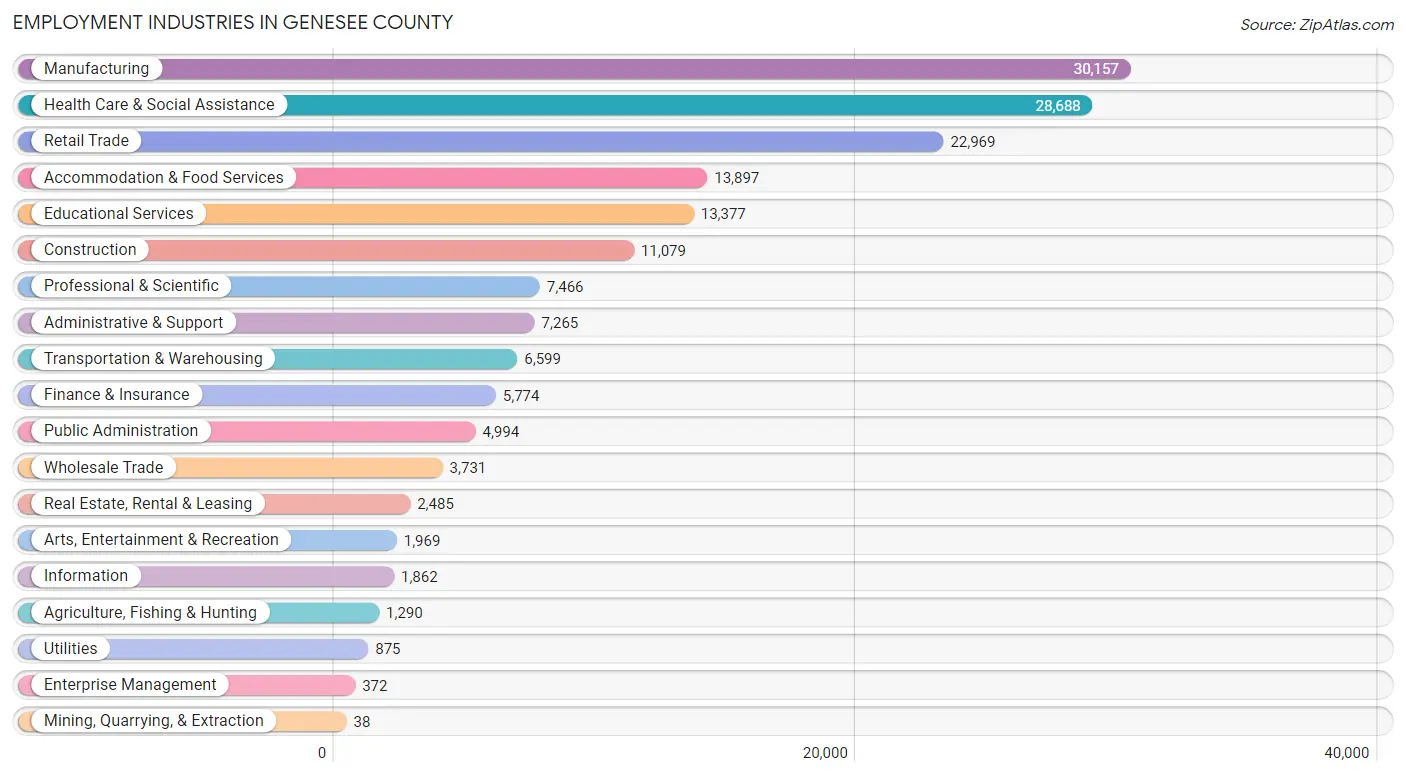
Employment Industries in Genesee County
The major employment industries in Genesee County include Manufacturing (30,157 | 17.4%), Health Care & Social Assistance (28,688 | 16.5%), Retail Trade (22,969 | 13.2%), Accommodation & Food Services (13,897 | 8.0%), and Educational Services (13,377 | 7.7%).
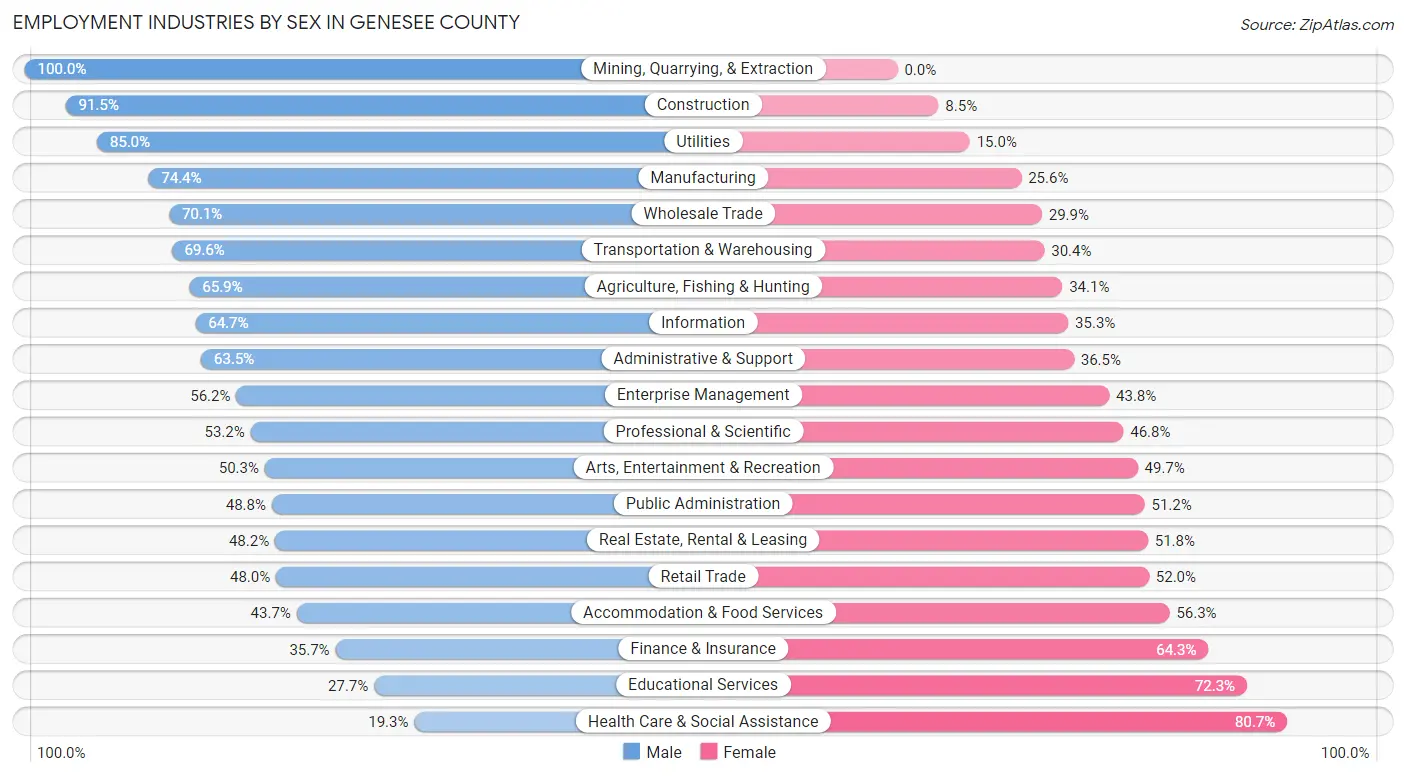
Employment Industries by Sex in Genesee County
The Genesee County industries that see more men than women are Mining, Quarrying, & Extraction (100.0%), Construction (91.5%), and Utilities (85.0%), whereas the industries that tend to have a higher number of women are Health Care & Social Assistance (80.7%), Educational Services (72.3%), and Finance & Insurance (64.3%).
| Industry | Male | Female |
| Agriculture, Fishing & Hunting | 850 (65.9%) | 440 (34.1%) |
| Mining, Quarrying, & Extraction | 38 (100.0%) | 0 (0.0%) |
| Construction | 10,139 (91.5%) | 940 (8.5%) |
| Manufacturing | 22,428 (74.4%) | 7,729 (25.6%) |
| Wholesale Trade | 2,616 (70.1%) | 1,115 (29.9%) |
| Retail Trade | 11,015 (48.0%) | 11,954 (52.0%) |
| Transportation & Warehousing | 4,593 (69.6%) | 2,006 (30.4%) |
| Utilities | 744 (85.0%) | 131 (15.0%) |
| Information | 1,204 (64.7%) | 658 (35.3%) |
| Finance & Insurance | 2,059 (35.7%) | 3,715 (64.3%) |
| Real Estate, Rental & Leasing | 1,197 (48.2%) | 1,288 (51.8%) |
| Professional & Scientific | 3,975 (53.2%) | 3,491 (46.8%) |
| Enterprise Management | 209 (56.2%) | 163 (43.8%) |
| Administrative & Support | 4,613 (63.5%) | 2,652 (36.5%) |
| Educational Services | 3,700 (27.7%) | 9,677 (72.3%) |
| Health Care & Social Assistance | 5,549 (19.3%) | 23,139 (80.7%) |
| Arts, Entertainment & Recreation | 990 (50.3%) | 979 (49.7%) |
| Accommodation & Food Services | 6,072 (43.7%) | 7,825 (56.3%) |
| Public Administration | 2,439 (48.8%) | 2,555 (51.2%) |
| Total | 88,361 (50.9%) | 85,083 (49.1%) |
Education in Genesee County
School Enrollment in Genesee County
The most common levels of schooling among the 90,485 students in Genesee County are high school (22,669 | 25.1%), middle school (20,569 | 22.7%), and elementary school (19,496 | 21.5%).
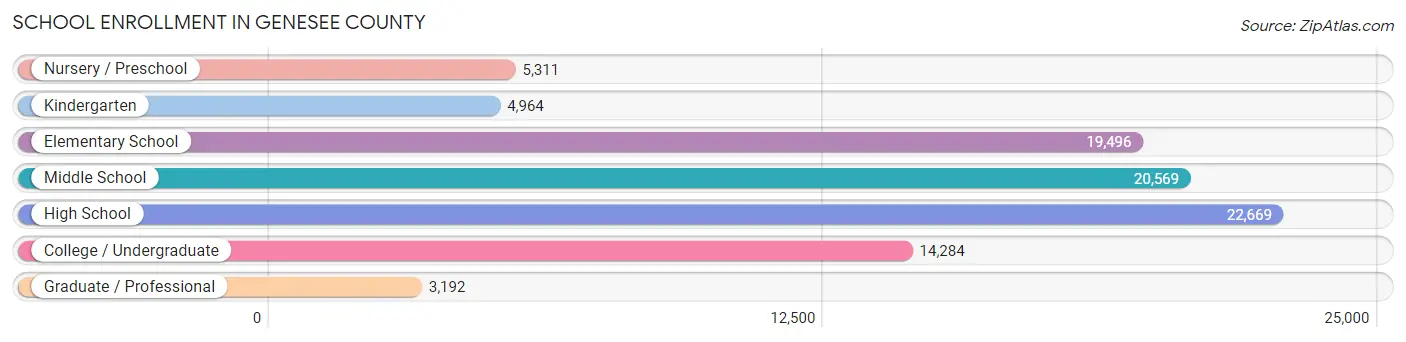
| School Level | # Students | % Students |
| Nursery / Preschool | 5,311 | 5.9% |
| Kindergarten | 4,964 | 5.5% |
| Elementary School | 19,496 | 21.5% |
| Middle School | 20,569 | 22.7% |
| High School | 22,669 | 25.1% |
| College / Undergraduate | 14,284 | 15.8% |
| Graduate / Professional | 3,192 | 3.5% |
| Total | 90,485 | 100.0% |
School Enrollment by Age by Funding Source in Genesee County
Out of a total of 90,485 students who are enrolled in schools in Genesee County, 9,682 (10.7%) attend a private institution, while the remaining 80,803 (89.3%) are enrolled in public schools. The age group of 3 to 4 year olds has the highest likelihood of being enrolled in private schools, with 976 (23.0% in the age bracket) enrolled. Conversely, the age group of 10 to 14 year olds has the lowest likelihood of being enrolled in a private school, with 23,976 (92.8% in the age bracket) attending a public institution.
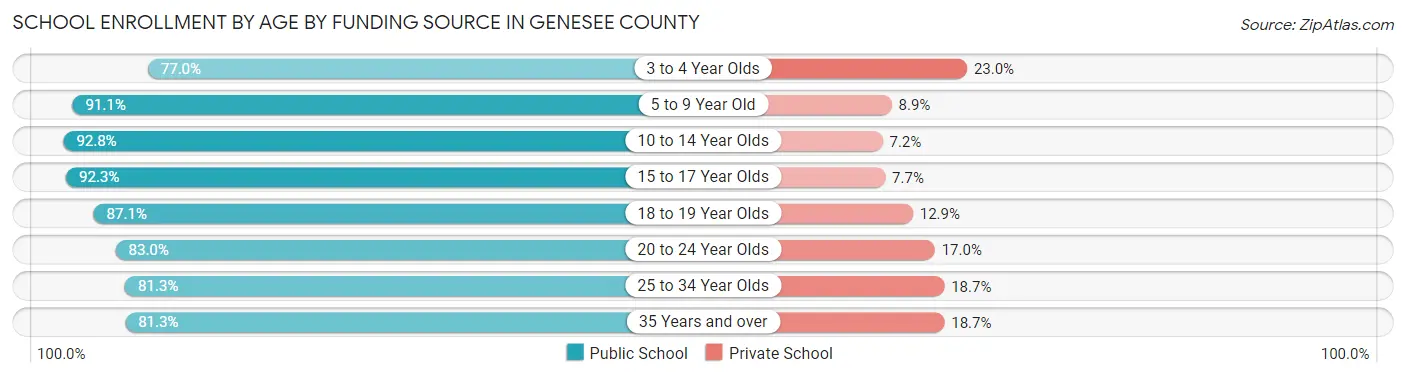
| Age Bracket | Public School | Private School |
| 3 to 4 Year Olds | 3,275 (77.0%) | 976 (23.0%) |
| 5 to 9 Year Old | 20,921 (91.1%) | 2,051 (8.9%) |
| 10 to 14 Year Olds | 23,976 (92.8%) | 1,871 (7.2%) |
| 15 to 17 Year Olds | 14,855 (92.3%) | 1,245 (7.7%) |
| 18 to 19 Year Olds | 5,566 (87.1%) | 822 (12.9%) |
| 20 to 24 Year Olds | 5,577 (83.0%) | 1,139 (17.0%) |
| 25 to 34 Year Olds | 3,819 (81.3%) | 880 (18.7%) |
| 35 Years and over | 2,854 (81.3%) | 658 (18.7%) |
| Total | 80,803 (89.3%) | 9,682 (10.7%) |
Educational Attainment by Field of Study in Genesee County
Business (14,909 | 21.8%), education (10,941 | 16.0%), science & technology (8,954 | 13.1%), engineering (5,696 | 8.4%), and arts & humanities (5,390 | 7.9%) are the most common fields of study among 68,254 individuals in Genesee County who have obtained a bachelor's degree or higher.
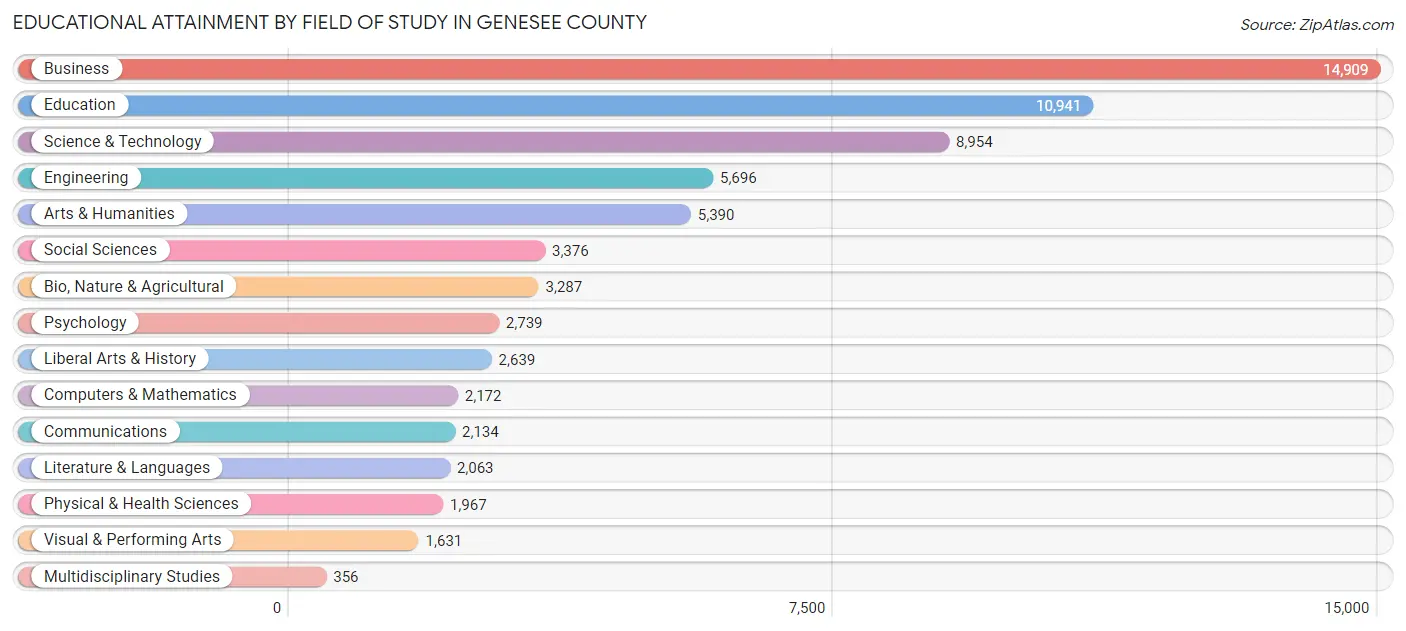
| Field of Study | # Graduates | % Graduates |
| Computers & Mathematics | 2,172 | 3.2% |
| Bio, Nature & Agricultural | 3,287 | 4.8% |
| Physical & Health Sciences | 1,967 | 2.9% |
| Psychology | 2,739 | 4.0% |
| Social Sciences | 3,376 | 5.0% |
| Engineering | 5,696 | 8.4% |
| Multidisciplinary Studies | 356 | 0.5% |
| Science & Technology | 8,954 | 13.1% |
| Business | 14,909 | 21.8% |
| Education | 10,941 | 16.0% |
| Literature & Languages | 2,063 | 3.0% |
| Liberal Arts & History | 2,639 | 3.9% |
| Visual & Performing Arts | 1,631 | 2.4% |
| Communications | 2,134 | 3.1% |
| Arts & Humanities | 5,390 | 7.9% |
| Total | 68,254 | 100.0% |
Transportation & Commute in Genesee County
Vehicle Availability by Sex in Genesee County
The most prevalent vehicle ownership categories in Genesee County are males with 2 vehicles (36,703, accounting for 42.5%) and females with 2 vehicles (34,201, making up 44.2%).
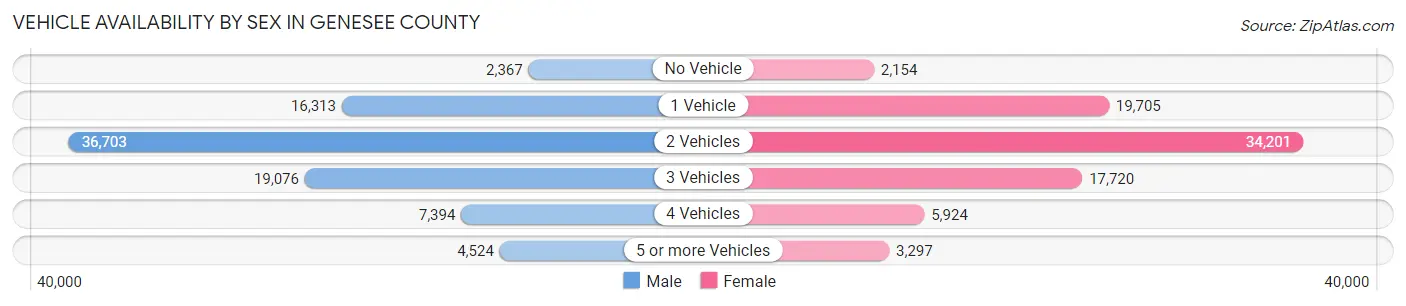
| Vehicles Available | Male | Female |
| No Vehicle | 2,367 (2.7%) | 2,154 (2.6%) |
| 1 Vehicle | 16,313 (18.9%) | 19,705 (23.7%) |
| 2 Vehicles | 36,703 (42.5%) | 34,201 (41.2%) |
| 3 Vehicles | 19,076 (22.1%) | 17,720 (21.3%) |
| 4 Vehicles | 7,394 (8.6%) | 5,924 (7.1%) |
| 5 or more Vehicles | 4,524 (5.2%) | 3,297 (4.0%) |
| Total | 86,377 (100.0%) | 83,001 (100.0%) |
Commute Time in Genesee County
The most frequently occuring commute durations in Genesee County are 15 to 19 minutes (26,444 commuters, 16.8%), 20 to 24 minutes (24,170 commuters, 15.3%), and 10 to 14 minutes (22,312 commuters, 14.2%).
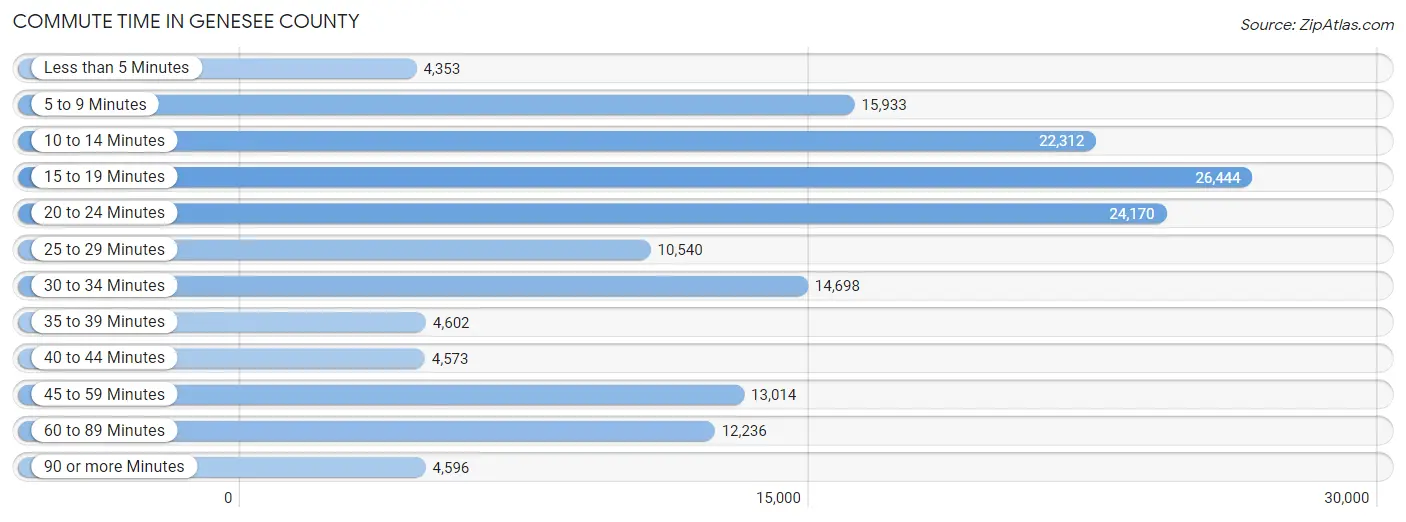
| Commute Time | # Commuters | % Commuters |
| Less than 5 Minutes | 4,353 | 2.8% |
| 5 to 9 Minutes | 15,933 | 10.1% |
| 10 to 14 Minutes | 22,312 | 14.2% |
| 15 to 19 Minutes | 26,444 | 16.8% |
| 20 to 24 Minutes | 24,170 | 15.3% |
| 25 to 29 Minutes | 10,540 | 6.7% |
| 30 to 34 Minutes | 14,698 | 9.3% |
| 35 to 39 Minutes | 4,602 | 2.9% |
| 40 to 44 Minutes | 4,573 | 2.9% |
| 45 to 59 Minutes | 13,014 | 8.3% |
| 60 to 89 Minutes | 12,236 | 7.8% |
| 90 or more Minutes | 4,596 | 2.9% |
Commute Time by Sex in Genesee County
The most common commute times in Genesee County are 15 to 19 minutes (12,284 commuters, 15.1%) for males and 15 to 19 minutes (14,160 commuters, 18.5%) for females.
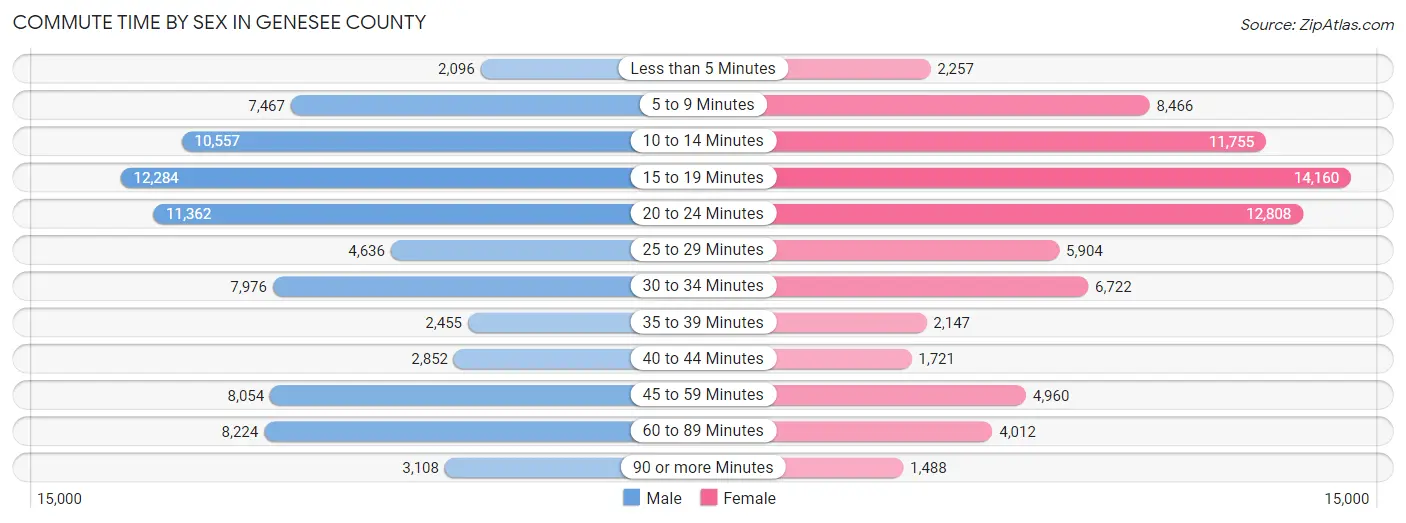
| Commute Time | Male | Female |
| Less than 5 Minutes | 2,096 (2.6%) | 2,257 (2.9%) |
| 5 to 9 Minutes | 7,467 (9.2%) | 8,466 (11.1%) |
| 10 to 14 Minutes | 10,557 (13.0%) | 11,755 (15.4%) |
| 15 to 19 Minutes | 12,284 (15.1%) | 14,160 (18.5%) |
| 20 to 24 Minutes | 11,362 (14.0%) | 12,808 (16.8%) |
| 25 to 29 Minutes | 4,636 (5.7%) | 5,904 (7.7%) |
| 30 to 34 Minutes | 7,976 (9.8%) | 6,722 (8.8%) |
| 35 to 39 Minutes | 2,455 (3.0%) | 2,147 (2.8%) |
| 40 to 44 Minutes | 2,852 (3.5%) | 1,721 (2.2%) |
| 45 to 59 Minutes | 8,054 (9.9%) | 4,960 (6.5%) |
| 60 to 89 Minutes | 8,224 (10.1%) | 4,012 (5.2%) |
| 90 or more Minutes | 3,108 (3.8%) | 1,488 (1.9%) |
Time of Departure to Work by Sex in Genesee County
The most frequent times of departure to work in Genesee County are 7:00 AM to 7:29 AM (9,617, 11.9%) for males and 7:30 AM to 7:59 AM (9,778, 12.8%) for females.
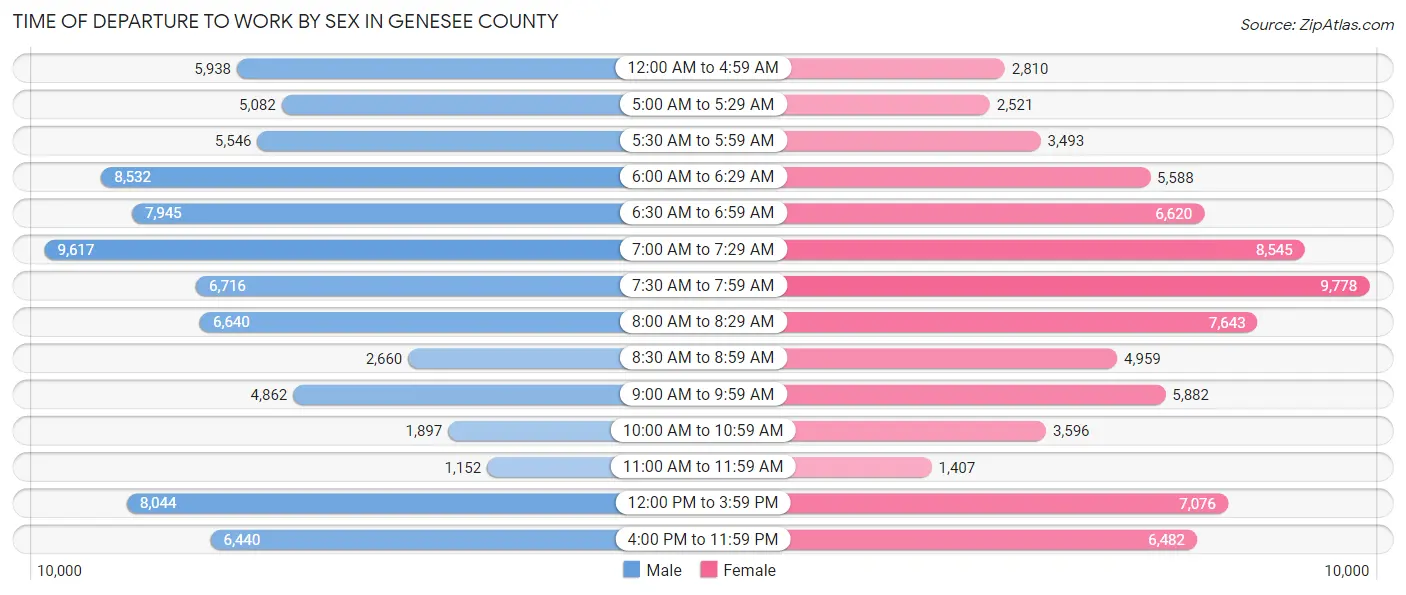
| Time of Departure | Male | Female |
| 12:00 AM to 4:59 AM | 5,938 (7.3%) | 2,810 (3.7%) |
| 5:00 AM to 5:29 AM | 5,082 (6.3%) | 2,521 (3.3%) |
| 5:30 AM to 5:59 AM | 5,546 (6.8%) | 3,493 (4.6%) |
| 6:00 AM to 6:29 AM | 8,532 (10.5%) | 5,588 (7.3%) |
| 6:30 AM to 6:59 AM | 7,945 (9.8%) | 6,620 (8.7%) |
| 7:00 AM to 7:29 AM | 9,617 (11.9%) | 8,545 (11.2%) |
| 7:30 AM to 7:59 AM | 6,716 (8.3%) | 9,778 (12.8%) |
| 8:00 AM to 8:29 AM | 6,640 (8.2%) | 7,643 (10.0%) |
| 8:30 AM to 8:59 AM | 2,660 (3.3%) | 4,959 (6.5%) |
| 9:00 AM to 9:59 AM | 4,862 (6.0%) | 5,882 (7.7%) |
| 10:00 AM to 10:59 AM | 1,897 (2.3%) | 3,596 (4.7%) |
| 11:00 AM to 11:59 AM | 1,152 (1.4%) | 1,407 (1.8%) |
| 12:00 PM to 3:59 PM | 8,044 (9.9%) | 7,076 (9.3%) |
| 4:00 PM to 11:59 PM | 6,440 (7.9%) | 6,482 (8.5%) |
| Total | 81,071 (100.0%) | 76,400 (100.0%) |
Housing Occupancy in Genesee County
Occupancy by Ownership in Genesee County
Of the total 166,060 dwellings in Genesee County, owner-occupied units account for 116,882 (70.4%), while renter-occupied units make up 49,178 (29.6%).
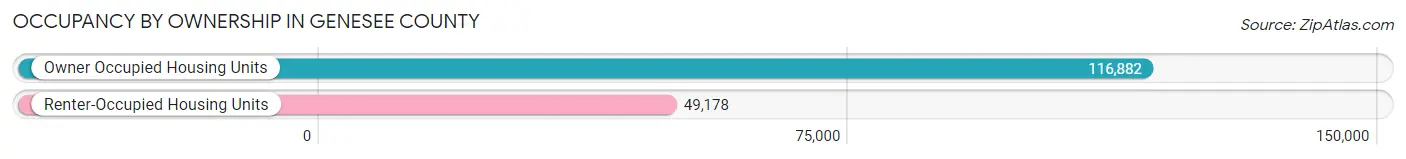
| Occupancy | # Housing Units | % Housing Units |
| Owner Occupied Housing Units | 116,882 | 70.4% |
| Renter-Occupied Housing Units | 49,178 | 29.6% |
| Total Occupied Housing Units | 166,060 | 100.0% |
Occupancy by Household Size in Genesee County
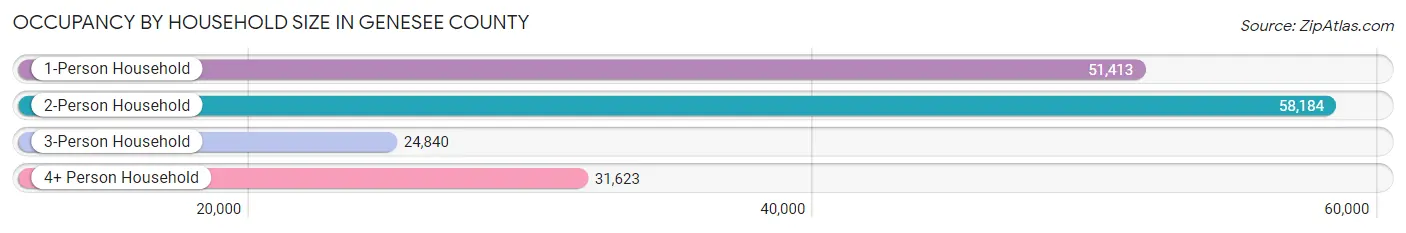
| Household Size | # Housing Units | % Housing Units |
| 1-Person Household | 51,413 | 31.0% |
| 2-Person Household | 58,184 | 35.0% |
| 3-Person Household | 24,840 | 15.0% |
| 4+ Person Household | 31,623 | 19.0% |
| Total Housing Units | 166,060 | 100.0% |
Occupancy by Ownership by Household Size in Genesee County
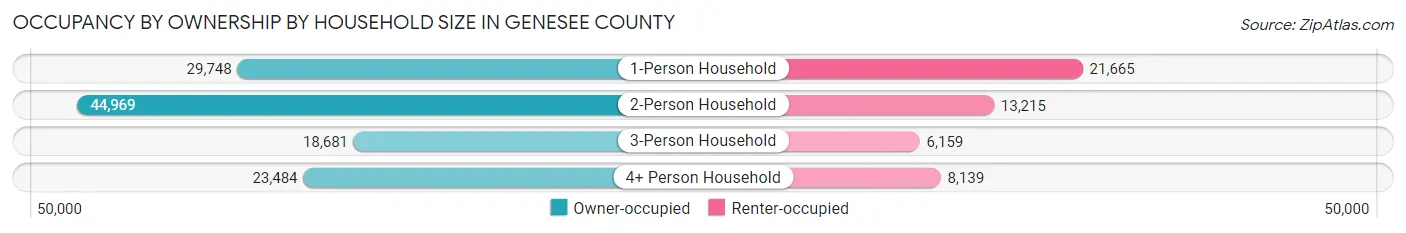
| Household Size | Owner-occupied | Renter-occupied |
| 1-Person Household | 29,748 (57.9%) | 21,665 (42.1%) |
| 2-Person Household | 44,969 (77.3%) | 13,215 (22.7%) |
| 3-Person Household | 18,681 (75.2%) | 6,159 (24.8%) |
| 4+ Person Household | 23,484 (74.3%) | 8,139 (25.7%) |
| Total Housing Units | 116,882 (70.4%) | 49,178 (29.6%) |
Occupancy by Educational Attainment in Genesee County
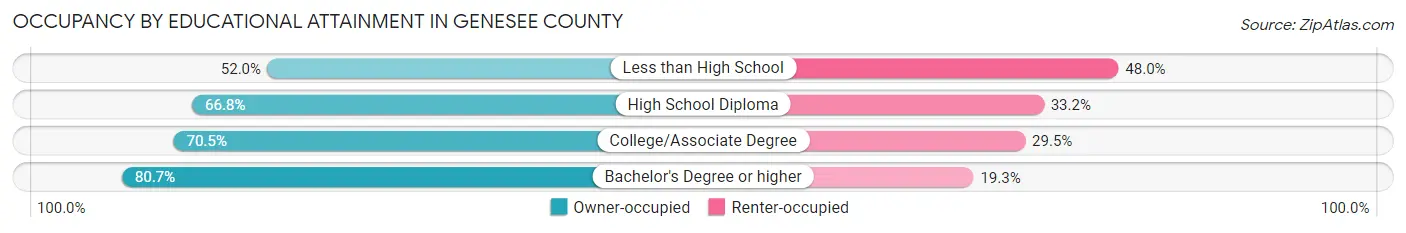
| Household Size | Owner-occupied | Renter-occupied |
| Less than High School | 7,144 (52.0%) | 6,602 (48.0%) |
| High School Diploma | 31,907 (66.8%) | 15,870 (33.2%) |
| College/Associate Degree | 44,954 (70.5%) | 18,850 (29.5%) |
| Bachelor's Degree or higher | 32,877 (80.7%) | 7,856 (19.3%) |
Occupancy by Age of Householder in Genesee County
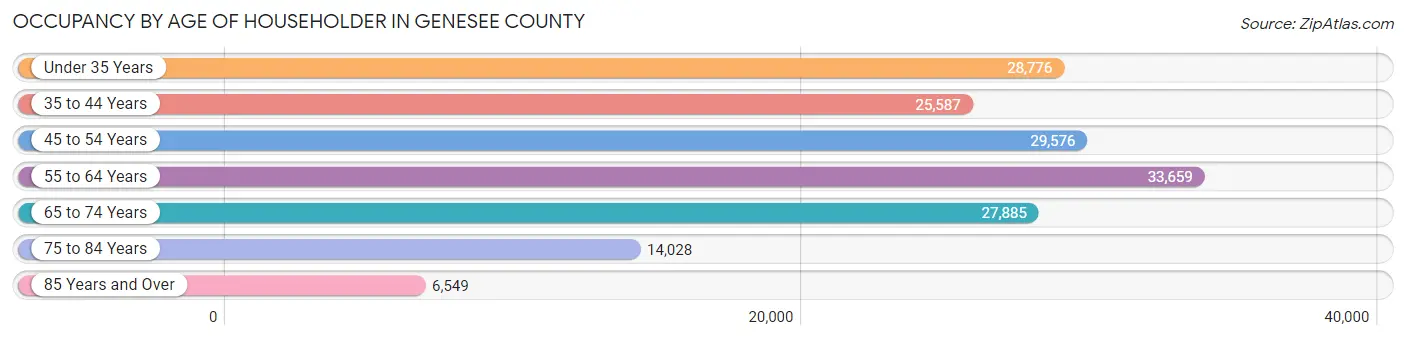
| Age Bracket | # Households | % Households |
| Under 35 Years | 28,776 | 17.3% |
| 35 to 44 Years | 25,587 | 15.4% |
| 45 to 54 Years | 29,576 | 17.8% |
| 55 to 64 Years | 33,659 | 20.3% |
| 65 to 74 Years | 27,885 | 16.8% |
| 75 to 84 Years | 14,028 | 8.5% |
| 85 Years and Over | 6,549 | 3.9% |
| Total | 166,060 | 100.0% |
Housing Finances in Genesee County
Median Income by Occupancy in Genesee County
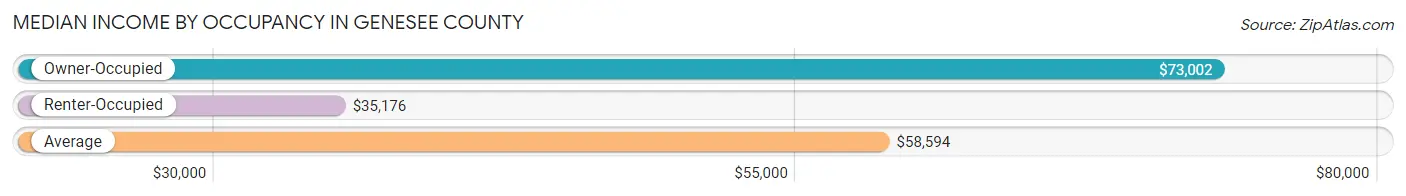
| Occupancy Type | # Households | Median Income |
| Owner-Occupied | 116,882 (70.4%) | $73,002 |
| Renter-Occupied | 49,178 (29.6%) | $35,176 |
| Average | 166,060 (100.0%) | $58,594 |
Occupancy by Householder Income Bracket in Genesee County
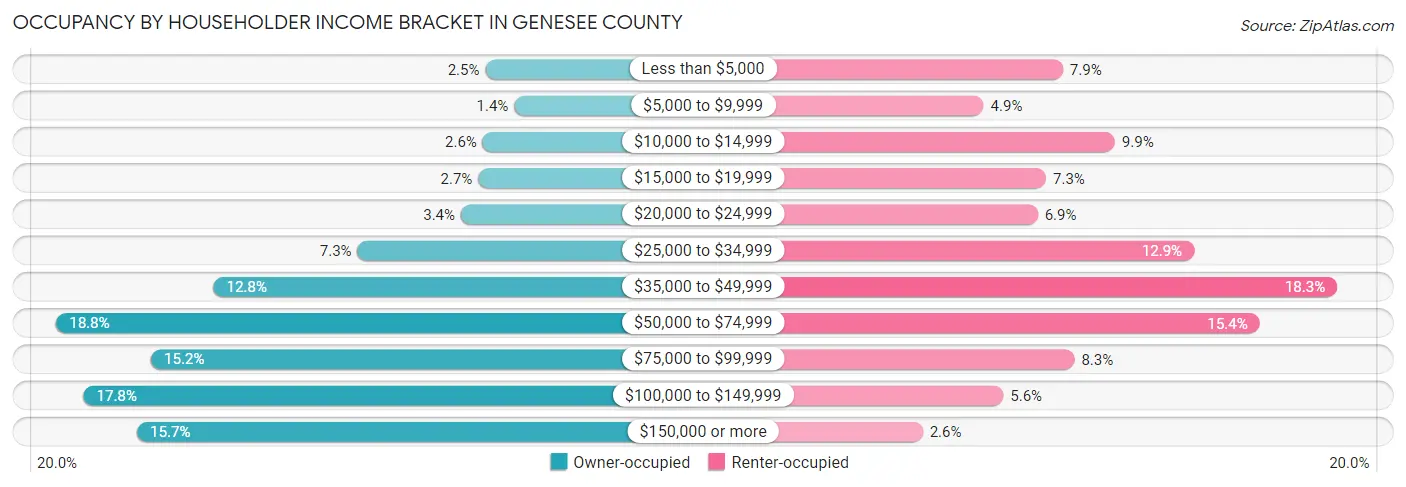
| Income Bracket | Owner-occupied | Renter-occupied |
| Less than $5,000 | 2,863 (2.5%) | 3,887 (7.9%) |
| $5,000 to $9,999 | 1,576 (1.3%) | 2,399 (4.9%) |
| $10,000 to $14,999 | 2,983 (2.5%) | 4,857 (9.9%) |
| $15,000 to $19,999 | 3,174 (2.7%) | 3,568 (7.3%) |
| $20,000 to $24,999 | 3,956 (3.4%) | 3,412 (6.9%) |
| $25,000 to $34,999 | 8,550 (7.3%) | 6,337 (12.9%) |
| $35,000 to $49,999 | 14,966 (12.8%) | 9,021 (18.3%) |
| $50,000 to $74,999 | 21,962 (18.8%) | 7,567 (15.4%) |
| $75,000 to $99,999 | 17,746 (15.2%) | 4,103 (8.3%) |
| $100,000 to $149,999 | 20,742 (17.7%) | 2,769 (5.6%) |
| $150,000 or more | 18,364 (15.7%) | 1,258 (2.6%) |
| Total | 116,882 (100.0%) | 49,178 (100.0%) |
Monthly Housing Cost Tiers in Genesee County
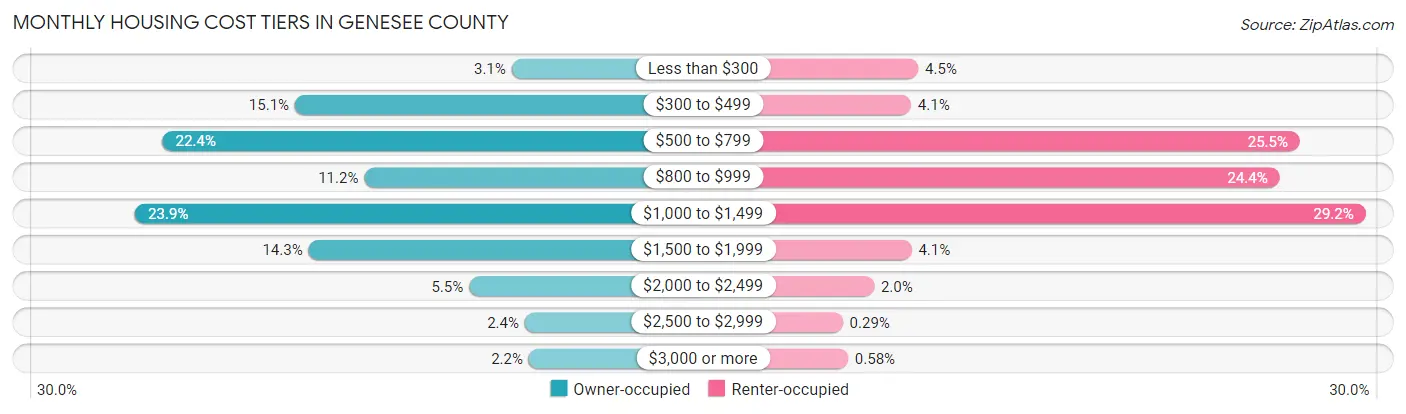
| Monthly Cost | Owner-occupied | Renter-occupied |
| Less than $300 | 3,623 (3.1%) | 2,191 (4.5%) |
| $300 to $499 | 17,614 (15.1%) | 1,996 (4.1%) |
| $500 to $799 | 26,161 (22.4%) | 12,560 (25.5%) |
| $800 to $999 | 13,143 (11.2%) | 12,009 (24.4%) |
| $1,000 to $1,499 | 27,940 (23.9%) | 14,344 (29.2%) |
| $1,500 to $1,999 | 16,743 (14.3%) | 2,012 (4.1%) |
| $2,000 to $2,499 | 6,375 (5.4%) | 994 (2.0%) |
| $2,500 to $2,999 | 2,770 (2.4%) | 141 (0.3%) |
| $3,000 or more | 2,513 (2.1%) | 287 (0.6%) |
| Total | 116,882 (100.0%) | 49,178 (100.0%) |
Physical Housing Characteristics in Genesee County
Housing Structures in Genesee County
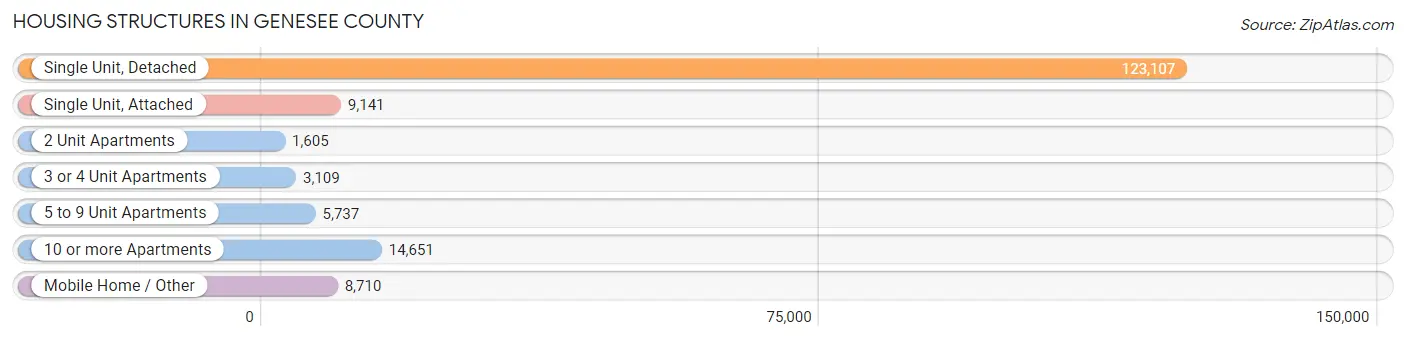
| Structure Type | # Housing Units | % Housing Units |
| Single Unit, Detached | 123,107 | 74.1% |
| Single Unit, Attached | 9,141 | 5.5% |
| 2 Unit Apartments | 1,605 | 1.0% |
| 3 or 4 Unit Apartments | 3,109 | 1.9% |
| 5 to 9 Unit Apartments | 5,737 | 3.5% |
| 10 or more Apartments | 14,651 | 8.8% |
| Mobile Home / Other | 8,710 | 5.2% |
| Total | 166,060 | 100.0% |
Housing Structures by Occupancy in Genesee County
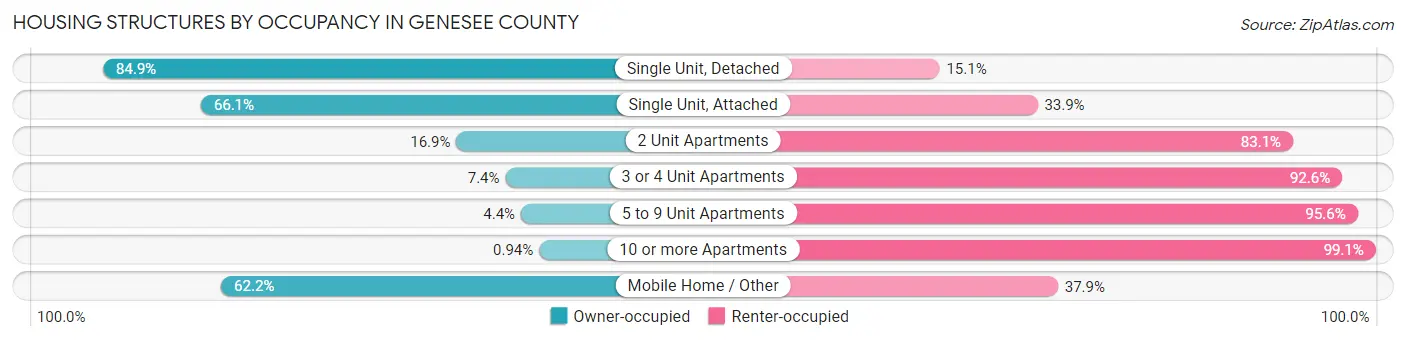
| Structure Type | Owner-occupied | Renter-occupied |
| Single Unit, Detached | 104,537 (84.9%) | 18,570 (15.1%) |
| Single Unit, Attached | 6,039 (66.1%) | 3,102 (33.9%) |
| 2 Unit Apartments | 271 (16.9%) | 1,334 (83.1%) |
| 3 or 4 Unit Apartments | 231 (7.4%) | 2,878 (92.6%) |
| 5 to 9 Unit Apartments | 254 (4.4%) | 5,483 (95.6%) |
| 10 or more Apartments | 137 (0.9%) | 14,514 (99.1%) |
| Mobile Home / Other | 5,413 (62.2%) | 3,297 (37.9%) |
| Total | 116,882 (70.4%) | 49,178 (29.6%) |
Housing Structures by Number of Rooms in Genesee County
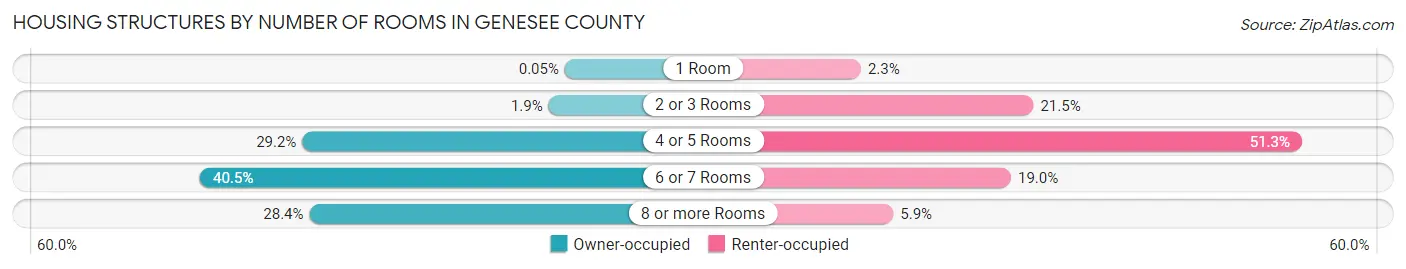
| Number of Rooms | Owner-occupied | Renter-occupied |
| 1 Room | 54 (0.1%) | 1,151 (2.3%) |
| 2 or 3 Rooms | 2,166 (1.8%) | 10,562 (21.5%) |
| 4 or 5 Rooms | 34,115 (29.2%) | 25,208 (51.3%) |
| 6 or 7 Rooms | 47,357 (40.5%) | 9,339 (19.0%) |
| 8 or more Rooms | 33,190 (28.4%) | 2,918 (5.9%) |
| Total | 116,882 (100.0%) | 49,178 (100.0%) |
Housing Structure by Heating Type in Genesee County
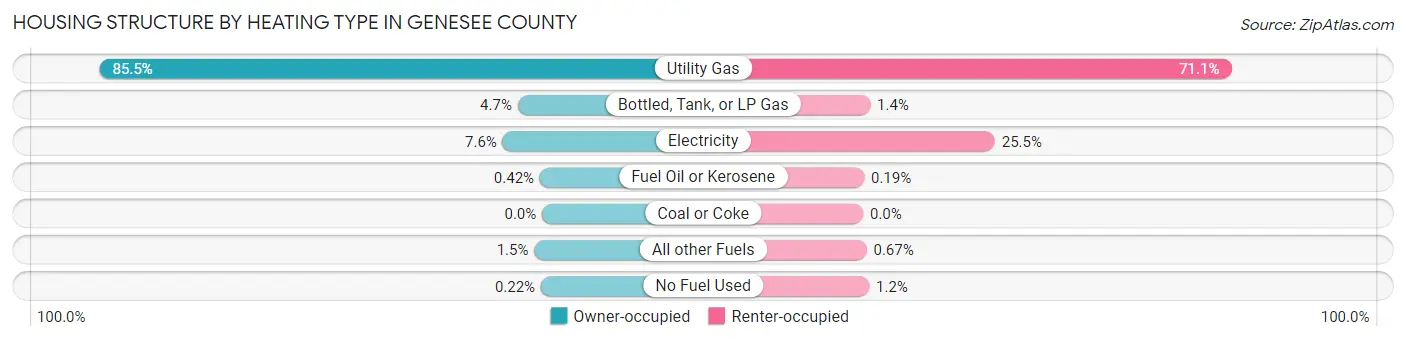
| Heating Type | Owner-occupied | Renter-occupied |
| Utility Gas | 99,969 (85.5%) | 34,984 (71.1%) |
| Bottled, Tank, or LP Gas | 5,503 (4.7%) | 675 (1.4%) |
| Electricity | 8,910 (7.6%) | 12,519 (25.5%) |
| Fuel Oil or Kerosene | 490 (0.4%) | 95 (0.2%) |
| Coal or Coke | 0 (0.0%) | 0 (0.0%) |
| All other Fuels | 1,752 (1.5%) | 331 (0.7%) |
| No Fuel Used | 258 (0.2%) | 574 (1.2%) |
| Total | 116,882 (100.0%) | 49,178 (100.0%) |
Household Vehicle Usage in Genesee County
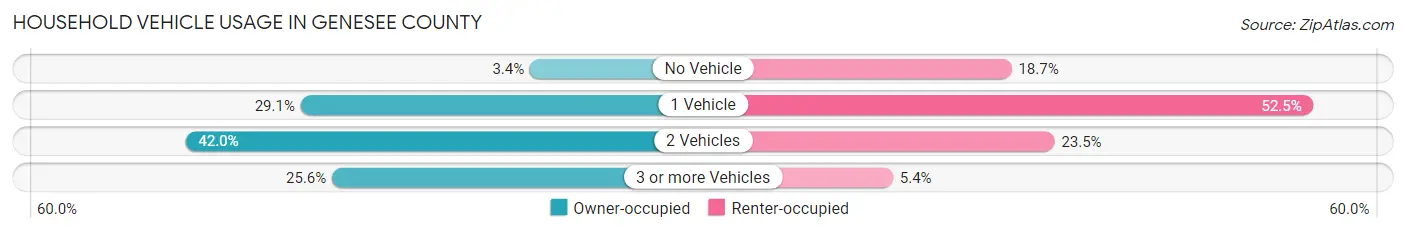
| Vehicles per Household | Owner-occupied | Renter-occupied |
| No Vehicle | 3,951 (3.4%) | 9,179 (18.7%) |
| 1 Vehicle | 33,981 (29.1%) | 25,814 (52.5%) |
| 2 Vehicles | 49,082 (42.0%) | 11,542 (23.5%) |
| 3 or more Vehicles | 29,868 (25.6%) | 2,643 (5.4%) |
| Total | 116,882 (100.0%) | 49,178 (100.0%) |
Real Estate & Mortgages in Genesee County
Real Estate and Mortgage Overview in Genesee County
| Characteristic | Without Mortgage | With Mortgage |
| Housing Units | 49,510 | 67,372 |
| Median Property Value | $115,800 | $178,400 |
| Median Household Income | $54,651 | $13,615 |
| Monthly Housing Costs | $549 | $2,403 |
| Real Estate Taxes | $1,919 | $2,401 |
Property Value by Mortgage Status in Genesee County
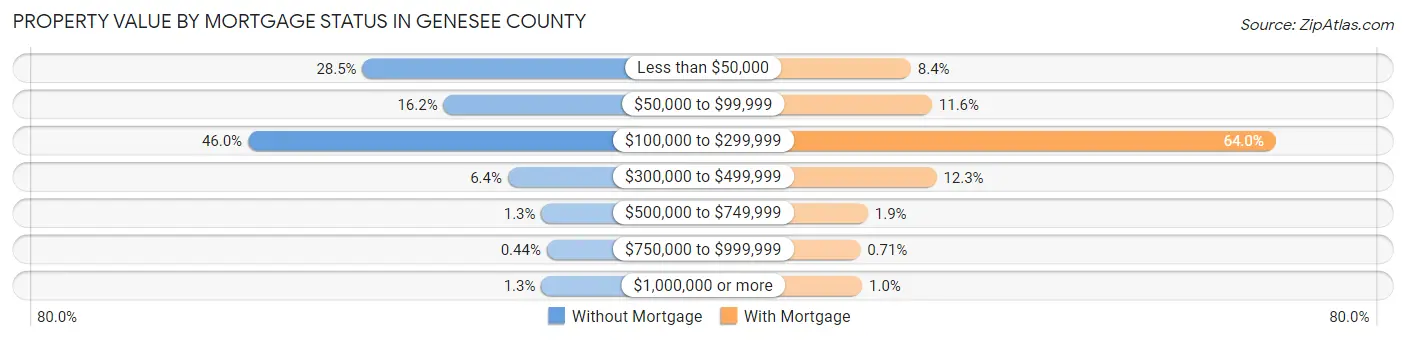
| Property Value | Without Mortgage | With Mortgage |
| Less than $50,000 | 14,119 (28.5%) | 5,678 (8.4%) |
| $50,000 to $99,999 | 8,008 (16.2%) | 7,838 (11.6%) |
| $100,000 to $299,999 | 22,761 (46.0%) | 43,140 (64.0%) |
| $300,000 to $499,999 | 3,154 (6.4%) | 8,309 (12.3%) |
| $500,000 to $749,999 | 620 (1.3%) | 1,257 (1.9%) |
| $750,000 to $999,999 | 217 (0.4%) | 476 (0.7%) |
| $1,000,000 or more | 631 (1.3%) | 674 (1.0%) |
| Total | 49,510 (100.0%) | 67,372 (100.0%) |
Household Income by Mortgage Status in Genesee County
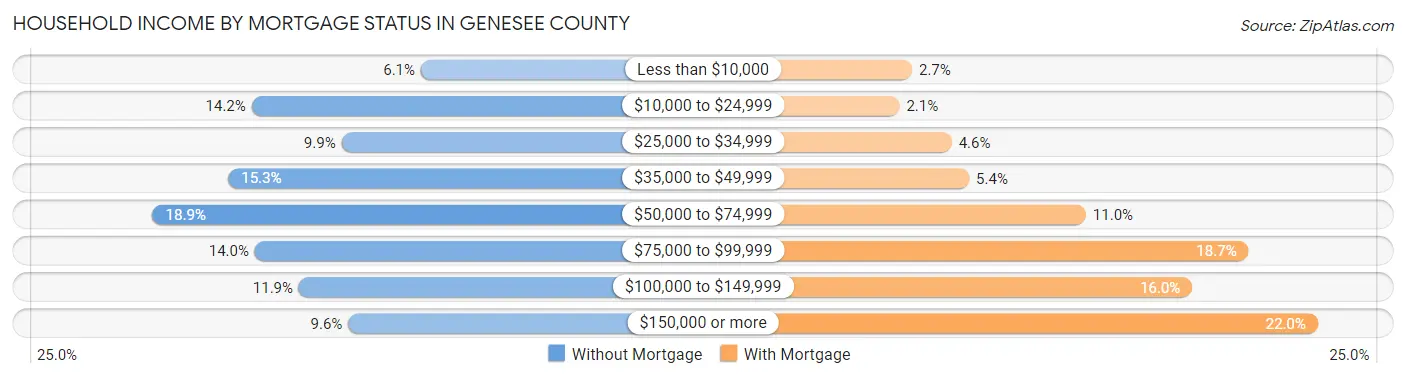
| Household Income | Without Mortgage | With Mortgage |
| Less than $10,000 | 3,034 (6.1%) | 1,811 (2.7%) |
| $10,000 to $24,999 | 7,027 (14.2%) | 1,405 (2.1%) |
| $25,000 to $34,999 | 4,905 (9.9%) | 3,086 (4.6%) |
| $35,000 to $49,999 | 7,575 (15.3%) | 3,645 (5.4%) |
| $50,000 to $74,999 | 9,358 (18.9%) | 7,391 (11.0%) |
| $75,000 to $99,999 | 6,949 (14.0%) | 12,604 (18.7%) |
| $100,000 to $149,999 | 5,913 (11.9%) | 10,797 (16.0%) |
| $150,000 or more | 4,749 (9.6%) | 14,829 (22.0%) |
| Total | 49,510 (100.0%) | 67,372 (100.0%) |
Property Value to Household Income Ratio in Genesee County
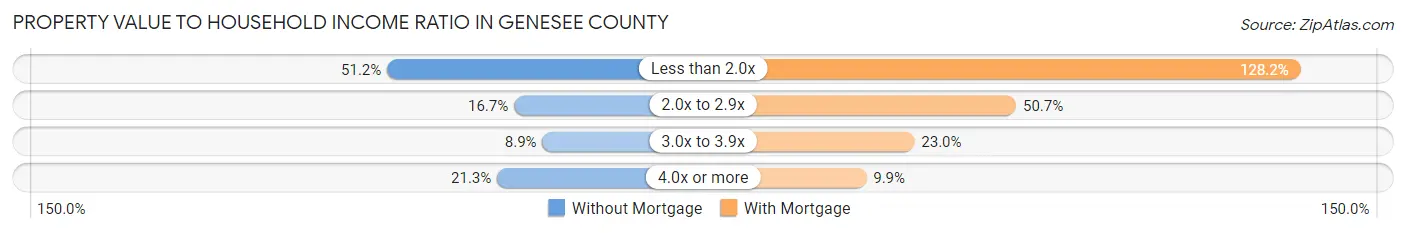
| Value-to-Income Ratio | Without Mortgage | With Mortgage |
| Less than 2.0x | 25,370 (51.2%) | 86,388 (128.2%) |
| 2.0x to 2.9x | 8,247 (16.7%) | 34,162 (50.7%) |
| 3.0x to 3.9x | 4,423 (8.9%) | 15,504 (23.0%) |
| 4.0x or more | 10,538 (21.3%) | 6,668 (9.9%) |
| Total | 49,510 (100.0%) | 67,372 (100.0%) |
Real Estate Taxes by Mortgage Status in Genesee County
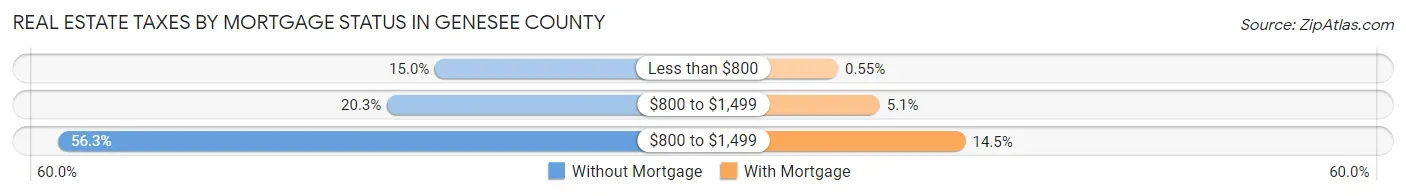
| Property Taxes | Without Mortgage | With Mortgage |
| Less than $800 | 7,431 (15.0%) | 370 (0.5%) |
| $800 to $1,499 | 10,038 (20.3%) | 3,449 (5.1%) |
| $800 to $1,499 | 27,889 (56.3%) | 9,784 (14.5%) |
| Total | 49,510 (100.0%) | 67,372 (100.0%) |
Health & Disability in Genesee County
Health Insurance Coverage by Age in Genesee County
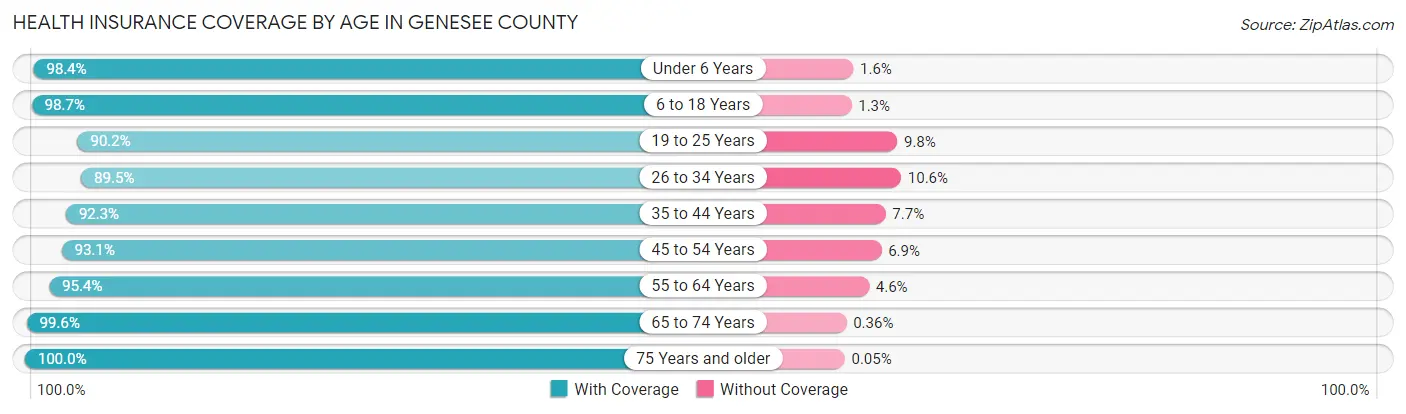
| Age Bracket | With Coverage | Without Coverage |
| Under 6 Years | 27,166 (98.4%) | 453 (1.6%) |
| 6 to 18 Years | 66,896 (98.7%) | 884 (1.3%) |
| 19 to 25 Years | 31,462 (90.2%) | 3,434 (9.8%) |
| 26 to 34 Years | 40,428 (89.4%) | 4,766 (10.5%) |
| 35 to 44 Years | 43,333 (92.3%) | 3,600 (7.7%) |
| 45 to 54 Years | 48,065 (93.1%) | 3,559 (6.9%) |
| 55 to 64 Years | 54,488 (95.4%) | 2,618 (4.6%) |
| 65 to 74 Years | 42,853 (99.6%) | 153 (0.4%) |
| 75 Years and older | 28,853 (100.0%) | 14 (0.1%) |
| Total | 383,544 (95.2%) | 19,481 (4.8%) |
Health Insurance Coverage by Citizenship Status in Genesee County
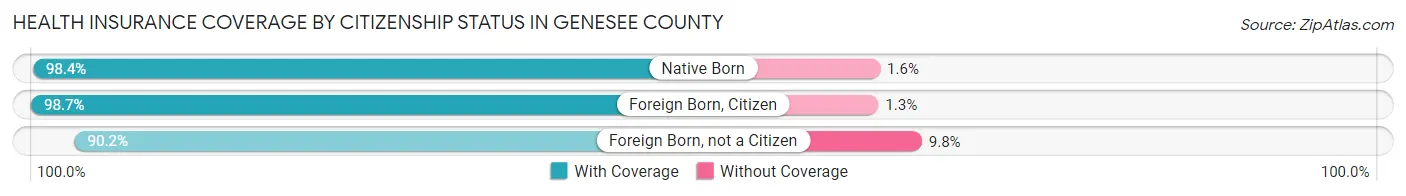
| Citizenship Status | With Coverage | Without Coverage |
| Native Born | 27,166 (98.4%) | 453 (1.6%) |
| Foreign Born, Citizen | 66,896 (98.7%) | 884 (1.3%) |
| Foreign Born, not a Citizen | 31,462 (90.2%) | 3,434 (9.8%) |
Health Insurance Coverage by Household Income in Genesee County
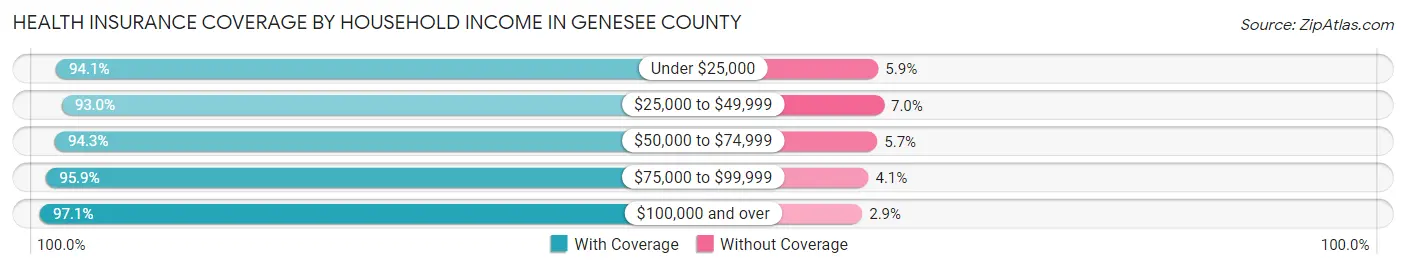
| Household Income | With Coverage | Without Coverage |
| Under $25,000 | 55,509 (94.1%) | 3,491 (5.9%) |
| $25,000 to $49,999 | 73,917 (93.0%) | 5,543 (7.0%) |
| $50,000 to $74,999 | 67,188 (94.3%) | 4,077 (5.7%) |
| $75,000 to $99,999 | 56,521 (95.9%) | 2,397 (4.1%) |
| $100,000 and over | 127,755 (97.1%) | 3,816 (2.9%) |
Public vs Private Health Insurance Coverage by Age in Genesee County
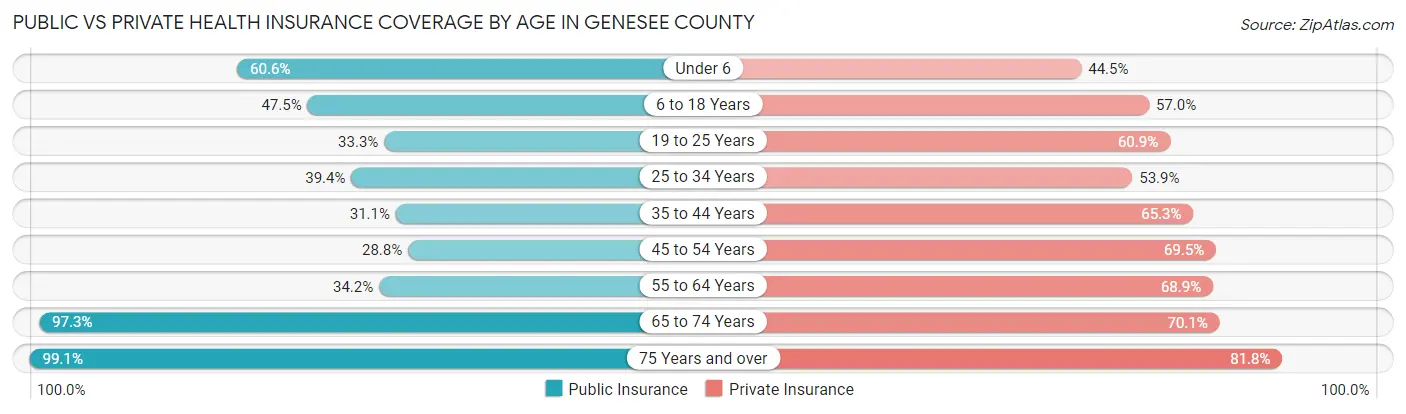
| Age Bracket | Public Insurance | Private Insurance |
| Under 6 | 16,724 (60.6%) | 12,280 (44.5%) |
| 6 to 18 Years | 32,191 (47.5%) | 38,649 (57.0%) |
| 19 to 25 Years | 11,608 (33.3%) | 21,255 (60.9%) |
| 25 to 34 Years | 17,788 (39.4%) | 24,369 (53.9%) |
| 35 to 44 Years | 14,597 (31.1%) | 30,622 (65.2%) |
| 45 to 54 Years | 14,882 (28.8%) | 35,869 (69.5%) |
| 55 to 64 Years | 19,536 (34.2%) | 39,341 (68.9%) |
| 65 to 74 Years | 41,844 (97.3%) | 30,159 (70.1%) |
| 75 Years and over | 28,602 (99.1%) | 23,603 (81.8%) |
| Total | 197,772 (49.1%) | 256,147 (63.6%) |
Disability Status by Sex by Age in Genesee County
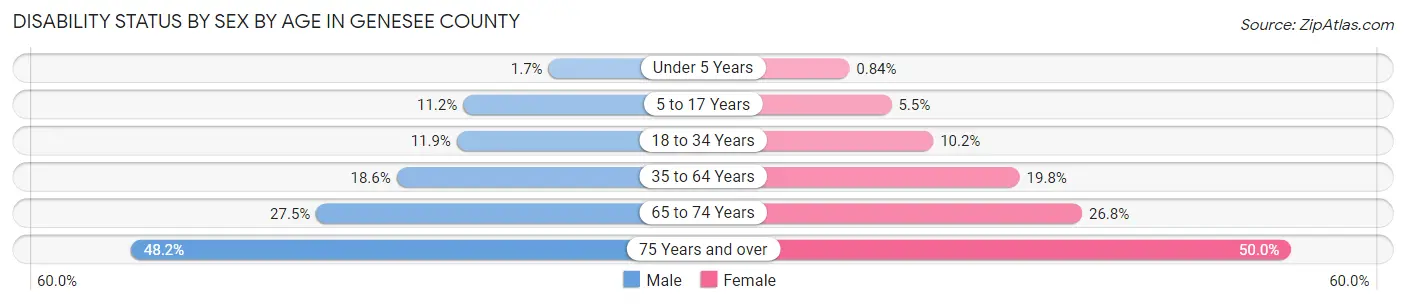
| Age Bracket | Male | Female |
| Under 5 Years | 193 (1.7%) | 96 (0.8%) |
| 5 to 17 Years | 3,860 (11.2%) | 1,808 (5.5%) |
| 18 to 34 Years | 5,045 (11.9%) | 4,357 (10.2%) |
| 35 to 64 Years | 13,959 (18.6%) | 15,952 (19.8%) |
| 65 to 74 Years | 5,461 (27.5%) | 6,201 (26.8%) |
| 75 Years and over | 5,691 (48.2%) | 8,532 (50.0%) |
Disability Class by Sex by Age in Genesee County
Disability Class: Hearing Difficulty
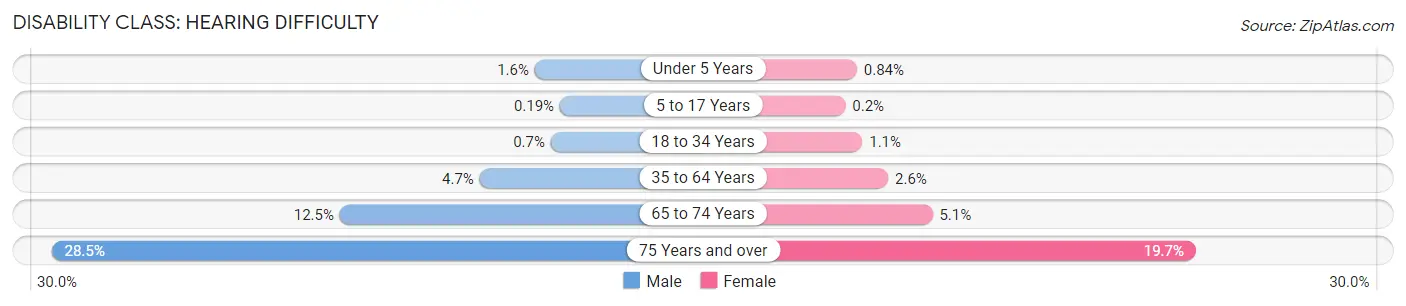
| Age Bracket | Male | Female |
| Under 5 Years | 184 (1.6%) | 96 (0.8%) |
| 5 to 17 Years | 64 (0.2%) | 66 (0.2%) |
| 18 to 34 Years | 296 (0.7%) | 489 (1.1%) |
| 35 to 64 Years | 3,500 (4.7%) | 2,076 (2.6%) |
| 65 to 74 Years | 2,469 (12.4%) | 1,171 (5.1%) |
| 75 Years and over | 3,368 (28.5%) | 3,361 (19.7%) |
Disability Class: Vision Difficulty
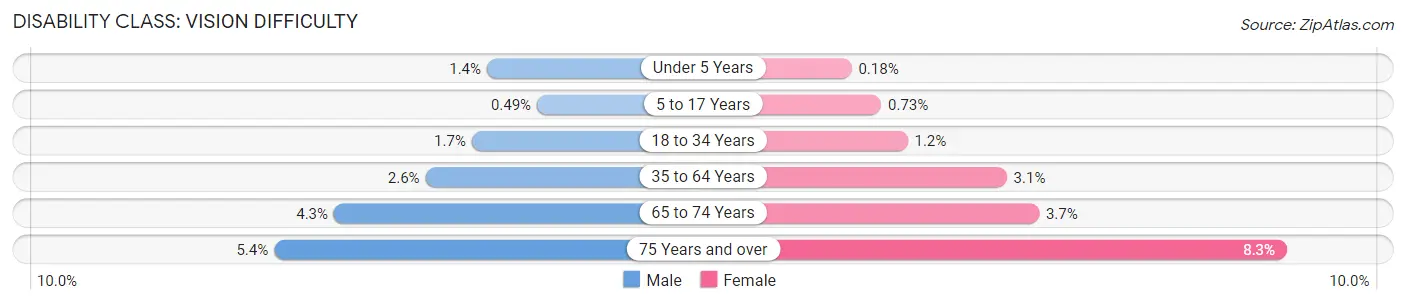
| Age Bracket | Male | Female |
| Under 5 Years | 165 (1.4%) | 21 (0.2%) |
| 5 to 17 Years | 170 (0.5%) | 237 (0.7%) |
| 18 to 34 Years | 722 (1.7%) | 524 (1.2%) |
| 35 to 64 Years | 1,924 (2.6%) | 2,461 (3.1%) |
| 65 to 74 Years | 845 (4.3%) | 847 (3.7%) |
| 75 Years and over | 635 (5.4%) | 1,409 (8.3%) |
Disability Class: Cognitive Difficulty
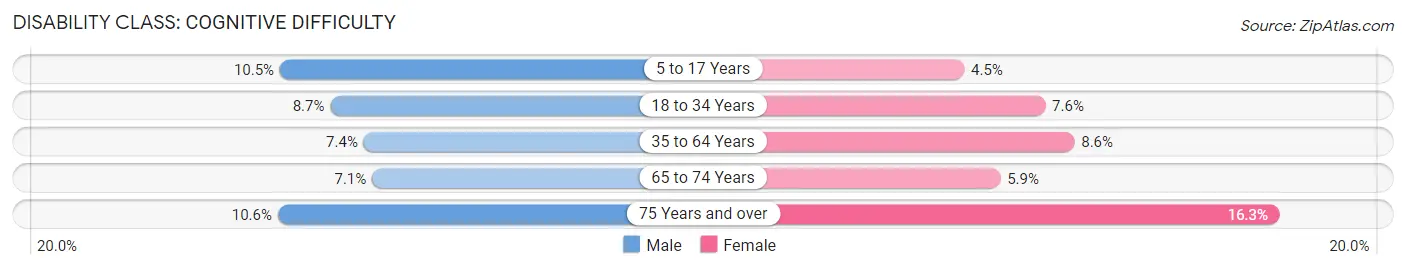
| Age Bracket | Male | Female |
| 5 to 17 Years | 3,636 (10.5%) | 1,482 (4.5%) |
| 18 to 34 Years | 3,674 (8.6%) | 3,231 (7.5%) |
| 35 to 64 Years | 5,566 (7.4%) | 6,951 (8.6%) |
| 65 to 74 Years | 1,409 (7.1%) | 1,363 (5.9%) |
| 75 Years and over | 1,253 (10.6%) | 2,772 (16.3%) |
Disability Class: Ambulatory Difficulty
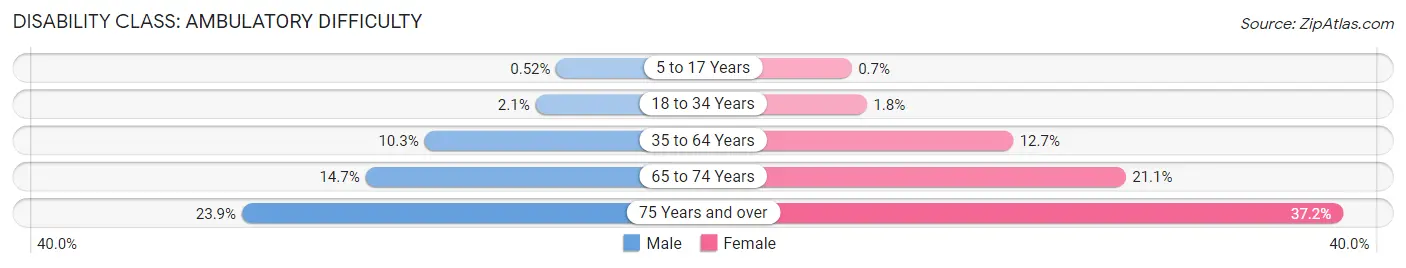
| Age Bracket | Male | Female |
| 5 to 17 Years | 179 (0.5%) | 230 (0.7%) |
| 18 to 34 Years | 881 (2.1%) | 782 (1.8%) |
| 35 to 64 Years | 7,745 (10.3%) | 10,221 (12.7%) |
| 65 to 74 Years | 2,915 (14.7%) | 4,878 (21.0%) |
| 75 Years and over | 2,820 (23.9%) | 6,344 (37.2%) |
Disability Class: Self-Care Difficulty
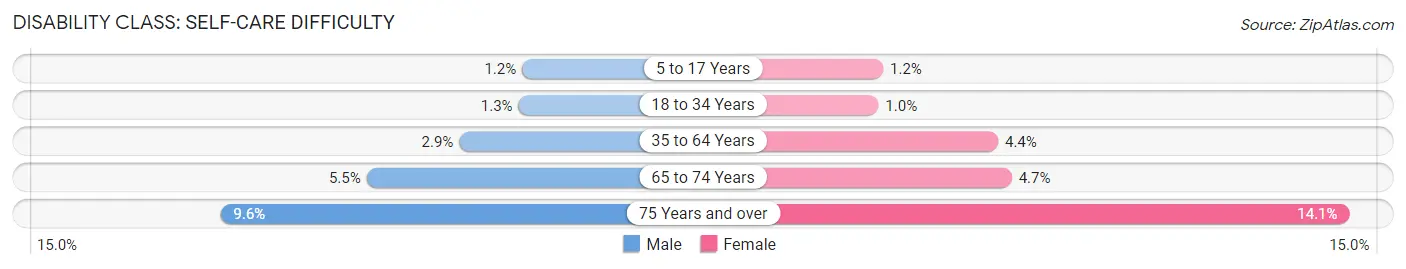
| Age Bracket | Male | Female |
| 5 to 17 Years | 397 (1.1%) | 377 (1.1%) |
| 18 to 34 Years | 533 (1.3%) | 436 (1.0%) |
| 35 to 64 Years | 2,176 (2.9%) | 3,506 (4.3%) |
| 65 to 74 Years | 1,088 (5.5%) | 1,096 (4.7%) |
| 75 Years and over | 1,129 (9.6%) | 2,409 (14.1%) |
Technology Access in Genesee County
Computing Device Access in Genesee County
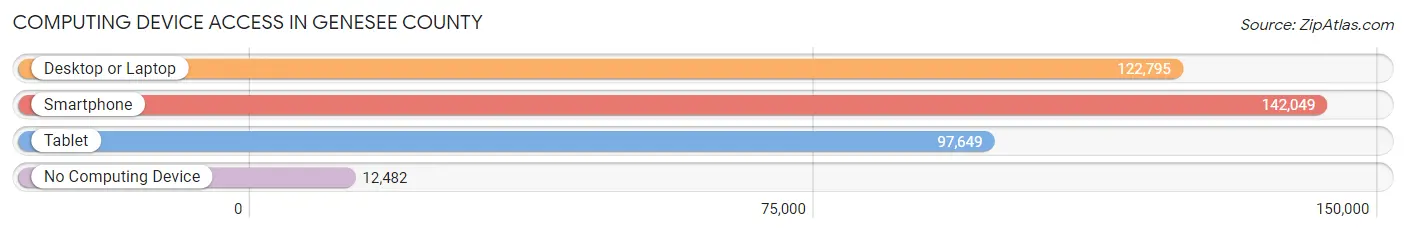
| Device Type | # Households | % Households |
| Desktop or Laptop | 122,795 | 74.0% |
| Smartphone | 142,049 | 85.5% |
| Tablet | 97,649 | 58.8% |
| No Computing Device | 12,482 | 7.5% |
| Total | 166,060 | 100.0% |
Internet Access in Genesee County
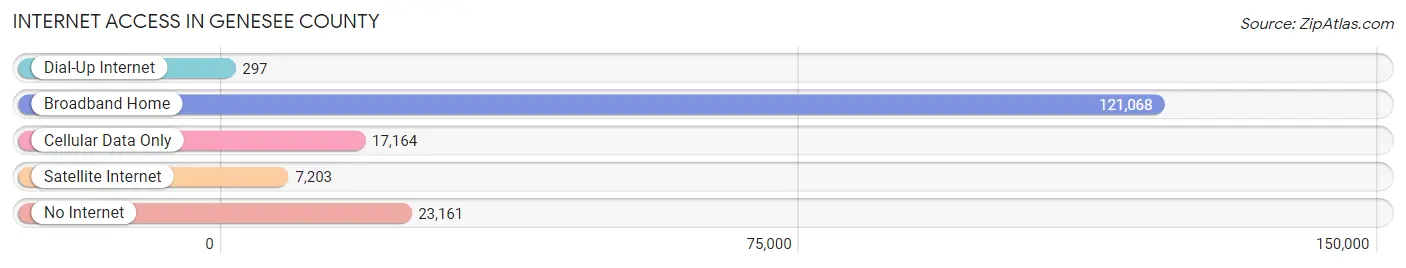
| Internet Type | # Households | % Households |
| Dial-Up Internet | 297 | 0.2% |
| Broadband Home | 121,068 | 72.9% |
| Cellular Data Only | 17,164 | 10.3% |
| Satellite Internet | 7,203 | 4.3% |
| No Internet | 23,161 | 14.0% |
| Total | 166,060 | 100.0% |
Genesee County Summary
Genesee County, Michigan is located in the southeastern part of the state and is part of the Flint/Tri-Cities region. It is bordered by Saginaw County to the north, Shiawassee County to the west, Oakland County to the south, and Lapeer County to the east. The county seat is Flint, and the largest city is Flint. Genesee County is home to a population of 425,790 people, making it the fifth most populous county in Michigan.
Geography
Genesee County covers an area of 664 square miles and is located in the Flint/Tri-Cities region of Michigan. The county is bordered by Saginaw County to the north, Shiawassee County to the west, Oakland County to the south, and Lapeer County to the east. The terrain of the county is mostly flat, with some rolling hills in the northern and western parts of the county. The county is home to several rivers, including the Flint River, the Shiawassee River, and the Cass River. The county also contains several lakes, including Mott Lake, Holloway Reservoir, and Lake Fenton.
History
Genesee County was established in 1835 and was named after Genesee County, New York. The county was originally part of Saginaw County, but was split off in 1836. The county was initially populated by Native Americans, but was later settled by European immigrants. The county was home to several industries, including lumber, agriculture, and manufacturing. The city of Flint was founded in 1819 and quickly became the county seat.
Economy
Genesee County has a diverse economy, with a variety of industries. The county is home to several major employers, including General Motors, McLaren Health Care, and Hurley Medical Center. The county is also home to several educational institutions, including the University of Michigan-Flint, Mott Community College, and Baker College. The county is also home to several tourist attractions, including the Flint Institute of Arts, the Flint Children’s Museum, and the Crossroads Village and Huckleberry Railroad.
Demographics
As of the 2010 census, Genesee County had a population of 425,790 people. The racial makeup of the county was 79.2% White, 14.3% African American, 0.7% Native American, 1.7% Asian, 0.1% Pacific Islander, 1.3% from other races, and 2.9% from two or more races. Hispanic or Latino of any race were 4.2% of the population.
The median income for a household in the county was $45,945, and the median income for a family was $54,817. The per capita income for the county was $22,845. About 16.2% of the population was below the poverty line.
Genesee County is a diverse and vibrant county with a rich history and a strong economy. The county is home to a variety of industries, educational institutions, and tourist attractions. The county is also home to a diverse population, with a variety of racial and ethnic backgrounds. Genesee County is an important part of the Flint/Tri-Cities region and is an important part of Michigan.
Common Questions
What is the Total Population of Genesee County?
Total Population of Genesee County is 405,280.
What is the Total Male Population of Genesee County?
Total Male Population of Genesee County is 196,717.
What is the Total Female Population of Genesee County?
Total Female Population of Genesee County is 208,563.
What is the Ratio of Males per 100 Females in Genesee County?
There are 94.32 Males per 100 Females in Genesee County.
What is the Ratio of Females per 100 Males in Genesee County?
There are 106.02 Females per 100 Males in Genesee County.
What is the Median Population Age in Genesee County?
Median Population Age in Genesee County is 40.5 Years.
What is the Average Family Size in Genesee County
Average Family Size in Genesee County is 3.0 People.
What is the Average Household Size in Genesee County
Average Household Size in Genesee County is 2.4 People.
What is Per Capita Income in Genesee County?
Per Capita income in Genesee County is $33,562.
What is the Median Family Income in Genesee County?
Median Family Income in Genesee County is $75,461.
What is the Median Household income in Genesee County?
Median Household Income in Genesee County is $58,594.
What is Income or Wage Gap in Genesee County?
Income or Wage Gap in Genesee County is 33.3%.
Women in Genesee County earn 66.7 cents for every dollar earned by a man.
What is Family Income Deficit in Genesee County?
Family Income Deficit in Genesee County is $11,196.
Families that are below poverty line in Genesee County earn $11,196 less on average than the poverty threshold level.
What is Inequality or Gini Index in Genesee County?
Inequality or Gini Index in Genesee County is 0.47.
How Large is the Labor Force in Genesee County?
There are 189,641 People in the Labor Forcein in Genesee County.
What is the Percentage of People in the Labor Force in Genesee County?
58.2% of People are in the Labor Force in Genesee County.
What is the Unemployment Rate in Genesee County?
Unemployment Rate in Genesee County is 8.5%.