Dickinson County, MI
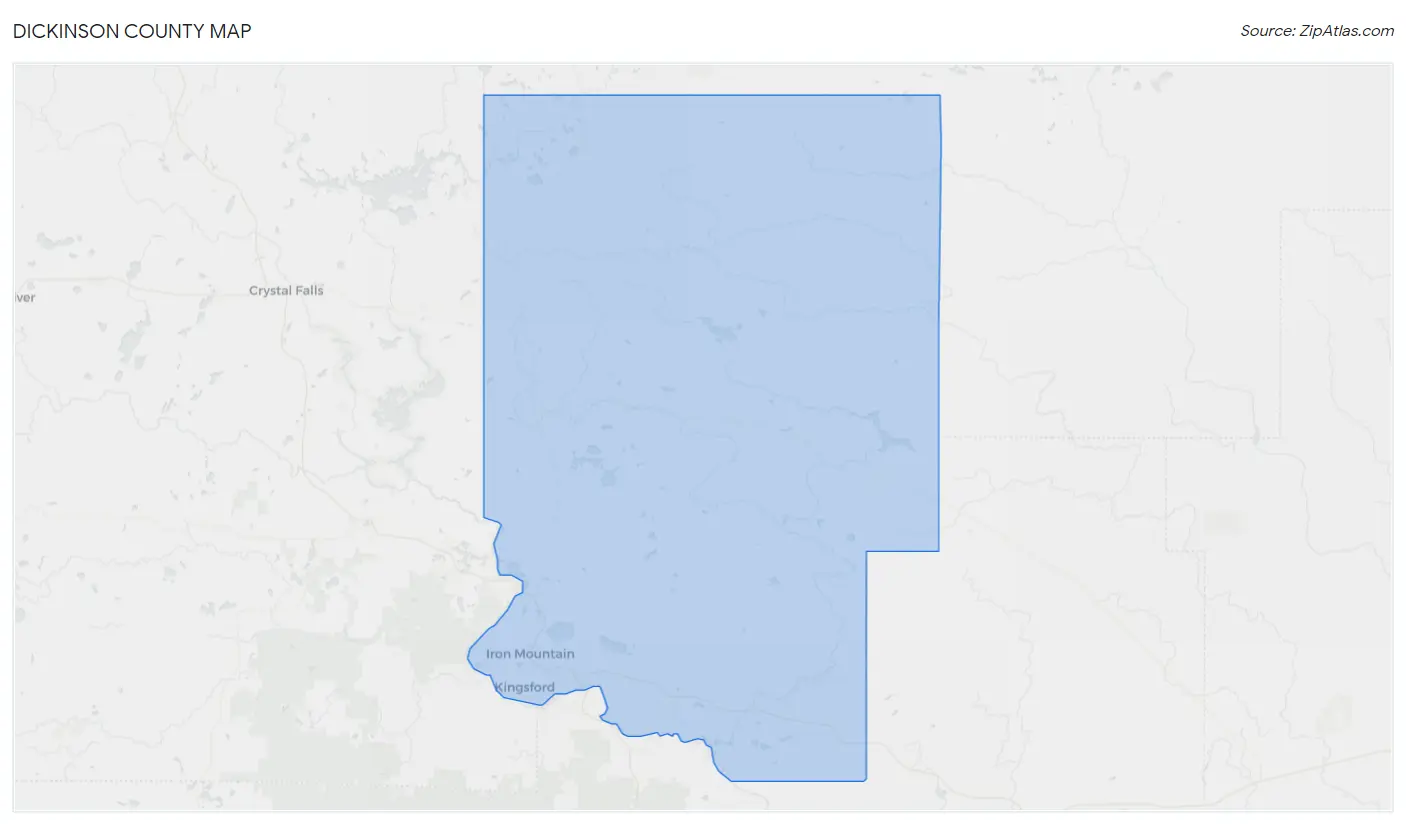
Dickinson County Map
Dickinson County Overview
25,937
TOTAL POPULATION
13,219
MALE POPULATION
12,718
FEMALE POPULATION
103.94
MALES / 100 FEMALES
96.21
FEMALES / 100 MALES
47.2
MEDIAN AGE
2.7
AVG FAMILY SIZE
2.2
AVG HOUSEHOLD SIZE
$35,722
PER CAPITA INCOME
$75,121
AVG FAMILY INCOME
$59,651
AVG HOUSEHOLD INCOME
39.9%
WAGE / INCOME GAP [ % ]
60.1¢/ $1
WAGE / INCOME GAP [ $ ]
$7,418
FAMILY INCOME DEFICIT
0.43
INEQUALITY / GINI INDEX
12,349
LABOR FORCE [ PEOPLE ]
57.4%
PERCENT IN LABOR FORCE
3.8%
UNEMPLOYMENT RATE
Dickinson County Area Codes
Race in Dickinson County
The most populous races in Dickinson County are White / Caucasian (24,382 | 94.0%), Two or more Races (927 | 3.6%), and Hispanic or Latino (464 | 1.8%).
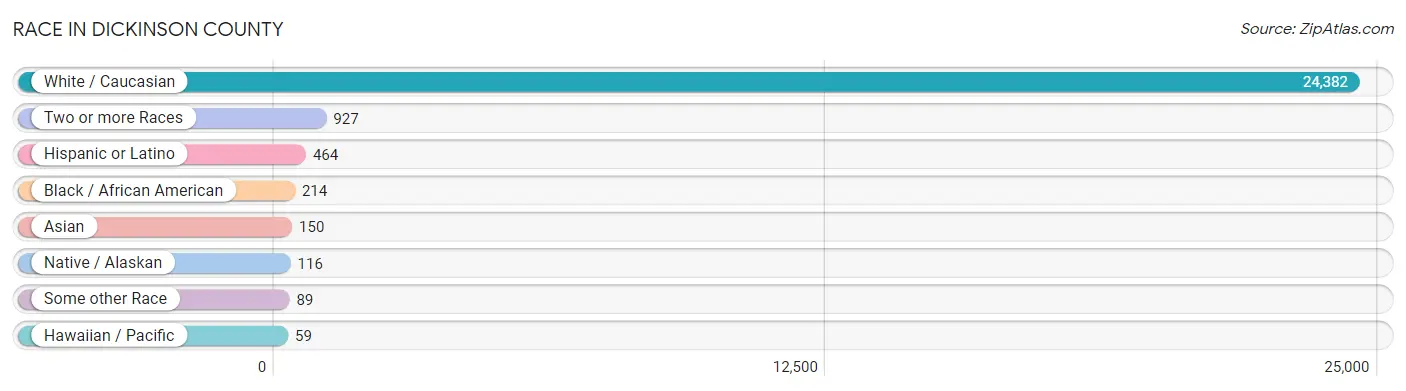
| Race | # Population | % Population |
| Asian | 150 | 0.6% |
| Black / African American | 214 | 0.8% |
| Hawaiian / Pacific | 59 | 0.2% |
| Hispanic or Latino | 464 | 1.8% |
| Native / Alaskan | 116 | 0.4% |
| White / Caucasian | 24,382 | 94.0% |
| Two or more Races | 927 | 3.6% |
| Some other Race | 89 | 0.3% |
| Total | 25,937 | 100.0% |
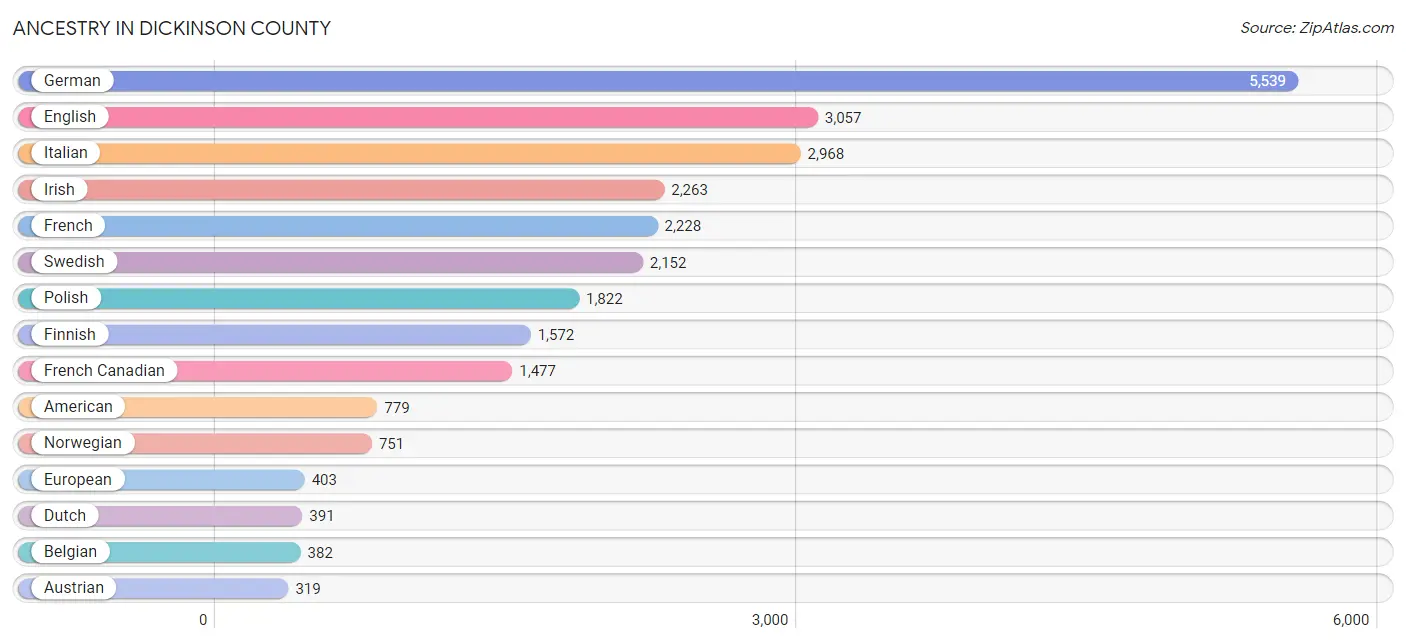
Ancestry in Dickinson County
The most populous ancestries reported in Dickinson County are German (5,539 | 21.4%), English (3,057 | 11.8%), Italian (2,968 | 11.4%), Irish (2,263 | 8.7%), and French (2,228 | 8.6%), together accounting for 61.9% of all Dickinson County residents.
| Ancestry | # Population | % Population |
| African | 10 | 0.0% |
| American | 779 | 3.0% |
| Arab | 132 | 0.5% |
| Austrian | 319 | 1.2% |
| Bangladeshi | 20 | 0.1% |
| Belgian | 382 | 1.5% |
| Bhutanese | 18 | 0.1% |
| Blackfeet | 23 | 0.1% |
| British | 46 | 0.2% |
| Bulgarian | 7 | 0.0% |
| Burmese | 10 | 0.0% |
| Canadian | 94 | 0.4% |
| Central American | 32 | 0.1% |
| Cherokee | 47 | 0.2% |
| Chilean | 11 | 0.0% |
| Chippewa | 171 | 0.7% |
| Costa Rican | 7 | 0.0% |
| Croatian | 122 | 0.5% |
| Czech | 92 | 0.4% |
| Czechoslovakian | 100 | 0.4% |
| Danish | 193 | 0.7% |
| Dutch | 391 | 1.5% |
| Eastern European | 110 | 0.4% |
| Ecuadorian | 29 | 0.1% |
| English | 3,057 | 11.8% |
| European | 403 | 1.5% |
| Finnish | 1,572 | 6.1% |
| French | 2,228 | 8.6% |
| French American Indian | 20 | 0.1% |
| French Canadian | 1,477 | 5.7% |
| German | 5,539 | 21.4% |
| Greek | 82 | 0.3% |
| Guatemalan | 16 | 0.1% |
| Honduran | 9 | 0.0% |
| Hungarian | 52 | 0.2% |
| Indian (Asian) | 93 | 0.4% |
| Irish | 2,263 | 8.7% |
| Italian | 2,968 | 11.4% |
| Jamaican | 36 | 0.1% |
| Korean | 119 | 0.5% |
| Lebanese | 132 | 0.5% |
| Lithuanian | 96 | 0.4% |
| Luxembourger | 19 | 0.1% |
| Mexican | 281 | 1.1% |
| Native Hawaiian | 59 | 0.2% |
| Northern European | 44 | 0.2% |
| Norwegian | 751 | 2.9% |
| Polish | 1,822 | 7.0% |
| Portuguese | 1 | 0.0% |
| Puerto Rican | 7 | 0.0% |
| Russian | 59 | 0.2% |
| Scandinavian | 157 | 0.6% |
| Scotch-Irish | 245 | 0.9% |
| Scottish | 224 | 0.9% |
| Slavic | 70 | 0.3% |
| Slovak | 28 | 0.1% |
| Slovene | 12 | 0.1% |
| South American | 50 | 0.2% |
| South American Indian | 29 | 0.1% |
| Spaniard | 68 | 0.3% |
| Spanish | 23 | 0.1% |
| Spanish American Indian | 6 | 0.0% |
| Subsaharan African | 10 | 0.0% |
| Swedish | 2,152 | 8.3% |
| Swiss | 284 | 1.1% |
| Thai | 33 | 0.1% |
| Trinidadian and Tobagonian | 6 | 0.0% |
| Ukrainian | 19 | 0.1% |
| Venezuelan | 10 | 0.0% |
| Welsh | 145 | 0.6% |
| Yugoslavian | 51 | 0.2% | View All 71 Rows |
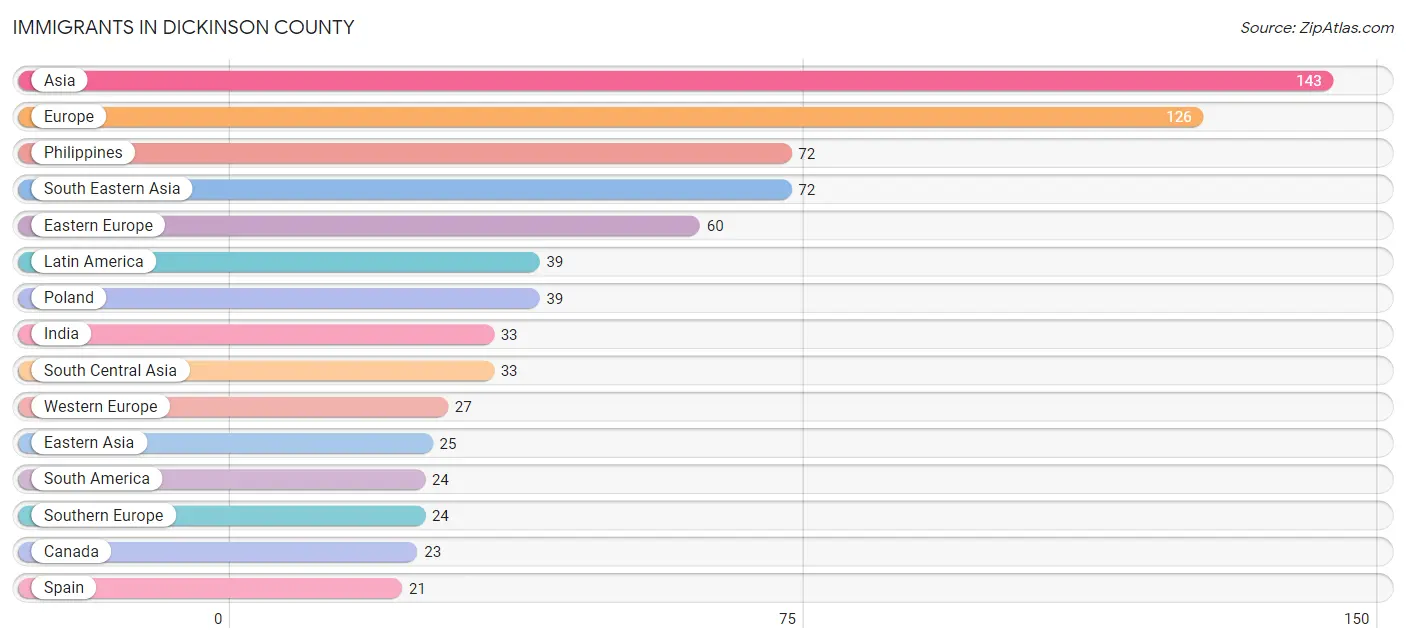
Immigrants in Dickinson County
The most numerous immigrant groups reported in Dickinson County came from Asia (143 | 0.5%), Europe (126 | 0.5%), Philippines (72 | 0.3%), South Eastern Asia (72 | 0.3%), and Eastern Europe (60 | 0.2%), together accounting for 1.8% of all Dickinson County residents.
| Immigration Origin | # Population | % Population |
| Africa | 10 | 0.0% |
| Asia | 143 | 0.5% |
| Austria | 11 | 0.0% |
| Azores | 1 | 0.0% |
| Bulgaria | 4 | 0.0% |
| Canada | 23 | 0.1% |
| Caribbean | 13 | 0.1% |
| Central America | 2 | 0.0% |
| Chile | 11 | 0.0% |
| China | 11 | 0.0% |
| Czechoslovakia | 4 | 0.0% |
| Eastern Asia | 25 | 0.1% |
| Eastern Europe | 60 | 0.2% |
| Ecuador | 13 | 0.1% |
| England | 13 | 0.1% |
| Europe | 126 | 0.5% |
| Germany | 16 | 0.1% |
| Hungary | 10 | 0.0% |
| India | 33 | 0.1% |
| Italy | 2 | 0.0% |
| Jamaica | 11 | 0.0% |
| Korea | 14 | 0.1% |
| Latin America | 39 | 0.2% |
| Lebanon | 13 | 0.1% |
| Mexico | 2 | 0.0% |
| Northern Europe | 15 | 0.1% |
| Norway | 2 | 0.0% |
| Philippines | 72 | 0.3% |
| Poland | 39 | 0.2% |
| Portugal | 1 | 0.0% |
| South America | 24 | 0.1% |
| South Central Asia | 33 | 0.1% |
| South Eastern Asia | 72 | 0.3% |
| Southern Europe | 24 | 0.1% |
| Spain | 21 | 0.1% |
| Trinidad and Tobago | 2 | 0.0% |
| Ukraine | 3 | 0.0% |
| Western Asia | 13 | 0.1% |
| Western Europe | 27 | 0.1% | View All 39 Rows |
Sex and Age in Dickinson County
Sex and Age in Dickinson County
The most populous age groups in Dickinson County are 60 to 64 Years (1,224 | 9.3%) for men and 60 to 64 Years (1,125 | 8.8%) for women.
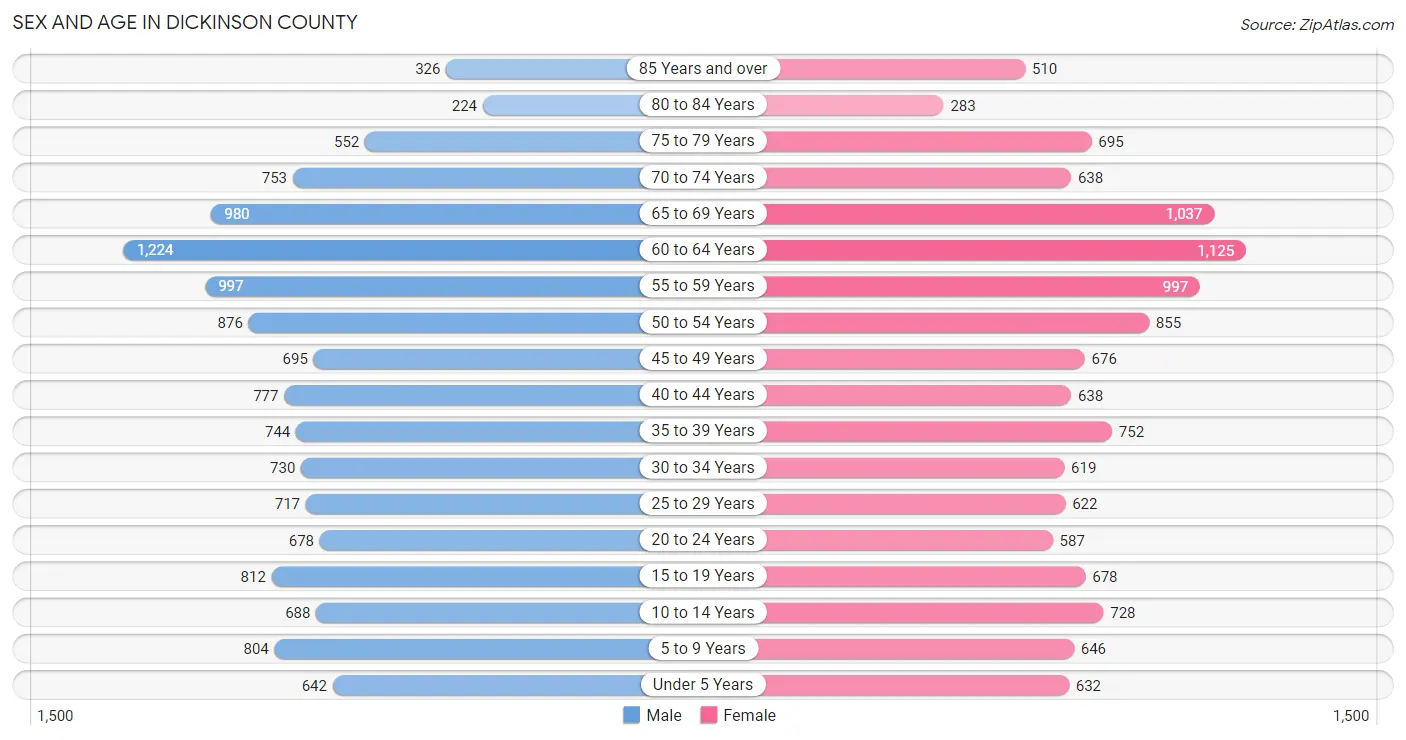
| Age Bracket | Male | Female |
| Under 5 Years | 642 (4.9%) | 632 (5.0%) |
| 5 to 9 Years | 804 (6.1%) | 646 (5.1%) |
| 10 to 14 Years | 688 (5.2%) | 728 (5.7%) |
| 15 to 19 Years | 812 (6.1%) | 678 (5.3%) |
| 20 to 24 Years | 678 (5.1%) | 587 (4.6%) |
| 25 to 29 Years | 717 (5.4%) | 622 (4.9%) |
| 30 to 34 Years | 730 (5.5%) | 619 (4.9%) |
| 35 to 39 Years | 744 (5.6%) | 752 (5.9%) |
| 40 to 44 Years | 777 (5.9%) | 638 (5.0%) |
| 45 to 49 Years | 695 (5.3%) | 676 (5.3%) |
| 50 to 54 Years | 876 (6.6%) | 855 (6.7%) |
| 55 to 59 Years | 997 (7.5%) | 997 (7.8%) |
| 60 to 64 Years | 1,224 (9.3%) | 1,125 (8.8%) |
| 65 to 69 Years | 980 (7.4%) | 1,037 (8.2%) |
| 70 to 74 Years | 753 (5.7%) | 638 (5.0%) |
| 75 to 79 Years | 552 (4.2%) | 695 (5.5%) |
| 80 to 84 Years | 224 (1.7%) | 283 (2.2%) |
| 85 Years and over | 326 (2.5%) | 510 (4.0%) |
| Total | 13,219 (100.0%) | 12,718 (100.0%) |
Families and Households in Dickinson County
Median Family Size in Dickinson County
The median family size in Dickinson County is 2.73 persons per family, with married-couple families (5,785 | 78.0%) accounting for the largest median family size of 2.85 persons per family. On the other hand, single male/father families (579 | 7.8%) represent the smallest median family size with 2.17 persons per family.
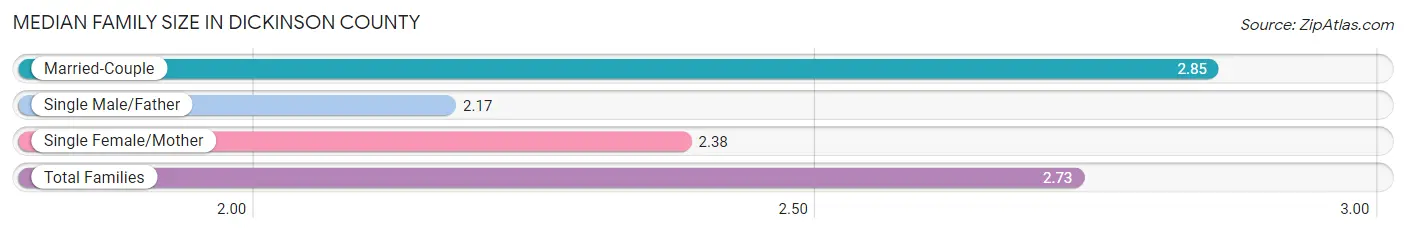
| Family Type | # Families | Family Size |
| Married-Couple | 5,785 (78.0%) | 2.85 |
| Single Male/Father | 579 (7.8%) | 2.17 |
| Single Female/Mother | 1,048 (14.1%) | 2.38 |
| Total Families | 7,412 (100.0%) | 2.73 |
Median Household Size in Dickinson County
The median household size in Dickinson County is 2.21 persons per household, with married-couple households (5,785 | 50.0%) accounting for the largest median household size of 2.86 persons per household. non-family households (4,148 | 35.9%) represent the smallest median household size with 1.15 persons per household.
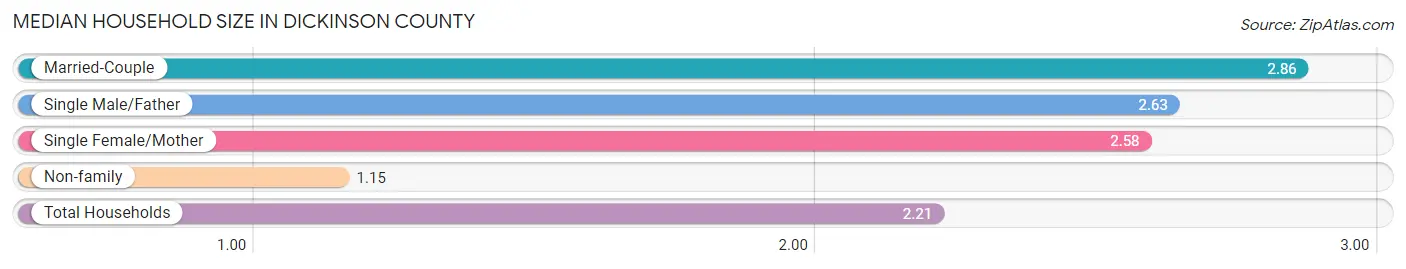
| Household Type | # Households | Household Size |
| Married-Couple | 5,785 (50.0%) | 2.86 |
| Single Male/Father | 579 (5.0%) | 2.63 |
| Single Female/Mother | 1,048 (9.1%) | 2.58 |
| Non-family | 4,148 (35.9%) | 1.15 |
| Total Households | 11,560 (100.0%) | 2.21 |
Household Size by Marriage Status in Dickinson County
Out of a total of 11,560 households in Dickinson County, 7,412 (64.1%) are family households, while 4,148 (35.9%) are nonfamily households. The most numerous type of family households are 2-person households, comprising 4,337, and the most common type of nonfamily households are 1-person households, comprising 3,595.
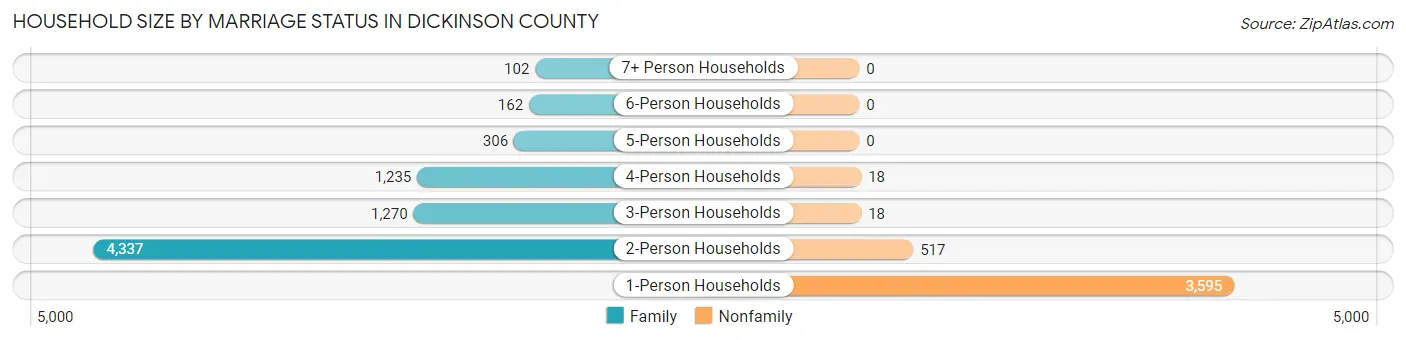
| Household Size | Family Households | Nonfamily Households |
| 1-Person Households | - | 3,595 (31.1%) |
| 2-Person Households | 4,337 (37.5%) | 517 (4.5%) |
| 3-Person Households | 1,270 (11.0%) | 18 (0.2%) |
| 4-Person Households | 1,235 (10.7%) | 18 (0.2%) |
| 5-Person Households | 306 (2.6%) | 0 (0.0%) |
| 6-Person Households | 162 (1.4%) | 0 (0.0%) |
| 7+ Person Households | 102 (0.9%) | 0 (0.0%) |
| Total | 7,412 (64.1%) | 4,148 (35.9%) |
Female Fertility in Dickinson County
Fertility by Age in Dickinson County
Average fertility rate in Dickinson County is 73.0 births per 1,000 women. Women in the age bracket of 20 to 34 years have the highest fertility rate with 161.0 births per 1,000 women. Women in the age bracket of 20 to 34 years acount for 85.7% of all women with births.

| Age Bracket | Women with Births | Births / 1,000 Women |
| 15 to 19 years | 2 (0.6%) | 3.0 |
| 20 to 34 years | 294 (85.7%) | 161.0 |
| 35 to 50 years | 47 (13.7%) | 21.0 |
| Total | 343 (100.0%) | 73.0 |
Fertility by Age by Marriage Status in Dickinson County
77.6% of women with births (343) in Dickinson County are married. The highest percentage of unmarried women with births falls into 15 to 19 years age bracket with 100.0% of them unmarried at the time of birth, while the lowest percentage of unmarried women with births belong to 35 to 50 years age bracket with 21.3% of them unmarried.

| Age Bracket | Married | Unmarried |
| 15 to 19 years | 0 (0.0%) | 2 (100.0%) |
| 20 to 34 years | 229 (77.9%) | 65 (22.1%) |
| 35 to 50 years | 37 (78.7%) | 10 (21.3%) |
| Total | 266 (77.5%) | 77 (22.5%) |
Fertility by Education in Dickinson County
Average fertility rate in Dickinson County is 73.0 births per 1,000 women. Women with the education attainment of college or associate's degree have the highest fertility rate of 97.0 births per 1,000 women, while women with the education attainment of less than high school have the lowest fertility at 33.0 births per 1,000 women. Women with the education attainment of college or associate's degree represent 55.7% of all women with births.
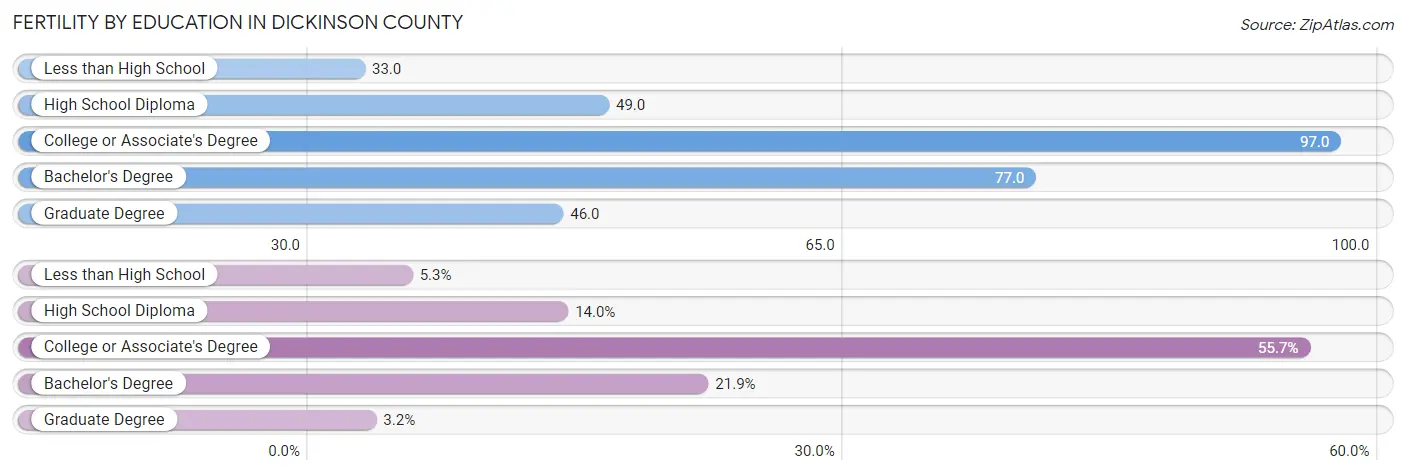
| Educational Attainment | Women with Births | Births / 1,000 Women |
| Less than High School | 18 (5.2%) | 33.0 |
| High School Diploma | 48 (14.0%) | 49.0 |
| College or Associate's Degree | 191 (55.7%) | 97.0 |
| Bachelor's Degree | 75 (21.9%) | 77.0 |
| Graduate Degree | 11 (3.2%) | 46.0 |
| Total | 343 (100.0%) | 73.0 |
Fertility by Education by Marriage Status in Dickinson County
22.5% of women with births in Dickinson County are unmarried. Women with the educational attainment of bachelor's degree are most likely to be married with 100.0% of them married at childbirth, while women with the educational attainment of college or associate's degree are least likely to be married with 34.5% of them unmarried at childbirth.
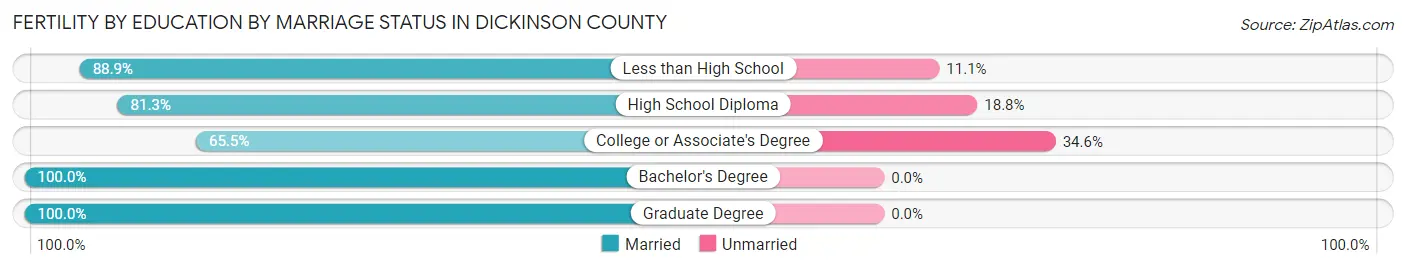
| Educational Attainment | Married | Unmarried |
| Less than High School | 16 (88.9%) | 2 (11.1%) |
| High School Diploma | 39 (81.2%) | 9 (18.8%) |
| College or Associate's Degree | 125 (65.4%) | 66 (34.5%) |
| Bachelor's Degree | 75 (100.0%) | 0 (0.0%) |
| Graduate Degree | 11 (100.0%) | 0 (0.0%) |
| Total | 266 (77.5%) | 77 (22.5%) |
Income in Dickinson County
Income Overview in Dickinson County
Per Capita Income in Dickinson County is $35,722, while median incomes of families and households are $75,121 and $59,651 respectively.
| Characteristic | Number | Measure |
| Per Capita Income | 25,937 | $35,722 |
| Median Family Income | 7,412 | $75,121 |
| Mean Family Income | 7,412 | $95,432 |
| Median Household Income | 11,560 | $59,651 |
| Mean Household Income | 11,560 | $79,478 |
| Income Deficit | 7,412 | $7,418 |
| Wage / Income Gap (%) | 25,937 | 39.86% |
| Wage / Income Gap ($) | 25,937 | 60.14¢ per $1 |
| Gini / Inequality Index | 25,937 | 0.43 |
Earnings by Sex in Dickinson County
Average Earnings in Dickinson County are $38,212, $50,226 for men and $30,207 for women, a difference of 39.9%.

| Sex | Number | Average Earnings |
| Male | 7,138 (54.6%) | $50,226 |
| Female | 5,933 (45.4%) | $30,207 |
| Total | 13,071 (100.0%) | $38,212 |
Earnings by Sex by Income Bracket in Dickinson County
The most common earnings brackets in Dickinson County are $100,000+ for men (903 | 12.7%) and $35,000 to $39,999 for women (465 | 7.8%).
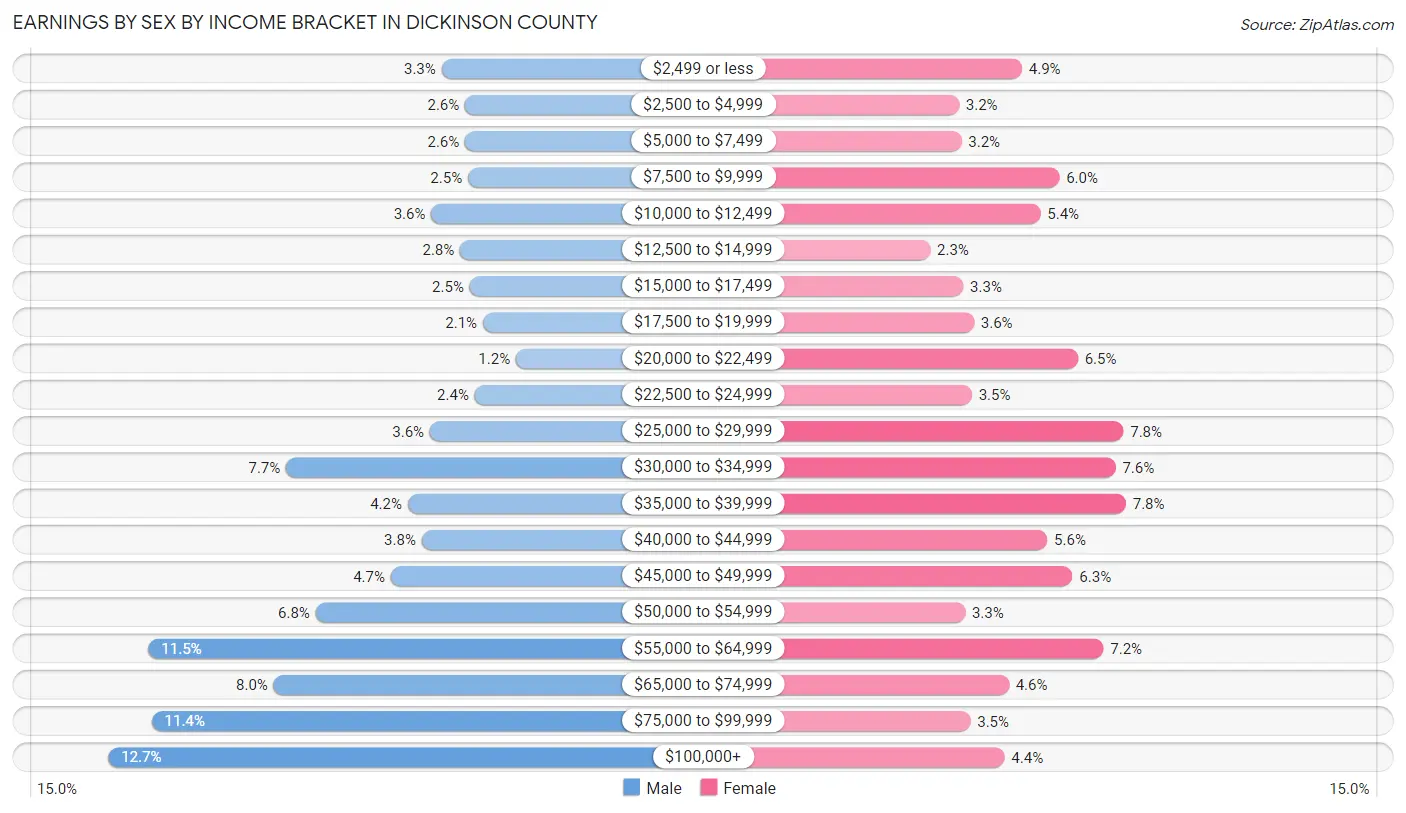
| Income | Male | Female |
| $2,499 or less | 234 (3.3%) | 292 (4.9%) |
| $2,500 to $4,999 | 187 (2.6%) | 187 (3.2%) |
| $5,000 to $7,499 | 187 (2.6%) | 191 (3.2%) |
| $7,500 to $9,999 | 181 (2.5%) | 354 (6.0%) |
| $10,000 to $12,499 | 255 (3.6%) | 323 (5.4%) |
| $12,500 to $14,999 | 197 (2.8%) | 139 (2.3%) |
| $15,000 to $17,499 | 178 (2.5%) | 194 (3.3%) |
| $17,500 to $19,999 | 151 (2.1%) | 212 (3.6%) |
| $20,000 to $22,499 | 85 (1.2%) | 385 (6.5%) |
| $22,500 to $24,999 | 168 (2.4%) | 208 (3.5%) |
| $25,000 to $29,999 | 258 (3.6%) | 461 (7.8%) |
| $30,000 to $34,999 | 546 (7.6%) | 448 (7.5%) |
| $35,000 to $39,999 | 302 (4.2%) | 465 (7.8%) |
| $40,000 to $44,999 | 274 (3.8%) | 334 (5.6%) |
| $45,000 to $49,999 | 336 (4.7%) | 376 (6.3%) |
| $50,000 to $54,999 | 487 (6.8%) | 197 (3.3%) |
| $55,000 to $64,999 | 822 (11.5%) | 428 (7.2%) |
| $65,000 to $74,999 | 571 (8.0%) | 270 (4.5%) |
| $75,000 to $99,999 | 816 (11.4%) | 206 (3.5%) |
| $100,000+ | 903 (12.7%) | 263 (4.4%) |
| Total | 7,138 (100.0%) | 5,933 (100.0%) |
Earnings by Sex by Educational Attainment in Dickinson County
Average earnings in Dickinson County are $55,302 for men and $33,644 for women, a difference of 39.2%. Men with an educational attainment of graduate degree enjoy the highest average annual earnings of $82,338, while those with high school diploma education earn the least with $39,230. Women with an educational attainment of graduate degree earn the most with the average annual earnings of $63,125, while those with less than high school education have the smallest earnings of $21,230.
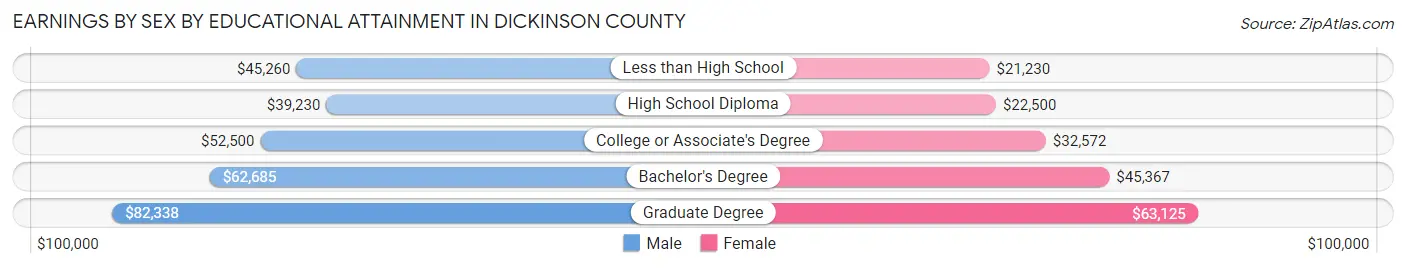
| Educational Attainment | Male Income | Female Income |
| Less than High School | $45,260 | $21,230 |
| High School Diploma | $39,230 | $22,500 |
| College or Associate's Degree | $52,500 | $32,572 |
| Bachelor's Degree | $62,685 | $45,367 |
| Graduate Degree | $82,338 | $63,125 |
| Total | $55,302 | $33,644 |
Family Income in Dickinson County
Family Income Brackets in Dickinson County
According to the Dickinson County family income data, there are 1,705 families falling into the $50,000 to $74,999 income range, which is the most common income bracket and makes up 23.0% of all families. Conversely, the less than $10,000 income bracket is the least frequent group with only 126 families (1.7%) belonging to this category.
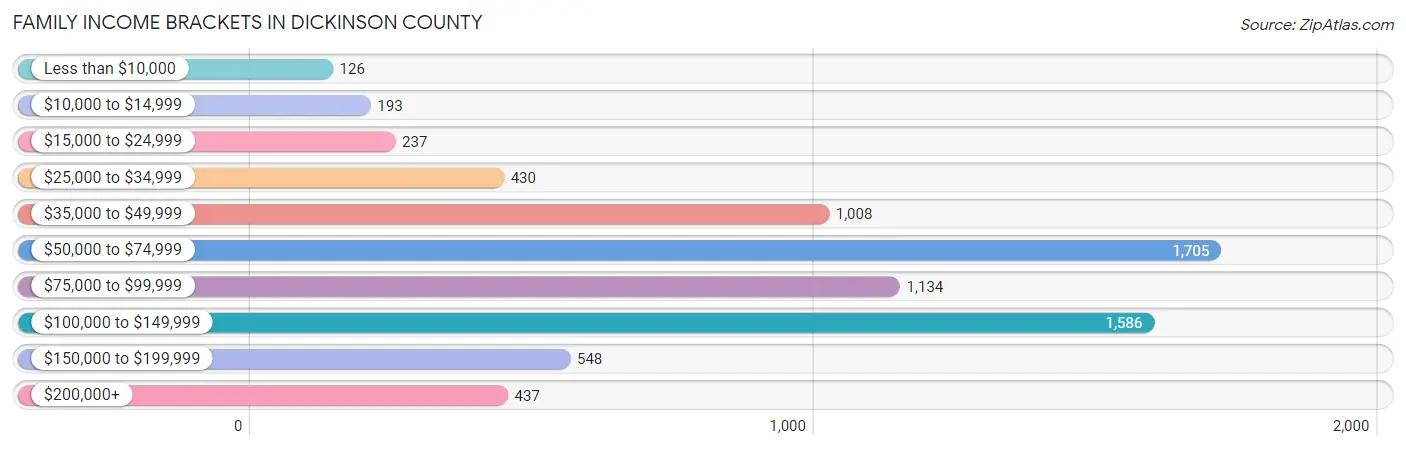
| Income Bracket | # Families | % Families |
| Less than $10,000 | 126 | 1.7% |
| $10,000 to $14,999 | 193 | 2.6% |
| $15,000 to $24,999 | 237 | 3.2% |
| $25,000 to $34,999 | 430 | 5.8% |
| $35,000 to $49,999 | 1,008 | 13.6% |
| $50,000 to $74,999 | 1,705 | 23.0% |
| $75,000 to $99,999 | 1,134 | 15.3% |
| $100,000 to $149,999 | 1,586 | 21.4% |
| $150,000 to $199,999 | 548 | 7.4% |
| $200,000+ | 437 | 5.9% |
Family Income by Famaliy Size in Dickinson County
6-person families (151 | 2.0%) account for the highest median family income in Dickinson County with $111,750 per family, while 2-person families (4,546 | 61.3%) have the highest median income of $32,898 per family member.
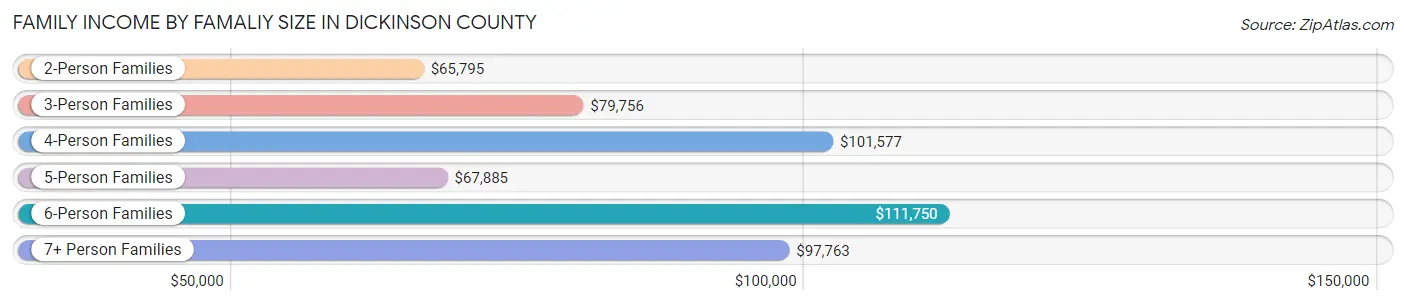
| Income Bracket | # Families | Median Income |
| 2-Person Families | 4,546 (61.3%) | $65,795 |
| 3-Person Families | 1,220 (16.5%) | $79,756 |
| 4-Person Families | 1,111 (15.0%) | $101,577 |
| 5-Person Families | 312 (4.2%) | $67,885 |
| 6-Person Families | 151 (2.0%) | $111,750 |
| 7+ Person Families | 72 (1.0%) | $97,763 |
| Total | 7,412 (100.0%) | $75,121 |
Family Income by Number of Earners in Dickinson County
The median family income in Dickinson County is $75,121, with families comprising 3+ earners (663) having the highest median family income of $116,458, while families with no earners (1,584) have the lowest median family income of $46,990, accounting for 8.9% and 21.4% of families, respectively.

| Number of Earners | # Families | Median Income |
| No Earners | 1,584 (21.4%) | $46,990 |
| 1 Earner | 2,350 (31.7%) | $67,917 |
| 2 Earners | 2,815 (38.0%) | $93,384 |
| 3+ Earners | 663 (8.9%) | $116,458 |
| Total | 7,412 (100.0%) | $75,121 |
Household Income in Dickinson County
Household Income Brackets in Dickinson County
With 2,462 households falling in the category, the $50,000 to $74,999 income range is the most frequent in Dickinson County, accounting for 21.3% of all households. In contrast, only 462 households (4.0%) fall into the $10,000 to $14,999 income bracket, making it the least populous group.

| Income Bracket | # Households | % Households |
| Less than $10,000 | 543 | 4.7% |
| $10,000 to $14,999 | 462 | 4.0% |
| $15,000 to $24,999 | 902 | 7.8% |
| $25,000 to $34,999 | 1,017 | 8.8% |
| $35,000 to $49,999 | 1,630 | 14.1% |
| $50,000 to $74,999 | 2,462 | 21.3% |
| $75,000 to $99,999 | 1,572 | 13.6% |
| $100,000 to $149,999 | 1,792 | 15.5% |
| $150,000 to $199,999 | 682 | 5.9% |
| $200,000+ | 486 | 4.2% |
Household Income by Householder Age in Dickinson County
The median household income in Dickinson County is $59,651, with the highest median household income of $79,761 found in the 25 to 44 years age bracket for the primary householder. A total of 2,945 households (25.5%) fall into this category. Meanwhile, the 15 to 24 years age bracket for the primary householder has the lowest median household income of $37,165, with 295 households (2.5%) in this group.
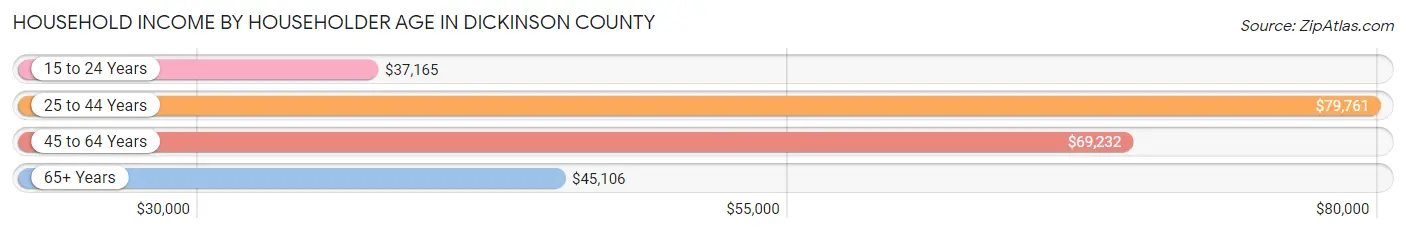
| Income Bracket | # Households | Median Income |
| 15 to 24 Years | 295 (2.5%) | $37,165 |
| 25 to 44 Years | 2,945 (25.5%) | $79,761 |
| 45 to 64 Years | 4,326 (37.4%) | $69,232 |
| 65+ Years | 3,994 (34.5%) | $45,106 |
| Total | 11,560 (100.0%) | $59,651 |
Poverty in Dickinson County
Income Below Poverty by Sex and Age in Dickinson County
With 8.3% poverty level for males and 11.1% for females among the residents of Dickinson County, 15 year old males and 25 to 34 year old females are the most vulnerable to poverty, with 26 males (18.6%) and 231 females (18.8%) in their respective age groups living below the poverty level.

| Age Bracket | Male | Female |
| Under 5 Years | 14 (2.3%) | 0 (0.0%) |
| 5 Years | 27 (13.7%) | 0 (0.0%) |
| 6 to 11 Years | 142 (16.6%) | 118 (13.8%) |
| 12 to 14 Years | 43 (10.9%) | 7 (1.9%) |
| 15 Years | 26 (18.6%) | 6 (4.2%) |
| 16 and 17 Years | 49 (13.0%) | 50 (15.9%) |
| 18 to 24 Years | 125 (13.0%) | 78 (9.7%) |
| 25 to 34 Years | 136 (9.4%) | 231 (18.8%) |
| 35 to 44 Years | 59 (4.0%) | 228 (16.4%) |
| 45 to 54 Years | 80 (5.1%) | 149 (9.7%) |
| 55 to 64 Years | 218 (10.0%) | 146 (6.9%) |
| 65 to 74 Years | 122 (7.1%) | 128 (7.7%) |
| 75 Years and over | 37 (3.6%) | 258 (17.9%) |
| Total | 1,078 (8.3%) | 1,399 (11.1%) |
Income Above Poverty by Sex and Age in Dickinson County
According to the poverty statistics in Dickinson County, males aged under 5 years and females aged under 5 years are the age groups that are most secure financially, with 97.7% of males and 100.0% of females in these age groups living above the poverty line.
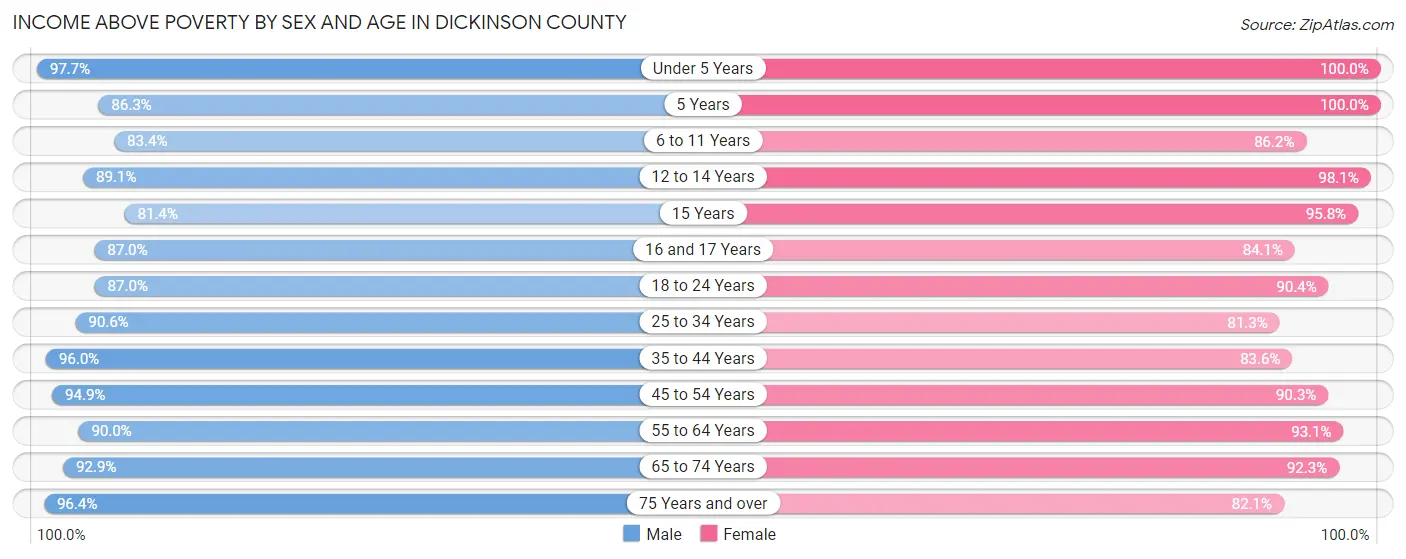
| Age Bracket | Male | Female |
| Under 5 Years | 604 (97.7%) | 632 (100.0%) |
| 5 Years | 170 (86.3%) | 85 (100.0%) |
| 6 to 11 Years | 712 (83.4%) | 737 (86.2%) |
| 12 to 14 Years | 353 (89.1%) | 370 (98.1%) |
| 15 Years | 114 (81.4%) | 137 (95.8%) |
| 16 and 17 Years | 329 (87.0%) | 264 (84.1%) |
| 18 to 24 Years | 836 (87.0%) | 730 (90.3%) |
| 25 to 34 Years | 1,304 (90.6%) | 1,001 (81.2%) |
| 35 to 44 Years | 1,430 (96.0%) | 1,162 (83.6%) |
| 45 to 54 Years | 1,481 (94.9%) | 1,382 (90.3%) |
| 55 to 64 Years | 1,963 (90.0%) | 1,967 (93.1%) |
| 65 to 74 Years | 1,589 (92.9%) | 1,531 (92.3%) |
| 75 Years and over | 990 (96.4%) | 1,179 (82.1%) |
| Total | 11,875 (91.7%) | 11,177 (88.9%) |
Income Below Poverty Among Married-Couple Families in Dickinson County
The poverty statistics for married-couple families in Dickinson County show that 3.3% or 191 of the total 5,785 families live below the poverty line. Families with 1 or 2 children have the highest poverty rate of 6.0%, comprising of 84 families. On the other hand, families with 5 or more children have the lowest poverty rate of 0.0%, which includes 0 families.
| Children | Above Poverty | Below Poverty |
| No Children | 3,880 (97.4%) | 103 (2.6%) |
| 1 or 2 Children | 1,313 (94.0%) | 84 (6.0%) |
| 3 or 4 Children | 329 (98.8%) | 4 (1.2%) |
| 5 or more Children | 72 (100.0%) | 0 (0.0%) |
| Total | 5,594 (96.7%) | 191 (3.3%) |
Income Below Poverty Among Single-Parent Households in Dickinson County
According to the poverty data in Dickinson County, 8.1% or 47 single-father households and 25.4% or 266 single-mother households are living below the poverty line. Among single-father households, those with 3 or 4 children have the highest poverty rate, with 5 households (21.7%) experiencing poverty. Likewise, among single-mother households, those with 3 or 4 children have the highest poverty rate, with 36 households (48.0%) falling below the poverty line.
| Children | Single Father | Single Mother |
| No Children | 3 (1.1%) | 130 (22.9%) |
| 1 or 2 Children | 39 (13.7%) | 100 (24.7%) |
| 3 or 4 Children | 5 (21.7%) | 36 (48.0%) |
| 5 or more Children | 0 (0.0%) | 0 (0.0%) |
| Total | 47 (8.1%) | 266 (25.4%) |
Income Below Poverty Among Married-Couple vs Single-Parent Households in Dickinson County
The poverty data for Dickinson County shows that 191 of the married-couple family households (3.3%) and 313 of the single-parent households (19.2%) are living below the poverty level. Within the married-couple family households, those with 1 or 2 children have the highest poverty rate, with 84 households (6.0%) falling below the poverty line. Among the single-parent households, those with 3 or 4 children have the highest poverty rate, with 41 household (41.8%) living below poverty.

| Children | Married-Couple Families | Single-Parent Households |
| No Children | 103 (2.6%) | 133 (15.8%) |
| 1 or 2 Children | 84 (6.0%) | 139 (20.2%) |
| 3 or 4 Children | 4 (1.2%) | 41 (41.8%) |
| 5 or more Children | 0 (0.0%) | 0 (0.0%) |
| Total | 191 (3.3%) | 313 (19.2%) |
Employment Characteristics in Dickinson County
Employment by Class of Employer in Dickinson County
Among the 11,750 employed individuals in Dickinson County, private company employees (8,223 | 70.0%), local government employees (939 | 8.0%), and not-for-profit organizations (929 | 7.9%) make up the most common classes of employment.

| Employer Class | # Employees | % Employees |
| Private Company Employees | 8,223 | 70.0% |
| Self-Employed (Incorporated) | 490 | 4.2% |
| Self-Employed (Not Incorporated) | 418 | 3.6% |
| Not-for-profit Organizations | 929 | 7.9% |
| Local Government Employees | 939 | 8.0% |
| State Government Employees | 250 | 2.1% |
| Federal Government Employees | 492 | 4.2% |
| Unpaid Family Workers | 9 | 0.1% |
| Total | 11,750 | 100.0% |
Employment Status by Age in Dickinson County
According to the labor force statistics for Dickinson County, out of the total population over 16 years of age (21,514), 57.4% or 12,349 individuals are in the labor force, with 3.8% or 469 of them unemployed. The age group with the highest labor force participation rate is 25 to 29 years, with 87.5% or 1,172 individuals in the labor force. Within the labor force, the 20 to 24 years age range has the highest percentage of unemployed individuals, with 8.5% or 83 of them being unemployed.

| Age Bracket | In Labor Force | Unemployed |
| 16 to 19 Years | 573 (47.5%) | 13 (2.3%) |
| 20 to 24 Years | 980 (77.5%) | 83 (8.5%) |
| 25 to 29 Years | 1,172 (87.5%) | 54 (4.6%) |
| 30 to 34 Years | 1,064 (78.9%) | 35 (3.3%) |
| 35 to 44 Years | 2,471 (84.9%) | 77 (3.1%) |
| 45 to 54 Years | 2,568 (82.8%) | 77 (3.0%) |
| 55 to 59 Years | 1,418 (71.1%) | 50 (3.5%) |
| 60 to 64 Years | 1,334 (56.8%) | 33 (2.5%) |
| 65 to 74 Years | 702 (20.6%) | 51 (7.3%) |
| 75 Years and over | 73 (2.8%) | 0 (0.0%) |
| Total | 12,349 (57.4%) | 469 (3.8%) |
Employment Status by Educational Attainment in Dickinson County
According to labor force statistics for Dickinson County, 76.9% of individuals (10,031) out of the total population between 25 and 64 years of age (13,044) are in the labor force, with 3.2% or 321 of them being unemployed. The group with the highest labor force participation rate are those with the educational attainment of bachelor's degree or higher, with 88.0% or 3,004 individuals in the labor force. Within the labor force, individuals with less than high school education have the highest percentage of unemployment, with 5.0% or 10 of them being unemployed.
| Educational Attainment | In Labor Force | Unemployed |
| Less than High School | 199 (58.0%) | 17 (5.0%) |
| High School Diploma | 2,782 (75.0%) | 160 (4.3%) |
| College / Associate Degree | 4,038 (72.4%) | 262 (4.7%) |
| Bachelor's Degree or higher | 3,004 (88.0%) | 7 (0.2%) |
| Total | 10,031 (76.9%) | 417 (3.2%) |
Employment Occupations by Sex in Dickinson County
Management, Business, Science and Arts Occupations
The most common Management, Business, Science and Arts occupations in Dickinson County are Management (1,170 | 9.9%), Health Diagnosing & Treating (883 | 7.4%), Community & Social Service (849 | 7.1%), Computers, Engineering & Science (610 | 5.1%), and Health Technologists (554 | 4.7%).

Management, Business, Science and Arts Occupations by Sex
Within the Management, Business, Science and Arts occupations in Dickinson County, the most male-oriented occupations are Computers & Mathematics (92.7%), Architecture & Engineering (91.5%), and Computers, Engineering & Science (84.4%), while the most female-oriented occupations are Education Instruction & Library (79.7%), Health Diagnosing & Treating (76.4%), and Health Technologists (75.1%).

| Occupation | Male | Female |
| Management | 774 (66.1%) | 396 (33.9%) |
| Business & Financial | 235 (53.0%) | 208 (46.9%) |
| Computers, Engineering & Science | 515 (84.4%) | 95 (15.6%) |
| Computers & Mathematics | 217 (92.7%) | 17 (7.3%) |
| Architecture & Engineering | 280 (91.5%) | 26 (8.5%) |
| Life, Physical & Social Science | 18 (25.7%) | 52 (74.3%) |
| Community & Social Service | 313 (36.9%) | 536 (63.1%) |
| Education, Arts & Media | 129 (51.0%) | 124 (49.0%) |
| Legal Services & Support | 8 (72.7%) | 3 (27.3%) |
| Education Instruction & Library | 97 (20.3%) | 382 (79.7%) |
| Arts, Media & Entertainment | 79 (74.5%) | 27 (25.5%) |
| Health Diagnosing & Treating | 208 (23.6%) | 675 (76.4%) |
| Health Technologists | 138 (24.9%) | 416 (75.1%) |
| Total (Category) | 2,045 (51.7%) | 1,910 (48.3%) |
| Total (Overall) | 6,590 (55.5%) | 5,286 (44.5%) |
Services Occupations
The most common Services occupations in Dickinson County are Food Preparation & Serving (681 | 5.7%), Healthcare Support (518 | 4.4%), Cleaning & Maintenance (432 | 3.6%), Security & Protection (316 | 2.7%), and Personal Care & Service (201 | 1.7%).

Services Occupations by Sex
Within the Services occupations in Dickinson County, the most male-oriented occupations are Law Enforcement (85.7%), Security & Protection (83.9%), and Firefighting & Prevention (81.3%), while the most female-oriented occupations are Healthcare Support (99.6%), Food Preparation & Serving (59.6%), and Personal Care & Service (57.2%).
| Occupation | Male | Female |
| Healthcare Support | 2 (0.4%) | 516 (99.6%) |
| Security & Protection | 265 (83.9%) | 51 (16.1%) |
| Firefighting & Prevention | 109 (81.3%) | 25 (18.7%) |
| Law Enforcement | 156 (85.7%) | 26 (14.3%) |
| Food Preparation & Serving | 275 (40.4%) | 406 (59.6%) |
| Cleaning & Maintenance | 199 (46.1%) | 233 (53.9%) |
| Personal Care & Service | 86 (42.8%) | 115 (57.2%) |
| Total (Category) | 827 (38.5%) | 1,321 (61.5%) |
| Total (Overall) | 6,590 (55.5%) | 5,286 (44.5%) |
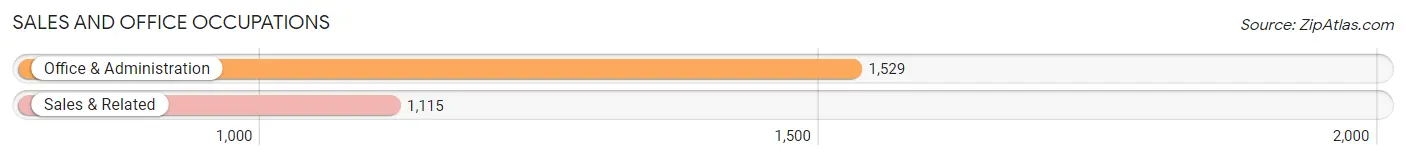
Sales and Office Occupations
The most common Sales and Office occupations in Dickinson County are Office & Administration (1,529 | 12.9%), and Sales & Related (1,115 | 9.4%).
Sales and Office Occupations by Sex
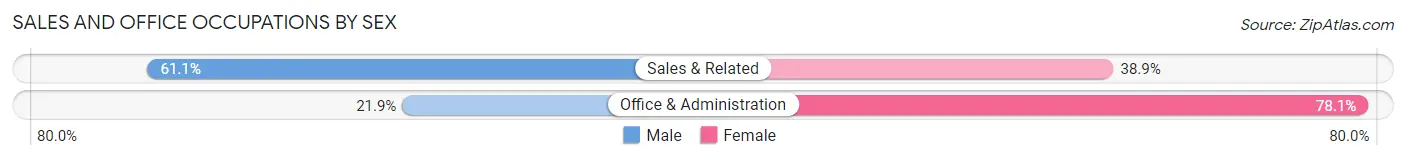
| Occupation | Male | Female |
| Sales & Related | 681 (61.1%) | 434 (38.9%) |
| Office & Administration | 335 (21.9%) | 1,194 (78.1%) |
| Total (Category) | 1,016 (38.4%) | 1,628 (61.6%) |
| Total (Overall) | 6,590 (55.5%) | 5,286 (44.5%) |
Natural Resources, Construction and Maintenance Occupations
The most common Natural Resources, Construction and Maintenance occupations in Dickinson County are Construction & Extraction (478 | 4.0%), Installation, Maintenance & Repair (478 | 4.0%), and Farming, Fishing & Forestry (26 | 0.2%).

Natural Resources, Construction and Maintenance Occupations by Sex
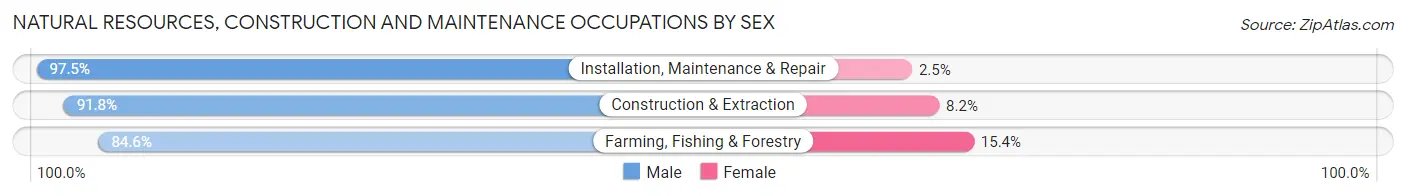
| Occupation | Male | Female |
| Farming, Fishing & Forestry | 22 (84.6%) | 4 (15.4%) |
| Construction & Extraction | 439 (91.8%) | 39 (8.2%) |
| Installation, Maintenance & Repair | 466 (97.5%) | 12 (2.5%) |
| Total (Category) | 927 (94.4%) | 55 (5.6%) |
| Total (Overall) | 6,590 (55.5%) | 5,286 (44.5%) |
Production, Transportation and Moving Occupations
The most common Production, Transportation and Moving occupations in Dickinson County are Production (854 | 7.2%), Material Moving (720 | 6.1%), and Transportation (573 | 4.8%).

Production, Transportation and Moving Occupations by Sex
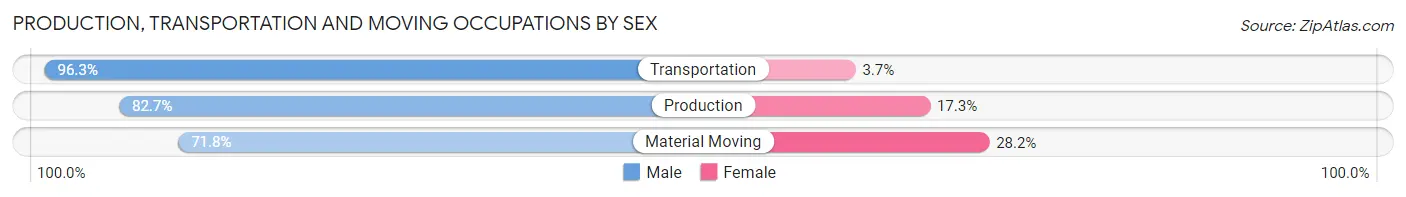
| Occupation | Male | Female |
| Production | 706 (82.7%) | 148 (17.3%) |
| Transportation | 552 (96.3%) | 21 (3.7%) |
| Material Moving | 517 (71.8%) | 203 (28.2%) |
| Total (Category) | 1,775 (82.7%) | 372 (17.3%) |
| Total (Overall) | 6,590 (55.5%) | 5,286 (44.5%) |
Employment Industries by Sex in Dickinson County
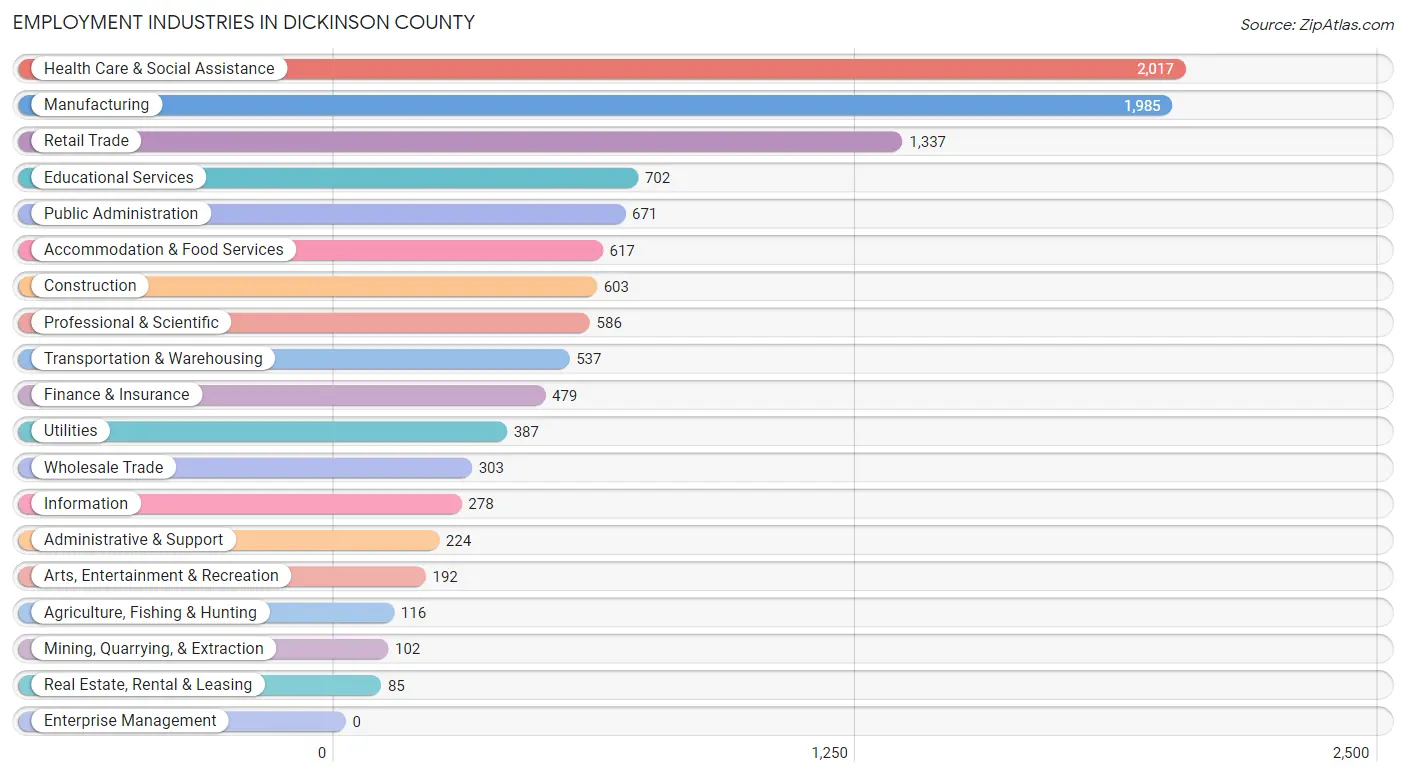
Employment Industries in Dickinson County
The major employment industries in Dickinson County include Health Care & Social Assistance (2,017 | 17.0%), Manufacturing (1,985 | 16.7%), Retail Trade (1,337 | 11.3%), Educational Services (702 | 5.9%), and Public Administration (671 | 5.7%).
Employment Industries by Sex in Dickinson County
The Dickinson County industries that see more men than women are Transportation & Warehousing (93.1%), Agriculture, Fishing & Hunting (90.5%), and Construction (86.6%), whereas the industries that tend to have a higher number of women are Health Care & Social Assistance (86.0%), Educational Services (76.9%), and Utilities (65.6%).
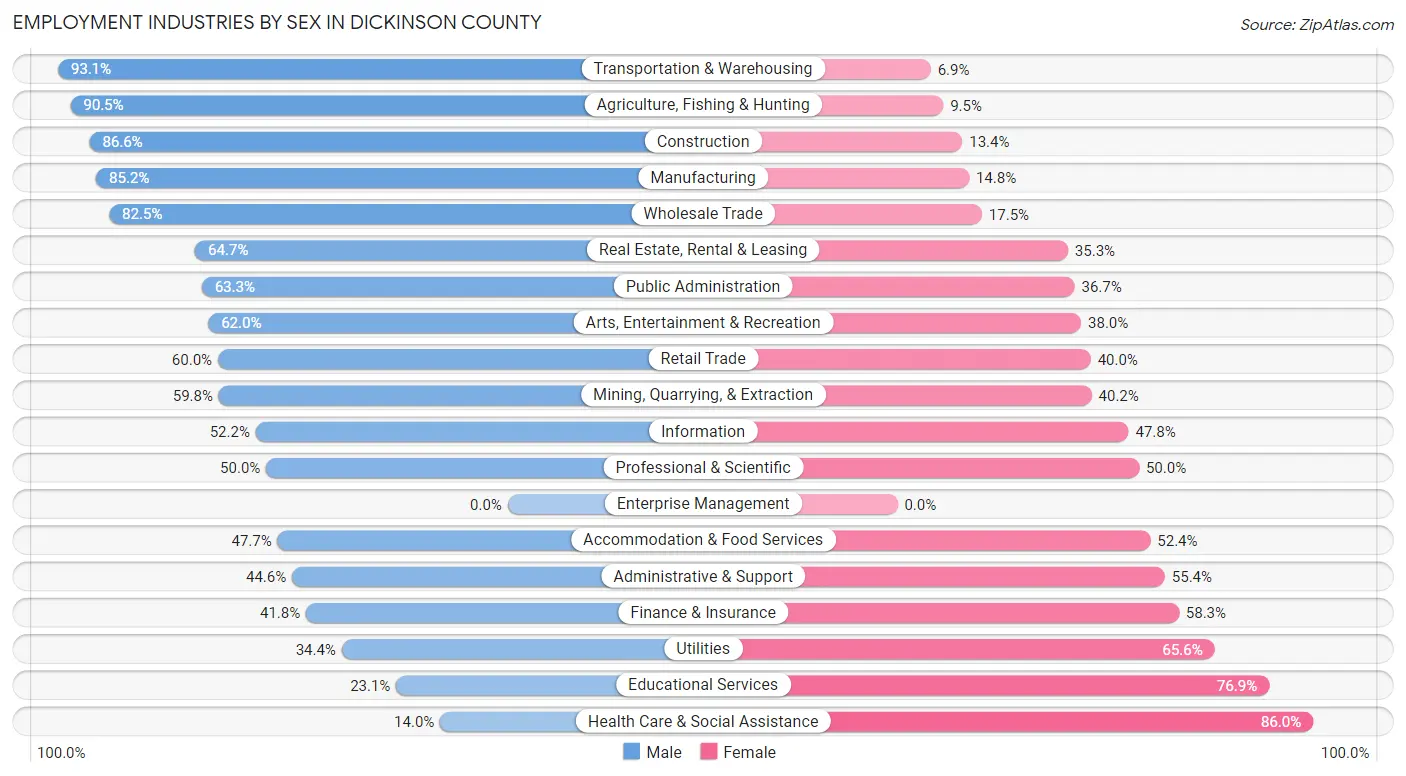
| Industry | Male | Female |
| Agriculture, Fishing & Hunting | 105 (90.5%) | 11 (9.5%) |
| Mining, Quarrying, & Extraction | 61 (59.8%) | 41 (40.2%) |
| Construction | 522 (86.6%) | 81 (13.4%) |
| Manufacturing | 1,691 (85.2%) | 294 (14.8%) |
| Wholesale Trade | 250 (82.5%) | 53 (17.5%) |
| Retail Trade | 802 (60.0%) | 535 (40.0%) |
| Transportation & Warehousing | 500 (93.1%) | 37 (6.9%) |
| Utilities | 133 (34.4%) | 254 (65.6%) |
| Information | 145 (52.2%) | 133 (47.8%) |
| Finance & Insurance | 200 (41.7%) | 279 (58.3%) |
| Real Estate, Rental & Leasing | 55 (64.7%) | 30 (35.3%) |
| Professional & Scientific | 293 (50.0%) | 293 (50.0%) |
| Enterprise Management | 0 (0.0%) | 0 (0.0%) |
| Administrative & Support | 100 (44.6%) | 124 (55.4%) |
| Educational Services | 162 (23.1%) | 540 (76.9%) |
| Health Care & Social Assistance | 282 (14.0%) | 1,735 (86.0%) |
| Arts, Entertainment & Recreation | 119 (62.0%) | 73 (38.0%) |
| Accommodation & Food Services | 294 (47.6%) | 323 (52.3%) |
| Public Administration | 425 (63.3%) | 246 (36.7%) |
| Total | 6,590 (55.5%) | 5,286 (44.5%) |
Education in Dickinson County
School Enrollment in Dickinson County
The most common levels of schooling among the 5,043 students in Dickinson County are high school (1,263 | 25.0%), middle school (1,195 | 23.7%), and elementary school (992 | 19.7%).

| School Level | # Students | % Students |
| Nursery / Preschool | 213 | 4.2% |
| Kindergarten | 364 | 7.2% |
| Elementary School | 992 | 19.7% |
| Middle School | 1,195 | 23.7% |
| High School | 1,263 | 25.0% |
| College / Undergraduate | 807 | 16.0% |
| Graduate / Professional | 209 | 4.1% |
| Total | 5,043 | 100.0% |
School Enrollment by Age by Funding Source in Dickinson County
Out of a total of 5,043 students who are enrolled in schools in Dickinson County, 671 (13.3%) attend a private institution, while the remaining 4,372 (86.7%) are enrolled in public schools. The age group of 3 to 4 year olds has the highest likelihood of being enrolled in private schools, with 41 (34.2% in the age bracket) enrolled. Conversely, the age group of 20 to 24 year olds has the lowest likelihood of being enrolled in a private school, with 297 (92.2% in the age bracket) attending a public institution.
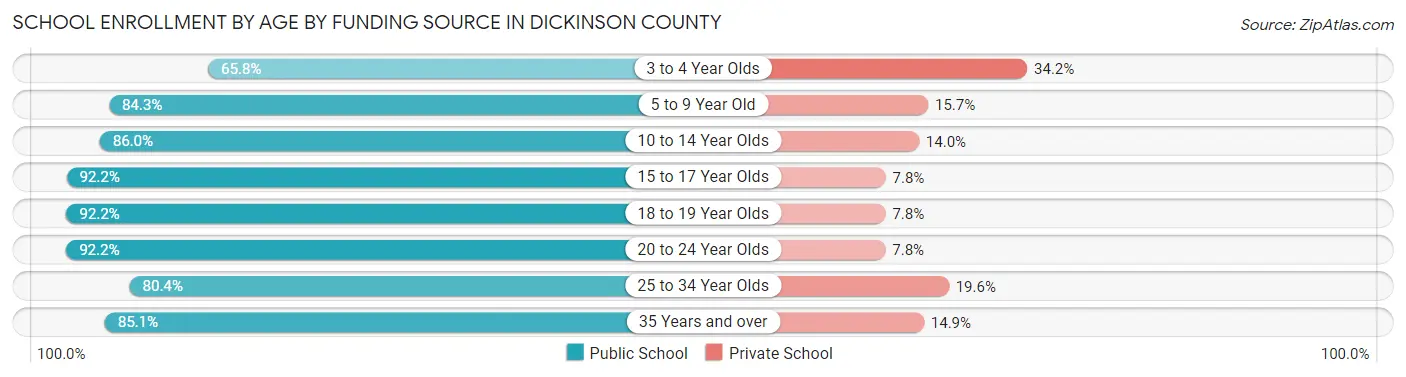
| Age Bracket | Public School | Private School |
| 3 to 4 Year Olds | 79 (65.8%) | 41 (34.2%) |
| 5 to 9 Year Old | 1,147 (84.3%) | 214 (15.7%) |
| 10 to 14 Year Olds | 1,178 (86.0%) | 192 (14.0%) |
| 15 to 17 Year Olds | 897 (92.2%) | 76 (7.8%) |
| 18 to 19 Year Olds | 284 (92.2%) | 24 (7.8%) |
| 20 to 24 Year Olds | 297 (92.2%) | 25 (7.8%) |
| 25 to 34 Year Olds | 226 (80.4%) | 55 (19.6%) |
| 35 Years and over | 262 (85.1%) | 46 (14.9%) |
| Total | 4,372 (86.7%) | 671 (13.3%) |
Educational Attainment by Field of Study in Dickinson County
Science & technology (956 | 19.2%), education (762 | 15.3%), business (717 | 14.4%), engineering (499 | 10.0%), and arts & humanities (480 | 9.6%) are the most common fields of study among 4,985 individuals in Dickinson County who have obtained a bachelor's degree or higher.
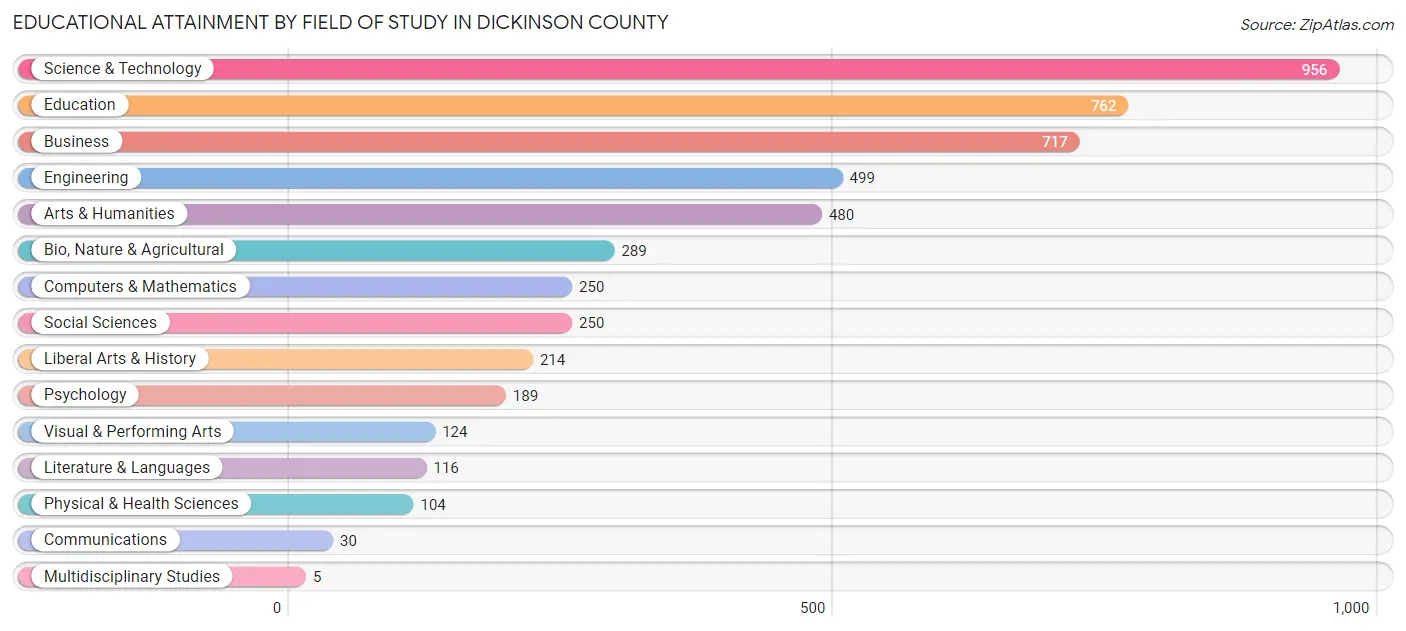
| Field of Study | # Graduates | % Graduates |
| Computers & Mathematics | 250 | 5.0% |
| Bio, Nature & Agricultural | 289 | 5.8% |
| Physical & Health Sciences | 104 | 2.1% |
| Psychology | 189 | 3.8% |
| Social Sciences | 250 | 5.0% |
| Engineering | 499 | 10.0% |
| Multidisciplinary Studies | 5 | 0.1% |
| Science & Technology | 956 | 19.2% |
| Business | 717 | 14.4% |
| Education | 762 | 15.3% |
| Literature & Languages | 116 | 2.3% |
| Liberal Arts & History | 214 | 4.3% |
| Visual & Performing Arts | 124 | 2.5% |
| Communications | 30 | 0.6% |
| Arts & Humanities | 480 | 9.6% |
| Total | 4,985 | 100.0% |
Transportation & Commute in Dickinson County
Vehicle Availability by Sex in Dickinson County
The most prevalent vehicle ownership categories in Dickinson County are males with 2 vehicles (3,097, accounting for 47.8%) and females with 2 vehicles (2,600, making up 59.3%).
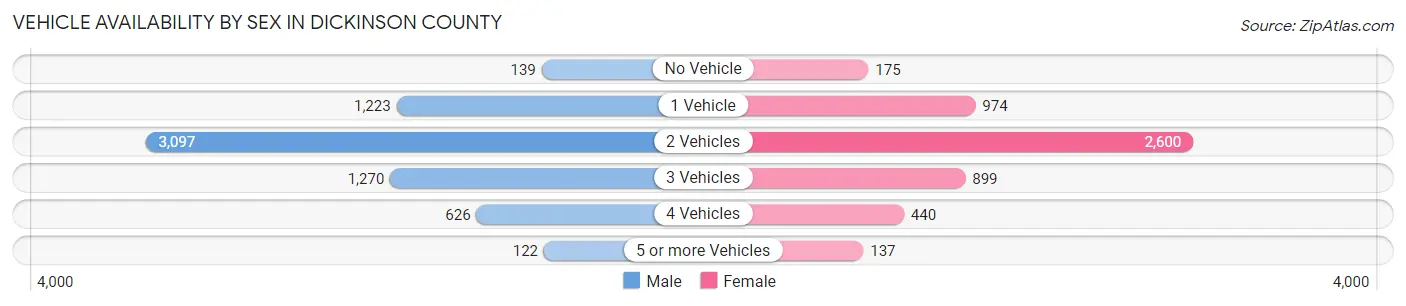
| Vehicles Available | Male | Female |
| No Vehicle | 139 (2.1%) | 175 (3.4%) |
| 1 Vehicle | 1,223 (18.9%) | 974 (18.6%) |
| 2 Vehicles | 3,097 (47.8%) | 2,600 (49.8%) |
| 3 Vehicles | 1,270 (19.6%) | 899 (17.2%) |
| 4 Vehicles | 626 (9.7%) | 440 (8.4%) |
| 5 or more Vehicles | 122 (1.9%) | 137 (2.6%) |
| Total | 6,477 (100.0%) | 5,225 (100.0%) |
Commute Time in Dickinson County
The most frequently occuring commute durations in Dickinson County are 10 to 14 minutes (3,204 commuters, 29.5%), 5 to 9 minutes (2,650 commuters, 24.4%), and 15 to 19 minutes (1,658 commuters, 15.3%).
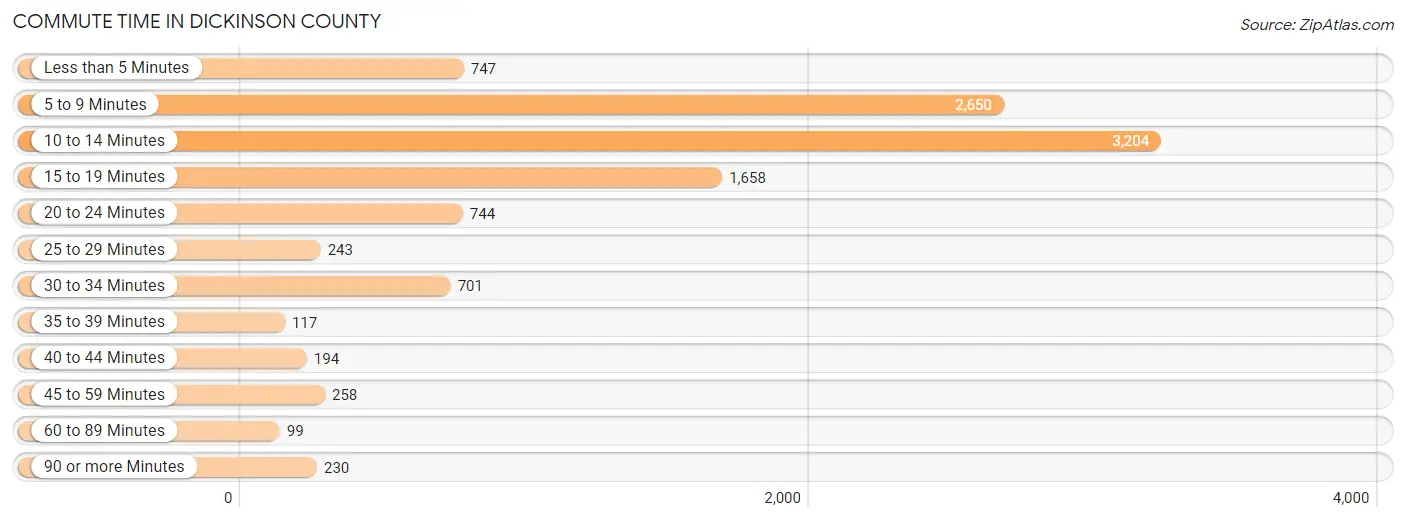
| Commute Time | # Commuters | % Commuters |
| Less than 5 Minutes | 747 | 6.9% |
| 5 to 9 Minutes | 2,650 | 24.4% |
| 10 to 14 Minutes | 3,204 | 29.5% |
| 15 to 19 Minutes | 1,658 | 15.3% |
| 20 to 24 Minutes | 744 | 6.9% |
| 25 to 29 Minutes | 243 | 2.2% |
| 30 to 34 Minutes | 701 | 6.5% |
| 35 to 39 Minutes | 117 | 1.1% |
| 40 to 44 Minutes | 194 | 1.8% |
| 45 to 59 Minutes | 258 | 2.4% |
| 60 to 89 Minutes | 99 | 0.9% |
| 90 or more Minutes | 230 | 2.1% |
Commute Time by Sex in Dickinson County
The most common commute times in Dickinson County are 10 to 14 minutes (1,815 commuters, 29.8%) for males and 10 to 14 minutes (1,389 commuters, 29.2%) for females.
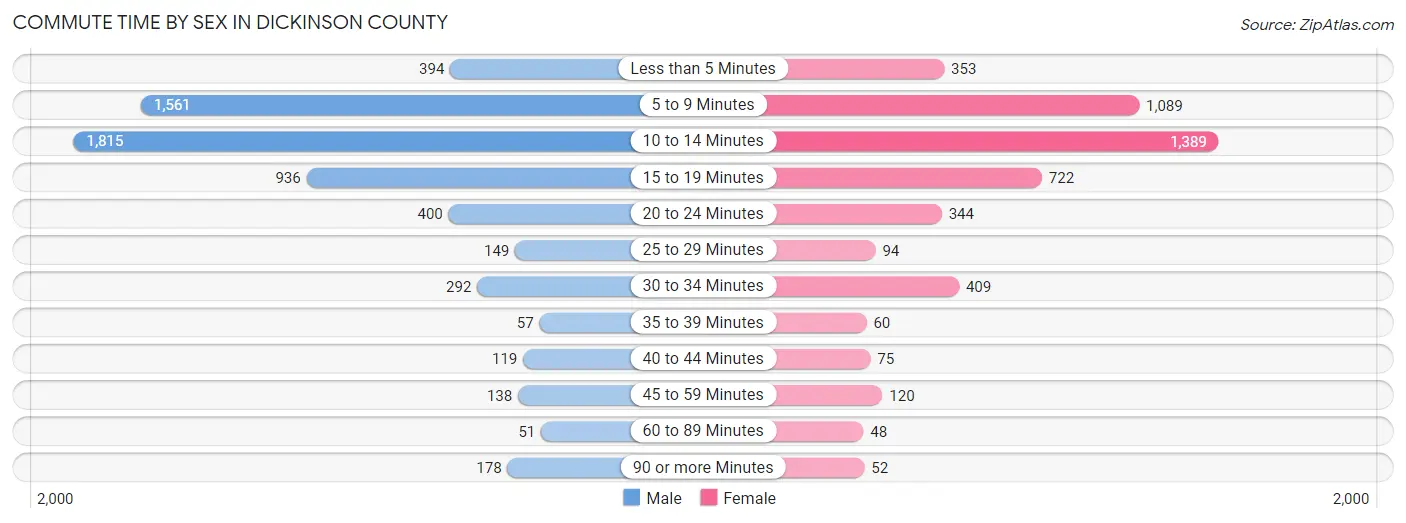
| Commute Time | Male | Female |
| Less than 5 Minutes | 394 (6.5%) | 353 (7.4%) |
| 5 to 9 Minutes | 1,561 (25.6%) | 1,089 (22.9%) |
| 10 to 14 Minutes | 1,815 (29.8%) | 1,389 (29.2%) |
| 15 to 19 Minutes | 936 (15.4%) | 722 (15.2%) |
| 20 to 24 Minutes | 400 (6.6%) | 344 (7.2%) |
| 25 to 29 Minutes | 149 (2.5%) | 94 (2.0%) |
| 30 to 34 Minutes | 292 (4.8%) | 409 (8.6%) |
| 35 to 39 Minutes | 57 (0.9%) | 60 (1.3%) |
| 40 to 44 Minutes | 119 (1.9%) | 75 (1.6%) |
| 45 to 59 Minutes | 138 (2.3%) | 120 (2.5%) |
| 60 to 89 Minutes | 51 (0.8%) | 48 (1.0%) |
| 90 or more Minutes | 178 (2.9%) | 52 (1.1%) |
Time of Departure to Work by Sex in Dickinson County
The most frequent times of departure to work in Dickinson County are 7:30 AM to 7:59 AM (899, 14.8%) for males and 7:30 AM to 7:59 AM (932, 19.6%) for females.
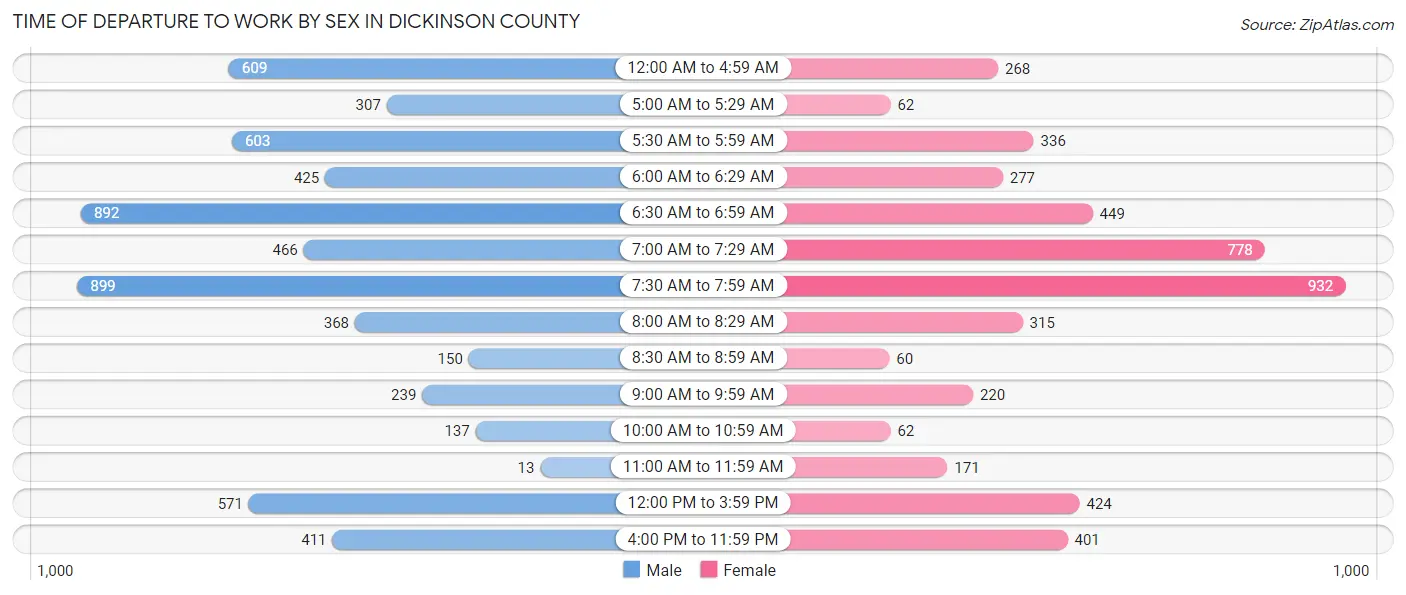
| Time of Departure | Male | Female |
| 12:00 AM to 4:59 AM | 609 (10.0%) | 268 (5.6%) |
| 5:00 AM to 5:29 AM | 307 (5.0%) | 62 (1.3%) |
| 5:30 AM to 5:59 AM | 603 (9.9%) | 336 (7.1%) |
| 6:00 AM to 6:29 AM | 425 (7.0%) | 277 (5.8%) |
| 6:30 AM to 6:59 AM | 892 (14.6%) | 449 (9.4%) |
| 7:00 AM to 7:29 AM | 466 (7.6%) | 778 (16.4%) |
| 7:30 AM to 7:59 AM | 899 (14.8%) | 932 (19.6%) |
| 8:00 AM to 8:29 AM | 368 (6.0%) | 315 (6.6%) |
| 8:30 AM to 8:59 AM | 150 (2.5%) | 60 (1.3%) |
| 9:00 AM to 9:59 AM | 239 (3.9%) | 220 (4.6%) |
| 10:00 AM to 10:59 AM | 137 (2.2%) | 62 (1.3%) |
| 11:00 AM to 11:59 AM | 13 (0.2%) | 171 (3.6%) |
| 12:00 PM to 3:59 PM | 571 (9.4%) | 424 (8.9%) |
| 4:00 PM to 11:59 PM | 411 (6.8%) | 401 (8.4%) |
| Total | 6,090 (100.0%) | 4,755 (100.0%) |
Housing Occupancy in Dickinson County
Occupancy by Ownership in Dickinson County
Of the total 11,560 dwellings in Dickinson County, owner-occupied units account for 9,617 (83.2%), while renter-occupied units make up 1,943 (16.8%).
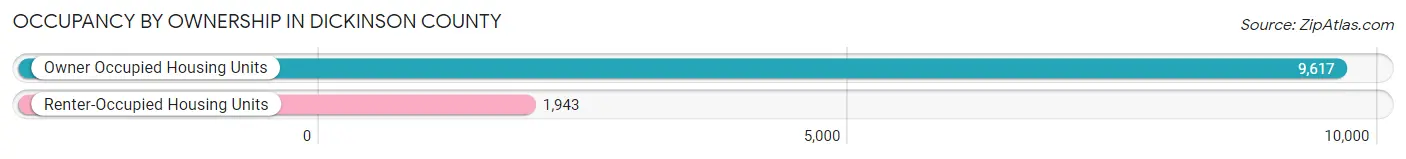
| Occupancy | # Housing Units | % Housing Units |
| Owner Occupied Housing Units | 9,617 | 83.2% |
| Renter-Occupied Housing Units | 1,943 | 16.8% |
| Total Occupied Housing Units | 11,560 | 100.0% |
Occupancy by Household Size in Dickinson County

| Household Size | # Housing Units | % Housing Units |
| 1-Person Household | 3,595 | 31.1% |
| 2-Person Household | 4,854 | 42.0% |
| 3-Person Household | 1,288 | 11.1% |
| 4+ Person Household | 1,823 | 15.8% |
| Total Housing Units | 11,560 | 100.0% |
Occupancy by Ownership by Household Size in Dickinson County
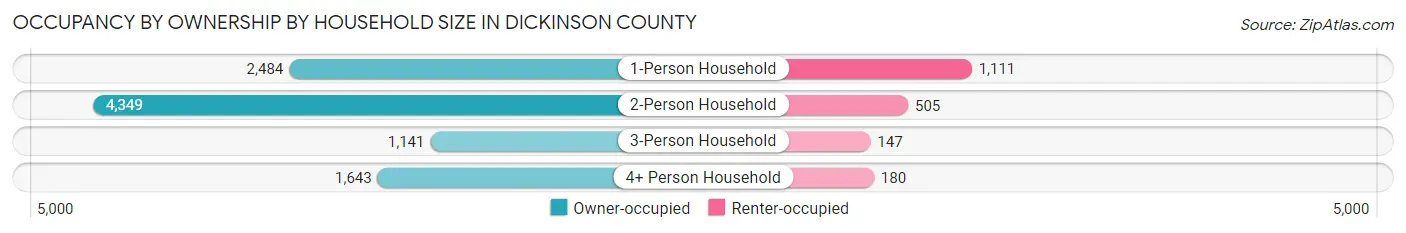
| Household Size | Owner-occupied | Renter-occupied |
| 1-Person Household | 2,484 (69.1%) | 1,111 (30.9%) |
| 2-Person Household | 4,349 (89.6%) | 505 (10.4%) |
| 3-Person Household | 1,141 (88.6%) | 147 (11.4%) |
| 4+ Person Household | 1,643 (90.1%) | 180 (9.9%) |
| Total Housing Units | 9,617 (83.2%) | 1,943 (16.8%) |
Occupancy by Educational Attainment in Dickinson County
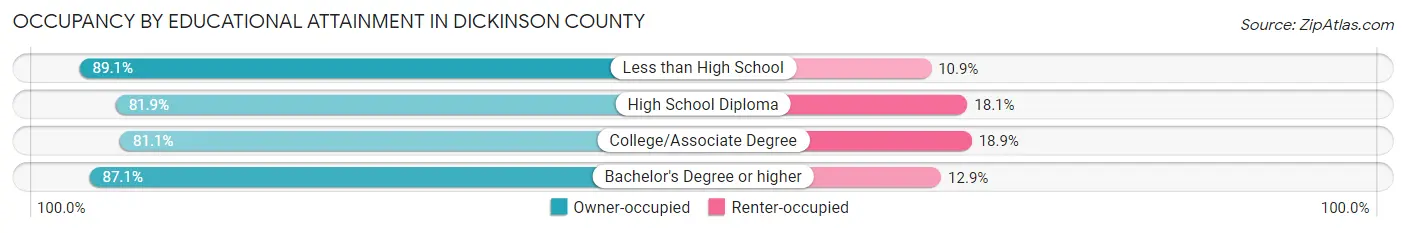
| Household Size | Owner-occupied | Renter-occupied |
| Less than High School | 433 (89.1%) | 53 (10.9%) |
| High School Diploma | 2,886 (81.9%) | 637 (18.1%) |
| College/Associate Degree | 3,754 (81.1%) | 877 (18.9%) |
| Bachelor's Degree or higher | 2,544 (87.1%) | 376 (12.9%) |
Occupancy by Age of Householder in Dickinson County

| Age Bracket | # Households | % Households |
| Under 35 Years | 1,541 | 13.3% |
| 35 to 44 Years | 1,699 | 14.7% |
| 45 to 54 Years | 1,627 | 14.1% |
| 55 to 64 Years | 2,699 | 23.4% |
| 65 to 74 Years | 2,124 | 18.4% |
| 75 to 84 Years | 1,252 | 10.8% |
| 85 Years and Over | 618 | 5.3% |
| Total | 11,560 | 100.0% |
Housing Finances in Dickinson County
Median Income by Occupancy in Dickinson County
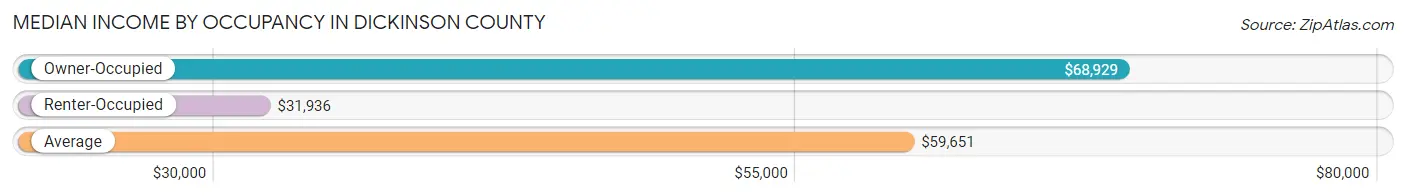
| Occupancy Type | # Households | Median Income |
| Owner-Occupied | 9,617 (83.2%) | $68,929 |
| Renter-Occupied | 1,943 (16.8%) | $31,936 |
| Average | 11,560 (100.0%) | $59,651 |
Occupancy by Householder Income Bracket in Dickinson County
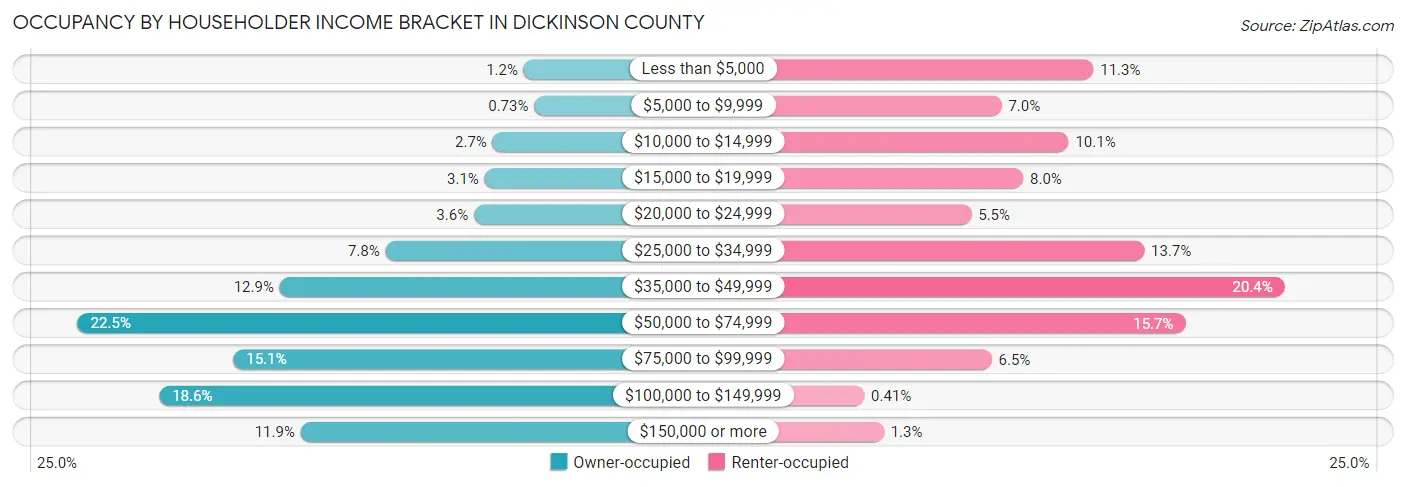
| Income Bracket | Owner-occupied | Renter-occupied |
| Less than $5,000 | 118 (1.2%) | 220 (11.3%) |
| $5,000 to $9,999 | 70 (0.7%) | 135 (7.0%) |
| $10,000 to $14,999 | 261 (2.7%) | 197 (10.1%) |
| $15,000 to $19,999 | 297 (3.1%) | 155 (8.0%) |
| $20,000 to $24,999 | 346 (3.6%) | 107 (5.5%) |
| $25,000 to $34,999 | 751 (7.8%) | 267 (13.7%) |
| $35,000 to $49,999 | 1,236 (12.9%) | 397 (20.4%) |
| $50,000 to $74,999 | 2,162 (22.5%) | 305 (15.7%) |
| $75,000 to $99,999 | 1,448 (15.1%) | 126 (6.5%) |
| $100,000 to $149,999 | 1,788 (18.6%) | 8 (0.4%) |
| $150,000 or more | 1,140 (11.8%) | 26 (1.3%) |
| Total | 9,617 (100.0%) | 1,943 (100.0%) |
Monthly Housing Cost Tiers in Dickinson County

| Monthly Cost | Owner-occupied | Renter-occupied |
| Less than $300 | 766 (8.0%) | 113 (5.8%) |
| $300 to $499 | 1,842 (19.2%) | 261 (13.4%) |
| $500 to $799 | 2,933 (30.5%) | 774 (39.8%) |
| $800 to $999 | 1,161 (12.1%) | 302 (15.5%) |
| $1,000 to $1,499 | 1,784 (18.5%) | 173 (8.9%) |
| $1,500 to $1,999 | 768 (8.0%) | 24 (1.2%) |
| $2,000 to $2,499 | 119 (1.2%) | 68 (3.5%) |
| $2,500 to $2,999 | 45 (0.5%) | 42 (2.2%) |
| $3,000 or more | 199 (2.1%) | 11 (0.6%) |
| Total | 9,617 (100.0%) | 1,943 (100.0%) |
Physical Housing Characteristics in Dickinson County
Housing Structures in Dickinson County
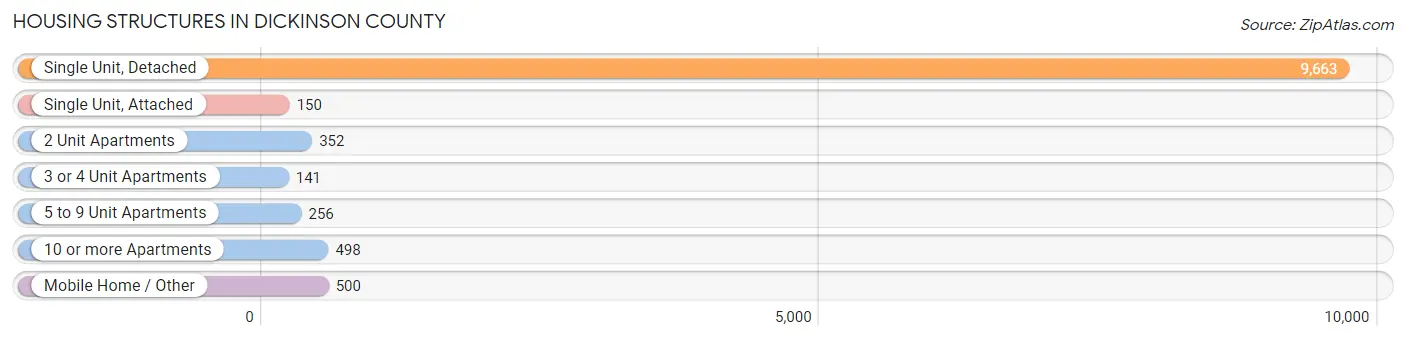
| Structure Type | # Housing Units | % Housing Units |
| Single Unit, Detached | 9,663 | 83.6% |
| Single Unit, Attached | 150 | 1.3% |
| 2 Unit Apartments | 352 | 3.0% |
| 3 or 4 Unit Apartments | 141 | 1.2% |
| 5 to 9 Unit Apartments | 256 | 2.2% |
| 10 or more Apartments | 498 | 4.3% |
| Mobile Home / Other | 500 | 4.3% |
| Total | 11,560 | 100.0% |
Housing Structures by Occupancy in Dickinson County
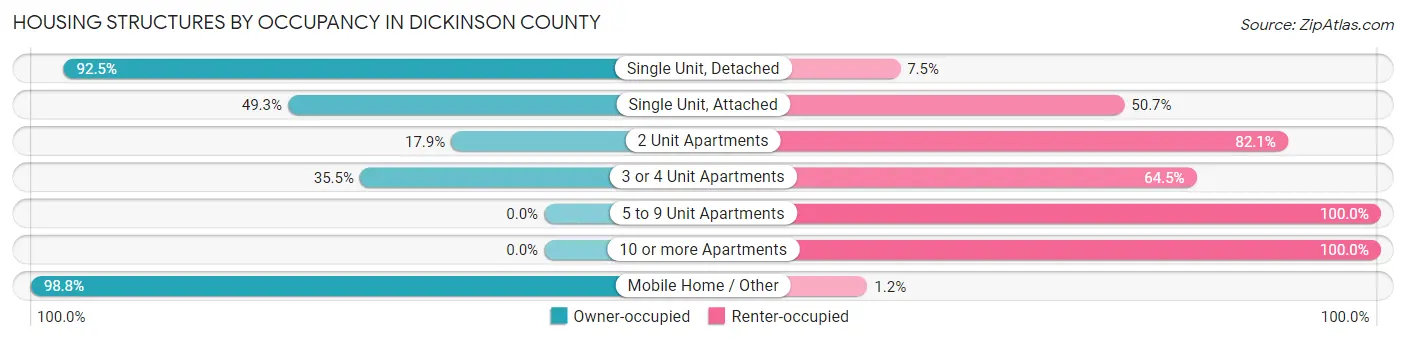
| Structure Type | Owner-occupied | Renter-occupied |
| Single Unit, Detached | 8,936 (92.5%) | 727 (7.5%) |
| Single Unit, Attached | 74 (49.3%) | 76 (50.7%) |
| 2 Unit Apartments | 63 (17.9%) | 289 (82.1%) |
| 3 or 4 Unit Apartments | 50 (35.5%) | 91 (64.5%) |
| 5 to 9 Unit Apartments | 0 (0.0%) | 256 (100.0%) |
| 10 or more Apartments | 0 (0.0%) | 498 (100.0%) |
| Mobile Home / Other | 494 (98.8%) | 6 (1.2%) |
| Total | 9,617 (83.2%) | 1,943 (16.8%) |
Housing Structures by Number of Rooms in Dickinson County
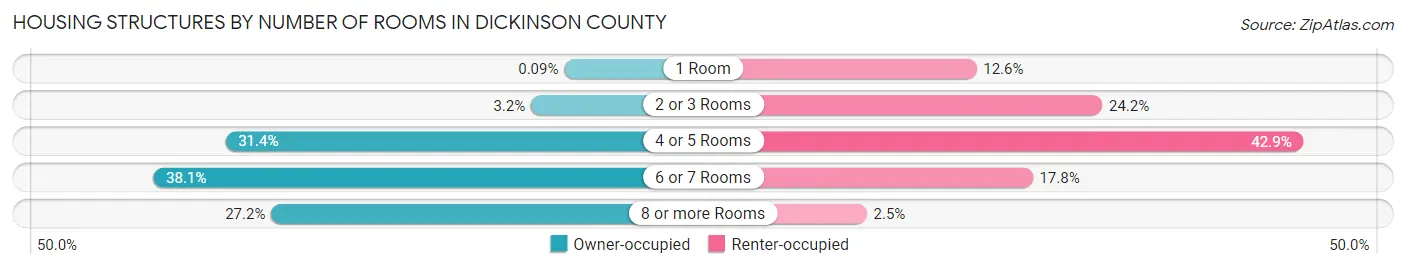
| Number of Rooms | Owner-occupied | Renter-occupied |
| 1 Room | 9 (0.1%) | 245 (12.6%) |
| 2 or 3 Rooms | 304 (3.2%) | 471 (24.2%) |
| 4 or 5 Rooms | 3,024 (31.4%) | 833 (42.9%) |
| 6 or 7 Rooms | 3,665 (38.1%) | 346 (17.8%) |
| 8 or more Rooms | 2,615 (27.2%) | 48 (2.5%) |
| Total | 9,617 (100.0%) | 1,943 (100.0%) |
Housing Structure by Heating Type in Dickinson County
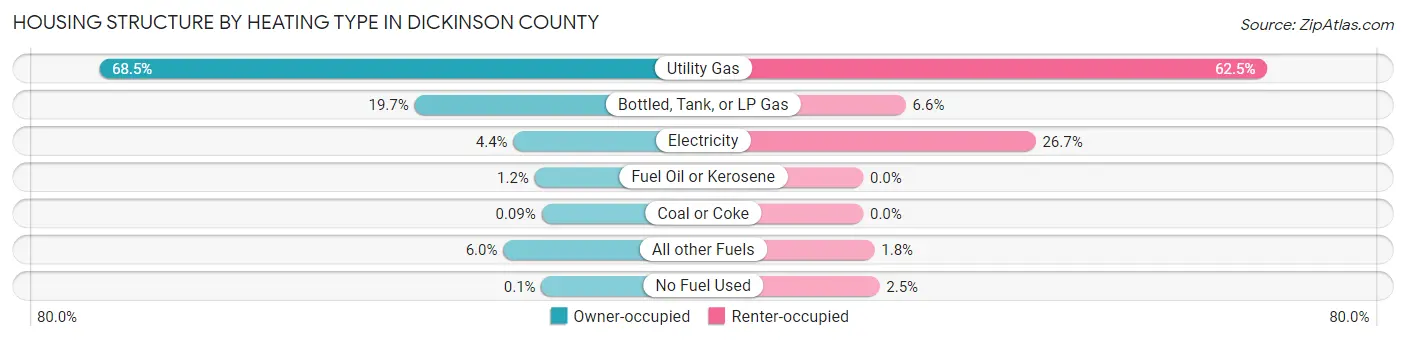
| Heating Type | Owner-occupied | Renter-occupied |
| Utility Gas | 6,588 (68.5%) | 1,214 (62.5%) |
| Bottled, Tank, or LP Gas | 1,896 (19.7%) | 128 (6.6%) |
| Electricity | 426 (4.4%) | 518 (26.7%) |
| Fuel Oil or Kerosene | 111 (1.1%) | 0 (0.0%) |
| Coal or Coke | 9 (0.1%) | 0 (0.0%) |
| All other Fuels | 577 (6.0%) | 34 (1.8%) |
| No Fuel Used | 10 (0.1%) | 49 (2.5%) |
| Total | 9,617 (100.0%) | 1,943 (100.0%) |
Household Vehicle Usage in Dickinson County
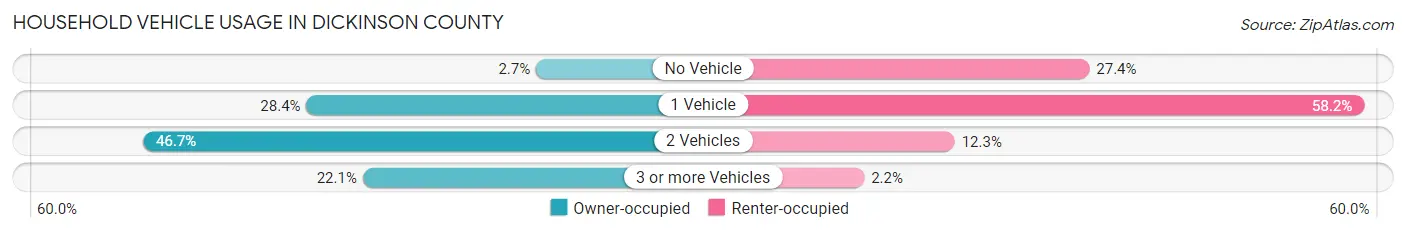
| Vehicles per Household | Owner-occupied | Renter-occupied |
| No Vehicle | 261 (2.7%) | 532 (27.4%) |
| 1 Vehicle | 2,734 (28.4%) | 1,130 (58.2%) |
| 2 Vehicles | 4,495 (46.7%) | 239 (12.3%) |
| 3 or more Vehicles | 2,127 (22.1%) | 42 (2.2%) |
| Total | 9,617 (100.0%) | 1,943 (100.0%) |
Real Estate & Mortgages in Dickinson County
Real Estate and Mortgage Overview in Dickinson County
| Characteristic | Without Mortgage | With Mortgage |
| Housing Units | 4,692 | 4,925 |
| Median Property Value | $123,300 | $122,200 |
| Median Household Income | $56,230 | $683 |
| Monthly Housing Costs | $480 | $199 |
| Real Estate Taxes | $1,714 | $106 |
Property Value by Mortgage Status in Dickinson County

| Property Value | Without Mortgage | With Mortgage |
| Less than $50,000 | 831 (17.7%) | 340 (6.9%) |
| $50,000 to $99,999 | 1,209 (25.8%) | 1,514 (30.7%) |
| $100,000 to $299,999 | 2,077 (44.3%) | 2,575 (52.3%) |
| $300,000 to $499,999 | 377 (8.0%) | 336 (6.8%) |
| $500,000 to $749,999 | 138 (2.9%) | 148 (3.0%) |
| $750,000 to $999,999 | 7 (0.2%) | 0 (0.0%) |
| $1,000,000 or more | 53 (1.1%) | 12 (0.2%) |
| Total | 4,692 (100.0%) | 4,925 (100.0%) |
Household Income by Mortgage Status in Dickinson County
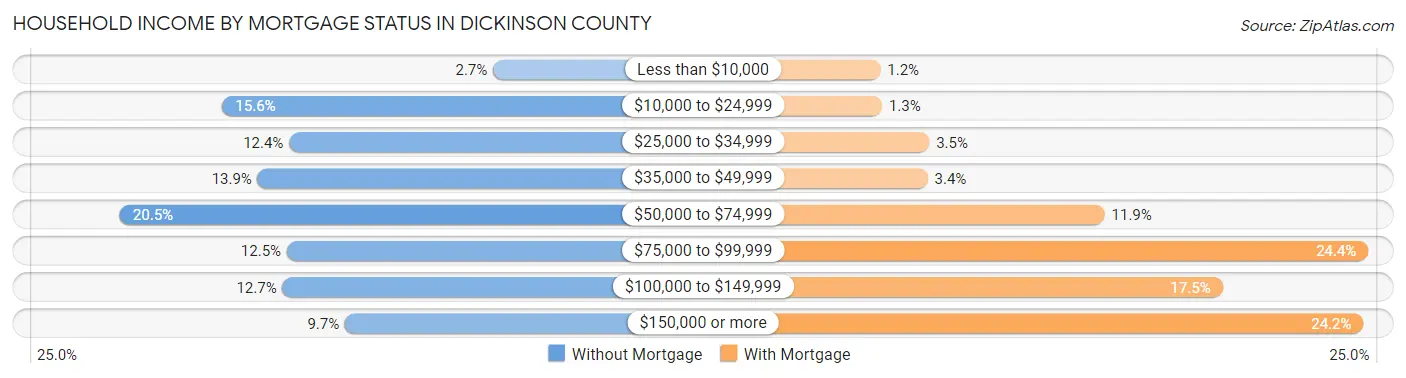
| Household Income | Without Mortgage | With Mortgage |
| Less than $10,000 | 126 (2.7%) | 58 (1.2%) |
| $10,000 to $24,999 | 731 (15.6%) | 62 (1.3%) |
| $25,000 to $34,999 | 582 (12.4%) | 173 (3.5%) |
| $35,000 to $49,999 | 652 (13.9%) | 169 (3.4%) |
| $50,000 to $74,999 | 960 (20.5%) | 584 (11.9%) |
| $75,000 to $99,999 | 587 (12.5%) | 1,202 (24.4%) |
| $100,000 to $149,999 | 597 (12.7%) | 861 (17.5%) |
| $150,000 or more | 457 (9.7%) | 1,191 (24.2%) |
| Total | 4,692 (100.0%) | 4,925 (100.0%) |
Property Value to Household Income Ratio in Dickinson County

| Value-to-Income Ratio | Without Mortgage | With Mortgage |
| Less than 2.0x | 2,319 (49.4%) | 84,281 (1,711.3%) |
| 2.0x to 2.9x | 747 (15.9%) | 3,043 (61.8%) |
| 3.0x to 3.9x | 356 (7.6%) | 971 (19.7%) |
| 4.0x or more | 1,260 (26.9%) | 273 (5.5%) |
| Total | 4,692 (100.0%) | 4,925 (100.0%) |
Real Estate Taxes by Mortgage Status in Dickinson County
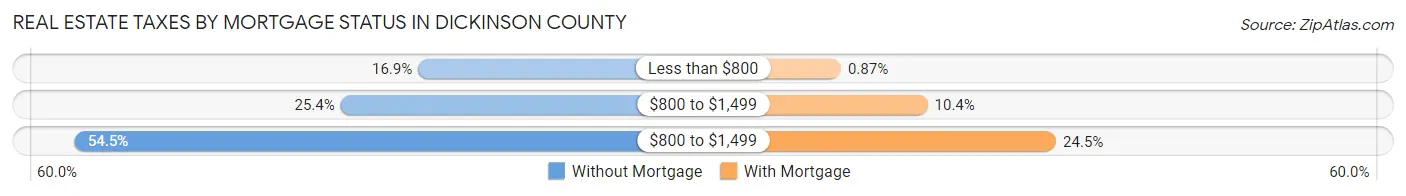
| Property Taxes | Without Mortgage | With Mortgage |
| Less than $800 | 792 (16.9%) | 43 (0.9%) |
| $800 to $1,499 | 1,191 (25.4%) | 510 (10.4%) |
| $800 to $1,499 | 2,556 (54.5%) | 1,204 (24.4%) |
| Total | 4,692 (100.0%) | 4,925 (100.0%) |
Health & Disability in Dickinson County
Health Insurance Coverage by Age in Dickinson County
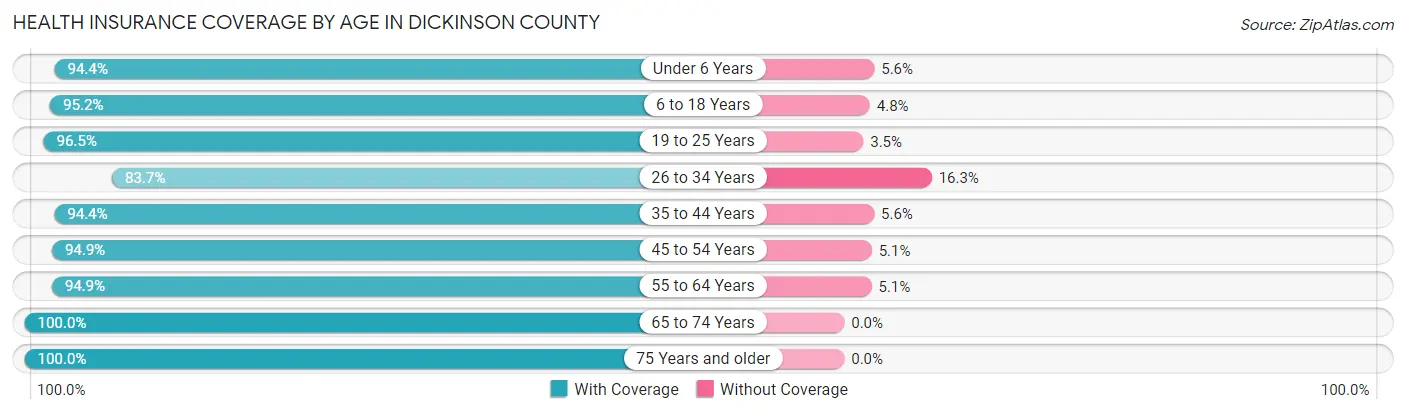
| Age Bracket | With Coverage | Without Coverage |
| Under 6 Years | 1,469 (94.4%) | 87 (5.6%) |
| 6 to 18 Years | 3,536 (95.2%) | 177 (4.8%) |
| 19 to 25 Years | 1,855 (96.5%) | 68 (3.5%) |
| 26 to 34 Years | 1,972 (83.7%) | 384 (16.3%) |
| 35 to 44 Years | 2,719 (94.4%) | 160 (5.6%) |
| 45 to 54 Years | 2,934 (94.9%) | 158 (5.1%) |
| 55 to 64 Years | 4,076 (94.9%) | 218 (5.1%) |
| 65 to 74 Years | 3,370 (100.0%) | 0 (0.0%) |
| 75 Years and older | 2,464 (100.0%) | 0 (0.0%) |
| Total | 24,395 (95.1%) | 1,252 (4.9%) |
Health Insurance Coverage by Citizenship Status in Dickinson County
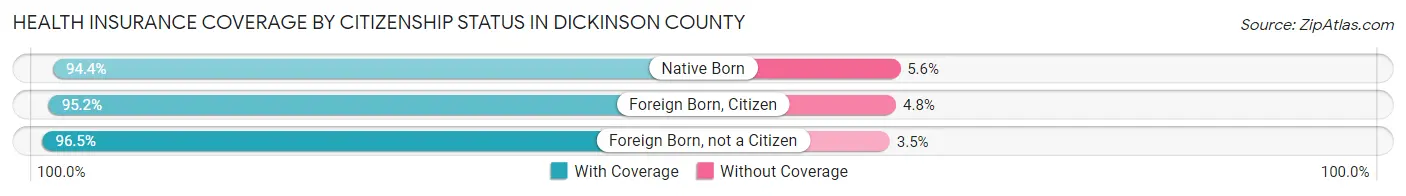
| Citizenship Status | With Coverage | Without Coverage |
| Native Born | 1,469 (94.4%) | 87 (5.6%) |
| Foreign Born, Citizen | 3,536 (95.2%) | 177 (4.8%) |
| Foreign Born, not a Citizen | 1,855 (96.5%) | 68 (3.5%) |
Health Insurance Coverage by Household Income in Dickinson County
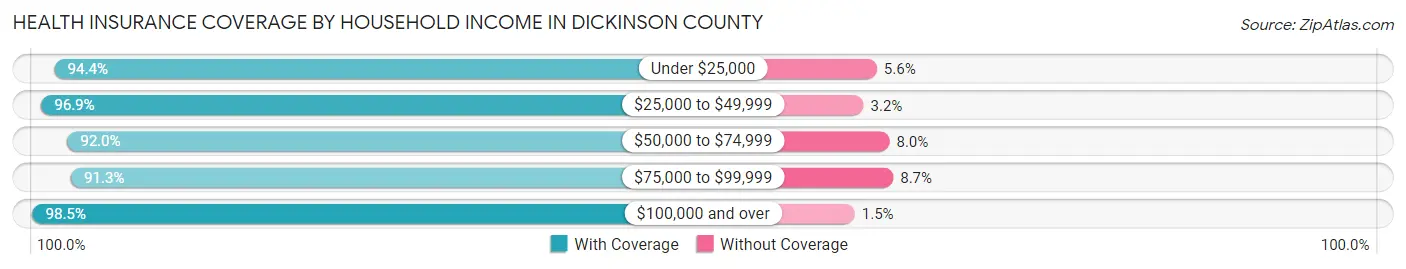
| Household Income | With Coverage | Without Coverage |
| Under $25,000 | 2,592 (94.4%) | 155 (5.6%) |
| $25,000 to $49,999 | 4,640 (96.9%) | 151 (3.2%) |
| $50,000 to $74,999 | 4,924 (92.0%) | 429 (8.0%) |
| $75,000 to $99,999 | 3,857 (91.3%) | 368 (8.7%) |
| $100,000 and over | 8,294 (98.5%) | 127 (1.5%) |
Public vs Private Health Insurance Coverage by Age in Dickinson County
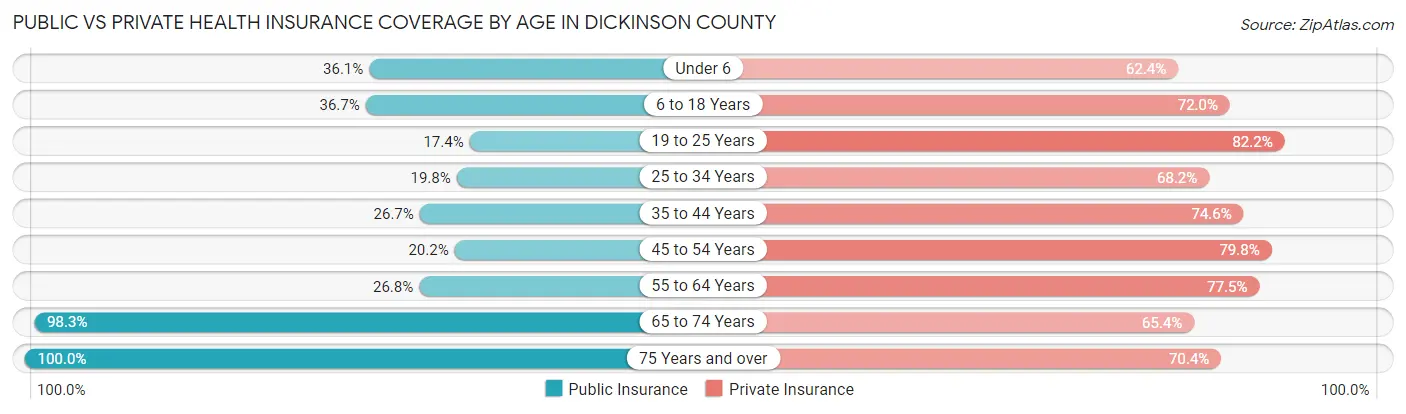
| Age Bracket | Public Insurance | Private Insurance |
| Under 6 | 561 (36.0%) | 971 (62.4%) |
| 6 to 18 Years | 1,363 (36.7%) | 2,674 (72.0%) |
| 19 to 25 Years | 335 (17.4%) | 1,580 (82.2%) |
| 25 to 34 Years | 467 (19.8%) | 1,606 (68.2%) |
| 35 to 44 Years | 768 (26.7%) | 2,147 (74.6%) |
| 45 to 54 Years | 625 (20.2%) | 2,466 (79.7%) |
| 55 to 64 Years | 1,150 (26.8%) | 3,328 (77.5%) |
| 65 to 74 Years | 3,311 (98.3%) | 2,204 (65.4%) |
| 75 Years and over | 2,464 (100.0%) | 1,735 (70.4%) |
| Total | 11,044 (43.1%) | 18,711 (73.0%) |
Disability Status by Sex by Age in Dickinson County
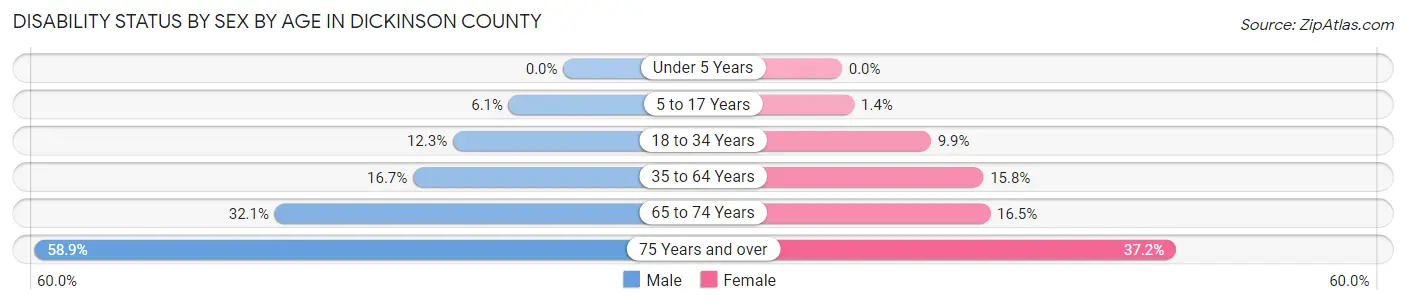
| Age Bracket | Male | Female |
| Under 5 Years | 0 (0.0%) | 0 (0.0%) |
| 5 to 17 Years | 122 (6.1%) | 25 (1.4%) |
| 18 to 34 Years | 294 (12.3%) | 202 (9.9%) |
| 35 to 64 Years | 875 (16.7%) | 793 (15.8%) |
| 65 to 74 Years | 550 (32.1%) | 274 (16.5%) |
| 75 Years and over | 605 (58.9%) | 535 (37.2%) |
Disability Class by Sex by Age in Dickinson County
Disability Class: Hearing Difficulty
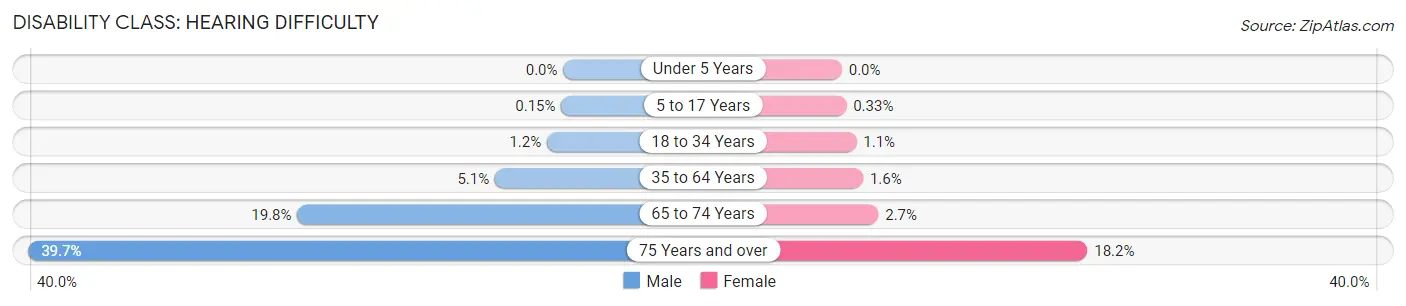
| Age Bracket | Male | Female |
| Under 5 Years | 0 (0.0%) | 0 (0.0%) |
| 5 to 17 Years | 3 (0.2%) | 6 (0.3%) |
| 18 to 34 Years | 29 (1.2%) | 22 (1.1%) |
| 35 to 64 Years | 265 (5.1%) | 79 (1.6%) |
| 65 to 74 Years | 338 (19.8%) | 45 (2.7%) |
| 75 Years and over | 408 (39.7%) | 262 (18.2%) |
Disability Class: Vision Difficulty

| Age Bracket | Male | Female |
| Under 5 Years | 0 (0.0%) | 0 (0.0%) |
| 5 to 17 Years | 6 (0.3%) | 8 (0.4%) |
| 18 to 34 Years | 34 (1.4%) | 4 (0.2%) |
| 35 to 64 Years | 122 (2.3%) | 21 (0.4%) |
| 65 to 74 Years | 81 (4.7%) | 46 (2.8%) |
| 75 Years and over | 84 (8.2%) | 76 (5.3%) |
Disability Class: Cognitive Difficulty
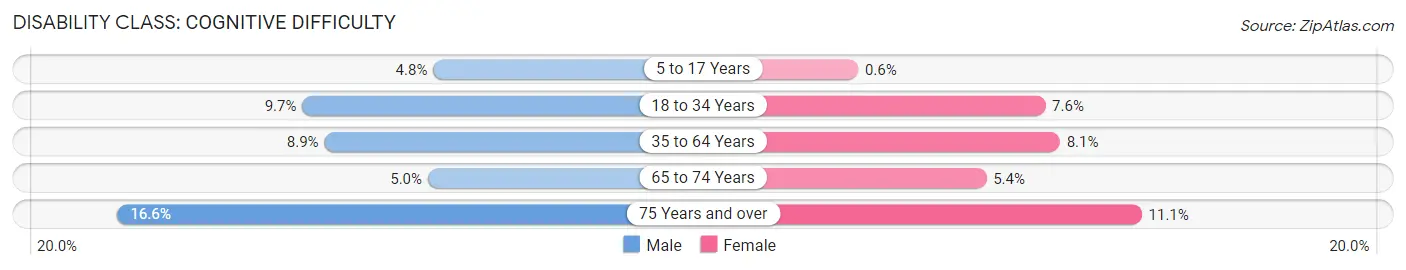
| Age Bracket | Male | Female |
| 5 to 17 Years | 97 (4.8%) | 11 (0.6%) |
| 18 to 34 Years | 232 (9.7%) | 154 (7.5%) |
| 35 to 64 Years | 464 (8.9%) | 407 (8.1%) |
| 65 to 74 Years | 86 (5.0%) | 89 (5.4%) |
| 75 Years and over | 170 (16.6%) | 160 (11.1%) |
Disability Class: Ambulatory Difficulty

| Age Bracket | Male | Female |
| 5 to 17 Years | 16 (0.8%) | 0 (0.0%) |
| 18 to 34 Years | 34 (1.4%) | 38 (1.9%) |
| 35 to 64 Years | 442 (8.5%) | 387 (7.7%) |
| 65 to 74 Years | 208 (12.2%) | 165 (10.0%) |
| 75 Years and over | 319 (31.1%) | 303 (21.1%) |
Disability Class: Self-Care Difficulty
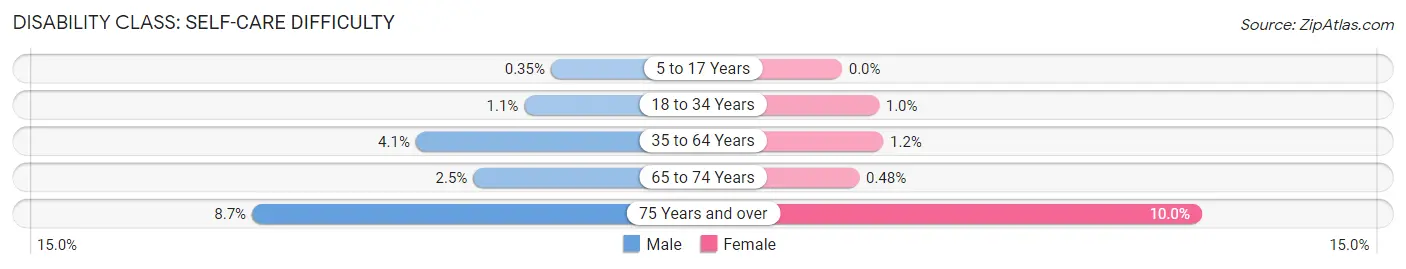
| Age Bracket | Male | Female |
| 5 to 17 Years | 7 (0.4%) | 0 (0.0%) |
| 18 to 34 Years | 26 (1.1%) | 21 (1.0%) |
| 35 to 64 Years | 215 (4.1%) | 58 (1.1%) |
| 65 to 74 Years | 43 (2.5%) | 8 (0.5%) |
| 75 Years and over | 89 (8.7%) | 144 (10.0%) |
Technology Access in Dickinson County
Computing Device Access in Dickinson County

| Device Type | # Households | % Households |
| Desktop or Laptop | 8,344 | 72.2% |
| Smartphone | 9,251 | 80.0% |
| Tablet | 7,072 | 61.2% |
| No Computing Device | 1,046 | 9.0% |
| Total | 11,560 | 100.0% |
Internet Access in Dickinson County
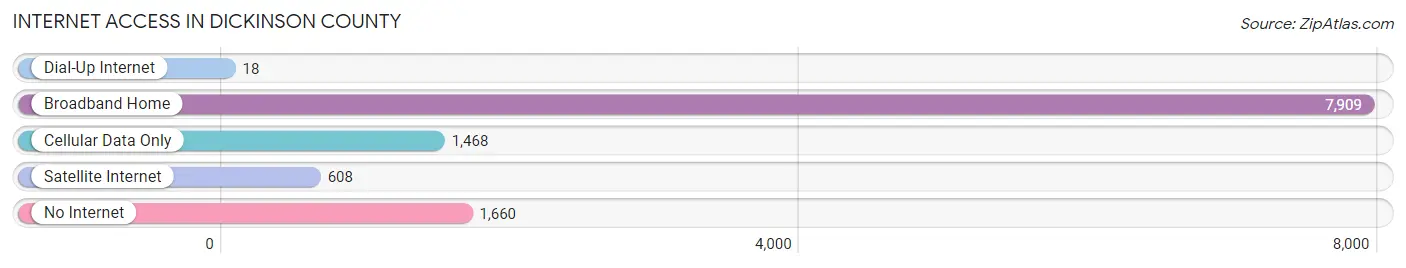
| Internet Type | # Households | % Households |
| Dial-Up Internet | 18 | 0.2% |
| Broadband Home | 7,909 | 68.4% |
| Cellular Data Only | 1,468 | 12.7% |
| Satellite Internet | 608 | 5.3% |
| No Internet | 1,660 | 14.4% |
| Total | 11,560 | 100.0% |
Dickinson County Summary
Dickinson County is located in the Upper Peninsula of Michigan, and is bordered by Menominee County to the north, Iron County to the east, Delta County to the south, and Marquette County to the west. The county seat is Iron Mountain, and the county has a total area of 576 square miles.
History
The area that is now Dickinson County was originally inhabited by the Ojibwe people. The first European settlers arrived in the area in the early 1800s, and the county was officially organized in 1891. The county was named after Donald M. Dickinson, who served as Postmaster General under President Grover Cleveland.
Geography
Dickinson County is located in the Upper Peninsula of Michigan, and is bordered by Menominee County to the north, Iron County to the east, Delta County to the south, and Marquette County to the west. The county seat is Iron Mountain, and the county has a total area of 576 square miles. The terrain is mostly rolling hills and forests, with the highest point being in the Menominee Range at 1,945 feet. The county is home to several lakes, including Lake Antoine, Lake Mary, and Lake Louise.
Economy
The economy of Dickinson County is largely based on tourism and natural resources. The county is home to several state parks, including Van Riper State Park, which is a popular destination for camping, fishing, and hiking. The county is also home to several ski resorts, including Pine Mountain Ski Resort and Ski Brule. The county is also home to several mines, including the Empire Mine, which is the largest iron ore mine in the United States.
Demographics
As of the 2010 census, Dickinson County had a population of 26,168. The racial makeup of the county was 94.3% White, 0.7% African American, 1.3% Native American, 0.4% Asian, 0.1% Pacific Islander, 1.2% from other races, and 2.1% from two or more races. Hispanic or Latino of any race were 3.2% of the population.
The median income for a household in the county was $41,945, and the median income for a family was $50,945. The per capita income for the county was $20,945. About 11.2% of families and 14.7% of the population were below the poverty line, including 19.2% of those under age 18 and 8.2% of those age 65 or over.
Common Questions
What is the Total Population of Dickinson County?
Total Population of Dickinson County is 25,937.
What is the Total Male Population of Dickinson County?
Total Male Population of Dickinson County is 13,219.
What is the Total Female Population of Dickinson County?
Total Female Population of Dickinson County is 12,718.
What is the Ratio of Males per 100 Females in Dickinson County?
There are 103.94 Males per 100 Females in Dickinson County.
What is the Ratio of Females per 100 Males in Dickinson County?
There are 96.21 Females per 100 Males in Dickinson County.
What is the Median Population Age in Dickinson County?
Median Population Age in Dickinson County is 47.2 Years.
What is the Average Family Size in Dickinson County
Average Family Size in Dickinson County is 2.7 People.
What is the Average Household Size in Dickinson County
Average Household Size in Dickinson County is 2.2 People.
What is Per Capita Income in Dickinson County?
Per Capita income in Dickinson County is $35,722.
What is the Median Family Income in Dickinson County?
Median Family Income in Dickinson County is $75,121.
What is the Median Household income in Dickinson County?
Median Household Income in Dickinson County is $59,651.
What is Income or Wage Gap in Dickinson County?
Income or Wage Gap in Dickinson County is 39.9%.
Women in Dickinson County earn 60.1 cents for every dollar earned by a man.
What is Family Income Deficit in Dickinson County?
Family Income Deficit in Dickinson County is $7,418.
Families that are below poverty line in Dickinson County earn $7,418 less on average than the poverty threshold level.
What is Inequality or Gini Index in Dickinson County?
Inequality or Gini Index in Dickinson County is 0.43.
How Large is the Labor Force in Dickinson County?
There are 12,349 People in the Labor Forcein in Dickinson County.
What is the Percentage of People in the Labor Force in Dickinson County?
57.4% of People are in the Labor Force in Dickinson County.
What is the Unemployment Rate in Dickinson County?
Unemployment Rate in Dickinson County is 3.8%.