Delta County, MI
Delta County Overview
36,839
TOTAL POPULATION
18,645
MALE POPULATION
18,194
FEMALE POPULATION
102.48
MALES / 100 FEMALES
97.58
FEMALES / 100 MALES
47.6
MEDIAN AGE
2.8
AVG FAMILY SIZE
2.3
AVG HOUSEHOLD SIZE
$32,311
PER CAPITA INCOME
$72,385
AVG FAMILY INCOME
$53,852
AVG HOUSEHOLD INCOME
41.5%
WAGE / INCOME GAP [ % ]
58.5¢/ $1
WAGE / INCOME GAP [ $ ]
$10,416
FAMILY INCOME DEFICIT
0.45
INEQUALITY / GINI INDEX
15,908
LABOR FORCE [ PEOPLE ]
51.7%
PERCENT IN LABOR FORCE
5.2%
UNEMPLOYMENT RATE
Delta County Area Codes
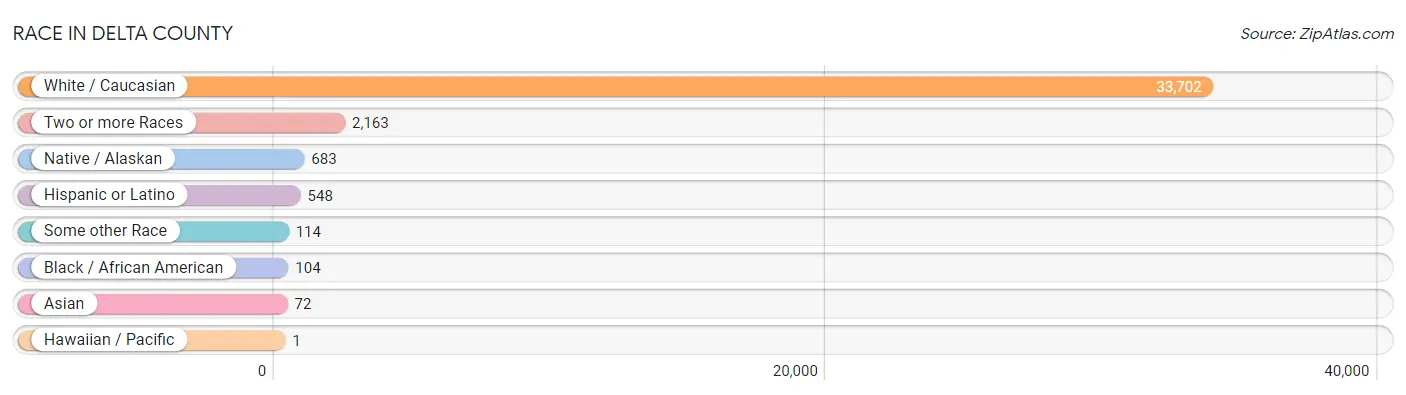
Race in Delta County
The most populous races in Delta County are White / Caucasian (33,702 | 91.5%), Two or more Races (2,163 | 5.9%), and Native / Alaskan (683 | 1.8%).
| Race | # Population | % Population |
| Asian | 72 | 0.2% |
| Black / African American | 104 | 0.3% |
| Hawaiian / Pacific | 1 | 0.0% |
| Hispanic or Latino | 548 | 1.5% |
| Native / Alaskan | 683 | 1.8% |
| White / Caucasian | 33,702 | 91.5% |
| Two or more Races | 2,163 | 5.9% |
| Some other Race | 114 | 0.3% |
| Total | 36,839 | 100.0% |
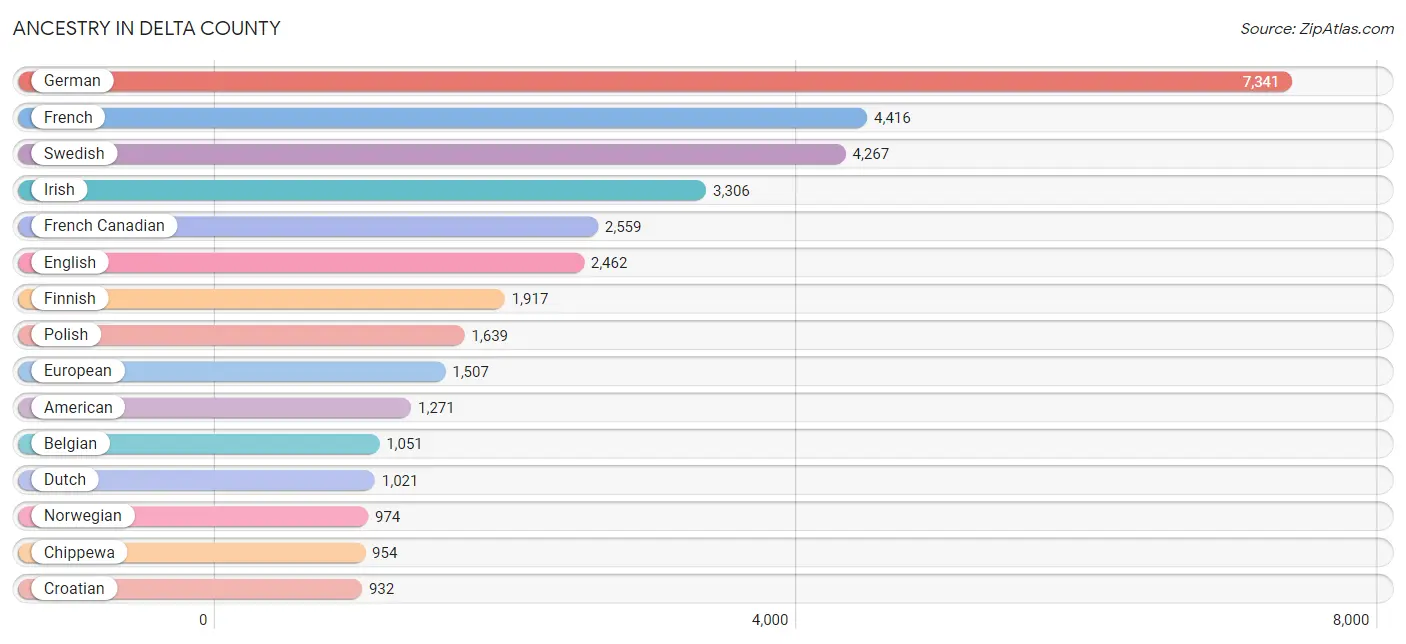
Ancestry in Delta County
The most populous ancestries reported in Delta County are German (7,341 | 19.9%), French (4,416 | 12.0%), Swedish (4,267 | 11.6%), Irish (3,306 | 9.0%), and French Canadian (2,559 | 7.0%), together accounting for 59.4% of all Delta County residents.
| Ancestry | # Population | % Population |
| African | 10 | 0.0% |
| American | 1,271 | 3.5% |
| Arab | 48 | 0.1% |
| Armenian | 4 | 0.0% |
| Australian | 13 | 0.0% |
| Austrian | 53 | 0.1% |
| Bangladeshi | 7 | 0.0% |
| Belgian | 1,051 | 2.9% |
| Bhutanese | 94 | 0.3% |
| Blackfeet | 73 | 0.2% |
| British | 56 | 0.2% |
| Burmese | 43 | 0.1% |
| Canadian | 40 | 0.1% |
| Celtic | 5 | 0.0% |
| Central American | 4 | 0.0% |
| Cherokee | 18 | 0.1% |
| Chippewa | 954 | 2.6% |
| Choctaw | 2 | 0.0% |
| Creek | 21 | 0.1% |
| Croatian | 932 | 2.5% |
| Cuban | 56 | 0.2% |
| Czech | 197 | 0.5% |
| Czechoslovakian | 8 | 0.0% |
| Danish | 182 | 0.5% |
| Dutch | 1,021 | 2.8% |
| Eastern European | 149 | 0.4% |
| English | 2,462 | 6.7% |
| Estonian | 3 | 0.0% |
| European | 1,507 | 4.1% |
| Filipino | 2 | 0.0% |
| Finnish | 1,917 | 5.2% |
| French | 4,416 | 12.0% |
| French American Indian | 55 | 0.2% |
| French Canadian | 2,559 | 7.0% |
| German | 7,341 | 19.9% |
| Greek | 60 | 0.2% |
| Honduran | 4 | 0.0% |
| Hungarian | 193 | 0.5% |
| Indian (Asian) | 38 | 0.1% |
| Irish | 3,306 | 9.0% |
| Iroquois | 7 | 0.0% |
| Italian | 881 | 2.4% |
| Korean | 66 | 0.2% |
| Latvian | 2 | 0.0% |
| Lebanese | 18 | 0.1% |
| Lithuanian | 150 | 0.4% |
| Luxembourger | 30 | 0.1% |
| Macedonian | 2 | 0.0% |
| Malaysian | 33 | 0.1% |
| Mexican | 236 | 0.6% |
| Moroccan | 3 | 0.0% |
| Native Hawaiian | 1 | 0.0% |
| New Zealander | 5 | 0.0% |
| Northern European | 100 | 0.3% |
| Norwegian | 974 | 2.6% |
| Ottawa | 30 | 0.1% |
| Pakistani | 24 | 0.1% |
| Pennsylvania German | 23 | 0.1% |
| Polish | 1,639 | 4.4% |
| Portuguese | 8 | 0.0% |
| Potawatomi | 85 | 0.2% |
| Puerto Rican | 122 | 0.3% |
| Romanian | 17 | 0.1% |
| Russian | 53 | 0.1% |
| Scandinavian | 206 | 0.6% |
| Scotch-Irish | 195 | 0.5% |
| Scottish | 348 | 0.9% |
| Serbian | 10 | 0.0% |
| Sioux | 11 | 0.0% |
| Slavic | 2 | 0.0% |
| Slovak | 16 | 0.0% |
| Spaniard | 21 | 0.1% |
| Spanish | 104 | 0.3% |
| Subsaharan African | 10 | 0.0% |
| Swedish | 4,267 | 11.6% |
| Swiss | 76 | 0.2% |
| Syrian | 13 | 0.0% |
| Thai | 8 | 0.0% |
| Turkish | 1 | 0.0% |
| Ukrainian | 72 | 0.2% |
| Welsh | 127 | 0.3% |
| Yugoslavian | 27 | 0.1% | View All 82 Rows |
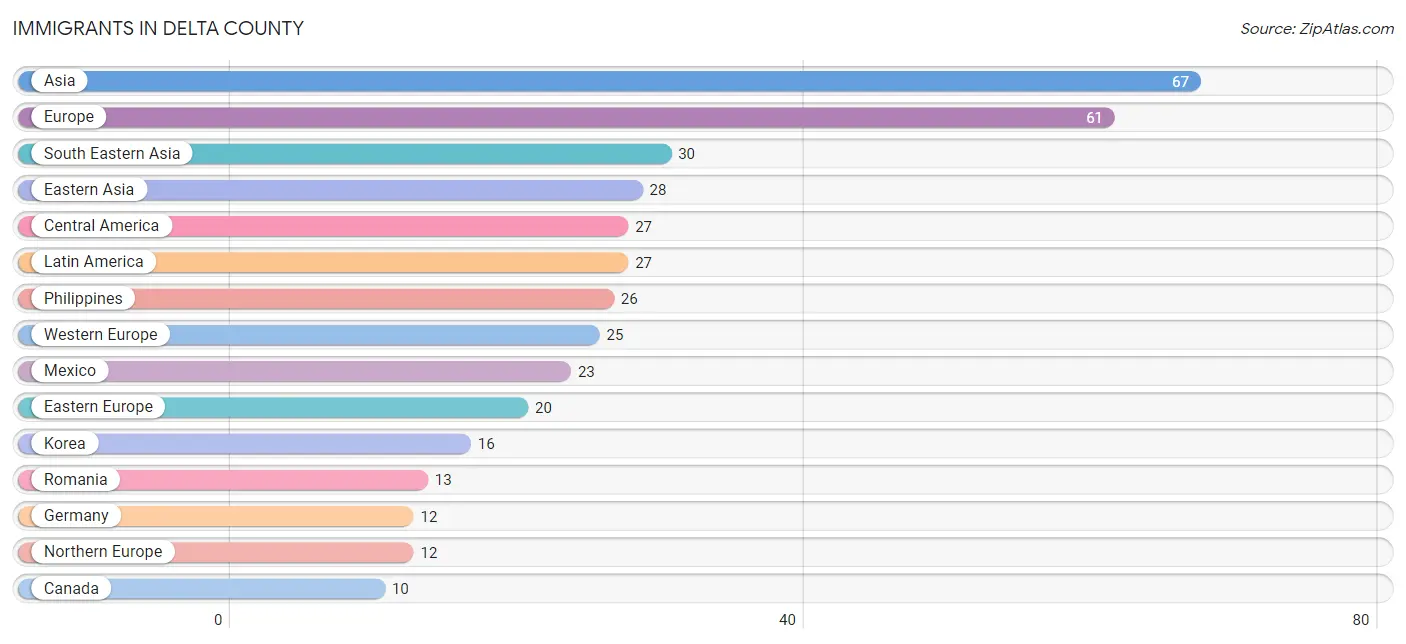
Immigrants in Delta County
The most numerous immigrant groups reported in Delta County came from Asia (67 | 0.2%), Europe (61 | 0.2%), South Eastern Asia (30 | 0.1%), Eastern Asia (28 | 0.1%), and Central America (27 | 0.1%), together accounting for 0.6% of all Delta County residents.
| Immigration Origin | # Population | % Population |
| Africa | 4 | 0.0% |
| Asia | 67 | 0.2% |
| Australia | 2 | 0.0% |
| Canada | 10 | 0.0% |
| Central America | 27 | 0.1% |
| China | 9 | 0.0% |
| Croatia | 2 | 0.0% |
| Eastern Asia | 28 | 0.1% |
| Eastern Europe | 20 | 0.1% |
| Europe | 61 | 0.2% |
| France | 10 | 0.0% |
| Germany | 12 | 0.0% |
| Greece | 1 | 0.0% |
| Honduras | 4 | 0.0% |
| India | 8 | 0.0% |
| Ireland | 7 | 0.0% |
| Italy | 3 | 0.0% |
| Japan | 3 | 0.0% |
| Korea | 16 | 0.0% |
| Laos | 4 | 0.0% |
| Latin America | 27 | 0.1% |
| Lebanon | 1 | 0.0% |
| Mexico | 23 | 0.1% |
| Netherlands | 3 | 0.0% |
| Northern Europe | 12 | 0.0% |
| Oceania | 2 | 0.0% |
| Philippines | 26 | 0.1% |
| Poland | 3 | 0.0% |
| Romania | 13 | 0.0% |
| South Central Asia | 8 | 0.0% |
| South Eastern Asia | 30 | 0.1% |
| Southern Europe | 4 | 0.0% |
| Ukraine | 2 | 0.0% |
| Western Asia | 1 | 0.0% |
| Western Europe | 25 | 0.1% | View All 35 Rows |
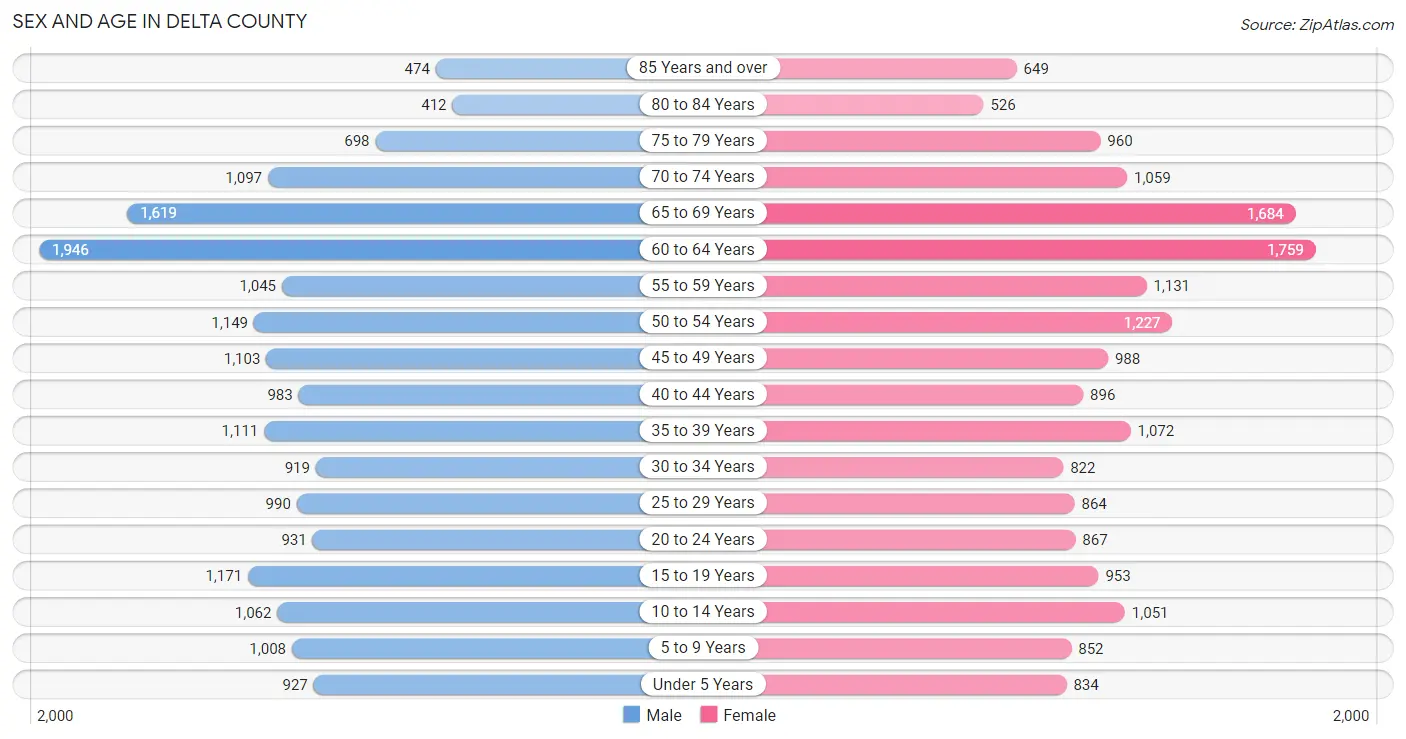
Sex and Age in Delta County
Sex and Age in Delta County
The most populous age groups in Delta County are 60 to 64 Years (1,946 | 10.4%) for men and 60 to 64 Years (1,759 | 9.7%) for women.
| Age Bracket | Male | Female |
| Under 5 Years | 927 (5.0%) | 834 (4.6%) |
| 5 to 9 Years | 1,008 (5.4%) | 852 (4.7%) |
| 10 to 14 Years | 1,062 (5.7%) | 1,051 (5.8%) |
| 15 to 19 Years | 1,171 (6.3%) | 953 (5.2%) |
| 20 to 24 Years | 931 (5.0%) | 867 (4.8%) |
| 25 to 29 Years | 990 (5.3%) | 864 (4.8%) |
| 30 to 34 Years | 919 (4.9%) | 822 (4.5%) |
| 35 to 39 Years | 1,111 (6.0%) | 1,072 (5.9%) |
| 40 to 44 Years | 983 (5.3%) | 896 (4.9%) |
| 45 to 49 Years | 1,103 (5.9%) | 988 (5.4%) |
| 50 to 54 Years | 1,149 (6.2%) | 1,227 (6.7%) |
| 55 to 59 Years | 1,045 (5.6%) | 1,131 (6.2%) |
| 60 to 64 Years | 1,946 (10.4%) | 1,759 (9.7%) |
| 65 to 69 Years | 1,619 (8.7%) | 1,684 (9.3%) |
| 70 to 74 Years | 1,097 (5.9%) | 1,059 (5.8%) |
| 75 to 79 Years | 698 (3.7%) | 960 (5.3%) |
| 80 to 84 Years | 412 (2.2%) | 526 (2.9%) |
| 85 Years and over | 474 (2.5%) | 649 (3.6%) |
| Total | 18,645 (100.0%) | 18,194 (100.0%) |
Families and Households in Delta County
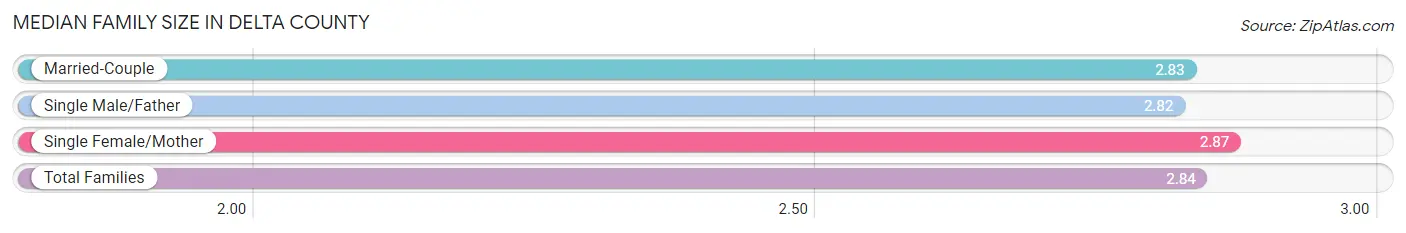
Median Family Size in Delta County
The median family size in Delta County is 2.84 persons per family, with single female/mother families (1,179 | 11.6%) accounting for the largest median family size of 2.87 persons per family. On the other hand, single male/father families (689 | 6.8%) represent the smallest median family size with 2.82 persons per family.
| Family Type | # Families | Family Size |
| Married-Couple | 8,291 (81.6%) | 2.83 |
| Single Male/Father | 689 (6.8%) | 2.82 |
| Single Female/Mother | 1,179 (11.6%) | 2.87 |
| Total Families | 10,159 (100.0%) | 2.84 |
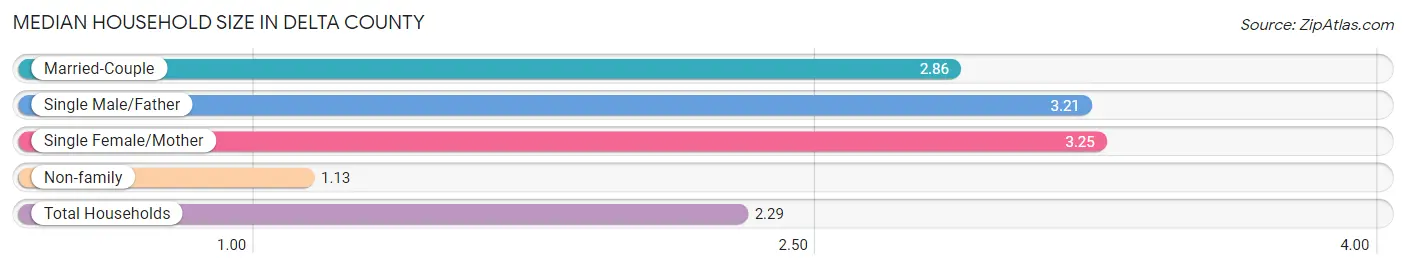
Median Household Size in Delta County
The median household size in Delta County is 2.29 persons per household, with single female/mother households (1,179 | 7.4%) accounting for the largest median household size of 3.25 persons per household. non-family households (5,692 | 35.9%) represent the smallest median household size with 1.13 persons per household.
| Household Type | # Households | Household Size |
| Married-Couple | 8,291 (52.3%) | 2.86 |
| Single Male/Father | 689 (4.3%) | 3.21 |
| Single Female/Mother | 1,179 (7.4%) | 3.25 |
| Non-family | 5,692 (35.9%) | 1.13 |
| Total Households | 15,851 (100.0%) | 2.29 |
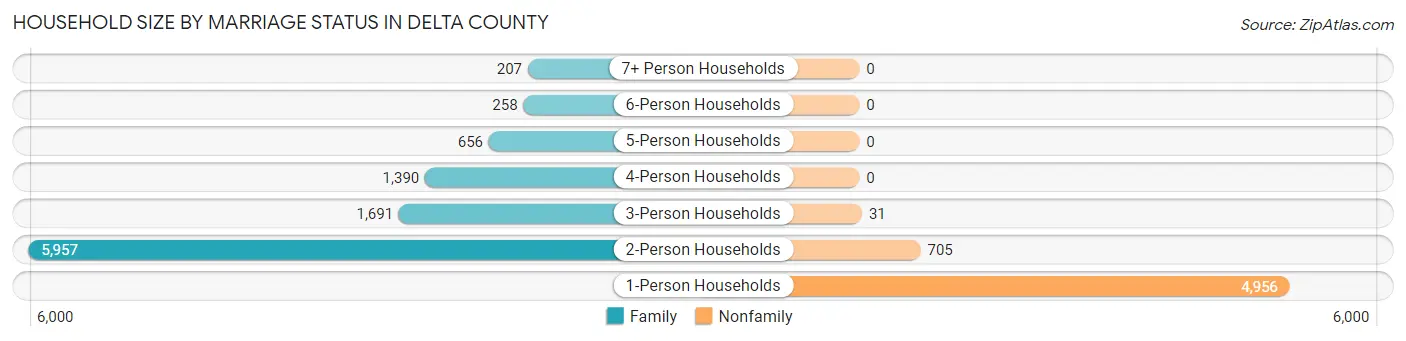
Household Size by Marriage Status in Delta County
Out of a total of 15,851 households in Delta County, 10,159 (64.1%) are family households, while 5,692 (35.9%) are nonfamily households. The most numerous type of family households are 2-person households, comprising 5,957, and the most common type of nonfamily households are 1-person households, comprising 4,956.
| Household Size | Family Households | Nonfamily Households |
| 1-Person Households | - | 4,956 (31.3%) |
| 2-Person Households | 5,957 (37.6%) | 705 (4.4%) |
| 3-Person Households | 1,691 (10.7%) | 31 (0.2%) |
| 4-Person Households | 1,390 (8.8%) | 0 (0.0%) |
| 5-Person Households | 656 (4.1%) | 0 (0.0%) |
| 6-Person Households | 258 (1.6%) | 0 (0.0%) |
| 7+ Person Households | 207 (1.3%) | 0 (0.0%) |
| Total | 10,159 (64.1%) | 5,692 (35.9%) |
Female Fertility in Delta County
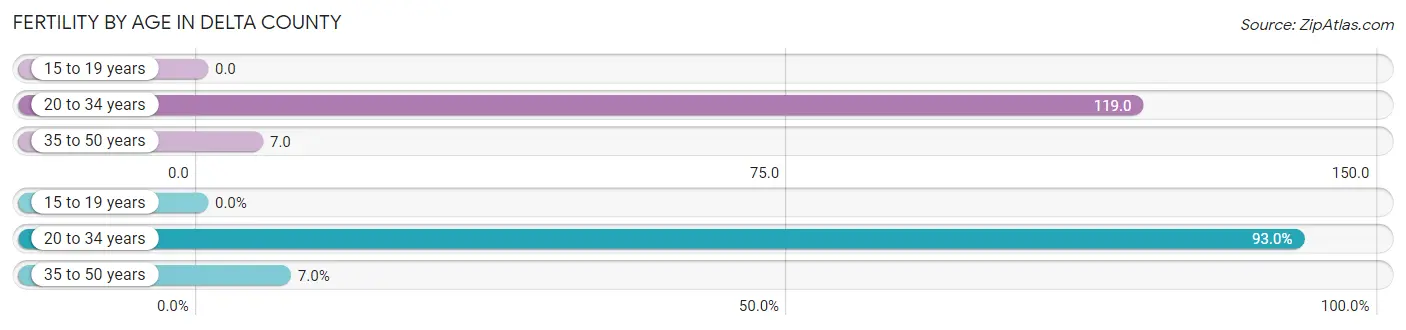
Fertility by Age in Delta County
Average fertility rate in Delta County is 49.0 births per 1,000 women. Women in the age bracket of 20 to 34 years have the highest fertility rate with 119.0 births per 1,000 women. Women in the age bracket of 20 to 34 years acount for 93.0% of all women with births.
| Age Bracket | Women with Births | Births / 1,000 Women |
| 15 to 19 years | 0 (0.0%) | 0.0 |
| 20 to 34 years | 304 (93.0%) | 119.0 |
| 35 to 50 years | 23 (7.0%) | 7.0 |
| Total | 327 (100.0%) | 49.0 |
Fertility by Age by Marriage Status in Delta County
86.2% of women with births (327) in Delta County are married. The highest percentage of unmarried women with births falls into 35 to 50 years age bracket with 26.1% of them unmarried at the time of birth, while the lowest percentage of unmarried women with births belong to 20 to 34 years age bracket with 12.8% of them unmarried.
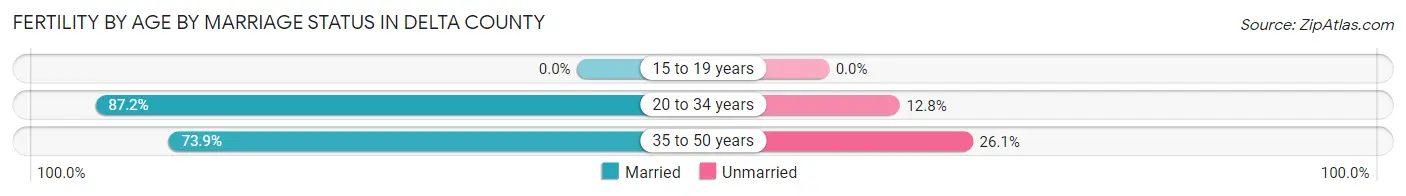
| Age Bracket | Married | Unmarried |
| 15 to 19 years | 0 (0.0%) | 0 (0.0%) |
| 20 to 34 years | 265 (87.2%) | 39 (12.8%) |
| 35 to 50 years | 17 (73.9%) | 6 (26.1%) |
| Total | 282 (86.2%) | 45 (13.8%) |
Fertility by Education in Delta County
Average fertility rate in Delta County is 49.0 births per 1,000 women. Women with the education attainment of college or associate's degree have the highest fertility rate of 77.0 births per 1,000 women, while women with the education attainment of less than high school have the lowest fertility at 12.0 births per 1,000 women. Women with the education attainment of college or associate's degree represent 62.7% of all women with births.
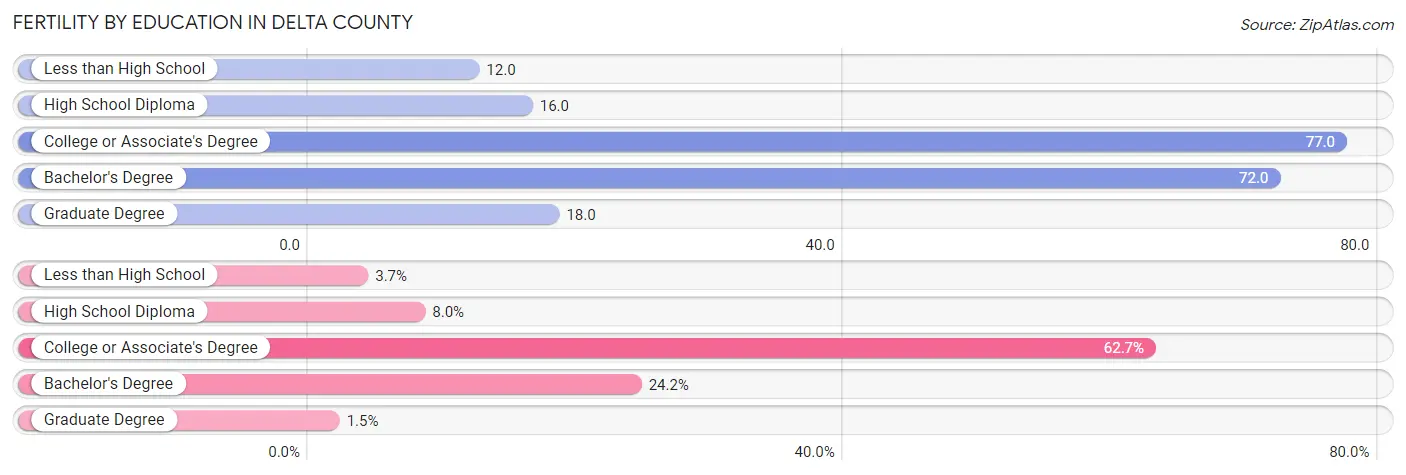
| Educational Attainment | Women with Births | Births / 1,000 Women |
| Less than High School | 12 (3.7%) | 12.0 |
| High School Diploma | 26 (8.0%) | 16.0 |
| College or Associate's Degree | 205 (62.7%) | 77.0 |
| Bachelor's Degree | 79 (24.2%) | 72.0 |
| Graduate Degree | 5 (1.5%) | 18.0 |
| Total | 327 (100.0%) | 49.0 |
Fertility by Education by Marriage Status in Delta County
13.8% of women with births in Delta County are unmarried. Women with the educational attainment of bachelor's degree are most likely to be married with 100.0% of them married at childbirth, while women with the educational attainment of less than high school are least likely to be married with 100.0% of them unmarried at childbirth.
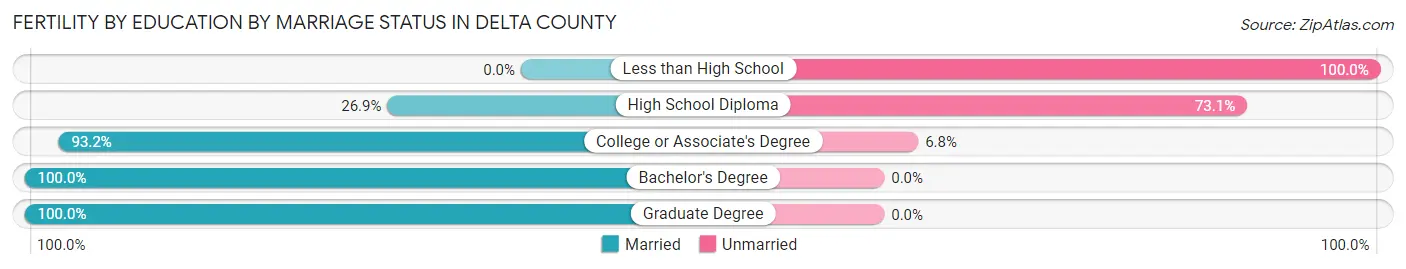
| Educational Attainment | Married | Unmarried |
| Less than High School | 0 (0.0%) | 12 (100.0%) |
| High School Diploma | 7 (26.9%) | 19 (73.1%) |
| College or Associate's Degree | 191 (93.2%) | 14 (6.8%) |
| Bachelor's Degree | 79 (100.0%) | 0 (0.0%) |
| Graduate Degree | 5 (100.0%) | 0 (0.0%) |
| Total | 282 (86.2%) | 45 (13.8%) |
Income in Delta County
Income Overview in Delta County
Per Capita Income in Delta County is $32,311, while median incomes of families and households are $72,385 and $53,852 respectively.
| Characteristic | Number | Measure |
| Per Capita Income | 36,839 | $32,311 |
| Median Family Income | 10,159 | $72,385 |
| Mean Family Income | 10,159 | $89,514 |
| Median Household Income | 15,851 | $53,852 |
| Mean Household Income | 15,851 | $72,837 |
| Income Deficit | 10,159 | $10,416 |
| Wage / Income Gap (%) | 36,839 | 41.51% |
| Wage / Income Gap ($) | 36,839 | 58.49¢ per $1 |
| Gini / Inequality Index | 36,839 | 0.45 |
Earnings by Sex in Delta County
Average Earnings in Delta County are $32,742, $41,438 for men and $24,237 for women, a difference of 41.5%.
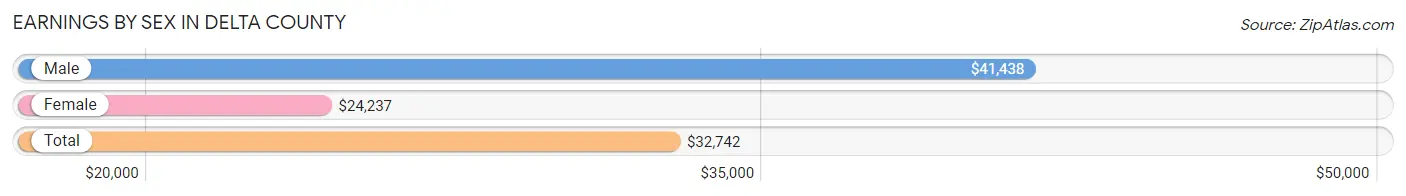
| Sex | Number | Average Earnings |
| Male | 9,343 (53.9%) | $41,438 |
| Female | 7,982 (46.1%) | $24,237 |
| Total | 17,325 (100.0%) | $32,742 |
Earnings by Sex by Income Bracket in Delta County
The most common earnings brackets in Delta County are $100,000+ for men (1,183 | 12.7%) and $2,499 or less for women (612 | 7.7%).
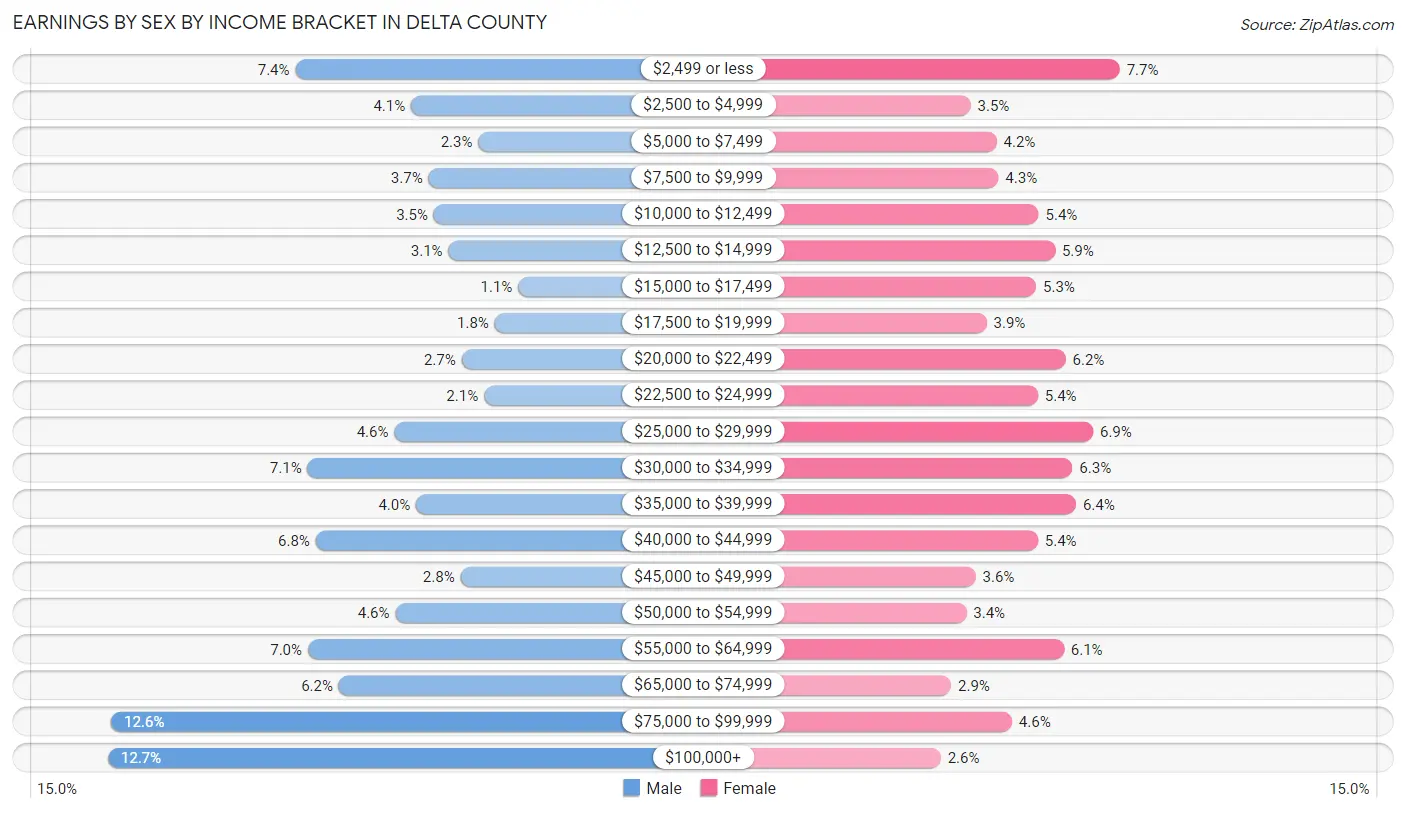
| Income | Male | Female |
| $2,499 or less | 690 (7.4%) | 612 (7.7%) |
| $2,500 to $4,999 | 387 (4.1%) | 278 (3.5%) |
| $5,000 to $7,499 | 210 (2.2%) | 336 (4.2%) |
| $7,500 to $9,999 | 341 (3.6%) | 340 (4.3%) |
| $10,000 to $12,499 | 327 (3.5%) | 430 (5.4%) |
| $12,500 to $14,999 | 289 (3.1%) | 467 (5.9%) |
| $15,000 to $17,499 | 106 (1.1%) | 425 (5.3%) |
| $17,500 to $19,999 | 167 (1.8%) | 314 (3.9%) |
| $20,000 to $22,499 | 254 (2.7%) | 491 (6.1%) |
| $22,500 to $24,999 | 195 (2.1%) | 429 (5.4%) |
| $25,000 to $29,999 | 431 (4.6%) | 552 (6.9%) |
| $30,000 to $34,999 | 659 (7.0%) | 506 (6.3%) |
| $35,000 to $39,999 | 374 (4.0%) | 514 (6.4%) |
| $40,000 to $44,999 | 637 (6.8%) | 429 (5.4%) |
| $45,000 to $49,999 | 257 (2.8%) | 289 (3.6%) |
| $50,000 to $54,999 | 428 (4.6%) | 268 (3.4%) |
| $55,000 to $64,999 | 658 (7.0%) | 487 (6.1%) |
| $65,000 to $74,999 | 576 (6.2%) | 234 (2.9%) |
| $75,000 to $99,999 | 1,174 (12.6%) | 370 (4.6%) |
| $100,000+ | 1,183 (12.7%) | 211 (2.6%) |
| Total | 9,343 (100.0%) | 7,982 (100.0%) |
Earnings by Sex by Educational Attainment in Delta County
Average earnings in Delta County are $49,841 for men and $27,695 for women, a difference of 44.4%. Men with an educational attainment of graduate degree enjoy the highest average annual earnings of $73,984, while those with less than high school education earn the least with $21,272. Women with an educational attainment of graduate degree earn the most with the average annual earnings of $75,294, while those with high school diploma education have the smallest earnings of $20,085.
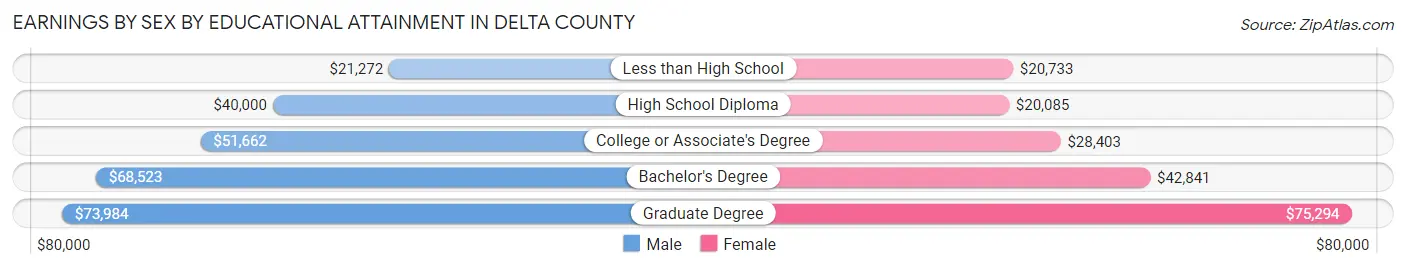
| Educational Attainment | Male Income | Female Income |
| Less than High School | $21,272 | $20,733 |
| High School Diploma | $40,000 | $20,085 |
| College or Associate's Degree | $51,662 | $28,403 |
| Bachelor's Degree | $68,523 | $42,841 |
| Graduate Degree | $73,984 | $75,294 |
| Total | $49,841 | $27,695 |
Family Income in Delta County
Family Income Brackets in Delta County
According to the Delta County family income data, there are 2,042 families falling into the $100,000 to $149,999 income range, which is the most common income bracket and makes up 20.1% of all families. Conversely, the less than $10,000 income bracket is the least frequent group with only 284 families (2.8%) belonging to this category.
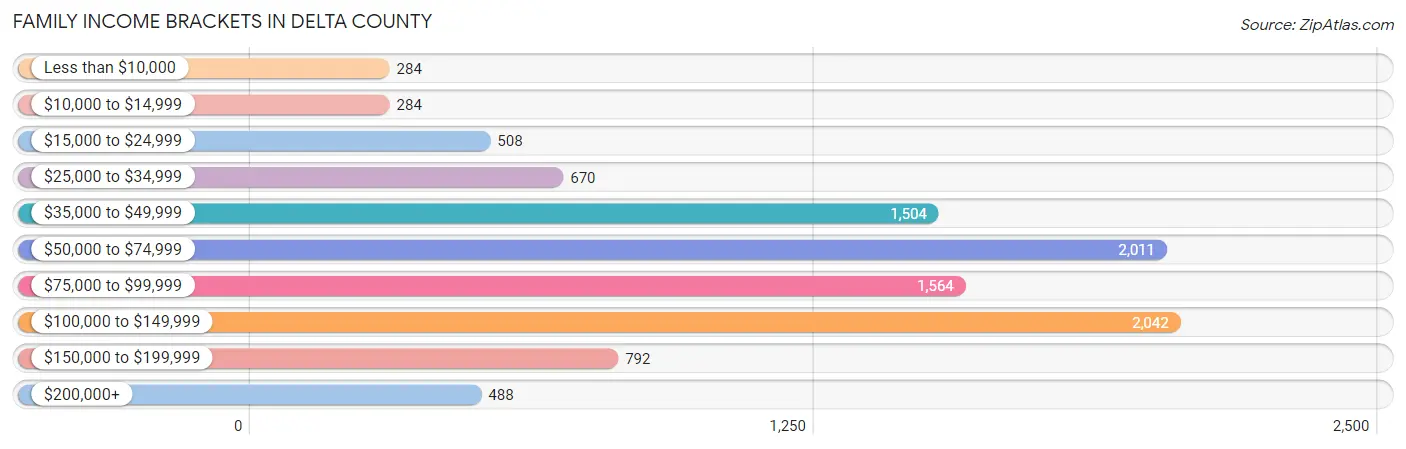
| Income Bracket | # Families | % Families |
| Less than $10,000 | 284 | 2.8% |
| $10,000 to $14,999 | 284 | 2.8% |
| $15,000 to $24,999 | 508 | 5.0% |
| $25,000 to $34,999 | 670 | 6.6% |
| $35,000 to $49,999 | 1,504 | 14.8% |
| $50,000 to $74,999 | 2,011 | 19.8% |
| $75,000 to $99,999 | 1,564 | 15.4% |
| $100,000 to $149,999 | 2,042 | 20.1% |
| $150,000 to $199,999 | 792 | 7.8% |
| $200,000+ | 488 | 4.8% |
Family Income by Famaliy Size in Delta County
5-person families (627 | 6.2%) account for the highest median family income in Delta County with $112,904 per family, while 3-person families (1,633 | 16.1%) have the highest median income of $31,477 per family member.
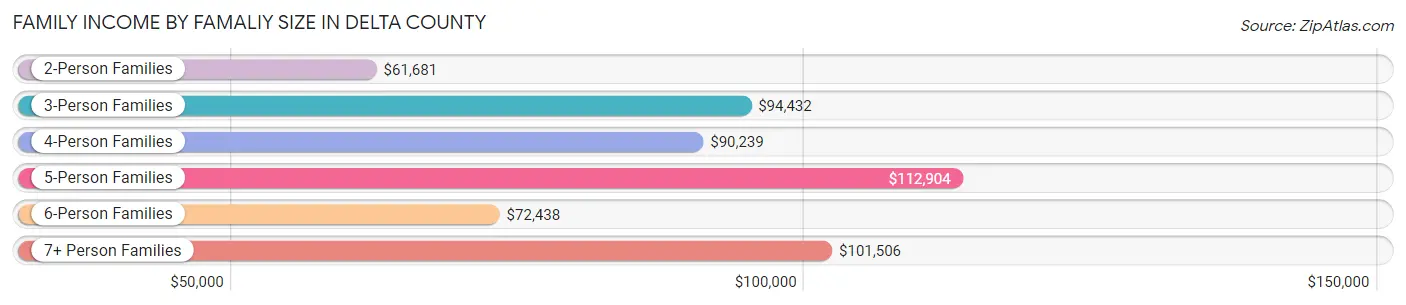
| Income Bracket | # Families | Median Income |
| 2-Person Families | 6,231 (61.3%) | $61,681 |
| 3-Person Families | 1,633 (16.1%) | $94,432 |
| 4-Person Families | 1,273 (12.5%) | $90,239 |
| 5-Person Families | 627 (6.2%) | $112,904 |
| 6-Person Families | 286 (2.8%) | $72,438 |
| 7+ Person Families | 109 (1.1%) | $101,506 |
| Total | 10,159 (100.0%) | $72,385 |
Family Income by Number of Earners in Delta County
The median family income in Delta County is $72,385, with families comprising 3+ earners (772) having the highest median family income of $130,357, while families with no earners (2,800) have the lowest median family income of $48,377, accounting for 7.6% and 27.6% of families, respectively.

| Number of Earners | # Families | Median Income |
| No Earners | 2,800 (27.6%) | $48,377 |
| 1 Earner | 2,944 (29.0%) | $57,500 |
| 2 Earners | 3,643 (35.9%) | $106,028 |
| 3+ Earners | 772 (7.6%) | $130,357 |
| Total | 10,159 (100.0%) | $72,385 |
Household Income in Delta County
Household Income Brackets in Delta County
With 2,869 households falling in the category, the $50,000 to $74,999 income range is the most frequent in Delta County, accounting for 18.1% of all households. In contrast, only 539 households (3.4%) fall into the $200,000+ income bracket, making it the least populous group.
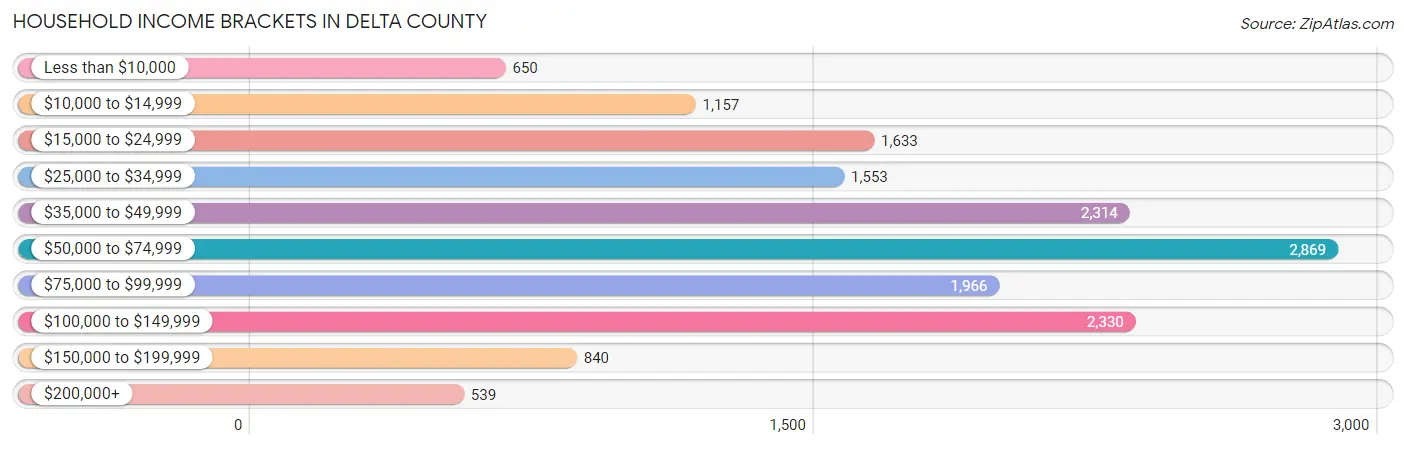
| Income Bracket | # Households | % Households |
| Less than $10,000 | 650 | 4.1% |
| $10,000 to $14,999 | 1,157 | 7.3% |
| $15,000 to $24,999 | 1,633 | 10.3% |
| $25,000 to $34,999 | 1,553 | 9.8% |
| $35,000 to $49,999 | 2,314 | 14.6% |
| $50,000 to $74,999 | 2,869 | 18.1% |
| $75,000 to $99,999 | 1,966 | 12.4% |
| $100,000 to $149,999 | 2,330 | 14.7% |
| $150,000 to $199,999 | 840 | 5.3% |
| $200,000+ | 539 | 3.4% |
Household Income by Householder Age in Delta County
The median household income in Delta County is $53,852, with the highest median household income of $71,504 found in the 25 to 44 years age bracket for the primary householder. A total of 3,785 households (23.9%) fall into this category. Meanwhile, the 65+ years age bracket for the primary householder has the lowest median household income of $41,299, with 5,653 households (35.7%) in this group.
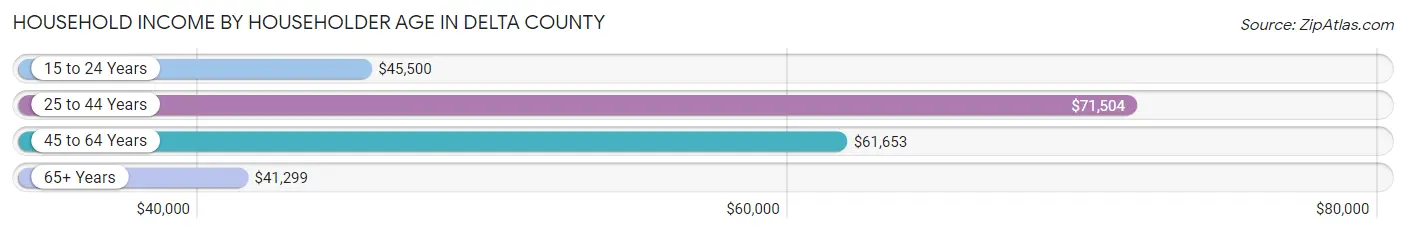
| Income Bracket | # Households | Median Income |
| 15 to 24 Years | 394 (2.5%) | $45,500 |
| 25 to 44 Years | 3,785 (23.9%) | $71,504 |
| 45 to 64 Years | 6,019 (38.0%) | $61,653 |
| 65+ Years | 5,653 (35.7%) | $41,299 |
| Total | 15,851 (100.0%) | $53,852 |
Poverty in Delta County
Income Below Poverty by Sex and Age in Delta County
With 12.0% poverty level for males and 14.5% for females among the residents of Delta County, 15 year old males and 5 year old females are the most vulnerable to poverty, with 33 males (18.2%) and 35 females (31.0%) in their respective age groups living below the poverty level.
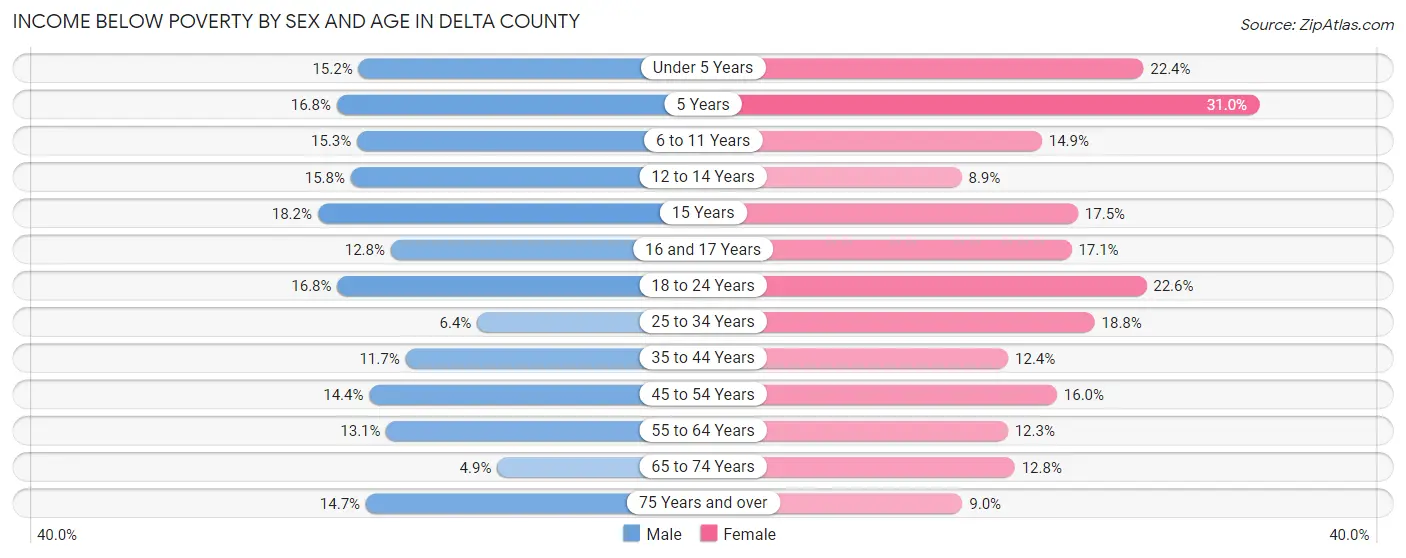
| Age Bracket | Male | Female |
| Under 5 Years | 139 (15.2%) | 176 (22.4%) |
| 5 Years | 37 (16.8%) | 35 (31.0%) |
| 6 to 11 Years | 188 (15.3%) | 157 (14.8%) |
| 12 to 14 Years | 89 (15.8%) | 61 (8.9%) |
| 15 Years | 33 (18.2%) | 27 (17.5%) |
| 16 and 17 Years | 77 (12.8%) | 82 (17.1%) |
| 18 to 24 Years | 213 (16.8%) | 265 (22.6%) |
| 25 to 34 Years | 120 (6.4%) | 315 (18.8%) |
| 35 to 44 Years | 242 (11.7%) | 242 (12.3%) |
| 45 to 54 Years | 323 (14.4%) | 353 (16.0%) |
| 55 to 64 Years | 391 (13.1%) | 355 (12.3%) |
| 65 to 74 Years | 133 (4.9%) | 346 (12.8%) |
| 75 Years and over | 224 (14.7%) | 179 (8.9%) |
| Total | 2,209 (12.0%) | 2,593 (14.5%) |
Income Above Poverty by Sex and Age in Delta County
According to the poverty statistics in Delta County, males aged 65 to 74 years and females aged 12 to 14 years are the age groups that are most secure financially, with 95.1% of males and 91.1% of females in these age groups living above the poverty line.
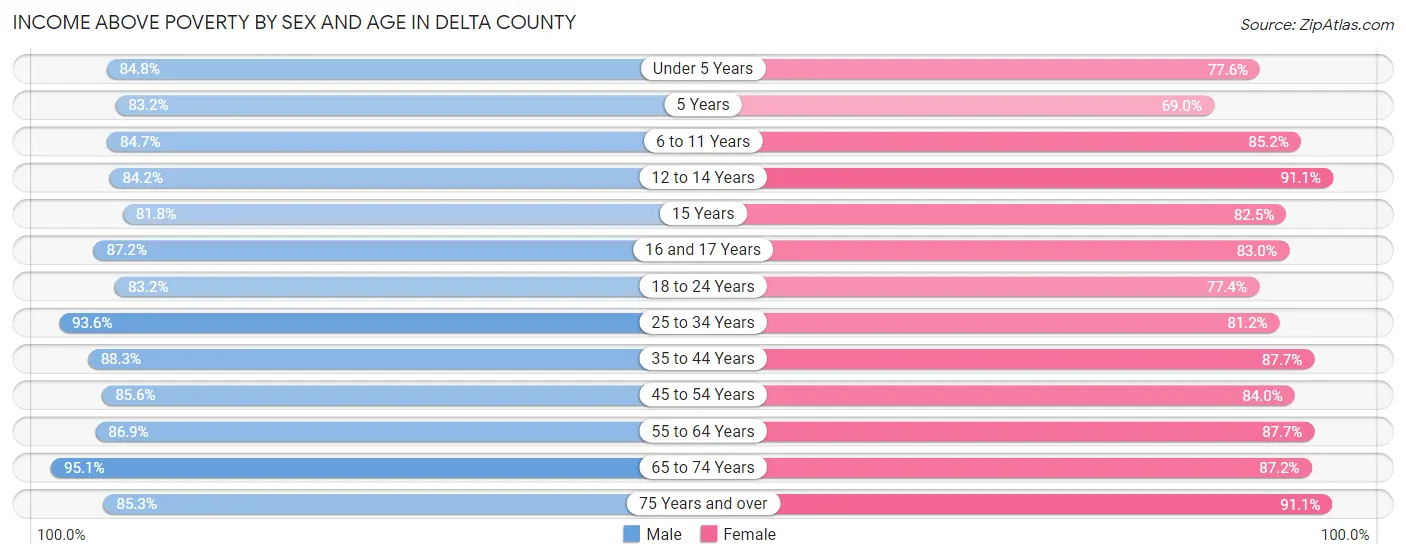
| Age Bracket | Male | Female |
| Under 5 Years | 775 (84.8%) | 610 (77.6%) |
| 5 Years | 183 (83.2%) | 78 (69.0%) |
| 6 to 11 Years | 1,039 (84.7%) | 900 (85.2%) |
| 12 to 14 Years | 475 (84.2%) | 625 (91.1%) |
| 15 Years | 148 (81.8%) | 127 (82.5%) |
| 16 and 17 Years | 524 (87.2%) | 399 (83.0%) |
| 18 to 24 Years | 1,056 (83.2%) | 907 (77.4%) |
| 25 to 34 Years | 1,756 (93.6%) | 1,363 (81.2%) |
| 35 to 44 Years | 1,823 (88.3%) | 1,718 (87.6%) |
| 45 to 54 Years | 1,918 (85.6%) | 1,858 (84.0%) |
| 55 to 64 Years | 2,585 (86.9%) | 2,527 (87.7%) |
| 65 to 74 Years | 2,577 (95.1%) | 2,348 (87.2%) |
| 75 Years and over | 1,304 (85.3%) | 1,820 (91.0%) |
| Total | 16,163 (88.0%) | 15,280 (85.5%) |
Income Below Poverty Among Married-Couple Families in Delta County
The poverty statistics for married-couple families in Delta County show that 5.1% or 422 of the total 8,291 families live below the poverty line. Families with 5 or more children have the highest poverty rate of 23.5%, comprising of 8 families. On the other hand, families with no children have the lowest poverty rate of 3.3%, which includes 193 families.
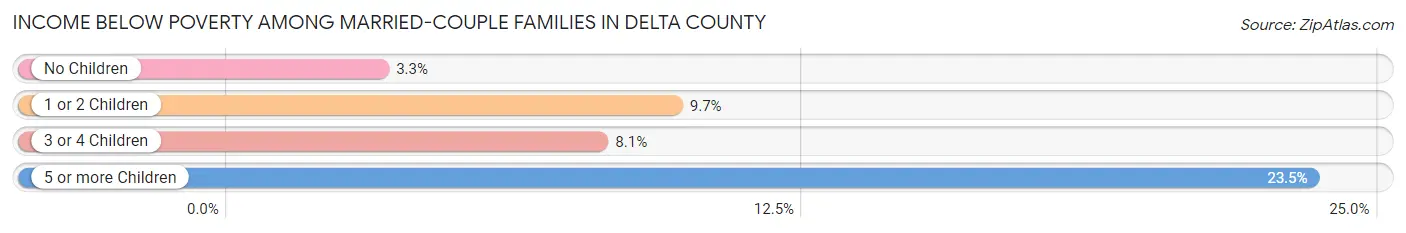
| Children | Above Poverty | Below Poverty |
| No Children | 5,679 (96.7%) | 193 (3.3%) |
| 1 or 2 Children | 1,605 (90.3%) | 172 (9.7%) |
| 3 or 4 Children | 559 (91.9%) | 49 (8.1%) |
| 5 or more Children | 26 (76.5%) | 8 (23.5%) |
| Total | 7,869 (94.9%) | 422 (5.1%) |
Income Below Poverty Among Single-Parent Households in Delta County
According to the poverty data in Delta County, 16.3% or 112 single-father households and 33.3% or 392 single-mother households are living below the poverty line. Among single-father households, those with 3 or 4 children have the highest poverty rate, with 18 households (48.6%) experiencing poverty. Likewise, among single-mother households, those with 3 or 4 children have the highest poverty rate, with 107 households (71.8%) falling below the poverty line.
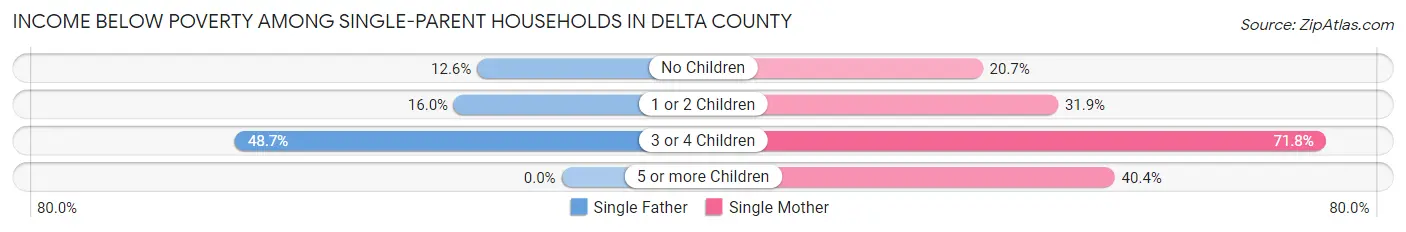
| Children | Single Father | Single Mother |
| No Children | 23 (12.6%) | 89 (20.7%) |
| 1 or 2 Children | 71 (16.0%) | 175 (31.9%) |
| 3 or 4 Children | 18 (48.6%) | 107 (71.8%) |
| 5 or more Children | 0 (0.0%) | 21 (40.4%) |
| Total | 112 (16.3%) | 392 (33.3%) |
Income Below Poverty Among Married-Couple vs Single-Parent Households in Delta County
The poverty data for Delta County shows that 422 of the married-couple family households (5.1%) and 504 of the single-parent households (27.0%) are living below the poverty level. Within the married-couple family households, those with 5 or more children have the highest poverty rate, with 8 households (23.5%) falling below the poverty line. Among the single-parent households, those with 3 or 4 children have the highest poverty rate, with 125 household (67.2%) living below poverty.
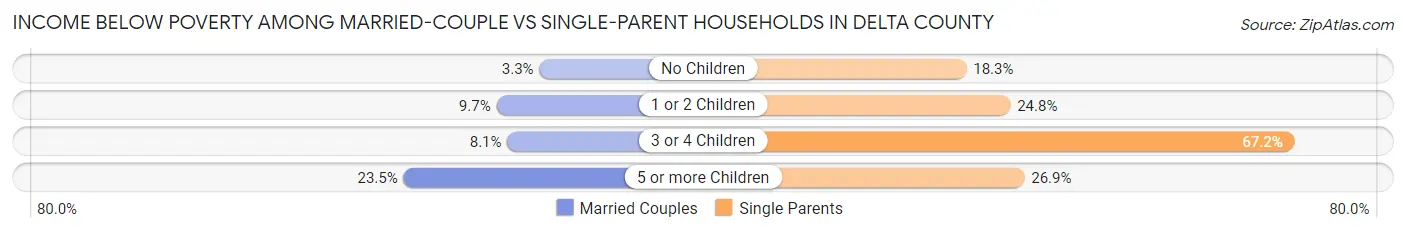
| Children | Married-Couple Families | Single-Parent Households |
| No Children | 193 (3.3%) | 112 (18.3%) |
| 1 or 2 Children | 172 (9.7%) | 246 (24.8%) |
| 3 or 4 Children | 49 (8.1%) | 125 (67.2%) |
| 5 or more Children | 8 (23.5%) | 21 (26.9%) |
| Total | 422 (5.1%) | 504 (27.0%) |
Employment Characteristics in Delta County
Employment by Class of Employer in Delta County
Among the 14,790 employed individuals in Delta County, private company employees (9,770 | 66.1%), not-for-profit organizations (1,369 | 9.3%), and local government employees (1,011 | 6.8%) make up the most common classes of employment.

| Employer Class | # Employees | % Employees |
| Private Company Employees | 9,770 | 66.1% |
| Self-Employed (Incorporated) | 744 | 5.0% |
| Self-Employed (Not Incorporated) | 836 | 5.7% |
| Not-for-profit Organizations | 1,369 | 9.3% |
| Local Government Employees | 1,011 | 6.8% |
| State Government Employees | 634 | 4.3% |
| Federal Government Employees | 420 | 2.8% |
| Unpaid Family Workers | 6 | 0.0% |
| Total | 14,790 | 100.0% |
Employment Status by Age in Delta County
According to the labor force statistics for Delta County, out of the total population over 16 years of age (30,770), 51.7% or 15,908 individuals are in the labor force, with 5.2% or 827 of them unemployed. The age group with the highest labor force participation rate is 20 to 24 years, with 85.5% or 1,537 individuals in the labor force. Within the labor force, the 16 to 19 years age range has the highest percentage of unemployed individuals, with 10.8% or 105 of them being unemployed.
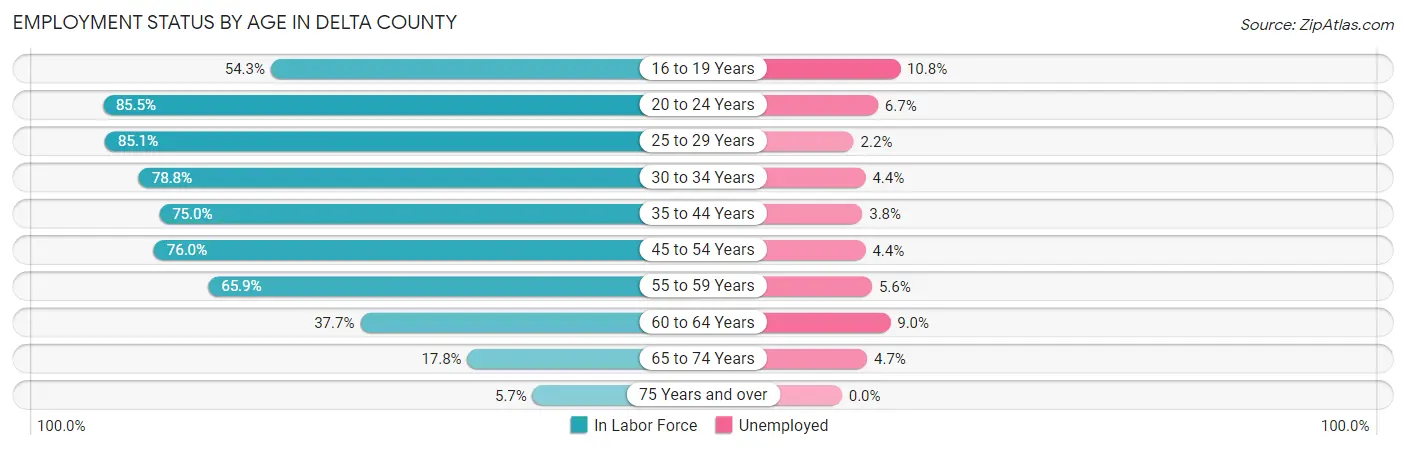
| Age Bracket | In Labor Force | Unemployed |
| 16 to 19 Years | 971 (54.3%) | 105 (10.8%) |
| 20 to 24 Years | 1,537 (85.5%) | 103 (6.7%) |
| 25 to 29 Years | 1,578 (85.1%) | 35 (2.2%) |
| 30 to 34 Years | 1,372 (78.8%) | 60 (4.4%) |
| 35 to 44 Years | 3,046 (75.0%) | 116 (3.8%) |
| 45 to 54 Years | 3,395 (76.0%) | 149 (4.4%) |
| 55 to 59 Years | 1,434 (65.9%) | 80 (5.6%) |
| 60 to 64 Years | 1,397 (37.7%) | 126 (9.0%) |
| 65 to 74 Years | 972 (17.8%) | 46 (4.7%) |
| 75 Years and over | 212 (5.7%) | 0 (0.0%) |
| Total | 15,908 (51.7%) | 827 (5.2%) |
Employment Status by Educational Attainment in Delta County
According to labor force statistics for Delta County, 67.9% of individuals (12,225) out of the total population between 25 and 64 years of age (18,005) are in the labor force, with 4.6% or 562 of them being unemployed. The group with the highest labor force participation rate are those with the educational attainment of bachelor's degree or higher, with 82.3% or 3,145 individuals in the labor force. Within the labor force, individuals with high school diploma education have the highest percentage of unemployment, with 6.3% or 210 of them being unemployed.
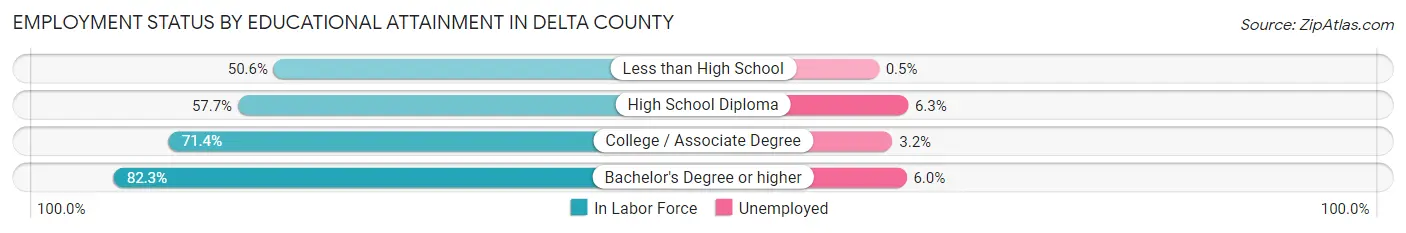
| Educational Attainment | In Labor Force | Unemployed |
| Less than High School | 624 (50.6%) | 6 (0.5%) |
| High School Diploma | 3,333 (57.7%) | 364 (6.3%) |
| College / Associate Degree | 5,122 (71.4%) | 230 (3.2%) |
| Bachelor's Degree or higher | 3,145 (82.3%) | 229 (6.0%) |
| Total | 12,225 (67.9%) | 828 (4.6%) |
Employment Occupations by Sex in Delta County
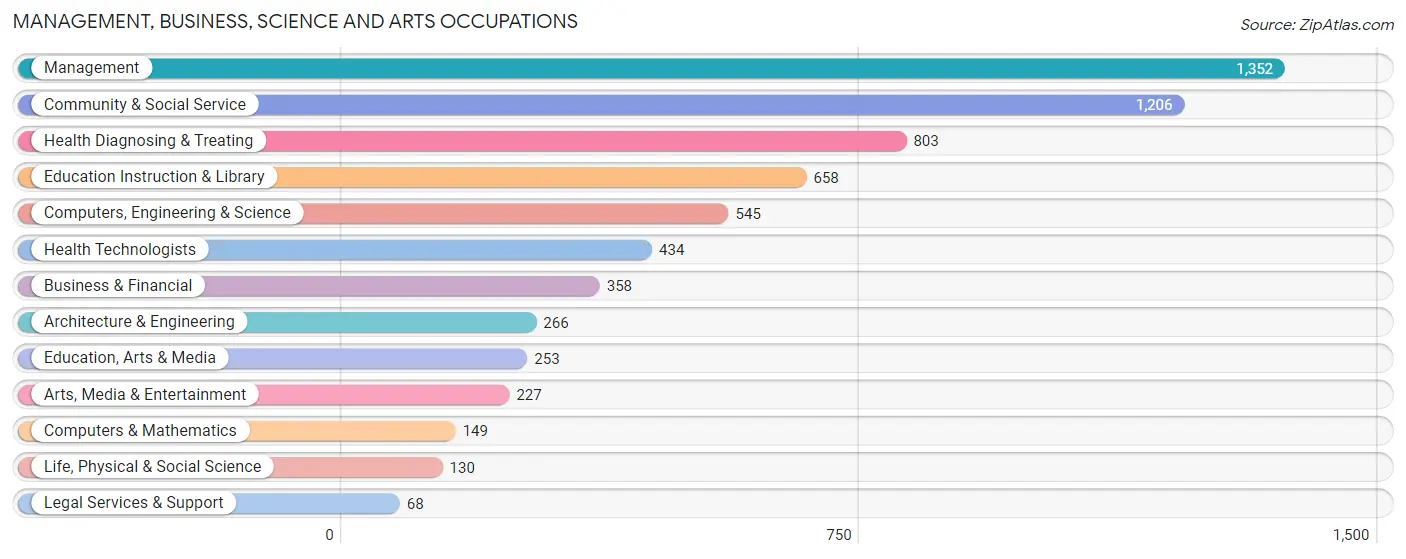
Management, Business, Science and Arts Occupations
The most common Management, Business, Science and Arts occupations in Delta County are Management (1,352 | 9.0%), Community & Social Service (1,206 | 8.0%), Health Diagnosing & Treating (803 | 5.3%), Education Instruction & Library (658 | 4.4%), and Computers, Engineering & Science (545 | 3.6%).
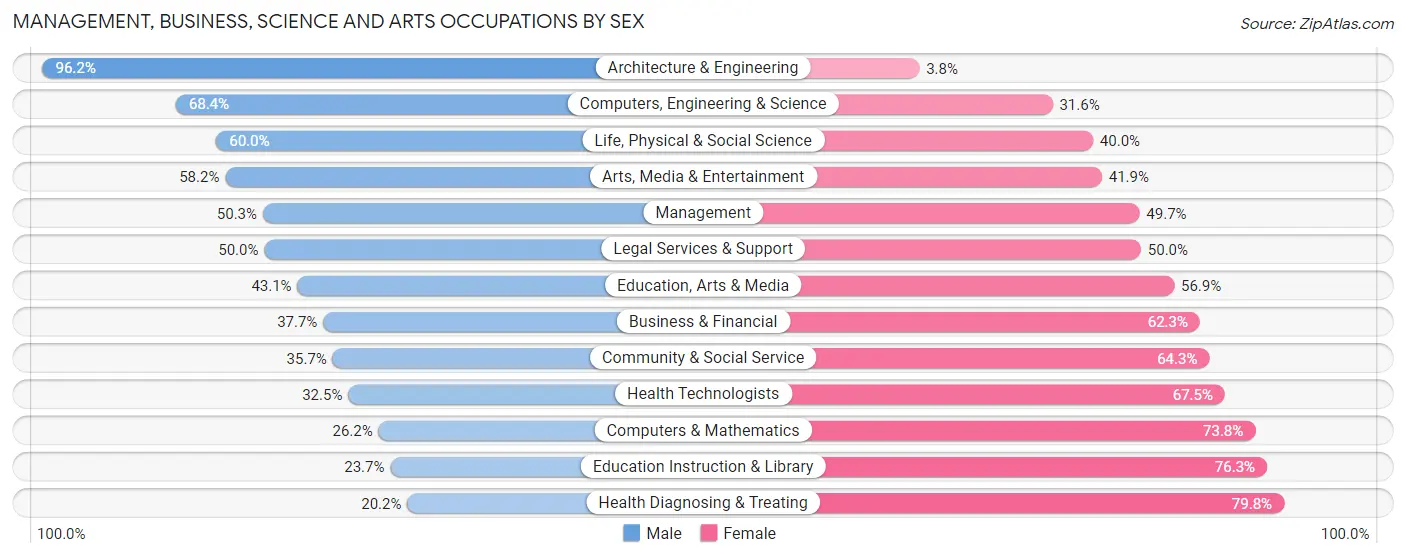
Management, Business, Science and Arts Occupations by Sex
Within the Management, Business, Science and Arts occupations in Delta County, the most male-oriented occupations are Architecture & Engineering (96.2%), Computers, Engineering & Science (68.4%), and Life, Physical & Social Science (60.0%), while the most female-oriented occupations are Health Diagnosing & Treating (79.8%), Education Instruction & Library (76.3%), and Computers & Mathematics (73.8%).
| Occupation | Male | Female |
| Management | 680 (50.3%) | 672 (49.7%) |
| Business & Financial | 135 (37.7%) | 223 (62.3%) |
| Computers, Engineering & Science | 373 (68.4%) | 172 (31.6%) |
| Computers & Mathematics | 39 (26.2%) | 110 (73.8%) |
| Architecture & Engineering | 256 (96.2%) | 10 (3.8%) |
| Life, Physical & Social Science | 78 (60.0%) | 52 (40.0%) |
| Community & Social Service | 431 (35.7%) | 775 (64.3%) |
| Education, Arts & Media | 109 (43.1%) | 144 (56.9%) |
| Legal Services & Support | 34 (50.0%) | 34 (50.0%) |
| Education Instruction & Library | 156 (23.7%) | 502 (76.3%) |
| Arts, Media & Entertainment | 132 (58.2%) | 95 (41.8%) |
| Health Diagnosing & Treating | 162 (20.2%) | 641 (79.8%) |
| Health Technologists | 141 (32.5%) | 293 (67.5%) |
| Total (Category) | 1,781 (41.8%) | 2,483 (58.2%) |
| Total (Overall) | 8,010 (53.1%) | 7,087 (46.9%) |
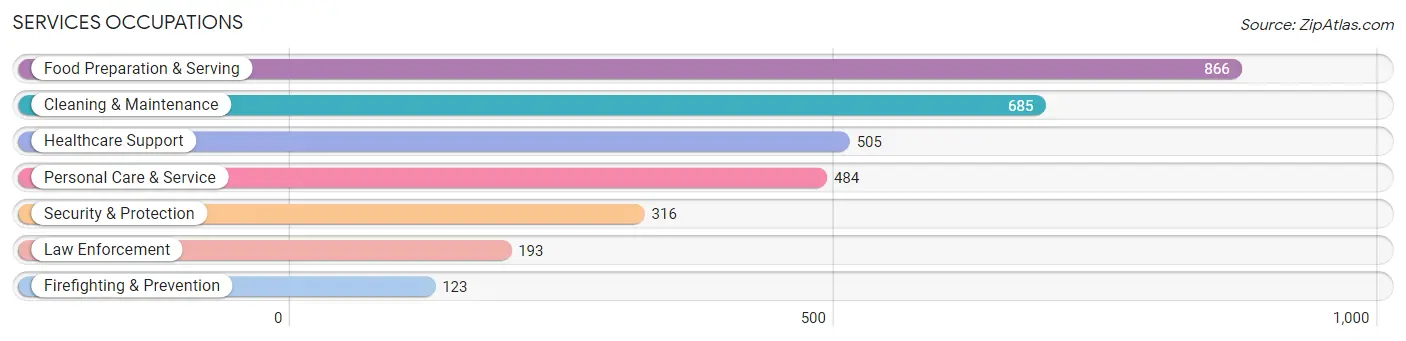
Services Occupations
The most common Services occupations in Delta County are Food Preparation & Serving (866 | 5.7%), Cleaning & Maintenance (685 | 4.5%), Healthcare Support (505 | 3.4%), Personal Care & Service (484 | 3.2%), and Security & Protection (316 | 2.1%).
Services Occupations by Sex
Within the Services occupations in Delta County, the most male-oriented occupations are Law Enforcement (97.9%), Security & Protection (92.7%), and Firefighting & Prevention (84.6%), while the most female-oriented occupations are Healthcare Support (95.5%), Personal Care & Service (78.9%), and Food Preparation & Serving (55.5%).
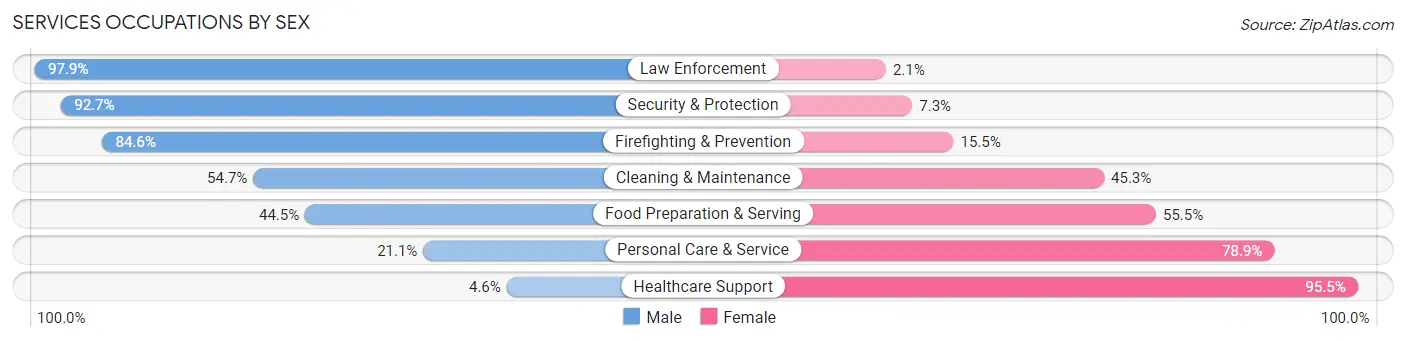
| Occupation | Male | Female |
| Healthcare Support | 23 (4.5%) | 482 (95.5%) |
| Security & Protection | 293 (92.7%) | 23 (7.3%) |
| Firefighting & Prevention | 104 (84.6%) | 19 (15.4%) |
| Law Enforcement | 189 (97.9%) | 4 (2.1%) |
| Food Preparation & Serving | 385 (44.5%) | 481 (55.5%) |
| Cleaning & Maintenance | 375 (54.7%) | 310 (45.3%) |
| Personal Care & Service | 102 (21.1%) | 382 (78.9%) |
| Total (Category) | 1,178 (41.2%) | 1,678 (58.8%) |
| Total (Overall) | 8,010 (53.1%) | 7,087 (46.9%) |
Sales and Office Occupations
The most common Sales and Office occupations in Delta County are Office & Administration (1,656 | 11.0%), and Sales & Related (1,572 | 10.4%).

Sales and Office Occupations by Sex

| Occupation | Male | Female |
| Sales & Related | 762 (48.5%) | 810 (51.5%) |
| Office & Administration | 204 (12.3%) | 1,452 (87.7%) |
| Total (Category) | 966 (29.9%) | 2,262 (70.1%) |
| Total (Overall) | 8,010 (53.1%) | 7,087 (46.9%) |
Natural Resources, Construction and Maintenance Occupations
The most common Natural Resources, Construction and Maintenance occupations in Delta County are Construction & Extraction (899 | 5.9%), Installation, Maintenance & Repair (829 | 5.5%), and Farming, Fishing & Forestry (120 | 0.8%).
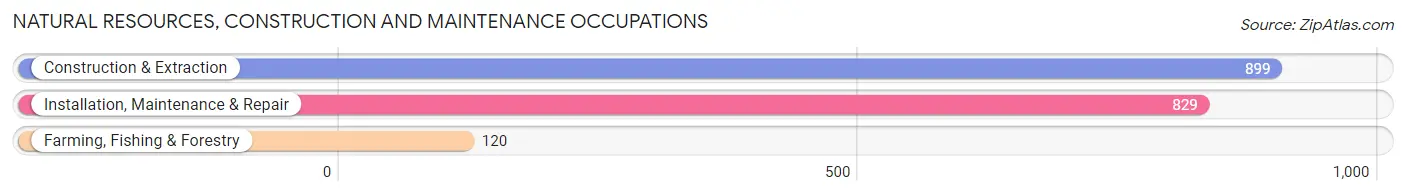
Natural Resources, Construction and Maintenance Occupations by Sex

| Occupation | Male | Female |
| Farming, Fishing & Forestry | 109 (90.8%) | 11 (9.2%) |
| Construction & Extraction | 883 (98.2%) | 16 (1.8%) |
| Installation, Maintenance & Repair | 735 (88.7%) | 94 (11.3%) |
| Total (Category) | 1,727 (93.4%) | 121 (6.6%) |
| Total (Overall) | 8,010 (53.1%) | 7,087 (46.9%) |
Production, Transportation and Moving Occupations
The most common Production, Transportation and Moving occupations in Delta County are Production (1,286 | 8.5%), Material Moving (895 | 5.9%), and Transportation (720 | 4.8%).

Production, Transportation and Moving Occupations by Sex

| Occupation | Male | Female |
| Production | 1,091 (84.8%) | 195 (15.2%) |
| Transportation | 669 (92.9%) | 51 (7.1%) |
| Material Moving | 598 (66.8%) | 297 (33.2%) |
| Total (Category) | 2,358 (81.3%) | 543 (18.7%) |
| Total (Overall) | 8,010 (53.1%) | 7,087 (46.9%) |
Employment Industries by Sex in Delta County
Employment Industries in Delta County
The major employment industries in Delta County include Manufacturing (2,507 | 16.6%), Health Care & Social Assistance (2,132 | 14.1%), Retail Trade (2,035 | 13.5%), Accommodation & Food Services (1,371 | 9.1%), and Educational Services (988 | 6.5%).

Employment Industries by Sex in Delta County
The Delta County industries that see more men than women are Utilities (100.0%), Construction (96.5%), and Manufacturing (78.3%), whereas the industries that tend to have a higher number of women are Health Care & Social Assistance (90.1%), Finance & Insurance (83.4%), and Educational Services (66.6%).
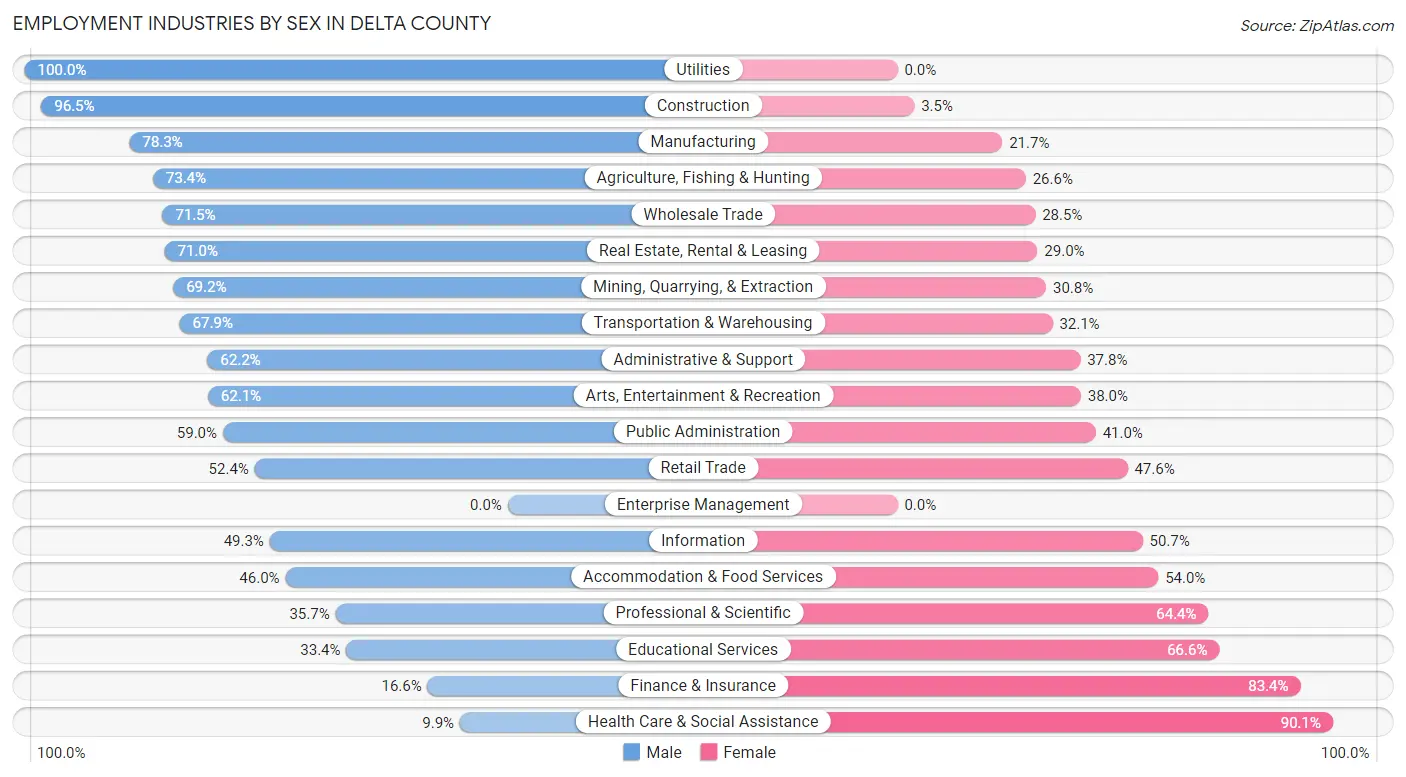
| Industry | Male | Female |
| Agriculture, Fishing & Hunting | 224 (73.4%) | 81 (26.6%) |
| Mining, Quarrying, & Extraction | 27 (69.2%) | 12 (30.8%) |
| Construction | 916 (96.5%) | 33 (3.5%) |
| Manufacturing | 1,963 (78.3%) | 544 (21.7%) |
| Wholesale Trade | 218 (71.5%) | 87 (28.5%) |
| Retail Trade | 1,066 (52.4%) | 969 (47.6%) |
| Transportation & Warehousing | 527 (67.9%) | 249 (32.1%) |
| Utilities | 113 (100.0%) | 0 (0.0%) |
| Information | 101 (49.3%) | 104 (50.7%) |
| Finance & Insurance | 119 (16.6%) | 598 (83.4%) |
| Real Estate, Rental & Leasing | 76 (71.0%) | 31 (29.0%) |
| Professional & Scientific | 82 (35.6%) | 148 (64.3%) |
| Enterprise Management | 0 (0.0%) | 0 (0.0%) |
| Administrative & Support | 230 (62.2%) | 140 (37.8%) |
| Educational Services | 330 (33.4%) | 658 (66.6%) |
| Health Care & Social Assistance | 211 (9.9%) | 1,921 (90.1%) |
| Arts, Entertainment & Recreation | 278 (62.1%) | 170 (38.0%) |
| Accommodation & Food Services | 631 (46.0%) | 740 (54.0%) |
| Public Administration | 444 (59.0%) | 309 (41.0%) |
| Total | 8,010 (53.1%) | 7,087 (46.9%) |
Education in Delta County
School Enrollment in Delta County
The most common levels of schooling among the 7,004 students in Delta County are high school (1,901 | 27.1%), middle school (1,678 | 24.0%), and elementary school (1,311 | 18.7%).
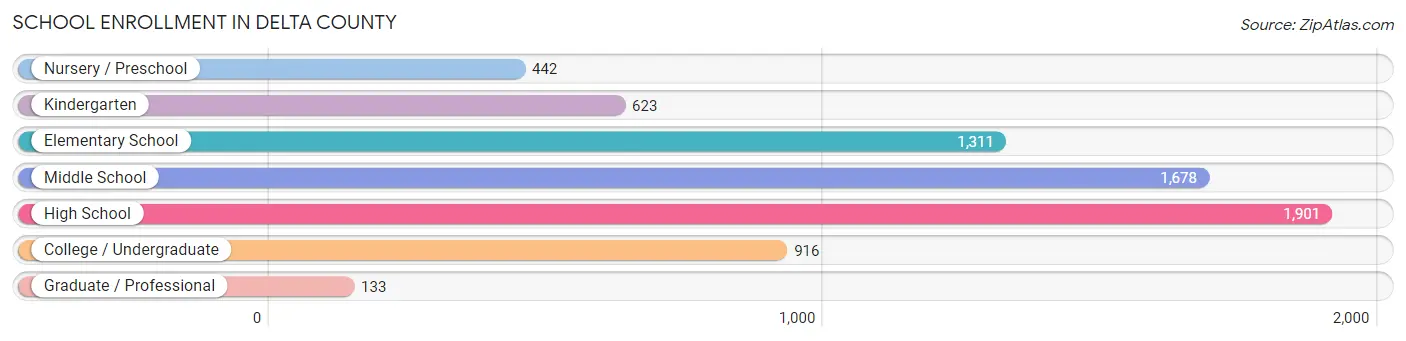
| School Level | # Students | % Students |
| Nursery / Preschool | 442 | 6.3% |
| Kindergarten | 623 | 8.9% |
| Elementary School | 1,311 | 18.7% |
| Middle School | 1,678 | 24.0% |
| High School | 1,901 | 27.1% |
| College / Undergraduate | 916 | 13.1% |
| Graduate / Professional | 133 | 1.9% |
| Total | 7,004 | 100.0% |
School Enrollment by Age by Funding Source in Delta County
Out of a total of 7,004 students who are enrolled in schools in Delta County, 1,009 (14.4%) attend a private institution, while the remaining 5,995 (85.6%) are enrolled in public schools. The age group of 3 to 4 year olds has the highest likelihood of being enrolled in private schools, with 114 (35.1% in the age bracket) enrolled. Conversely, the age group of 15 to 17 year olds has the lowest likelihood of being enrolled in a private school, with 1,306 (93.3% in the age bracket) attending a public institution.
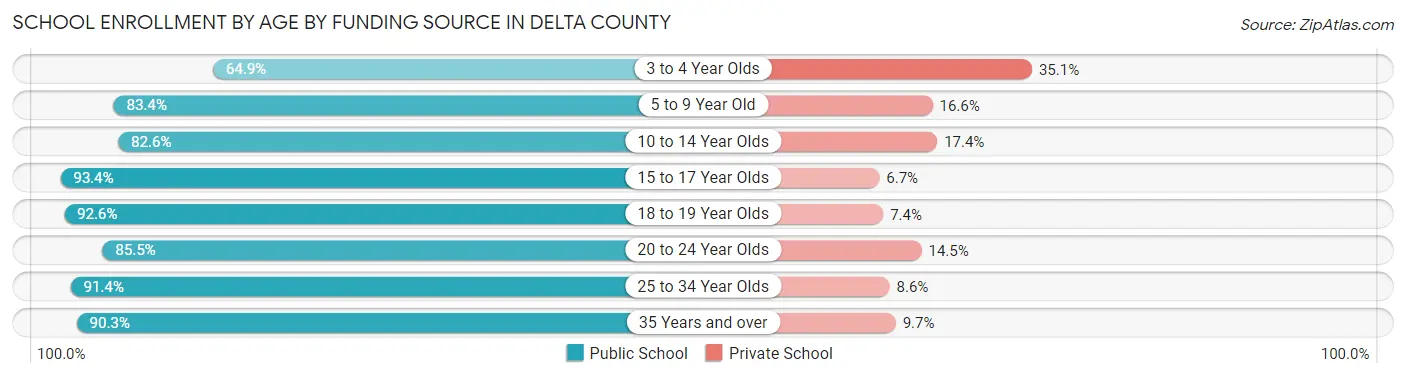
| Age Bracket | Public School | Private School |
| 3 to 4 Year Olds | 211 (64.9%) | 114 (35.1%) |
| 5 to 9 Year Old | 1,460 (83.4%) | 290 (16.6%) |
| 10 to 14 Year Olds | 1,726 (82.6%) | 364 (17.4%) |
| 15 to 17 Year Olds | 1,306 (93.3%) | 93 (6.7%) |
| 18 to 19 Year Olds | 465 (92.6%) | 37 (7.4%) |
| 20 to 24 Year Olds | 448 (85.5%) | 76 (14.5%) |
| 25 to 34 Year Olds | 171 (91.4%) | 16 (8.6%) |
| 35 Years and over | 205 (90.3%) | 22 (9.7%) |
| Total | 5,995 (85.6%) | 1,009 (14.4%) |
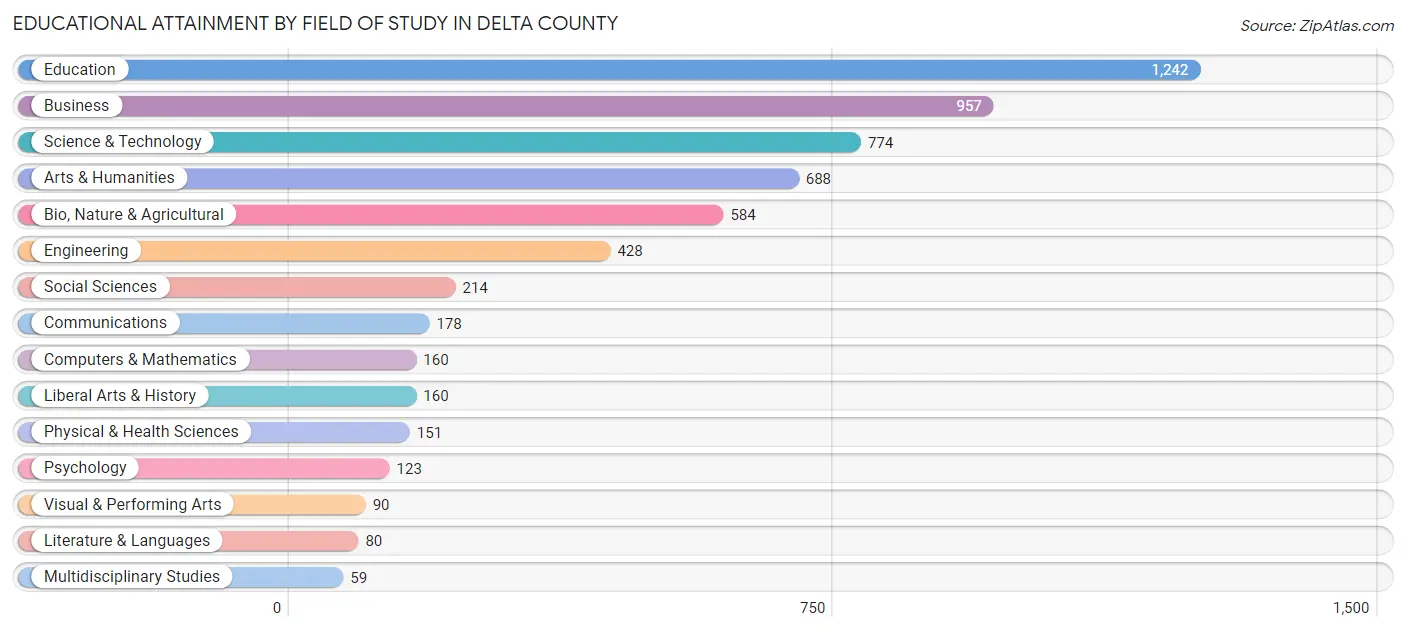
Educational Attainment by Field of Study in Delta County
Education (1,242 | 21.1%), business (957 | 16.3%), science & technology (774 | 13.2%), arts & humanities (688 | 11.7%), and bio, nature & agricultural (584 | 9.9%) are the most common fields of study among 5,888 individuals in Delta County who have obtained a bachelor's degree or higher.
| Field of Study | # Graduates | % Graduates |
| Computers & Mathematics | 160 | 2.7% |
| Bio, Nature & Agricultural | 584 | 9.9% |
| Physical & Health Sciences | 151 | 2.6% |
| Psychology | 123 | 2.1% |
| Social Sciences | 214 | 3.6% |
| Engineering | 428 | 7.3% |
| Multidisciplinary Studies | 59 | 1.0% |
| Science & Technology | 774 | 13.2% |
| Business | 957 | 16.3% |
| Education | 1,242 | 21.1% |
| Literature & Languages | 80 | 1.4% |
| Liberal Arts & History | 160 | 2.7% |
| Visual & Performing Arts | 90 | 1.5% |
| Communications | 178 | 3.0% |
| Arts & Humanities | 688 | 11.7% |
| Total | 5,888 | 100.0% |
Transportation & Commute in Delta County
Vehicle Availability by Sex in Delta County
The most prevalent vehicle ownership categories in Delta County are males with 2 vehicles (4,009, accounting for 51.0%) and females with 2 vehicles (3,014, making up 58.1%).
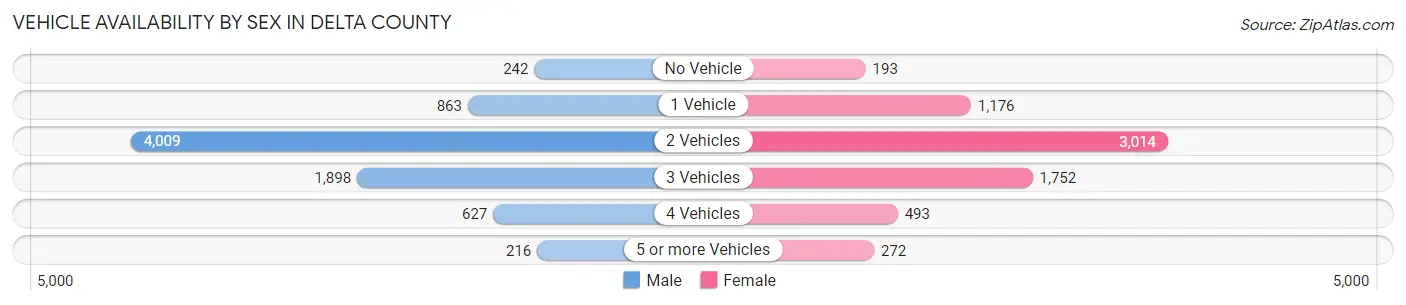
| Vehicles Available | Male | Female |
| No Vehicle | 242 (3.1%) | 193 (2.8%) |
| 1 Vehicle | 863 (11.0%) | 1,176 (17.0%) |
| 2 Vehicles | 4,009 (51.0%) | 3,014 (43.7%) |
| 3 Vehicles | 1,898 (24.2%) | 1,752 (25.4%) |
| 4 Vehicles | 627 (8.0%) | 493 (7.1%) |
| 5 or more Vehicles | 216 (2.8%) | 272 (3.9%) |
| Total | 7,855 (100.0%) | 6,900 (100.0%) |
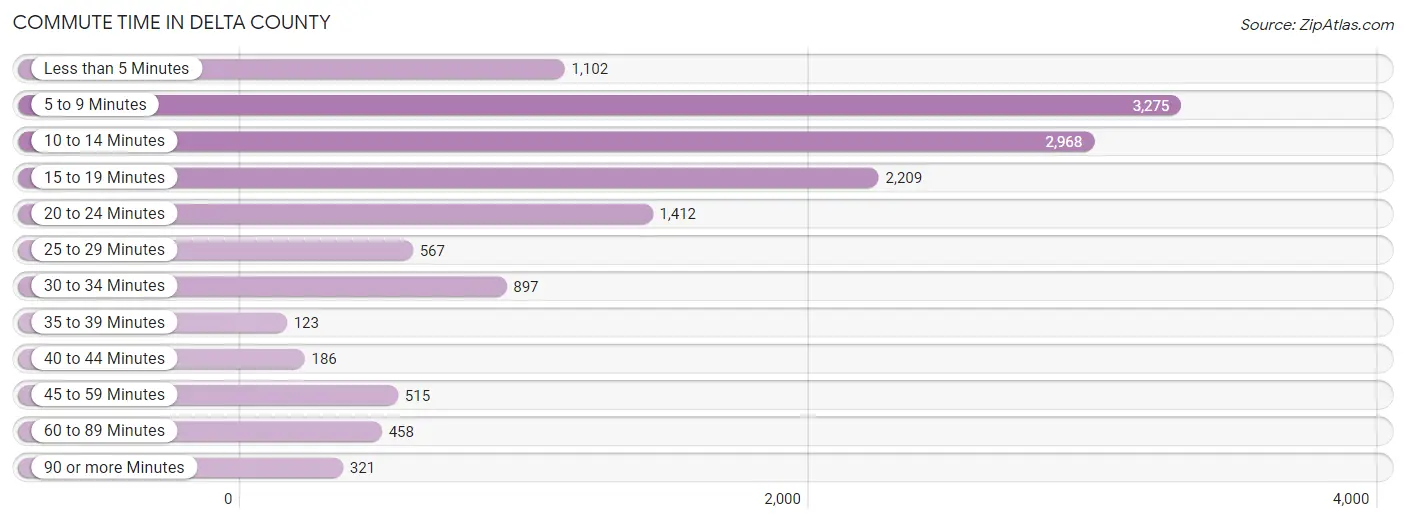
Commute Time in Delta County
The most frequently occuring commute durations in Delta County are 5 to 9 minutes (3,275 commuters, 23.3%), 10 to 14 minutes (2,968 commuters, 21.1%), and 15 to 19 minutes (2,209 commuters, 15.7%).
| Commute Time | # Commuters | % Commuters |
| Less than 5 Minutes | 1,102 | 7.9% |
| 5 to 9 Minutes | 3,275 | 23.3% |
| 10 to 14 Minutes | 2,968 | 21.1% |
| 15 to 19 Minutes | 2,209 | 15.7% |
| 20 to 24 Minutes | 1,412 | 10.1% |
| 25 to 29 Minutes | 567 | 4.0% |
| 30 to 34 Minutes | 897 | 6.4% |
| 35 to 39 Minutes | 123 | 0.9% |
| 40 to 44 Minutes | 186 | 1.3% |
| 45 to 59 Minutes | 515 | 3.7% |
| 60 to 89 Minutes | 458 | 3.3% |
| 90 or more Minutes | 321 | 2.3% |
Commute Time by Sex in Delta County
The most common commute times in Delta County are 10 to 14 minutes (1,588 commuters, 21.2%) for males and 5 to 9 minutes (1,817 commuters, 27.7%) for females.
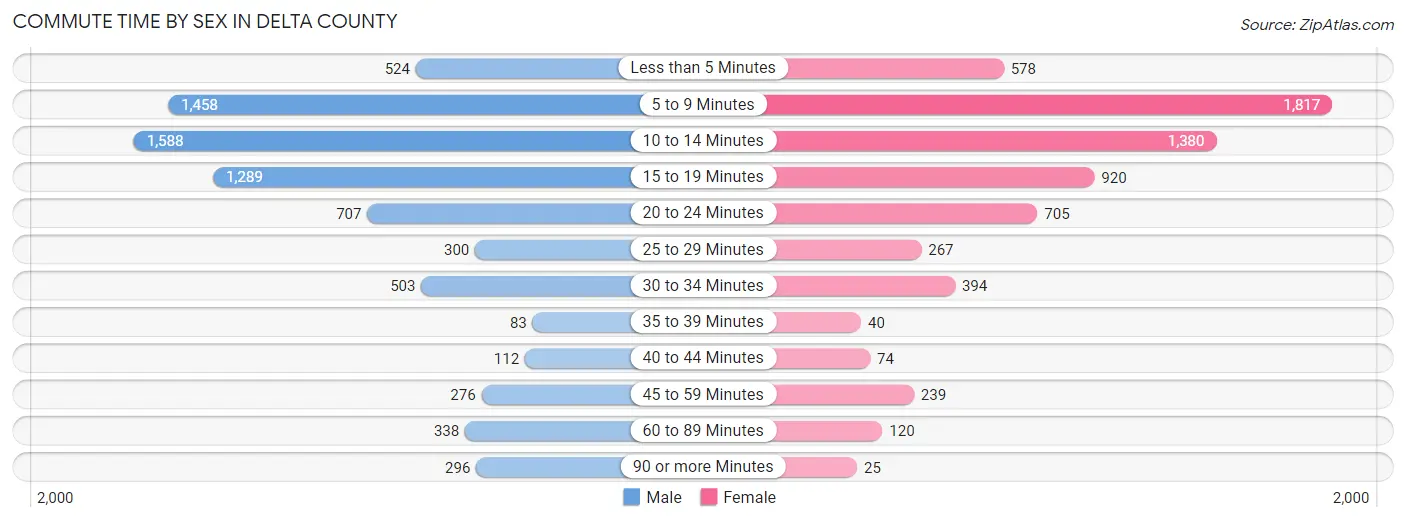
| Commute Time | Male | Female |
| Less than 5 Minutes | 524 (7.0%) | 578 (8.8%) |
| 5 to 9 Minutes | 1,458 (19.5%) | 1,817 (27.7%) |
| 10 to 14 Minutes | 1,588 (21.2%) | 1,380 (21.0%) |
| 15 to 19 Minutes | 1,289 (17.2%) | 920 (14.0%) |
| 20 to 24 Minutes | 707 (9.5%) | 705 (10.7%) |
| 25 to 29 Minutes | 300 (4.0%) | 267 (4.1%) |
| 30 to 34 Minutes | 503 (6.7%) | 394 (6.0%) |
| 35 to 39 Minutes | 83 (1.1%) | 40 (0.6%) |
| 40 to 44 Minutes | 112 (1.5%) | 74 (1.1%) |
| 45 to 59 Minutes | 276 (3.7%) | 239 (3.6%) |
| 60 to 89 Minutes | 338 (4.5%) | 120 (1.8%) |
| 90 or more Minutes | 296 (4.0%) | 25 (0.4%) |
Time of Departure to Work by Sex in Delta County
The most frequent times of departure to work in Delta County are 7:00 AM to 7:29 AM (1,016, 13.6%) for males and 7:30 AM to 7:59 AM (1,165, 17.8%) for females.
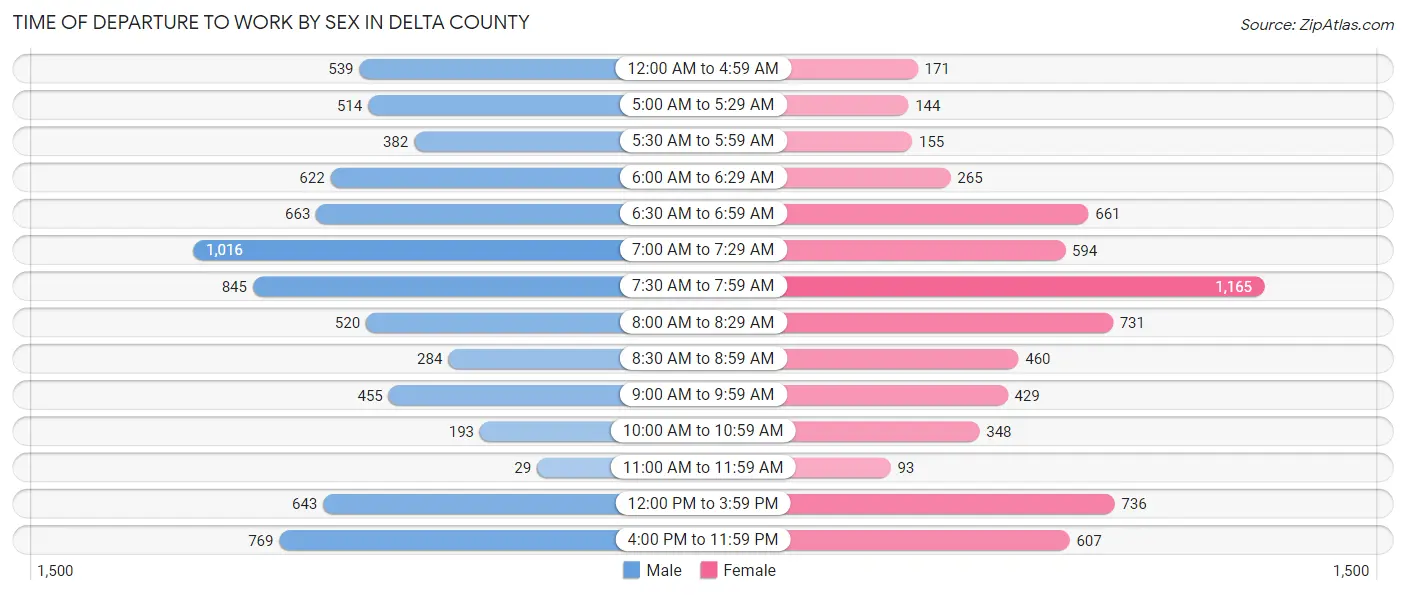
| Time of Departure | Male | Female |
| 12:00 AM to 4:59 AM | 539 (7.2%) | 171 (2.6%) |
| 5:00 AM to 5:29 AM | 514 (6.9%) | 144 (2.2%) |
| 5:30 AM to 5:59 AM | 382 (5.1%) | 155 (2.4%) |
| 6:00 AM to 6:29 AM | 622 (8.3%) | 265 (4.0%) |
| 6:30 AM to 6:59 AM | 663 (8.9%) | 661 (10.1%) |
| 7:00 AM to 7:29 AM | 1,016 (13.6%) | 594 (9.1%) |
| 7:30 AM to 7:59 AM | 845 (11.3%) | 1,165 (17.8%) |
| 8:00 AM to 8:29 AM | 520 (7.0%) | 731 (11.1%) |
| 8:30 AM to 8:59 AM | 284 (3.8%) | 460 (7.0%) |
| 9:00 AM to 9:59 AM | 455 (6.1%) | 429 (6.5%) |
| 10:00 AM to 10:59 AM | 193 (2.6%) | 348 (5.3%) |
| 11:00 AM to 11:59 AM | 29 (0.4%) | 93 (1.4%) |
| 12:00 PM to 3:59 PM | 643 (8.6%) | 736 (11.2%) |
| 4:00 PM to 11:59 PM | 769 (10.3%) | 607 (9.2%) |
| Total | 7,474 (100.0%) | 6,559 (100.0%) |
Housing Occupancy in Delta County
Occupancy by Ownership in Delta County
Of the total 15,851 dwellings in Delta County, owner-occupied units account for 12,425 (78.4%), while renter-occupied units make up 3,426 (21.6%).
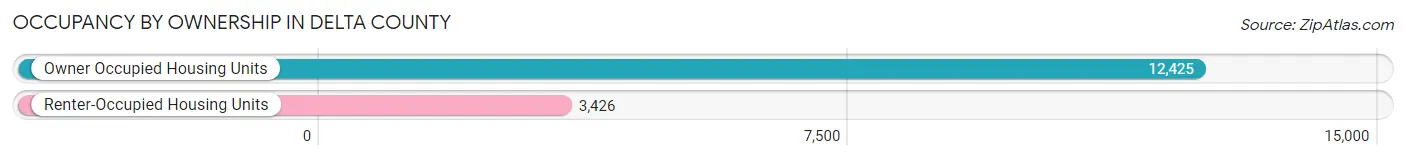
| Occupancy | # Housing Units | % Housing Units |
| Owner Occupied Housing Units | 12,425 | 78.4% |
| Renter-Occupied Housing Units | 3,426 | 21.6% |
| Total Occupied Housing Units | 15,851 | 100.0% |
Occupancy by Household Size in Delta County
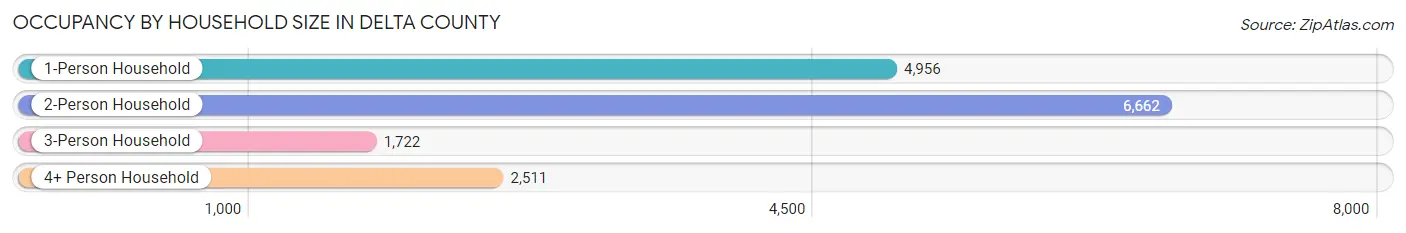
| Household Size | # Housing Units | % Housing Units |
| 1-Person Household | 4,956 | 31.3% |
| 2-Person Household | 6,662 | 42.0% |
| 3-Person Household | 1,722 | 10.9% |
| 4+ Person Household | 2,511 | 15.8% |
| Total Housing Units | 15,851 | 100.0% |
Occupancy by Ownership by Household Size in Delta County

| Household Size | Owner-occupied | Renter-occupied |
| 1-Person Household | 3,128 (63.1%) | 1,828 (36.9%) |
| 2-Person Household | 5,694 (85.5%) | 968 (14.5%) |
| 3-Person Household | 1,563 (90.8%) | 159 (9.2%) |
| 4+ Person Household | 2,040 (81.2%) | 471 (18.8%) |
| Total Housing Units | 12,425 (78.4%) | 3,426 (21.6%) |
Occupancy by Educational Attainment in Delta County
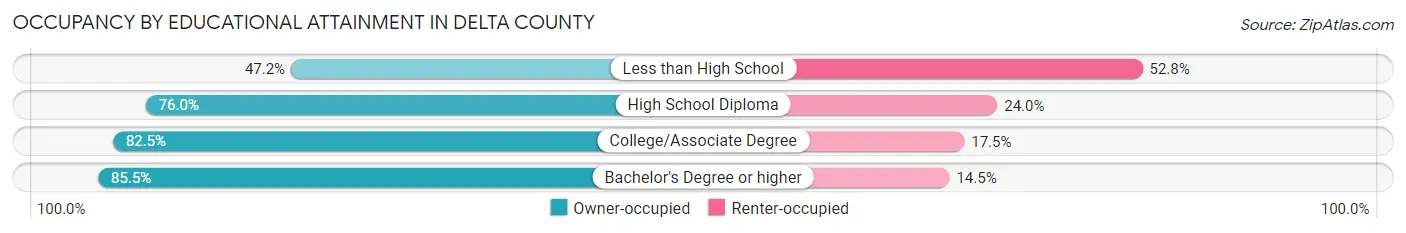
| Household Size | Owner-occupied | Renter-occupied |
| Less than High School | 538 (47.2%) | 602 (52.8%) |
| High School Diploma | 4,063 (76.0%) | 1,284 (24.0%) |
| College/Associate Degree | 5,027 (82.5%) | 1,064 (17.5%) |
| Bachelor's Degree or higher | 2,797 (85.5%) | 476 (14.5%) |
Occupancy by Age of Householder in Delta County
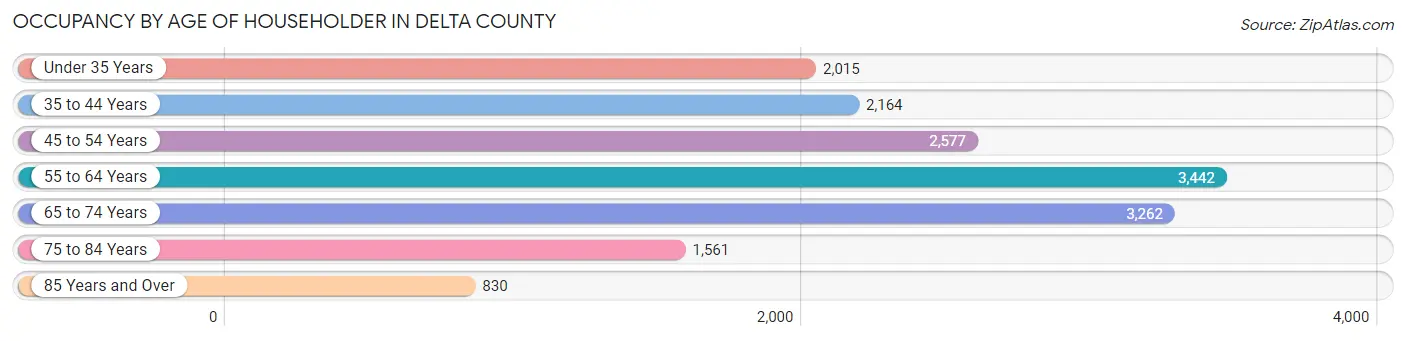
| Age Bracket | # Households | % Households |
| Under 35 Years | 2,015 | 12.7% |
| 35 to 44 Years | 2,164 | 13.7% |
| 45 to 54 Years | 2,577 | 16.3% |
| 55 to 64 Years | 3,442 | 21.7% |
| 65 to 74 Years | 3,262 | 20.6% |
| 75 to 84 Years | 1,561 | 9.9% |
| 85 Years and Over | 830 | 5.2% |
| Total | 15,851 | 100.0% |
Housing Finances in Delta County
Median Income by Occupancy in Delta County
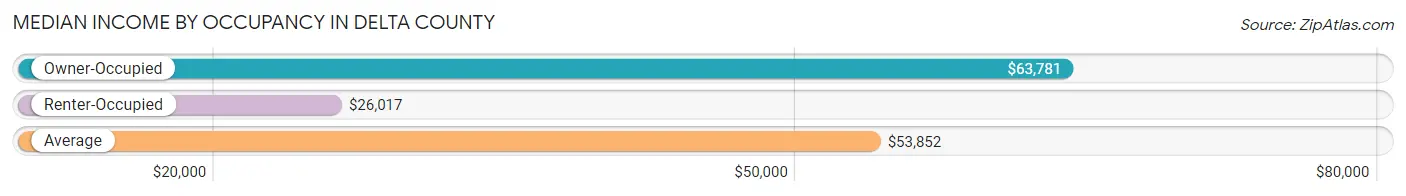
| Occupancy Type | # Households | Median Income |
| Owner-Occupied | 12,425 (78.4%) | $63,781 |
| Renter-Occupied | 3,426 (21.6%) | $26,017 |
| Average | 15,851 (100.0%) | $53,852 |
Occupancy by Householder Income Bracket in Delta County
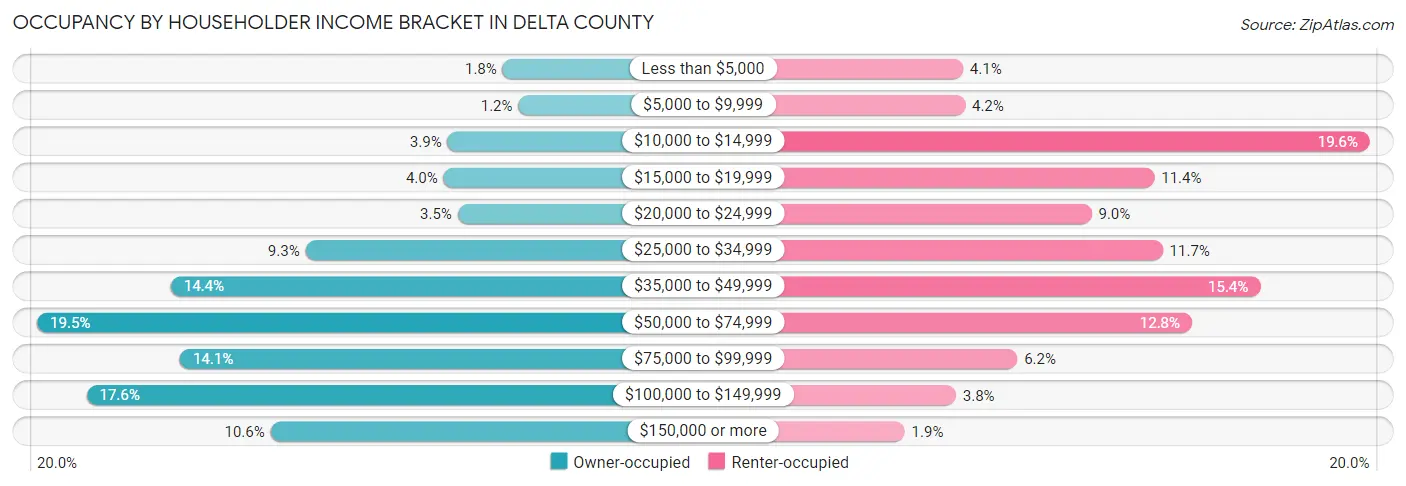
| Income Bracket | Owner-occupied | Renter-occupied |
| Less than $5,000 | 222 (1.8%) | 140 (4.1%) |
| $5,000 to $9,999 | 148 (1.2%) | 143 (4.2%) |
| $10,000 to $14,999 | 483 (3.9%) | 671 (19.6%) |
| $15,000 to $19,999 | 502 (4.0%) | 390 (11.4%) |
| $20,000 to $24,999 | 435 (3.5%) | 308 (9.0%) |
| $25,000 to $34,999 | 1,155 (9.3%) | 401 (11.7%) |
| $35,000 to $49,999 | 1,793 (14.4%) | 528 (15.4%) |
| $50,000 to $74,999 | 2,425 (19.5%) | 439 (12.8%) |
| $75,000 to $99,999 | 1,749 (14.1%) | 211 (6.2%) |
| $100,000 to $149,999 | 2,192 (17.6%) | 131 (3.8%) |
| $150,000 or more | 1,321 (10.6%) | 64 (1.9%) |
| Total | 12,425 (100.0%) | 3,426 (100.0%) |
Monthly Housing Cost Tiers in Delta County

| Monthly Cost | Owner-occupied | Renter-occupied |
| Less than $300 | 908 (7.3%) | 426 (12.4%) |
| $300 to $499 | 2,854 (23.0%) | 615 (17.9%) |
| $500 to $799 | 2,838 (22.8%) | 1,029 (30.0%) |
| $800 to $999 | 1,346 (10.8%) | 620 (18.1%) |
| $1,000 to $1,499 | 2,815 (22.7%) | 351 (10.2%) |
| $1,500 to $1,999 | 1,193 (9.6%) | 51 (1.5%) |
| $2,000 to $2,499 | 350 (2.8%) | 0 (0.0%) |
| $2,500 to $2,999 | 76 (0.6%) | 0 (0.0%) |
| $3,000 or more | 45 (0.4%) | 9 (0.3%) |
| Total | 12,425 (100.0%) | 3,426 (100.0%) |
Physical Housing Characteristics in Delta County
Housing Structures in Delta County
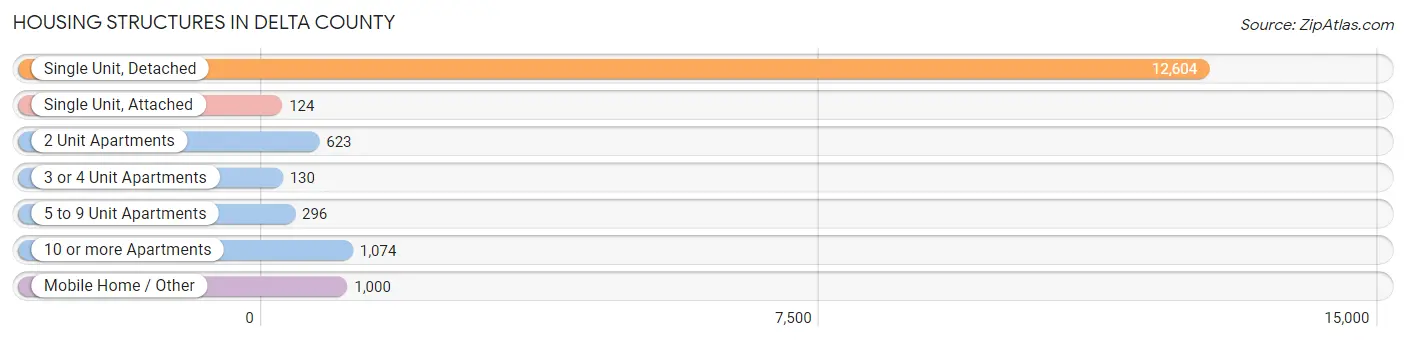
| Structure Type | # Housing Units | % Housing Units |
| Single Unit, Detached | 12,604 | 79.5% |
| Single Unit, Attached | 124 | 0.8% |
| 2 Unit Apartments | 623 | 3.9% |
| 3 or 4 Unit Apartments | 130 | 0.8% |
| 5 to 9 Unit Apartments | 296 | 1.9% |
| 10 or more Apartments | 1,074 | 6.8% |
| Mobile Home / Other | 1,000 | 6.3% |
| Total | 15,851 | 100.0% |
Housing Structures by Occupancy in Delta County
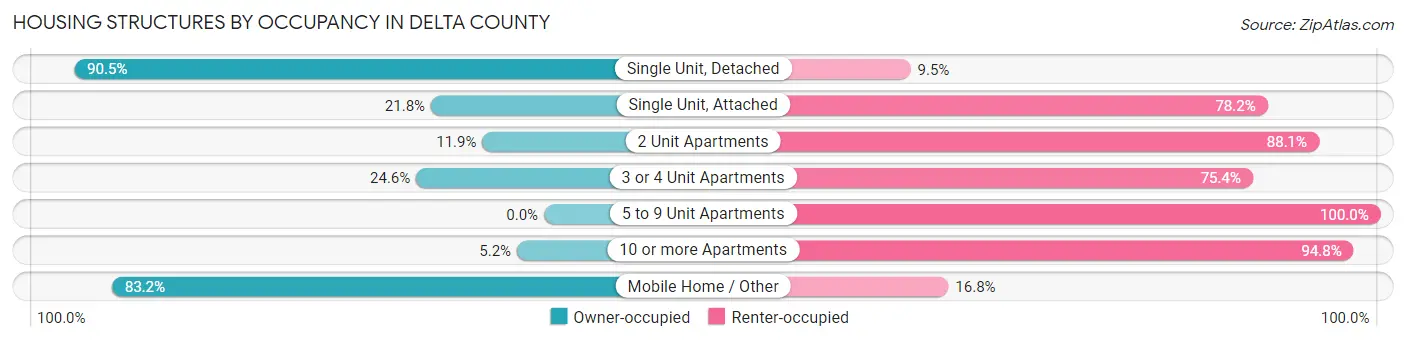
| Structure Type | Owner-occupied | Renter-occupied |
| Single Unit, Detached | 11,404 (90.5%) | 1,200 (9.5%) |
| Single Unit, Attached | 27 (21.8%) | 97 (78.2%) |
| 2 Unit Apartments | 74 (11.9%) | 549 (88.1%) |
| 3 or 4 Unit Apartments | 32 (24.6%) | 98 (75.4%) |
| 5 to 9 Unit Apartments | 0 (0.0%) | 296 (100.0%) |
| 10 or more Apartments | 56 (5.2%) | 1,018 (94.8%) |
| Mobile Home / Other | 832 (83.2%) | 168 (16.8%) |
| Total | 12,425 (78.4%) | 3,426 (21.6%) |
Housing Structures by Number of Rooms in Delta County
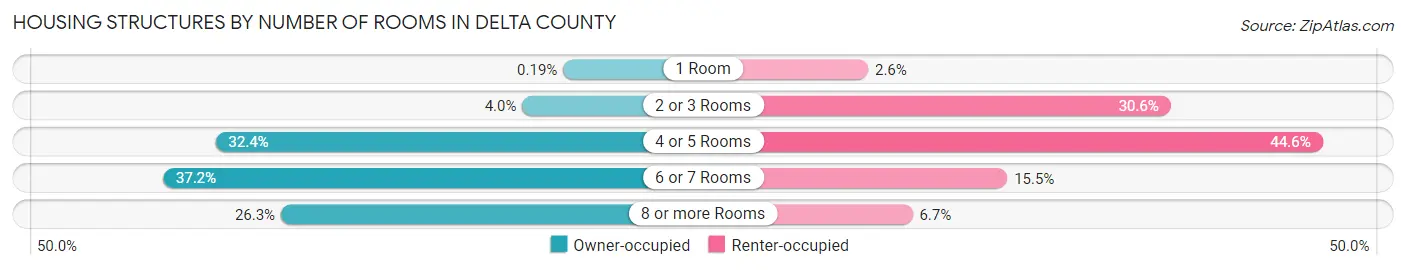
| Number of Rooms | Owner-occupied | Renter-occupied |
| 1 Room | 23 (0.2%) | 89 (2.6%) |
| 2 or 3 Rooms | 493 (4.0%) | 1,048 (30.6%) |
| 4 or 5 Rooms | 4,019 (32.4%) | 1,529 (44.6%) |
| 6 or 7 Rooms | 4,623 (37.2%) | 530 (15.5%) |
| 8 or more Rooms | 3,267 (26.3%) | 230 (6.7%) |
| Total | 12,425 (100.0%) | 3,426 (100.0%) |
Housing Structure by Heating Type in Delta County
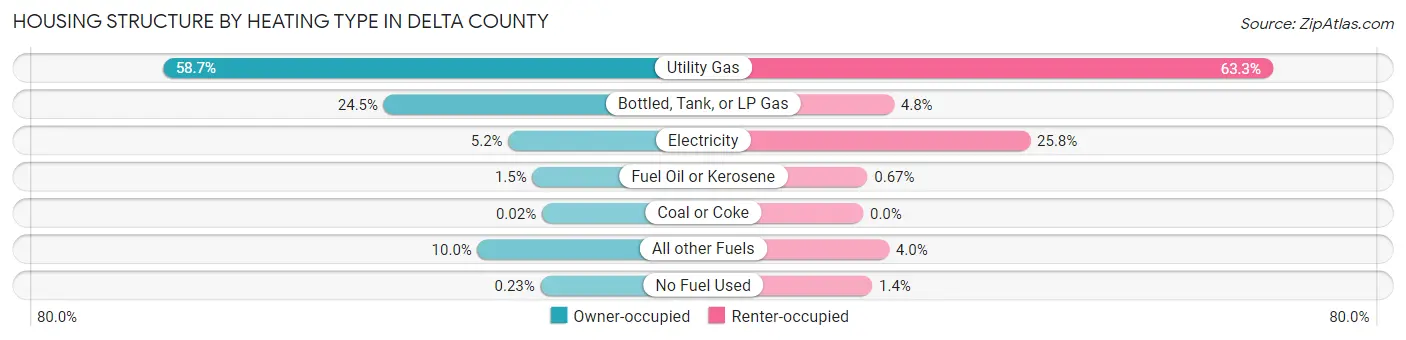
| Heating Type | Owner-occupied | Renter-occupied |
| Utility Gas | 7,287 (58.7%) | 2,170 (63.3%) |
| Bottled, Tank, or LP Gas | 3,039 (24.5%) | 163 (4.8%) |
| Electricity | 647 (5.2%) | 885 (25.8%) |
| Fuel Oil or Kerosene | 184 (1.5%) | 23 (0.7%) |
| Coal or Coke | 2 (0.0%) | 0 (0.0%) |
| All other Fuels | 1,238 (10.0%) | 137 (4.0%) |
| No Fuel Used | 28 (0.2%) | 48 (1.4%) |
| Total | 12,425 (100.0%) | 3,426 (100.0%) |
Household Vehicle Usage in Delta County
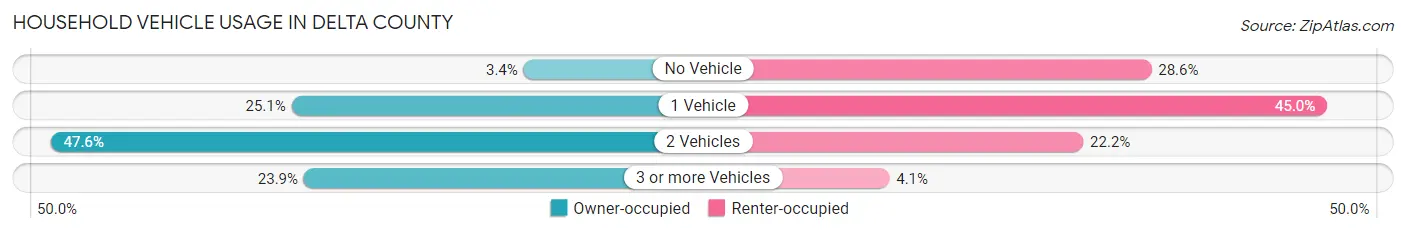
| Vehicles per Household | Owner-occupied | Renter-occupied |
| No Vehicle | 425 (3.4%) | 980 (28.6%) |
| 1 Vehicle | 3,116 (25.1%) | 1,542 (45.0%) |
| 2 Vehicles | 5,911 (47.6%) | 762 (22.2%) |
| 3 or more Vehicles | 2,973 (23.9%) | 142 (4.1%) |
| Total | 12,425 (100.0%) | 3,426 (100.0%) |
Real Estate & Mortgages in Delta County
Real Estate and Mortgage Overview in Delta County
| Characteristic | Without Mortgage | With Mortgage |
| Housing Units | 5,993 | 6,432 |
| Median Property Value | $127,500 | $145,900 |
| Median Household Income | $53,097 | $706 |
| Monthly Housing Costs | $452 | $41 |
| Real Estate Taxes | $1,565 | $375 |
Property Value by Mortgage Status in Delta County
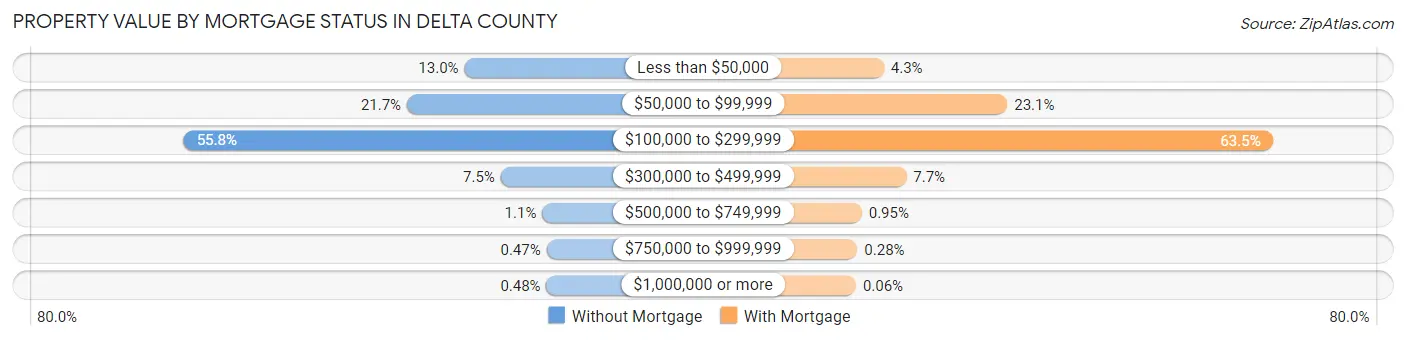
| Property Value | Without Mortgage | With Mortgage |
| Less than $50,000 | 778 (13.0%) | 277 (4.3%) |
| $50,000 to $99,999 | 1,303 (21.7%) | 1,488 (23.1%) |
| $100,000 to $299,999 | 3,341 (55.7%) | 4,086 (63.5%) |
| $300,000 to $499,999 | 447 (7.5%) | 498 (7.7%) |
| $500,000 to $749,999 | 67 (1.1%) | 61 (0.9%) |
| $750,000 to $999,999 | 28 (0.5%) | 18 (0.3%) |
| $1,000,000 or more | 29 (0.5%) | 4 (0.1%) |
| Total | 5,993 (100.0%) | 6,432 (100.0%) |
Household Income by Mortgage Status in Delta County
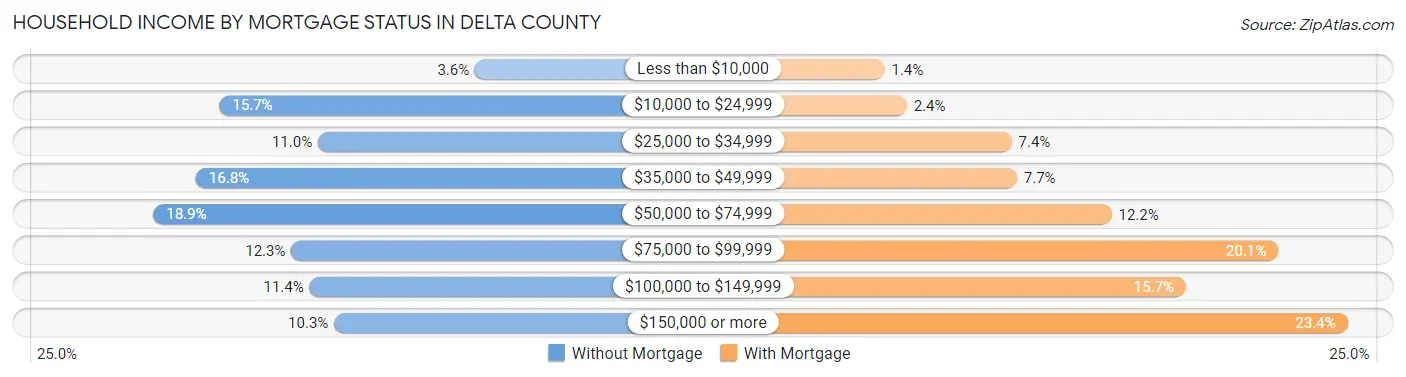
| Household Income | Without Mortgage | With Mortgage |
| Less than $10,000 | 213 (3.5%) | 89 (1.4%) |
| $10,000 to $24,999 | 942 (15.7%) | 157 (2.4%) |
| $25,000 to $34,999 | 661 (11.0%) | 478 (7.4%) |
| $35,000 to $49,999 | 1,009 (16.8%) | 494 (7.7%) |
| $50,000 to $74,999 | 1,131 (18.9%) | 784 (12.2%) |
| $75,000 to $99,999 | 737 (12.3%) | 1,294 (20.1%) |
| $100,000 to $149,999 | 685 (11.4%) | 1,012 (15.7%) |
| $150,000 or more | 615 (10.3%) | 1,507 (23.4%) |
| Total | 5,993 (100.0%) | 6,432 (100.0%) |
Property Value to Household Income Ratio in Delta County
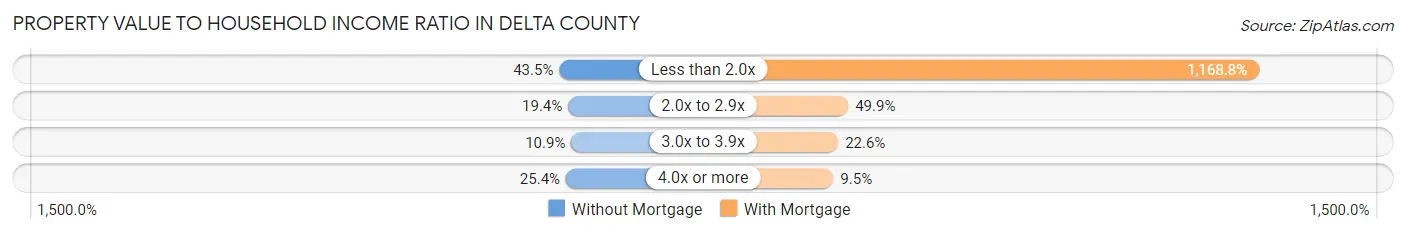
| Value-to-Income Ratio | Without Mortgage | With Mortgage |
| Less than 2.0x | 2,609 (43.5%) | 75,179 (1,168.8%) |
| 2.0x to 2.9x | 1,161 (19.4%) | 3,209 (49.9%) |
| 3.0x to 3.9x | 650 (10.8%) | 1,451 (22.6%) |
| 4.0x or more | 1,521 (25.4%) | 609 (9.5%) |
| Total | 5,993 (100.0%) | 6,432 (100.0%) |
Real Estate Taxes by Mortgage Status in Delta County

| Property Taxes | Without Mortgage | With Mortgage |
| Less than $800 | 932 (15.5%) | 28 (0.4%) |
| $800 to $1,499 | 1,791 (29.9%) | 473 (7.3%) |
| $800 to $1,499 | 2,981 (49.7%) | 1,987 (30.9%) |
| Total | 5,993 (100.0%) | 6,432 (100.0%) |
Health & Disability in Delta County
Health Insurance Coverage by Age in Delta County

| Age Bracket | With Coverage | Without Coverage |
| Under 6 Years | 2,100 (99.1%) | 19 (0.9%) |
| 6 to 18 Years | 5,269 (97.8%) | 119 (2.2%) |
| 19 to 25 Years | 2,358 (91.1%) | 231 (8.9%) |
| 26 to 34 Years | 2,683 (87.4%) | 387 (12.6%) |
| 35 to 44 Years | 3,662 (91.0%) | 363 (9.0%) |
| 45 to 54 Years | 3,991 (89.6%) | 461 (10.3%) |
| 55 to 64 Years | 5,543 (94.6%) | 315 (5.4%) |
| 65 to 74 Years | 5,382 (99.6%) | 22 (0.4%) |
| 75 Years and older | 3,527 (100.0%) | 0 (0.0%) |
| Total | 34,515 (94.7%) | 1,917 (5.3%) |
Health Insurance Coverage by Citizenship Status in Delta County

| Citizenship Status | With Coverage | Without Coverage |
| Native Born | 2,100 (99.1%) | 19 (0.9%) |
| Foreign Born, Citizen | 5,269 (97.8%) | 119 (2.2%) |
| Foreign Born, not a Citizen | 2,358 (91.1%) | 231 (8.9%) |
Health Insurance Coverage by Household Income in Delta County
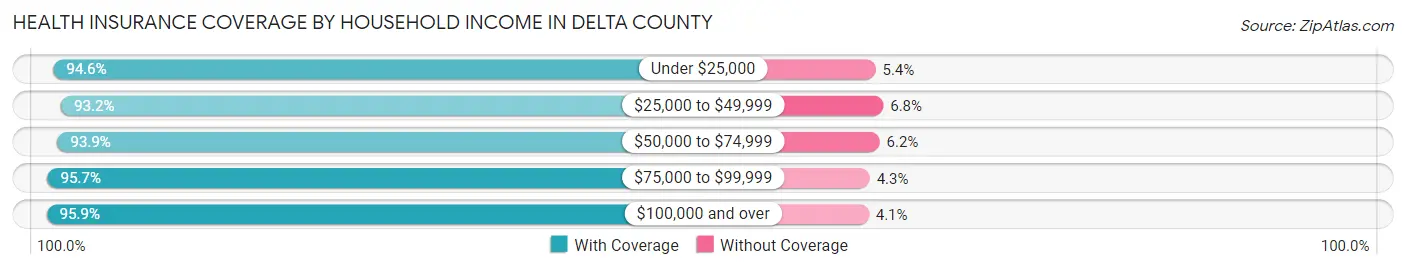
| Household Income | With Coverage | Without Coverage |
| Under $25,000 | 4,737 (94.6%) | 270 (5.4%) |
| $25,000 to $49,999 | 7,031 (93.2%) | 516 (6.8%) |
| $50,000 to $74,999 | 6,406 (93.9%) | 420 (6.1%) |
| $75,000 to $99,999 | 4,938 (95.7%) | 222 (4.3%) |
| $100,000 and over | 11,229 (95.9%) | 482 (4.1%) |
Public vs Private Health Insurance Coverage by Age in Delta County
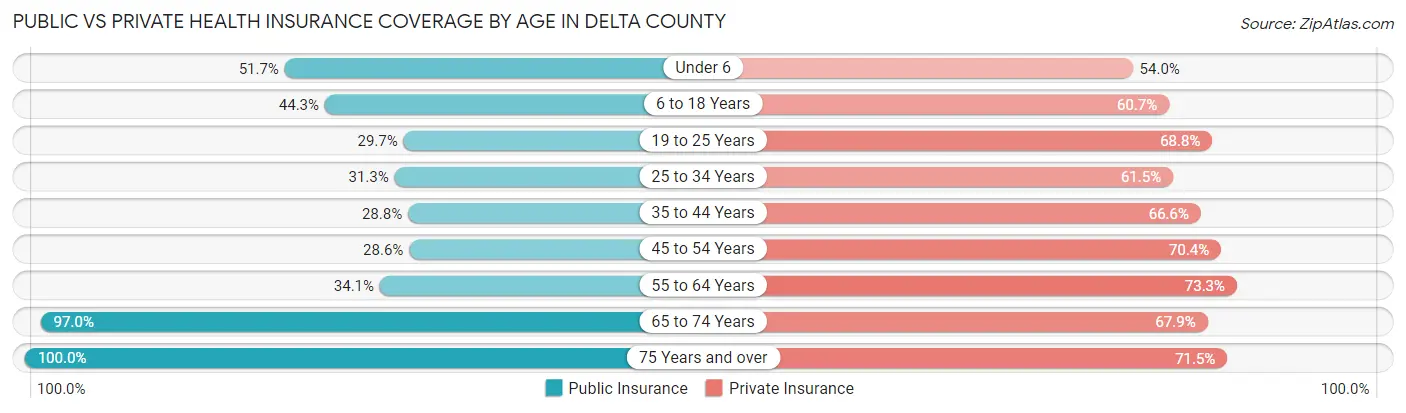
| Age Bracket | Public Insurance | Private Insurance |
| Under 6 | 1,096 (51.7%) | 1,144 (54.0%) |
| 6 to 18 Years | 2,385 (44.3%) | 3,272 (60.7%) |
| 19 to 25 Years | 768 (29.7%) | 1,780 (68.8%) |
| 25 to 34 Years | 962 (31.3%) | 1,887 (61.5%) |
| 35 to 44 Years | 1,161 (28.8%) | 2,682 (66.6%) |
| 45 to 54 Years | 1,274 (28.6%) | 3,134 (70.4%) |
| 55 to 64 Years | 1,995 (34.1%) | 4,295 (73.3%) |
| 65 to 74 Years | 5,244 (97.0%) | 3,668 (67.9%) |
| 75 Years and over | 3,526 (100.0%) | 2,523 (71.5%) |
| Total | 18,411 (50.5%) | 24,385 (66.9%) |
Disability Status by Sex by Age in Delta County
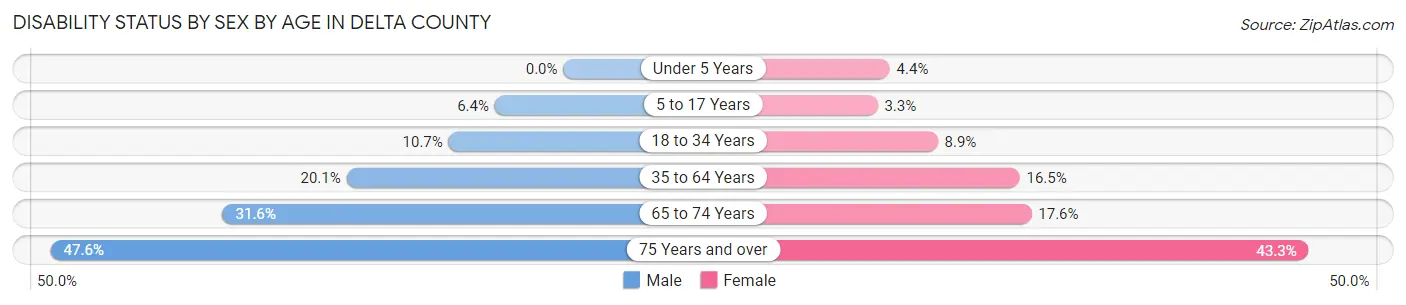
| Age Bracket | Male | Female |
| Under 5 Years | 0 (0.0%) | 37 (4.4%) |
| 5 to 17 Years | 181 (6.4%) | 84 (3.3%) |
| 18 to 34 Years | 337 (10.6%) | 254 (8.9%) |
| 35 to 64 Years | 1,465 (20.1%) | 1,164 (16.5%) |
| 65 to 74 Years | 857 (31.6%) | 474 (17.6%) |
| 75 Years and over | 727 (47.6%) | 866 (43.3%) |
Disability Class by Sex by Age in Delta County
Disability Class: Hearing Difficulty
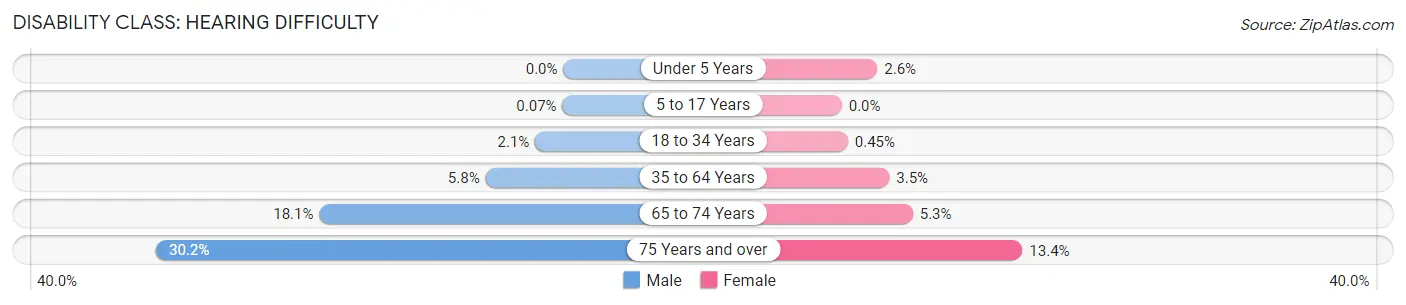
| Age Bracket | Male | Female |
| Under 5 Years | 0 (0.0%) | 22 (2.6%) |
| 5 to 17 Years | 2 (0.1%) | 0 (0.0%) |
| 18 to 34 Years | 66 (2.1%) | 13 (0.4%) |
| 35 to 64 Years | 421 (5.8%) | 249 (3.5%) |
| 65 to 74 Years | 491 (18.1%) | 142 (5.3%) |
| 75 Years and over | 462 (30.2%) | 268 (13.4%) |
Disability Class: Vision Difficulty
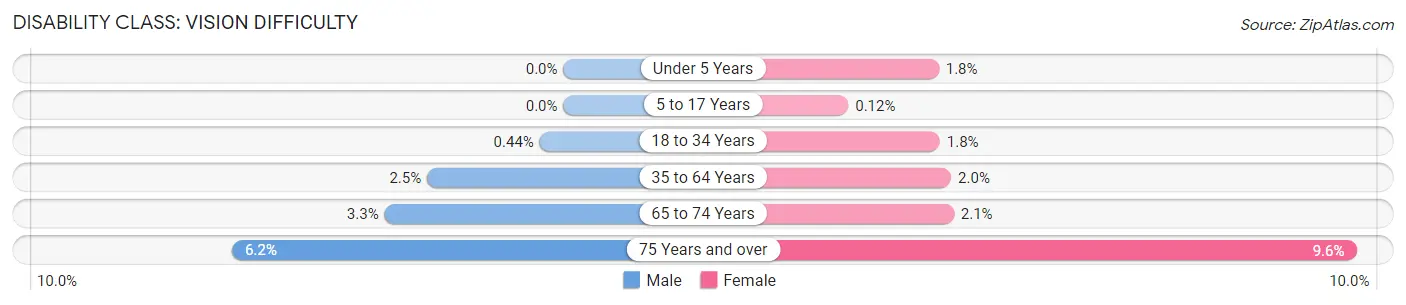
| Age Bracket | Male | Female |
| Under 5 Years | 0 (0.0%) | 15 (1.8%) |
| 5 to 17 Years | 0 (0.0%) | 3 (0.1%) |
| 18 to 34 Years | 14 (0.4%) | 52 (1.8%) |
| 35 to 64 Years | 184 (2.5%) | 143 (2.0%) |
| 65 to 74 Years | 90 (3.3%) | 56 (2.1%) |
| 75 Years and over | 94 (6.1%) | 191 (9.6%) |
Disability Class: Cognitive Difficulty

| Age Bracket | Male | Female |
| 5 to 17 Years | 179 (6.3%) | 79 (3.1%) |
| 18 to 34 Years | 283 (8.9%) | 181 (6.3%) |
| 35 to 64 Years | 581 (8.0%) | 446 (6.3%) |
| 65 to 74 Years | 107 (4.0%) | 98 (3.6%) |
| 75 Years and over | 166 (10.9%) | 365 (18.3%) |
Disability Class: Ambulatory Difficulty
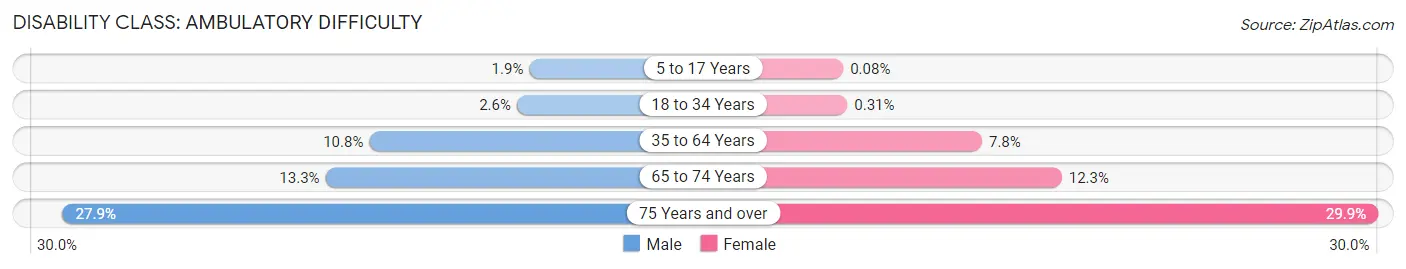
| Age Bracket | Male | Female |
| 5 to 17 Years | 54 (1.9%) | 2 (0.1%) |
| 18 to 34 Years | 82 (2.6%) | 9 (0.3%) |
| 35 to 64 Years | 787 (10.8%) | 551 (7.8%) |
| 65 to 74 Years | 359 (13.3%) | 330 (12.2%) |
| 75 Years and over | 426 (27.9%) | 597 (29.9%) |
Disability Class: Self-Care Difficulty
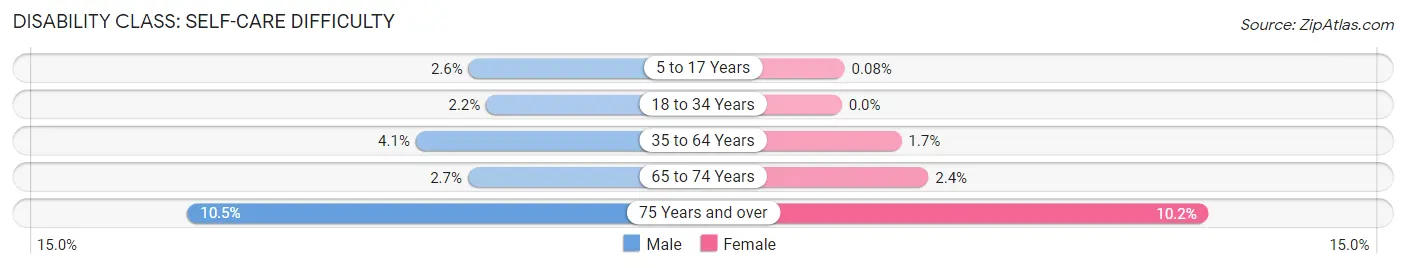
| Age Bracket | Male | Female |
| 5 to 17 Years | 75 (2.6%) | 2 (0.1%) |
| 18 to 34 Years | 68 (2.1%) | 0 (0.0%) |
| 35 to 64 Years | 299 (4.1%) | 117 (1.7%) |
| 65 to 74 Years | 72 (2.7%) | 65 (2.4%) |
| 75 Years and over | 160 (10.5%) | 204 (10.2%) |
Technology Access in Delta County
Computing Device Access in Delta County

| Device Type | # Households | % Households |
| Desktop or Laptop | 11,186 | 70.6% |
| Smartphone | 12,371 | 78.0% |
| Tablet | 8,676 | 54.7% |
| No Computing Device | 1,687 | 10.6% |
| Total | 15,851 | 100.0% |
Internet Access in Delta County
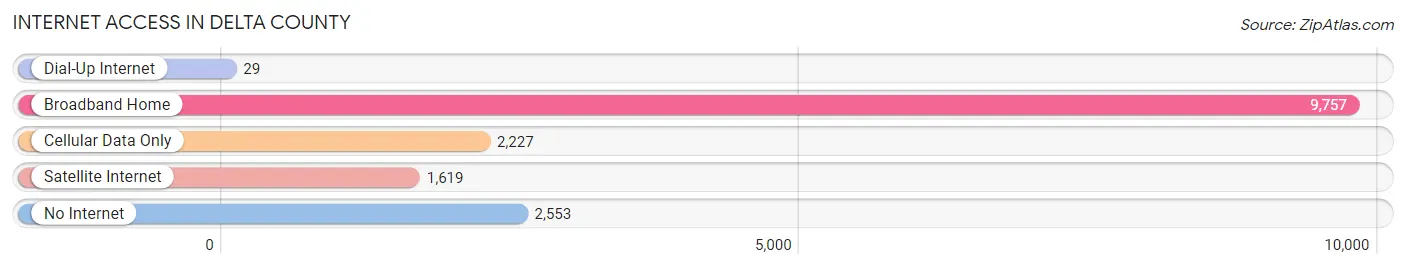
| Internet Type | # Households | % Households |
| Dial-Up Internet | 29 | 0.2% |
| Broadband Home | 9,757 | 61.6% |
| Cellular Data Only | 2,227 | 14.1% |
| Satellite Internet | 1,619 | 10.2% |
| No Internet | 2,553 | 16.1% |
| Total | 15,851 | 100.0% |
Delta County Summary
County History
Delta County is located in the Upper Peninsula of Michigan and is bordered by Menominee County to the north, Dickinson County to the east, Marquette County to the south, and Alger and Schoolcraft Counties to the west. The county was established in 1861 and was named after the Greek letter Delta, which is the fourth letter of the Greek alphabet. The county was originally part of Mackinac County, which was established in 1818.
The first settlers in Delta County were French fur traders who arrived in the area in the late 1700s. The first permanent settlers arrived in the early 1800s and were mostly of Scandinavian and German descent. The first town in the county was Escanaba, which was founded in 1866. The county was largely rural until the late 1800s when the lumber industry began to boom. The lumber industry was the main source of employment in the county until the early 1900s when the mining industry began to take off.
The county experienced a population boom in the early 1900s due to the mining industry. The population peaked in 1920 at over 40,000 people. The population has since declined due to the decline of the mining industry and the out-migration of people to other parts of the state. The population in 2020 was estimated to be around 37,000 people.
Geography
Delta County is located in the Upper Peninsula of Michigan and is bordered by Menominee County to the north, Dickinson County to the east, Marquette County to the south, and Alger and Schoolcraft Counties to the west. The county covers an area of 1,845 square miles and is the second largest county in the state.
The county is mostly rural and is home to several small towns and villages. The largest city in the county is Escanaba, which is located on the shores of Little Bay de Noc. Other towns in the county include Gladstone, Rapid River, and Garden.
The county is home to several lakes, rivers, and streams. The largest lake in the county is Lake Michigan, which is located on the western border of the county. Other lakes in the county include Big Bay de Noc, Little Bay de Noc, and Lake Antoine. The Escanaba River runs through the county and is a popular destination for fishing and boating.
Economy
Delta County has a diverse economy that is largely based on agriculture, manufacturing, and tourism. The county is home to several large agricultural operations, including dairy farms, fruit orchards, and vegetable farms. The county is also home to several manufacturing companies, including paper mills, food processing plants, and metal fabrication plants.
The county is also a popular tourist destination due to its proximity to Lake Michigan and its many outdoor recreational opportunities. The county is home to several state parks, including Fayette State Park, which is located on the shores of Lake Michigan. The county is also home to several golf courses, ski resorts, and other recreational attractions.
Demographics
As of the 2020 census, Delta County had an estimated population of 37,000 people. The population is largely white (94.3%) and the median age is 44.7 years. The median household income is $45,845 and the median home value is $128,400.
The county is home to several Native American tribes, including the Bay Mills Indian Community, the Sault Ste. Marie Tribe of Chippewa Indians, and the Keweenaw Bay Indian Community. The county is also home to several immigrant communities, including a large Finnish population.
Conclusion
Delta County is a rural county located in the Upper Peninsula of Michigan. The county has a diverse economy that is largely based on agriculture, manufacturing, and tourism. The county is home to several Native American tribes and immigrant communities. The population is largely white and the median age is 44.7 years. The median household income is $45,845 and the median home value is $128,400.
Common Questions
What is the Total Population of Delta County?
Total Population of Delta County is 36,839.
What is the Total Male Population of Delta County?
Total Male Population of Delta County is 18,645.
What is the Total Female Population of Delta County?
Total Female Population of Delta County is 18,194.
What is the Ratio of Males per 100 Females in Delta County?
There are 102.48 Males per 100 Females in Delta County.
What is the Ratio of Females per 100 Males in Delta County?
There are 97.58 Females per 100 Males in Delta County.
What is the Median Population Age in Delta County?
Median Population Age in Delta County is 47.6 Years.
What is the Average Family Size in Delta County
Average Family Size in Delta County is 2.8 People.
What is the Average Household Size in Delta County
Average Household Size in Delta County is 2.3 People.
What is Per Capita Income in Delta County?
Per Capita income in Delta County is $32,311.
What is the Median Family Income in Delta County?
Median Family Income in Delta County is $72,385.
What is the Median Household income in Delta County?
Median Household Income in Delta County is $53,852.
What is Income or Wage Gap in Delta County?
Income or Wage Gap in Delta County is 41.5%.
Women in Delta County earn 58.5 cents for every dollar earned by a man.
What is Family Income Deficit in Delta County?
Family Income Deficit in Delta County is $10,416.
Families that are below poverty line in Delta County earn $10,416 less on average than the poverty threshold level.
What is Inequality or Gini Index in Delta County?
Inequality or Gini Index in Delta County is 0.45.
How Large is the Labor Force in Delta County?
There are 15,908 People in the Labor Forcein in Delta County.
What is the Percentage of People in the Labor Force in Delta County?
51.7% of People are in the Labor Force in Delta County.
What is the Unemployment Rate in Delta County?
Unemployment Rate in Delta County is 5.2%.