Clare County, MI
Clare County Map
Clare County Overview
30,998
TOTAL POPULATION
15,586
MALE POPULATION
15,412
FEMALE POPULATION
101.13
MALES / 100 FEMALES
98.88
FEMALES / 100 MALES
48.2
MEDIAN AGE
3.2
AVG FAMILY SIZE
2.6
AVG HOUSEHOLD SIZE
$27,147
PER CAPITA INCOME
$57,063
AVG FAMILY INCOME
$47,816
AVG HOUSEHOLD INCOME
31.9%
WAGE / INCOME GAP [ % ]
68.1¢/ $1
WAGE / INCOME GAP [ $ ]
$8,218
FAMILY INCOME DEFICIT
0.46
INEQUALITY / GINI INDEX
12,180
LABOR FORCE [ PEOPLE ]
47.6%
PERCENT IN LABOR FORCE
9.3%
UNEMPLOYMENT RATE
Clare County Area Codes
Race in Clare County
The most populous races in Clare County are White / Caucasian (29,348 | 94.7%), Two or more Races (1,043 | 3.4%), and Hispanic or Latino (713 | 2.3%).

| Race | # Population | % Population |
| Asian | 102 | 0.3% |
| Black / African American | 253 | 0.8% |
| Hawaiian / Pacific | 0 | 0.0% |
| Hispanic or Latino | 713 | 2.3% |
| Native / Alaskan | 128 | 0.4% |
| White / Caucasian | 29,348 | 94.7% |
| Two or more Races | 1,043 | 3.4% |
| Some other Race | 124 | 0.4% |
| Total | 30,998 | 100.0% |
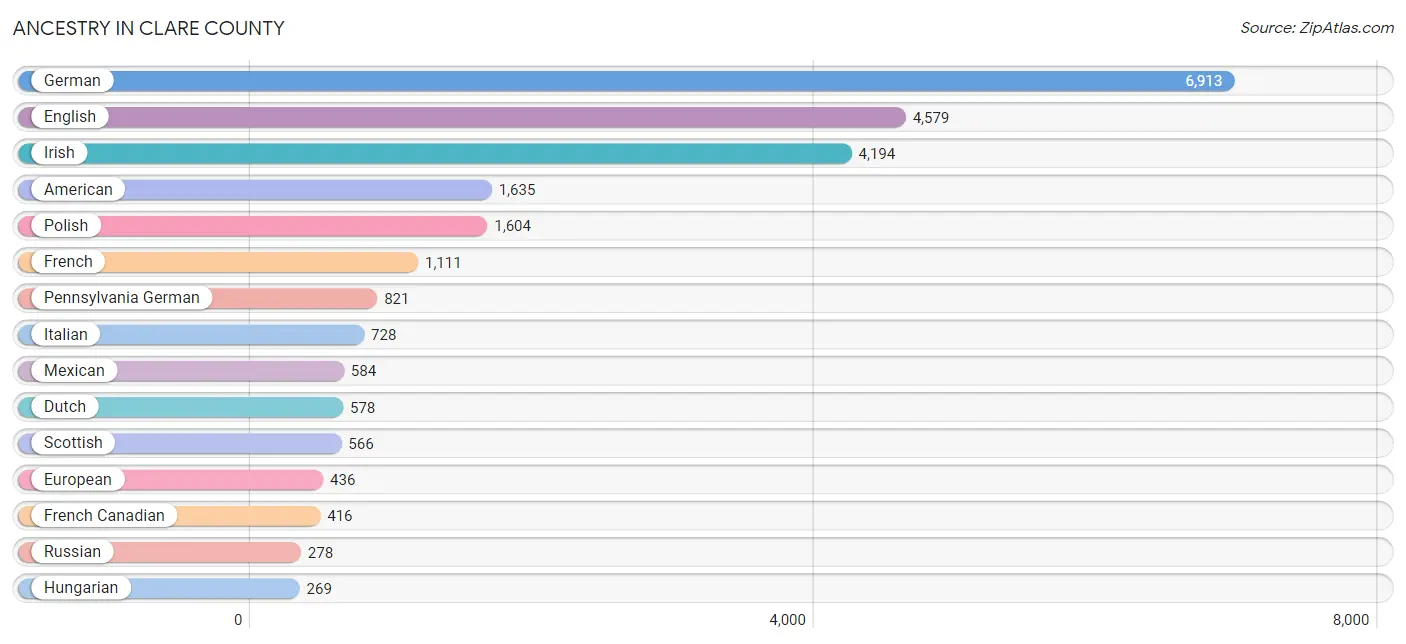
Ancestry in Clare County
The most populous ancestries reported in Clare County are German (6,913 | 22.3%), English (4,579 | 14.8%), Irish (4,194 | 13.5%), American (1,635 | 5.3%), and Polish (1,604 | 5.2%), together accounting for 61.0% of all Clare County residents.
| Ancestry | # Population | % Population |
| African | 34 | 0.1% |
| Albanian | 6 | 0.0% |
| American | 1,635 | 5.3% |
| Apache | 9 | 0.0% |
| Arab | 29 | 0.1% |
| Armenian | 3 | 0.0% |
| Austrian | 67 | 0.2% |
| Belgian | 106 | 0.3% |
| Bhutanese | 14 | 0.1% |
| Blackfeet | 14 | 0.1% |
| British | 91 | 0.3% |
| Burmese | 23 | 0.1% |
| Canadian | 266 | 0.9% |
| Celtic | 3 | 0.0% |
| Central American | 8 | 0.0% |
| Cherokee | 92 | 0.3% |
| Chippewa | 211 | 0.7% |
| Cuban | 30 | 0.1% |
| Czech | 73 | 0.2% |
| Czechoslovakian | 18 | 0.1% |
| Danish | 64 | 0.2% |
| Dutch | 578 | 1.9% |
| Eastern European | 25 | 0.1% |
| English | 4,579 | 14.8% |
| European | 436 | 1.4% |
| Finnish | 89 | 0.3% |
| French | 1,111 | 3.6% |
| French American Indian | 27 | 0.1% |
| French Canadian | 416 | 1.3% |
| German | 6,913 | 22.3% |
| Greek | 18 | 0.1% |
| Guatemalan | 8 | 0.0% |
| Hungarian | 269 | 0.9% |
| Irish | 4,194 | 13.5% |
| Iroquois | 15 | 0.1% |
| Italian | 728 | 2.4% |
| Korean | 86 | 0.3% |
| Latvian | 2 | 0.0% |
| Lebanese | 14 | 0.1% |
| Lithuanian | 55 | 0.2% |
| Maltese | 13 | 0.0% |
| Mexican | 584 | 1.9% |
| Navajo | 10 | 0.0% |
| Nigerian | 22 | 0.1% |
| Northern European | 8 | 0.0% |
| Norwegian | 185 | 0.6% |
| Ottawa | 17 | 0.1% |
| Pennsylvania German | 821 | 2.6% |
| Polish | 1,604 | 5.2% |
| Portuguese | 13 | 0.0% |
| Potawatomi | 8 | 0.0% |
| Puerto Rican | 30 | 0.1% |
| Romanian | 85 | 0.3% |
| Russian | 278 | 0.9% |
| Scandinavian | 170 | 0.5% |
| Scotch-Irish | 143 | 0.5% |
| Scottish | 566 | 1.8% |
| Serbian | 20 | 0.1% |
| Sioux | 9 | 0.0% |
| Slavic | 8 | 0.0% |
| Slovak | 22 | 0.1% |
| Spaniard | 6 | 0.0% |
| Spanish | 37 | 0.1% |
| Subsaharan African | 56 | 0.2% |
| Swedish | 212 | 0.7% |
| Swiss | 173 | 0.6% |
| Ukrainian | 188 | 0.6% |
| Welsh | 97 | 0.3% |
| Yugoslavian | 23 | 0.1% | View All 69 Rows |
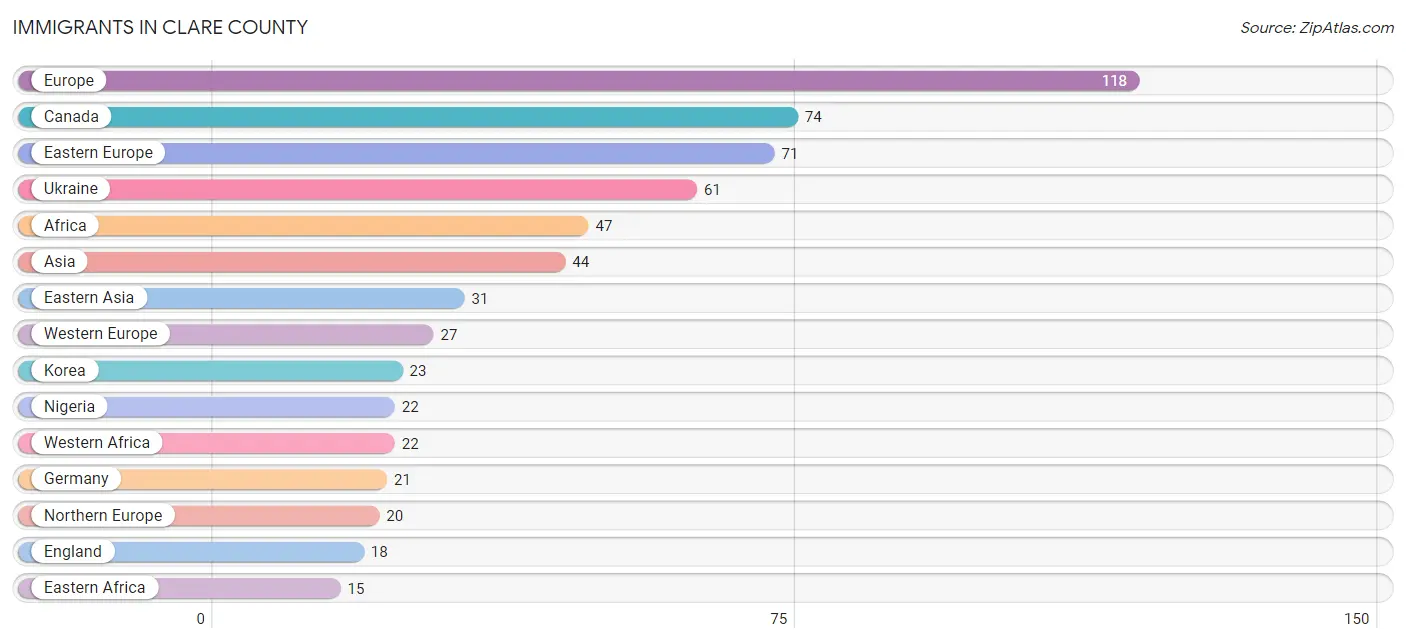
Immigrants in Clare County
The most numerous immigrant groups reported in Clare County came from Europe (118 | 0.4%), Canada (74 | 0.2%), Eastern Europe (71 | 0.2%), Ukraine (61 | 0.2%), and Africa (47 | 0.2%), together accounting for 1.2% of all Clare County residents.
| Immigration Origin | # Population | % Population |
| Africa | 47 | 0.2% |
| Albania | 6 | 0.0% |
| Argentina | 1 | 0.0% |
| Asia | 44 | 0.1% |
| Austria | 6 | 0.0% |
| Canada | 74 | 0.2% |
| Central America | 8 | 0.0% |
| China | 8 | 0.0% |
| Czechoslovakia | 4 | 0.0% |
| Denmark | 2 | 0.0% |
| Eastern Africa | 15 | 0.1% |
| Eastern Asia | 31 | 0.1% |
| Eastern Europe | 71 | 0.2% |
| England | 18 | 0.1% |
| Europe | 118 | 0.4% |
| Germany | 21 | 0.1% |
| Guatemala | 6 | 0.0% |
| Hong Kong | 8 | 0.0% |
| Korea | 23 | 0.1% |
| Latin America | 9 | 0.0% |
| Mexico | 2 | 0.0% |
| Nigeria | 22 | 0.1% |
| Northern Europe | 20 | 0.1% |
| Philippines | 13 | 0.0% |
| South America | 1 | 0.0% |
| South Eastern Asia | 13 | 0.0% |
| Ukraine | 61 | 0.2% |
| Western Africa | 22 | 0.1% |
| Western Europe | 27 | 0.1% | View All 29 Rows |
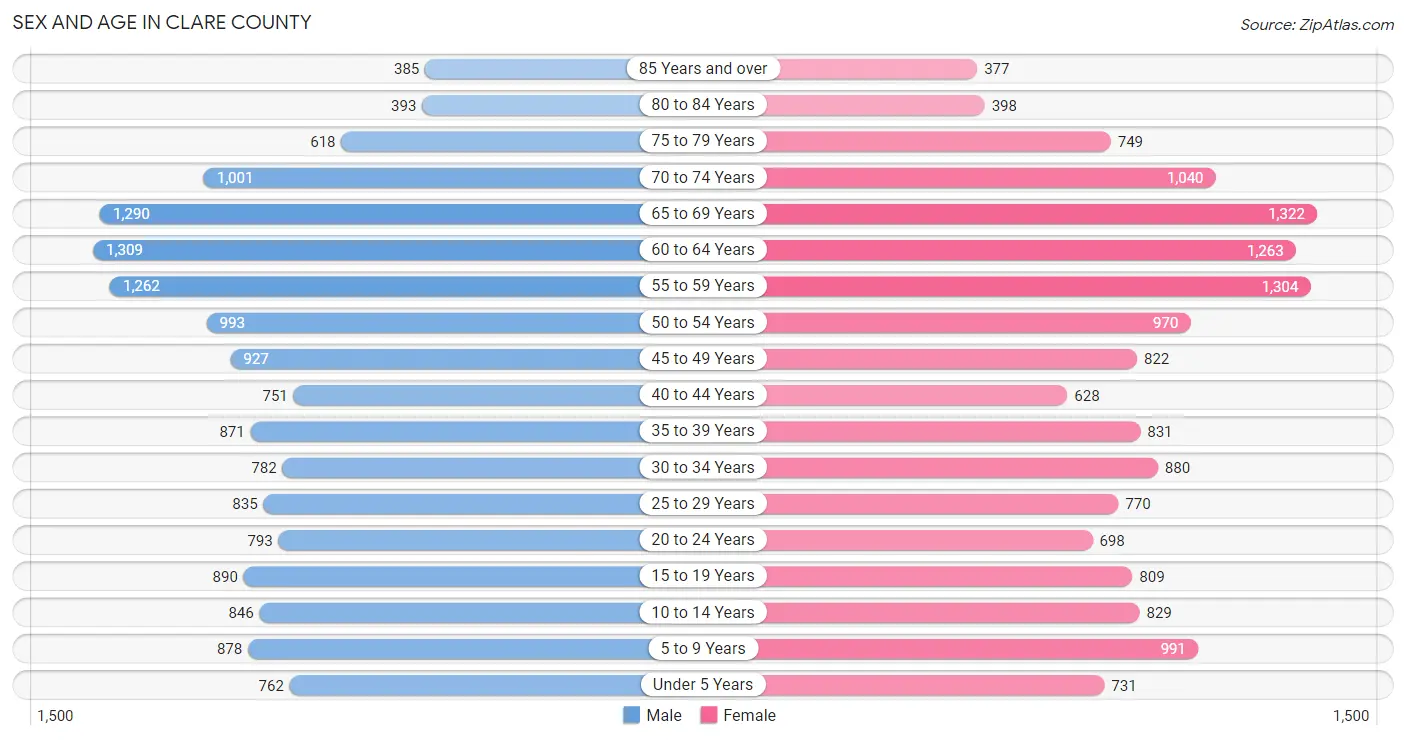
Sex and Age in Clare County
Sex and Age in Clare County
The most populous age groups in Clare County are 60 to 64 Years (1,309 | 8.4%) for men and 65 to 69 Years (1,322 | 8.6%) for women.
| Age Bracket | Male | Female |
| Under 5 Years | 762 (4.9%) | 731 (4.7%) |
| 5 to 9 Years | 878 (5.6%) | 991 (6.4%) |
| 10 to 14 Years | 846 (5.4%) | 829 (5.4%) |
| 15 to 19 Years | 890 (5.7%) | 809 (5.2%) |
| 20 to 24 Years | 793 (5.1%) | 698 (4.5%) |
| 25 to 29 Years | 835 (5.4%) | 770 (5.0%) |
| 30 to 34 Years | 782 (5.0%) | 880 (5.7%) |
| 35 to 39 Years | 871 (5.6%) | 831 (5.4%) |
| 40 to 44 Years | 751 (4.8%) | 628 (4.1%) |
| 45 to 49 Years | 927 (5.9%) | 822 (5.3%) |
| 50 to 54 Years | 993 (6.4%) | 970 (6.3%) |
| 55 to 59 Years | 1,262 (8.1%) | 1,304 (8.5%) |
| 60 to 64 Years | 1,309 (8.4%) | 1,263 (8.2%) |
| 65 to 69 Years | 1,290 (8.3%) | 1,322 (8.6%) |
| 70 to 74 Years | 1,001 (6.4%) | 1,040 (6.8%) |
| 75 to 79 Years | 618 (4.0%) | 749 (4.9%) |
| 80 to 84 Years | 393 (2.5%) | 398 (2.6%) |
| 85 Years and over | 385 (2.5%) | 377 (2.5%) |
| Total | 15,586 (100.0%) | 15,412 (100.0%) |
Families and Households in Clare County
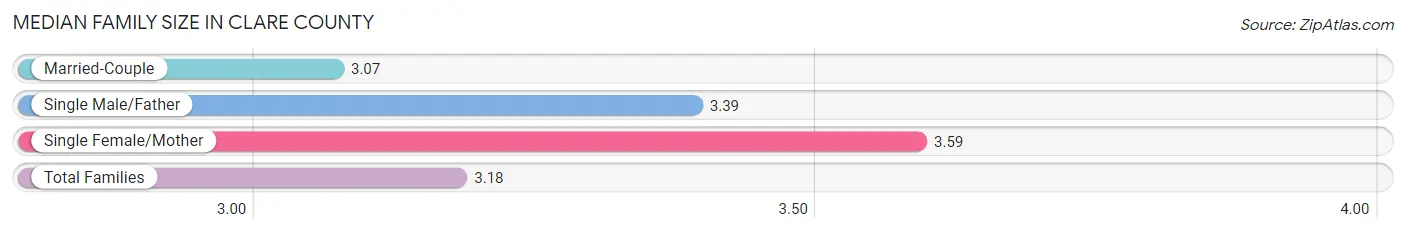
Median Family Size in Clare County
The median family size in Clare County is 3.18 persons per family, with single female/mother families (1,195 | 15.7%) accounting for the largest median family size of 3.59 persons per family. On the other hand, married-couple families (5,796 | 76.2%) represent the smallest median family size with 3.07 persons per family.
| Family Type | # Families | Family Size |
| Married-Couple | 5,796 (76.2%) | 3.07 |
| Single Male/Father | 618 (8.1%) | 3.39 |
| Single Female/Mother | 1,195 (15.7%) | 3.59 |
| Total Families | 7,609 (100.0%) | 3.18 |
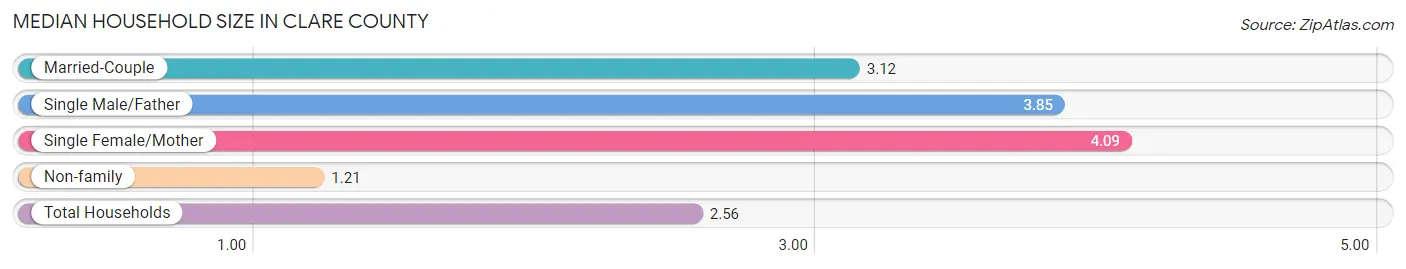
Median Household Size in Clare County
The median household size in Clare County is 2.56 persons per household, with single female/mother households (1,195 | 10.0%) accounting for the largest median household size of 4.09 persons per household. non-family households (4,326 | 36.2%) represent the smallest median household size with 1.21 persons per household.
| Household Type | # Households | Household Size |
| Married-Couple | 5,796 (48.6%) | 3.12 |
| Single Male/Father | 618 (5.2%) | 3.85 |
| Single Female/Mother | 1,195 (10.0%) | 4.09 |
| Non-family | 4,326 (36.2%) | 1.21 |
| Total Households | 11,935 (100.0%) | 2.56 |
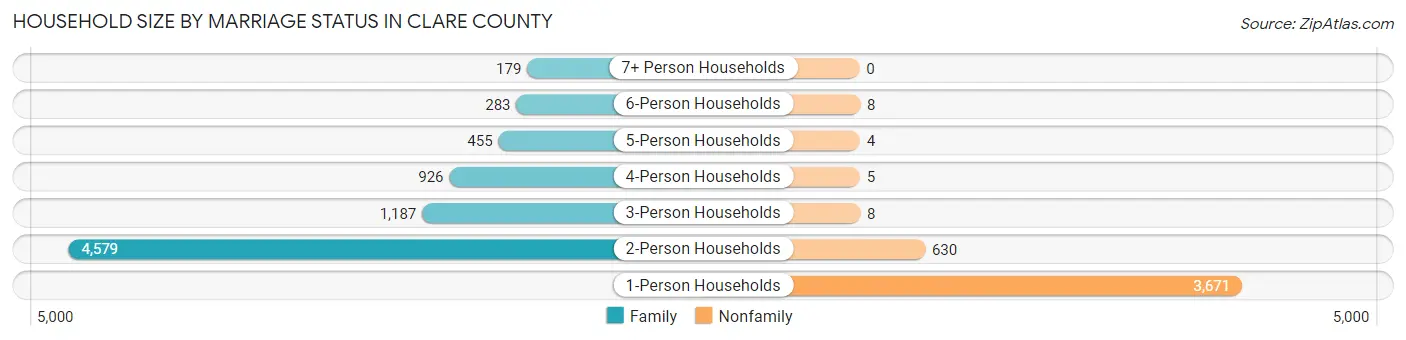
Household Size by Marriage Status in Clare County
Out of a total of 11,935 households in Clare County, 7,609 (63.7%) are family households, while 4,326 (36.2%) are nonfamily households. The most numerous type of family households are 2-person households, comprising 4,579, and the most common type of nonfamily households are 1-person households, comprising 3,671.
| Household Size | Family Households | Nonfamily Households |
| 1-Person Households | - | 3,671 (30.8%) |
| 2-Person Households | 4,579 (38.4%) | 630 (5.3%) |
| 3-Person Households | 1,187 (10.0%) | 8 (0.1%) |
| 4-Person Households | 926 (7.8%) | 5 (0.0%) |
| 5-Person Households | 455 (3.8%) | 4 (0.0%) |
| 6-Person Households | 283 (2.4%) | 8 (0.1%) |
| 7+ Person Households | 179 (1.5%) | 0 (0.0%) |
| Total | 7,609 (63.7%) | 4,326 (36.2%) |
Female Fertility in Clare County
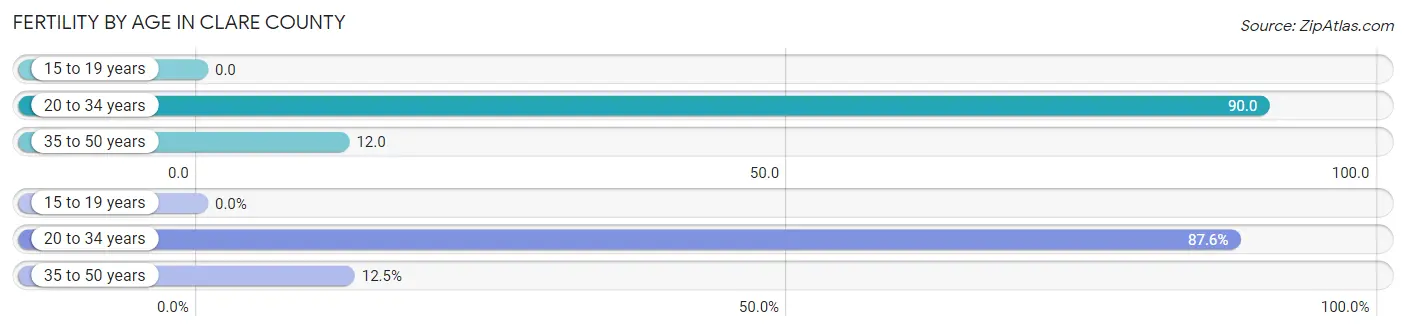
Fertility by Age in Clare County
Average fertility rate in Clare County is 43.0 births per 1,000 women. Women in the age bracket of 20 to 34 years have the highest fertility rate with 90.0 births per 1,000 women. Women in the age bracket of 20 to 34 years acount for 87.5% of all women with births.
| Age Bracket | Women with Births | Births / 1,000 Women |
| 15 to 19 years | 0 (0.0%) | 0.0 |
| 20 to 34 years | 211 (87.5%) | 90.0 |
| 35 to 50 years | 30 (12.4%) | 12.0 |
| Total | 241 (100.0%) | 43.0 |
Fertility by Age by Marriage Status in Clare County
50.2% of women with births (241) in Clare County are married. The highest percentage of unmarried women with births falls into 20 to 34 years age bracket with 56.9% of them unmarried at the time of birth, while the lowest percentage of unmarried women with births belong to 35 to 50 years age bracket with 0.0% of them unmarried.
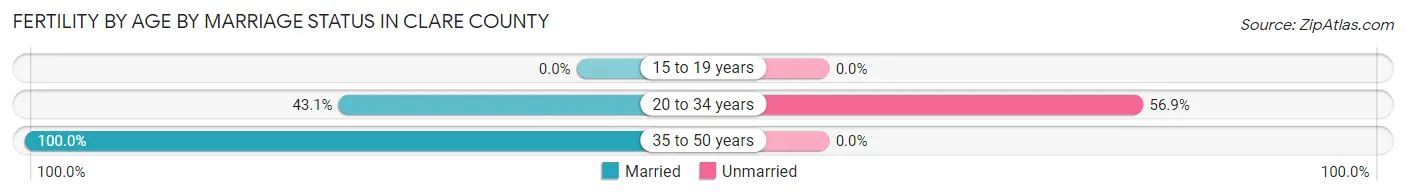
| Age Bracket | Married | Unmarried |
| 15 to 19 years | 0 (0.0%) | 0 (0.0%) |
| 20 to 34 years | 91 (43.1%) | 120 (56.9%) |
| 35 to 50 years | 30 (100.0%) | 0 (0.0%) |
| Total | 121 (50.2%) | 120 (49.8%) |
Fertility by Education in Clare County
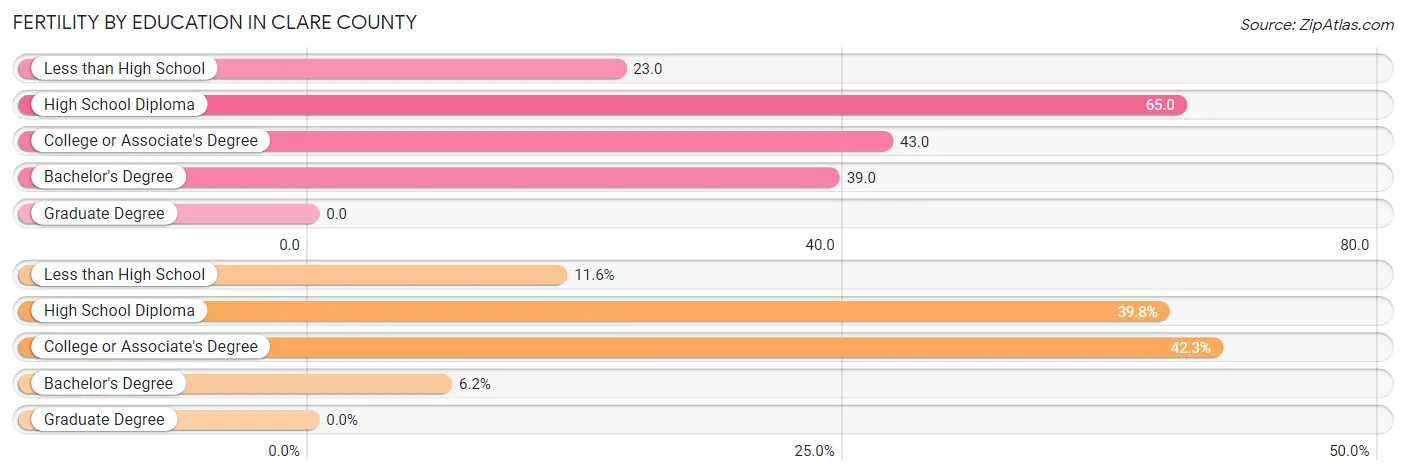
| Educational Attainment | Women with Births | Births / 1,000 Women |
| Less than High School | 28 (11.6%) | 23.0 |
| High School Diploma | 96 (39.8%) | 65.0 |
| College or Associate's Degree | 102 (42.3%) | 43.0 |
| Bachelor's Degree | 15 (6.2%) | 39.0 |
| Graduate Degree | 0 (0.0%) | 0.0 |
| Total | 241 (100.0%) | 43.0 |
Fertility by Education by Marriage Status in Clare County
49.8% of women with births in Clare County are unmarried. Women with the educational attainment of bachelor's degree are most likely to be married with 100.0% of them married at childbirth, while women with the educational attainment of high school diploma are least likely to be married with 72.9% of them unmarried at childbirth.

| Educational Attainment | Married | Unmarried |
| Less than High School | 13 (46.4%) | 15 (53.6%) |
| High School Diploma | 26 (27.1%) | 70 (72.9%) |
| College or Associate's Degree | 67 (65.7%) | 35 (34.3%) |
| Bachelor's Degree | 15 (100.0%) | 0 (0.0%) |
| Graduate Degree | 0 (0.0%) | 0 (0.0%) |
| Total | 121 (50.2%) | 120 (49.8%) |
Income in Clare County
Income Overview in Clare County
Per Capita Income in Clare County is $27,147, while median incomes of families and households are $57,063 and $47,816 respectively.
| Characteristic | Number | Measure |
| Per Capita Income | 30,998 | $27,147 |
| Median Family Income | 7,609 | $57,063 |
| Mean Family Income | 7,609 | $75,080 |
| Median Household Income | 11,935 | $47,816 |
| Mean Household Income | 11,935 | $65,699 |
| Income Deficit | 7,609 | $8,218 |
| Wage / Income Gap (%) | 30,998 | 31.93% |
| Wage / Income Gap ($) | 30,998 | 68.07¢ per $1 |
| Gini / Inequality Index | 30,998 | 0.46 |
Earnings by Sex in Clare County
Average Earnings in Clare County are $27,923, $35,039 for men and $23,850 for women, a difference of 31.9%.
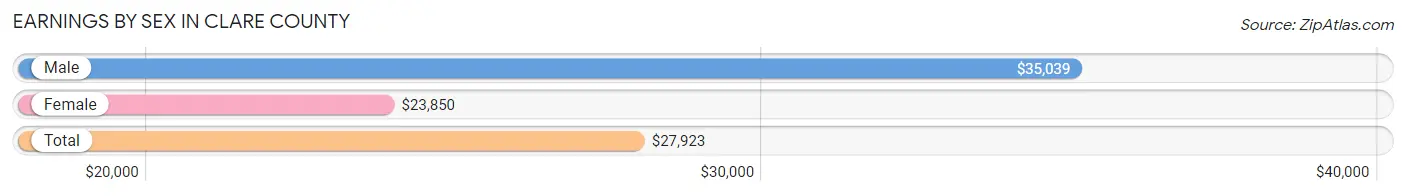
| Sex | Number | Average Earnings |
| Male | 6,737 (52.8%) | $35,039 |
| Female | 6,033 (47.2%) | $23,850 |
| Total | 12,770 (100.0%) | $27,923 |
Earnings by Sex by Income Bracket in Clare County
The most common earnings brackets in Clare County are $2,499 or less for men (504 | 7.5%) and $25,000 to $29,999 for women (639 | 10.6%).
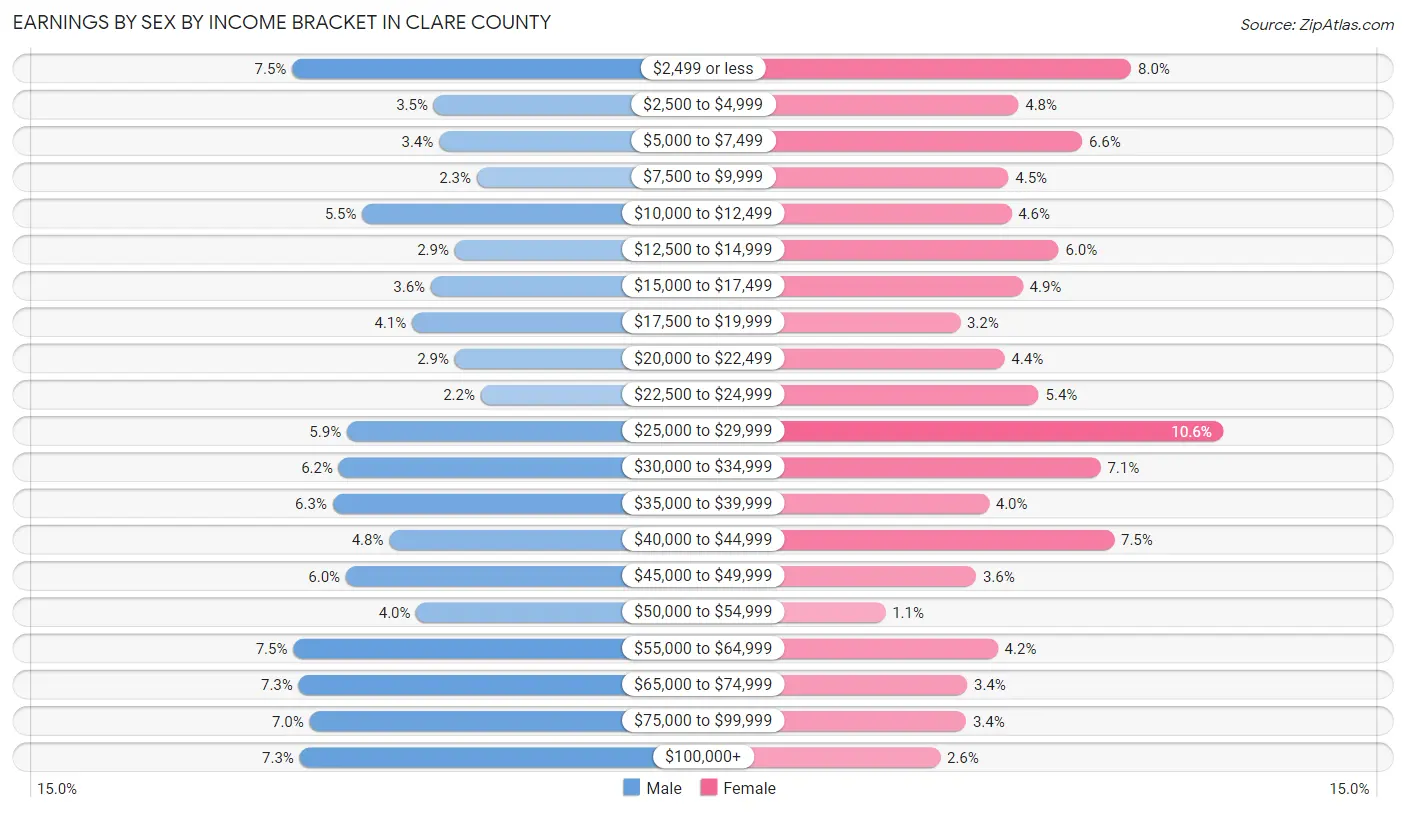
| Income | Male | Female |
| $2,499 or less | 504 (7.5%) | 482 (8.0%) |
| $2,500 to $4,999 | 236 (3.5%) | 291 (4.8%) |
| $5,000 to $7,499 | 226 (3.4%) | 399 (6.6%) |
| $7,500 to $9,999 | 154 (2.3%) | 274 (4.5%) |
| $10,000 to $12,499 | 371 (5.5%) | 279 (4.6%) |
| $12,500 to $14,999 | 196 (2.9%) | 359 (5.9%) |
| $15,000 to $17,499 | 241 (3.6%) | 298 (4.9%) |
| $17,500 to $19,999 | 277 (4.1%) | 192 (3.2%) |
| $20,000 to $22,499 | 196 (2.9%) | 267 (4.4%) |
| $22,500 to $24,999 | 147 (2.2%) | 325 (5.4%) |
| $25,000 to $29,999 | 400 (5.9%) | 639 (10.6%) |
| $30,000 to $34,999 | 416 (6.2%) | 430 (7.1%) |
| $35,000 to $39,999 | 427 (6.3%) | 241 (4.0%) |
| $40,000 to $44,999 | 320 (4.8%) | 453 (7.5%) |
| $45,000 to $49,999 | 402 (6.0%) | 219 (3.6%) |
| $50,000 to $54,999 | 269 (4.0%) | 65 (1.1%) |
| $55,000 to $64,999 | 502 (7.4%) | 256 (4.2%) |
| $65,000 to $74,999 | 492 (7.3%) | 204 (3.4%) |
| $75,000 to $99,999 | 471 (7.0%) | 202 (3.4%) |
| $100,000+ | 490 (7.3%) | 158 (2.6%) |
| Total | 6,737 (100.0%) | 6,033 (100.0%) |
Earnings by Sex by Educational Attainment in Clare County
Average earnings in Clare County are $39,483 for men and $25,754 for women, a difference of 34.8%. Men with an educational attainment of graduate degree enjoy the highest average annual earnings of $71,198, while those with less than high school education earn the least with $26,950. Women with an educational attainment of graduate degree earn the most with the average annual earnings of $62,000, while those with less than high school education have the smallest earnings of $15,917.
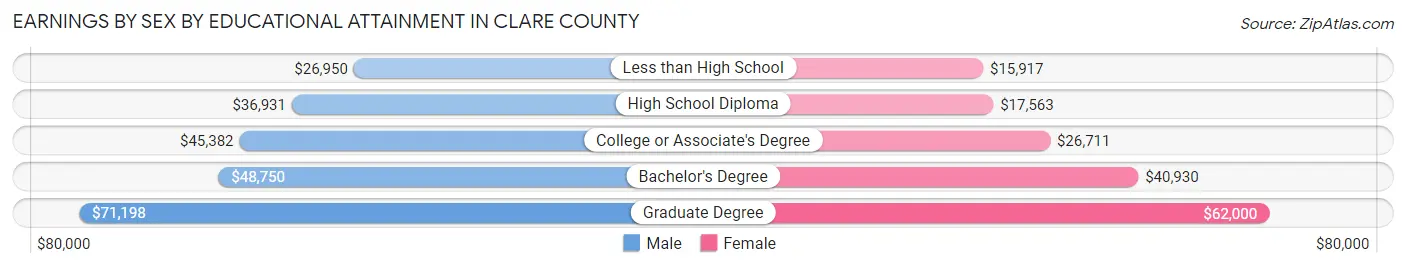
| Educational Attainment | Male Income | Female Income |
| Less than High School | $26,950 | $15,917 |
| High School Diploma | $36,931 | $17,563 |
| College or Associate's Degree | $45,382 | $26,711 |
| Bachelor's Degree | $48,750 | $40,930 |
| Graduate Degree | $71,198 | $62,000 |
| Total | $39,483 | $25,754 |
Family Income in Clare County
Family Income Brackets in Clare County
According to the Clare County family income data, there are 1,666 families falling into the $50,000 to $74,999 income range, which is the most common income bracket and makes up 21.9% of all families. Conversely, the less than $10,000 income bracket is the least frequent group with only 251 families (3.3%) belonging to this category.
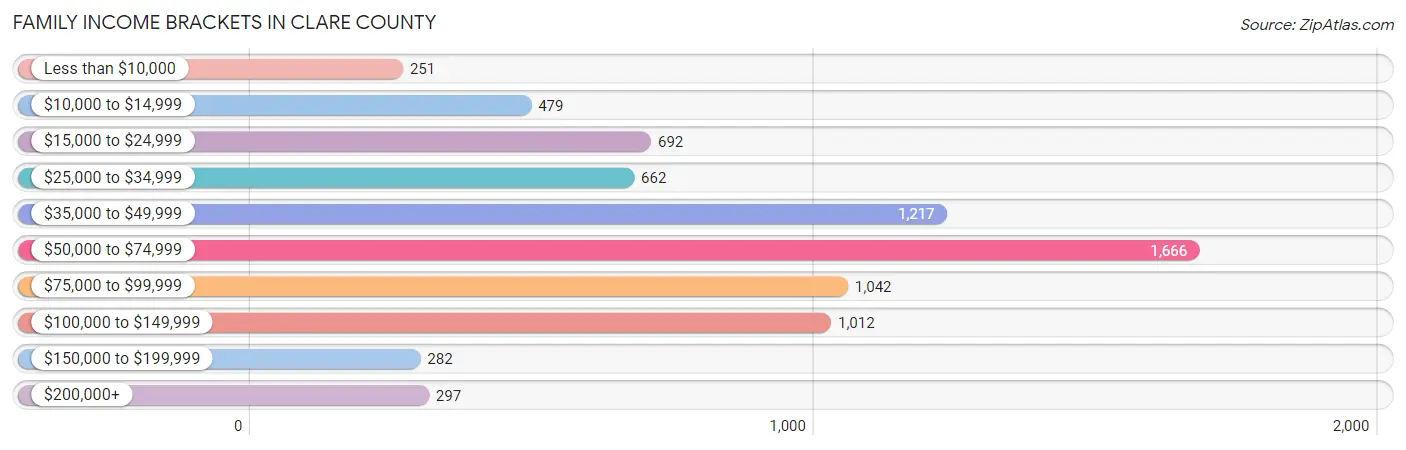
| Income Bracket | # Families | % Families |
| Less than $10,000 | 251 | 3.3% |
| $10,000 to $14,999 | 479 | 6.3% |
| $15,000 to $24,999 | 692 | 9.1% |
| $25,000 to $34,999 | 662 | 8.7% |
| $35,000 to $49,999 | 1,217 | 16.0% |
| $50,000 to $74,999 | 1,666 | 21.9% |
| $75,000 to $99,999 | 1,042 | 13.7% |
| $100,000 to $149,999 | 1,012 | 13.3% |
| $150,000 to $199,999 | 282 | 3.7% |
| $200,000+ | 297 | 3.9% |
Family Income by Famaliy Size in Clare County
7+ person families (158 | 2.1%) account for the highest median family income in Clare County with $196,875 per family, while 7+ person families (158 | 2.1%) have the highest median income of $28,125 per family member.
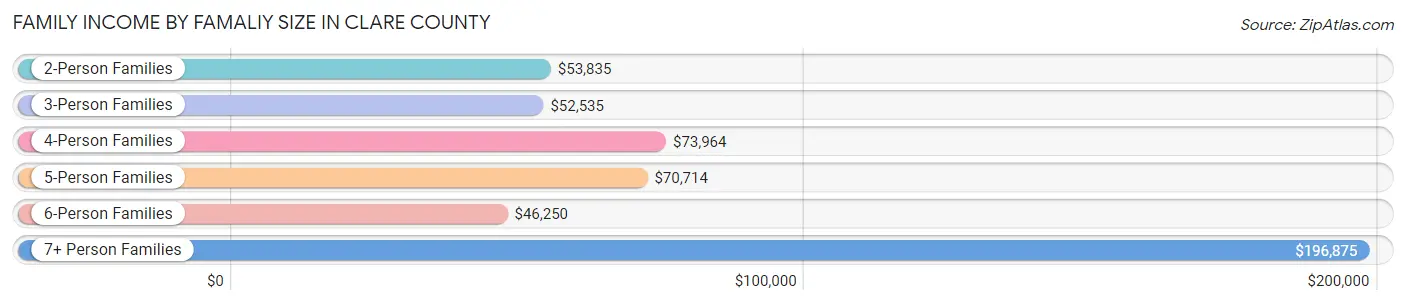
| Income Bracket | # Families | Median Income |
| 2-Person Families | 4,820 (63.3%) | $53,835 |
| 3-Person Families | 1,269 (16.7%) | $52,535 |
| 4-Person Families | 747 (9.8%) | $73,964 |
| 5-Person Families | 370 (4.9%) | $70,714 |
| 6-Person Families | 245 (3.2%) | $46,250 |
| 7+ Person Families | 158 (2.1%) | $196,875 |
| Total | 7,609 (100.0%) | $57,063 |
Family Income by Number of Earners in Clare County
The median family income in Clare County is $57,063, with families comprising 3+ earners (500) having the highest median family income of $120,600, while families with no earners (2,386) have the lowest median family income of $42,890, accounting for 6.6% and 31.4% of families, respectively.
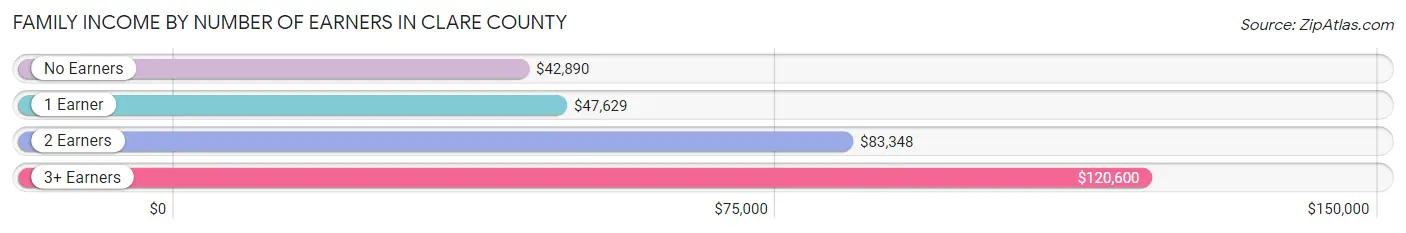
| Number of Earners | # Families | Median Income |
| No Earners | 2,386 (31.4%) | $42,890 |
| 1 Earner | 2,630 (34.6%) | $47,629 |
| 2 Earners | 2,093 (27.5%) | $83,348 |
| 3+ Earners | 500 (6.6%) | $120,600 |
| Total | 7,609 (100.0%) | $57,063 |
Household Income in Clare County
Household Income Brackets in Clare County
With 2,399 households falling in the category, the $50,000 to $74,999 income range is the most frequent in Clare County, accounting for 20.1% of all households. In contrast, only 322 households (2.7%) fall into the $150,000 to $199,999 income bracket, making it the least populous group.

| Income Bracket | # Households | % Households |
| Less than $10,000 | 561 | 4.7% |
| $10,000 to $14,999 | 847 | 7.1% |
| $15,000 to $24,999 | 1,396 | 11.7% |
| $25,000 to $34,999 | 1,456 | 12.2% |
| $35,000 to $49,999 | 2,017 | 16.9% |
| $50,000 to $74,999 | 2,399 | 20.1% |
| $75,000 to $99,999 | 1,384 | 11.6% |
| $100,000 to $149,999 | 1,194 | 10.0% |
| $150,000 to $199,999 | 322 | 2.7% |
| $200,000+ | 358 | 3.0% |
Household Income by Householder Age in Clare County
The median household income in Clare County is $47,816, with the highest median household income of $52,992 found in the 25 to 44 years age bracket for the primary householder. A total of 2,539 households (21.3%) fall into this category. Meanwhile, the 65+ years age bracket for the primary householder has the lowest median household income of $44,221, with 4,750 households (39.8%) in this group.
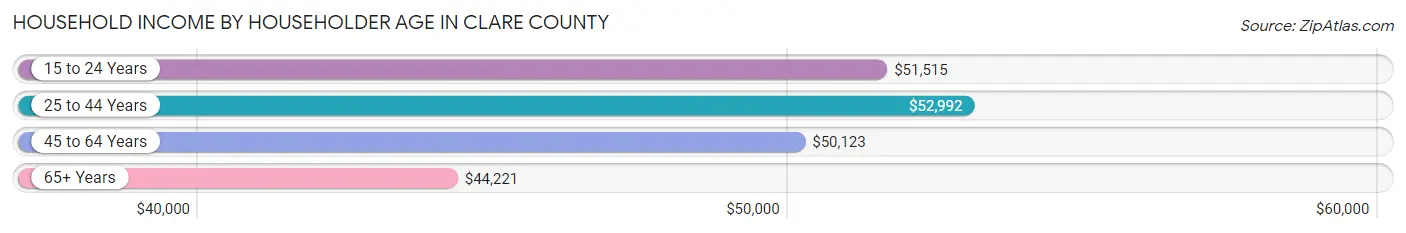
| Income Bracket | # Households | Median Income |
| 15 to 24 Years | 244 (2.0%) | $51,515 |
| 25 to 44 Years | 2,539 (21.3%) | $52,992 |
| 45 to 64 Years | 4,402 (36.9%) | $50,123 |
| 65+ Years | 4,750 (39.8%) | $44,221 |
| Total | 11,935 (100.0%) | $47,816 |
Poverty in Clare County
Income Below Poverty by Sex and Age in Clare County
With 19.9% poverty level for males and 24.3% for females among the residents of Clare County, 12 to 14 year old males and 5 year old females are the most vulnerable to poverty, with 167 males (43.0%) and 172 females (58.7%) in their respective age groups living below the poverty level.
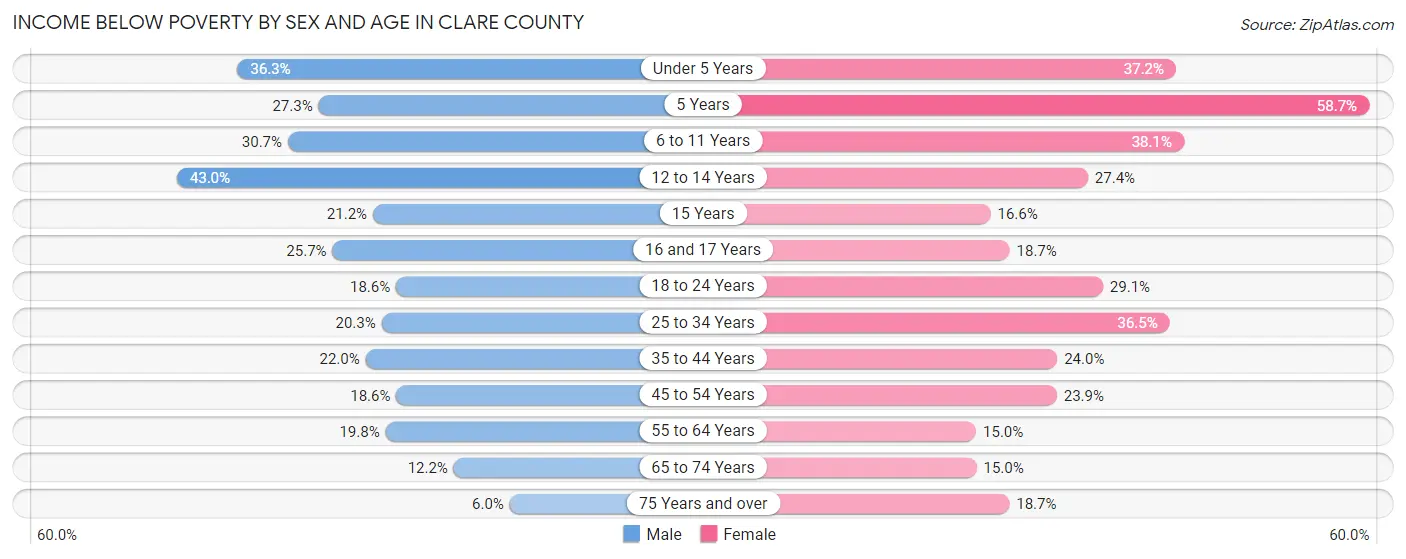
| Age Bracket | Male | Female |
| Under 5 Years | 273 (36.3%) | 263 (37.2%) |
| 5 Years | 30 (27.3%) | 172 (58.7%) |
| 6 to 11 Years | 363 (30.7%) | 364 (38.1%) |
| 12 to 14 Years | 167 (43.0%) | 148 (27.4%) |
| 15 Years | 42 (21.2%) | 29 (16.6%) |
| 16 and 17 Years | 98 (25.7%) | 60 (18.7%) |
| 18 to 24 Years | 202 (18.6%) | 294 (29.1%) |
| 25 to 34 Years | 313 (20.3%) | 596 (36.5%) |
| 35 to 44 Years | 348 (22.0%) | 350 (24.0%) |
| 45 to 54 Years | 355 (18.6%) | 429 (23.9%) |
| 55 to 64 Years | 505 (19.8%) | 382 (15.0%) |
| 65 to 74 Years | 278 (12.2%) | 353 (15.0%) |
| 75 Years and over | 83 (6.0%) | 268 (18.6%) |
| Total | 3,057 (19.9%) | 3,708 (24.3%) |
Income Above Poverty by Sex and Age in Clare County
According to the poverty statistics in Clare County, males aged 75 years and over and females aged 55 to 64 years are the age groups that are most secure financially, with 94.0% of males and 85.0% of females in these age groups living above the poverty line.
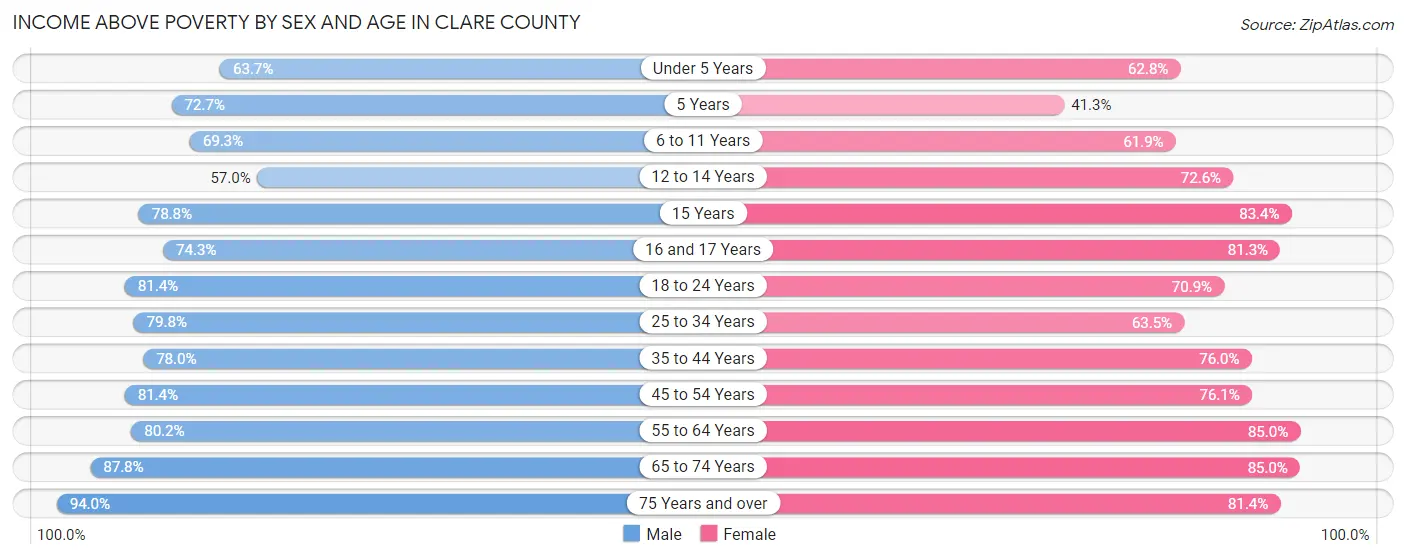
| Age Bracket | Male | Female |
| Under 5 Years | 479 (63.7%) | 444 (62.8%) |
| 5 Years | 80 (72.7%) | 121 (41.3%) |
| 6 to 11 Years | 820 (69.3%) | 592 (61.9%) |
| 12 to 14 Years | 221 (57.0%) | 392 (72.6%) |
| 15 Years | 156 (78.8%) | 146 (83.4%) |
| 16 and 17 Years | 283 (74.3%) | 261 (81.3%) |
| 18 to 24 Years | 882 (81.4%) | 717 (70.9%) |
| 25 to 34 Years | 1,233 (79.7%) | 1,037 (63.5%) |
| 35 to 44 Years | 1,232 (78.0%) | 1,109 (76.0%) |
| 45 to 54 Years | 1,554 (81.4%) | 1,363 (76.1%) |
| 55 to 64 Years | 2,044 (80.2%) | 2,171 (85.0%) |
| 65 to 74 Years | 1,999 (87.8%) | 1,998 (85.0%) |
| 75 Years and over | 1,304 (94.0%) | 1,169 (81.4%) |
| Total | 12,287 (80.1%) | 11,520 (75.6%) |
Income Below Poverty Among Married-Couple Families in Clare County
The poverty statistics for married-couple families in Clare County show that 9.1% or 527 of the total 5,796 families live below the poverty line. Families with 3 or 4 children have the highest poverty rate of 23.0%, comprising of 107 families. On the other hand, families with no children have the lowest poverty rate of 7.5%, which includes 317 families.
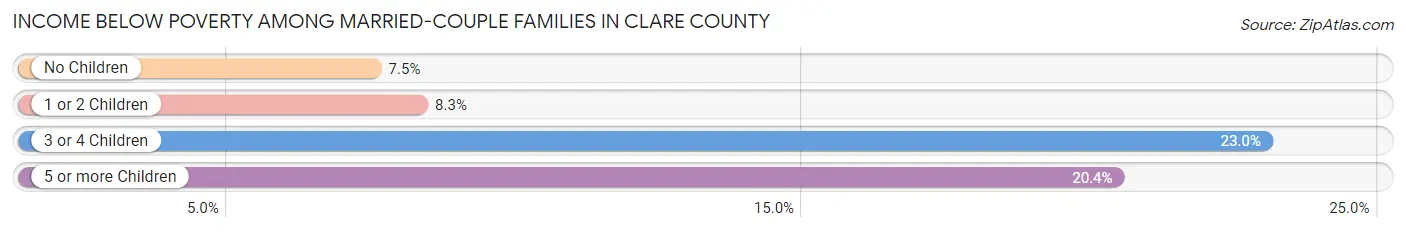
| Children | Above Poverty | Below Poverty |
| No Children | 3,910 (92.5%) | 317 (7.5%) |
| 1 or 2 Children | 927 (91.7%) | 84 (8.3%) |
| 3 or 4 Children | 358 (77.0%) | 107 (23.0%) |
| 5 or more Children | 74 (79.6%) | 19 (20.4%) |
| Total | 5,269 (90.9%) | 527 (9.1%) |
Income Below Poverty Among Single-Parent Households in Clare County
According to the poverty data in Clare County, 35.3% or 218 single-father households and 48.4% or 579 single-mother households are living below the poverty line. Among single-father households, those with 5 or more children have the highest poverty rate, with 8 households (100.0%) experiencing poverty. Likewise, among single-mother households, those with 3 or 4 children have the highest poverty rate, with 75 households (67.0%) falling below the poverty line.
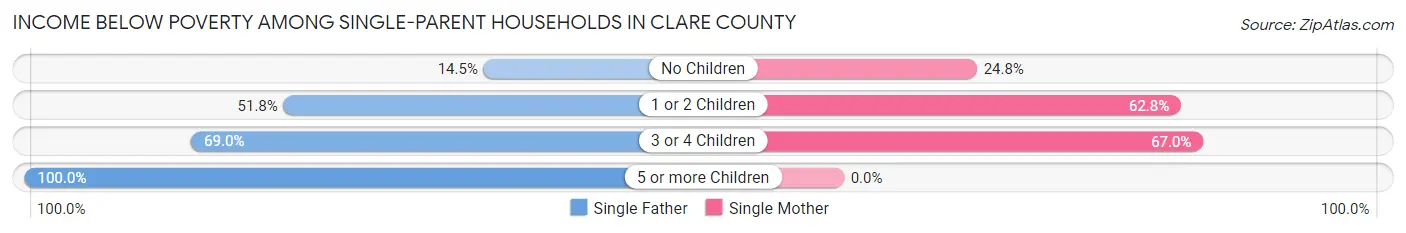
| Children | Single Father | Single Mother |
| No Children | 43 (14.5%) | 115 (24.8%) |
| 1 or 2 Children | 147 (51.8%) | 389 (62.8%) |
| 3 or 4 Children | 20 (69.0%) | 75 (67.0%) |
| 5 or more Children | 8 (100.0%) | 0 (0.0%) |
| Total | 218 (35.3%) | 579 (48.4%) |
Income Below Poverty Among Married-Couple vs Single-Parent Households in Clare County
The poverty data for Clare County shows that 527 of the married-couple family households (9.1%) and 797 of the single-parent households (44.0%) are living below the poverty level. Within the married-couple family households, those with 3 or 4 children have the highest poverty rate, with 107 households (23.0%) falling below the poverty line. Among the single-parent households, those with 5 or more children have the highest poverty rate, with 8 household (100.0%) living below poverty.

| Children | Married-Couple Families | Single-Parent Households |
| No Children | 317 (7.5%) | 158 (20.8%) |
| 1 or 2 Children | 84 (8.3%) | 536 (59.4%) |
| 3 or 4 Children | 107 (23.0%) | 95 (67.4%) |
| 5 or more Children | 19 (20.4%) | 8 (100.0%) |
| Total | 527 (9.1%) | 797 (44.0%) |
Employment Characteristics in Clare County
Employment by Class of Employer in Clare County
Among the 10,714 employed individuals in Clare County, private company employees (7,359 | 68.7%), not-for-profit organizations (901 | 8.4%), and self-employed (not incorporated) (836 | 7.8%) make up the most common classes of employment.
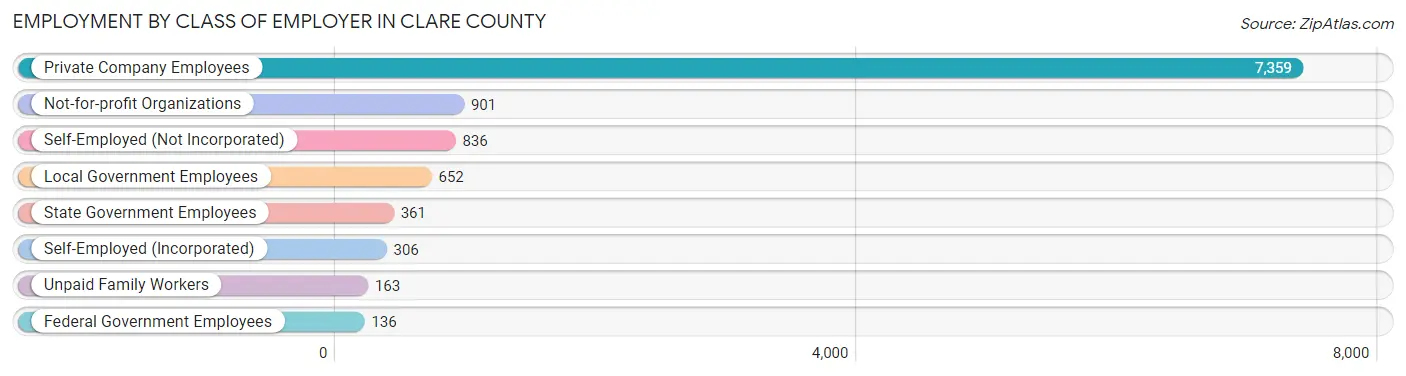
| Employer Class | # Employees | % Employees |
| Private Company Employees | 7,359 | 68.7% |
| Self-Employed (Incorporated) | 306 | 2.9% |
| Self-Employed (Not Incorporated) | 836 | 7.8% |
| Not-for-profit Organizations | 901 | 8.4% |
| Local Government Employees | 652 | 6.1% |
| State Government Employees | 361 | 3.4% |
| Federal Government Employees | 136 | 1.3% |
| Unpaid Family Workers | 163 | 1.5% |
| Total | 10,714 | 100.0% |
Employment Status by Age in Clare County
According to the labor force statistics for Clare County, out of the total population over 16 years of age (25,588), 47.6% or 12,180 individuals are in the labor force, with 9.3% or 1,133 of them unemployed. The age group with the highest labor force participation rate is 20 to 24 years, with 79.7% or 1,188 individuals in the labor force. Within the labor force, the 16 to 19 years age range has the highest percentage of unemployed individuals, with 26.2% or 186 of them being unemployed.

| Age Bracket | In Labor Force | Unemployed |
| 16 to 19 Years | 711 (53.6%) | 186 (26.2%) |
| 20 to 24 Years | 1,188 (79.7%) | 125 (10.5%) |
| 25 to 29 Years | 1,075 (67.0%) | 115 (10.7%) |
| 30 to 34 Years | 1,296 (78.0%) | 104 (8.0%) |
| 35 to 44 Years | 2,120 (68.8%) | 153 (7.2%) |
| 45 to 54 Years | 2,598 (70.0%) | 169 (6.5%) |
| 55 to 59 Years | 1,434 (55.9%) | 166 (11.6%) |
| 60 to 64 Years | 959 (37.3%) | 36 (3.8%) |
| 65 to 74 Years | 698 (15.0%) | 77 (11.0%) |
| 75 Years and over | 88 (3.0%) | 0 (0.0%) |
| Total | 12,180 (47.6%) | 1,133 (9.3%) |
Employment Status by Educational Attainment in Clare County
According to labor force statistics for Clare County, 62.4% of individuals (9,484) out of the total population between 25 and 64 years of age (15,198) are in the labor force, with 7.8% or 740 of them being unemployed. The group with the highest labor force participation rate are those with the educational attainment of bachelor's degree or higher, with 82.1% or 1,382 individuals in the labor force. Within the labor force, individuals with less than high school education have the highest percentage of unemployment, with 18.2% or 145 of them being unemployed.
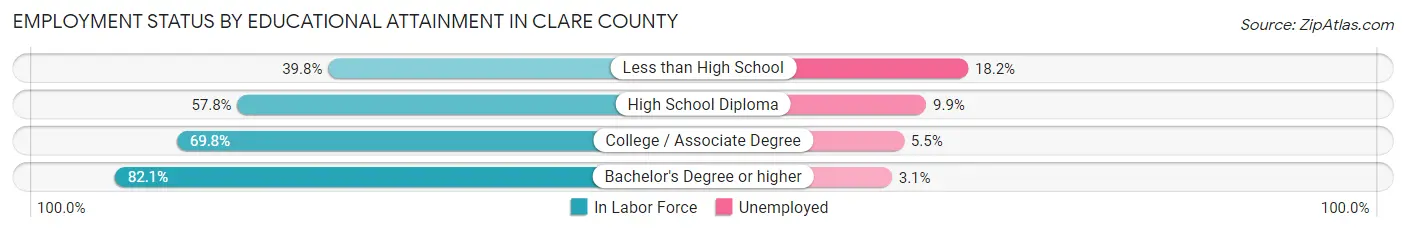
| Educational Attainment | In Labor Force | Unemployed |
| Less than High School | 798 (39.8%) | 365 (18.2%) |
| High School Diploma | 3,504 (57.8%) | 600 (9.9%) |
| College / Associate Degree | 3,801 (69.8%) | 300 (5.5%) |
| Bachelor's Degree or higher | 1,382 (82.1%) | 52 (3.1%) |
| Total | 9,484 (62.4%) | 1,185 (7.8%) |
Employment Occupations by Sex in Clare County
Management, Business, Science and Arts Occupations
The most common Management, Business, Science and Arts occupations in Clare County are Management (937 | 8.5%), Community & Social Service (805 | 7.3%), Health Diagnosing & Treating (573 | 5.2%), Education Instruction & Library (553 | 5.0%), and Health Technologists (383 | 3.5%).

Management, Business, Science and Arts Occupations by Sex
Within the Management, Business, Science and Arts occupations in Clare County, the most male-oriented occupations are Legal Services & Support (100.0%), Architecture & Engineering (90.1%), and Computers & Mathematics (70.7%), while the most female-oriented occupations are Health Diagnosing & Treating (82.7%), Education Instruction & Library (77.9%), and Health Technologists (74.7%).
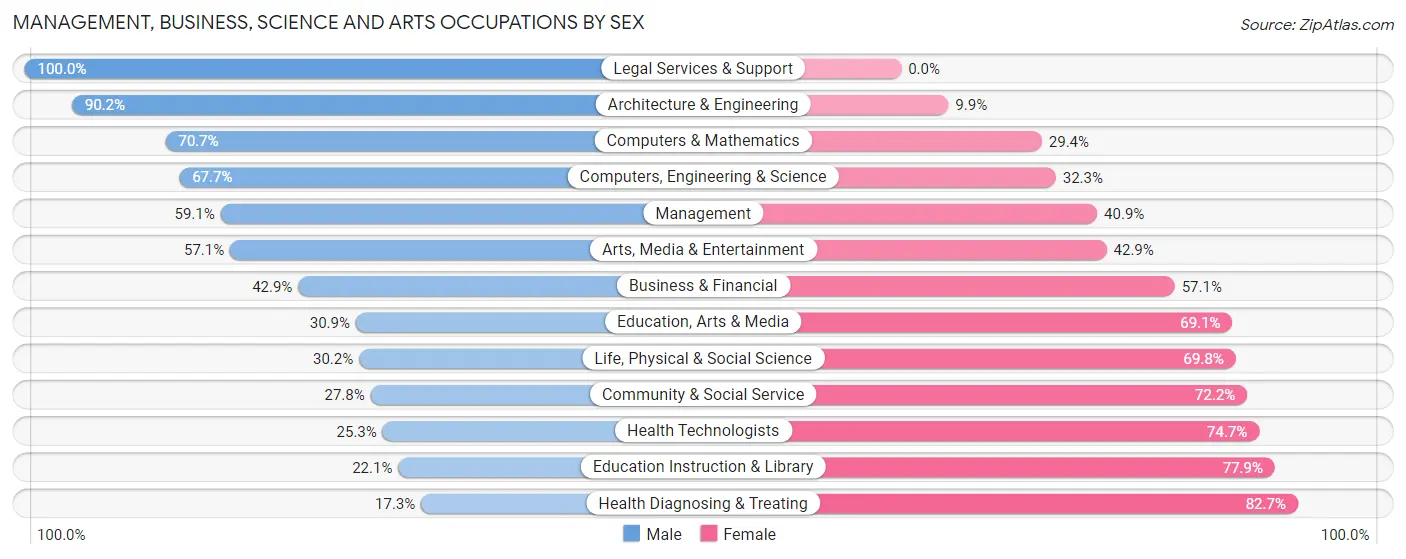
| Occupation | Male | Female |
| Management | 554 (59.1%) | 383 (40.9%) |
| Business & Financial | 161 (42.9%) | 214 (57.1%) |
| Computers, Engineering & Science | 210 (67.7%) | 100 (32.3%) |
| Computers & Mathematics | 65 (70.7%) | 27 (29.3%) |
| Architecture & Engineering | 119 (90.1%) | 13 (9.9%) |
| Life, Physical & Social Science | 26 (30.2%) | 60 (69.8%) |
| Community & Social Service | 224 (27.8%) | 581 (72.2%) |
| Education, Arts & Media | 51 (30.9%) | 114 (69.1%) |
| Legal Services & Support | 3 (100.0%) | 0 (0.0%) |
| Education Instruction & Library | 122 (22.1%) | 431 (77.9%) |
| Arts, Media & Entertainment | 48 (57.1%) | 36 (42.9%) |
| Health Diagnosing & Treating | 99 (17.3%) | 474 (82.7%) |
| Health Technologists | 97 (25.3%) | 286 (74.7%) |
| Total (Category) | 1,248 (41.6%) | 1,752 (58.4%) |
| Total (Overall) | 5,696 (51.6%) | 5,345 (48.4%) |
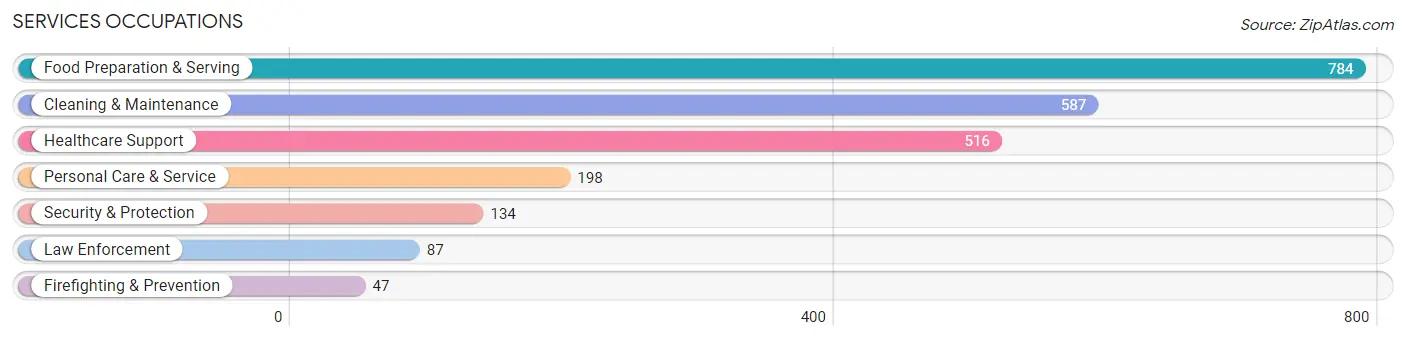
Services Occupations
The most common Services occupations in Clare County are Food Preparation & Serving (784 | 7.1%), Cleaning & Maintenance (587 | 5.3%), Healthcare Support (516 | 4.7%), Personal Care & Service (198 | 1.8%), and Security & Protection (134 | 1.2%).
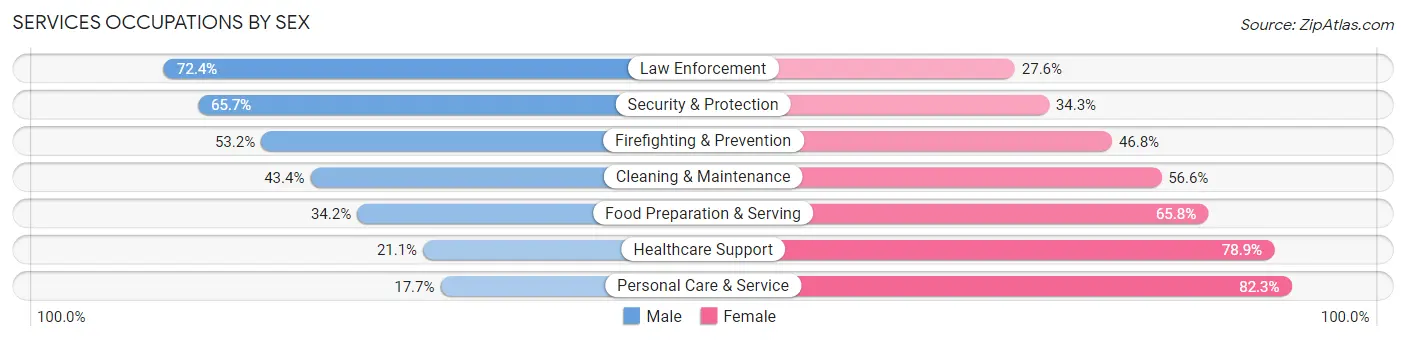
Services Occupations by Sex
Within the Services occupations in Clare County, the most male-oriented occupations are Law Enforcement (72.4%), Security & Protection (65.7%), and Firefighting & Prevention (53.2%), while the most female-oriented occupations are Personal Care & Service (82.3%), Healthcare Support (78.9%), and Food Preparation & Serving (65.8%).
| Occupation | Male | Female |
| Healthcare Support | 109 (21.1%) | 407 (78.9%) |
| Security & Protection | 88 (65.7%) | 46 (34.3%) |
| Firefighting & Prevention | 25 (53.2%) | 22 (46.8%) |
| Law Enforcement | 63 (72.4%) | 24 (27.6%) |
| Food Preparation & Serving | 268 (34.2%) | 516 (65.8%) |
| Cleaning & Maintenance | 255 (43.4%) | 332 (56.6%) |
| Personal Care & Service | 35 (17.7%) | 163 (82.3%) |
| Total (Category) | 755 (34.0%) | 1,464 (66.0%) |
| Total (Overall) | 5,696 (51.6%) | 5,345 (48.4%) |
Sales and Office Occupations
The most common Sales and Office occupations in Clare County are Sales & Related (1,167 | 10.6%), and Office & Administration (1,142 | 10.3%).

Sales and Office Occupations by Sex

| Occupation | Male | Female |
| Sales & Related | 406 (34.8%) | 761 (65.2%) |
| Office & Administration | 203 (17.8%) | 939 (82.2%) |
| Total (Category) | 609 (26.4%) | 1,700 (73.6%) |
| Total (Overall) | 5,696 (51.6%) | 5,345 (48.4%) |
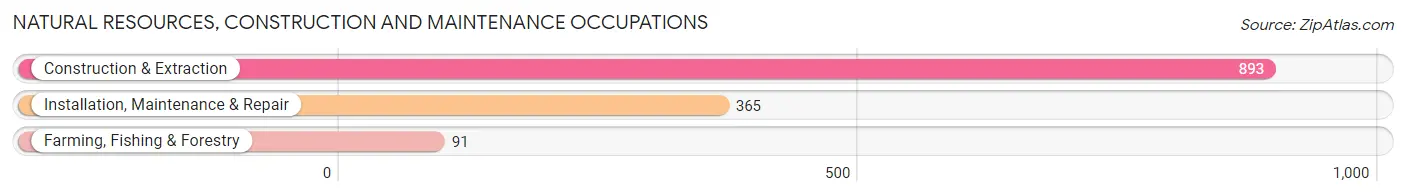
Natural Resources, Construction and Maintenance Occupations
The most common Natural Resources, Construction and Maintenance occupations in Clare County are Construction & Extraction (893 | 8.1%), Installation, Maintenance & Repair (365 | 3.3%), and Farming, Fishing & Forestry (91 | 0.8%).
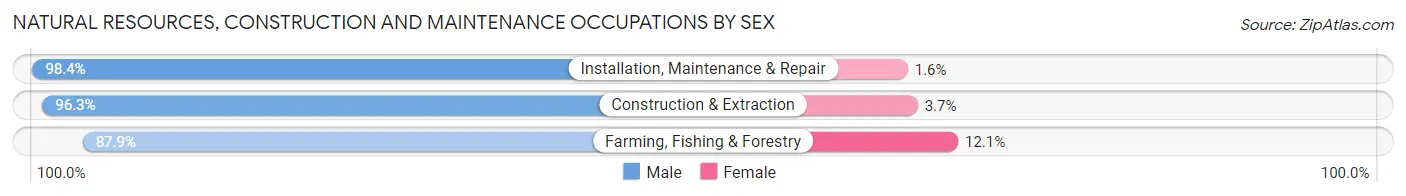
Natural Resources, Construction and Maintenance Occupations by Sex
| Occupation | Male | Female |
| Farming, Fishing & Forestry | 80 (87.9%) | 11 (12.1%) |
| Construction & Extraction | 860 (96.3%) | 33 (3.7%) |
| Installation, Maintenance & Repair | 359 (98.4%) | 6 (1.6%) |
| Total (Category) | 1,299 (96.3%) | 50 (3.7%) |
| Total (Overall) | 5,696 (51.6%) | 5,345 (48.4%) |
Production, Transportation and Moving Occupations
The most common Production, Transportation and Moving occupations in Clare County are Production (1,176 | 10.6%), Transportation (531 | 4.8%), and Material Moving (457 | 4.1%).
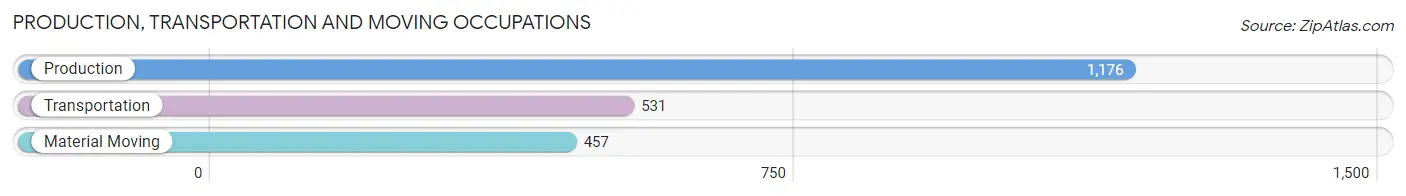
Production, Transportation and Moving Occupations by Sex

| Occupation | Male | Female |
| Production | 936 (79.6%) | 240 (20.4%) |
| Transportation | 479 (90.2%) | 52 (9.8%) |
| Material Moving | 370 (81.0%) | 87 (19.0%) |
| Total (Category) | 1,785 (82.5%) | 379 (17.5%) |
| Total (Overall) | 5,696 (51.6%) | 5,345 (48.4%) |
Employment Industries by Sex in Clare County
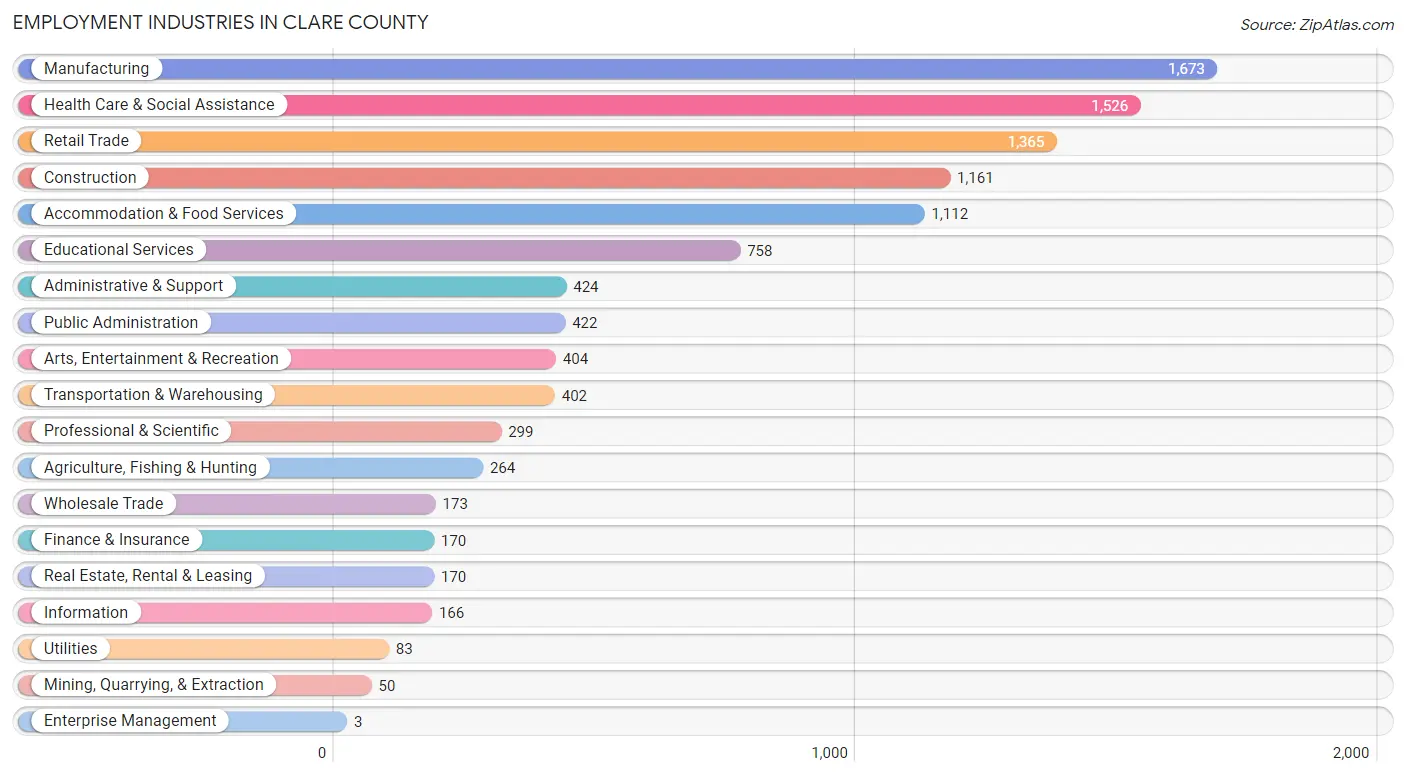
Employment Industries in Clare County
The major employment industries in Clare County include Manufacturing (1,673 | 15.1%), Health Care & Social Assistance (1,526 | 13.8%), Retail Trade (1,365 | 12.4%), Construction (1,161 | 10.5%), and Accommodation & Food Services (1,112 | 10.1%).
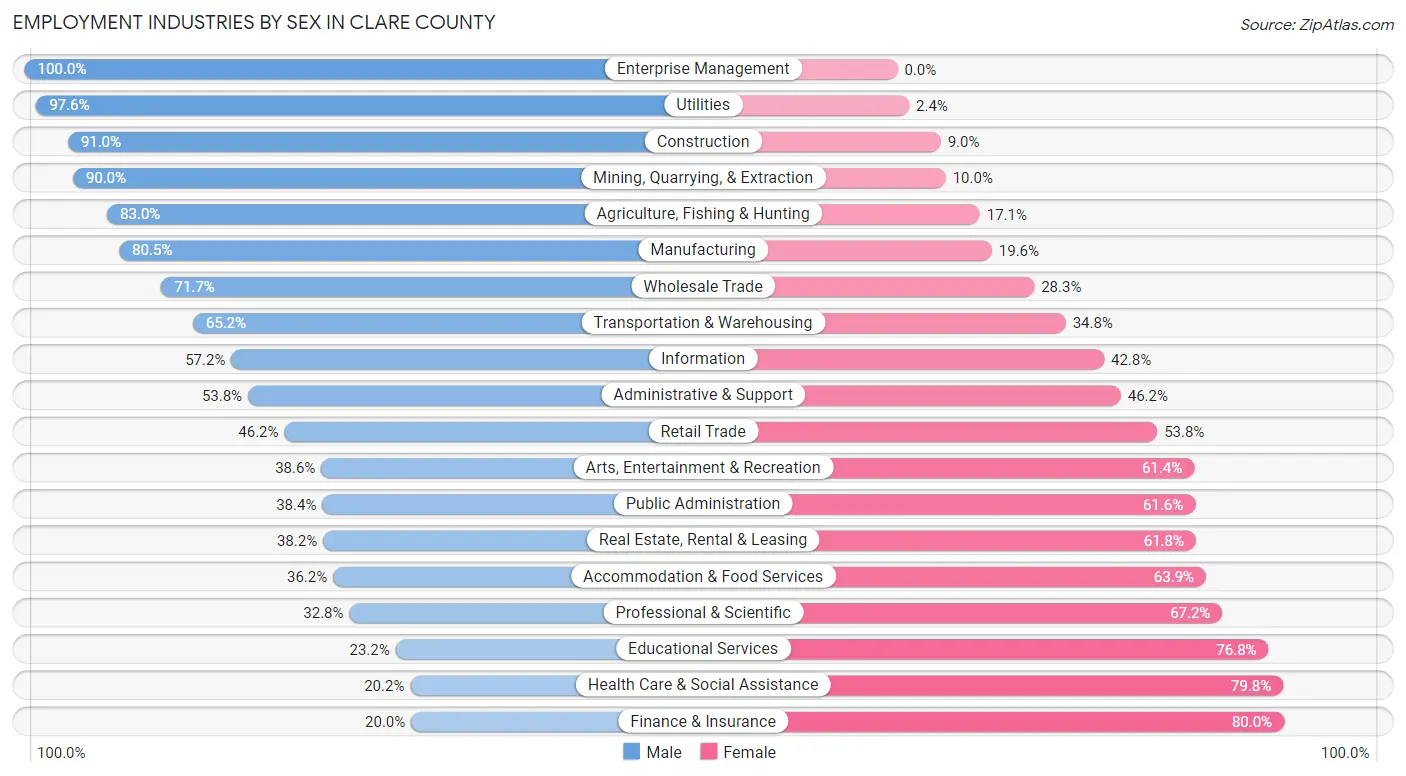
Employment Industries by Sex in Clare County
The Clare County industries that see more men than women are Enterprise Management (100.0%), Utilities (97.6%), and Construction (91.0%), whereas the industries that tend to have a higher number of women are Finance & Insurance (80.0%), Health Care & Social Assistance (79.8%), and Educational Services (76.8%).
| Industry | Male | Female |
| Agriculture, Fishing & Hunting | 219 (83.0%) | 45 (17.1%) |
| Mining, Quarrying, & Extraction | 45 (90.0%) | 5 (10.0%) |
| Construction | 1,057 (91.0%) | 104 (9.0%) |
| Manufacturing | 1,346 (80.4%) | 327 (19.6%) |
| Wholesale Trade | 124 (71.7%) | 49 (28.3%) |
| Retail Trade | 631 (46.2%) | 734 (53.8%) |
| Transportation & Warehousing | 262 (65.2%) | 140 (34.8%) |
| Utilities | 81 (97.6%) | 2 (2.4%) |
| Information | 95 (57.2%) | 71 (42.8%) |
| Finance & Insurance | 34 (20.0%) | 136 (80.0%) |
| Real Estate, Rental & Leasing | 65 (38.2%) | 105 (61.8%) |
| Professional & Scientific | 98 (32.8%) | 201 (67.2%) |
| Enterprise Management | 3 (100.0%) | 0 (0.0%) |
| Administrative & Support | 228 (53.8%) | 196 (46.2%) |
| Educational Services | 176 (23.2%) | 582 (76.8%) |
| Health Care & Social Assistance | 308 (20.2%) | 1,218 (79.8%) |
| Arts, Entertainment & Recreation | 156 (38.6%) | 248 (61.4%) |
| Accommodation & Food Services | 402 (36.1%) | 710 (63.8%) |
| Public Administration | 162 (38.4%) | 260 (61.6%) |
| Total | 5,696 (51.6%) | 5,345 (48.4%) |
Education in Clare County
School Enrollment in Clare County
The most common levels of schooling among the 5,678 students in Clare County are middle school (1,370 | 24.1%), elementary school (1,299 | 22.9%), and college / undergraduate (1,066 | 18.8%).

| School Level | # Students | % Students |
| Nursery / Preschool | 283 | 5.0% |
| Kindergarten | 516 | 9.1% |
| Elementary School | 1,299 | 22.9% |
| Middle School | 1,370 | 24.1% |
| High School | 1,045 | 18.4% |
| College / Undergraduate | 1,066 | 18.8% |
| Graduate / Professional | 99 | 1.7% |
| Total | 5,678 | 100.0% |
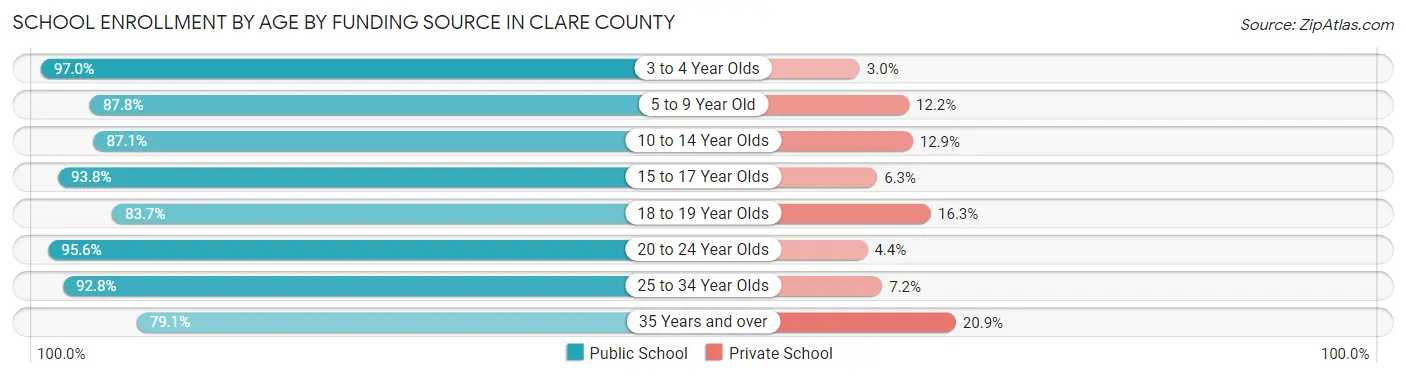
School Enrollment by Age by Funding Source in Clare County
Out of a total of 5,678 students who are enrolled in schools in Clare County, 625 (11.0%) attend a private institution, while the remaining 5,053 (89.0%) are enrolled in public schools. The age group of 35 years and over has the highest likelihood of being enrolled in private schools, with 60 (20.9% in the age bracket) enrolled. Conversely, the age group of 3 to 4 year olds has the lowest likelihood of being enrolled in a private school, with 193 (97.0% in the age bracket) attending a public institution.
| Age Bracket | Public School | Private School |
| 3 to 4 Year Olds | 193 (97.0%) | 6 (3.0%) |
| 5 to 9 Year Old | 1,535 (87.8%) | 213 (12.2%) |
| 10 to 14 Year Olds | 1,354 (87.1%) | 200 (12.9%) |
| 15 to 17 Year Olds | 840 (93.8%) | 56 (6.2%) |
| 18 to 19 Year Olds | 262 (83.7%) | 51 (16.3%) |
| 20 to 24 Year Olds | 345 (95.6%) | 16 (4.4%) |
| 25 to 34 Year Olds | 297 (92.8%) | 23 (7.2%) |
| 35 Years and over | 227 (79.1%) | 60 (20.9%) |
| Total | 5,053 (89.0%) | 625 (11.0%) |
Educational Attainment by Field of Study in Clare County
Education (740 | 24.9%), business (520 | 17.5%), science & technology (413 | 13.9%), bio, nature & agricultural (178 | 6.0%), and computers & mathematics (135 | 4.5%) are the most common fields of study among 2,971 individuals in Clare County who have obtained a bachelor's degree or higher.
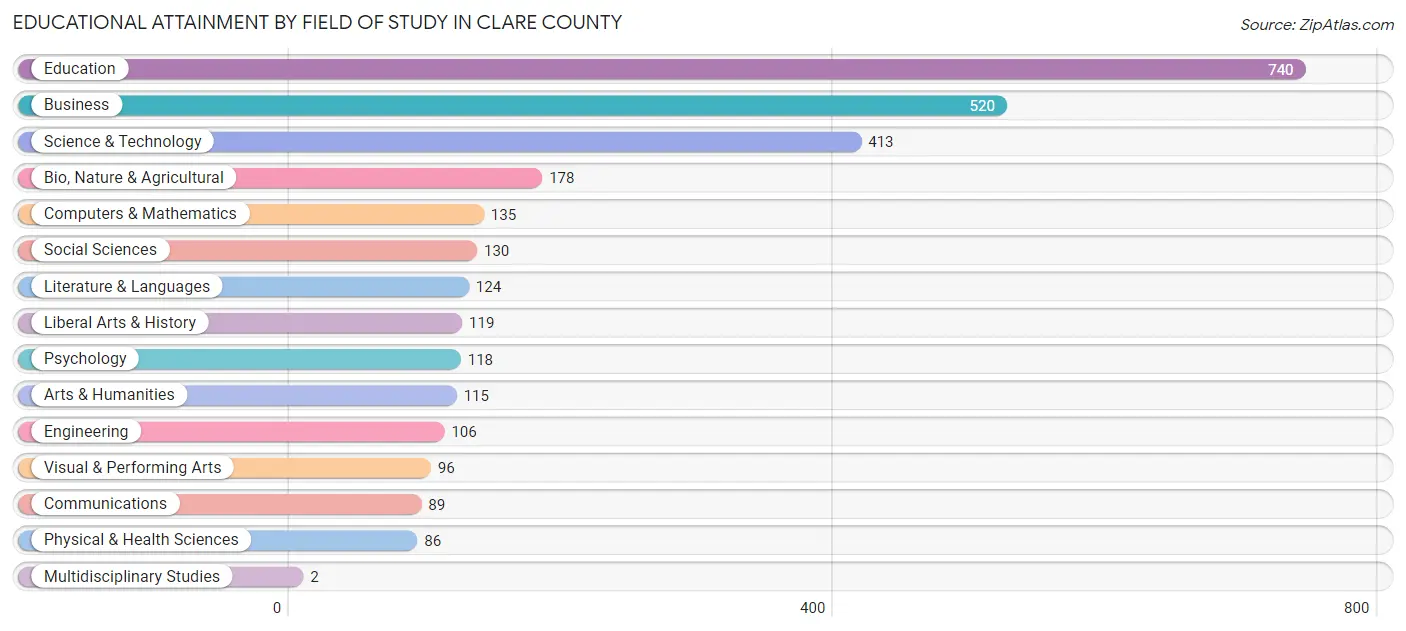
| Field of Study | # Graduates | % Graduates |
| Computers & Mathematics | 135 | 4.5% |
| Bio, Nature & Agricultural | 178 | 6.0% |
| Physical & Health Sciences | 86 | 2.9% |
| Psychology | 118 | 4.0% |
| Social Sciences | 130 | 4.4% |
| Engineering | 106 | 3.6% |
| Multidisciplinary Studies | 2 | 0.1% |
| Science & Technology | 413 | 13.9% |
| Business | 520 | 17.5% |
| Education | 740 | 24.9% |
| Literature & Languages | 124 | 4.2% |
| Liberal Arts & History | 119 | 4.0% |
| Visual & Performing Arts | 96 | 3.2% |
| Communications | 89 | 3.0% |
| Arts & Humanities | 115 | 3.9% |
| Total | 2,971 | 100.0% |
Transportation & Commute in Clare County
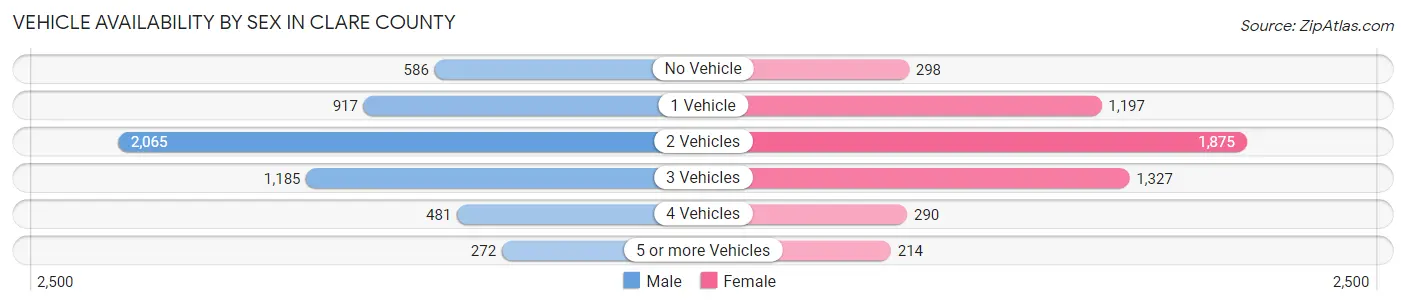
Vehicle Availability by Sex in Clare County
The most prevalent vehicle ownership categories in Clare County are males with 2 vehicles (2,065, accounting for 37.5%) and females with 2 vehicles (1,875, making up 39.7%).
| Vehicles Available | Male | Female |
| No Vehicle | 586 (10.6%) | 298 (5.7%) |
| 1 Vehicle | 917 (16.7%) | 1,197 (23.0%) |
| 2 Vehicles | 2,065 (37.5%) | 1,875 (36.0%) |
| 3 Vehicles | 1,185 (21.5%) | 1,327 (25.5%) |
| 4 Vehicles | 481 (8.7%) | 290 (5.6%) |
| 5 or more Vehicles | 272 (4.9%) | 214 (4.1%) |
| Total | 5,506 (100.0%) | 5,201 (100.0%) |
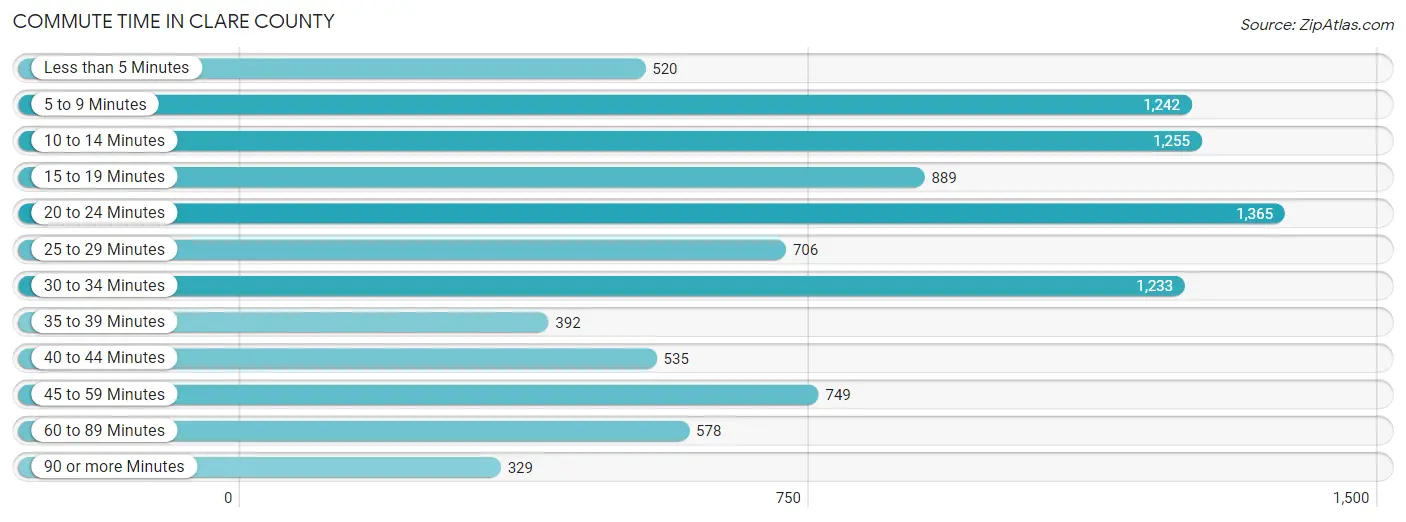
Commute Time in Clare County
The most frequently occuring commute durations in Clare County are 20 to 24 minutes (1,365 commuters, 13.9%), 10 to 14 minutes (1,255 commuters, 12.8%), and 5 to 9 minutes (1,242 commuters, 12.7%).
| Commute Time | # Commuters | % Commuters |
| Less than 5 Minutes | 520 | 5.3% |
| 5 to 9 Minutes | 1,242 | 12.7% |
| 10 to 14 Minutes | 1,255 | 12.8% |
| 15 to 19 Minutes | 889 | 9.1% |
| 20 to 24 Minutes | 1,365 | 13.9% |
| 25 to 29 Minutes | 706 | 7.2% |
| 30 to 34 Minutes | 1,233 | 12.6% |
| 35 to 39 Minutes | 392 | 4.0% |
| 40 to 44 Minutes | 535 | 5.5% |
| 45 to 59 Minutes | 749 | 7.6% |
| 60 to 89 Minutes | 578 | 5.9% |
| 90 or more Minutes | 329 | 3.4% |
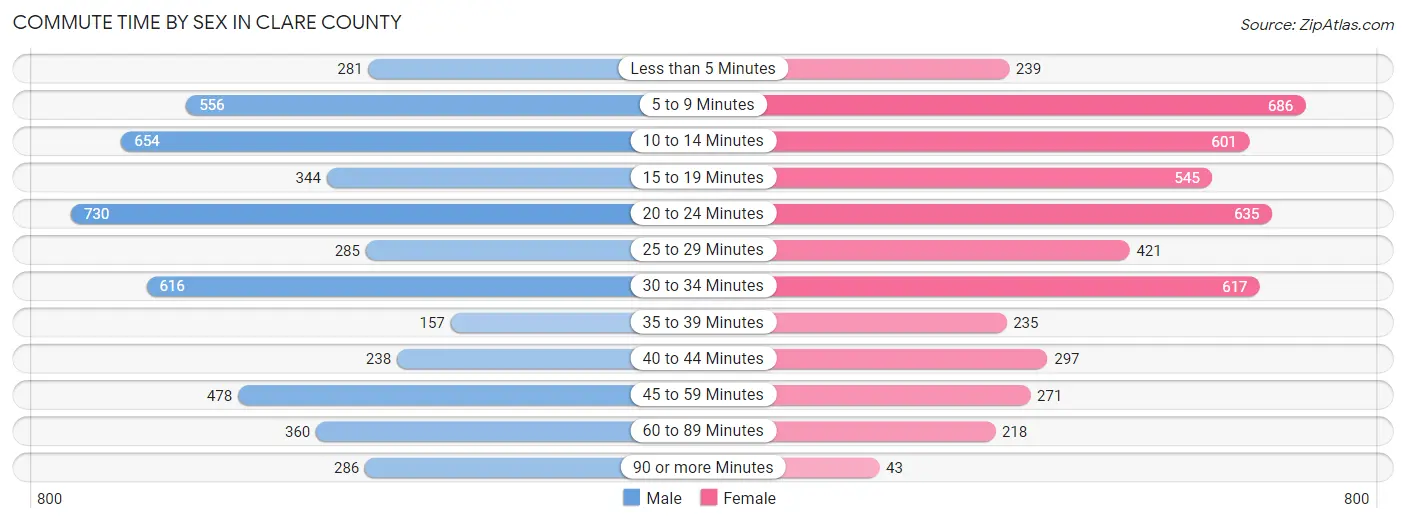
Commute Time by Sex in Clare County
The most common commute times in Clare County are 20 to 24 minutes (730 commuters, 14.6%) for males and 5 to 9 minutes (686 commuters, 14.3%) for females.
| Commute Time | Male | Female |
| Less than 5 Minutes | 281 (5.6%) | 239 (5.0%) |
| 5 to 9 Minutes | 556 (11.2%) | 686 (14.3%) |
| 10 to 14 Minutes | 654 (13.1%) | 601 (12.5%) |
| 15 to 19 Minutes | 344 (6.9%) | 545 (11.3%) |
| 20 to 24 Minutes | 730 (14.6%) | 635 (13.2%) |
| 25 to 29 Minutes | 285 (5.7%) | 421 (8.8%) |
| 30 to 34 Minutes | 616 (12.4%) | 617 (12.8%) |
| 35 to 39 Minutes | 157 (3.2%) | 235 (4.9%) |
| 40 to 44 Minutes | 238 (4.8%) | 297 (6.2%) |
| 45 to 59 Minutes | 478 (9.6%) | 271 (5.6%) |
| 60 to 89 Minutes | 360 (7.2%) | 218 (4.5%) |
| 90 or more Minutes | 286 (5.7%) | 43 (0.9%) |
Time of Departure to Work by Sex in Clare County
The most frequent times of departure to work in Clare County are 7:00 AM to 7:29 AM (586, 11.8%) for males and 7:00 AM to 7:29 AM (662, 13.8%) for females.

| Time of Departure | Male | Female |
| 12:00 AM to 4:59 AM | 436 (8.7%) | 175 (3.6%) |
| 5:00 AM to 5:29 AM | 204 (4.1%) | 58 (1.2%) |
| 5:30 AM to 5:59 AM | 456 (9.1%) | 190 (4.0%) |
| 6:00 AM to 6:29 AM | 572 (11.5%) | 323 (6.7%) |
| 6:30 AM to 6:59 AM | 381 (7.6%) | 456 (9.5%) |
| 7:00 AM to 7:29 AM | 586 (11.8%) | 662 (13.8%) |
| 7:30 AM to 7:59 AM | 442 (8.9%) | 646 (13.4%) |
| 8:00 AM to 8:29 AM | 401 (8.0%) | 344 (7.1%) |
| 8:30 AM to 8:59 AM | 209 (4.2%) | 258 (5.4%) |
| 9:00 AM to 9:59 AM | 252 (5.1%) | 565 (11.7%) |
| 10:00 AM to 10:59 AM | 79 (1.6%) | 135 (2.8%) |
| 11:00 AM to 11:59 AM | 76 (1.5%) | 50 (1.0%) |
| 12:00 PM to 3:59 PM | 448 (9.0%) | 540 (11.2%) |
| 4:00 PM to 11:59 PM | 443 (8.9%) | 406 (8.4%) |
| Total | 4,985 (100.0%) | 4,808 (100.0%) |
Housing Occupancy in Clare County
Occupancy by Ownership in Clare County
Of the total 11,935 dwellings in Clare County, owner-occupied units account for 10,151 (85.1%), while renter-occupied units make up 1,784 (14.9%).
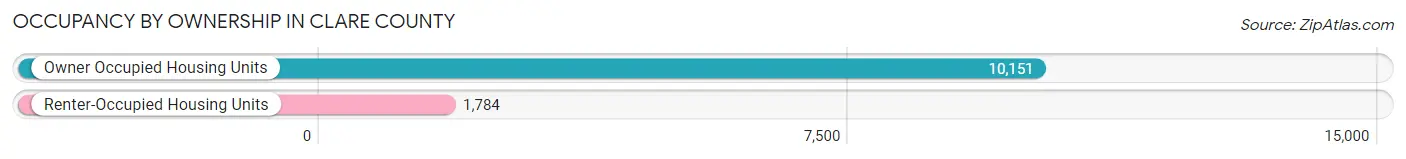
| Occupancy | # Housing Units | % Housing Units |
| Owner Occupied Housing Units | 10,151 | 85.1% |
| Renter-Occupied Housing Units | 1,784 | 14.9% |
| Total Occupied Housing Units | 11,935 | 100.0% |
Occupancy by Household Size in Clare County
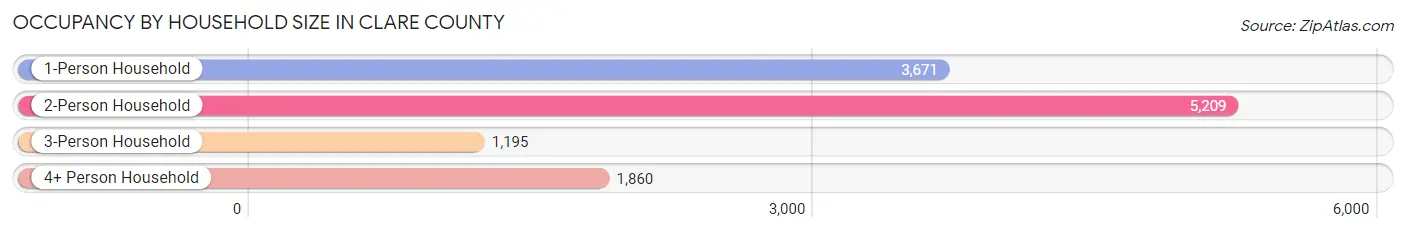
| Household Size | # Housing Units | % Housing Units |
| 1-Person Household | 3,671 | 30.8% |
| 2-Person Household | 5,209 | 43.6% |
| 3-Person Household | 1,195 | 10.0% |
| 4+ Person Household | 1,860 | 15.6% |
| Total Housing Units | 11,935 | 100.0% |
Occupancy by Ownership by Household Size in Clare County

| Household Size | Owner-occupied | Renter-occupied |
| 1-Person Household | 2,937 (80.0%) | 734 (20.0%) |
| 2-Person Household | 4,642 (89.1%) | 567 (10.9%) |
| 3-Person Household | 1,002 (83.9%) | 193 (16.2%) |
| 4+ Person Household | 1,570 (84.4%) | 290 (15.6%) |
| Total Housing Units | 10,151 (85.1%) | 1,784 (14.9%) |
Occupancy by Educational Attainment in Clare County
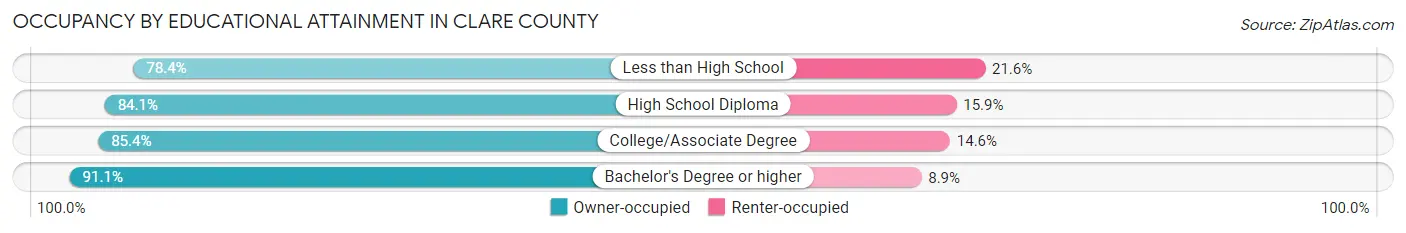
| Household Size | Owner-occupied | Renter-occupied |
| Less than High School | 945 (78.4%) | 260 (21.6%) |
| High School Diploma | 3,600 (84.1%) | 680 (15.9%) |
| College/Associate Degree | 4,028 (85.4%) | 689 (14.6%) |
| Bachelor's Degree or higher | 1,578 (91.1%) | 155 (8.9%) |
Occupancy by Age of Householder in Clare County
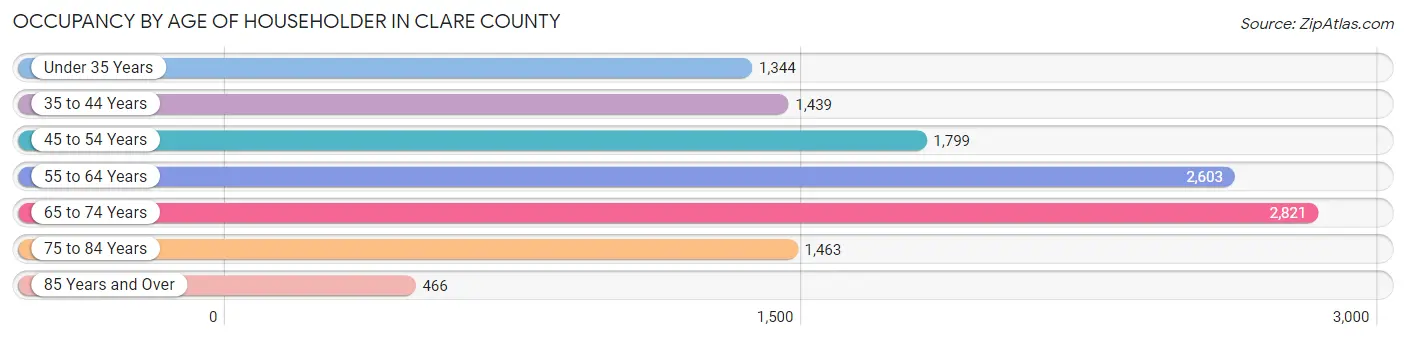
| Age Bracket | # Households | % Households |
| Under 35 Years | 1,344 | 11.3% |
| 35 to 44 Years | 1,439 | 12.1% |
| 45 to 54 Years | 1,799 | 15.1% |
| 55 to 64 Years | 2,603 | 21.8% |
| 65 to 74 Years | 2,821 | 23.6% |
| 75 to 84 Years | 1,463 | 12.3% |
| 85 Years and Over | 466 | 3.9% |
| Total | 11,935 | 100.0% |
Housing Finances in Clare County
Median Income by Occupancy in Clare County

| Occupancy Type | # Households | Median Income |
| Owner-Occupied | 10,151 (85.1%) | $51,577 |
| Renter-Occupied | 1,784 (14.9%) | $25,850 |
| Average | 11,935 (100.0%) | $47,816 |
Occupancy by Householder Income Bracket in Clare County

| Income Bracket | Owner-occupied | Renter-occupied |
| Less than $5,000 | 217 (2.1%) | 116 (6.5%) |
| $5,000 to $9,999 | 167 (1.7%) | 59 (3.3%) |
| $10,000 to $14,999 | 561 (5.5%) | 287 (16.1%) |
| $15,000 to $19,999 | 504 (5.0%) | 238 (13.3%) |
| $20,000 to $24,999 | 497 (4.9%) | 157 (8.8%) |
| $25,000 to $34,999 | 1,169 (11.5%) | 293 (16.4%) |
| $35,000 to $49,999 | 1,794 (17.7%) | 223 (12.5%) |
| $50,000 to $74,999 | 2,122 (20.9%) | 274 (15.4%) |
| $75,000 to $99,999 | 1,299 (12.8%) | 83 (4.6%) |
| $100,000 to $149,999 | 1,156 (11.4%) | 42 (2.4%) |
| $150,000 or more | 665 (6.6%) | 12 (0.7%) |
| Total | 10,151 (100.0%) | 1,784 (100.0%) |
Monthly Housing Cost Tiers in Clare County
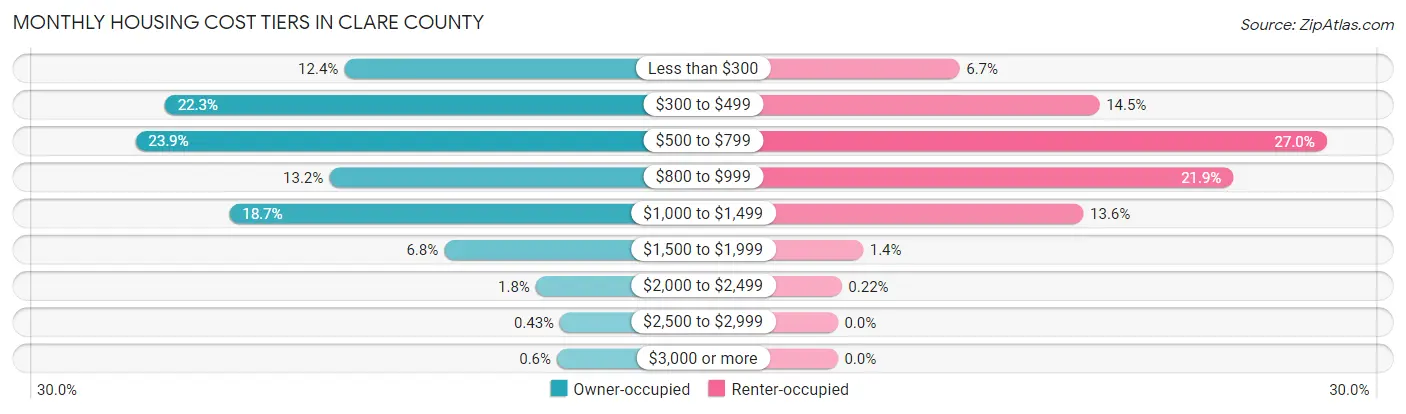
| Monthly Cost | Owner-occupied | Renter-occupied |
| Less than $300 | 1,254 (12.3%) | 120 (6.7%) |
| $300 to $499 | 2,260 (22.3%) | 258 (14.5%) |
| $500 to $799 | 2,424 (23.9%) | 482 (27.0%) |
| $800 to $999 | 1,338 (13.2%) | 390 (21.9%) |
| $1,000 to $1,499 | 1,897 (18.7%) | 242 (13.6%) |
| $1,500 to $1,999 | 693 (6.8%) | 25 (1.4%) |
| $2,000 to $2,499 | 180 (1.8%) | 4 (0.2%) |
| $2,500 to $2,999 | 44 (0.4%) | 0 (0.0%) |
| $3,000 or more | 61 (0.6%) | 0 (0.0%) |
| Total | 10,151 (100.0%) | 1,784 (100.0%) |
Physical Housing Characteristics in Clare County
Housing Structures in Clare County
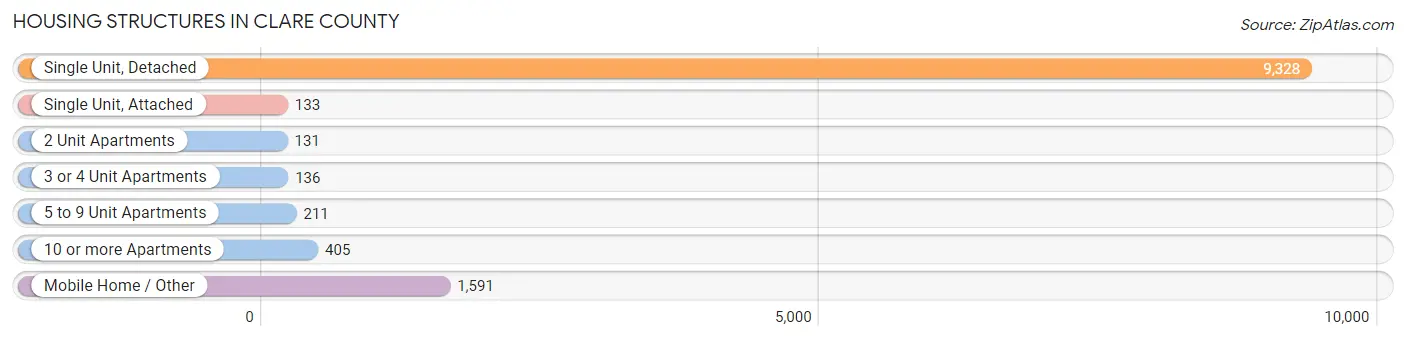
| Structure Type | # Housing Units | % Housing Units |
| Single Unit, Detached | 9,328 | 78.2% |
| Single Unit, Attached | 133 | 1.1% |
| 2 Unit Apartments | 131 | 1.1% |
| 3 or 4 Unit Apartments | 136 | 1.1% |
| 5 to 9 Unit Apartments | 211 | 1.8% |
| 10 or more Apartments | 405 | 3.4% |
| Mobile Home / Other | 1,591 | 13.3% |
| Total | 11,935 | 100.0% |
Housing Structures by Occupancy in Clare County
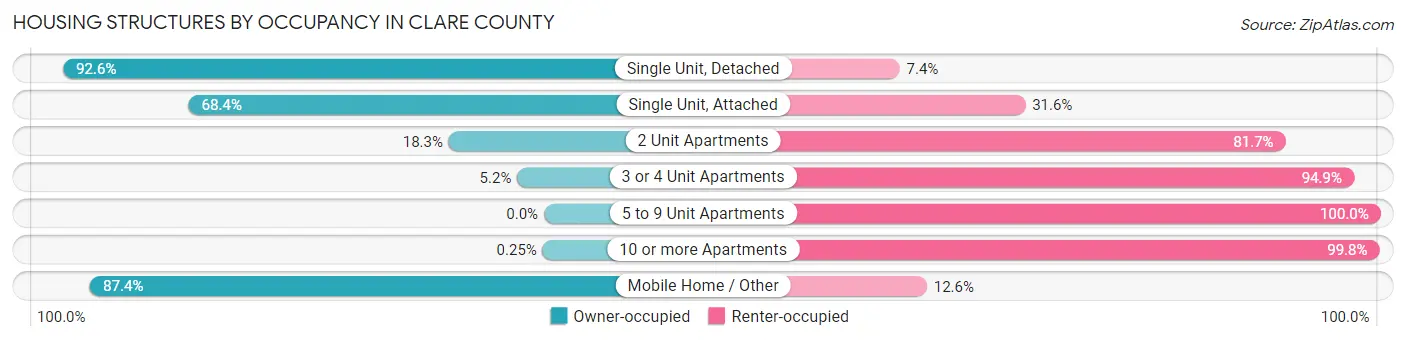
| Structure Type | Owner-occupied | Renter-occupied |
| Single Unit, Detached | 8,638 (92.6%) | 690 (7.4%) |
| Single Unit, Attached | 91 (68.4%) | 42 (31.6%) |
| 2 Unit Apartments | 24 (18.3%) | 107 (81.7%) |
| 3 or 4 Unit Apartments | 7 (5.1%) | 129 (94.9%) |
| 5 to 9 Unit Apartments | 0 (0.0%) | 211 (100.0%) |
| 10 or more Apartments | 1 (0.3%) | 404 (99.8%) |
| Mobile Home / Other | 1,390 (87.4%) | 201 (12.6%) |
| Total | 10,151 (85.1%) | 1,784 (14.9%) |
Housing Structures by Number of Rooms in Clare County
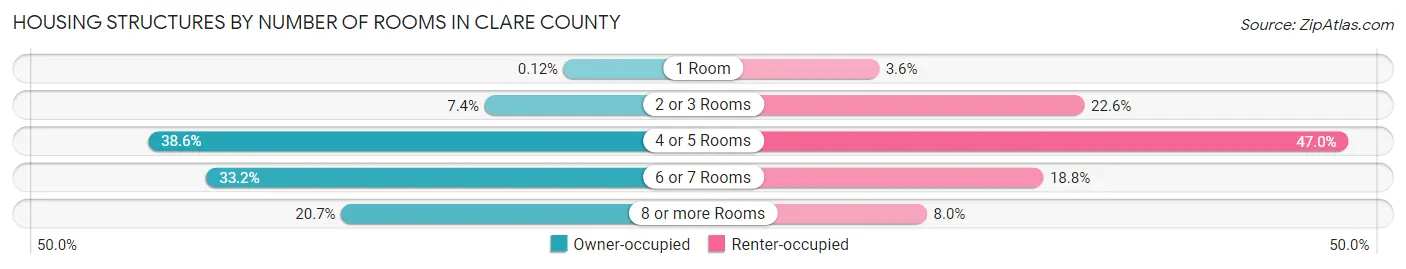
| Number of Rooms | Owner-occupied | Renter-occupied |
| 1 Room | 12 (0.1%) | 64 (3.6%) |
| 2 or 3 Rooms | 754 (7.4%) | 403 (22.6%) |
| 4 or 5 Rooms | 3,915 (38.6%) | 839 (47.0%) |
| 6 or 7 Rooms | 3,369 (33.2%) | 335 (18.8%) |
| 8 or more Rooms | 2,101 (20.7%) | 143 (8.0%) |
| Total | 10,151 (100.0%) | 1,784 (100.0%) |
Housing Structure by Heating Type in Clare County
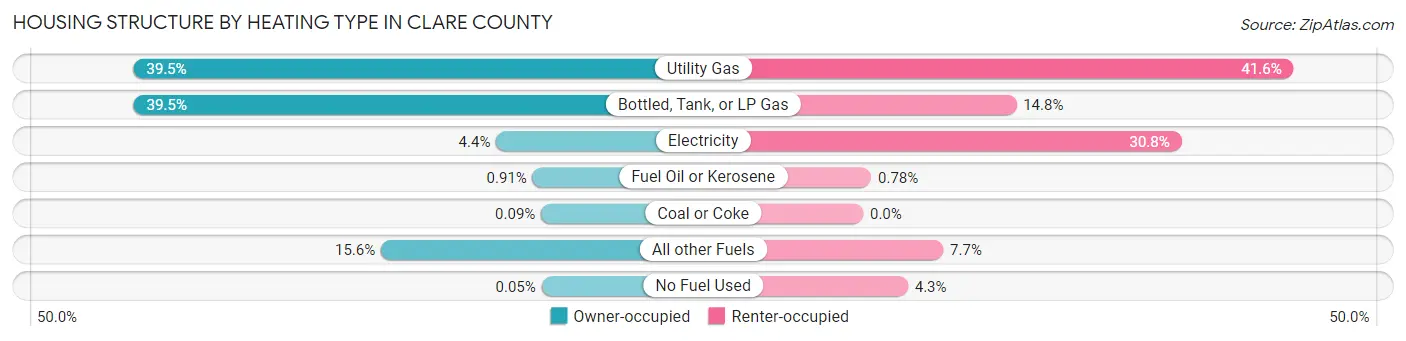
| Heating Type | Owner-occupied | Renter-occupied |
| Utility Gas | 4,009 (39.5%) | 742 (41.6%) |
| Bottled, Tank, or LP Gas | 4,007 (39.5%) | 264 (14.8%) |
| Electricity | 450 (4.4%) | 549 (30.8%) |
| Fuel Oil or Kerosene | 92 (0.9%) | 14 (0.8%) |
| Coal or Coke | 9 (0.1%) | 0 (0.0%) |
| All other Fuels | 1,579 (15.6%) | 138 (7.7%) |
| No Fuel Used | 5 (0.1%) | 77 (4.3%) |
| Total | 10,151 (100.0%) | 1,784 (100.0%) |
Household Vehicle Usage in Clare County

| Vehicles per Household | Owner-occupied | Renter-occupied |
| No Vehicle | 628 (6.2%) | 308 (17.3%) |
| 1 Vehicle | 3,476 (34.2%) | 1,001 (56.1%) |
| 2 Vehicles | 3,837 (37.8%) | 367 (20.6%) |
| 3 or more Vehicles | 2,210 (21.8%) | 108 (6.0%) |
| Total | 10,151 (100.0%) | 1,784 (100.0%) |
Real Estate & Mortgages in Clare County
Real Estate and Mortgage Overview in Clare County
| Characteristic | Without Mortgage | With Mortgage |
| Housing Units | 5,344 | 4,807 |
| Median Property Value | $106,100 | $121,800 |
| Median Household Income | $41,912 | $415 |
| Monthly Housing Costs | $430 | $46 |
| Real Estate Taxes | $1,250 | $230 |
Property Value by Mortgage Status in Clare County
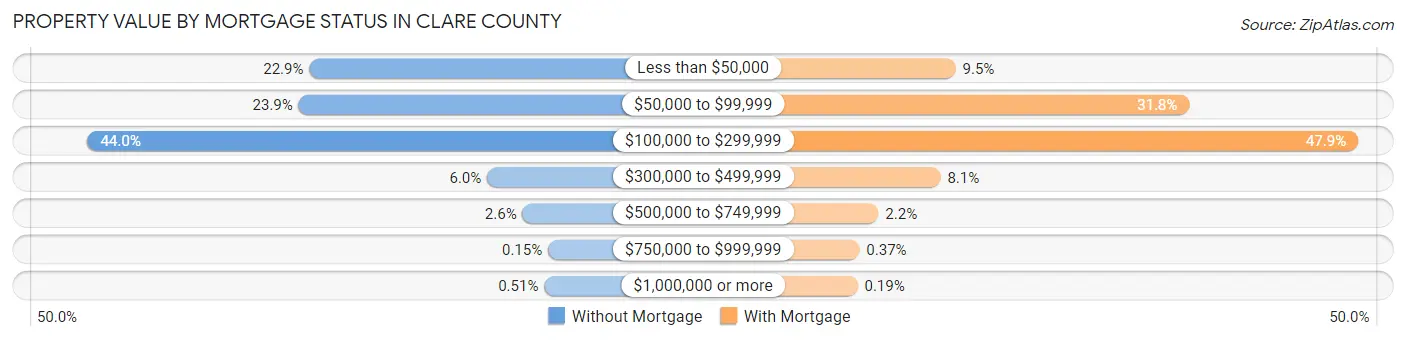
| Property Value | Without Mortgage | With Mortgage |
| Less than $50,000 | 1,223 (22.9%) | 458 (9.5%) |
| $50,000 to $99,999 | 1,278 (23.9%) | 1,528 (31.8%) |
| $100,000 to $299,999 | 2,352 (44.0%) | 2,300 (47.8%) |
| $300,000 to $499,999 | 318 (5.9%) | 389 (8.1%) |
| $500,000 to $749,999 | 138 (2.6%) | 105 (2.2%) |
| $750,000 to $999,999 | 8 (0.2%) | 18 (0.4%) |
| $1,000,000 or more | 27 (0.5%) | 9 (0.2%) |
| Total | 5,344 (100.0%) | 4,807 (100.0%) |
Household Income by Mortgage Status in Clare County

| Household Income | Without Mortgage | With Mortgage |
| Less than $10,000 | 281 (5.3%) | 78 (1.6%) |
| $10,000 to $24,999 | 1,065 (19.9%) | 103 (2.1%) |
| $25,000 to $34,999 | 653 (12.2%) | 497 (10.3%) |
| $35,000 to $49,999 | 1,126 (21.1%) | 516 (10.7%) |
| $50,000 to $74,999 | 971 (18.2%) | 668 (13.9%) |
| $75,000 to $99,999 | 553 (10.3%) | 1,151 (23.9%) |
| $100,000 to $149,999 | 445 (8.3%) | 746 (15.5%) |
| $150,000 or more | 250 (4.7%) | 711 (14.8%) |
| Total | 5,344 (100.0%) | 4,807 (100.0%) |
Property Value to Household Income Ratio in Clare County
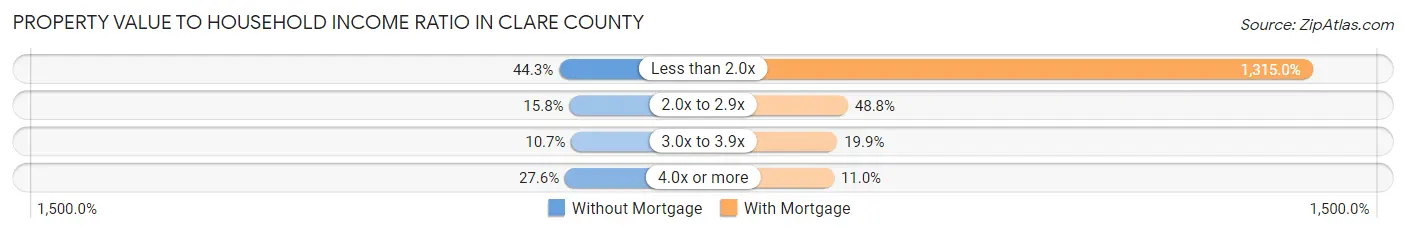
| Value-to-Income Ratio | Without Mortgage | With Mortgage |
| Less than 2.0x | 2,368 (44.3%) | 63,213 (1,315.0%) |
| 2.0x to 2.9x | 846 (15.8%) | 2,346 (48.8%) |
| 3.0x to 3.9x | 569 (10.6%) | 957 (19.9%) |
| 4.0x or more | 1,477 (27.6%) | 529 (11.0%) |
| Total | 5,344 (100.0%) | 4,807 (100.0%) |
Real Estate Taxes by Mortgage Status in Clare County

| Property Taxes | Without Mortgage | With Mortgage |
| Less than $800 | 1,298 (24.3%) | 11 (0.2%) |
| $800 to $1,499 | 1,733 (32.4%) | 671 (14.0%) |
| $800 to $1,499 | 1,897 (35.5%) | 1,795 (37.3%) |
| Total | 5,344 (100.0%) | 4,807 (100.0%) |
Health & Disability in Clare County
Health Insurance Coverage by Age in Clare County
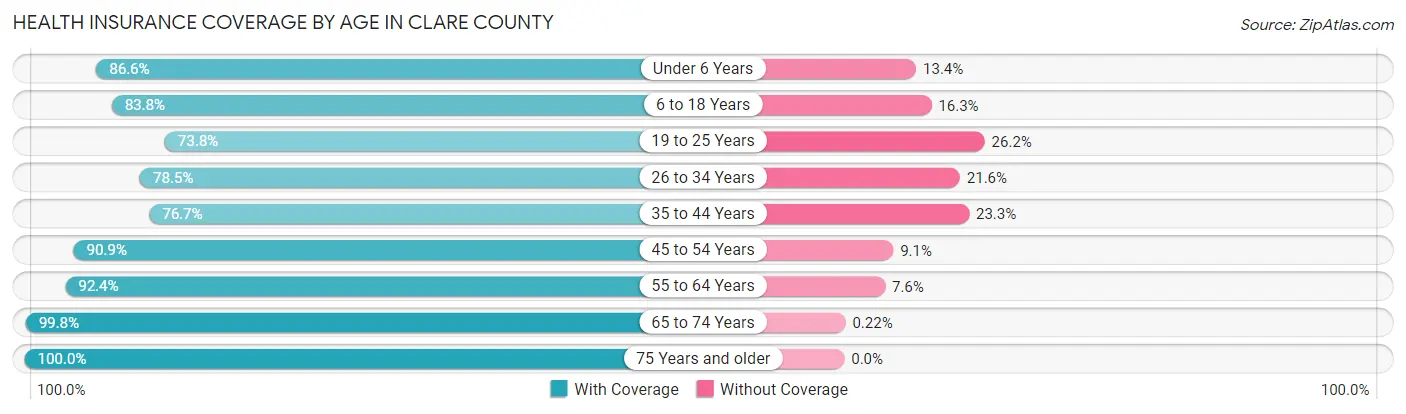
| Age Bracket | With Coverage | Without Coverage |
| Under 6 Years | 1,694 (86.6%) | 262 (13.4%) |
| 6 to 18 Years | 3,722 (83.8%) | 722 (16.3%) |
| 19 to 25 Years | 1,619 (73.8%) | 574 (26.2%) |
| 26 to 34 Years | 2,191 (78.4%) | 602 (21.5%) |
| 35 to 44 Years | 2,332 (76.7%) | 707 (23.3%) |
| 45 to 54 Years | 3,363 (90.9%) | 338 (9.1%) |
| 55 to 64 Years | 4,714 (92.4%) | 388 (7.6%) |
| 65 to 74 Years | 4,618 (99.8%) | 10 (0.2%) |
| 75 Years and older | 2,824 (100.0%) | 0 (0.0%) |
| Total | 27,077 (88.3%) | 3,603 (11.7%) |
Health Insurance Coverage by Citizenship Status in Clare County
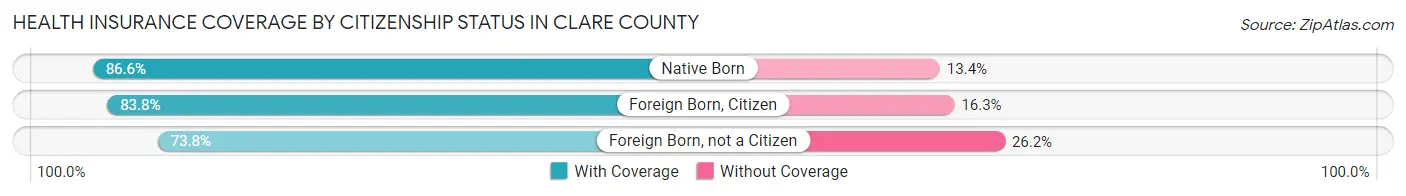
| Citizenship Status | With Coverage | Without Coverage |
| Native Born | 1,694 (86.6%) | 262 (13.4%) |
| Foreign Born, Citizen | 3,722 (83.8%) | 722 (16.3%) |
| Foreign Born, not a Citizen | 1,619 (73.8%) | 574 (26.2%) |
Health Insurance Coverage by Household Income in Clare County
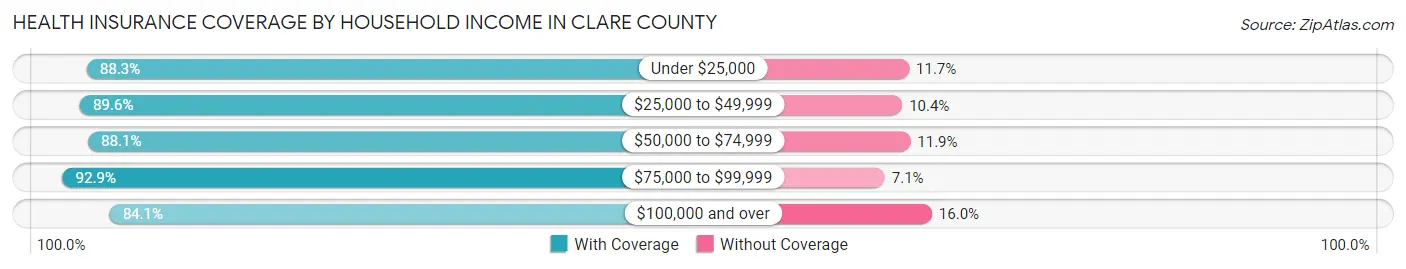
| Household Income | With Coverage | Without Coverage |
| Under $25,000 | 4,904 (88.3%) | 648 (11.7%) |
| $25,000 to $49,999 | 7,255 (89.6%) | 840 (10.4%) |
| $50,000 to $74,999 | 5,694 (88.1%) | 770 (11.9%) |
| $75,000 to $99,999 | 3,569 (92.9%) | 274 (7.1%) |
| $100,000 and over | 5,585 (84.1%) | 1,060 (16.0%) |
Public vs Private Health Insurance Coverage by Age in Clare County
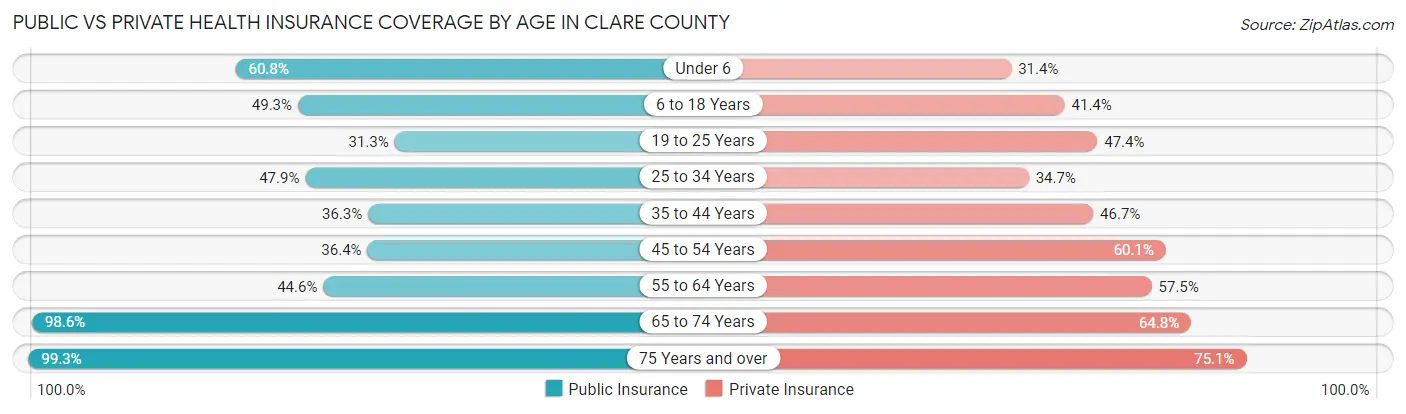
| Age Bracket | Public Insurance | Private Insurance |
| Under 6 | 1,190 (60.8%) | 615 (31.4%) |
| 6 to 18 Years | 2,190 (49.3%) | 1,838 (41.4%) |
| 19 to 25 Years | 687 (31.3%) | 1,040 (47.4%) |
| 25 to 34 Years | 1,338 (47.9%) | 969 (34.7%) |
| 35 to 44 Years | 1,102 (36.3%) | 1,418 (46.7%) |
| 45 to 54 Years | 1,346 (36.4%) | 2,225 (60.1%) |
| 55 to 64 Years | 2,274 (44.6%) | 2,934 (57.5%) |
| 65 to 74 Years | 4,565 (98.6%) | 3,000 (64.8%) |
| 75 Years and over | 2,804 (99.3%) | 2,120 (75.1%) |
| Total | 17,496 (57.0%) | 16,159 (52.7%) |
Disability Status by Sex by Age in Clare County

| Age Bracket | Male | Female |
| Under 5 Years | 40 (5.2%) | 0 (0.0%) |
| 5 to 17 Years | 253 (11.0%) | 157 (6.8%) |
| 18 to 34 Years | 529 (20.1%) | 339 (12.8%) |
| 35 to 64 Years | 1,397 (23.1%) | 1,542 (26.6%) |
| 65 to 74 Years | 831 (36.5%) | 667 (28.4%) |
| 75 Years and over | 774 (55.8%) | 622 (43.3%) |
Disability Class by Sex by Age in Clare County
Disability Class: Hearing Difficulty
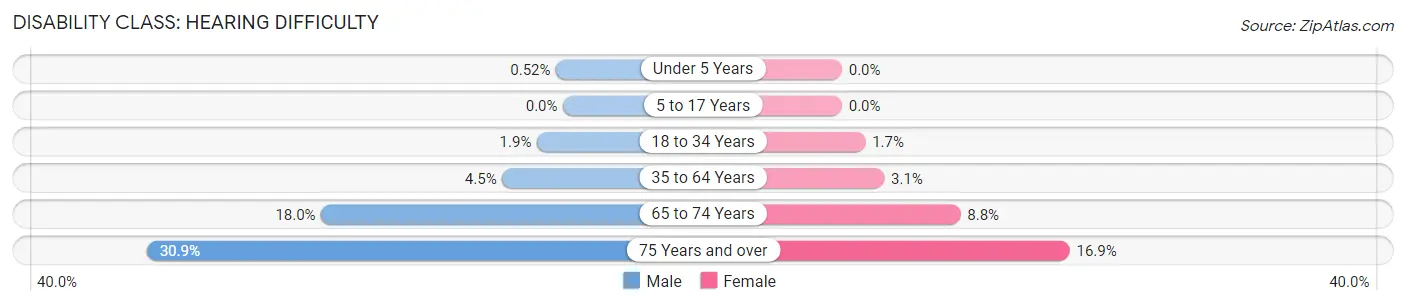
| Age Bracket | Male | Female |
| Under 5 Years | 4 (0.5%) | 0 (0.0%) |
| 5 to 17 Years | 0 (0.0%) | 0 (0.0%) |
| 18 to 34 Years | 51 (1.9%) | 46 (1.7%) |
| 35 to 64 Years | 273 (4.5%) | 182 (3.1%) |
| 65 to 74 Years | 409 (18.0%) | 207 (8.8%) |
| 75 Years and over | 429 (30.9%) | 243 (16.9%) |
Disability Class: Vision Difficulty
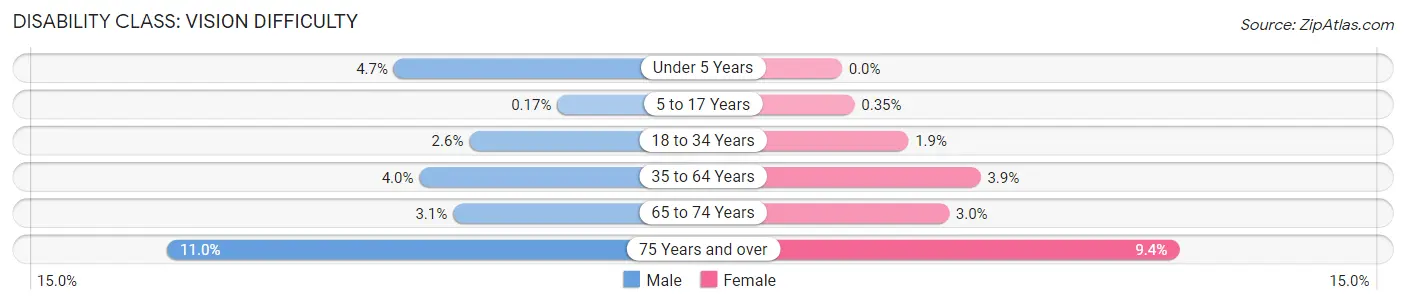
| Age Bracket | Male | Female |
| Under 5 Years | 36 (4.7%) | 0 (0.0%) |
| 5 to 17 Years | 4 (0.2%) | 8 (0.4%) |
| 18 to 34 Years | 69 (2.6%) | 49 (1.8%) |
| 35 to 64 Years | 242 (4.0%) | 224 (3.9%) |
| 65 to 74 Years | 70 (3.1%) | 70 (3.0%) |
| 75 Years and over | 153 (11.0%) | 135 (9.4%) |
Disability Class: Cognitive Difficulty
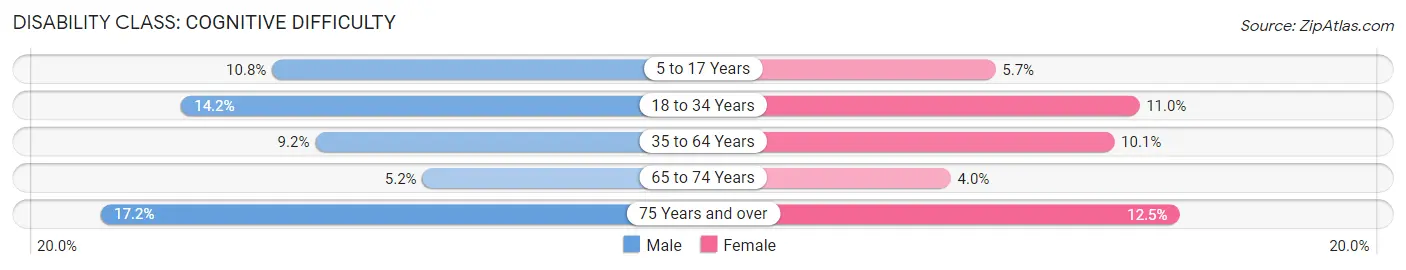
| Age Bracket | Male | Female |
| 5 to 17 Years | 249 (10.8%) | 132 (5.7%) |
| 18 to 34 Years | 373 (14.2%) | 292 (11.0%) |
| 35 to 64 Years | 556 (9.2%) | 587 (10.1%) |
| 65 to 74 Years | 119 (5.2%) | 95 (4.0%) |
| 75 Years and over | 238 (17.2%) | 180 (12.5%) |
Disability Class: Ambulatory Difficulty
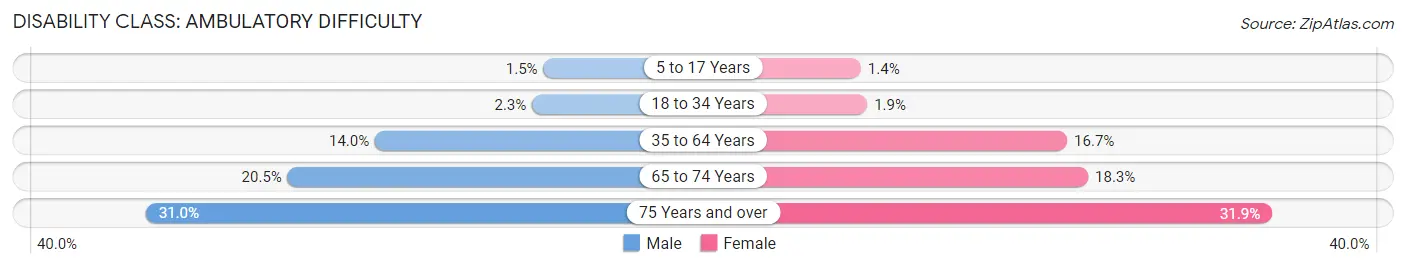
| Age Bracket | Male | Female |
| 5 to 17 Years | 34 (1.5%) | 33 (1.4%) |
| 18 to 34 Years | 61 (2.3%) | 50 (1.9%) |
| 35 to 64 Years | 844 (14.0%) | 971 (16.7%) |
| 65 to 74 Years | 466 (20.5%) | 430 (18.3%) |
| 75 Years and over | 430 (31.0%) | 459 (31.9%) |
Disability Class: Self-Care Difficulty

| Age Bracket | Male | Female |
| 5 to 17 Years | 57 (2.5%) | 69 (3.0%) |
| 18 to 34 Years | 33 (1.3%) | 10 (0.4%) |
| 35 to 64 Years | 305 (5.1%) | 371 (6.4%) |
| 65 to 74 Years | 171 (7.5%) | 111 (4.7%) |
| 75 Years and over | 171 (12.3%) | 127 (8.8%) |
Technology Access in Clare County
Computing Device Access in Clare County
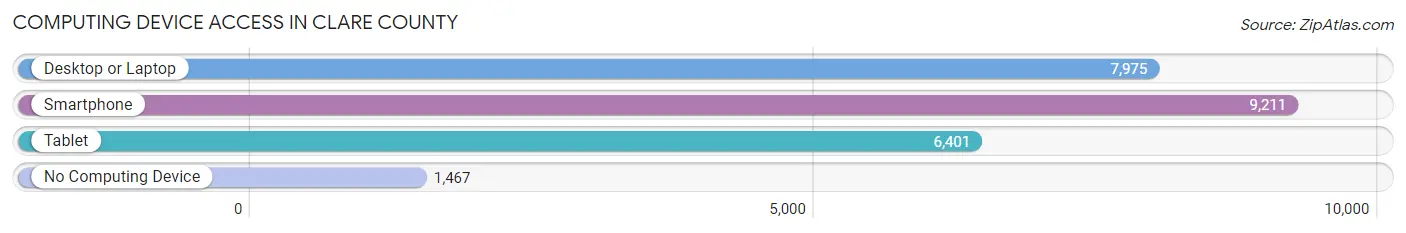
| Device Type | # Households | % Households |
| Desktop or Laptop | 7,975 | 66.8% |
| Smartphone | 9,211 | 77.2% |
| Tablet | 6,401 | 53.6% |
| No Computing Device | 1,467 | 12.3% |
| Total | 11,935 | 100.0% |
Internet Access in Clare County
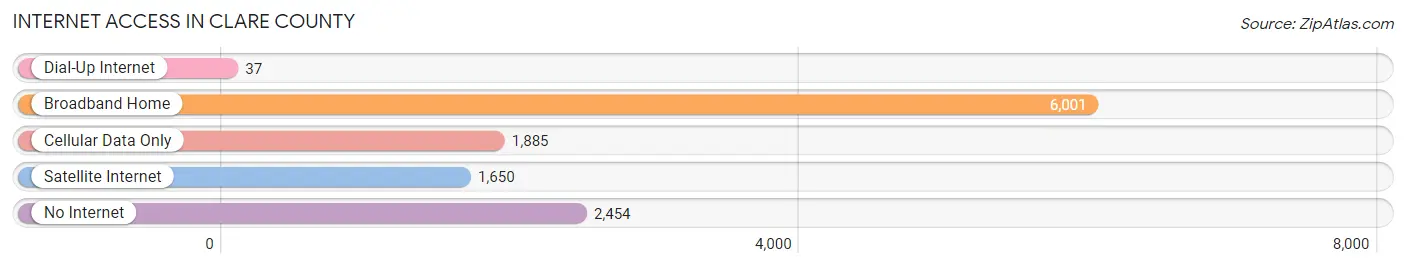
| Internet Type | # Households | % Households |
| Dial-Up Internet | 37 | 0.3% |
| Broadband Home | 6,001 | 50.3% |
| Cellular Data Only | 1,885 | 15.8% |
| Satellite Internet | 1,650 | 13.8% |
| No Internet | 2,454 | 20.6% |
| Total | 11,935 | 100.0% |
Clare County Summary
Clare County is located in the Central region of Michigan, and is part of the Central Michigan region. It is bordered by Isabella County to the north, Gladwin County to the east, Midland County to the south, and Osceola County to the west. The county seat is Harrison, and the county has a total area of 576 square miles.
History
Clare County was established in 1840 and was named after County Clare in Ireland. The county was originally part of Midland County, and was organized in 1871. The first settlers in the area were mostly of Irish and German descent. The first county seat was Farwell, but it was moved to Harrison in 1873.
Geography
Clare County is located in the Central region of Michigan, and is part of the Central Michigan region. It is bordered by Isabella County to the north, Gladwin County to the east, Midland County to the south, and Osceola County to the west. The county has a total area of 576 square miles, and is mostly covered in forests and rolling hills. The county is home to several lakes, including Budd Lake, Lake George, and Lake Lancer.
Economy
The economy of Clare County is largely based on agriculture and tourism. The county is home to several farms, which produce a variety of crops, including corn, soybeans, wheat, and hay. The county is also home to several wineries, which produce a variety of wines. Tourism is also an important part of the economy, as the county is home to several state parks, including the Clare County State Park, which offers camping, fishing, and hiking opportunities.
Demographics
As of the 2010 census, the population of Clare County was 30,926. The population is mostly white (94.3%), with small percentages of African American (2.2%), Native American (1.2%), Asian (0.5%), and other races (1.8%). The median household income is $41,945, and the median age is 43.7 years. The county has a higher-than-average poverty rate (17.2%), and a lower-than-average unemployment rate (5.7%).
Conclusion
Clare County is a rural county located in the Central region of Michigan. It is bordered by Isabella County to the north, Gladwin County to the east, Midland County to the south, and Osceola County to the west. The county has a total area of 576 square miles, and is mostly covered in forests and rolling hills. The economy of Clare County is largely based on agriculture and tourism, and the population is mostly white. The median household income is $41,945, and the median age is 43.7 years.
Common Questions
What is the Total Population of Clare County?
Total Population of Clare County is 30,998.
What is the Total Male Population of Clare County?
Total Male Population of Clare County is 15,586.
What is the Total Female Population of Clare County?
Total Female Population of Clare County is 15,412.
What is the Ratio of Males per 100 Females in Clare County?
There are 101.13 Males per 100 Females in Clare County.
What is the Ratio of Females per 100 Males in Clare County?
There are 98.88 Females per 100 Males in Clare County.
What is the Median Population Age in Clare County?
Median Population Age in Clare County is 48.2 Years.
What is the Average Family Size in Clare County
Average Family Size in Clare County is 3.2 People.
What is the Average Household Size in Clare County
Average Household Size in Clare County is 2.6 People.
What is Per Capita Income in Clare County?
Per Capita income in Clare County is $27,147.
What is the Median Family Income in Clare County?
Median Family Income in Clare County is $57,063.
What is the Median Household income in Clare County?
Median Household Income in Clare County is $47,816.
What is Income or Wage Gap in Clare County?
Income or Wage Gap in Clare County is 31.9%.
Women in Clare County earn 68.1 cents for every dollar earned by a man.
What is Family Income Deficit in Clare County?
Family Income Deficit in Clare County is $8,218.
Families that are below poverty line in Clare County earn $8,218 less on average than the poverty threshold level.
What is Inequality or Gini Index in Clare County?
Inequality or Gini Index in Clare County is 0.46.
How Large is the Labor Force in Clare County?
There are 12,180 People in the Labor Forcein in Clare County.
What is the Percentage of People in the Labor Force in Clare County?
47.6% of People are in the Labor Force in Clare County.
What is the Unemployment Rate in Clare County?
Unemployment Rate in Clare County is 9.3%.