Chippewa County, MI
Chippewa County Map
Chippewa County Overview
36,670
TOTAL POPULATION
19,879
MALE POPULATION
16,791
FEMALE POPULATION
118.39
MALES / 100 FEMALES
84.47
FEMALES / 100 MALES
40.8
MEDIAN AGE
3.0
AVG FAMILY SIZE
2.4
AVG HOUSEHOLD SIZE
$31,167
PER CAPITA INCOME
$76,273
AVG FAMILY INCOME
$58,408
AVG HOUSEHOLD INCOME
12.3%
WAGE / INCOME GAP [ % ]
87.7¢/ $1
WAGE / INCOME GAP [ $ ]
$13,211
FAMILY INCOME DEFICIT
0.48
INEQUALITY / GINI INDEX
17,129
LABOR FORCE [ PEOPLE ]
55.5%
PERCENT IN LABOR FORCE
7.7%
UNEMPLOYMENT RATE
Chippewa County Area Codes
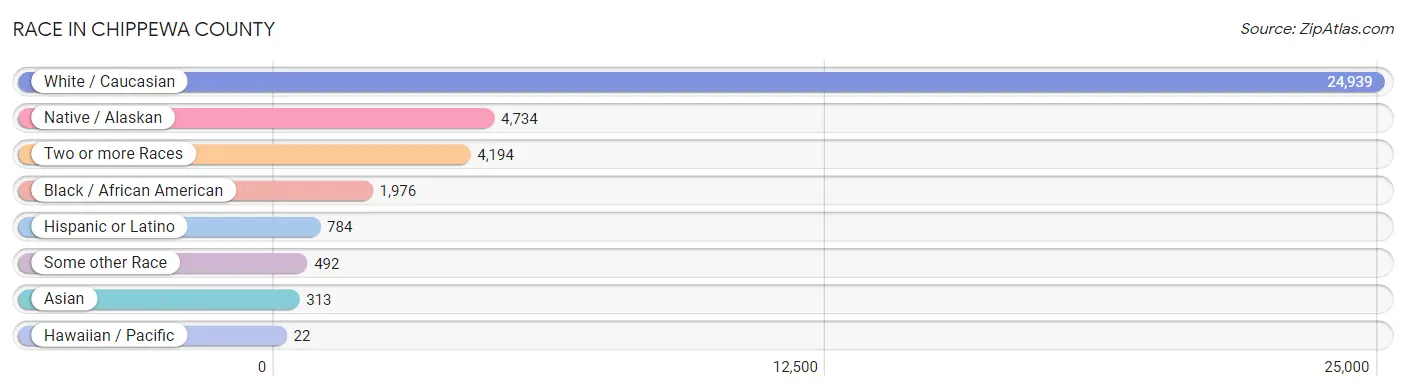
Race in Chippewa County
The most populous races in Chippewa County are White / Caucasian (24,939 | 68.0%), Native / Alaskan (4,734 | 12.9%), and Two or more Races (4,194 | 11.4%).
| Race | # Population | % Population |
| Asian | 313 | 0.9% |
| Black / African American | 1,976 | 5.4% |
| Hawaiian / Pacific | 22 | 0.1% |
| Hispanic or Latino | 784 | 2.1% |
| Native / Alaskan | 4,734 | 12.9% |
| White / Caucasian | 24,939 | 68.0% |
| Two or more Races | 4,194 | 11.4% |
| Some other Race | 492 | 1.3% |
| Total | 36,670 | 100.0% |
Ancestry in Chippewa County
The most populous ancestries reported in Chippewa County are Chippewa (5,567 | 15.2%), German (4,828 | 13.2%), English (4,747 | 13.0%), Irish (3,527 | 9.6%), and Polish (1,900 | 5.2%), together accounting for 56.1% of all Chippewa County residents.

| Ancestry | # Population | % Population |
| African | 172 | 0.5% |
| Alaskan Athabascan | 5 | 0.0% |
| American | 1,432 | 3.9% |
| Arab | 95 | 0.3% |
| Armenian | 31 | 0.1% |
| Austrian | 15 | 0.0% |
| Bangladeshi | 9 | 0.0% |
| Belgian | 99 | 0.3% |
| Bhutanese | 57 | 0.2% |
| Blackfeet | 57 | 0.2% |
| Brazilian | 68 | 0.2% |
| British | 92 | 0.3% |
| Burmese | 9 | 0.0% |
| Cajun | 12 | 0.0% |
| Canadian | 156 | 0.4% |
| Celtic | 10 | 0.0% |
| Central American | 97 | 0.3% |
| Central American Indian | 10 | 0.0% |
| Cherokee | 258 | 0.7% |
| Chippewa | 5,567 | 15.2% |
| Choctaw | 23 | 0.1% |
| Costa Rican | 78 | 0.2% |
| Cree | 1 | 0.0% |
| Croatian | 57 | 0.2% |
| Cuban | 21 | 0.1% |
| Czech | 34 | 0.1% |
| Czechoslovakian | 36 | 0.1% |
| Danish | 71 | 0.2% |
| Dominican | 9 | 0.0% |
| Dutch | 1,370 | 3.7% |
| Eastern European | 97 | 0.3% |
| Egyptian | 1 | 0.0% |
| English | 4,747 | 13.0% |
| Ethiopian | 60 | 0.2% |
| European | 668 | 1.8% |
| Finnish | 1,256 | 3.4% |
| French | 1,888 | 5.1% |
| French American Indian | 129 | 0.4% |
| French Canadian | 637 | 1.7% |
| German | 4,828 | 13.2% |
| Greek | 134 | 0.4% |
| Guatemalan | 1 | 0.0% |
| Honduran | 3 | 0.0% |
| Hungarian | 209 | 0.6% |
| Indian (Asian) | 153 | 0.4% |
| Iraqi | 19 | 0.1% |
| Irish | 3,527 | 9.6% |
| Iroquois | 13 | 0.0% |
| Israeli | 30 | 0.1% |
| Italian | 1,859 | 5.1% |
| Jamaican | 23 | 0.1% |
| Japanese | 1 | 0.0% |
| Korean | 164 | 0.4% |
| Latvian | 15 | 0.0% |
| Lebanese | 30 | 0.1% |
| Lithuanian | 43 | 0.1% |
| Lumbee | 4 | 0.0% |
| Macedonian | 1 | 0.0% |
| Maltese | 3 | 0.0% |
| Mexican | 491 | 1.3% |
| Mexican American Indian | 3 | 0.0% |
| Moroccan | 41 | 0.1% |
| Native Hawaiian | 149 | 0.4% |
| Navajo | 24 | 0.1% |
| Nicaraguan | 2 | 0.0% |
| Nigerian | 6 | 0.0% |
| Northern European | 51 | 0.1% |
| Norwegian | 451 | 1.2% |
| Ottawa | 113 | 0.3% |
| Pakistani | 3 | 0.0% |
| Pennsylvania German | 35 | 0.1% |
| Peruvian | 15 | 0.0% |
| Polish | 1,900 | 5.2% |
| Potawatomi | 87 | 0.2% |
| Pueblo | 21 | 0.1% |
| Puerto Rican | 33 | 0.1% |
| Romanian | 33 | 0.1% |
| Russian | 85 | 0.2% |
| Salvadoran | 13 | 0.0% |
| Samoan | 11 | 0.0% |
| Scandinavian | 61 | 0.2% |
| Scotch-Irish | 524 | 1.4% |
| Scottish | 1,241 | 3.4% |
| Serbian | 1 | 0.0% |
| Sioux | 139 | 0.4% |
| Slavic | 2 | 0.0% |
| Slovak | 67 | 0.2% |
| Slovene | 8 | 0.0% |
| South African | 4 | 0.0% |
| South American | 15 | 0.0% |
| Spaniard | 2 | 0.0% |
| Spanish | 16 | 0.0% |
| Sri Lankan | 96 | 0.3% |
| Subsaharan African | 242 | 0.7% |
| Swedish | 604 | 1.7% |
| Swiss | 36 | 0.1% |
| Syrian | 4 | 0.0% |
| Thai | 38 | 0.1% |
| Ukrainian | 92 | 0.3% |
| Vietnamese | 31 | 0.1% |
| Welsh | 104 | 0.3% |
| West Indian | 28 | 0.1% |
| Yugoslavian | 9 | 0.0% | View All 103 Rows |
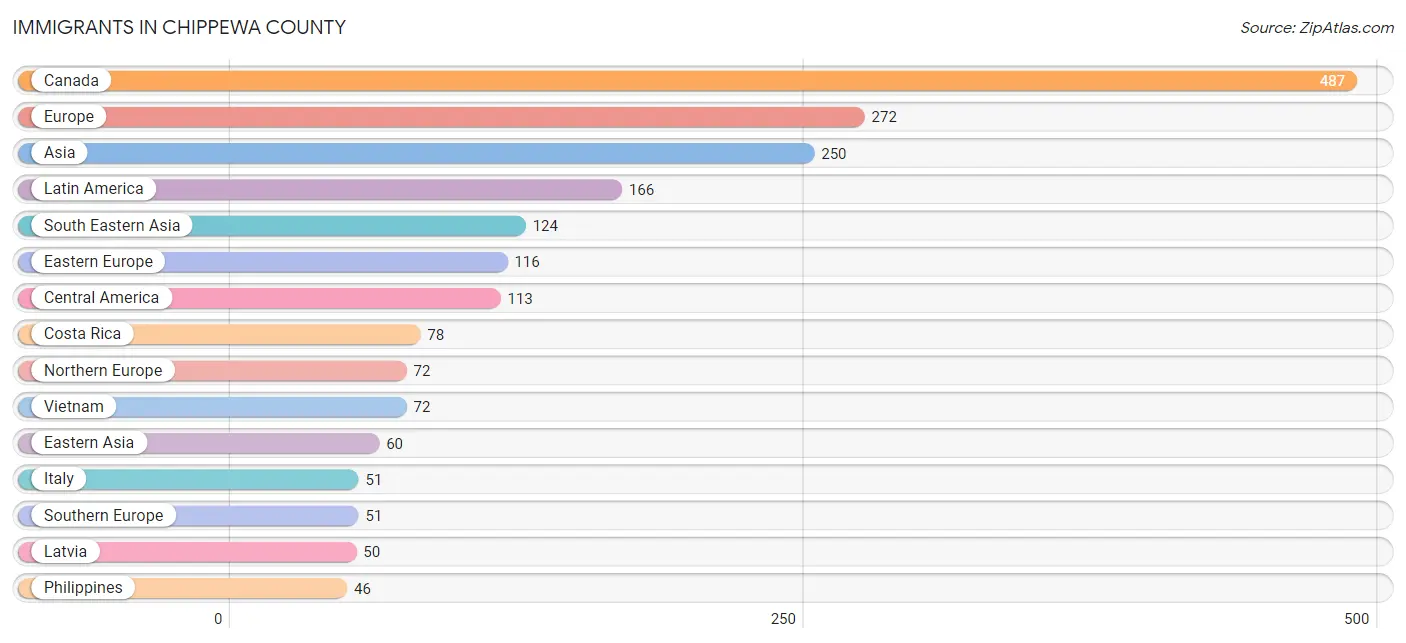
Immigrants in Chippewa County
The most numerous immigrant groups reported in Chippewa County came from Canada (487 | 1.3%), Europe (272 | 0.7%), Asia (250 | 0.7%), Latin America (166 | 0.4%), and South Eastern Asia (124 | 0.3%), together accounting for 3.5% of all Chippewa County residents.
| Immigration Origin | # Population | % Population |
| Africa | 1 | 0.0% |
| Asia | 250 | 0.7% |
| Bangladesh | 31 | 0.1% |
| Belgium | 10 | 0.0% |
| Cambodia | 1 | 0.0% |
| Canada | 487 | 1.3% |
| Caribbean | 42 | 0.1% |
| Central America | 113 | 0.3% |
| China | 38 | 0.1% |
| Costa Rica | 78 | 0.2% |
| Eastern Africa | 1 | 0.0% |
| Eastern Asia | 60 | 0.2% |
| Eastern Europe | 116 | 0.3% |
| El Salvador | 13 | 0.0% |
| England | 41 | 0.1% |
| Ethiopia | 1 | 0.0% |
| Europe | 272 | 0.7% |
| Germany | 23 | 0.1% |
| Hong Kong | 2 | 0.0% |
| India | 4 | 0.0% |
| Iraq | 3 | 0.0% |
| Ireland | 3 | 0.0% |
| Italy | 51 | 0.1% |
| Jamaica | 23 | 0.1% |
| Japan | 4 | 0.0% |
| Korea | 18 | 0.1% |
| Latin America | 166 | 0.4% |
| Latvia | 50 | 0.1% |
| Lithuania | 2 | 0.0% |
| Mexico | 22 | 0.1% |
| Northern Europe | 72 | 0.2% |
| Pakistan | 9 | 0.0% |
| Peru | 11 | 0.0% |
| Philippines | 46 | 0.1% |
| Poland | 16 | 0.0% |
| Romania | 11 | 0.0% |
| Russia | 14 | 0.0% |
| Scotland | 11 | 0.0% |
| South America | 11 | 0.0% |
| South Central Asia | 44 | 0.1% |
| South Eastern Asia | 124 | 0.3% |
| Southern Europe | 51 | 0.1% |
| Sweden | 6 | 0.0% |
| Thailand | 5 | 0.0% |
| Trinidad and Tobago | 19 | 0.1% |
| Ukraine | 21 | 0.1% |
| Vietnam | 72 | 0.2% |
| Western Asia | 3 | 0.0% |
| Western Europe | 33 | 0.1% | View All 49 Rows |
Sex and Age in Chippewa County
Sex and Age in Chippewa County
The most populous age groups in Chippewa County are 20 to 24 Years (1,840 | 9.3%) for men and 20 to 24 Years (1,489 | 8.9%) for women.

| Age Bracket | Male | Female |
| Under 5 Years | 850 (4.3%) | 832 (5.0%) |
| 5 to 9 Years | 991 (5.0%) | 958 (5.7%) |
| 10 to 14 Years | 961 (4.8%) | 806 (4.8%) |
| 15 to 19 Years | 1,217 (6.1%) | 1,094 (6.5%) |
| 20 to 24 Years | 1,840 (9.3%) | 1,489 (8.9%) |
| 25 to 29 Years | 1,401 (7.0%) | 1,032 (6.1%) |
| 30 to 34 Years | 1,397 (7.0%) | 1,117 (6.7%) |
| 35 to 39 Years | 1,223 (6.1%) | 727 (4.3%) |
| 40 to 44 Years | 1,480 (7.4%) | 988 (5.9%) |
| 45 to 49 Years | 1,363 (6.9%) | 905 (5.4%) |
| 50 to 54 Years | 1,272 (6.4%) | 930 (5.5%) |
| 55 to 59 Years | 1,163 (5.9%) | 1,121 (6.7%) |
| 60 to 64 Years | 1,395 (7.0%) | 1,216 (7.2%) |
| 65 to 69 Years | 1,243 (6.2%) | 1,124 (6.7%) |
| 70 to 74 Years | 806 (4.1%) | 862 (5.1%) |
| 75 to 79 Years | 542 (2.7%) | 706 (4.2%) |
| 80 to 84 Years | 419 (2.1%) | 448 (2.7%) |
| 85 Years and over | 316 (1.6%) | 436 (2.6%) |
| Total | 19,879 (100.0%) | 16,791 (100.0%) |
Families and Households in Chippewa County
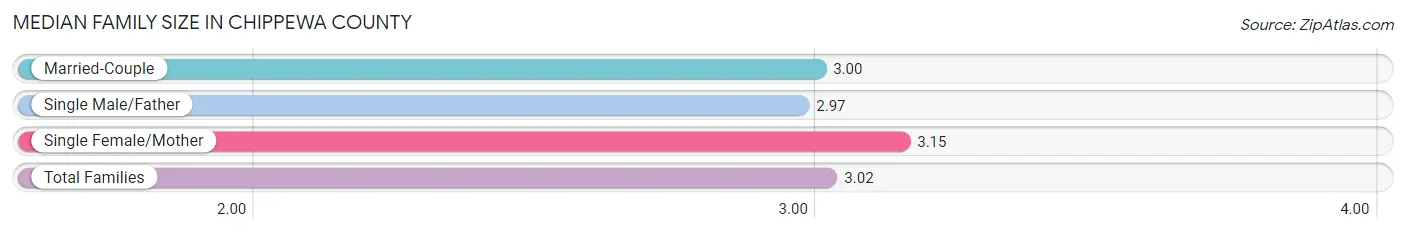
Median Family Size in Chippewa County
The median family size in Chippewa County is 3.02 persons per family, with single female/mother families (1,389 | 16.7%) accounting for the largest median family size of 3.15 persons per family. On the other hand, single male/father families (575 | 6.9%) represent the smallest median family size with 2.97 persons per family.
| Family Type | # Families | Family Size |
| Married-Couple | 6,363 (76.4%) | 3.00 |
| Single Male/Father | 575 (6.9%) | 2.97 |
| Single Female/Mother | 1,389 (16.7%) | 3.15 |
| Total Families | 8,327 (100.0%) | 3.02 |
Median Household Size in Chippewa County
The median household size in Chippewa County is 2.40 persons per household, with single female/mother households (1,389 | 10.1%) accounting for the largest median household size of 3.64 persons per household. non-family households (5,420 | 39.4%) represent the smallest median household size with 1.25 persons per household.
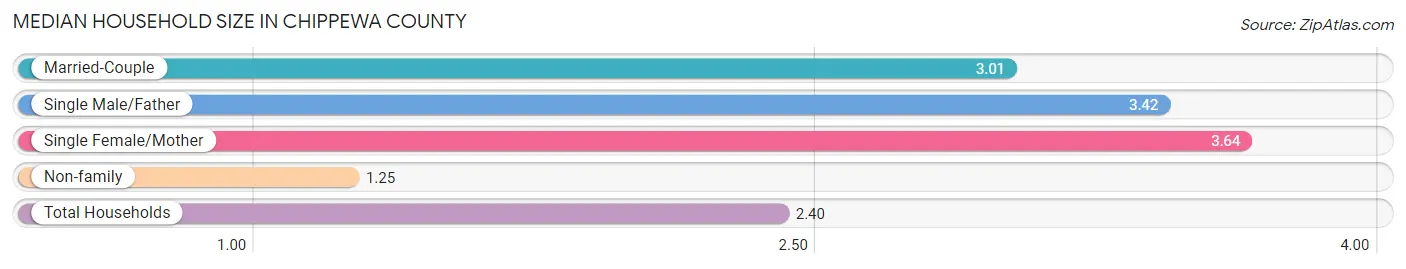
| Household Type | # Households | Household Size |
| Married-Couple | 6,363 (46.3%) | 3.01 |
| Single Male/Father | 575 (4.2%) | 3.42 |
| Single Female/Mother | 1,389 (10.1%) | 3.64 |
| Non-family | 5,420 (39.4%) | 1.25 |
| Total Households | 13,747 (100.0%) | 2.40 |
Household Size by Marriage Status in Chippewa County
Out of a total of 13,747 households in Chippewa County, 8,327 (60.6%) are family households, while 5,420 (39.4%) are nonfamily households. The most numerous type of family households are 2-person households, comprising 4,261, and the most common type of nonfamily households are 1-person households, comprising 4,505.
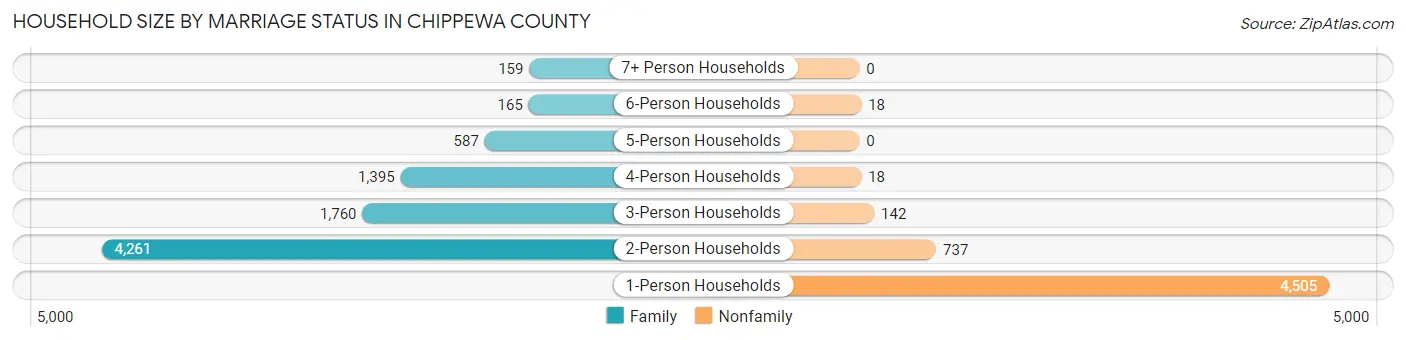
| Household Size | Family Households | Nonfamily Households |
| 1-Person Households | - | 4,505 (32.8%) |
| 2-Person Households | 4,261 (31.0%) | 737 (5.4%) |
| 3-Person Households | 1,760 (12.8%) | 142 (1.0%) |
| 4-Person Households | 1,395 (10.2%) | 18 (0.1%) |
| 5-Person Households | 587 (4.3%) | 0 (0.0%) |
| 6-Person Households | 165 (1.2%) | 18 (0.1%) |
| 7+ Person Households | 159 (1.2%) | 0 (0.0%) |
| Total | 8,327 (60.6%) | 5,420 (39.4%) |
Female Fertility in Chippewa County
Fertility by Age in Chippewa County
Average fertility rate in Chippewa County is 49.0 births per 1,000 women. Women in the age bracket of 20 to 34 years have the highest fertility rate with 89.0 births per 1,000 women. Women in the age bracket of 20 to 34 years acount for 88.2% of all women with births.
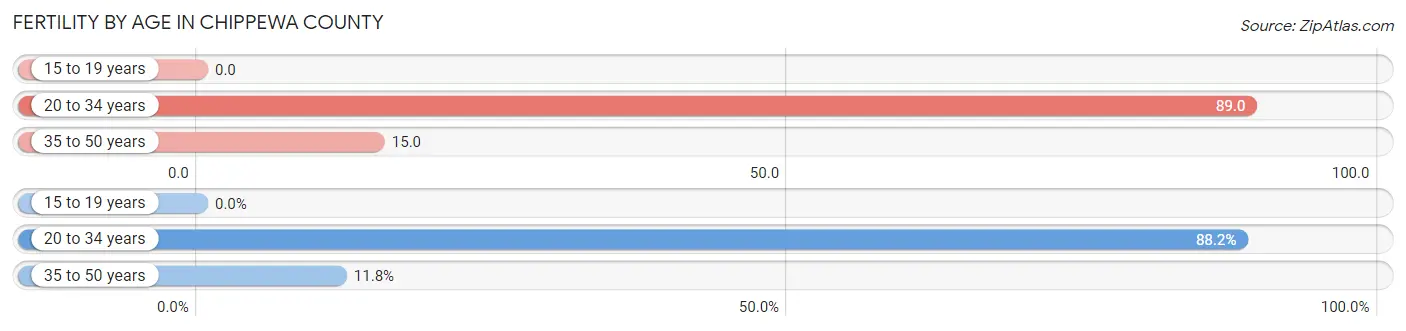
| Age Bracket | Women with Births | Births / 1,000 Women |
| 15 to 19 years | 0 (0.0%) | 0.0 |
| 20 to 34 years | 322 (88.2%) | 89.0 |
| 35 to 50 years | 43 (11.8%) | 15.0 |
| Total | 365 (100.0%) | 49.0 |
Fertility by Age by Marriage Status in Chippewa County
66.3% of women with births (365) in Chippewa County are married. The highest percentage of unmarried women with births falls into 35 to 50 years age bracket with 58.1% of them unmarried at the time of birth, while the lowest percentage of unmarried women with births belong to 20 to 34 years age bracket with 30.4% of them unmarried.
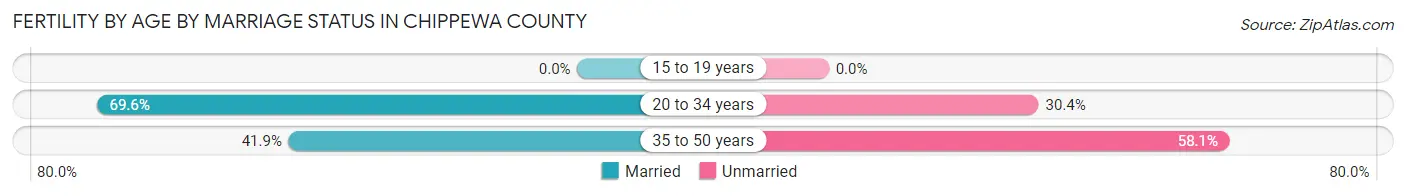
| Age Bracket | Married | Unmarried |
| 15 to 19 years | 0 (0.0%) | 0 (0.0%) |
| 20 to 34 years | 224 (69.6%) | 98 (30.4%) |
| 35 to 50 years | 18 (41.9%) | 25 (58.1%) |
| Total | 242 (66.3%) | 123 (33.7%) |
Fertility by Education in Chippewa County
Average fertility rate in Chippewa County is 49.0 births per 1,000 women. Women with the education attainment of less than high school have the highest fertility rate of 72.0 births per 1,000 women, while women with the education attainment of graduate degree have the lowest fertility at 17.0 births per 1,000 women. Women with the education attainment of college or associate's degree represent 49.9% of all women with births.
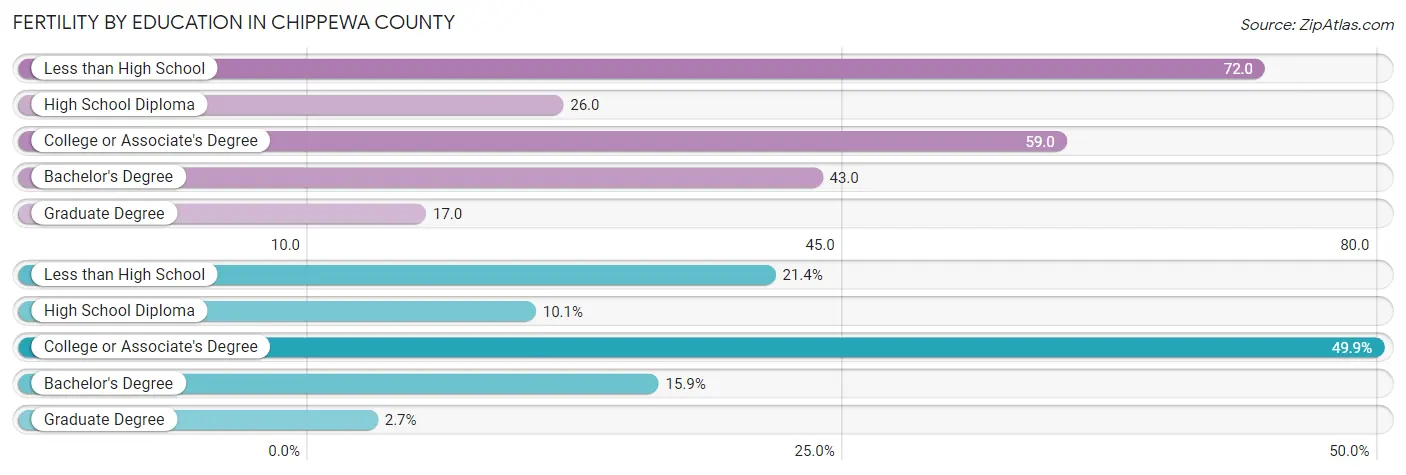
| Educational Attainment | Women with Births | Births / 1,000 Women |
| Less than High School | 78 (21.4%) | 72.0 |
| High School Diploma | 37 (10.1%) | 26.0 |
| College or Associate's Degree | 182 (49.9%) | 59.0 |
| Bachelor's Degree | 58 (15.9%) | 43.0 |
| Graduate Degree | 10 (2.7%) | 17.0 |
| Total | 365 (100.0%) | 49.0 |
Fertility by Education by Marriage Status in Chippewa County
33.7% of women with births in Chippewa County are unmarried. Women with the educational attainment of graduate degree are most likely to be married with 100.0% of them married at childbirth, while women with the educational attainment of high school diploma are least likely to be married with 78.4% of them unmarried at childbirth.
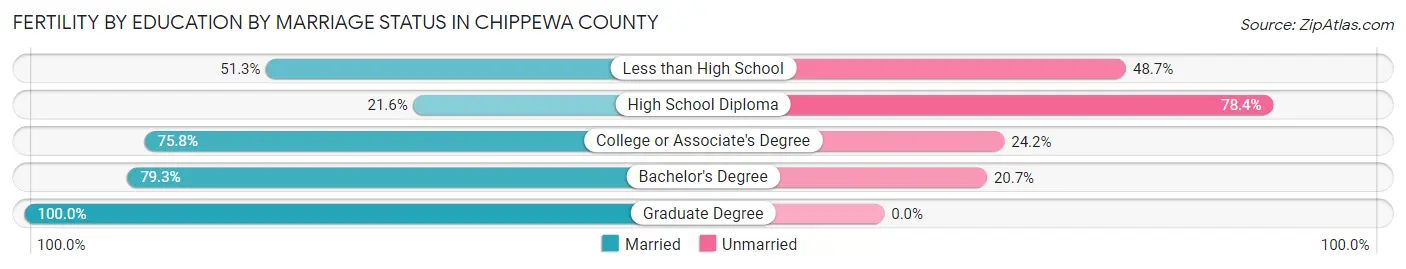
| Educational Attainment | Married | Unmarried |
| Less than High School | 40 (51.3%) | 38 (48.7%) |
| High School Diploma | 8 (21.6%) | 29 (78.4%) |
| College or Associate's Degree | 138 (75.8%) | 44 (24.2%) |
| Bachelor's Degree | 46 (79.3%) | 12 (20.7%) |
| Graduate Degree | 10 (100.0%) | 0 (0.0%) |
| Total | 242 (66.3%) | 123 (33.7%) |
Income in Chippewa County
Income Overview in Chippewa County
Per Capita Income in Chippewa County is $31,167, while median incomes of families and households are $76,273 and $58,408 respectively.
| Characteristic | Number | Measure |
| Per Capita Income | 36,670 | $31,167 |
| Median Family Income | 8,327 | $76,273 |
| Mean Family Income | 8,327 | $99,701 |
| Median Household Income | 13,747 | $58,408 |
| Mean Household Income | 13,747 | $78,556 |
| Income Deficit | 8,327 | $13,211 |
| Wage / Income Gap (%) | 36,670 | 12.32% |
| Wage / Income Gap ($) | 36,670 | 87.68¢ per $1 |
| Gini / Inequality Index | 36,670 | 0.48 |
Earnings by Sex in Chippewa County
Average Earnings in Chippewa County are $29,063, $30,654 for men and $26,877 for women, a difference of 12.3%.

| Sex | Number | Average Earnings |
| Male | 10,642 (54.4%) | $30,654 |
| Female | 8,932 (45.6%) | $26,877 |
| Total | 19,574 (100.0%) | $29,063 |
Earnings by Sex by Income Bracket in Chippewa County
The most common earnings brackets in Chippewa County are $2,499 or less for men (1,105 | 10.4%) and $55,000 to $64,999 for women (817 | 9.1%).
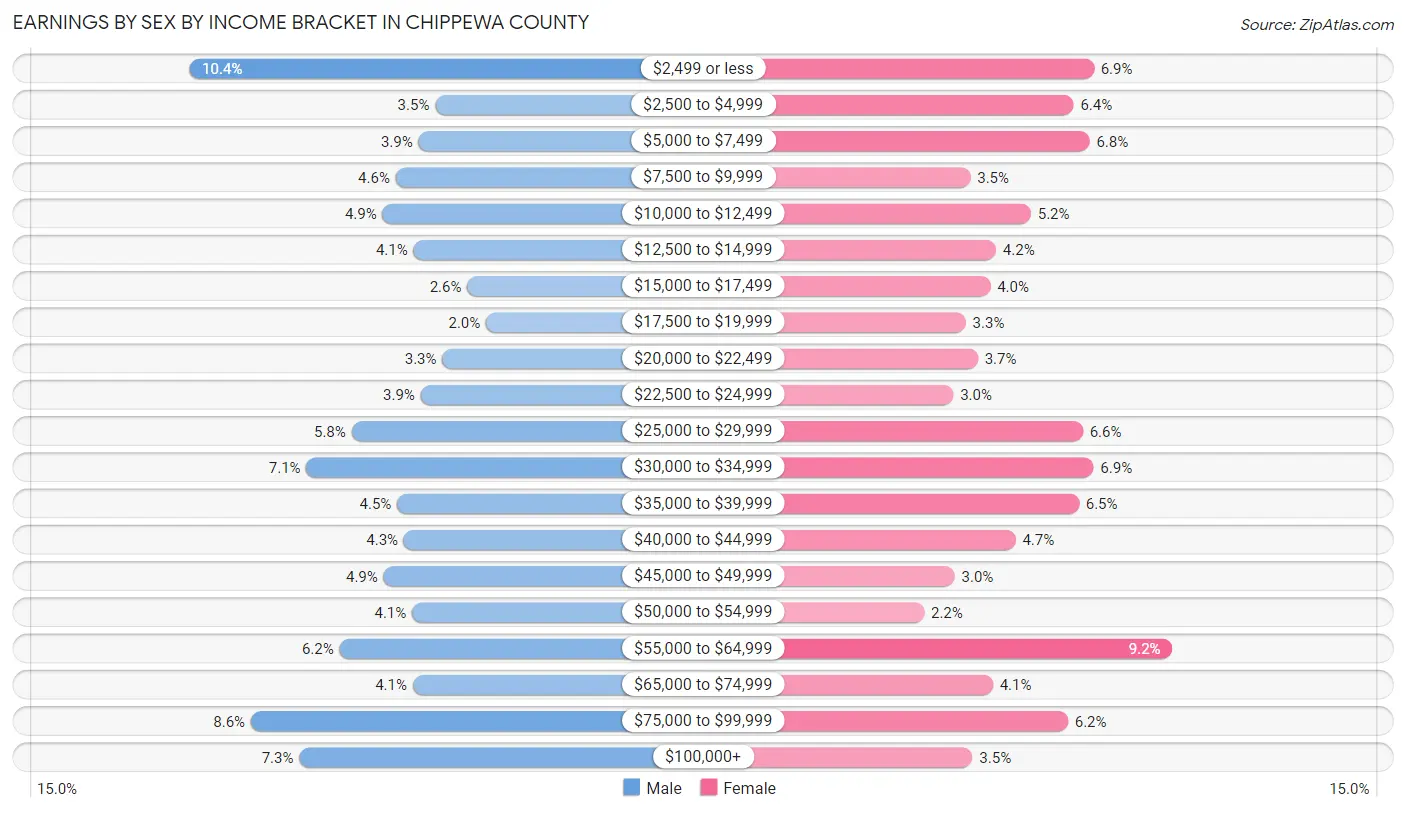
| Income | Male | Female |
| $2,499 or less | 1,105 (10.4%) | 620 (6.9%) |
| $2,500 to $4,999 | 368 (3.5%) | 569 (6.4%) |
| $5,000 to $7,499 | 418 (3.9%) | 609 (6.8%) |
| $7,500 to $9,999 | 486 (4.6%) | 310 (3.5%) |
| $10,000 to $12,499 | 526 (4.9%) | 462 (5.2%) |
| $12,500 to $14,999 | 433 (4.1%) | 374 (4.2%) |
| $15,000 to $17,499 | 272 (2.6%) | 360 (4.0%) |
| $17,500 to $19,999 | 216 (2.0%) | 298 (3.3%) |
| $20,000 to $22,499 | 347 (3.3%) | 329 (3.7%) |
| $22,500 to $24,999 | 412 (3.9%) | 267 (3.0%) |
| $25,000 to $29,999 | 618 (5.8%) | 592 (6.6%) |
| $30,000 to $34,999 | 753 (7.1%) | 619 (6.9%) |
| $35,000 to $39,999 | 482 (4.5%) | 582 (6.5%) |
| $40,000 to $44,999 | 462 (4.3%) | 423 (4.7%) |
| $45,000 to $49,999 | 522 (4.9%) | 271 (3.0%) |
| $50,000 to $54,999 | 437 (4.1%) | 194 (2.2%) |
| $55,000 to $64,999 | 655 (6.1%) | 817 (9.1%) |
| $65,000 to $74,999 | 435 (4.1%) | 366 (4.1%) |
| $75,000 to $99,999 | 920 (8.6%) | 555 (6.2%) |
| $100,000+ | 775 (7.3%) | 315 (3.5%) |
| Total | 10,642 (100.0%) | 8,932 (100.0%) |
Earnings by Sex by Educational Attainment in Chippewa County
Average earnings in Chippewa County are $37,348 for men and $34,071 for women, a difference of 8.8%. Men with an educational attainment of graduate degree enjoy the highest average annual earnings of $90,479, while those with less than high school education earn the least with $16,250. Women with an educational attainment of graduate degree earn the most with the average annual earnings of $67,625, while those with less than high school education have the smallest earnings of $8,810.
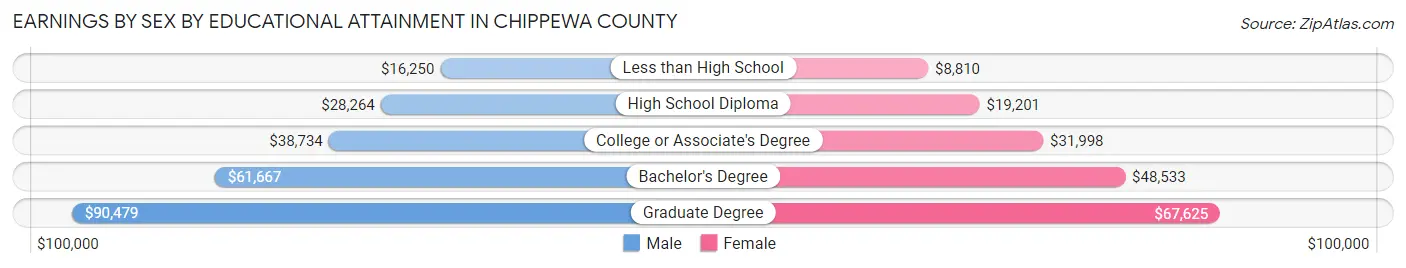
| Educational Attainment | Male Income | Female Income |
| Less than High School | $16,250 | $8,810 |
| High School Diploma | $28,264 | $19,201 |
| College or Associate's Degree | $38,734 | $31,998 |
| Bachelor's Degree | $61,667 | $48,533 |
| Graduate Degree | $90,479 | $67,625 |
| Total | $37,348 | $34,071 |
Family Income in Chippewa County
Family Income Brackets in Chippewa County
According to the Chippewa County family income data, there are 1,665 families falling into the $75,000 to $99,999 income range, which is the most common income bracket and makes up 20.0% of all families. Conversely, the $10,000 to $14,999 income bracket is the least frequent group with only 200 families (2.4%) belonging to this category.
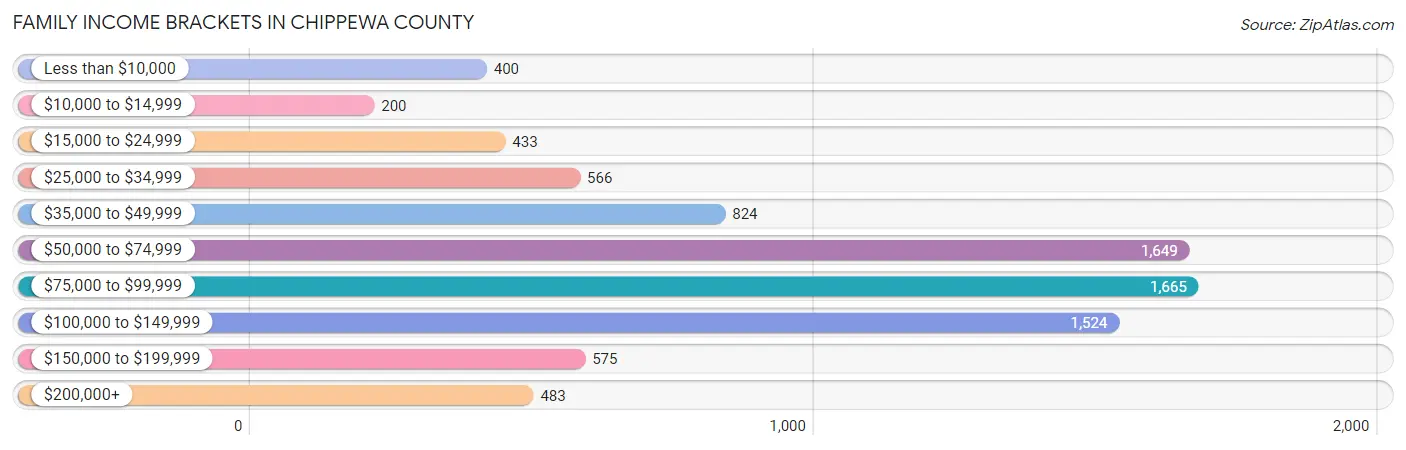
| Income Bracket | # Families | % Families |
| Less than $10,000 | 400 | 4.8% |
| $10,000 to $14,999 | 200 | 2.4% |
| $15,000 to $24,999 | 433 | 5.2% |
| $25,000 to $34,999 | 566 | 6.8% |
| $35,000 to $49,999 | 824 | 9.9% |
| $50,000 to $74,999 | 1,649 | 19.8% |
| $75,000 to $99,999 | 1,665 | 20.0% |
| $100,000 to $149,999 | 1,524 | 18.3% |
| $150,000 to $199,999 | 575 | 6.9% |
| $200,000+ | 483 | 5.8% |
Family Income by Famaliy Size in Chippewa County
5-person families (521 | 6.3%) account for the highest median family income in Chippewa County with $100,398 per family, while 2-person families (4,552 | 54.7%) have the highest median income of $33,522 per family member.
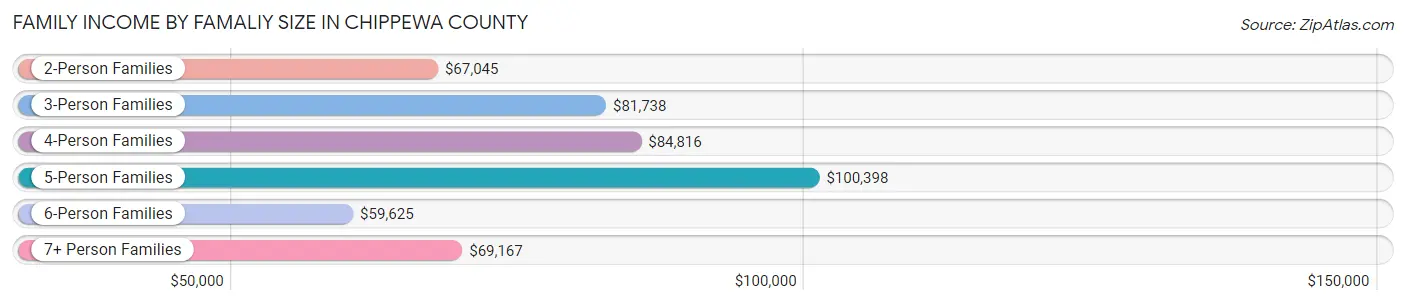
| Income Bracket | # Families | Median Income |
| 2-Person Families | 4,552 (54.7%) | $67,045 |
| 3-Person Families | 1,713 (20.6%) | $81,738 |
| 4-Person Families | 1,267 (15.2%) | $84,816 |
| 5-Person Families | 521 (6.3%) | $100,398 |
| 6-Person Families | 124 (1.5%) | $59,625 |
| 7+ Person Families | 150 (1.8%) | $69,167 |
| Total | 8,327 (100.0%) | $76,273 |
Family Income by Number of Earners in Chippewa County
The median family income in Chippewa County is $76,273, with families comprising 3+ earners (936) having the highest median family income of $125,484, while families with no earners (1,477) have the lowest median family income of $48,210, accounting for 11.2% and 17.7% of families, respectively.
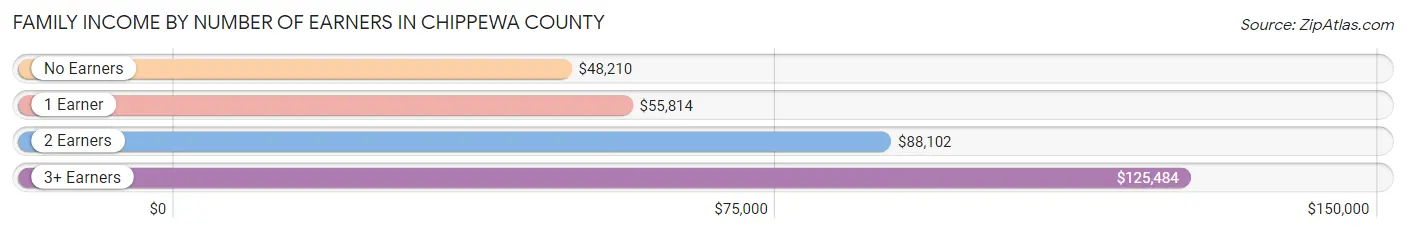
| Number of Earners | # Families | Median Income |
| No Earners | 1,477 (17.7%) | $48,210 |
| 1 Earner | 2,693 (32.3%) | $55,814 |
| 2 Earners | 3,221 (38.7%) | $88,102 |
| 3+ Earners | 936 (11.2%) | $125,484 |
| Total | 8,327 (100.0%) | $76,273 |
Household Income in Chippewa County
Household Income Brackets in Chippewa County
With 2,804 households falling in the category, the $50,000 to $74,999 income range is the most frequent in Chippewa County, accounting for 20.4% of all households. In contrast, only 550 households (4.0%) fall into the $200,000+ income bracket, making it the least populous group.
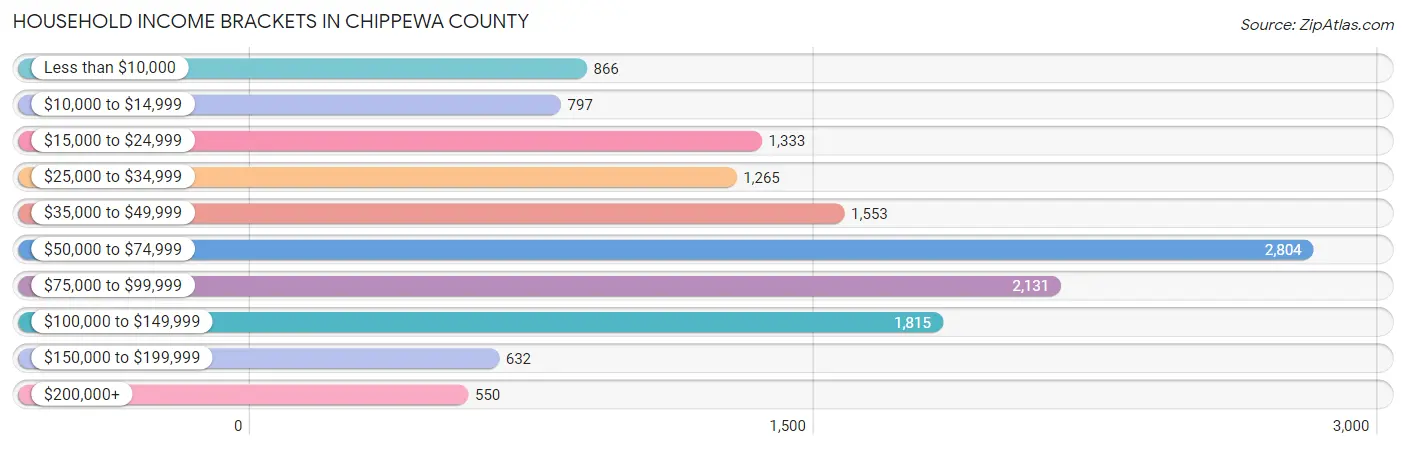
| Income Bracket | # Households | % Households |
| Less than $10,000 | 866 | 6.3% |
| $10,000 to $14,999 | 797 | 5.8% |
| $15,000 to $24,999 | 1,333 | 9.7% |
| $25,000 to $34,999 | 1,265 | 9.2% |
| $35,000 to $49,999 | 1,553 | 11.3% |
| $50,000 to $74,999 | 2,804 | 20.4% |
| $75,000 to $99,999 | 2,131 | 15.5% |
| $100,000 to $149,999 | 1,815 | 13.2% |
| $150,000 to $199,999 | 632 | 4.6% |
| $200,000+ | 550 | 4.0% |
Household Income by Householder Age in Chippewa County
The median household income in Chippewa County is $58,408, with the highest median household income of $71,086 found in the 25 to 44 years age bracket for the primary householder. A total of 3,746 households (27.3%) fall into this category. Meanwhile, the 15 to 24 years age bracket for the primary householder has the lowest median household income of $24,483, with 671 households (4.9%) in this group.
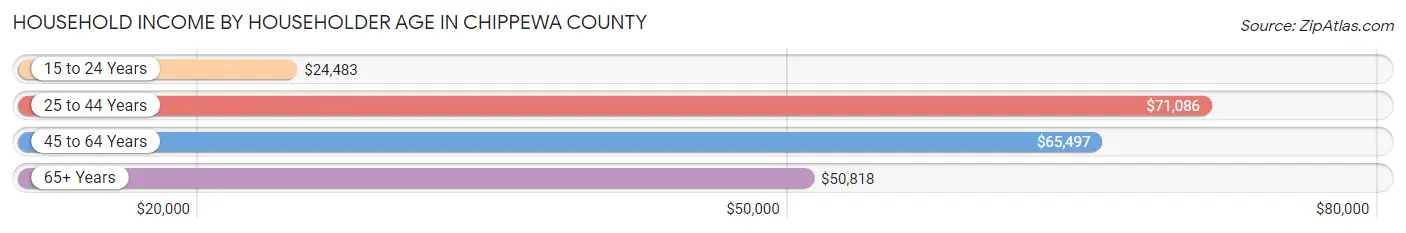
| Income Bracket | # Households | Median Income |
| 15 to 24 Years | 671 (4.9%) | $24,483 |
| 25 to 44 Years | 3,746 (27.3%) | $71,086 |
| 45 to 64 Years | 4,787 (34.8%) | $65,497 |
| 65+ Years | 4,543 (33.1%) | $50,818 |
| Total | 13,747 (100.0%) | $58,408 |
Poverty in Chippewa County
Income Below Poverty by Sex and Age in Chippewa County
With 14.8% poverty level for males and 18.1% for females among the residents of Chippewa County, 6 to 11 year old males and 16 and 17 year old females are the most vulnerable to poverty, with 403 males (37.4%) and 140 females (35.5%) in their respective age groups living below the poverty level.
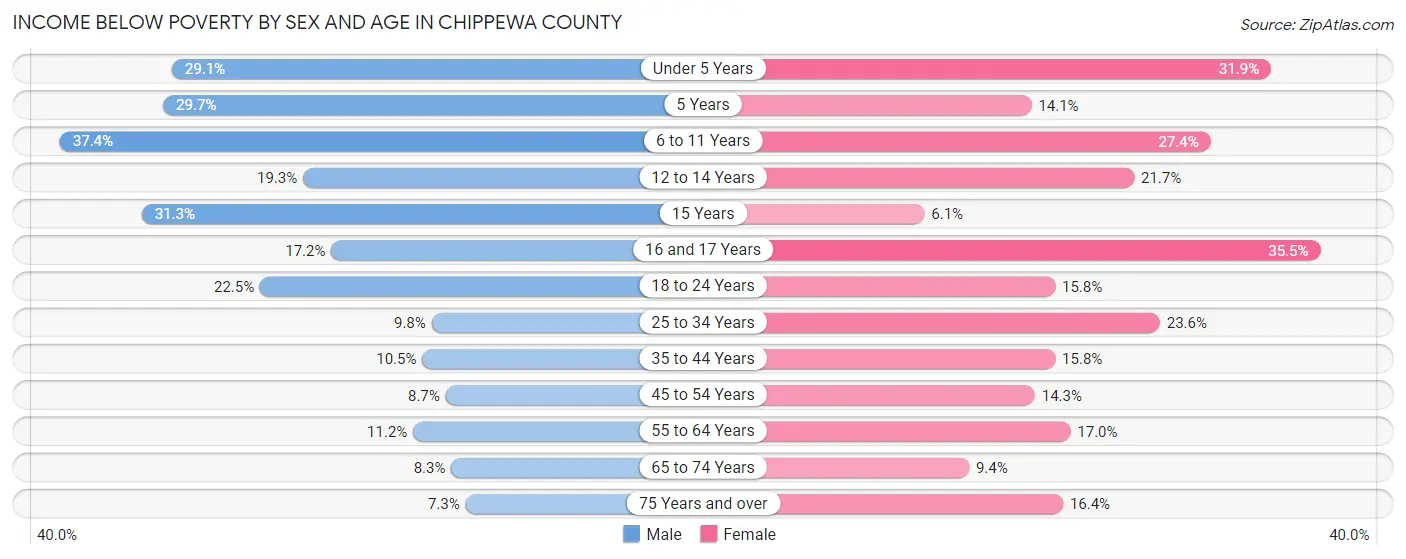
| Age Bracket | Male | Female |
| Under 5 Years | 245 (29.1%) | 262 (31.9%) |
| 5 Years | 52 (29.7%) | 40 (14.1%) |
| 6 to 11 Years | 403 (37.4%) | 273 (27.4%) |
| 12 to 14 Years | 133 (19.3%) | 102 (21.7%) |
| 15 Years | 77 (31.3%) | 10 (6.1%) |
| 16 and 17 Years | 61 (17.2%) | 140 (35.5%) |
| 18 to 24 Years | 432 (22.5%) | 261 (15.8%) |
| 25 to 34 Years | 204 (9.8%) | 493 (23.6%) |
| 35 to 44 Years | 211 (10.5%) | 270 (15.8%) |
| 45 to 54 Years | 170 (8.7%) | 263 (14.3%) |
| 55 to 64 Years | 252 (11.2%) | 396 (17.0%) |
| 65 to 74 Years | 164 (8.3%) | 187 (9.4%) |
| 75 Years and over | 87 (7.3%) | 253 (16.4%) |
| Total | 2,491 (14.8%) | 2,950 (18.1%) |
Income Above Poverty by Sex and Age in Chippewa County
According to the poverty statistics in Chippewa County, males aged 75 years and over and females aged 15 years are the age groups that are most secure financially, with 92.7% of males and 93.9% of females in these age groups living above the poverty line.
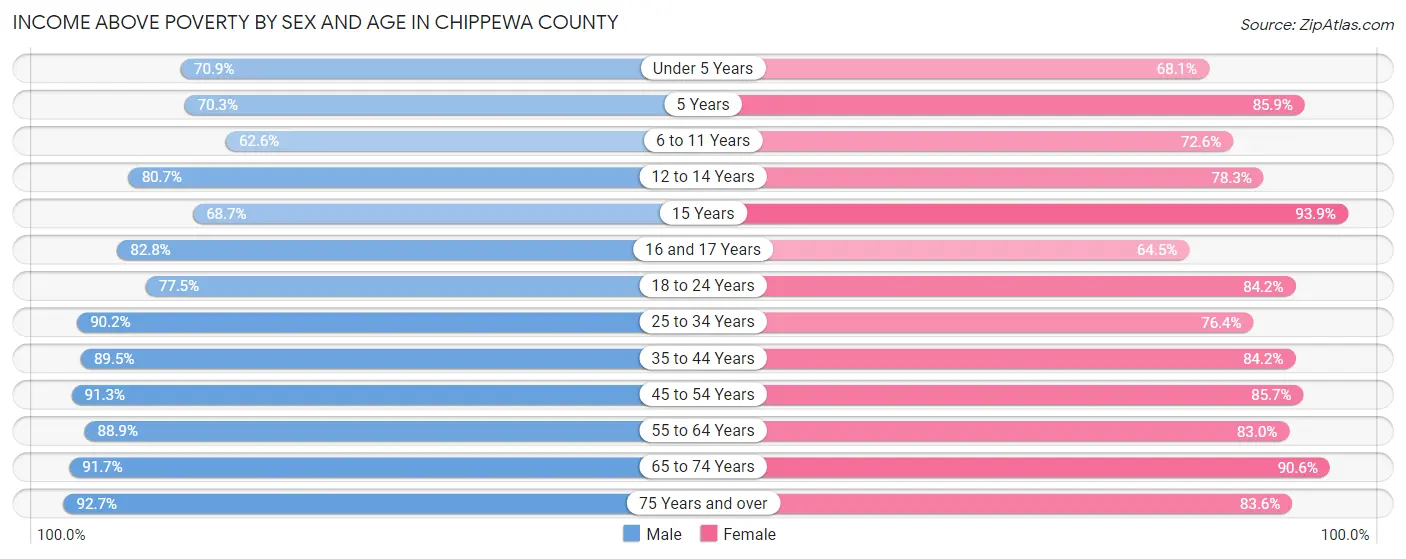
| Age Bracket | Male | Female |
| Under 5 Years | 598 (70.9%) | 560 (68.1%) |
| 5 Years | 123 (70.3%) | 244 (85.9%) |
| 6 to 11 Years | 675 (62.6%) | 724 (72.6%) |
| 12 to 14 Years | 555 (80.7%) | 368 (78.3%) |
| 15 Years | 169 (68.7%) | 153 (93.9%) |
| 16 and 17 Years | 293 (82.8%) | 254 (64.5%) |
| 18 to 24 Years | 1,486 (77.5%) | 1,388 (84.2%) |
| 25 to 34 Years | 1,881 (90.2%) | 1,595 (76.4%) |
| 35 to 44 Years | 1,805 (89.5%) | 1,435 (84.2%) |
| 45 to 54 Years | 1,774 (91.3%) | 1,572 (85.7%) |
| 55 to 64 Years | 2,008 (88.8%) | 1,938 (83.0%) |
| 65 to 74 Years | 1,808 (91.7%) | 1,794 (90.6%) |
| 75 Years and over | 1,112 (92.7%) | 1,288 (83.6%) |
| Total | 14,287 (85.2%) | 13,313 (81.9%) |
Income Below Poverty Among Married-Couple Families in Chippewa County
The poverty statistics for married-couple families in Chippewa County show that 3.8% or 242 of the total 6,363 families live below the poverty line. Families with 5 or more children have the highest poverty rate of 29.6%, comprising of 21 families. On the other hand, families with 1 or 2 children have the lowest poverty rate of 3.1%, which includes 56 families.
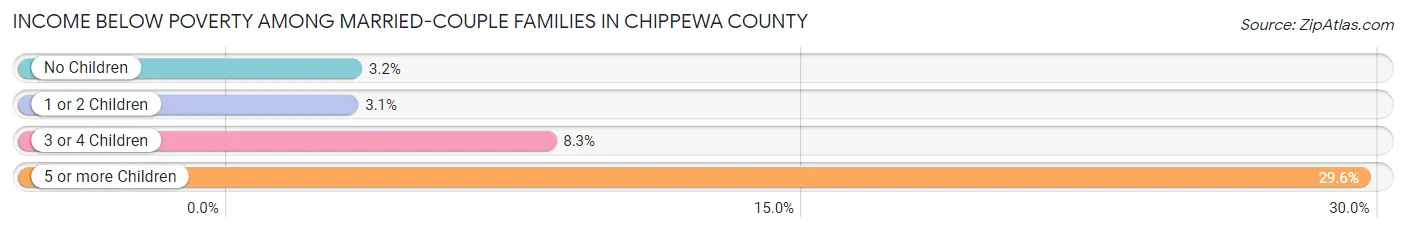
| Children | Above Poverty | Below Poverty |
| No Children | 4,001 (96.8%) | 134 (3.2%) |
| 1 or 2 Children | 1,728 (96.9%) | 56 (3.1%) |
| 3 or 4 Children | 342 (91.7%) | 31 (8.3%) |
| 5 or more Children | 50 (70.4%) | 21 (29.6%) |
| Total | 6,121 (96.2%) | 242 (3.8%) |
Income Below Poverty Among Single-Parent Households in Chippewa County
According to the poverty data in Chippewa County, 18.3% or 105 single-father households and 37.0% or 514 single-mother households are living below the poverty line. Among single-father households, those with 3 or 4 children have the highest poverty rate, with 49 households (62.0%) experiencing poverty. Likewise, among single-mother households, those with 5 or more children have the highest poverty rate, with 25 households (100.0%) falling below the poverty line.
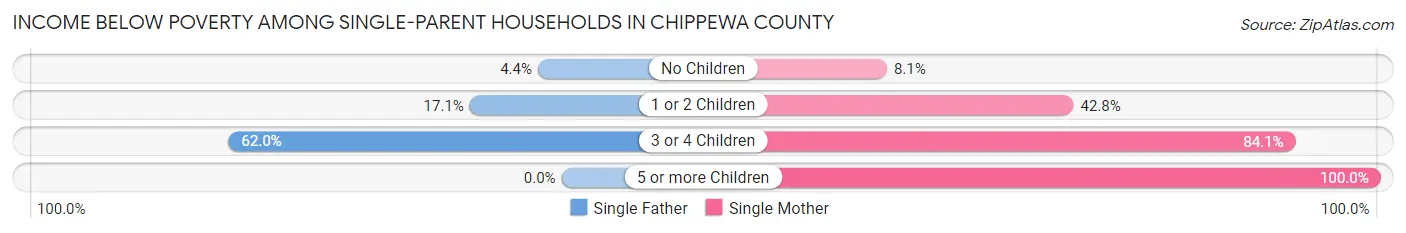
| Children | Single Father | Single Mother |
| No Children | 10 (4.4%) | 36 (8.1%) |
| 1 or 2 Children | 46 (17.1%) | 331 (42.8%) |
| 3 or 4 Children | 49 (62.0%) | 122 (84.1%) |
| 5 or more Children | 0 (0.0%) | 25 (100.0%) |
| Total | 105 (18.3%) | 514 (37.0%) |
Income Below Poverty Among Married-Couple vs Single-Parent Households in Chippewa County
The poverty data for Chippewa County shows that 242 of the married-couple family households (3.8%) and 619 of the single-parent households (31.5%) are living below the poverty level. Within the married-couple family households, those with 5 or more children have the highest poverty rate, with 21 households (29.6%) falling below the poverty line. Among the single-parent households, those with 5 or more children have the highest poverty rate, with 25 household (100.0%) living below poverty.
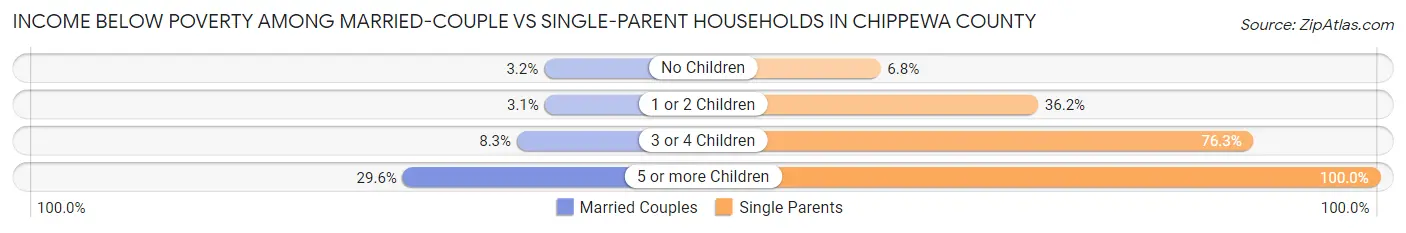
| Children | Married-Couple Families | Single-Parent Households |
| No Children | 134 (3.2%) | 46 (6.8%) |
| 1 or 2 Children | 56 (3.1%) | 377 (36.2%) |
| 3 or 4 Children | 31 (8.3%) | 171 (76.3%) |
| 5 or more Children | 21 (29.6%) | 25 (100.0%) |
| Total | 242 (3.8%) | 619 (31.5%) |
Employment Characteristics in Chippewa County
Employment by Class of Employer in Chippewa County
Among the 15,504 employed individuals in Chippewa County, private company employees (8,283 | 53.4%), not-for-profit organizations (1,677 | 10.8%), and local government employees (1,598 | 10.3%) make up the most common classes of employment.
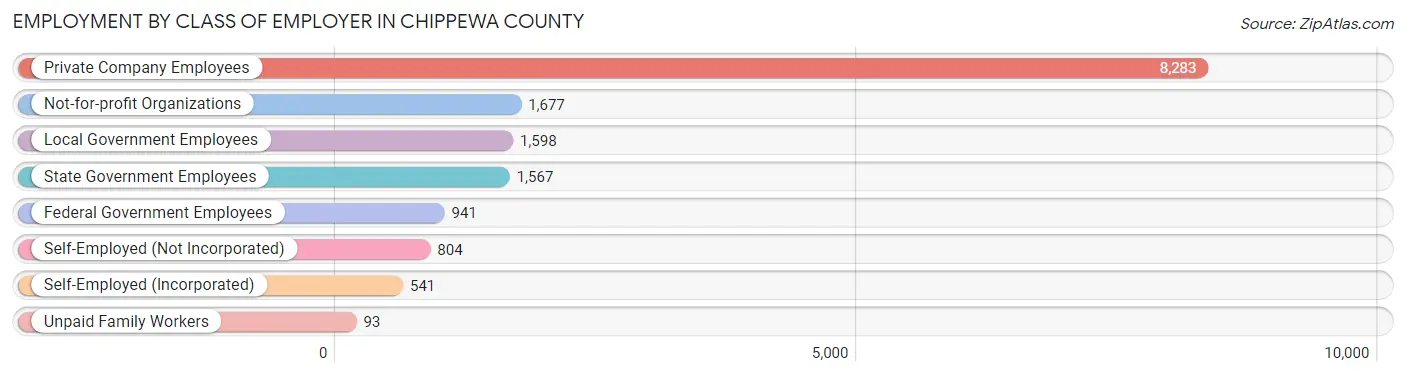
| Employer Class | # Employees | % Employees |
| Private Company Employees | 8,283 | 53.4% |
| Self-Employed (Incorporated) | 541 | 3.5% |
| Self-Employed (Not Incorporated) | 804 | 5.2% |
| Not-for-profit Organizations | 1,677 | 10.8% |
| Local Government Employees | 1,598 | 10.3% |
| State Government Employees | 1,567 | 10.1% |
| Federal Government Employees | 941 | 6.1% |
| Unpaid Family Workers | 93 | 0.6% |
| Total | 15,504 | 100.0% |
Employment Status by Age in Chippewa County
According to the labor force statistics for Chippewa County, out of the total population over 16 years of age (30,863), 55.5% or 17,129 individuals are in the labor force, with 7.7% or 1,319 of them unemployed. The age group with the highest labor force participation rate is 25 to 29 years, with 74.2% or 1,805 individuals in the labor force. Within the labor force, the 30 to 34 years age range has the highest percentage of unemployed individuals, with 16.6% or 299 of them being unemployed.
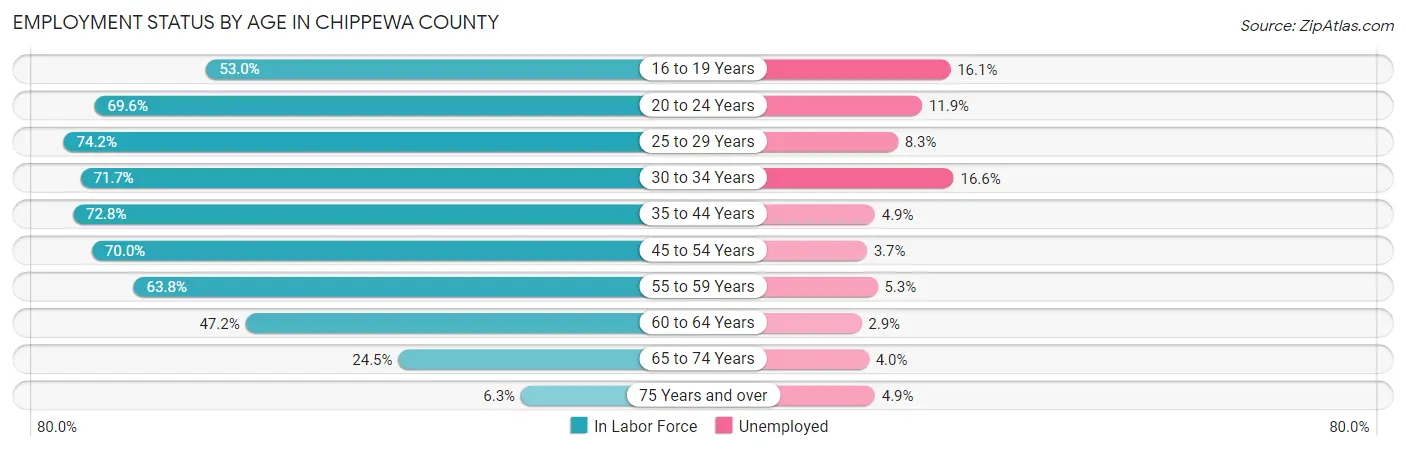
| Age Bracket | In Labor Force | Unemployed |
| 16 to 19 Years | 1,008 (53.0%) | 162 (16.1%) |
| 20 to 24 Years | 2,317 (69.6%) | 276 (11.9%) |
| 25 to 29 Years | 1,805 (74.2%) | 150 (8.3%) |
| 30 to 34 Years | 1,803 (71.7%) | 299 (16.6%) |
| 35 to 44 Years | 3,216 (72.8%) | 158 (4.9%) |
| 45 to 54 Years | 3,129 (70.0%) | 116 (3.7%) |
| 55 to 59 Years | 1,457 (63.8%) | 77 (5.3%) |
| 60 to 64 Years | 1,232 (47.2%) | 36 (2.9%) |
| 65 to 74 Years | 989 (24.5%) | 40 (4.0%) |
| 75 Years and over | 181 (6.3%) | 9 (4.9%) |
| Total | 17,129 (55.5%) | 1,319 (7.7%) |
Employment Status by Educational Attainment in Chippewa County
According to labor force statistics for Chippewa County, 67.5% of individuals (12,643) out of the total population between 25 and 64 years of age (18,730) are in the labor force, with 6.6% or 834 of them being unemployed. The group with the highest labor force participation rate are those with the educational attainment of bachelor's degree or higher, with 87.1% or 3,737 individuals in the labor force. Within the labor force, individuals with less than high school education have the highest percentage of unemployment, with 11.8% or 51 of them being unemployed.
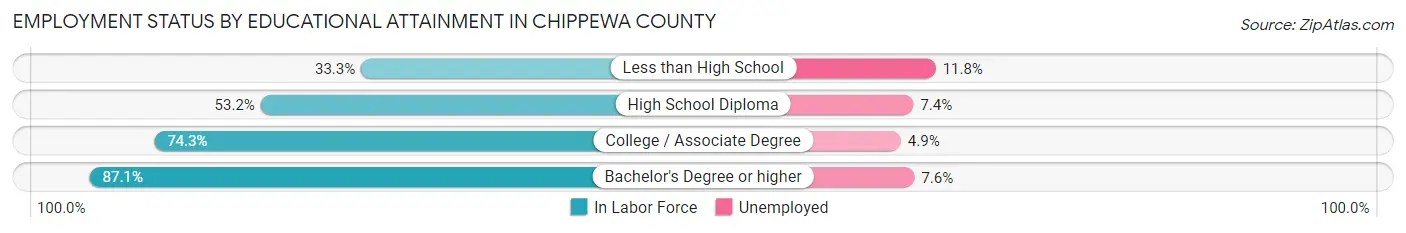
| Educational Attainment | In Labor Force | Unemployed |
| Less than High School | 432 (33.3%) | 153 (11.8%) |
| High School Diploma | 3,273 (53.2%) | 455 (7.4%) |
| College / Associate Degree | 5,194 (74.3%) | 343 (4.9%) |
| Bachelor's Degree or higher | 3,737 (87.1%) | 326 (7.6%) |
| Total | 12,643 (67.5%) | 1,236 (6.6%) |
Employment Occupations by Sex in Chippewa County
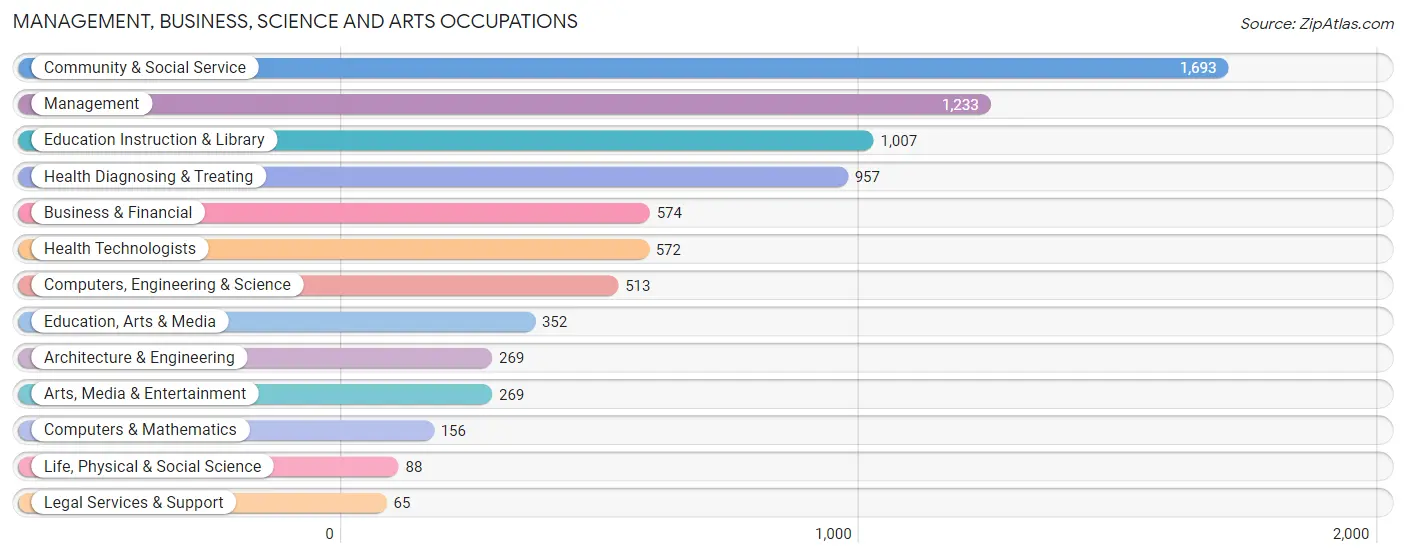
Management, Business, Science and Arts Occupations
The most common Management, Business, Science and Arts occupations in Chippewa County are Community & Social Service (1,693 | 10.8%), Management (1,233 | 7.9%), Education Instruction & Library (1,007 | 6.4%), Health Diagnosing & Treating (957 | 6.1%), and Business & Financial (574 | 3.6%).
Management, Business, Science and Arts Occupations by Sex
Within the Management, Business, Science and Arts occupations in Chippewa County, the most male-oriented occupations are Architecture & Engineering (90.7%), Computers & Mathematics (84.0%), and Computers, Engineering & Science (83.4%), while the most female-oriented occupations are Health Technologists (78.0%), Health Diagnosing & Treating (76.1%), and Education, Arts & Media (69.9%).

| Occupation | Male | Female |
| Management | 732 (59.4%) | 501 (40.6%) |
| Business & Financial | 182 (31.7%) | 392 (68.3%) |
| Computers, Engineering & Science | 428 (83.4%) | 85 (16.6%) |
| Computers & Mathematics | 131 (84.0%) | 25 (16.0%) |
| Architecture & Engineering | 244 (90.7%) | 25 (9.3%) |
| Life, Physical & Social Science | 53 (60.2%) | 35 (39.8%) |
| Community & Social Service | 607 (35.8%) | 1,086 (64.1%) |
| Education, Arts & Media | 106 (30.1%) | 246 (69.9%) |
| Legal Services & Support | 26 (40.0%) | 39 (60.0%) |
| Education Instruction & Library | 306 (30.4%) | 701 (69.6%) |
| Arts, Media & Entertainment | 169 (62.8%) | 100 (37.2%) |
| Health Diagnosing & Treating | 229 (23.9%) | 728 (76.1%) |
| Health Technologists | 126 (22.0%) | 446 (78.0%) |
| Total (Category) | 2,178 (43.8%) | 2,792 (56.2%) |
| Total (Overall) | 8,323 (53.0%) | 7,388 (47.0%) |
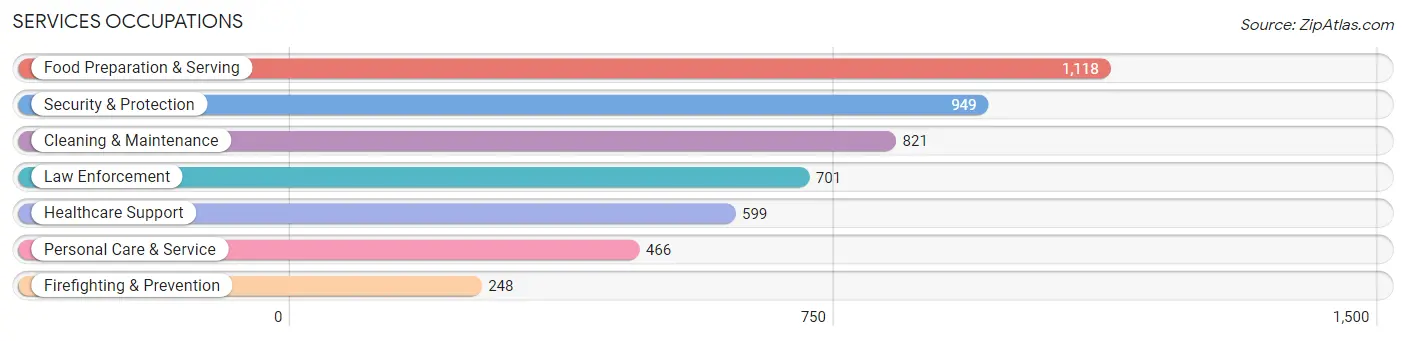
Services Occupations
The most common Services occupations in Chippewa County are Food Preparation & Serving (1,118 | 7.1%), Security & Protection (949 | 6.0%), Cleaning & Maintenance (821 | 5.2%), Law Enforcement (701 | 4.5%), and Healthcare Support (599 | 3.8%).
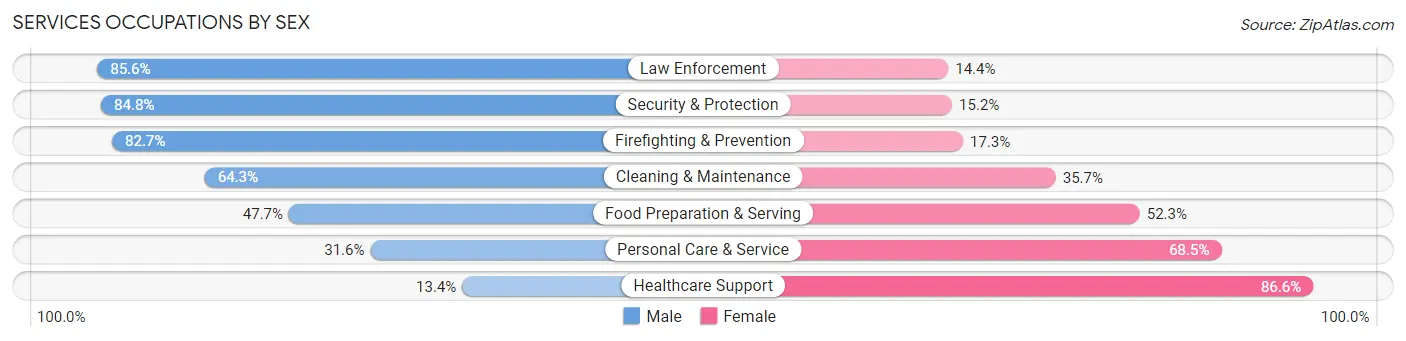
Services Occupations by Sex
Within the Services occupations in Chippewa County, the most male-oriented occupations are Law Enforcement (85.6%), Security & Protection (84.8%), and Firefighting & Prevention (82.7%), while the most female-oriented occupations are Healthcare Support (86.6%), Personal Care & Service (68.4%), and Food Preparation & Serving (52.3%).
| Occupation | Male | Female |
| Healthcare Support | 80 (13.4%) | 519 (86.6%) |
| Security & Protection | 805 (84.8%) | 144 (15.2%) |
| Firefighting & Prevention | 205 (82.7%) | 43 (17.3%) |
| Law Enforcement | 600 (85.6%) | 101 (14.4%) |
| Food Preparation & Serving | 533 (47.7%) | 585 (52.3%) |
| Cleaning & Maintenance | 528 (64.3%) | 293 (35.7%) |
| Personal Care & Service | 147 (31.6%) | 319 (68.4%) |
| Total (Category) | 2,093 (52.9%) | 1,860 (47.0%) |
| Total (Overall) | 8,323 (53.0%) | 7,388 (47.0%) |
Sales and Office Occupations
The most common Sales and Office occupations in Chippewa County are Office & Administration (1,919 | 12.2%), and Sales & Related (1,542 | 9.8%).

Sales and Office Occupations by Sex

| Occupation | Male | Female |
| Sales & Related | 753 (48.8%) | 789 (51.2%) |
| Office & Administration | 395 (20.6%) | 1,524 (79.4%) |
| Total (Category) | 1,148 (33.2%) | 2,313 (66.8%) |
| Total (Overall) | 8,323 (53.0%) | 7,388 (47.0%) |
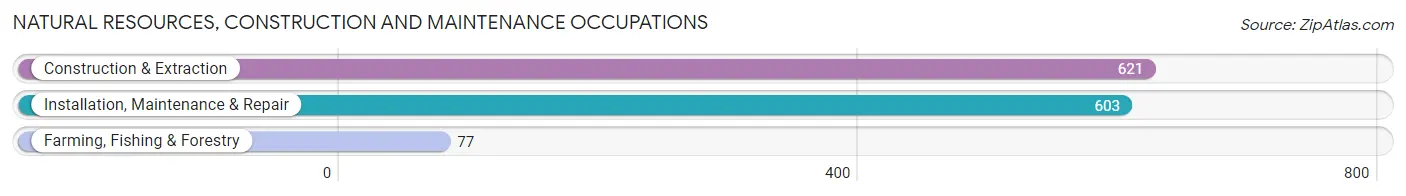
Natural Resources, Construction and Maintenance Occupations
The most common Natural Resources, Construction and Maintenance occupations in Chippewa County are Construction & Extraction (621 | 4.0%), Installation, Maintenance & Repair (603 | 3.8%), and Farming, Fishing & Forestry (77 | 0.5%).
Natural Resources, Construction and Maintenance Occupations by Sex
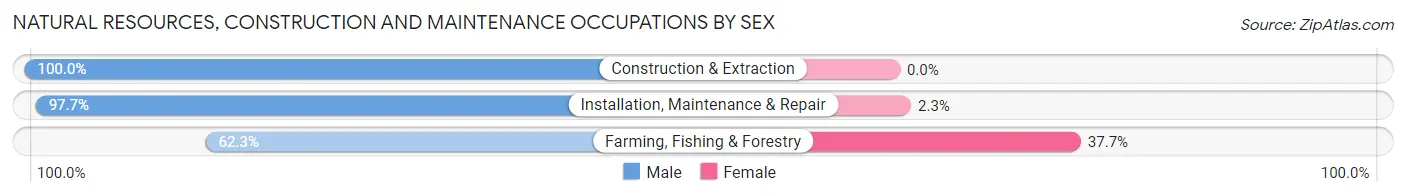
| Occupation | Male | Female |
| Farming, Fishing & Forestry | 48 (62.3%) | 29 (37.7%) |
| Construction & Extraction | 621 (100.0%) | 0 (0.0%) |
| Installation, Maintenance & Repair | 589 (97.7%) | 14 (2.3%) |
| Total (Category) | 1,258 (96.7%) | 43 (3.3%) |
| Total (Overall) | 8,323 (53.0%) | 7,388 (47.0%) |
Production, Transportation and Moving Occupations
The most common Production, Transportation and Moving occupations in Chippewa County are Transportation (865 | 5.5%), Production (656 | 4.2%), and Material Moving (505 | 3.2%).

Production, Transportation and Moving Occupations by Sex
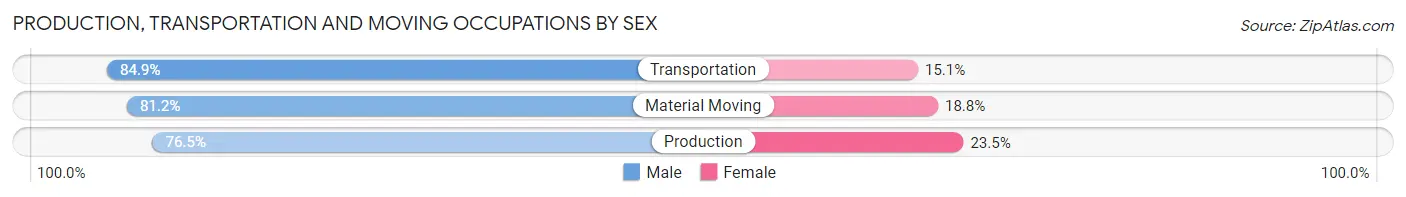
| Occupation | Male | Female |
| Production | 502 (76.5%) | 154 (23.5%) |
| Transportation | 734 (84.9%) | 131 (15.1%) |
| Material Moving | 410 (81.2%) | 95 (18.8%) |
| Total (Category) | 1,646 (81.2%) | 380 (18.8%) |
| Total (Overall) | 8,323 (53.0%) | 7,388 (47.0%) |
Employment Industries by Sex in Chippewa County
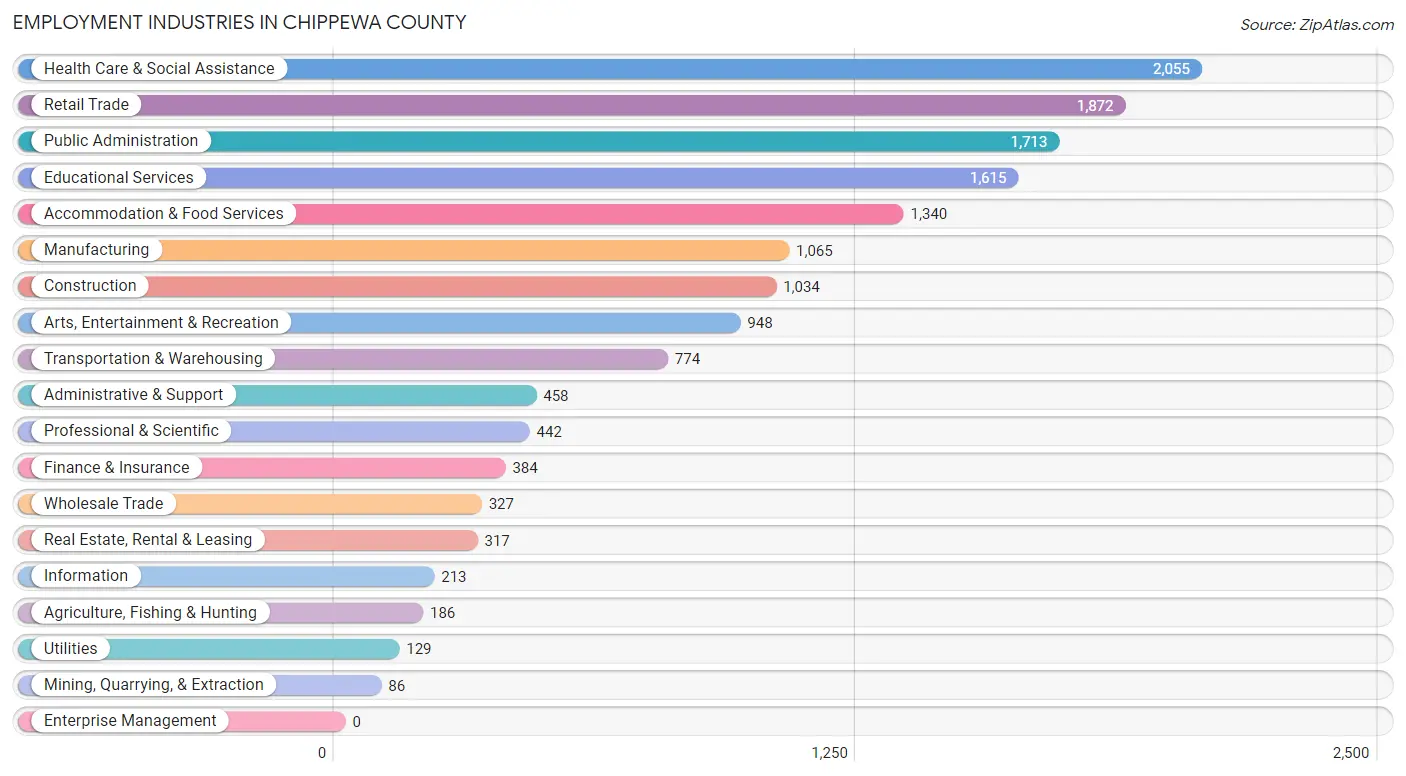
Employment Industries in Chippewa County
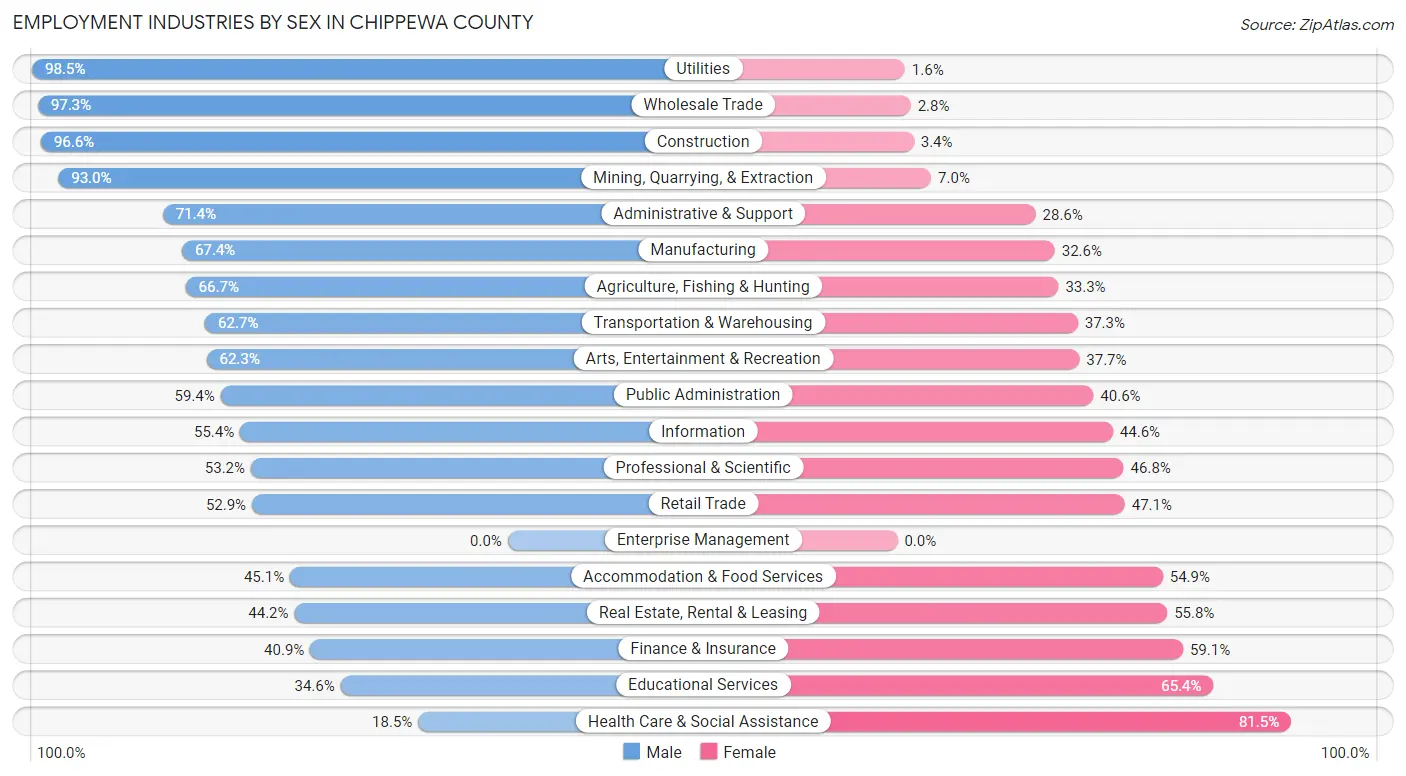
The major employment industries in Chippewa County include Health Care & Social Assistance (2,055 | 13.1%), Retail Trade (1,872 | 11.9%), Public Administration (1,713 | 10.9%), Educational Services (1,615 | 10.3%), and Accommodation & Food Services (1,340 | 8.5%).
Employment Industries by Sex in Chippewa County
The Chippewa County industries that see more men than women are Utilities (98.5%), Wholesale Trade (97.3%), and Construction (96.6%), whereas the industries that tend to have a higher number of women are Health Care & Social Assistance (81.5%), Educational Services (65.4%), and Finance & Insurance (59.1%).
| Industry | Male | Female |
| Agriculture, Fishing & Hunting | 124 (66.7%) | 62 (33.3%) |
| Mining, Quarrying, & Extraction | 80 (93.0%) | 6 (7.0%) |
| Construction | 999 (96.6%) | 35 (3.4%) |
| Manufacturing | 718 (67.4%) | 347 (32.6%) |
| Wholesale Trade | 318 (97.3%) | 9 (2.8%) |
| Retail Trade | 991 (52.9%) | 881 (47.1%) |
| Transportation & Warehousing | 485 (62.7%) | 289 (37.3%) |
| Utilities | 127 (98.5%) | 2 (1.5%) |
| Information | 118 (55.4%) | 95 (44.6%) |
| Finance & Insurance | 157 (40.9%) | 227 (59.1%) |
| Real Estate, Rental & Leasing | 140 (44.2%) | 177 (55.8%) |
| Professional & Scientific | 235 (53.2%) | 207 (46.8%) |
| Enterprise Management | 0 (0.0%) | 0 (0.0%) |
| Administrative & Support | 327 (71.4%) | 131 (28.6%) |
| Educational Services | 559 (34.6%) | 1,056 (65.4%) |
| Health Care & Social Assistance | 381 (18.5%) | 1,674 (81.5%) |
| Arts, Entertainment & Recreation | 591 (62.3%) | 357 (37.7%) |
| Accommodation & Food Services | 604 (45.1%) | 736 (54.9%) |
| Public Administration | 1,018 (59.4%) | 695 (40.6%) |
| Total | 8,323 (53.0%) | 7,388 (47.0%) |
Education in Chippewa County
School Enrollment in Chippewa County
The most common levels of schooling among the 8,160 students in Chippewa County are college / undergraduate (2,679 | 32.8%), high school (1,596 | 19.6%), and middle school (1,408 | 17.2%).

| School Level | # Students | % Students |
| Nursery / Preschool | 389 | 4.8% |
| Kindergarten | 469 | 5.8% |
| Elementary School | 1,382 | 16.9% |
| Middle School | 1,408 | 17.2% |
| High School | 1,596 | 19.6% |
| College / Undergraduate | 2,679 | 32.8% |
| Graduate / Professional | 237 | 2.9% |
| Total | 8,160 | 100.0% |
School Enrollment by Age by Funding Source in Chippewa County
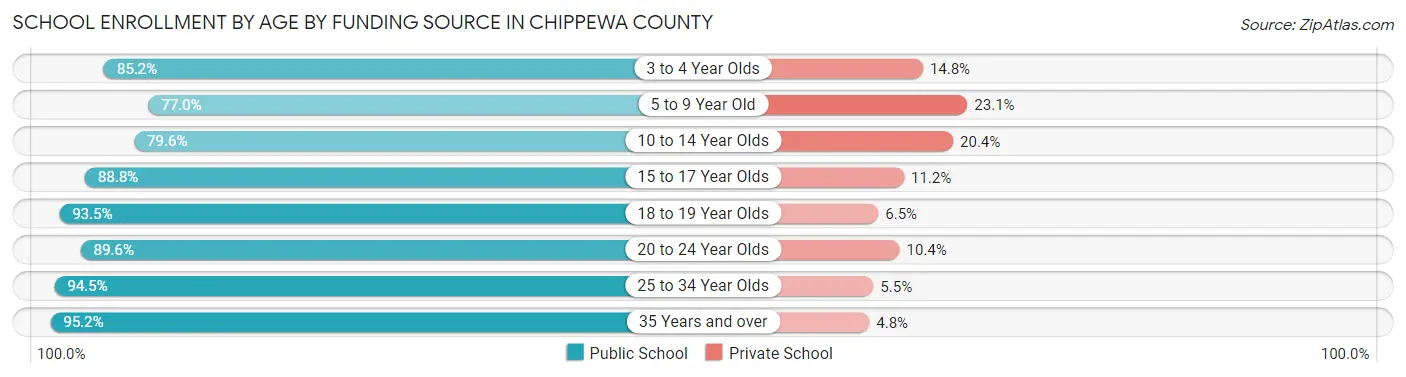
Out of a total of 8,160 students who are enrolled in schools in Chippewa County, 1,191 (14.6%) attend a private institution, while the remaining 6,969 (85.4%) are enrolled in public schools. The age group of 5 to 9 year old has the highest likelihood of being enrolled in private schools, with 425 (23.1% in the age bracket) enrolled. Conversely, the age group of 35 years and over has the lowest likelihood of being enrolled in a private school, with 358 (95.2% in the age bracket) attending a public institution.
| Age Bracket | Public School | Private School |
| 3 to 4 Year Olds | 254 (85.2%) | 44 (14.8%) |
| 5 to 9 Year Old | 1,419 (76.9%) | 425 (23.1%) |
| 10 to 14 Year Olds | 1,336 (79.6%) | 342 (20.4%) |
| 15 to 17 Year Olds | 971 (88.8%) | 123 (11.2%) |
| 18 to 19 Year Olds | 855 (93.5%) | 59 (6.5%) |
| 20 to 24 Year Olds | 1,316 (89.6%) | 153 (10.4%) |
| 25 to 34 Year Olds | 460 (94.5%) | 27 (5.5%) |
| 35 Years and over | 358 (95.2%) | 18 (4.8%) |
| Total | 6,969 (85.4%) | 1,191 (14.6%) |
Educational Attainment by Field of Study in Chippewa County
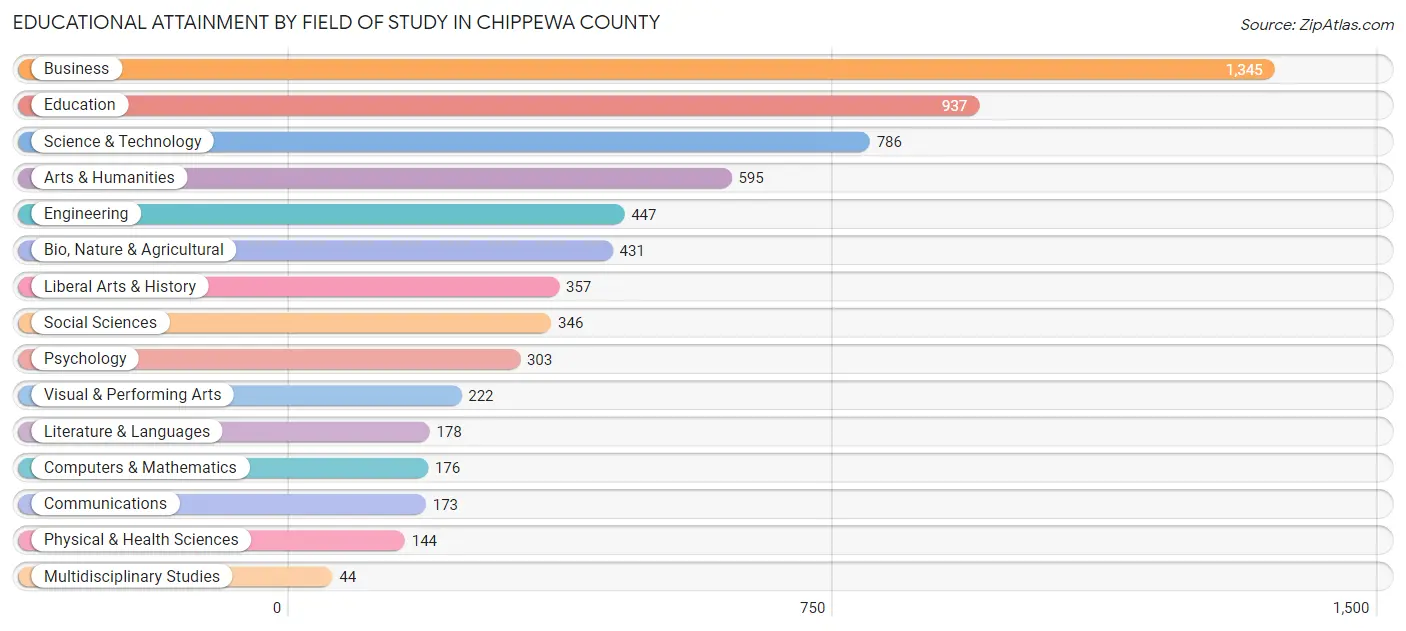
Business (1,345 | 20.7%), education (937 | 14.4%), science & technology (786 | 12.1%), arts & humanities (595 | 9.2%), and engineering (447 | 6.9%) are the most common fields of study among 6,484 individuals in Chippewa County who have obtained a bachelor's degree or higher.
| Field of Study | # Graduates | % Graduates |
| Computers & Mathematics | 176 | 2.7% |
| Bio, Nature & Agricultural | 431 | 6.7% |
| Physical & Health Sciences | 144 | 2.2% |
| Psychology | 303 | 4.7% |
| Social Sciences | 346 | 5.3% |
| Engineering | 447 | 6.9% |
| Multidisciplinary Studies | 44 | 0.7% |
| Science & Technology | 786 | 12.1% |
| Business | 1,345 | 20.7% |
| Education | 937 | 14.4% |
| Literature & Languages | 178 | 2.8% |
| Liberal Arts & History | 357 | 5.5% |
| Visual & Performing Arts | 222 | 3.4% |
| Communications | 173 | 2.7% |
| Arts & Humanities | 595 | 9.2% |
| Total | 6,484 | 100.0% |
Transportation & Commute in Chippewa County
Vehicle Availability by Sex in Chippewa County
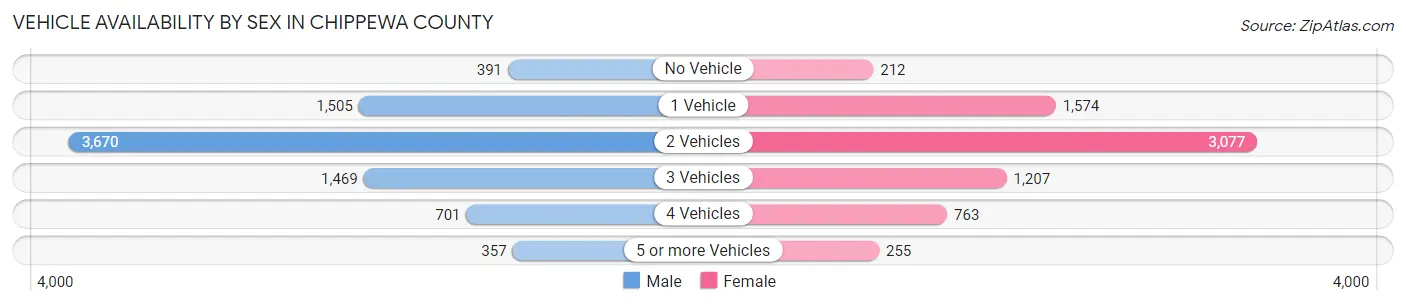
The most prevalent vehicle ownership categories in Chippewa County are males with 2 vehicles (3,670, accounting for 45.4%) and females with 2 vehicles (3,077, making up 51.8%).
| Vehicles Available | Male | Female |
| No Vehicle | 391 (4.8%) | 212 (3.0%) |
| 1 Vehicle | 1,505 (18.6%) | 1,574 (22.2%) |
| 2 Vehicles | 3,670 (45.4%) | 3,077 (43.4%) |
| 3 Vehicles | 1,469 (18.1%) | 1,207 (17.0%) |
| 4 Vehicles | 701 (8.7%) | 763 (10.8%) |
| 5 or more Vehicles | 357 (4.4%) | 255 (3.6%) |
| Total | 8,093 (100.0%) | 7,088 (100.0%) |
Commute Time in Chippewa County
The most frequently occuring commute durations in Chippewa County are 5 to 9 minutes (3,506 commuters, 24.2%), 10 to 14 minutes (2,602 commuters, 17.9%), and 15 to 19 minutes (2,240 commuters, 15.5%).
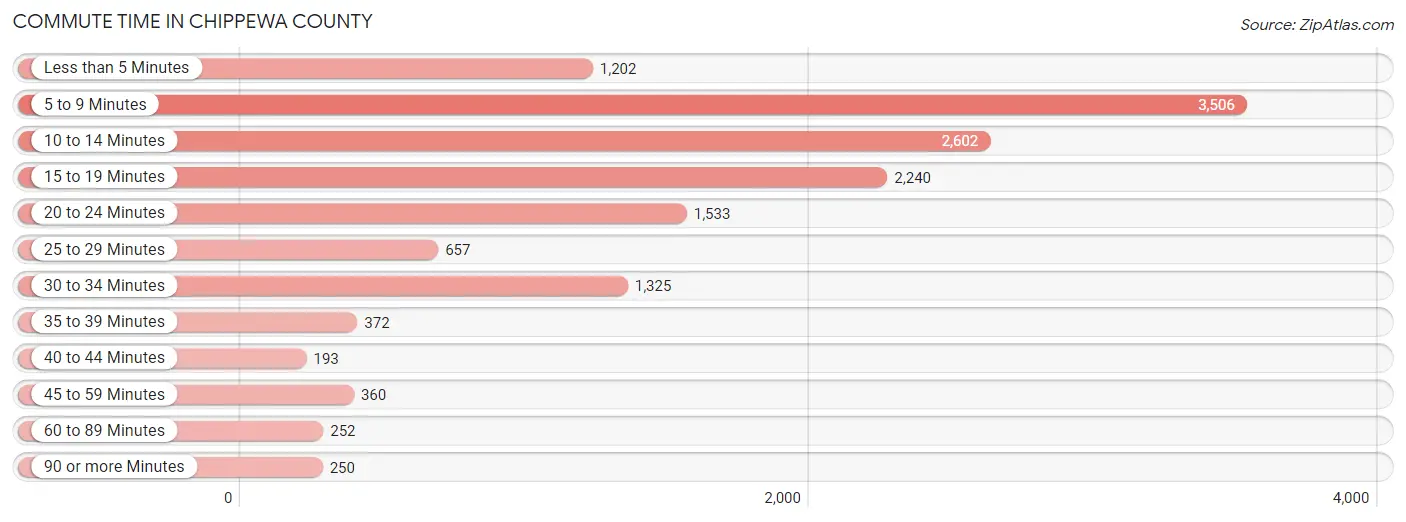
| Commute Time | # Commuters | % Commuters |
| Less than 5 Minutes | 1,202 | 8.3% |
| 5 to 9 Minutes | 3,506 | 24.2% |
| 10 to 14 Minutes | 2,602 | 17.9% |
| 15 to 19 Minutes | 2,240 | 15.5% |
| 20 to 24 Minutes | 1,533 | 10.6% |
| 25 to 29 Minutes | 657 | 4.5% |
| 30 to 34 Minutes | 1,325 | 9.1% |
| 35 to 39 Minutes | 372 | 2.6% |
| 40 to 44 Minutes | 193 | 1.3% |
| 45 to 59 Minutes | 360 | 2.5% |
| 60 to 89 Minutes | 252 | 1.7% |
| 90 or more Minutes | 250 | 1.7% |
Commute Time by Sex in Chippewa County
The most common commute times in Chippewa County are 5 to 9 minutes (1,661 commuters, 21.5%) for males and 5 to 9 minutes (1,845 commuters, 27.3%) for females.
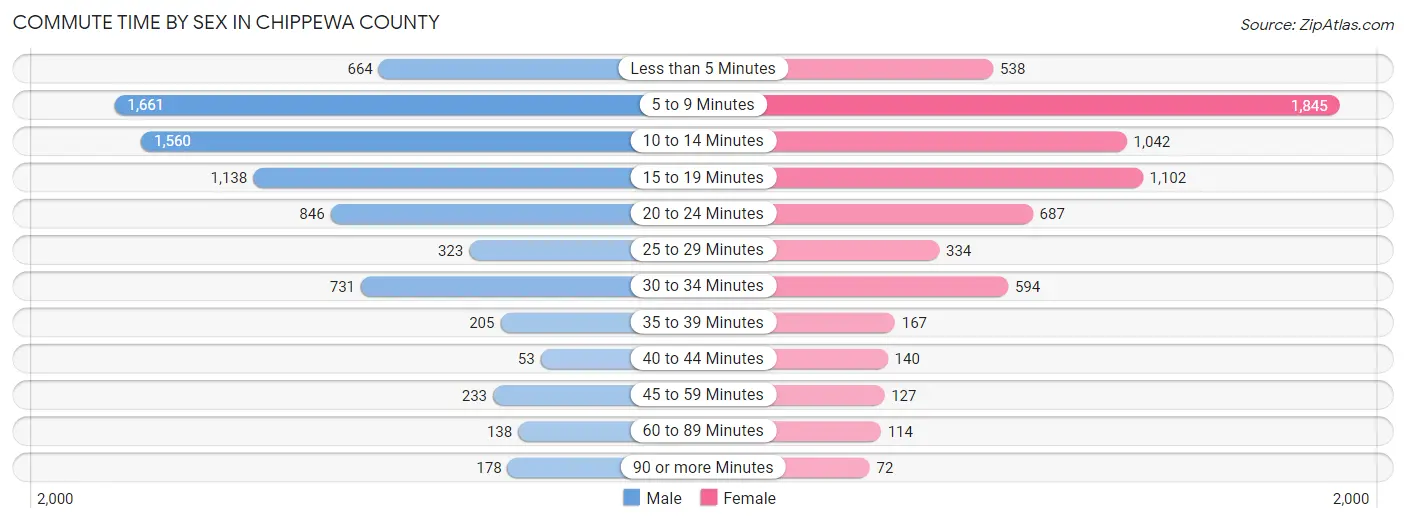
| Commute Time | Male | Female |
| Less than 5 Minutes | 664 (8.6%) | 538 (8.0%) |
| 5 to 9 Minutes | 1,661 (21.5%) | 1,845 (27.3%) |
| 10 to 14 Minutes | 1,560 (20.2%) | 1,042 (15.4%) |
| 15 to 19 Minutes | 1,138 (14.7%) | 1,102 (16.3%) |
| 20 to 24 Minutes | 846 (10.9%) | 687 (10.2%) |
| 25 to 29 Minutes | 323 (4.2%) | 334 (4.9%) |
| 30 to 34 Minutes | 731 (9.5%) | 594 (8.8%) |
| 35 to 39 Minutes | 205 (2.6%) | 167 (2.5%) |
| 40 to 44 Minutes | 53 (0.7%) | 140 (2.1%) |
| 45 to 59 Minutes | 233 (3.0%) | 127 (1.9%) |
| 60 to 89 Minutes | 138 (1.8%) | 114 (1.7%) |
| 90 or more Minutes | 178 (2.3%) | 72 (1.1%) |
Time of Departure to Work by Sex in Chippewa County
The most frequent times of departure to work in Chippewa County are 7:30 AM to 7:59 AM (1,183, 15.3%) for males and 7:30 AM to 7:59 AM (1,558, 23.0%) for females.
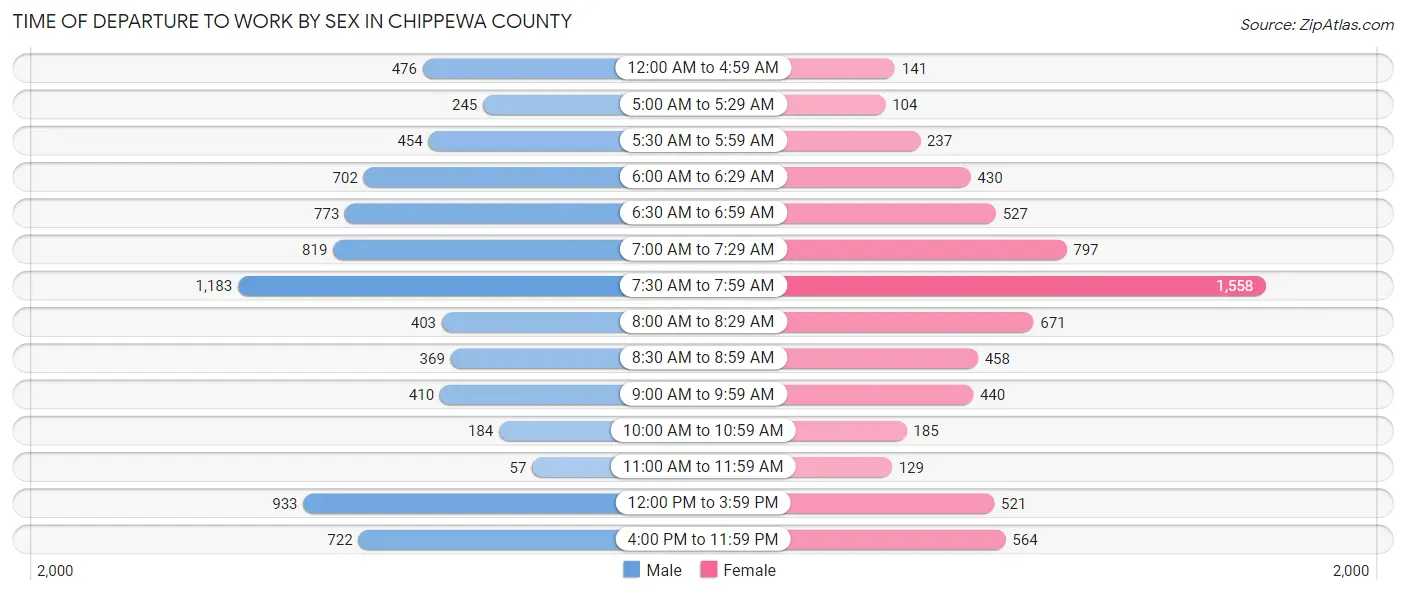
| Time of Departure | Male | Female |
| 12:00 AM to 4:59 AM | 476 (6.2%) | 141 (2.1%) |
| 5:00 AM to 5:29 AM | 245 (3.2%) | 104 (1.5%) |
| 5:30 AM to 5:59 AM | 454 (5.9%) | 237 (3.5%) |
| 6:00 AM to 6:29 AM | 702 (9.1%) | 430 (6.4%) |
| 6:30 AM to 6:59 AM | 773 (10.0%) | 527 (7.8%) |
| 7:00 AM to 7:29 AM | 819 (10.6%) | 797 (11.8%) |
| 7:30 AM to 7:59 AM | 1,183 (15.3%) | 1,558 (23.0%) |
| 8:00 AM to 8:29 AM | 403 (5.2%) | 671 (9.9%) |
| 8:30 AM to 8:59 AM | 369 (4.8%) | 458 (6.8%) |
| 9:00 AM to 9:59 AM | 410 (5.3%) | 440 (6.5%) |
| 10:00 AM to 10:59 AM | 184 (2.4%) | 185 (2.7%) |
| 11:00 AM to 11:59 AM | 57 (0.7%) | 129 (1.9%) |
| 12:00 PM to 3:59 PM | 933 (12.1%) | 521 (7.7%) |
| 4:00 PM to 11:59 PM | 722 (9.3%) | 564 (8.3%) |
| Total | 7,730 (100.0%) | 6,762 (100.0%) |
Housing Occupancy in Chippewa County
Occupancy by Ownership in Chippewa County
Of the total 13,747 dwellings in Chippewa County, owner-occupied units account for 10,120 (73.6%), while renter-occupied units make up 3,627 (26.4%).
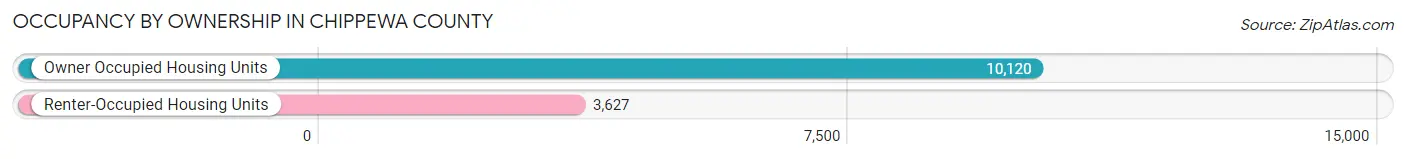
| Occupancy | # Housing Units | % Housing Units |
| Owner Occupied Housing Units | 10,120 | 73.6% |
| Renter-Occupied Housing Units | 3,627 | 26.4% |
| Total Occupied Housing Units | 13,747 | 100.0% |
Occupancy by Household Size in Chippewa County
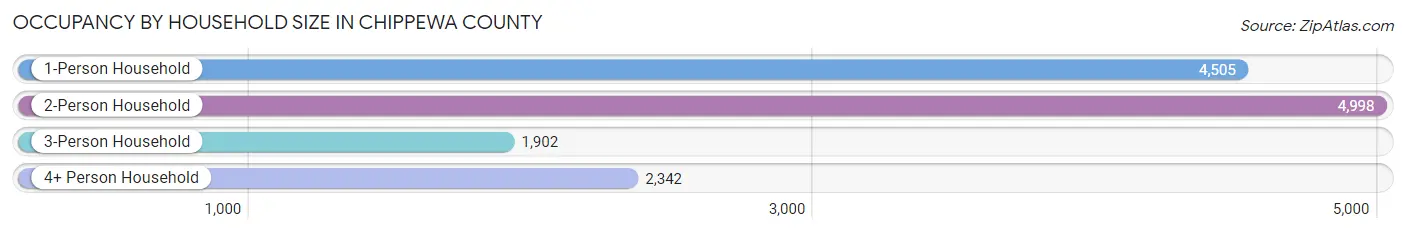
| Household Size | # Housing Units | % Housing Units |
| 1-Person Household | 4,505 | 32.8% |
| 2-Person Household | 4,998 | 36.4% |
| 3-Person Household | 1,902 | 13.8% |
| 4+ Person Household | 2,342 | 17.0% |
| Total Housing Units | 13,747 | 100.0% |
Occupancy by Ownership by Household Size in Chippewa County

| Household Size | Owner-occupied | Renter-occupied |
| 1-Person Household | 2,730 (60.6%) | 1,775 (39.4%) |
| 2-Person Household | 4,161 (83.3%) | 837 (16.8%) |
| 3-Person Household | 1,376 (72.3%) | 526 (27.7%) |
| 4+ Person Household | 1,853 (79.1%) | 489 (20.9%) |
| Total Housing Units | 10,120 (73.6%) | 3,627 (26.4%) |
Occupancy by Educational Attainment in Chippewa County
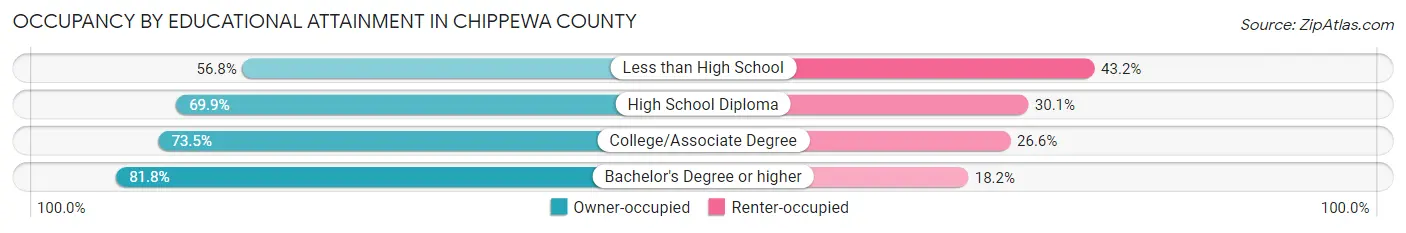
| Household Size | Owner-occupied | Renter-occupied |
| Less than High School | 490 (56.8%) | 373 (43.2%) |
| High School Diploma | 2,739 (69.9%) | 1,178 (30.1%) |
| College/Associate Degree | 3,914 (73.5%) | 1,415 (26.6%) |
| Bachelor's Degree or higher | 2,977 (81.8%) | 661 (18.2%) |
Occupancy by Age of Householder in Chippewa County
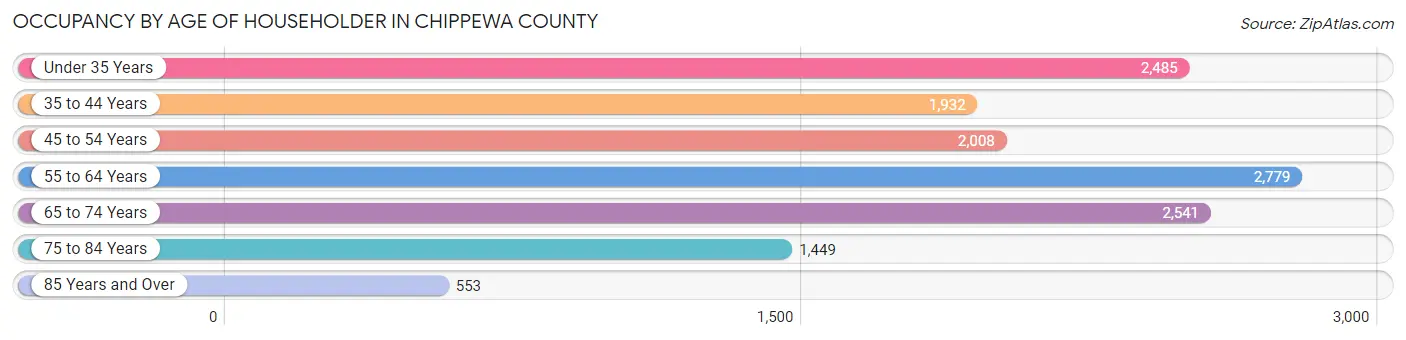
| Age Bracket | # Households | % Households |
| Under 35 Years | 2,485 | 18.1% |
| 35 to 44 Years | 1,932 | 14.1% |
| 45 to 54 Years | 2,008 | 14.6% |
| 55 to 64 Years | 2,779 | 20.2% |
| 65 to 74 Years | 2,541 | 18.5% |
| 75 to 84 Years | 1,449 | 10.5% |
| 85 Years and Over | 553 | 4.0% |
| Total | 13,747 | 100.0% |
Housing Finances in Chippewa County
Median Income by Occupancy in Chippewa County
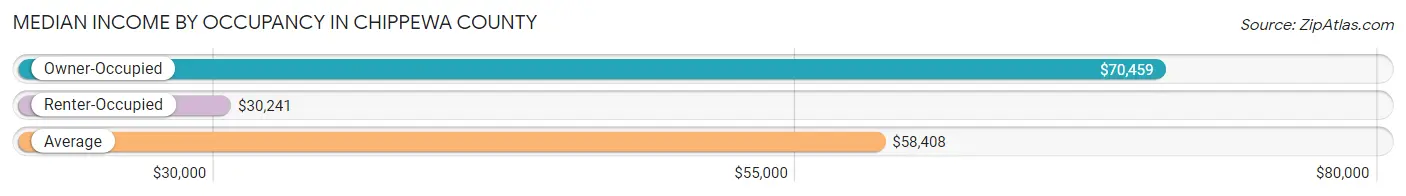
| Occupancy Type | # Households | Median Income |
| Owner-Occupied | 10,120 (73.6%) | $70,459 |
| Renter-Occupied | 3,627 (26.4%) | $30,241 |
| Average | 13,747 (100.0%) | $58,408 |
Occupancy by Householder Income Bracket in Chippewa County
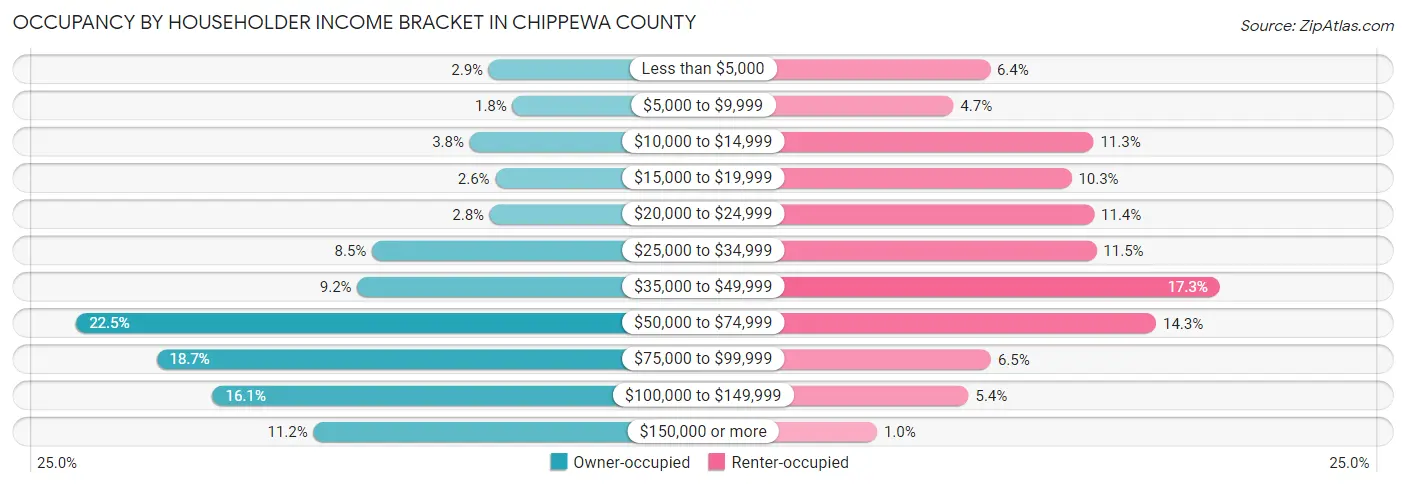
| Income Bracket | Owner-occupied | Renter-occupied |
| Less than $5,000 | 292 (2.9%) | 232 (6.4%) |
| $5,000 to $9,999 | 178 (1.8%) | 169 (4.7%) |
| $10,000 to $14,999 | 385 (3.8%) | 411 (11.3%) |
| $15,000 to $19,999 | 261 (2.6%) | 373 (10.3%) |
| $20,000 to $24,999 | 287 (2.8%) | 412 (11.4%) |
| $25,000 to $34,999 | 855 (8.5%) | 416 (11.5%) |
| $35,000 to $49,999 | 926 (9.1%) | 629 (17.3%) |
| $50,000 to $74,999 | 2,281 (22.5%) | 519 (14.3%) |
| $75,000 to $99,999 | 1,894 (18.7%) | 234 (6.5%) |
| $100,000 to $149,999 | 1,624 (16.1%) | 195 (5.4%) |
| $150,000 or more | 1,137 (11.2%) | 37 (1.0%) |
| Total | 10,120 (100.0%) | 3,627 (100.0%) |
Monthly Housing Cost Tiers in Chippewa County

| Monthly Cost | Owner-occupied | Renter-occupied |
| Less than $300 | 875 (8.6%) | 231 (6.4%) |
| $300 to $499 | 2,214 (21.9%) | 363 (10.0%) |
| $500 to $799 | 2,079 (20.5%) | 1,119 (30.8%) |
| $800 to $999 | 1,461 (14.4%) | 882 (24.3%) |
| $1,000 to $1,499 | 2,186 (21.6%) | 527 (14.5%) |
| $1,500 to $1,999 | 898 (8.9%) | 64 (1.8%) |
| $2,000 to $2,499 | 250 (2.5%) | 2 (0.1%) |
| $2,500 to $2,999 | 102 (1.0%) | 0 (0.0%) |
| $3,000 or more | 55 (0.5%) | 13 (0.4%) |
| Total | 10,120 (100.0%) | 3,627 (100.0%) |
Physical Housing Characteristics in Chippewa County
Housing Structures in Chippewa County
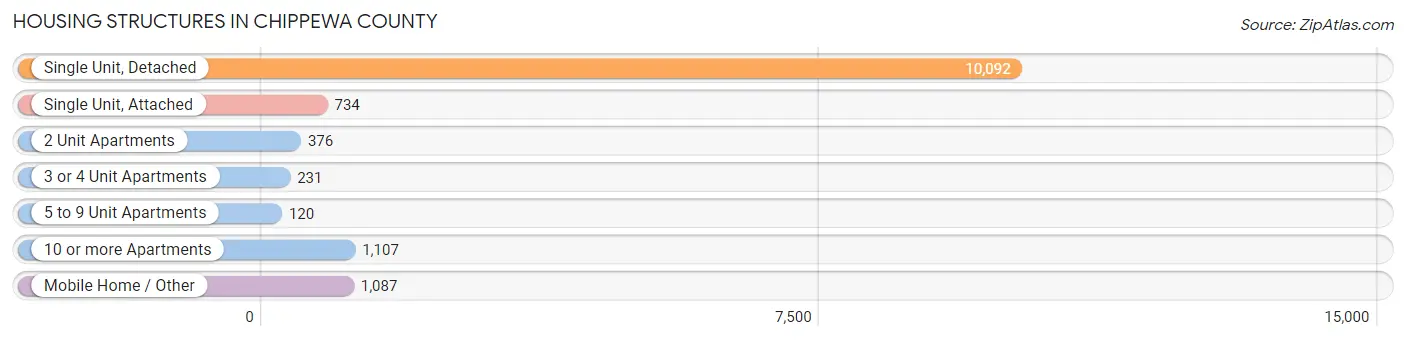
| Structure Type | # Housing Units | % Housing Units |
| Single Unit, Detached | 10,092 | 73.4% |
| Single Unit, Attached | 734 | 5.3% |
| 2 Unit Apartments | 376 | 2.7% |
| 3 or 4 Unit Apartments | 231 | 1.7% |
| 5 to 9 Unit Apartments | 120 | 0.9% |
| 10 or more Apartments | 1,107 | 8.1% |
| Mobile Home / Other | 1,087 | 7.9% |
| Total | 13,747 | 100.0% |
Housing Structures by Occupancy in Chippewa County
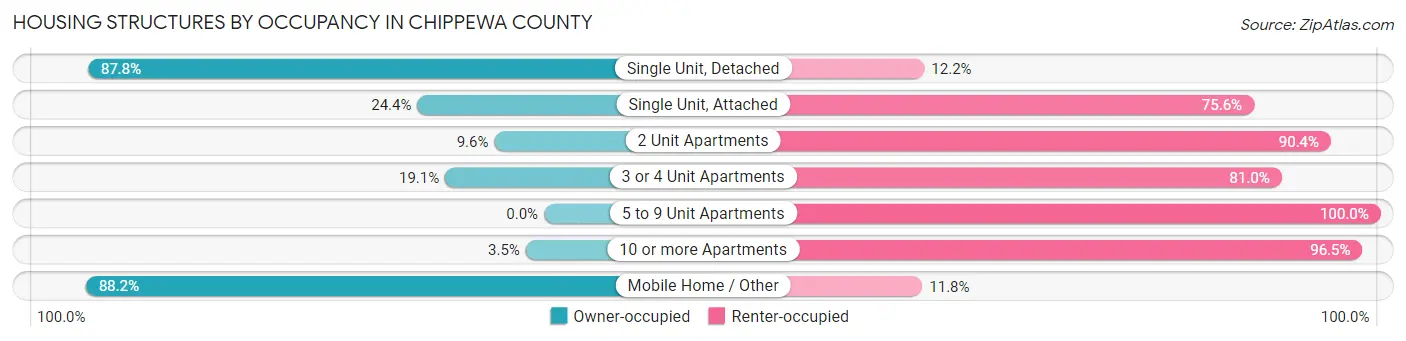
| Structure Type | Owner-occupied | Renter-occupied |
| Single Unit, Detached | 8,863 (87.8%) | 1,229 (12.2%) |
| Single Unit, Attached | 179 (24.4%) | 555 (75.6%) |
| 2 Unit Apartments | 36 (9.6%) | 340 (90.4%) |
| 3 or 4 Unit Apartments | 44 (19.1%) | 187 (80.9%) |
| 5 to 9 Unit Apartments | 0 (0.0%) | 120 (100.0%) |
| 10 or more Apartments | 39 (3.5%) | 1,068 (96.5%) |
| Mobile Home / Other | 959 (88.2%) | 128 (11.8%) |
| Total | 10,120 (73.6%) | 3,627 (26.4%) |
Housing Structures by Number of Rooms in Chippewa County

| Number of Rooms | Owner-occupied | Renter-occupied |
| 1 Room | 37 (0.4%) | 169 (4.7%) |
| 2 or 3 Rooms | 421 (4.2%) | 917 (25.3%) |
| 4 or 5 Rooms | 3,294 (32.6%) | 1,663 (45.9%) |
| 6 or 7 Rooms | 3,852 (38.1%) | 729 (20.1%) |
| 8 or more Rooms | 2,516 (24.9%) | 149 (4.1%) |
| Total | 10,120 (100.0%) | 3,627 (100.0%) |
Housing Structure by Heating Type in Chippewa County
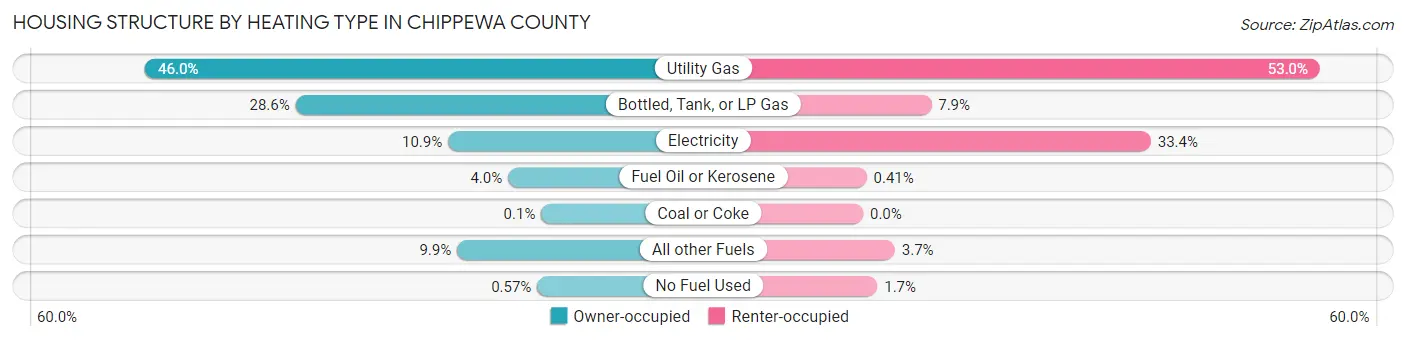
| Heating Type | Owner-occupied | Renter-occupied |
| Utility Gas | 4,657 (46.0%) | 1,921 (53.0%) |
| Bottled, Tank, or LP Gas | 2,893 (28.6%) | 287 (7.9%) |
| Electricity | 1,104 (10.9%) | 1,210 (33.4%) |
| Fuel Oil or Kerosene | 400 (4.0%) | 15 (0.4%) |
| Coal or Coke | 10 (0.1%) | 0 (0.0%) |
| All other Fuels | 998 (9.9%) | 134 (3.7%) |
| No Fuel Used | 58 (0.6%) | 60 (1.7%) |
| Total | 10,120 (100.0%) | 3,627 (100.0%) |
Household Vehicle Usage in Chippewa County

| Vehicles per Household | Owner-occupied | Renter-occupied |
| No Vehicle | 328 (3.2%) | 727 (20.0%) |
| 1 Vehicle | 3,100 (30.6%) | 1,884 (51.9%) |
| 2 Vehicles | 4,553 (45.0%) | 812 (22.4%) |
| 3 or more Vehicles | 2,139 (21.1%) | 204 (5.6%) |
| Total | 10,120 (100.0%) | 3,627 (100.0%) |
Real Estate & Mortgages in Chippewa County
Real Estate and Mortgage Overview in Chippewa County
| Characteristic | Without Mortgage | With Mortgage |
| Housing Units | 4,749 | 5,371 |
| Median Property Value | $137,100 | $144,300 |
| Median Household Income | $58,930 | $711 |
| Monthly Housing Costs | $437 | $55 |
| Real Estate Taxes | $1,741 | $411 |
Property Value by Mortgage Status in Chippewa County
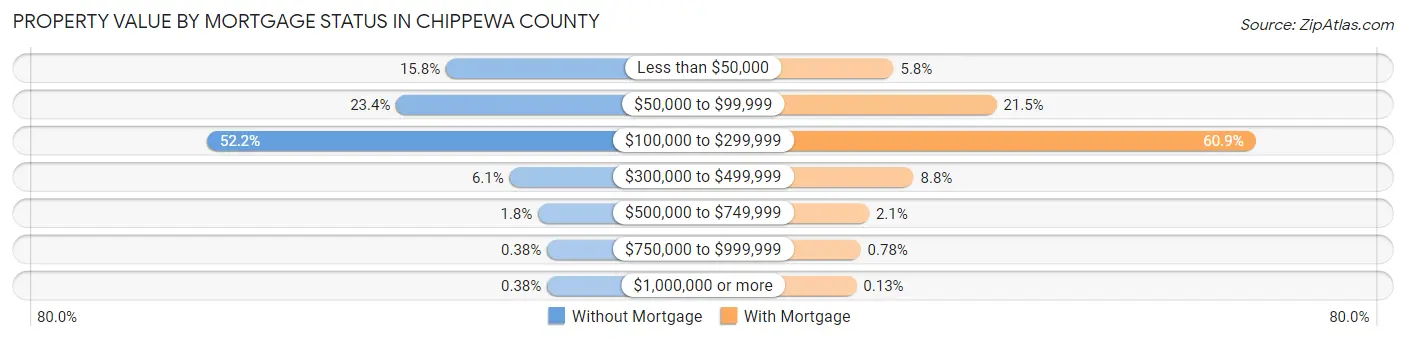
| Property Value | Without Mortgage | With Mortgage |
| Less than $50,000 | 750 (15.8%) | 311 (5.8%) |
| $50,000 to $99,999 | 1,110 (23.4%) | 1,153 (21.5%) |
| $100,000 to $299,999 | 2,480 (52.2%) | 3,273 (60.9%) |
| $300,000 to $499,999 | 290 (6.1%) | 475 (8.8%) |
| $500,000 to $749,999 | 83 (1.8%) | 110 (2.1%) |
| $750,000 to $999,999 | 18 (0.4%) | 42 (0.8%) |
| $1,000,000 or more | 18 (0.4%) | 7 (0.1%) |
| Total | 4,749 (100.0%) | 5,371 (100.0%) |
Household Income by Mortgage Status in Chippewa County
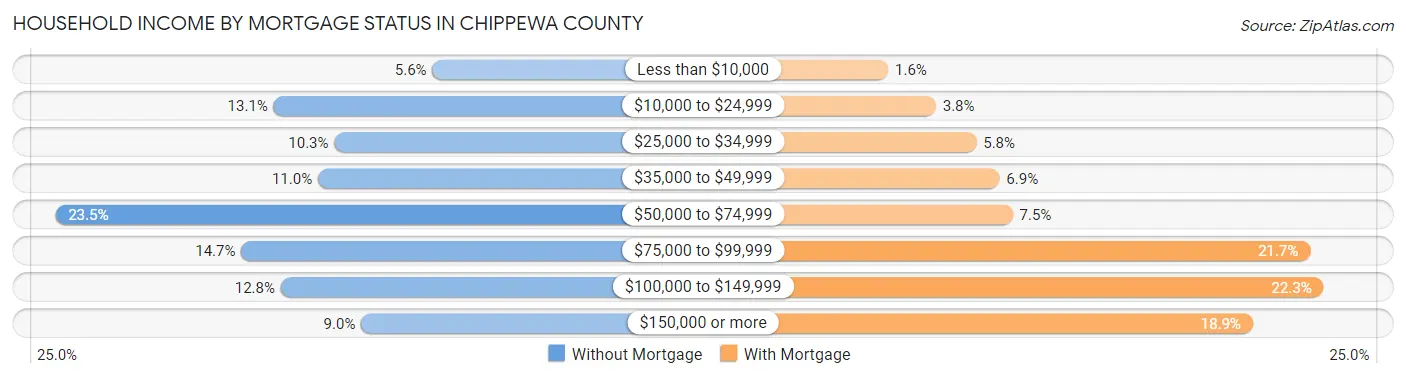
| Household Income | Without Mortgage | With Mortgage |
| Less than $10,000 | 265 (5.6%) | 83 (1.5%) |
| $10,000 to $24,999 | 624 (13.1%) | 205 (3.8%) |
| $25,000 to $34,999 | 487 (10.2%) | 309 (5.8%) |
| $35,000 to $49,999 | 524 (11.0%) | 368 (6.9%) |
| $50,000 to $74,999 | 1,118 (23.5%) | 402 (7.5%) |
| $75,000 to $99,999 | 697 (14.7%) | 1,163 (21.6%) |
| $100,000 to $149,999 | 608 (12.8%) | 1,197 (22.3%) |
| $150,000 or more | 426 (9.0%) | 1,016 (18.9%) |
| Total | 4,749 (100.0%) | 5,371 (100.0%) |
Property Value to Household Income Ratio in Chippewa County

| Value-to-Income Ratio | Without Mortgage | With Mortgage |
| Less than 2.0x | 2,077 (43.7%) | 79,258 (1,475.7%) |
| 2.0x to 2.9x | 934 (19.7%) | 2,993 (55.7%) |
| 3.0x to 3.9x | 551 (11.6%) | 1,100 (20.5%) |
| 4.0x or more | 1,129 (23.8%) | 377 (7.0%) |
| Total | 4,749 (100.0%) | 5,371 (100.0%) |
Real Estate Taxes by Mortgage Status in Chippewa County
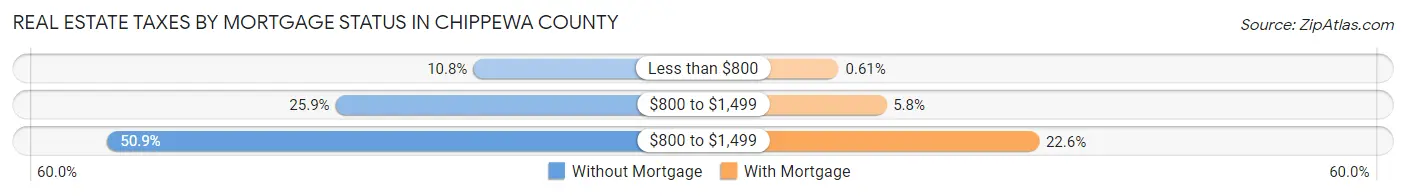
| Property Taxes | Without Mortgage | With Mortgage |
| Less than $800 | 515 (10.8%) | 33 (0.6%) |
| $800 to $1,499 | 1,232 (25.9%) | 313 (5.8%) |
| $800 to $1,499 | 2,418 (50.9%) | 1,212 (22.6%) |
| Total | 4,749 (100.0%) | 5,371 (100.0%) |
Health & Disability in Chippewa County
Health Insurance Coverage by Age in Chippewa County
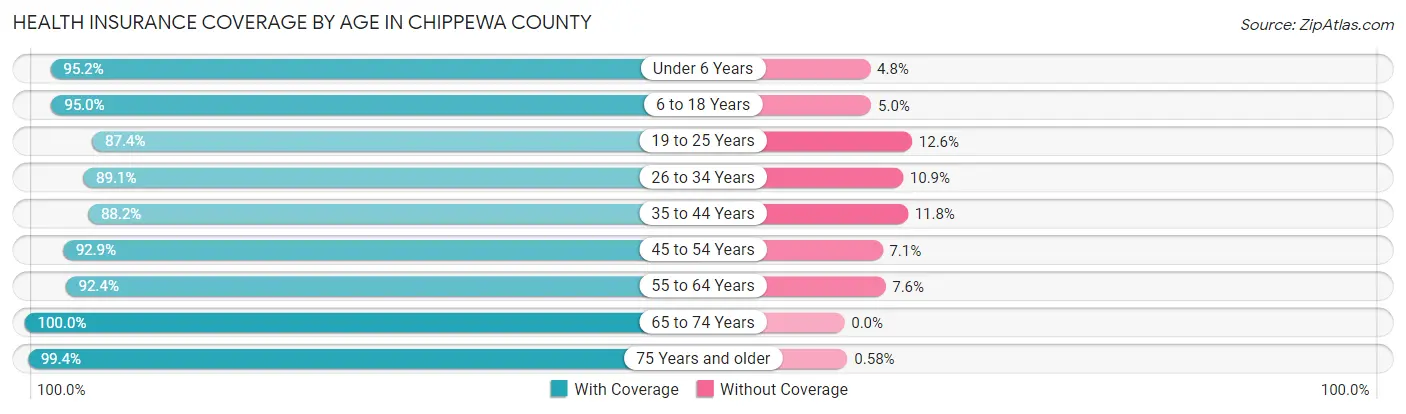
| Age Bracket | With Coverage | Without Coverage |
| Under 6 Years | 2,039 (95.2%) | 103 (4.8%) |
| 6 to 18 Years | 4,757 (95.0%) | 250 (5.0%) |
| 19 to 25 Years | 3,468 (87.4%) | 500 (12.6%) |
| 26 to 34 Years | 3,362 (89.1%) | 412 (10.9%) |
| 35 to 44 Years | 3,245 (88.2%) | 435 (11.8%) |
| 45 to 54 Years | 3,510 (92.9%) | 269 (7.1%) |
| 55 to 64 Years | 4,243 (92.4%) | 351 (7.6%) |
| 65 to 74 Years | 3,953 (100.0%) | 0 (0.0%) |
| 75 Years and older | 2,724 (99.4%) | 16 (0.6%) |
| Total | 31,301 (93.1%) | 2,336 (6.9%) |
Health Insurance Coverage by Citizenship Status in Chippewa County

| Citizenship Status | With Coverage | Without Coverage |
| Native Born | 2,039 (95.2%) | 103 (4.8%) |
| Foreign Born, Citizen | 4,757 (95.0%) | 250 (5.0%) |
| Foreign Born, not a Citizen | 3,468 (87.4%) | 500 (12.6%) |
Health Insurance Coverage by Household Income in Chippewa County
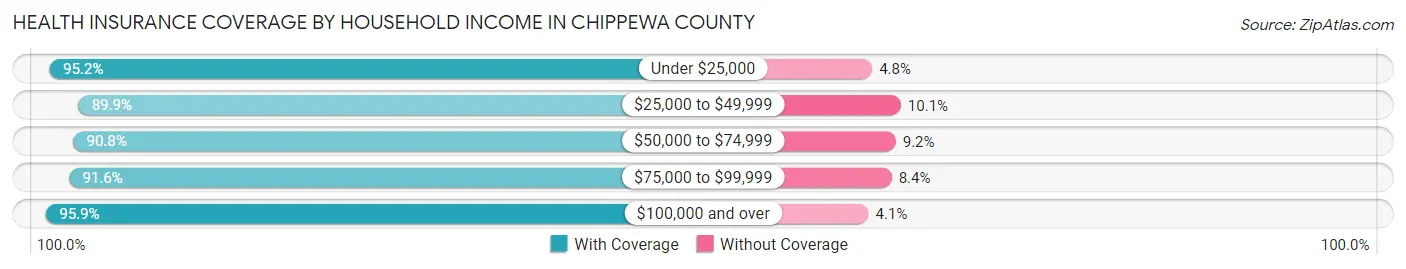
| Household Income | With Coverage | Without Coverage |
| Under $25,000 | 4,773 (95.2%) | 239 (4.8%) |
| $25,000 to $49,999 | 5,239 (89.9%) | 591 (10.1%) |
| $50,000 to $74,999 | 5,986 (90.8%) | 605 (9.2%) |
| $75,000 to $99,999 | 5,132 (91.6%) | 471 (8.4%) |
| $100,000 and over | 9,427 (95.9%) | 401 (4.1%) |
Public vs Private Health Insurance Coverage by Age in Chippewa County
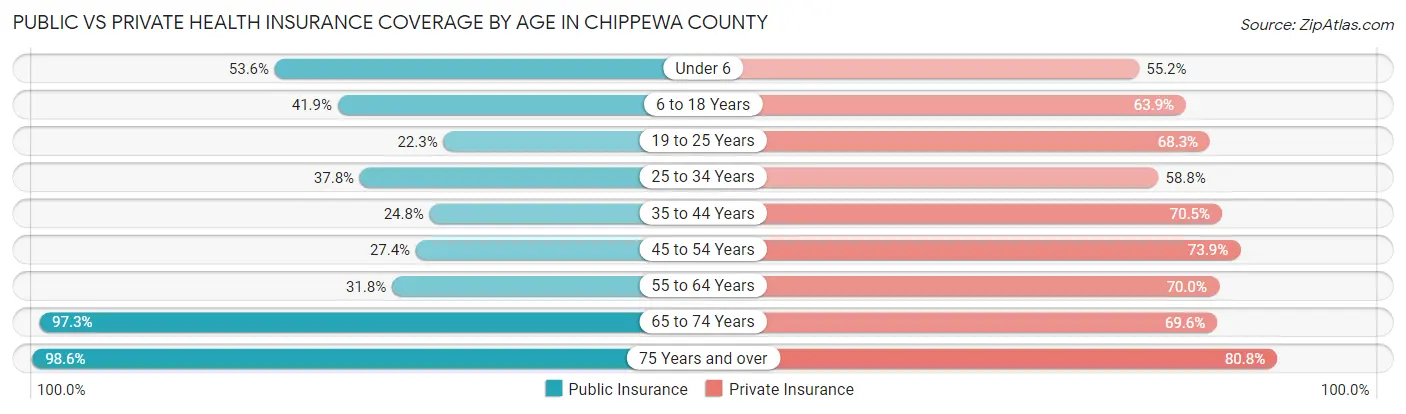
| Age Bracket | Public Insurance | Private Insurance |
| Under 6 | 1,147 (53.5%) | 1,183 (55.2%) |
| 6 to 18 Years | 2,096 (41.9%) | 3,198 (63.9%) |
| 19 to 25 Years | 883 (22.3%) | 2,711 (68.3%) |
| 25 to 34 Years | 1,425 (37.8%) | 2,219 (58.8%) |
| 35 to 44 Years | 913 (24.8%) | 2,596 (70.5%) |
| 45 to 54 Years | 1,034 (27.4%) | 2,794 (73.9%) |
| 55 to 64 Years | 1,461 (31.8%) | 3,214 (70.0%) |
| 65 to 74 Years | 3,846 (97.3%) | 2,753 (69.6%) |
| 75 Years and over | 2,701 (98.6%) | 2,213 (80.8%) |
| Total | 15,506 (46.1%) | 22,881 (68.0%) |
Disability Status by Sex by Age in Chippewa County
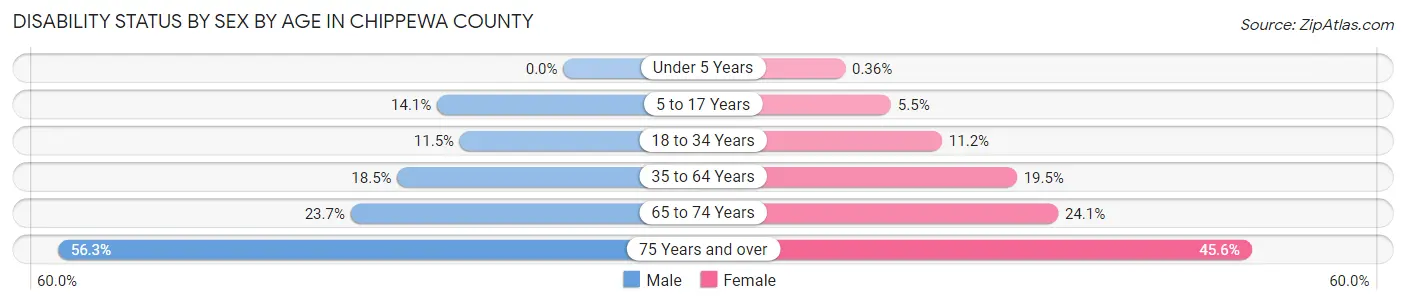
| Age Bracket | Male | Female |
| Under 5 Years | 0 (0.0%) | 3 (0.4%) |
| 5 to 17 Years | 360 (14.1%) | 127 (5.5%) |
| 18 to 34 Years | 488 (11.5%) | 456 (11.2%) |
| 35 to 64 Years | 1,147 (18.5%) | 1,139 (19.5%) |
| 65 to 74 Years | 467 (23.7%) | 477 (24.1%) |
| 75 Years and over | 675 (56.3%) | 703 (45.6%) |
Disability Class by Sex by Age in Chippewa County
Disability Class: Hearing Difficulty
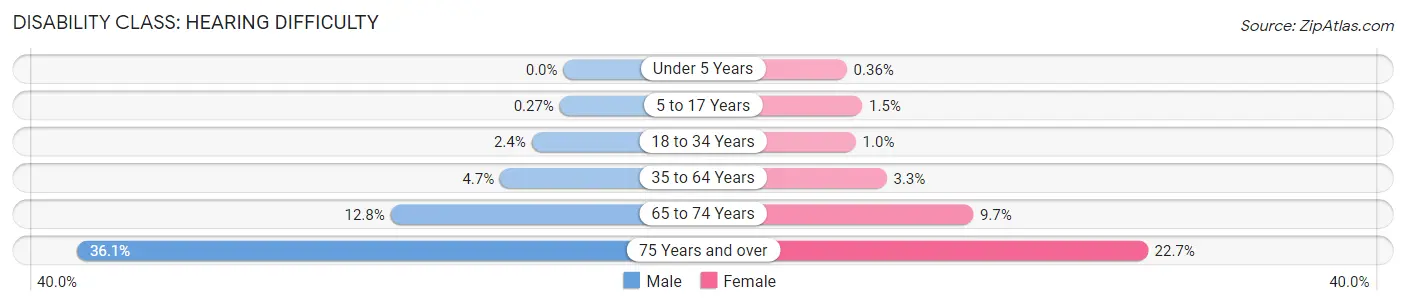
| Age Bracket | Male | Female |
| Under 5 Years | 0 (0.0%) | 3 (0.4%) |
| 5 to 17 Years | 7 (0.3%) | 35 (1.5%) |
| 18 to 34 Years | 100 (2.4%) | 42 (1.0%) |
| 35 to 64 Years | 292 (4.7%) | 194 (3.3%) |
| 65 to 74 Years | 253 (12.8%) | 193 (9.7%) |
| 75 Years and over | 433 (36.1%) | 350 (22.7%) |
Disability Class: Vision Difficulty
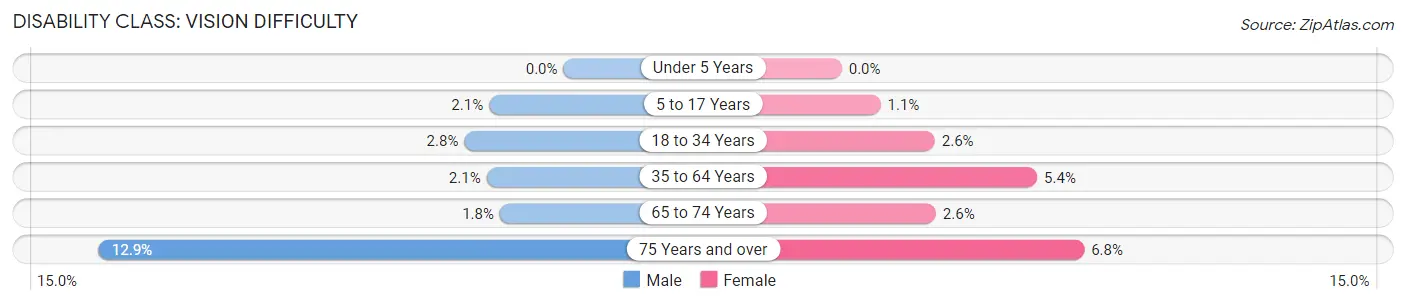
| Age Bracket | Male | Female |
| Under 5 Years | 0 (0.0%) | 0 (0.0%) |
| 5 to 17 Years | 53 (2.1%) | 25 (1.1%) |
| 18 to 34 Years | 117 (2.8%) | 106 (2.6%) |
| 35 to 64 Years | 133 (2.1%) | 318 (5.4%) |
| 65 to 74 Years | 35 (1.8%) | 52 (2.6%) |
| 75 Years and over | 155 (12.9%) | 104 (6.8%) |
Disability Class: Cognitive Difficulty
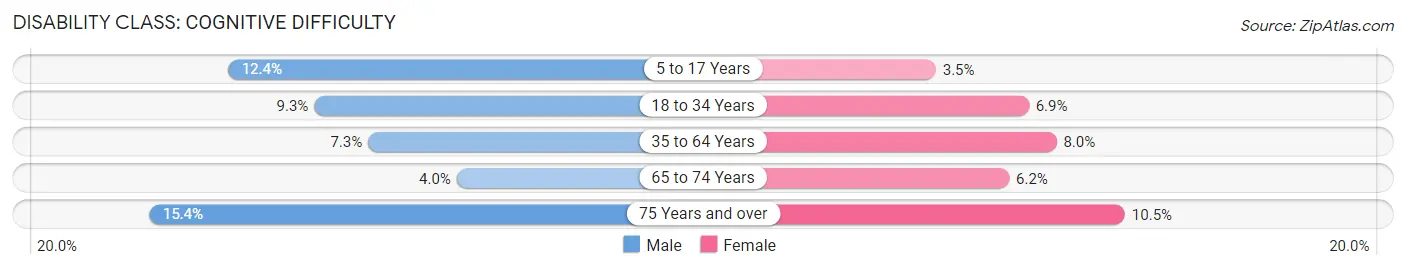
| Age Bracket | Male | Female |
| 5 to 17 Years | 318 (12.4%) | 81 (3.5%) |
| 18 to 34 Years | 392 (9.2%) | 284 (6.9%) |
| 35 to 64 Years | 450 (7.2%) | 466 (8.0%) |
| 65 to 74 Years | 78 (4.0%) | 123 (6.2%) |
| 75 Years and over | 184 (15.3%) | 162 (10.5%) |
Disability Class: Ambulatory Difficulty
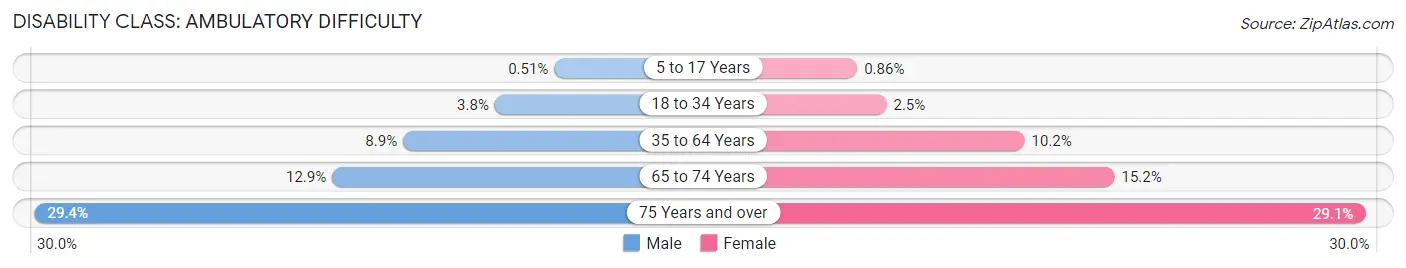
| Age Bracket | Male | Female |
| 5 to 17 Years | 13 (0.5%) | 20 (0.9%) |
| 18 to 34 Years | 162 (3.8%) | 102 (2.5%) |
| 35 to 64 Years | 554 (8.9%) | 595 (10.2%) |
| 65 to 74 Years | 254 (12.9%) | 301 (15.2%) |
| 75 Years and over | 353 (29.4%) | 449 (29.1%) |
Disability Class: Self-Care Difficulty
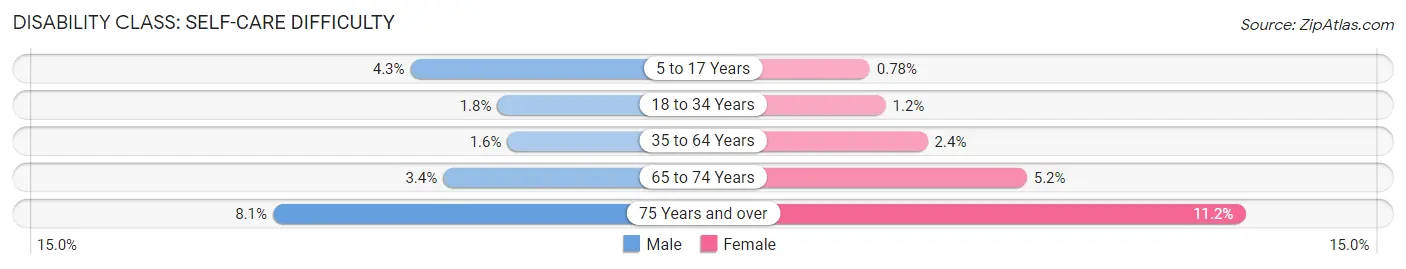
| Age Bracket | Male | Female |
| 5 to 17 Years | 109 (4.3%) | 18 (0.8%) |
| 18 to 34 Years | 78 (1.8%) | 50 (1.2%) |
| 35 to 64 Years | 97 (1.6%) | 140 (2.4%) |
| 65 to 74 Years | 66 (3.4%) | 102 (5.1%) |
| 75 Years and over | 97 (8.1%) | 173 (11.2%) |
Technology Access in Chippewa County
Computing Device Access in Chippewa County

| Device Type | # Households | % Households |
| Desktop or Laptop | 10,441 | 75.9% |
| Smartphone | 10,940 | 79.6% |
| Tablet | 8,030 | 58.4% |
| No Computing Device | 1,323 | 9.6% |
| Total | 13,747 | 100.0% |
Internet Access in Chippewa County
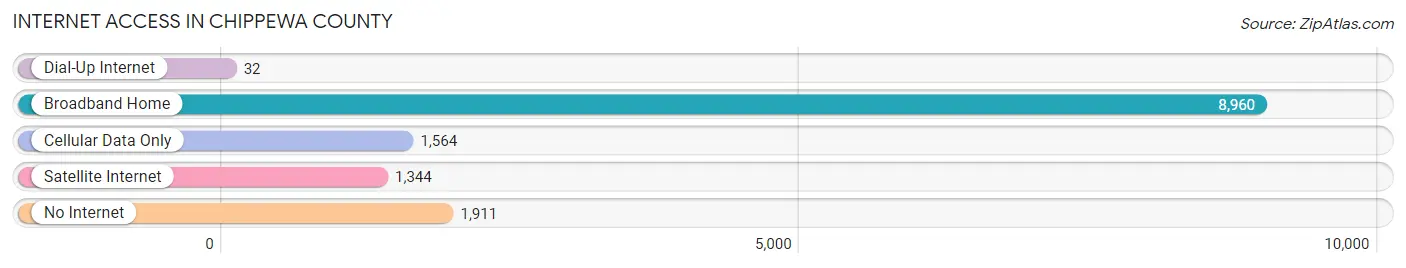
| Internet Type | # Households | % Households |
| Dial-Up Internet | 32 | 0.2% |
| Broadband Home | 8,960 | 65.2% |
| Cellular Data Only | 1,564 | 11.4% |
| Satellite Internet | 1,344 | 9.8% |
| No Internet | 1,911 | 13.9% |
| Total | 13,747 | 100.0% |
Chippewa County Summary
Chippewa County is located in the Upper Peninsula of Michigan, and is bordered by Mackinac, Luce, and Schoolcraft counties. It is the largest county in the Upper Peninsula, with a total area of 2,541 square miles. The county seat is Sault Ste. Marie, which is also the largest city in the county.
History
Chippewa County was established in 1826, and was named after the Chippewa Indians who lived in the area. The county was originally part of Mackinac County, but was split off in 1826. The county was originally home to several Native American tribes, including the Chippewa, Ottawa, and Potawatomi. The first European settlers arrived in the area in the late 1700s, and the county was officially organized in 1826.
The county was an important part of the lumber industry in the late 1800s and early 1900s. The county was home to several sawmills, and the lumber industry was a major source of employment for the county. The county also had a thriving agricultural industry, and was home to several farms.
Geography
Chippewa County is located in the Upper Peninsula of Michigan, and is bordered by Mackinac, Luce, and Schoolcraft counties. The county has a total area of 2,541 square miles, and is the largest county in the Upper Peninsula. The county is mostly rural, with the majority of the land being used for farming and forestry. The county is home to several lakes, including Lake Superior, Lake Michigan, and Lake Huron.
The county is home to several state parks, including Tahquamenon Falls State Park, which is the largest state park in the Upper Peninsula. The county is also home to several national forests, including the Hiawatha National Forest and the Ottawa National Forest.
Economy
The economy of Chippewa County is largely based on agriculture and forestry. The county is home to several farms, and the agricultural industry is a major source of employment for the county. The county is also home to several sawmills, and the lumber industry is a major source of employment for the county.
The county is also home to several manufacturing companies, including a paper mill and a steel mill. The county is also home to several tourist attractions, including the Soo Locks and the Tahquamenon Falls State Park.
Demographics
As of the 2010 census, the population of Chippewa County was 38,520. The population is mostly white (94.3%), with small percentages of Native American (2.2%), African American (1.2%), and Asian (0.5%) populations. The median household income in the county is $41,945, and the median age is 44.7 years. The county has a poverty rate of 16.2%, and the unemployment rate is 8.2%.
Common Questions
What is the Total Population of Chippewa County?
Total Population of Chippewa County is 36,670.
What is the Total Male Population of Chippewa County?
Total Male Population of Chippewa County is 19,879.
What is the Total Female Population of Chippewa County?
Total Female Population of Chippewa County is 16,791.
What is the Ratio of Males per 100 Females in Chippewa County?
There are 118.39 Males per 100 Females in Chippewa County.
What is the Ratio of Females per 100 Males in Chippewa County?
There are 84.47 Females per 100 Males in Chippewa County.
What is the Median Population Age in Chippewa County?
Median Population Age in Chippewa County is 40.8 Years.
What is the Average Family Size in Chippewa County
Average Family Size in Chippewa County is 3.0 People.
What is the Average Household Size in Chippewa County
Average Household Size in Chippewa County is 2.4 People.
What is Per Capita Income in Chippewa County?
Per Capita income in Chippewa County is $31,167.
What is the Median Family Income in Chippewa County?
Median Family Income in Chippewa County is $76,273.
What is the Median Household income in Chippewa County?
Median Household Income in Chippewa County is $58,408.
What is Income or Wage Gap in Chippewa County?
Income or Wage Gap in Chippewa County is 12.3%.
Women in Chippewa County earn 87.7 cents for every dollar earned by a man.
What is Family Income Deficit in Chippewa County?
Family Income Deficit in Chippewa County is $13,211.
Families that are below poverty line in Chippewa County earn $13,211 less on average than the poverty threshold level.
What is Inequality or Gini Index in Chippewa County?
Inequality or Gini Index in Chippewa County is 0.48.
How Large is the Labor Force in Chippewa County?
There are 17,129 People in the Labor Forcein in Chippewa County.
What is the Percentage of People in the Labor Force in Chippewa County?
55.5% of People are in the Labor Force in Chippewa County.
What is the Unemployment Rate in Chippewa County?
Unemployment Rate in Chippewa County is 7.7%.