Calhoun County, MI
Calhoun County Map
Calhoun County Overview
134,011
TOTAL POPULATION
66,230
MALE POPULATION
67,781
FEMALE POPULATION
97.71
MALES / 100 FEMALES
102.34
FEMALES / 100 MALES
40.0
MEDIAN AGE
3.1
AVG FAMILY SIZE
2.5
AVG HOUSEHOLD SIZE
$32,047
PER CAPITA INCOME
$74,187
AVG FAMILY INCOME
$58,191
AVG HOUSEHOLD INCOME
24.0%
WAGE / INCOME GAP [ % ]
76.0¢/ $1
WAGE / INCOME GAP [ $ ]
$10,219
FAMILY INCOME DEFICIT
0.44
INEQUALITY / GINI INDEX
64,009
LABOR FORCE [ PEOPLE ]
59.7%
PERCENT IN LABOR FORCE
6.8%
UNEMPLOYMENT RATE
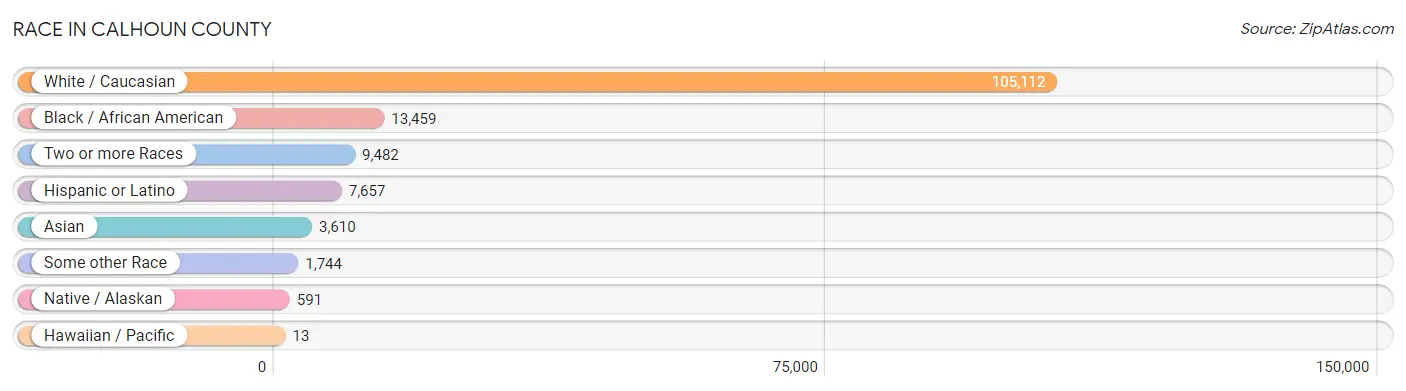
Race in Calhoun County
The most populous races in Calhoun County are White / Caucasian (105,112 | 78.4%), Black / African American (13,459 | 10.0%), and Two or more Races (9,482 | 7.1%).
| Race | # Population | % Population |
| Asian | 3,610 | 2.7% |
| Black / African American | 13,459 | 10.0% |
| Hawaiian / Pacific | 13 | 0.0% |
| Hispanic or Latino | 7,657 | 5.7% |
| Native / Alaskan | 591 | 0.4% |
| White / Caucasian | 105,112 | 78.4% |
| Two or more Races | 9,482 | 7.1% |
| Some other Race | 1,744 | 1.3% |
| Total | 134,011 | 100.0% |
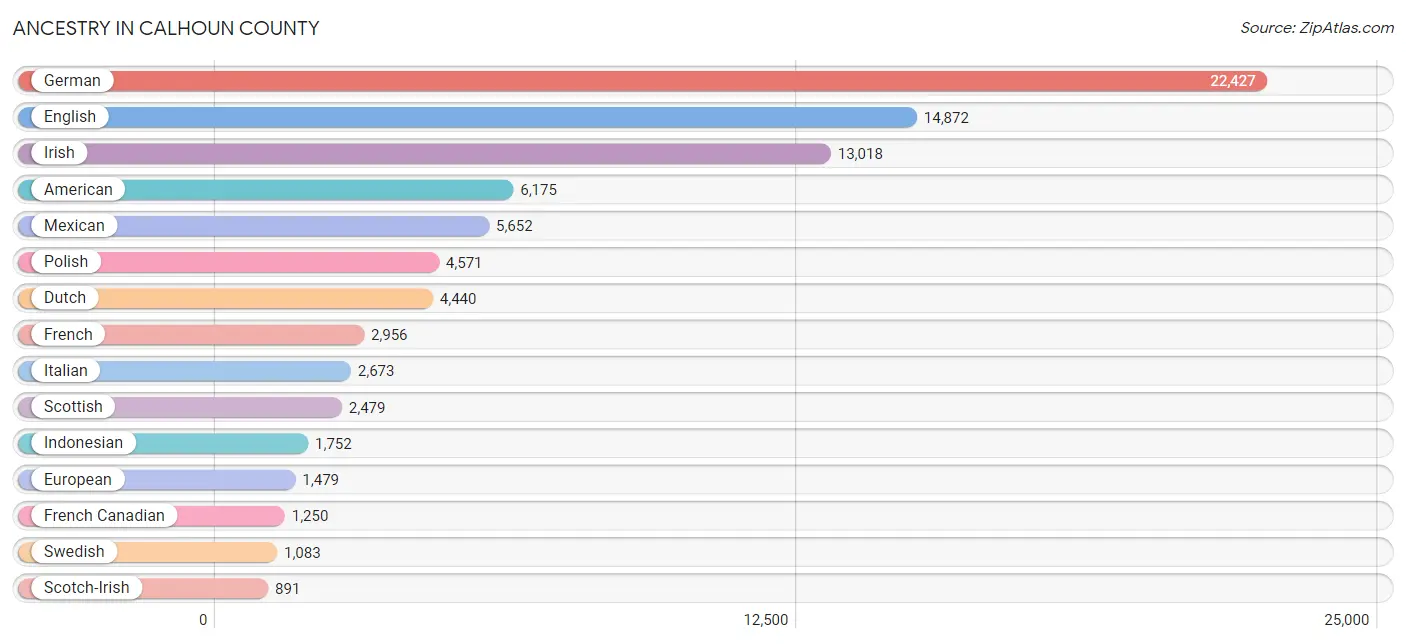
Ancestry in Calhoun County
The most populous ancestries reported in Calhoun County are German (22,427 | 16.7%), English (14,872 | 11.1%), Irish (13,018 | 9.7%), American (6,175 | 4.6%), and Mexican (5,652 | 4.2%), together accounting for 46.4% of all Calhoun County residents.
| Ancestry | # Population | % Population |
| African | 109 | 0.1% |
| Alaskan Athabascan | 4 | 0.0% |
| Aleut | 5 | 0.0% |
| American | 6,175 | 4.6% |
| Apache | 40 | 0.0% |
| Arab | 340 | 0.3% |
| Armenian | 18 | 0.0% |
| Australian | 8 | 0.0% |
| Austrian | 98 | 0.1% |
| Belgian | 286 | 0.2% |
| Bhutanese | 252 | 0.2% |
| Blackfeet | 123 | 0.1% |
| Brazilian | 9 | 0.0% |
| British | 530 | 0.4% |
| Bulgarian | 4 | 0.0% |
| Burmese | 470 | 0.4% |
| Cajun | 12 | 0.0% |
| Canadian | 260 | 0.2% |
| Cape Verdean | 1 | 0.0% |
| Celtic | 16 | 0.0% |
| Central American | 168 | 0.1% |
| Central American Indian | 17 | 0.0% |
| Cherokee | 722 | 0.5% |
| Chilean | 22 | 0.0% |
| Chippewa | 181 | 0.1% |
| Choctaw | 21 | 0.0% |
| Colombian | 214 | 0.2% |
| Colville | 38 | 0.0% |
| Comanche | 34 | 0.0% |
| Costa Rican | 65 | 0.1% |
| Creek | 40 | 0.0% |
| Croatian | 186 | 0.1% |
| Cuban | 83 | 0.1% |
| Czech | 183 | 0.1% |
| Czechoslovakian | 99 | 0.1% |
| Danish | 306 | 0.2% |
| Delaware | 24 | 0.0% |
| Dominican | 256 | 0.2% |
| Dutch | 4,440 | 3.3% |
| Dutch West Indian | 13 | 0.0% |
| Eastern European | 211 | 0.2% |
| Ecuadorian | 33 | 0.0% |
| Egyptian | 74 | 0.1% |
| English | 14,872 | 11.1% |
| Estonian | 50 | 0.0% |
| Ethiopian | 24 | 0.0% |
| European | 1,479 | 1.1% |
| Fijian | 8 | 0.0% |
| Finnish | 695 | 0.5% |
| French | 2,956 | 2.2% |
| French American Indian | 12 | 0.0% |
| French Canadian | 1,250 | 0.9% |
| German | 22,427 | 16.7% |
| Greek | 235 | 0.2% |
| Guatemalan | 77 | 0.1% |
| Haitian | 7 | 0.0% |
| Hmong | 48 | 0.0% |
| Hungarian | 668 | 0.5% |
| Icelander | 23 | 0.0% |
| Indian (Asian) | 162 | 0.1% |
| Indonesian | 1,752 | 1.3% |
| Inupiat | 10 | 0.0% |
| Iraqi | 17 | 0.0% |
| Irish | 13,018 | 9.7% |
| Italian | 2,673 | 2.0% |
| Jamaican | 21 | 0.0% |
| Japanese | 7 | 0.0% |
| Kenyan | 394 | 0.3% |
| Kiowa | 3 | 0.0% |
| Korean | 574 | 0.4% |
| Laotian | 172 | 0.1% |
| Latvian | 9 | 0.0% |
| Lebanese | 16 | 0.0% |
| Lithuanian | 300 | 0.2% |
| Lumbee | 53 | 0.0% |
| Macedonian | 195 | 0.2% |
| Malaysian | 5 | 0.0% |
| Maltese | 22 | 0.0% |
| Mexican | 5,652 | 4.2% |
| Mexican American Indian | 170 | 0.1% |
| Native Hawaiian | 16 | 0.0% |
| Navajo | 50 | 0.0% |
| Nigerian | 19 | 0.0% |
| Northern European | 93 | 0.1% |
| Norwegian | 664 | 0.5% |
| Ottawa | 31 | 0.0% |
| Pakistani | 18 | 0.0% |
| Palestinian | 9 | 0.0% |
| Panamanian | 1 | 0.0% |
| Paraguayan | 38 | 0.0% |
| Pennsylvania German | 107 | 0.1% |
| Polish | 4,571 | 3.4% |
| Portuguese | 195 | 0.2% |
| Potawatomi | 176 | 0.1% |
| Puerto Rican | 566 | 0.4% |
| Romanian | 44 | 0.0% |
| Russian | 410 | 0.3% |
| Salvadoran | 25 | 0.0% |
| Scandinavian | 230 | 0.2% |
| Scotch-Irish | 891 | 0.7% |
| Scottish | 2,479 | 1.8% |
| Serbian | 68 | 0.1% |
| Sioux | 26 | 0.0% |
| Slavic | 11 | 0.0% |
| Slovak | 124 | 0.1% |
| Slovene | 20 | 0.0% |
| South African | 13 | 0.0% |
| South American | 322 | 0.2% |
| South American Indian | 22 | 0.0% |
| Spaniard | 295 | 0.2% |
| Spanish | 39 | 0.0% |
| Sri Lankan | 237 | 0.2% |
| Subsaharan African | 676 | 0.5% |
| Swedish | 1,083 | 0.8% |
| Swiss | 367 | 0.3% |
| Syrian | 10 | 0.0% |
| Thai | 573 | 0.4% |
| Tohono O'Odham | 10 | 0.0% |
| Turkish | 3 | 0.0% |
| Ukrainian | 159 | 0.1% |
| Uruguayan | 5 | 0.0% |
| Venezuelan | 10 | 0.0% |
| Vietnamese | 121 | 0.1% |
| Welsh | 566 | 0.4% |
| Yugoslavian | 105 | 0.1% | View All 125 Rows |
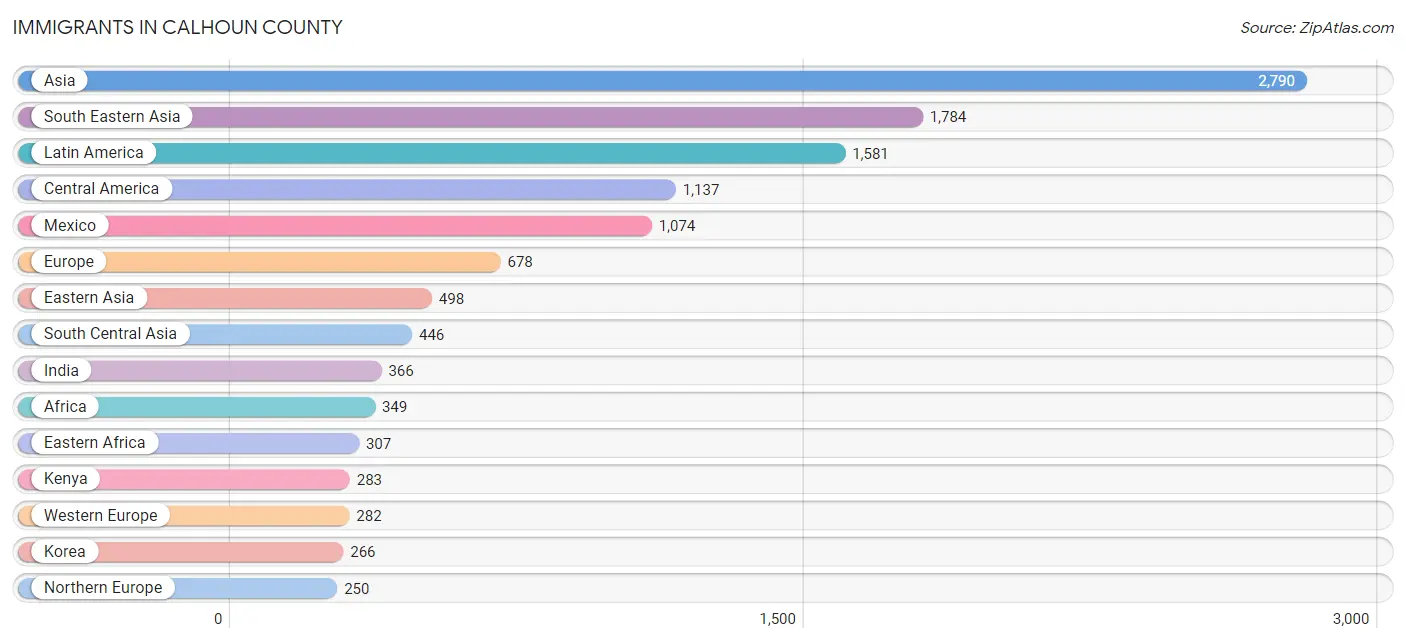
Immigrants in Calhoun County
The most numerous immigrant groups reported in Calhoun County came from Asia (2,790 | 2.1%), South Eastern Asia (1,784 | 1.3%), Latin America (1,581 | 1.2%), Central America (1,137 | 0.9%), and Mexico (1,074 | 0.8%), together accounting for 6.2% of all Calhoun County residents.
| Immigration Origin | # Population | % Population |
| Africa | 349 | 0.3% |
| Asia | 2,790 | 2.1% |
| Bangladesh | 61 | 0.1% |
| Belgium | 33 | 0.0% |
| Brazil | 43 | 0.0% |
| Cameroon | 10 | 0.0% |
| Canada | 122 | 0.1% |
| Caribbean | 212 | 0.2% |
| Central America | 1,137 | 0.9% |
| Chile | 22 | 0.0% |
| China | 119 | 0.1% |
| Colombia | 119 | 0.1% |
| Congo | 4 | 0.0% |
| Cuba | 60 | 0.0% |
| Dominican Republic | 93 | 0.1% |
| Eastern Africa | 307 | 0.2% |
| Eastern Asia | 498 | 0.4% |
| Eastern Europe | 96 | 0.1% |
| Ecuador | 33 | 0.0% |
| Egypt | 13 | 0.0% |
| El Salvador | 44 | 0.0% |
| England | 34 | 0.0% |
| Ethiopia | 24 | 0.0% |
| Europe | 678 | 0.5% |
| Germany | 235 | 0.2% |
| Greece | 14 | 0.0% |
| Guatemala | 16 | 0.0% |
| Haiti | 38 | 0.0% |
| Hungary | 8 | 0.0% |
| India | 366 | 0.3% |
| Indonesia | 28 | 0.0% |
| Iraq | 9 | 0.0% |
| Ireland | 19 | 0.0% |
| Italy | 36 | 0.0% |
| Jamaica | 21 | 0.0% |
| Japan | 113 | 0.1% |
| Kenya | 283 | 0.2% |
| Korea | 266 | 0.2% |
| Latin America | 1,581 | 1.2% |
| Latvia | 14 | 0.0% |
| Malaysia | 183 | 0.1% |
| Mexico | 1,074 | 0.8% |
| Middle Africa | 14 | 0.0% |
| Morocco | 10 | 0.0% |
| Netherlands | 14 | 0.0% |
| Nigeria | 1 | 0.0% |
| North Macedonia | 21 | 0.0% |
| Northern Africa | 23 | 0.0% |
| Northern Europe | 250 | 0.2% |
| Oceania | 8 | 0.0% |
| Pakistan | 5 | 0.0% |
| Panama | 3 | 0.0% |
| Philippines | 220 | 0.2% |
| Poland | 2 | 0.0% |
| Romania | 3 | 0.0% |
| Russia | 32 | 0.0% |
| South America | 232 | 0.2% |
| South Central Asia | 446 | 0.3% |
| South Eastern Asia | 1,784 | 1.3% |
| Southern Europe | 50 | 0.0% |
| Sweden | 174 | 0.1% |
| Thailand | 9 | 0.0% |
| Uruguay | 5 | 0.0% |
| Uzbekistan | 14 | 0.0% |
| Venezuela | 10 | 0.0% |
| Vietnam | 83 | 0.1% |
| Western Africa | 5 | 0.0% |
| Western Asia | 62 | 0.1% |
| Western Europe | 282 | 0.2% |
| Yemen | 53 | 0.0% | View All 70 Rows |
Sex and Age in Calhoun County
Sex and Age in Calhoun County
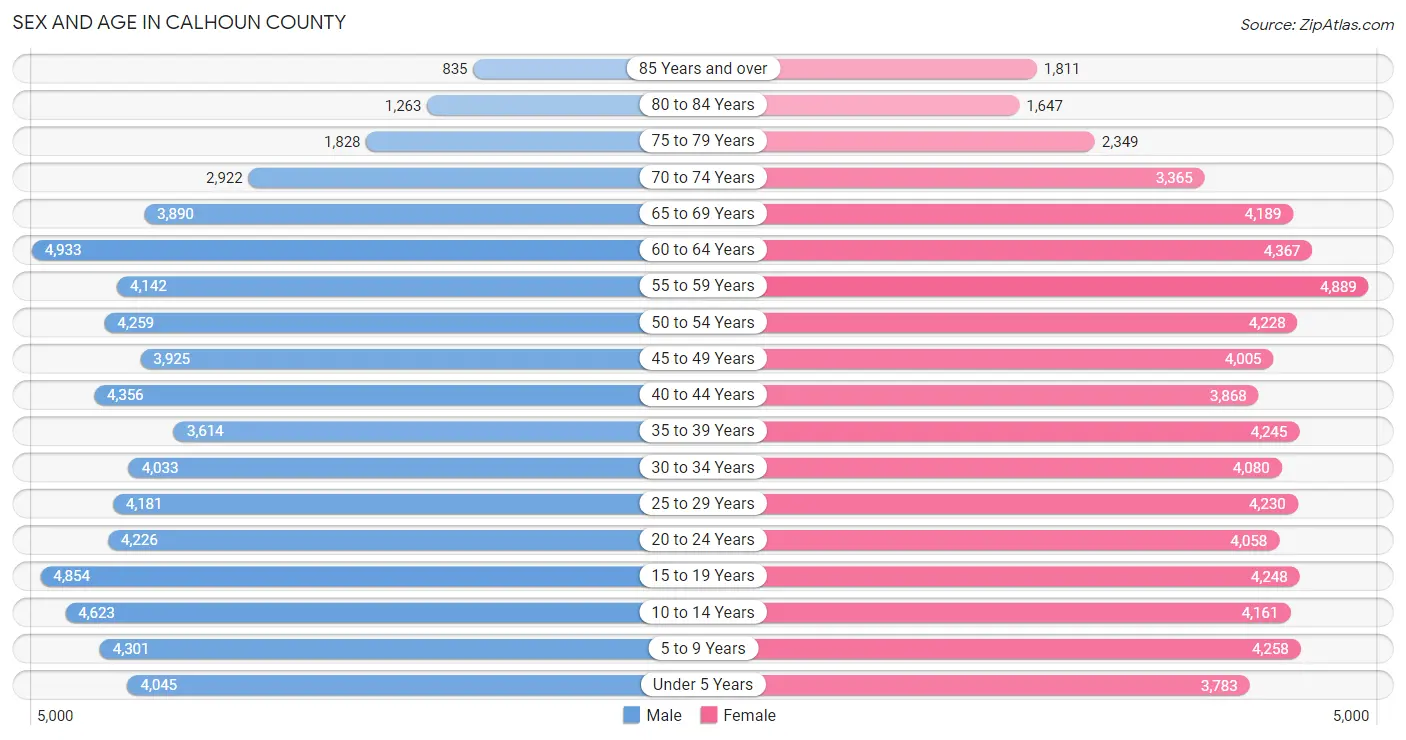
The most populous age groups in Calhoun County are 60 to 64 Years (4,933 | 7.4%) for men and 55 to 59 Years (4,889 | 7.2%) for women.
| Age Bracket | Male | Female |
| Under 5 Years | 4,045 (6.1%) | 3,783 (5.6%) |
| 5 to 9 Years | 4,301 (6.5%) | 4,258 (6.3%) |
| 10 to 14 Years | 4,623 (7.0%) | 4,161 (6.1%) |
| 15 to 19 Years | 4,854 (7.3%) | 4,248 (6.3%) |
| 20 to 24 Years | 4,226 (6.4%) | 4,058 (6.0%) |
| 25 to 29 Years | 4,181 (6.3%) | 4,230 (6.2%) |
| 30 to 34 Years | 4,033 (6.1%) | 4,080 (6.0%) |
| 35 to 39 Years | 3,614 (5.5%) | 4,245 (6.3%) |
| 40 to 44 Years | 4,356 (6.6%) | 3,868 (5.7%) |
| 45 to 49 Years | 3,925 (5.9%) | 4,005 (5.9%) |
| 50 to 54 Years | 4,259 (6.4%) | 4,228 (6.2%) |
| 55 to 59 Years | 4,142 (6.2%) | 4,889 (7.2%) |
| 60 to 64 Years | 4,933 (7.4%) | 4,367 (6.4%) |
| 65 to 69 Years | 3,890 (5.9%) | 4,189 (6.2%) |
| 70 to 74 Years | 2,922 (4.4%) | 3,365 (5.0%) |
| 75 to 79 Years | 1,828 (2.8%) | 2,349 (3.5%) |
| 80 to 84 Years | 1,263 (1.9%) | 1,647 (2.4%) |
| 85 Years and over | 835 (1.3%) | 1,811 (2.7%) |
| Total | 66,230 (100.0%) | 67,781 (100.0%) |
Families and Households in Calhoun County
Median Family Size in Calhoun County
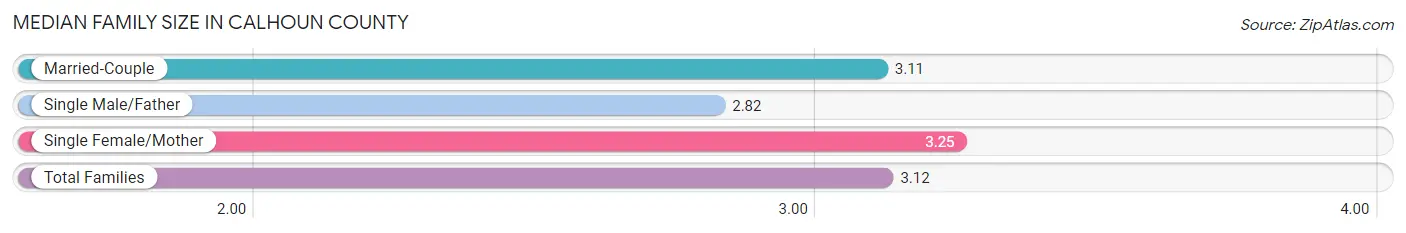
The median family size in Calhoun County is 3.12 persons per family, with single female/mother families (7,495 | 23.0%) accounting for the largest median family size of 3.25 persons per family. On the other hand, single male/father families (2,810 | 8.6%) represent the smallest median family size with 2.82 persons per family.
| Family Type | # Families | Family Size |
| Married-Couple | 22,337 (68.4%) | 3.11 |
| Single Male/Father | 2,810 (8.6%) | 2.82 |
| Single Female/Mother | 7,495 (23.0%) | 3.25 |
| Total Families | 32,642 (100.0%) | 3.12 |
Median Household Size in Calhoun County
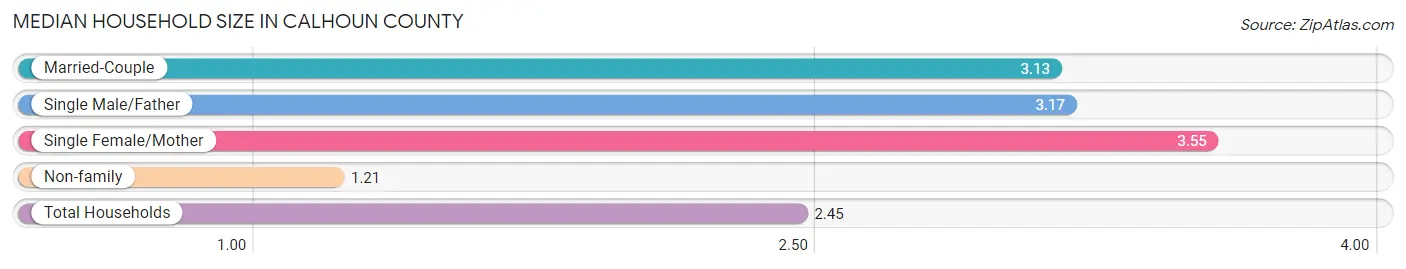
The median household size in Calhoun County is 2.45 persons per household, with single female/mother households (7,495 | 14.1%) accounting for the largest median household size of 3.55 persons per household. non-family households (20,408 | 38.5%) represent the smallest median household size with 1.21 persons per household.
| Household Type | # Households | Household Size |
| Married-Couple | 22,337 (42.1%) | 3.13 |
| Single Male/Father | 2,810 (5.3%) | 3.17 |
| Single Female/Mother | 7,495 (14.1%) | 3.55 |
| Non-family | 20,408 (38.5%) | 1.21 |
| Total Households | 53,050 (100.0%) | 2.45 |
Household Size by Marriage Status in Calhoun County
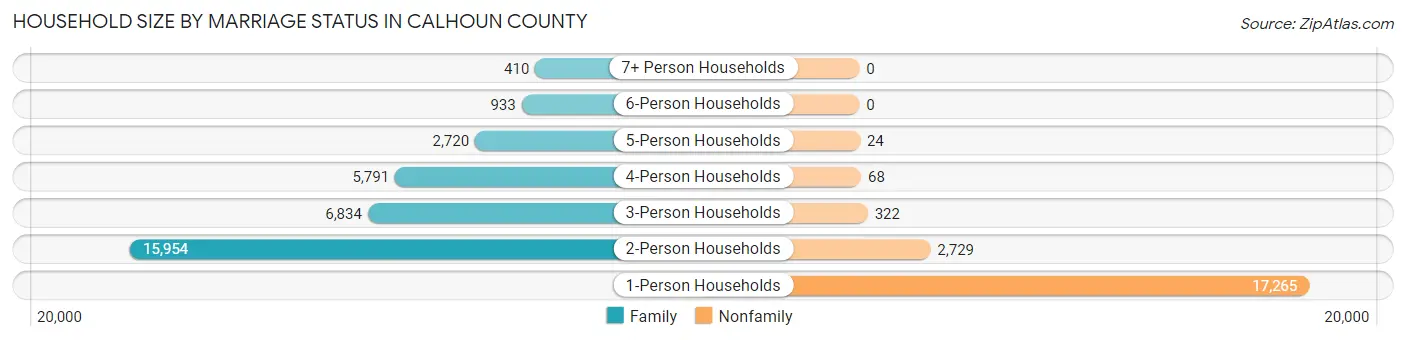
Out of a total of 53,050 households in Calhoun County, 32,642 (61.5%) are family households, while 20,408 (38.5%) are nonfamily households. The most numerous type of family households are 2-person households, comprising 15,954, and the most common type of nonfamily households are 1-person households, comprising 17,265.
| Household Size | Family Households | Nonfamily Households |
| 1-Person Households | - | 17,265 (32.5%) |
| 2-Person Households | 15,954 (30.1%) | 2,729 (5.1%) |
| 3-Person Households | 6,834 (12.9%) | 322 (0.6%) |
| 4-Person Households | 5,791 (10.9%) | 68 (0.1%) |
| 5-Person Households | 2,720 (5.1%) | 24 (0.1%) |
| 6-Person Households | 933 (1.8%) | 0 (0.0%) |
| 7+ Person Households | 410 (0.8%) | 0 (0.0%) |
| Total | 32,642 (61.5%) | 20,408 (38.5%) |
Female Fertility in Calhoun County
Fertility by Age in Calhoun County
Average fertility rate in Calhoun County is 48.0 births per 1,000 women. Women in the age bracket of 20 to 34 years have the highest fertility rate with 89.0 births per 1,000 women. Women in the age bracket of 20 to 34 years acount for 77.7% of all women with births.
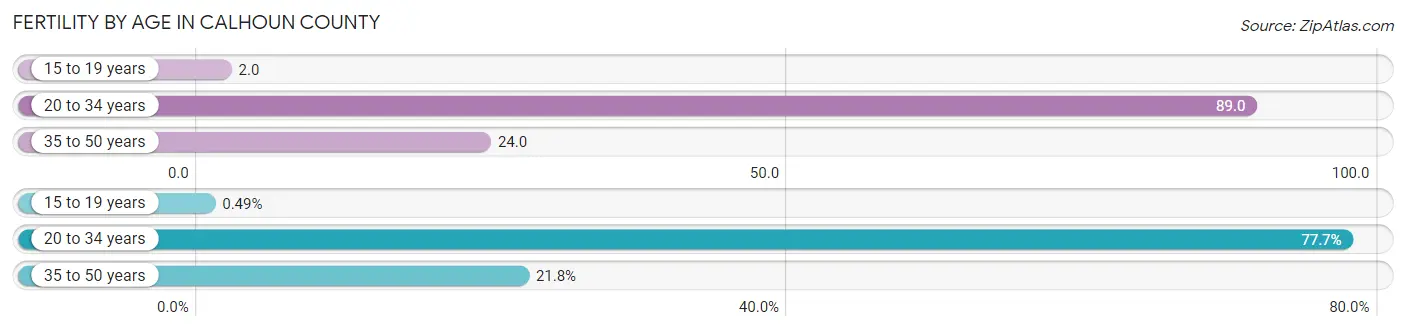
| Age Bracket | Women with Births | Births / 1,000 Women |
| 15 to 19 years | 7 (0.5%) | 2.0 |
| 20 to 34 years | 1,103 (77.7%) | 89.0 |
| 35 to 50 years | 309 (21.8%) | 24.0 |
| Total | 1,419 (100.0%) | 48.0 |
Fertility by Age by Marriage Status in Calhoun County
70.3% of women with births (1,419) in Calhoun County are married. The highest percentage of unmarried women with births falls into 15 to 19 years age bracket with 100.0% of them unmarried at the time of birth, while the lowest percentage of unmarried women with births belong to 35 to 50 years age bracket with 9.1% of them unmarried.
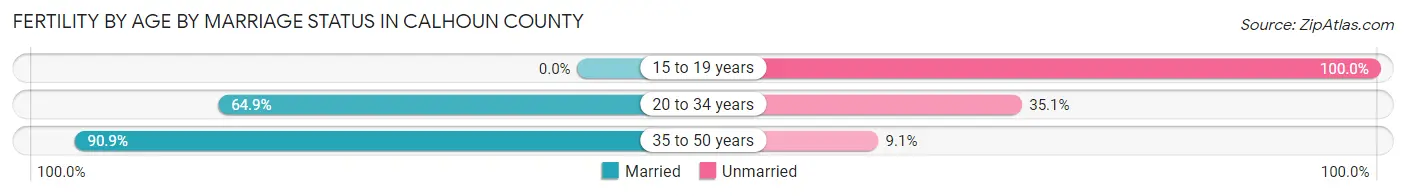
| Age Bracket | Married | Unmarried |
| 15 to 19 years | 0 (0.0%) | 7 (100.0%) |
| 20 to 34 years | 716 (64.9%) | 387 (35.1%) |
| 35 to 50 years | 281 (90.9%) | 28 (9.1%) |
| Total | 998 (70.3%) | 421 (29.7%) |
Fertility by Education in Calhoun County
Average fertility rate in Calhoun County is 48.0 births per 1,000 women. Women with the education attainment of graduate degree have the highest fertility rate of 67.0 births per 1,000 women, while women with the education attainment of less than high school have the lowest fertility at 36.0 births per 1,000 women. Women with the education attainment of high school diploma represent 35.2% of all women with births.
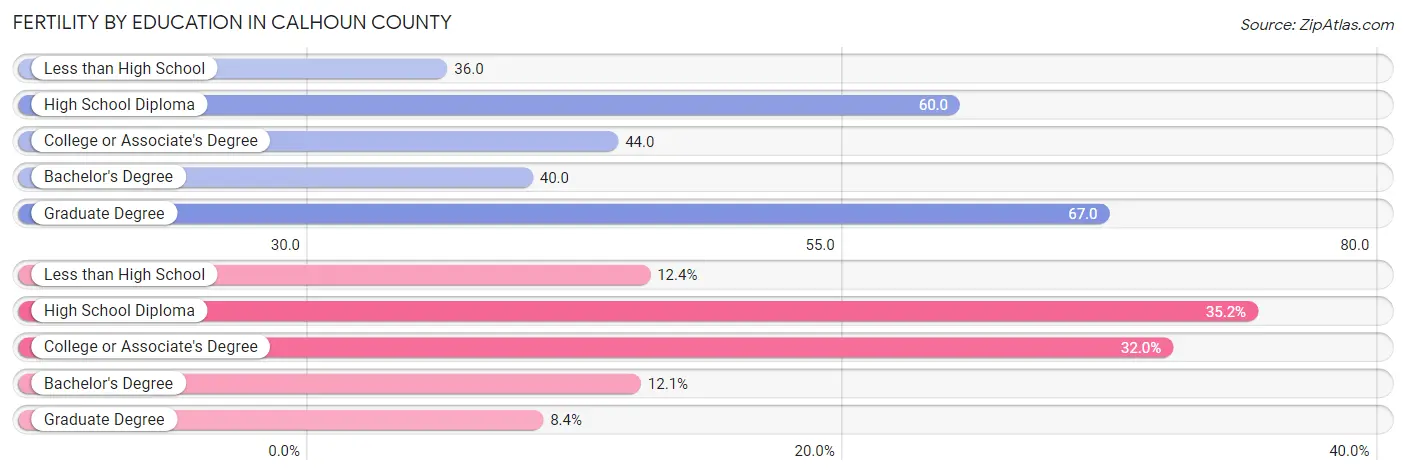
| Educational Attainment | Women with Births | Births / 1,000 Women |
| Less than High School | 176 (12.4%) | 36.0 |
| High School Diploma | 499 (35.2%) | 60.0 |
| College or Associate's Degree | 454 (32.0%) | 44.0 |
| Bachelor's Degree | 171 (12.0%) | 40.0 |
| Graduate Degree | 119 (8.4%) | 67.0 |
| Total | 1,419 (100.0%) | 48.0 |
Fertility by Education by Marriage Status in Calhoun County
29.7% of women with births in Calhoun County are unmarried. Women with the educational attainment of graduate degree are most likely to be married with 100.0% of them married at childbirth, while women with the educational attainment of less than high school are least likely to be married with 46.6% of them unmarried at childbirth.
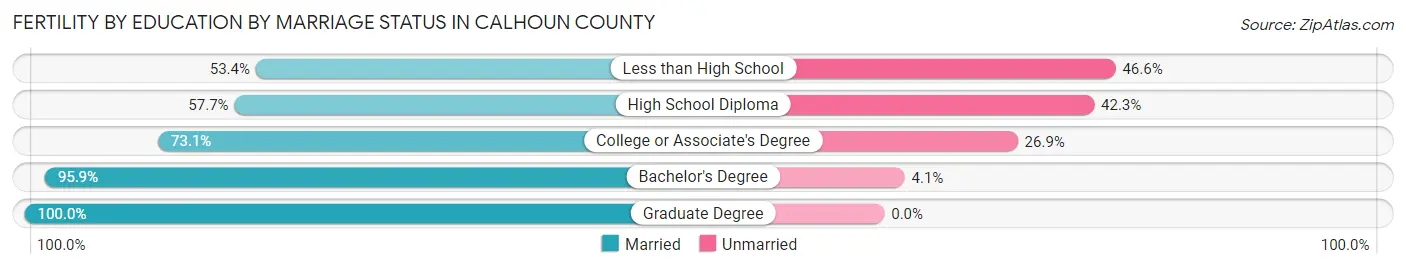
| Educational Attainment | Married | Unmarried |
| Less than High School | 94 (53.4%) | 82 (46.6%) |
| High School Diploma | 288 (57.7%) | 211 (42.3%) |
| College or Associate's Degree | 332 (73.1%) | 122 (26.9%) |
| Bachelor's Degree | 164 (95.9%) | 7 (4.1%) |
| Graduate Degree | 119 (100.0%) | 0 (0.0%) |
| Total | 998 (70.3%) | 421 (29.7%) |
Income in Calhoun County
Income Overview in Calhoun County
Per Capita Income in Calhoun County is $32,047, while median incomes of families and households are $74,187 and $58,191 respectively.
| Characteristic | Number | Measure |
| Per Capita Income | 134,011 | $32,047 |
| Median Family Income | 32,642 | $74,187 |
| Mean Family Income | 32,642 | $93,385 |
| Median Household Income | 53,050 | $58,191 |
| Mean Household Income | 53,050 | $77,674 |
| Income Deficit | 32,642 | $10,219 |
| Wage / Income Gap (%) | 134,011 | 24.00% |
| Wage / Income Gap ($) | 134,011 | 76.00¢ per $1 |
| Gini / Inequality Index | 134,011 | 0.44 |
Earnings by Sex in Calhoun County
Average Earnings in Calhoun County are $36,554, $41,974 for men and $31,901 for women, a difference of 24.0%.
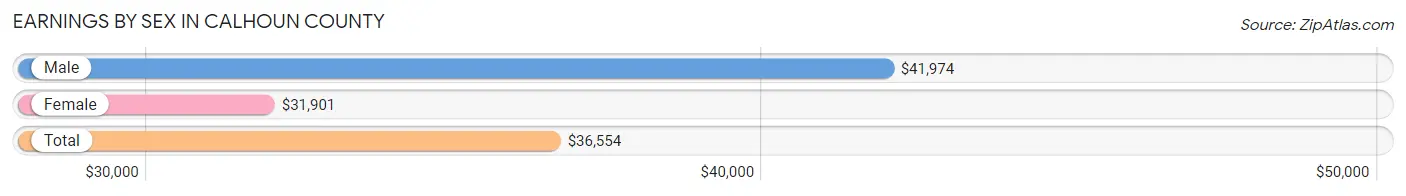
| Sex | Number | Average Earnings |
| Male | 34,623 (51.5%) | $41,974 |
| Female | 32,595 (48.5%) | $31,901 |
| Total | 67,218 (100.0%) | $36,554 |
Earnings by Sex by Income Bracket in Calhoun County
The most common earnings brackets in Calhoun County are $100,000+ for men (3,911 | 11.3%) and $25,000 to $29,999 for women (2,347 | 7.2%).
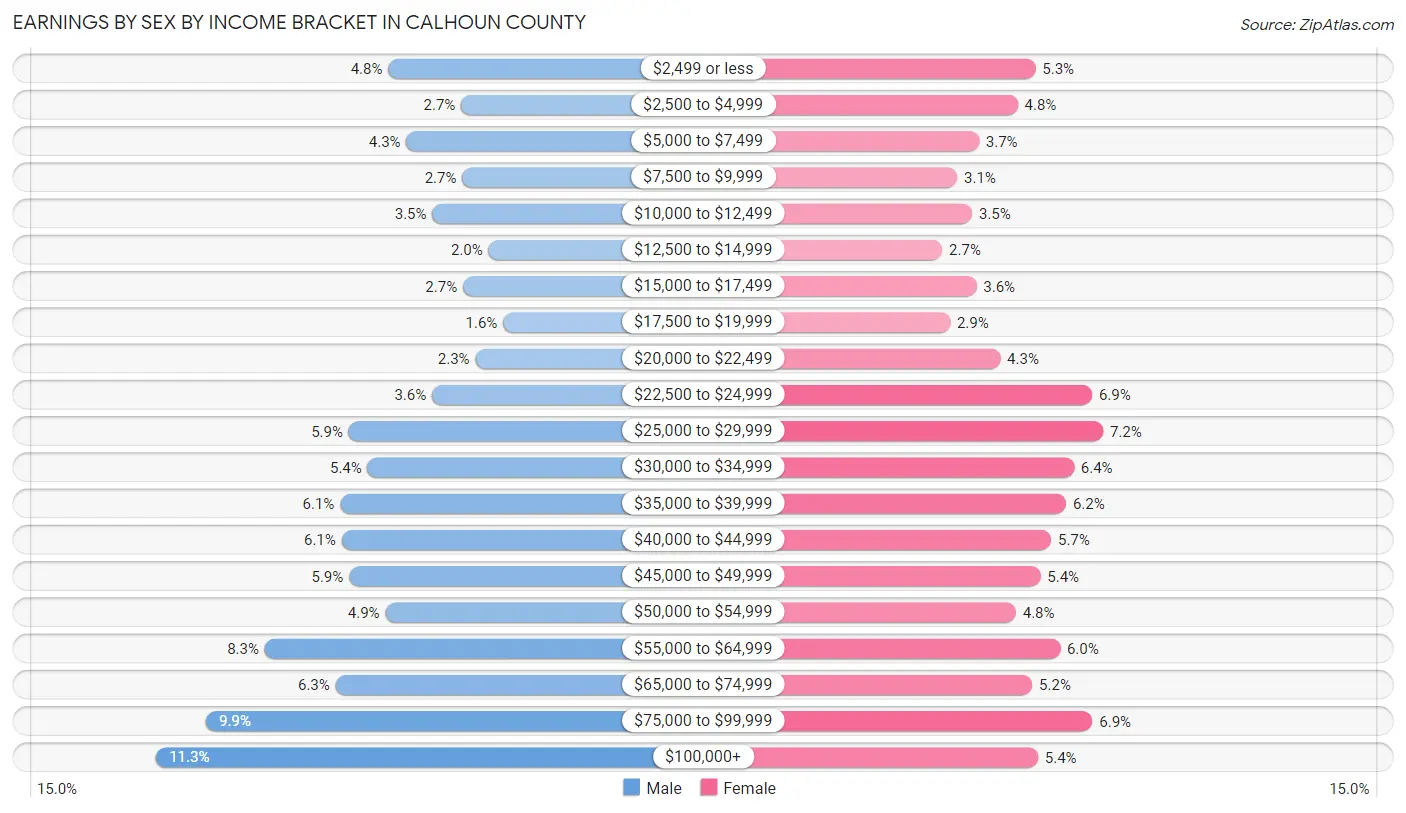
| Income | Male | Female |
| $2,499 or less | 1,656 (4.8%) | 1,729 (5.3%) |
| $2,500 to $4,999 | 944 (2.7%) | 1,566 (4.8%) |
| $5,000 to $7,499 | 1,479 (4.3%) | 1,209 (3.7%) |
| $7,500 to $9,999 | 934 (2.7%) | 1,011 (3.1%) |
| $10,000 to $12,499 | 1,226 (3.5%) | 1,146 (3.5%) |
| $12,500 to $14,999 | 680 (2.0%) | 873 (2.7%) |
| $15,000 to $17,499 | 929 (2.7%) | 1,187 (3.6%) |
| $17,500 to $19,999 | 538 (1.5%) | 946 (2.9%) |
| $20,000 to $22,499 | 807 (2.3%) | 1,405 (4.3%) |
| $22,500 to $24,999 | 1,229 (3.5%) | 2,245 (6.9%) |
| $25,000 to $29,999 | 2,038 (5.9%) | 2,347 (7.2%) |
| $30,000 to $34,999 | 1,855 (5.4%) | 2,080 (6.4%) |
| $35,000 to $39,999 | 2,123 (6.1%) | 2,008 (6.2%) |
| $40,000 to $44,999 | 2,108 (6.1%) | 1,870 (5.7%) |
| $45,000 to $49,999 | 2,037 (5.9%) | 1,773 (5.4%) |
| $50,000 to $54,999 | 1,681 (4.9%) | 1,549 (4.8%) |
| $55,000 to $64,999 | 2,855 (8.3%) | 1,953 (6.0%) |
| $65,000 to $74,999 | 2,167 (6.3%) | 1,699 (5.2%) |
| $75,000 to $99,999 | 3,426 (9.9%) | 2,248 (6.9%) |
| $100,000+ | 3,911 (11.3%) | 1,751 (5.4%) |
| Total | 34,623 (100.0%) | 32,595 (100.0%) |
Earnings by Sex by Educational Attainment in Calhoun County
Average earnings in Calhoun County are $46,927 for men and $36,328 for women, a difference of 22.6%. Men with an educational attainment of graduate degree enjoy the highest average annual earnings of $90,250, while those with less than high school education earn the least with $34,155. Women with an educational attainment of graduate degree earn the most with the average annual earnings of $75,205, while those with less than high school education have the smallest earnings of $22,599.
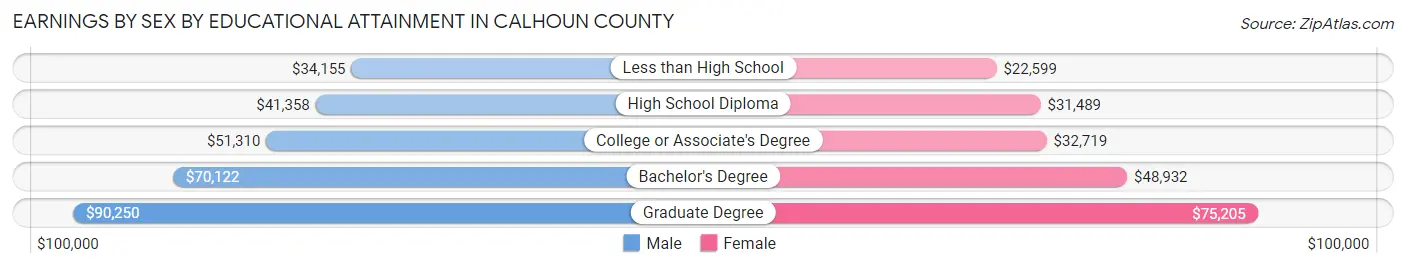
| Educational Attainment | Male Income | Female Income |
| Less than High School | $34,155 | $22,599 |
| High School Diploma | $41,358 | $31,489 |
| College or Associate's Degree | $51,310 | $32,719 |
| Bachelor's Degree | $70,122 | $48,932 |
| Graduate Degree | $90,250 | $75,205 |
| Total | $46,927 | $36,328 |
Family Income in Calhoun County
Family Income Brackets in Calhoun County
According to the Calhoun County family income data, there are 6,300 families falling into the $50,000 to $74,999 income range, which is the most common income bracket and makes up 19.3% of all families. Conversely, the $10,000 to $14,999 income bracket is the least frequent group with only 881 families (2.7%) belonging to this category.
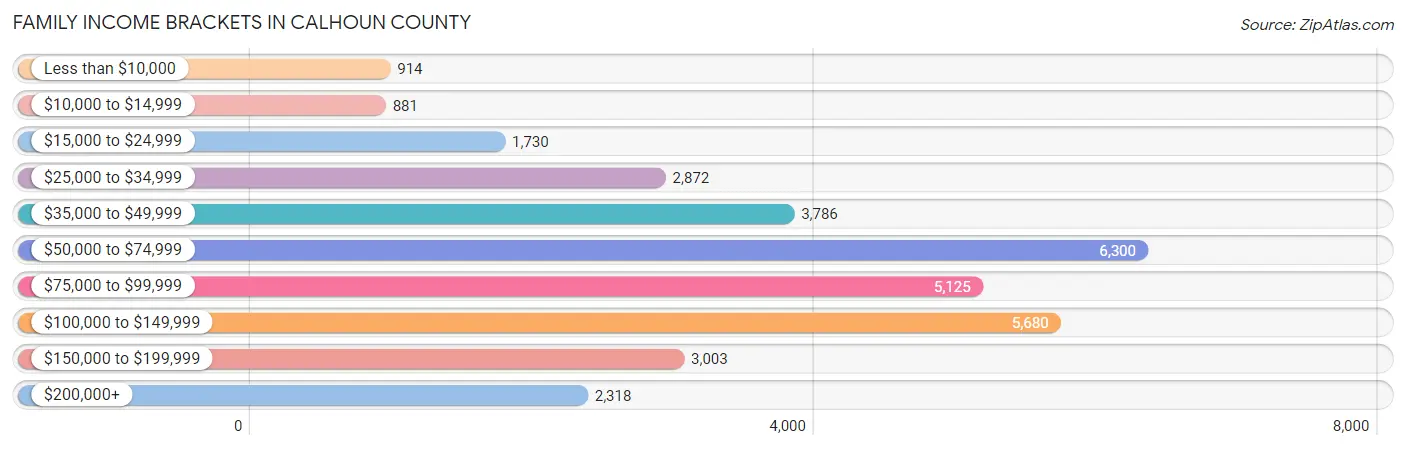
| Income Bracket | # Families | % Families |
| Less than $10,000 | 914 | 2.8% |
| $10,000 to $14,999 | 881 | 2.7% |
| $15,000 to $24,999 | 1,730 | 5.3% |
| $25,000 to $34,999 | 2,872 | 8.8% |
| $35,000 to $49,999 | 3,786 | 11.6% |
| $50,000 to $74,999 | 6,300 | 19.3% |
| $75,000 to $99,999 | 5,125 | 15.7% |
| $100,000 to $149,999 | 5,680 | 17.4% |
| $150,000 to $199,999 | 3,003 | 9.2% |
| $200,000+ | 2,318 | 7.1% |
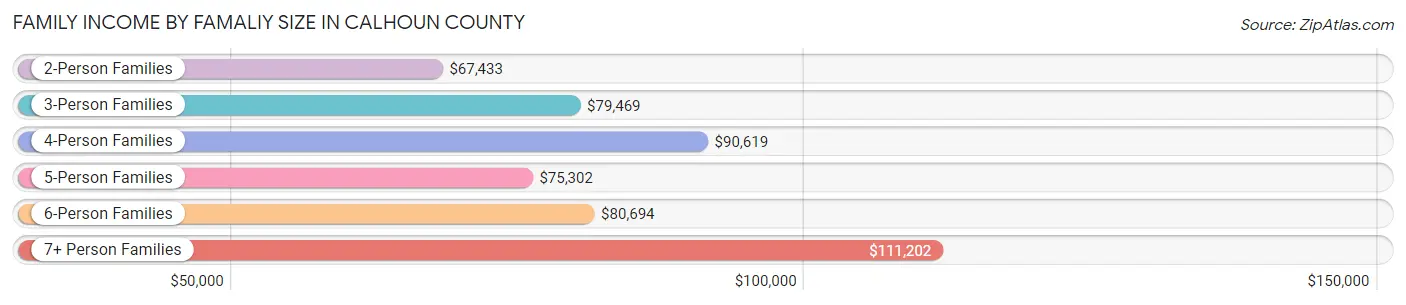
Family Income by Famaliy Size in Calhoun County
7+ person families (338 | 1.0%) account for the highest median family income in Calhoun County with $111,202 per family, while 2-person families (17,095 | 52.4%) have the highest median income of $33,716 per family member.
| Income Bracket | # Families | Median Income |
| 2-Person Families | 17,095 (52.4%) | $67,433 |
| 3-Person Families | 6,691 (20.5%) | $79,469 |
| 4-Person Families | 5,384 (16.5%) | $90,619 |
| 5-Person Families | 2,489 (7.6%) | $75,302 |
| 6-Person Families | 645 (2.0%) | $80,694 |
| 7+ Person Families | 338 (1.0%) | $111,202 |
| Total | 32,642 (100.0%) | $74,187 |
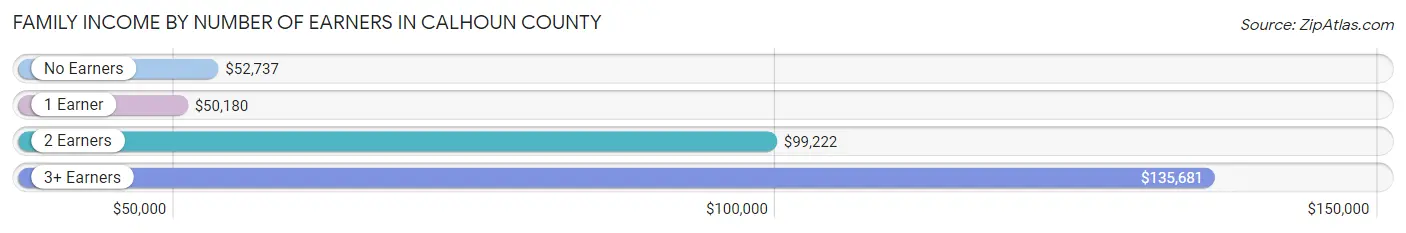
Family Income by Number of Earners in Calhoun County
The median family income in Calhoun County is $74,187, with families comprising 3+ earners (3,291) having the highest median family income of $135,681, while families with 1 earner (11,047) have the lowest median family income of $50,180, accounting for 10.1% and 33.8% of families, respectively.
| Number of Earners | # Families | Median Income |
| No Earners | 6,516 (20.0%) | $52,737 |
| 1 Earner | 11,047 (33.8%) | $50,180 |
| 2 Earners | 11,788 (36.1%) | $99,222 |
| 3+ Earners | 3,291 (10.1%) | $135,681 |
| Total | 32,642 (100.0%) | $74,187 |
Household Income in Calhoun County
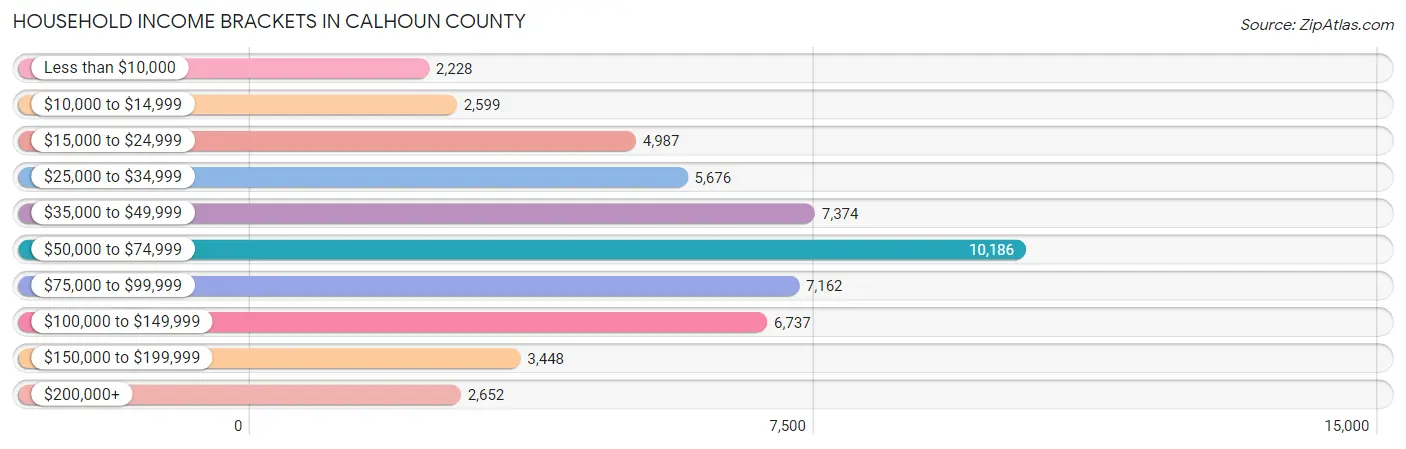
Household Income Brackets in Calhoun County
With 10,186 households falling in the category, the $50,000 to $74,999 income range is the most frequent in Calhoun County, accounting for 19.2% of all households. In contrast, only 2,228 households (4.2%) fall into the less than $10,000 income bracket, making it the least populous group.
| Income Bracket | # Households | % Households |
| Less than $10,000 | 2,228 | 4.2% |
| $10,000 to $14,999 | 2,599 | 4.9% |
| $15,000 to $24,999 | 4,987 | 9.4% |
| $25,000 to $34,999 | 5,676 | 10.7% |
| $35,000 to $49,999 | 7,374 | 13.9% |
| $50,000 to $74,999 | 10,186 | 19.2% |
| $75,000 to $99,999 | 7,162 | 13.5% |
| $100,000 to $149,999 | 6,737 | 12.7% |
| $150,000 to $199,999 | 3,448 | 6.5% |
| $200,000+ | 2,652 | 5.0% |
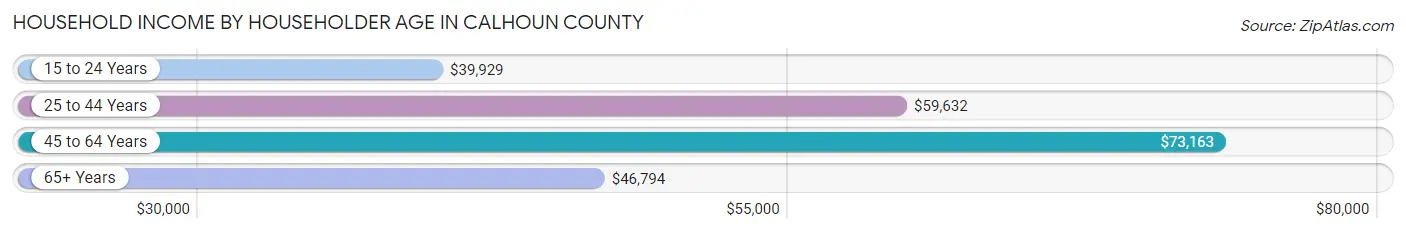
Household Income by Householder Age in Calhoun County
The median household income in Calhoun County is $58,191, with the highest median household income of $73,163 found in the 45 to 64 years age bracket for the primary householder. A total of 20,044 households (37.8%) fall into this category. Meanwhile, the 15 to 24 years age bracket for the primary householder has the lowest median household income of $39,929, with 1,668 households (3.1%) in this group.
| Income Bracket | # Households | Median Income |
| 15 to 24 Years | 1,668 (3.1%) | $39,929 |
| 25 to 44 Years | 16,119 (30.4%) | $59,632 |
| 45 to 64 Years | 20,044 (37.8%) | $73,163 |
| 65+ Years | 15,219 (28.7%) | $46,794 |
| Total | 53,050 (100.0%) | $58,191 |
Poverty in Calhoun County
Income Below Poverty by Sex and Age in Calhoun County
With 14.3% poverty level for males and 15.3% for females among the residents of Calhoun County, under 5 year old males and under 5 year old females are the most vulnerable to poverty, with 1,141 males (28.6%) and 1,091 females (29.4%) in their respective age groups living below the poverty level.
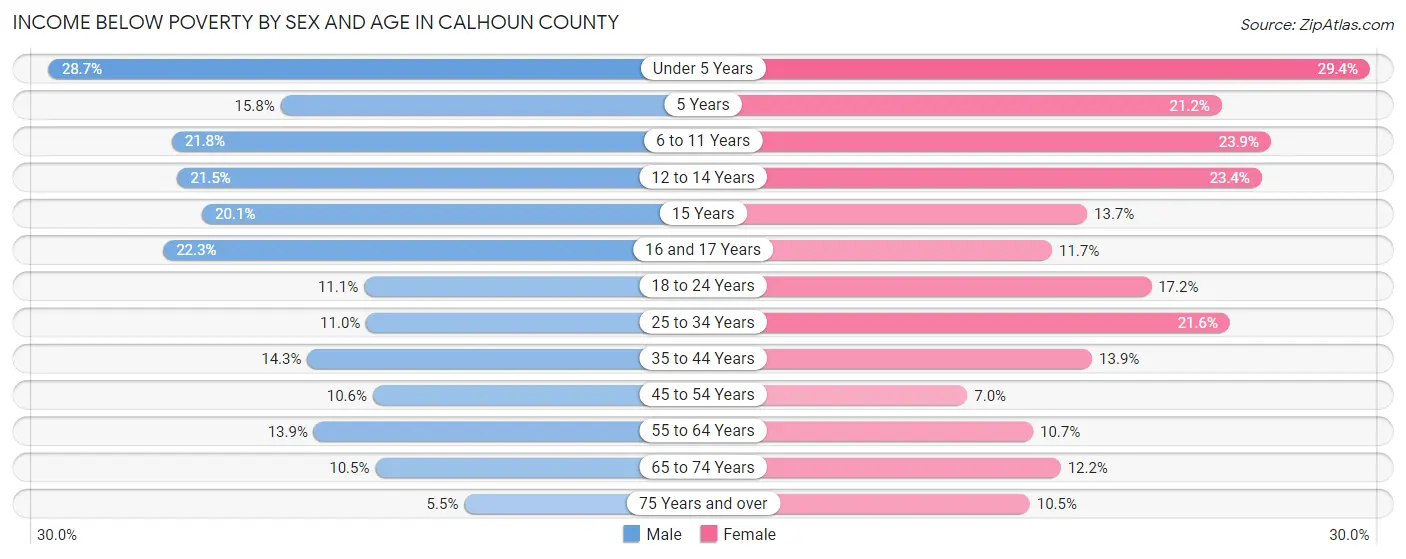
| Age Bracket | Male | Female |
| Under 5 Years | 1,141 (28.6%) | 1,091 (29.4%) |
| 5 Years | 146 (15.8%) | 169 (21.1%) |
| 6 to 11 Years | 1,155 (21.8%) | 1,135 (23.9%) |
| 12 to 14 Years | 536 (21.5%) | 621 (23.4%) |
| 15 Years | 151 (20.1%) | 118 (13.7%) |
| 16 and 17 Years | 490 (22.3%) | 189 (11.7%) |
| 18 to 24 Years | 590 (11.1%) | 859 (17.2%) |
| 25 to 34 Years | 878 (11.0%) | 1,785 (21.6%) |
| 35 to 44 Years | 1,121 (14.3%) | 1,124 (13.9%) |
| 45 to 54 Years | 858 (10.6%) | 573 (7.0%) |
| 55 to 64 Years | 1,258 (13.9%) | 983 (10.6%) |
| 65 to 74 Years | 699 (10.5%) | 905 (12.2%) |
| 75 Years and over | 211 (5.5%) | 574 (10.5%) |
| Total | 9,234 (14.3%) | 10,126 (15.3%) |
Income Above Poverty by Sex and Age in Calhoun County
According to the poverty statistics in Calhoun County, males aged 75 years and over and females aged 45 to 54 years are the age groups that are most secure financially, with 94.5% of males and 93.0% of females in these age groups living above the poverty line.
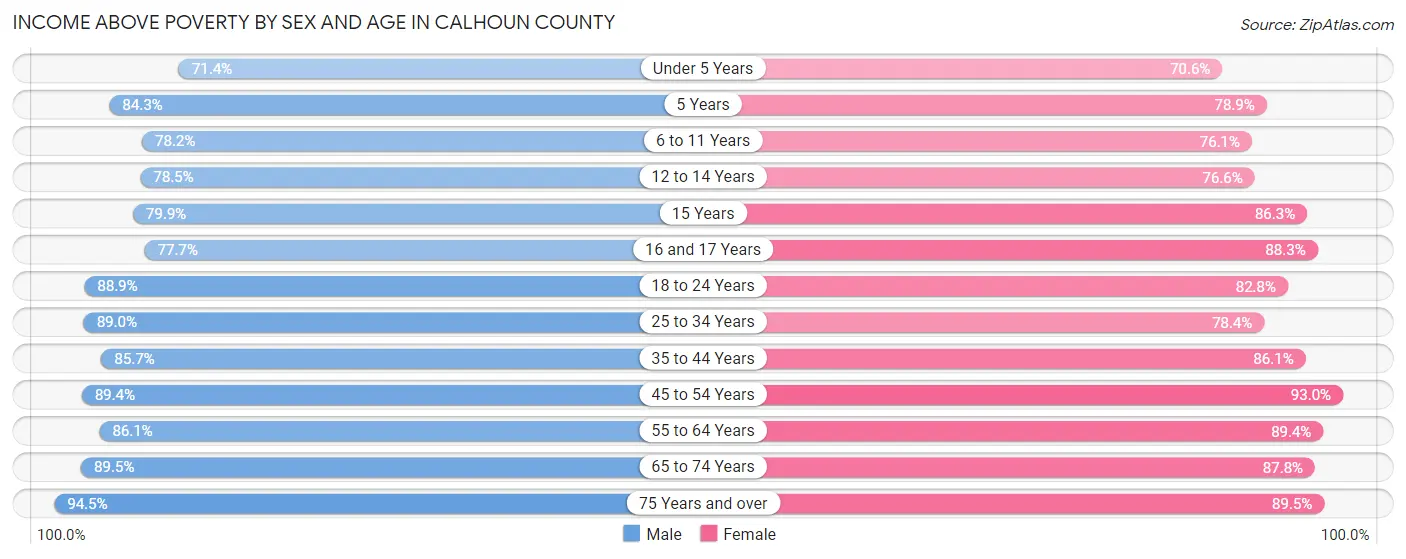
| Age Bracket | Male | Female |
| Under 5 Years | 2,841 (71.4%) | 2,620 (70.6%) |
| 5 Years | 781 (84.3%) | 630 (78.8%) |
| 6 to 11 Years | 4,143 (78.2%) | 3,616 (76.1%) |
| 12 to 14 Years | 1,958 (78.5%) | 2,035 (76.6%) |
| 15 Years | 600 (79.9%) | 746 (86.3%) |
| 16 and 17 Years | 1,709 (77.7%) | 1,425 (88.3%) |
| 18 to 24 Years | 4,726 (88.9%) | 4,126 (82.8%) |
| 25 to 34 Years | 7,119 (89.0%) | 6,479 (78.4%) |
| 35 to 44 Years | 6,738 (85.7%) | 6,938 (86.1%) |
| 45 to 54 Years | 7,229 (89.4%) | 7,625 (93.0%) |
| 55 to 64 Years | 7,795 (86.1%) | 8,249 (89.3%) |
| 65 to 74 Years | 5,978 (89.5%) | 6,519 (87.8%) |
| 75 Years and over | 3,611 (94.5%) | 4,908 (89.5%) |
| Total | 55,228 (85.7%) | 55,916 (84.7%) |
Income Below Poverty Among Married-Couple Families in Calhoun County
The poverty statistics for married-couple families in Calhoun County show that 4.4% or 980 of the total 22,337 families live below the poverty line. Families with 3 or 4 children have the highest poverty rate of 12.2%, comprising of 197 families. On the other hand, families with 5 or more children have the lowest poverty rate of 2.8%, which includes 5 families.
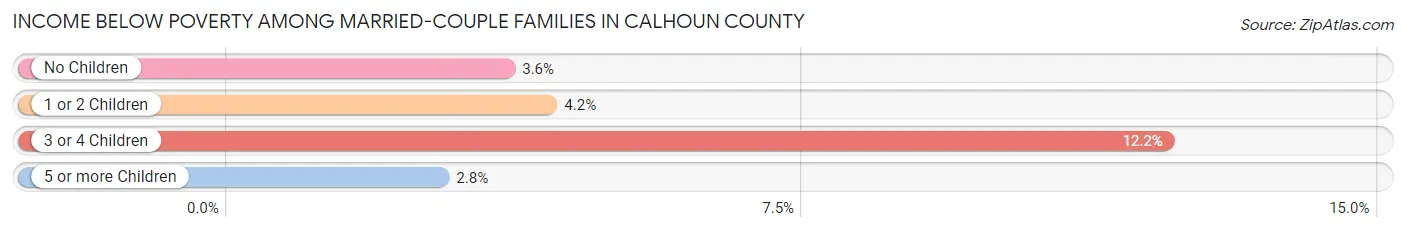
| Children | Above Poverty | Below Poverty |
| No Children | 13,730 (96.4%) | 515 (3.6%) |
| 1 or 2 Children | 6,037 (95.8%) | 263 (4.2%) |
| 3 or 4 Children | 1,414 (87.8%) | 197 (12.2%) |
| 5 or more Children | 176 (97.2%) | 5 (2.8%) |
| Total | 21,357 (95.6%) | 980 (4.4%) |
Income Below Poverty Among Single-Parent Households in Calhoun County
According to the poverty data in Calhoun County, 14.3% or 401 single-father households and 26.6% or 1,996 single-mother households are living below the poverty line. Among single-father households, those with 3 or 4 children have the highest poverty rate, with 87 households (39.0%) experiencing poverty. Likewise, among single-mother households, those with 5 or more children have the highest poverty rate, with 53 households (62.4%) falling below the poverty line.
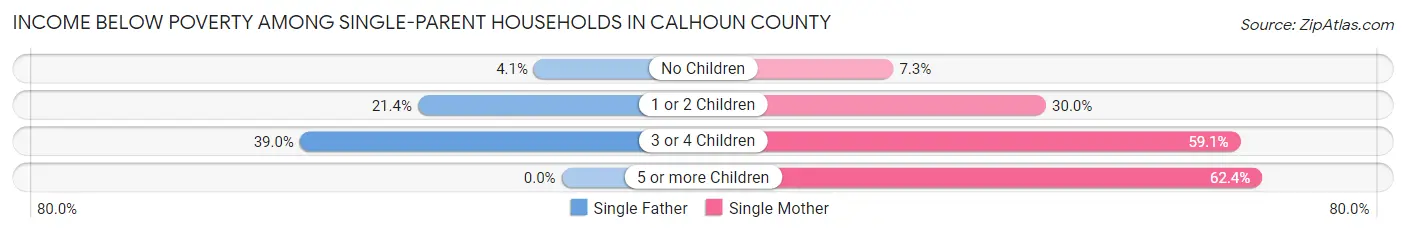
| Children | Single Father | Single Mother |
| No Children | 57 (4.1%) | 194 (7.3%) |
| 1 or 2 Children | 257 (21.4%) | 1,088 (30.0%) |
| 3 or 4 Children | 87 (39.0%) | 661 (59.1%) |
| 5 or more Children | 0 (0.0%) | 53 (62.4%) |
| Total | 401 (14.3%) | 1,996 (26.6%) |
Income Below Poverty Among Married-Couple vs Single-Parent Households in Calhoun County
The poverty data for Calhoun County shows that 980 of the married-couple family households (4.4%) and 2,397 of the single-parent households (23.3%) are living below the poverty level. Within the married-couple family households, those with 3 or 4 children have the highest poverty rate, with 197 households (12.2%) falling below the poverty line. Among the single-parent households, those with 5 or more children have the highest poverty rate, with 53 household (58.9%) living below poverty.
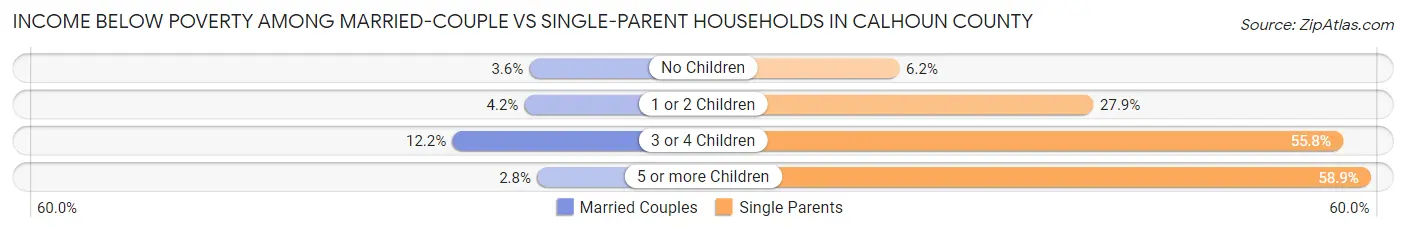
| Children | Married-Couple Families | Single-Parent Households |
| No Children | 515 (3.6%) | 251 (6.2%) |
| 1 or 2 Children | 263 (4.2%) | 1,345 (27.9%) |
| 3 or 4 Children | 197 (12.2%) | 748 (55.8%) |
| 5 or more Children | 5 (2.8%) | 53 (58.9%) |
| Total | 980 (4.4%) | 2,397 (23.3%) |
Employment Characteristics in Calhoun County
Employment by Class of Employer in Calhoun County
Among the 58,169 employed individuals in Calhoun County, private company employees (41,236 | 70.9%), not-for-profit organizations (5,787 | 10.0%), and local government employees (4,656 | 8.0%) make up the most common classes of employment.
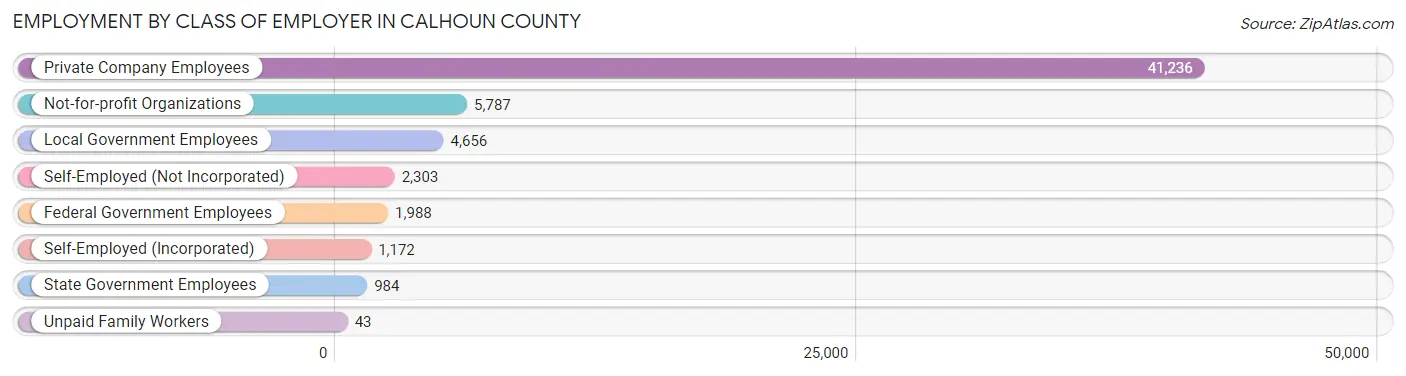
| Employer Class | # Employees | % Employees |
| Private Company Employees | 41,236 | 70.9% |
| Self-Employed (Incorporated) | 1,172 | 2.0% |
| Self-Employed (Not Incorporated) | 2,303 | 4.0% |
| Not-for-profit Organizations | 5,787 | 10.0% |
| Local Government Employees | 4,656 | 8.0% |
| State Government Employees | 984 | 1.7% |
| Federal Government Employees | 1,988 | 3.4% |
| Unpaid Family Workers | 43 | 0.1% |
| Total | 58,169 | 100.0% |
Employment Status by Age in Calhoun County
According to the labor force statistics for Calhoun County, out of the total population over 16 years of age (107,217), 59.7% or 64,009 individuals are in the labor force, with 6.8% or 4,353 of them unemployed. The age group with the highest labor force participation rate is 45 to 54 years, with 83.3% or 13,675 individuals in the labor force. Within the labor force, the 16 to 19 years age range has the highest percentage of unemployed individuals, with 19.7% or 614 of them being unemployed.
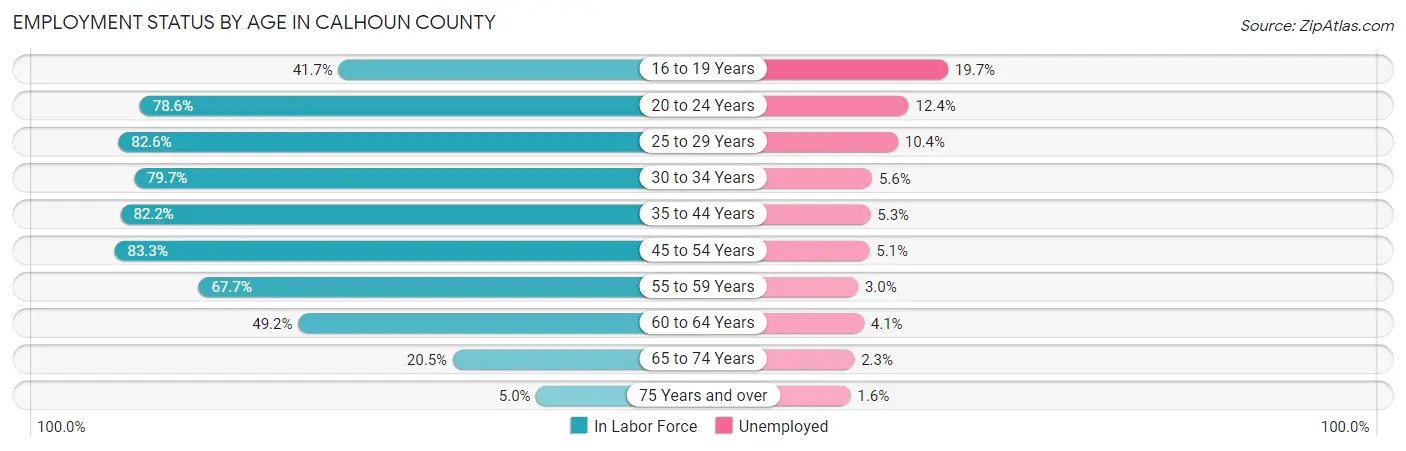
| Age Bracket | In Labor Force | Unemployed |
| 16 to 19 Years | 3,119 (41.7%) | 614 (19.7%) |
| 20 to 24 Years | 6,511 (78.6%) | 807 (12.4%) |
| 25 to 29 Years | 6,947 (82.6%) | 722 (10.4%) |
| 30 to 34 Years | 6,466 (79.7%) | 362 (5.6%) |
| 35 to 44 Years | 13,220 (82.2%) | 701 (5.3%) |
| 45 to 54 Years | 13,675 (83.3%) | 697 (5.1%) |
| 55 to 59 Years | 6,114 (67.7%) | 183 (3.0%) |
| 60 to 64 Years | 4,576 (49.2%) | 188 (4.1%) |
| 65 to 74 Years | 2,945 (20.5%) | 68 (2.3%) |
| 75 Years and over | 487 (5.0%) | 8 (1.6%) |
| Total | 64,009 (59.7%) | 4,353 (6.8%) |
Employment Status by Educational Attainment in Calhoun County
According to labor force statistics for Calhoun County, 75.7% of individuals (50,988) out of the total population between 25 and 64 years of age (67,355) are in the labor force, with 5.6% or 2,855 of them being unemployed. The group with the highest labor force participation rate are those with the educational attainment of bachelor's degree or higher, with 86.6% or 13,124 individuals in the labor force. Within the labor force, individuals with less than high school education have the highest percentage of unemployment, with 17.5% or 536 of them being unemployed.
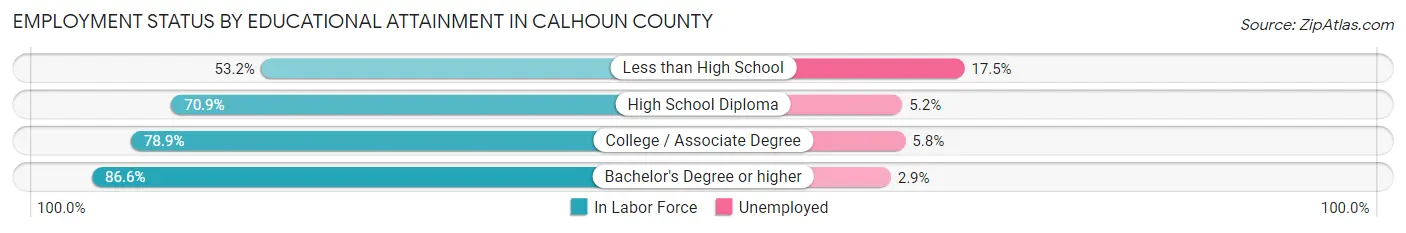
| Educational Attainment | In Labor Force | Unemployed |
| Less than High School | 3,061 (53.2%) | 1,007 (17.5%) |
| High School Diploma | 16,230 (70.9%) | 1,190 (5.2%) |
| College / Associate Degree | 18,585 (78.9%) | 1,366 (5.8%) |
| Bachelor's Degree or higher | 13,124 (86.6%) | 439 (2.9%) |
| Total | 50,988 (75.7%) | 3,772 (5.6%) |
Employment Occupations by Sex in Calhoun County
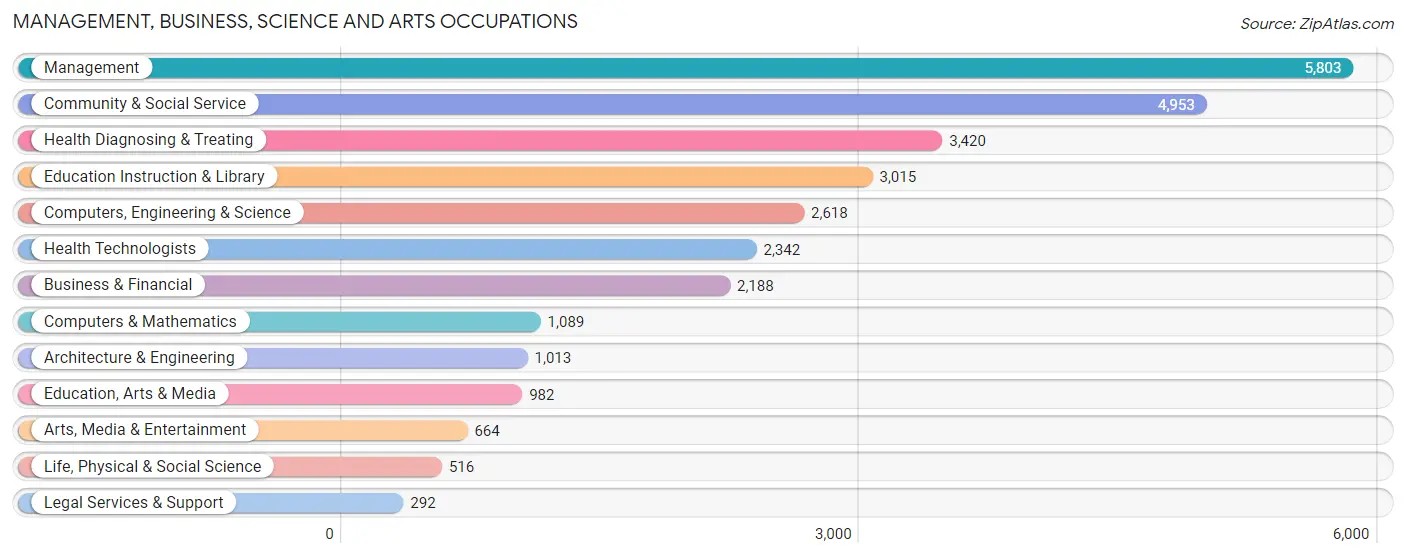
Management, Business, Science and Arts Occupations
The most common Management, Business, Science and Arts occupations in Calhoun County are Management (5,803 | 9.8%), Community & Social Service (4,953 | 8.3%), Health Diagnosing & Treating (3,420 | 5.7%), Education Instruction & Library (3,015 | 5.1%), and Computers, Engineering & Science (2,618 | 4.4%).
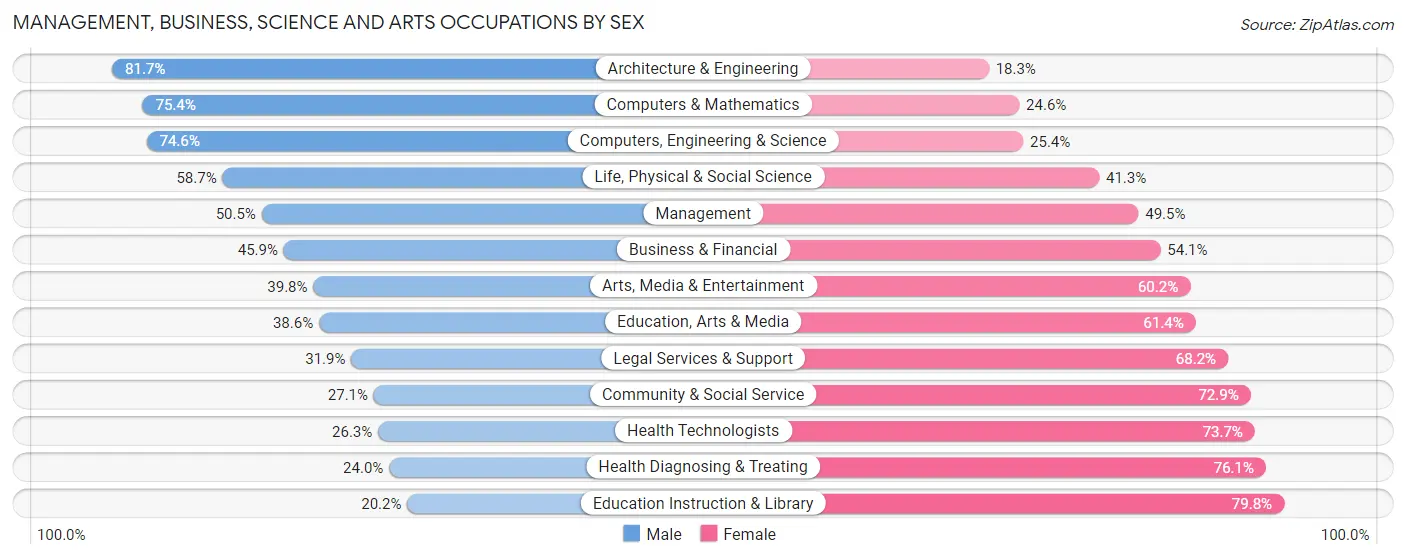
Management, Business, Science and Arts Occupations by Sex
Within the Management, Business, Science and Arts occupations in Calhoun County, the most male-oriented occupations are Architecture & Engineering (81.7%), Computers & Mathematics (75.4%), and Computers, Engineering & Science (74.6%), while the most female-oriented occupations are Education Instruction & Library (79.8%), Health Diagnosing & Treating (76.0%), and Health Technologists (73.7%).
| Occupation | Male | Female |
| Management | 2,933 (50.5%) | 2,870 (49.5%) |
| Business & Financial | 1,005 (45.9%) | 1,183 (54.1%) |
| Computers, Engineering & Science | 1,952 (74.6%) | 666 (25.4%) |
| Computers & Mathematics | 821 (75.4%) | 268 (24.6%) |
| Architecture & Engineering | 828 (81.7%) | 185 (18.3%) |
| Life, Physical & Social Science | 303 (58.7%) | 213 (41.3%) |
| Community & Social Service | 1,344 (27.1%) | 3,609 (72.9%) |
| Education, Arts & Media | 379 (38.6%) | 603 (61.4%) |
| Legal Services & Support | 93 (31.9%) | 199 (68.1%) |
| Education Instruction & Library | 608 (20.2%) | 2,407 (79.8%) |
| Arts, Media & Entertainment | 264 (39.8%) | 400 (60.2%) |
| Health Diagnosing & Treating | 819 (23.9%) | 2,601 (76.0%) |
| Health Technologists | 615 (26.3%) | 1,727 (73.7%) |
| Total (Category) | 8,053 (42.4%) | 10,929 (57.6%) |
| Total (Overall) | 30,517 (51.2%) | 29,031 (48.7%) |
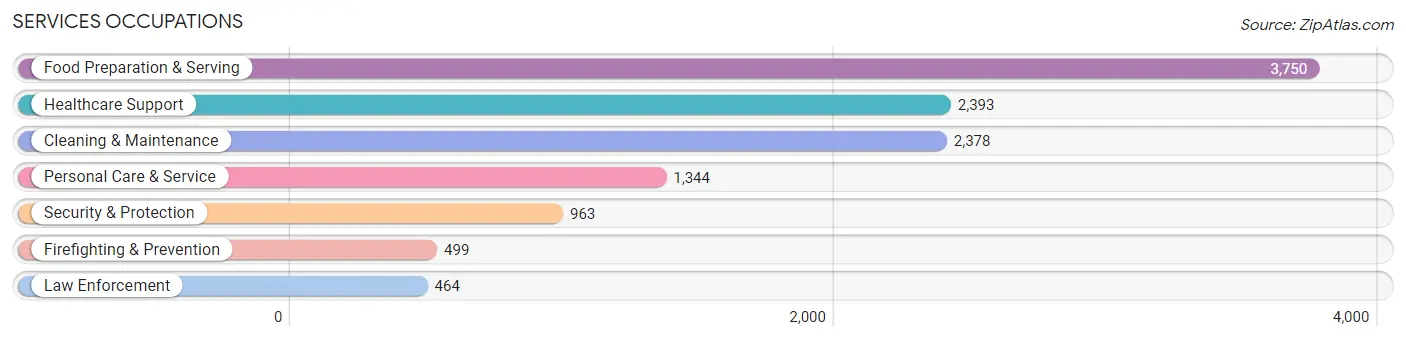
Services Occupations
The most common Services occupations in Calhoun County are Food Preparation & Serving (3,750 | 6.3%), Healthcare Support (2,393 | 4.0%), Cleaning & Maintenance (2,378 | 4.0%), Personal Care & Service (1,344 | 2.3%), and Security & Protection (963 | 1.6%).
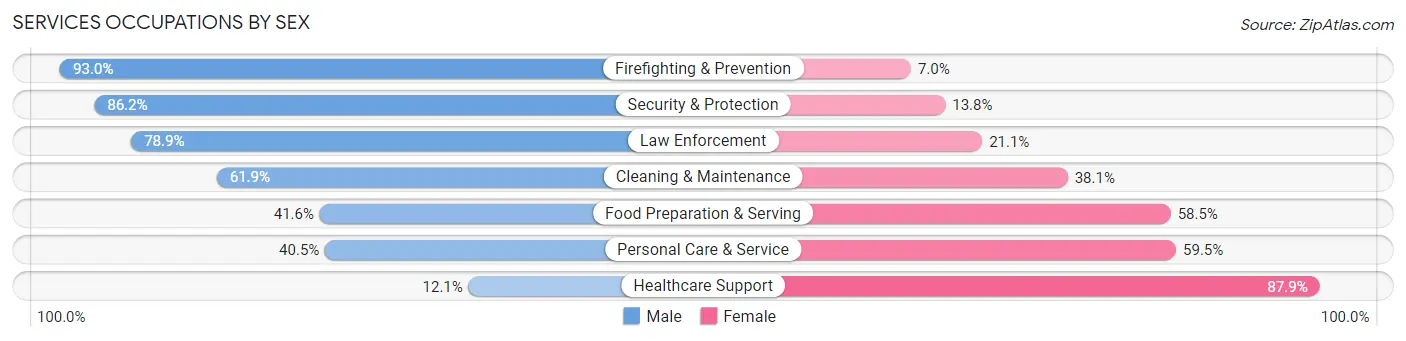
Services Occupations by Sex
Within the Services occupations in Calhoun County, the most male-oriented occupations are Firefighting & Prevention (93.0%), Security & Protection (86.2%), and Law Enforcement (78.9%), while the most female-oriented occupations are Healthcare Support (87.9%), Personal Care & Service (59.5%), and Food Preparation & Serving (58.5%).
| Occupation | Male | Female |
| Healthcare Support | 289 (12.1%) | 2,104 (87.9%) |
| Security & Protection | 830 (86.2%) | 133 (13.8%) |
| Firefighting & Prevention | 464 (93.0%) | 35 (7.0%) |
| Law Enforcement | 366 (78.9%) | 98 (21.1%) |
| Food Preparation & Serving | 1,558 (41.5%) | 2,192 (58.5%) |
| Cleaning & Maintenance | 1,473 (61.9%) | 905 (38.1%) |
| Personal Care & Service | 544 (40.5%) | 800 (59.5%) |
| Total (Category) | 4,694 (43.3%) | 6,134 (56.7%) |
| Total (Overall) | 30,517 (51.2%) | 29,031 (48.7%) |
Sales and Office Occupations
The most common Sales and Office occupations in Calhoun County are Office & Administration (6,086 | 10.2%), and Sales & Related (5,051 | 8.5%).

Sales and Office Occupations by Sex
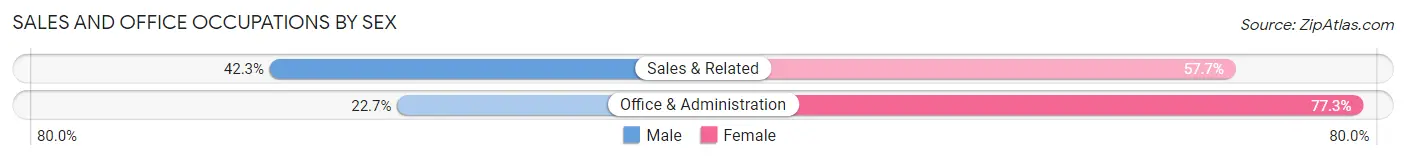
| Occupation | Male | Female |
| Sales & Related | 2,135 (42.3%) | 2,916 (57.7%) |
| Office & Administration | 1,379 (22.7%) | 4,707 (77.3%) |
| Total (Category) | 3,514 (31.6%) | 7,623 (68.4%) |
| Total (Overall) | 30,517 (51.2%) | 29,031 (48.7%) |
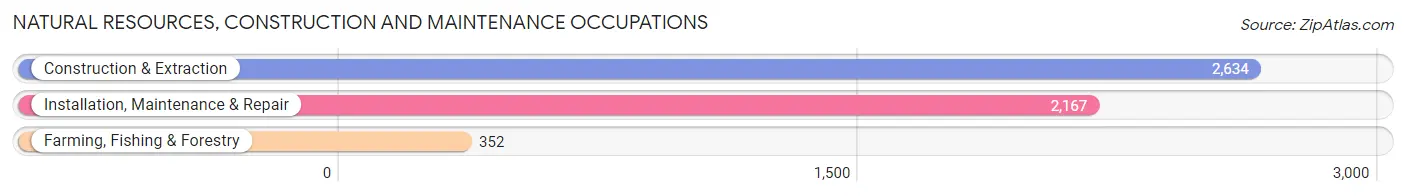
Natural Resources, Construction and Maintenance Occupations
The most common Natural Resources, Construction and Maintenance occupations in Calhoun County are Construction & Extraction (2,634 | 4.4%), Installation, Maintenance & Repair (2,167 | 3.6%), and Farming, Fishing & Forestry (352 | 0.6%).
Natural Resources, Construction and Maintenance Occupations by Sex
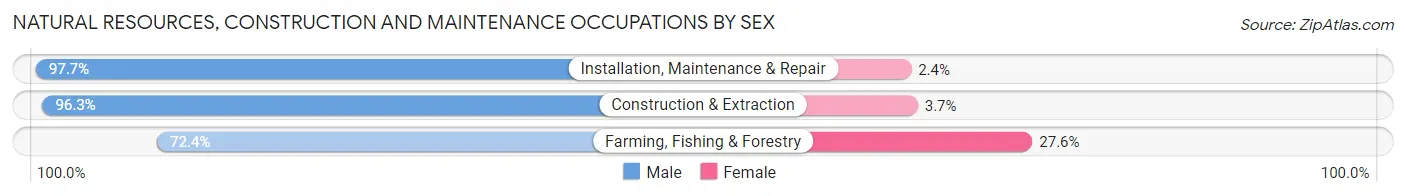
| Occupation | Male | Female |
| Farming, Fishing & Forestry | 255 (72.4%) | 97 (27.6%) |
| Construction & Extraction | 2,536 (96.3%) | 98 (3.7%) |
| Installation, Maintenance & Repair | 2,116 (97.7%) | 51 (2.4%) |
| Total (Category) | 4,907 (95.2%) | 246 (4.8%) |
| Total (Overall) | 30,517 (51.2%) | 29,031 (48.7%) |
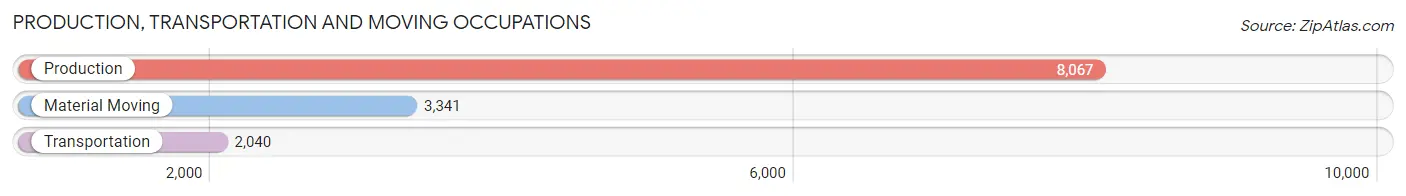
Production, Transportation and Moving Occupations
The most common Production, Transportation and Moving occupations in Calhoun County are Production (8,067 | 13.6%), Material Moving (3,341 | 5.6%), and Transportation (2,040 | 3.4%).
Production, Transportation and Moving Occupations by Sex
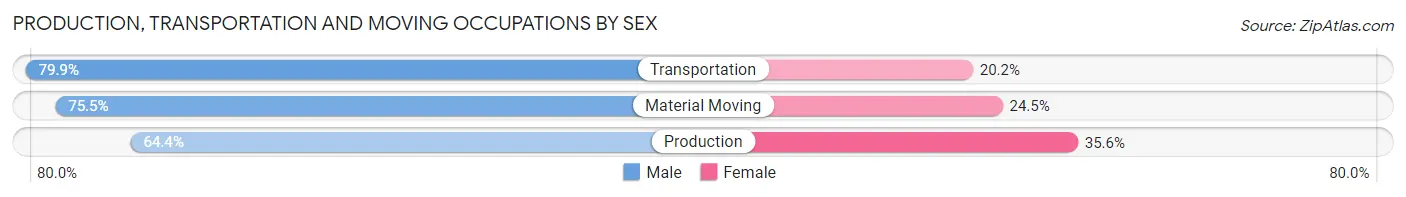
| Occupation | Male | Female |
| Production | 5,198 (64.4%) | 2,869 (35.6%) |
| Transportation | 1,629 (79.8%) | 411 (20.2%) |
| Material Moving | 2,522 (75.5%) | 819 (24.5%) |
| Total (Category) | 9,349 (69.5%) | 4,099 (30.5%) |
| Total (Overall) | 30,517 (51.2%) | 29,031 (48.7%) |
Employment Industries by Sex in Calhoun County
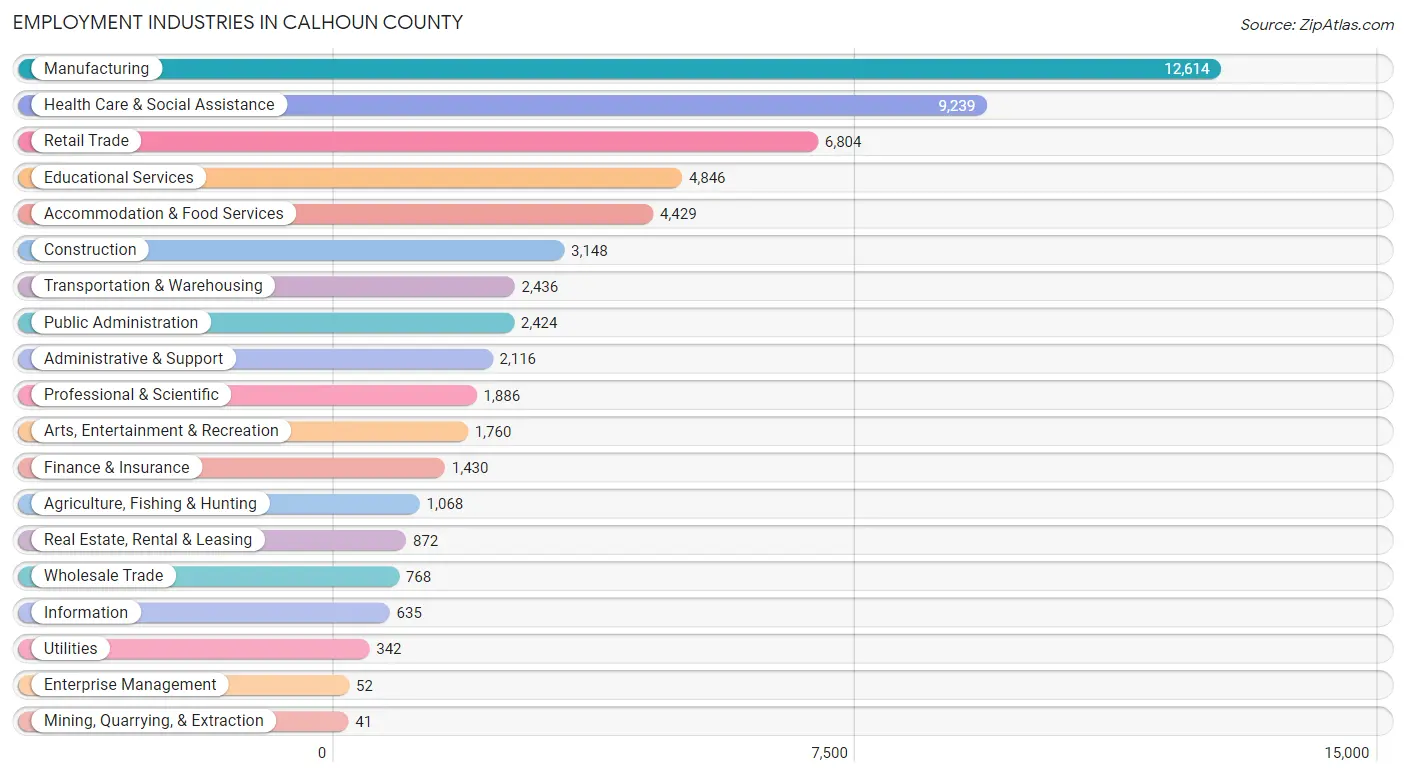
Employment Industries in Calhoun County
The major employment industries in Calhoun County include Manufacturing (12,614 | 21.2%), Health Care & Social Assistance (9,239 | 15.5%), Retail Trade (6,804 | 11.4%), Educational Services (4,846 | 8.1%), and Accommodation & Food Services (4,429 | 7.4%).
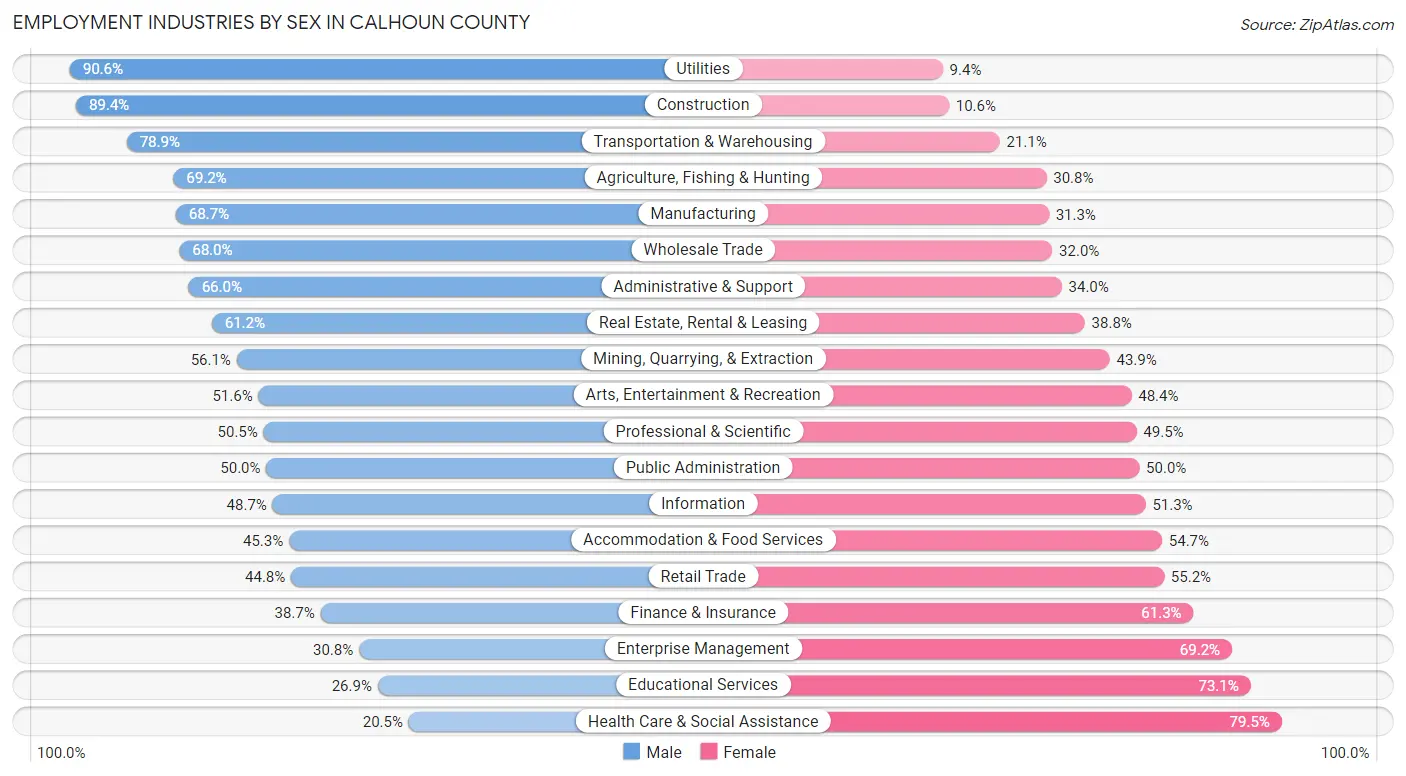
Employment Industries by Sex in Calhoun County
The Calhoun County industries that see more men than women are Utilities (90.6%), Construction (89.4%), and Transportation & Warehousing (78.9%), whereas the industries that tend to have a higher number of women are Health Care & Social Assistance (79.5%), Educational Services (73.1%), and Enterprise Management (69.2%).
| Industry | Male | Female |
| Agriculture, Fishing & Hunting | 739 (69.2%) | 329 (30.8%) |
| Mining, Quarrying, & Extraction | 23 (56.1%) | 18 (43.9%) |
| Construction | 2,813 (89.4%) | 335 (10.6%) |
| Manufacturing | 8,664 (68.7%) | 3,950 (31.3%) |
| Wholesale Trade | 522 (68.0%) | 246 (32.0%) |
| Retail Trade | 3,051 (44.8%) | 3,753 (55.2%) |
| Transportation & Warehousing | 1,921 (78.9%) | 515 (21.1%) |
| Utilities | 310 (90.6%) | 32 (9.4%) |
| Information | 309 (48.7%) | 326 (51.3%) |
| Finance & Insurance | 554 (38.7%) | 876 (61.3%) |
| Real Estate, Rental & Leasing | 534 (61.2%) | 338 (38.8%) |
| Professional & Scientific | 953 (50.5%) | 933 (49.5%) |
| Enterprise Management | 16 (30.8%) | 36 (69.2%) |
| Administrative & Support | 1,397 (66.0%) | 719 (34.0%) |
| Educational Services | 1,304 (26.9%) | 3,542 (73.1%) |
| Health Care & Social Assistance | 1,892 (20.5%) | 7,347 (79.5%) |
| Arts, Entertainment & Recreation | 908 (51.6%) | 852 (48.4%) |
| Accommodation & Food Services | 2,005 (45.3%) | 2,424 (54.7%) |
| Public Administration | 1,211 (50.0%) | 1,213 (50.0%) |
| Total | 30,517 (51.2%) | 29,031 (48.7%) |
Education in Calhoun County
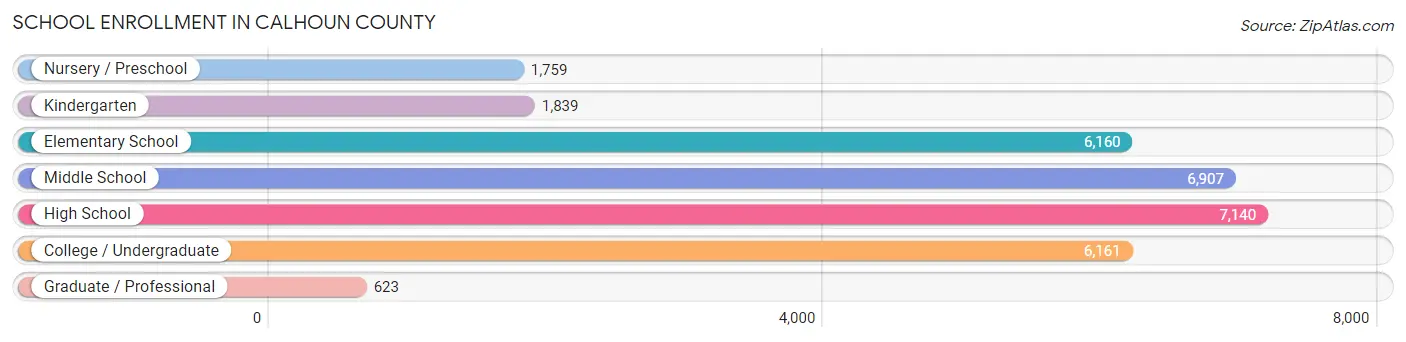
School Enrollment in Calhoun County
The most common levels of schooling among the 30,589 students in Calhoun County are high school (7,140 | 23.3%), middle school (6,907 | 22.6%), and college / undergraduate (6,161 | 20.1%).
| School Level | # Students | % Students |
| Nursery / Preschool | 1,759 | 5.8% |
| Kindergarten | 1,839 | 6.0% |
| Elementary School | 6,160 | 20.1% |
| Middle School | 6,907 | 22.6% |
| High School | 7,140 | 23.3% |
| College / Undergraduate | 6,161 | 20.1% |
| Graduate / Professional | 623 | 2.0% |
| Total | 30,589 | 100.0% |
School Enrollment by Age by Funding Source in Calhoun County
Out of a total of 30,589 students who are enrolled in schools in Calhoun County, 4,099 (13.4%) attend a private institution, while the remaining 26,490 (86.6%) are enrolled in public schools. The age group of 18 to 19 year olds has the highest likelihood of being enrolled in private schools, with 837 (33.4% in the age bracket) enrolled. Conversely, the age group of 15 to 17 year olds has the lowest likelihood of being enrolled in a private school, with 5,115 (94.3% in the age bracket) attending a public institution.
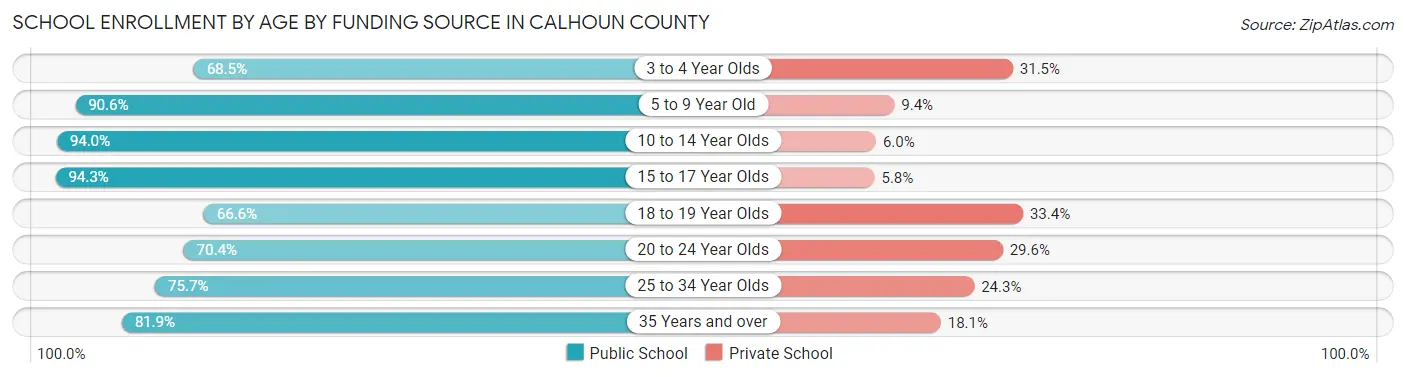
| Age Bracket | Public School | Private School |
| 3 to 4 Year Olds | 850 (68.5%) | 391 (31.5%) |
| 5 to 9 Year Old | 7,058 (90.6%) | 736 (9.4%) |
| 10 to 14 Year Olds | 7,965 (94.0%) | 509 (6.0%) |
| 15 to 17 Year Olds | 5,115 (94.3%) | 312 (5.8%) |
| 18 to 19 Year Olds | 1,669 (66.6%) | 837 (33.4%) |
| 20 to 24 Year Olds | 1,860 (70.4%) | 783 (29.6%) |
| 25 to 34 Year Olds | 1,008 (75.7%) | 324 (24.3%) |
| 35 Years and over | 960 (81.9%) | 212 (18.1%) |
| Total | 26,490 (86.6%) | 4,099 (13.4%) |
Educational Attainment by Field of Study in Calhoun County
Business (3,996 | 18.1%), education (3,823 | 17.3%), science & technology (2,774 | 12.6%), arts & humanities (1,990 | 9.0%), and engineering (1,541 | 7.0%) are the most common fields of study among 22,097 individuals in Calhoun County who have obtained a bachelor's degree or higher.
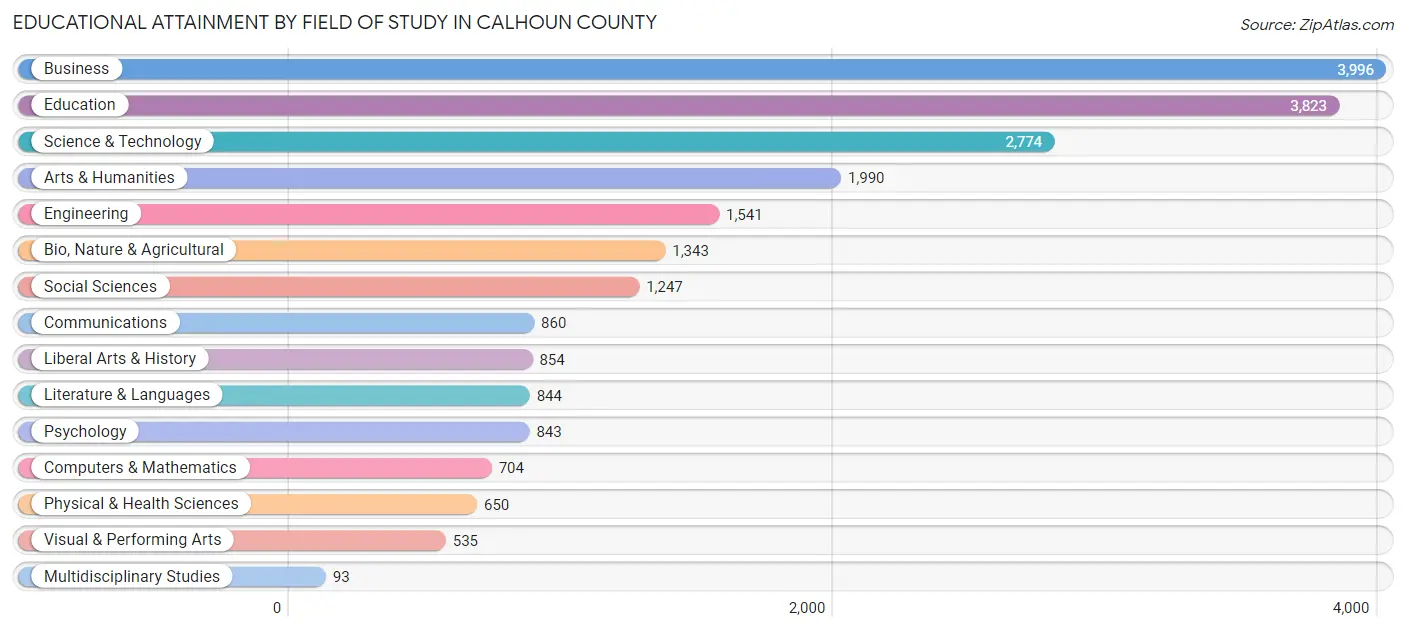
| Field of Study | # Graduates | % Graduates |
| Computers & Mathematics | 704 | 3.2% |
| Bio, Nature & Agricultural | 1,343 | 6.1% |
| Physical & Health Sciences | 650 | 2.9% |
| Psychology | 843 | 3.8% |
| Social Sciences | 1,247 | 5.6% |
| Engineering | 1,541 | 7.0% |
| Multidisciplinary Studies | 93 | 0.4% |
| Science & Technology | 2,774 | 12.6% |
| Business | 3,996 | 18.1% |
| Education | 3,823 | 17.3% |
| Literature & Languages | 844 | 3.8% |
| Liberal Arts & History | 854 | 3.9% |
| Visual & Performing Arts | 535 | 2.4% |
| Communications | 860 | 3.9% |
| Arts & Humanities | 1,990 | 9.0% |
| Total | 22,097 | 100.0% |
Transportation & Commute in Calhoun County
Vehicle Availability by Sex in Calhoun County
The most prevalent vehicle ownership categories in Calhoun County are males with 2 vehicles (12,919, accounting for 43.2%) and females with 2 vehicles (11,297, making up 46.6%).
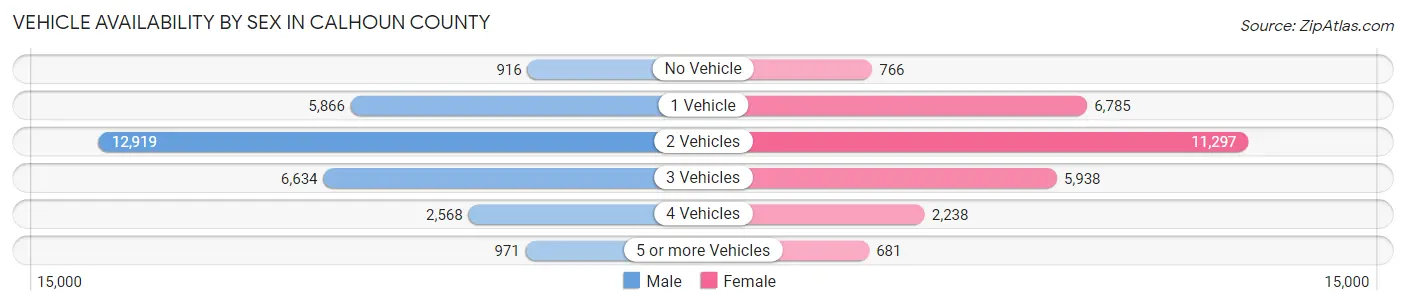
| Vehicles Available | Male | Female |
| No Vehicle | 916 (3.1%) | 766 (2.8%) |
| 1 Vehicle | 5,866 (19.6%) | 6,785 (24.5%) |
| 2 Vehicles | 12,919 (43.2%) | 11,297 (40.8%) |
| 3 Vehicles | 6,634 (22.2%) | 5,938 (21.4%) |
| 4 Vehicles | 2,568 (8.6%) | 2,238 (8.1%) |
| 5 or more Vehicles | 971 (3.3%) | 681 (2.5%) |
| Total | 29,874 (100.0%) | 27,705 (100.0%) |
Commute Time in Calhoun County
The most frequently occuring commute durations in Calhoun County are 10 to 14 minutes (10,848 commuters, 19.9%), 15 to 19 minutes (10,251 commuters, 18.8%), and 20 to 24 minutes (8,378 commuters, 15.4%).
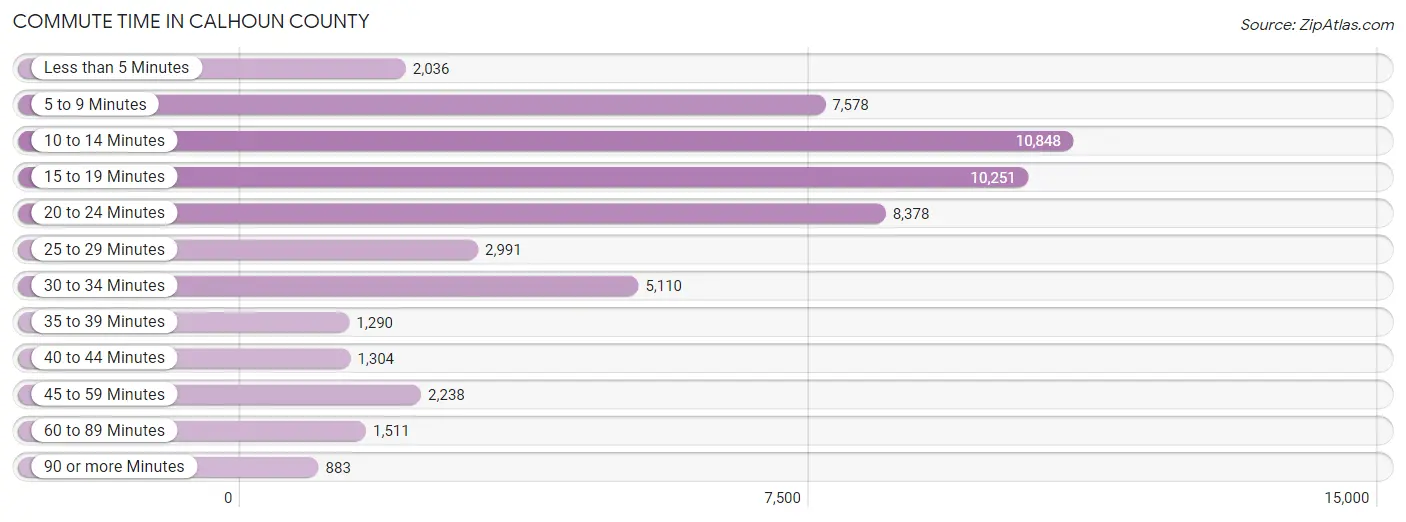
| Commute Time | # Commuters | % Commuters |
| Less than 5 Minutes | 2,036 | 3.7% |
| 5 to 9 Minutes | 7,578 | 13.9% |
| 10 to 14 Minutes | 10,848 | 19.9% |
| 15 to 19 Minutes | 10,251 | 18.8% |
| 20 to 24 Minutes | 8,378 | 15.4% |
| 25 to 29 Minutes | 2,991 | 5.5% |
| 30 to 34 Minutes | 5,110 | 9.4% |
| 35 to 39 Minutes | 1,290 | 2.4% |
| 40 to 44 Minutes | 1,304 | 2.4% |
| 45 to 59 Minutes | 2,238 | 4.1% |
| 60 to 89 Minutes | 1,511 | 2.8% |
| 90 or more Minutes | 883 | 1.6% |
Commute Time by Sex in Calhoun County
The most common commute times in Calhoun County are 15 to 19 minutes (5,374 commuters, 18.9%) for males and 10 to 14 minutes (5,677 commuters, 21.9%) for females.
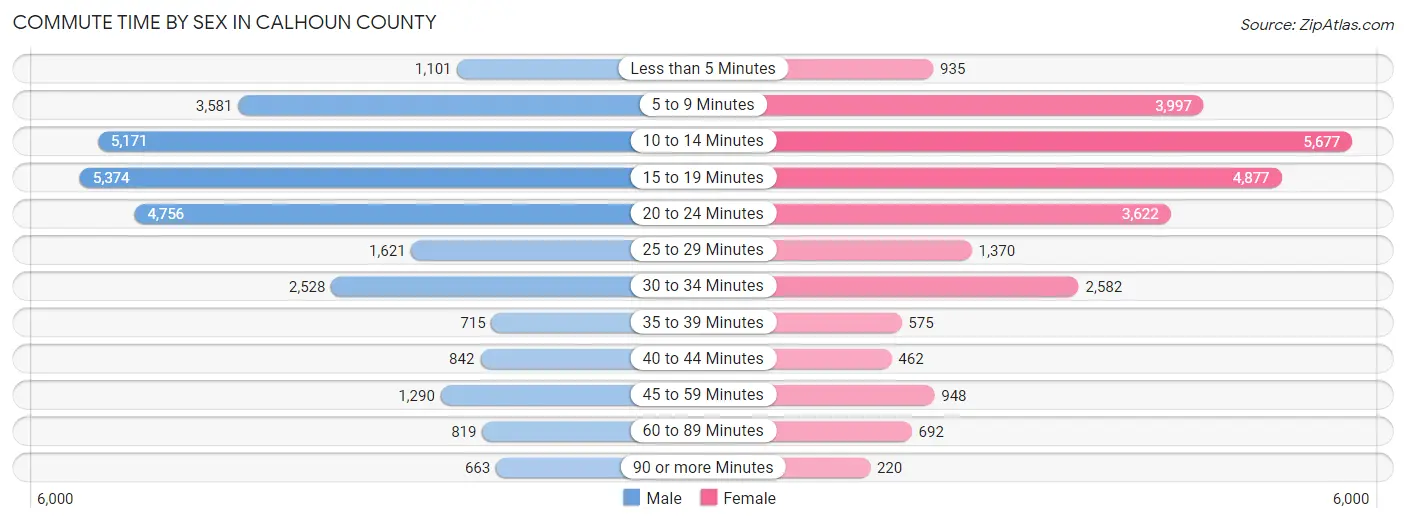
| Commute Time | Male | Female |
| Less than 5 Minutes | 1,101 (3.9%) | 935 (3.6%) |
| 5 to 9 Minutes | 3,581 (12.6%) | 3,997 (15.4%) |
| 10 to 14 Minutes | 5,171 (18.2%) | 5,677 (21.9%) |
| 15 to 19 Minutes | 5,374 (18.9%) | 4,877 (18.8%) |
| 20 to 24 Minutes | 4,756 (16.7%) | 3,622 (14.0%) |
| 25 to 29 Minutes | 1,621 (5.7%) | 1,370 (5.3%) |
| 30 to 34 Minutes | 2,528 (8.9%) | 2,582 (10.0%) |
| 35 to 39 Minutes | 715 (2.5%) | 575 (2.2%) |
| 40 to 44 Minutes | 842 (3.0%) | 462 (1.8%) |
| 45 to 59 Minutes | 1,290 (4.5%) | 948 (3.6%) |
| 60 to 89 Minutes | 819 (2.9%) | 692 (2.7%) |
| 90 or more Minutes | 663 (2.3%) | 220 (0.9%) |
Time of Departure to Work by Sex in Calhoun County
The most frequent times of departure to work in Calhoun County are 6:00 AM to 6:29 AM (3,091, 10.9%) for males and 7:30 AM to 7:59 AM (3,646, 14.1%) for females.
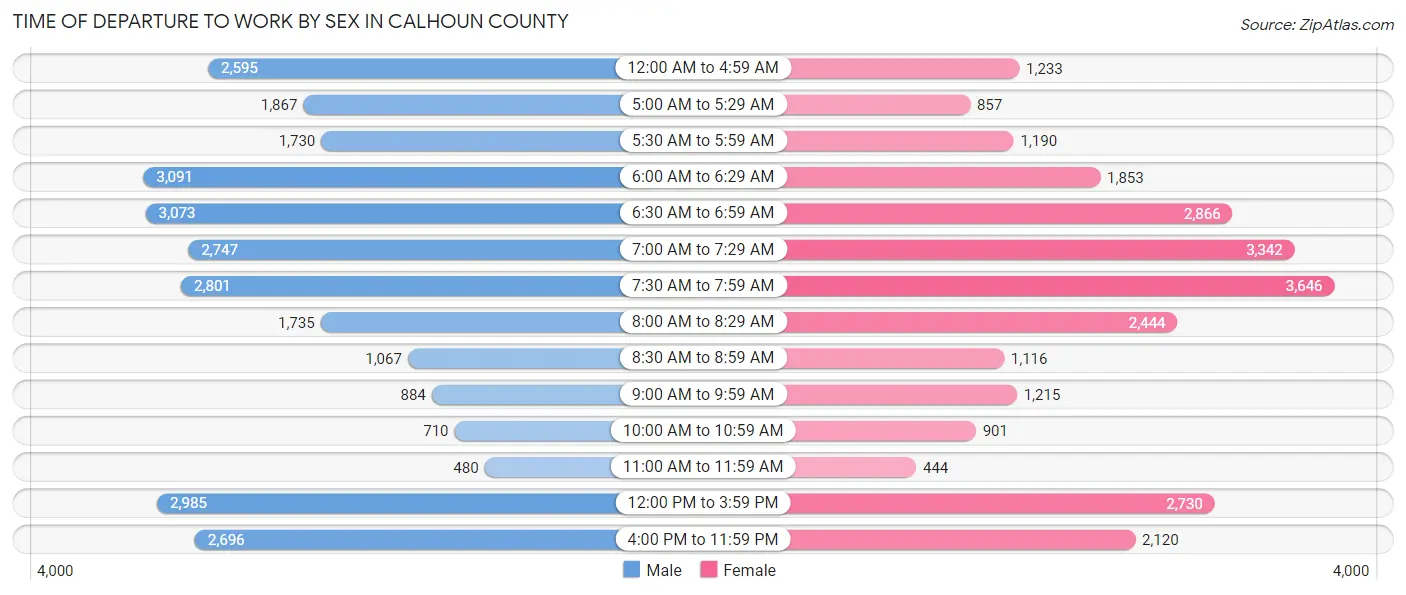
| Time of Departure | Male | Female |
| 12:00 AM to 4:59 AM | 2,595 (9.1%) | 1,233 (4.8%) |
| 5:00 AM to 5:29 AM | 1,867 (6.6%) | 857 (3.3%) |
| 5:30 AM to 5:59 AM | 1,730 (6.1%) | 1,190 (4.6%) |
| 6:00 AM to 6:29 AM | 3,091 (10.9%) | 1,853 (7.1%) |
| 6:30 AM to 6:59 AM | 3,073 (10.8%) | 2,866 (11.0%) |
| 7:00 AM to 7:29 AM | 2,747 (9.7%) | 3,342 (12.9%) |
| 7:30 AM to 7:59 AM | 2,801 (9.8%) | 3,646 (14.1%) |
| 8:00 AM to 8:29 AM | 1,735 (6.1%) | 2,444 (9.4%) |
| 8:30 AM to 8:59 AM | 1,067 (3.7%) | 1,116 (4.3%) |
| 9:00 AM to 9:59 AM | 884 (3.1%) | 1,215 (4.7%) |
| 10:00 AM to 10:59 AM | 710 (2.5%) | 901 (3.5%) |
| 11:00 AM to 11:59 AM | 480 (1.7%) | 444 (1.7%) |
| 12:00 PM to 3:59 PM | 2,985 (10.5%) | 2,730 (10.5%) |
| 4:00 PM to 11:59 PM | 2,696 (9.5%) | 2,120 (8.2%) |
| Total | 28,461 (100.0%) | 25,957 (100.0%) |
Housing Occupancy in Calhoun County
Occupancy by Ownership in Calhoun County
Of the total 53,050 dwellings in Calhoun County, owner-occupied units account for 38,018 (71.7%), while renter-occupied units make up 15,032 (28.3%).
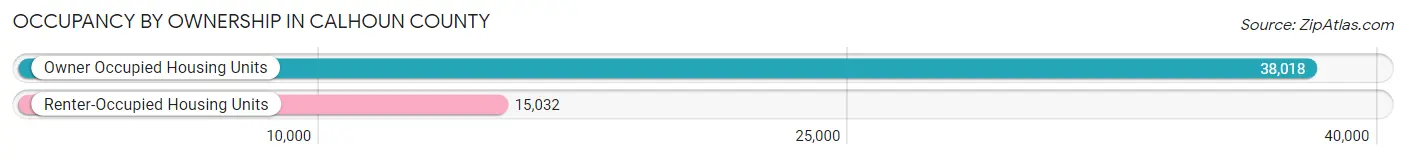
| Occupancy | # Housing Units | % Housing Units |
| Owner Occupied Housing Units | 38,018 | 71.7% |
| Renter-Occupied Housing Units | 15,032 | 28.3% |
| Total Occupied Housing Units | 53,050 | 100.0% |
Occupancy by Household Size in Calhoun County
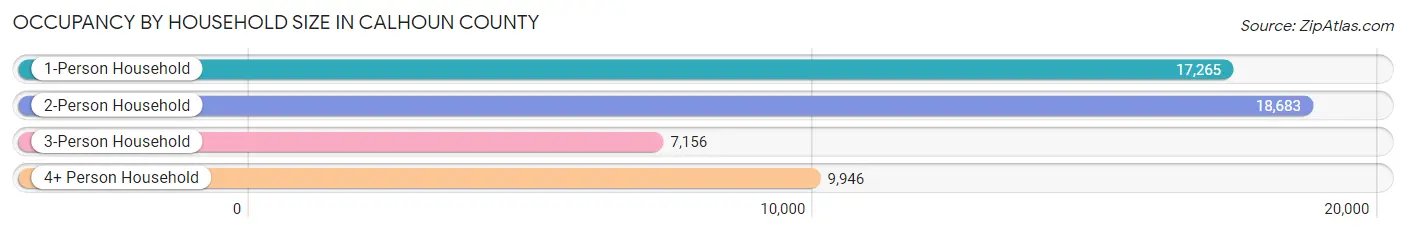
| Household Size | # Housing Units | % Housing Units |
| 1-Person Household | 17,265 | 32.5% |
| 2-Person Household | 18,683 | 35.2% |
| 3-Person Household | 7,156 | 13.5% |
| 4+ Person Household | 9,946 | 18.8% |
| Total Housing Units | 53,050 | 100.0% |
Occupancy by Ownership by Household Size in Calhoun County
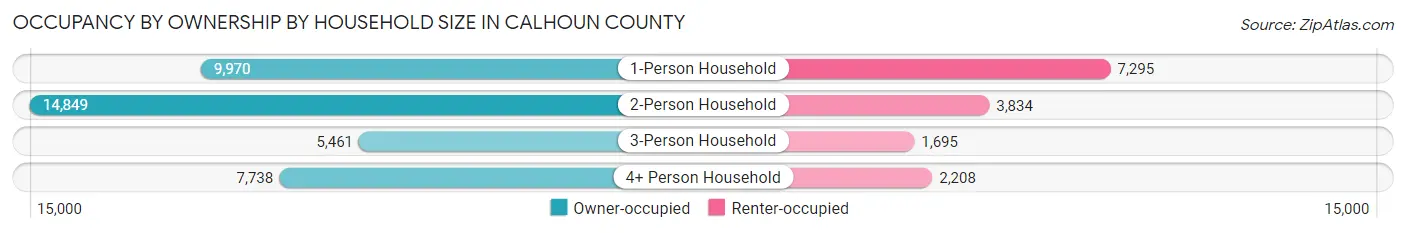
| Household Size | Owner-occupied | Renter-occupied |
| 1-Person Household | 9,970 (57.8%) | 7,295 (42.2%) |
| 2-Person Household | 14,849 (79.5%) | 3,834 (20.5%) |
| 3-Person Household | 5,461 (76.3%) | 1,695 (23.7%) |
| 4+ Person Household | 7,738 (77.8%) | 2,208 (22.2%) |
| Total Housing Units | 38,018 (71.7%) | 15,032 (28.3%) |
Occupancy by Educational Attainment in Calhoun County
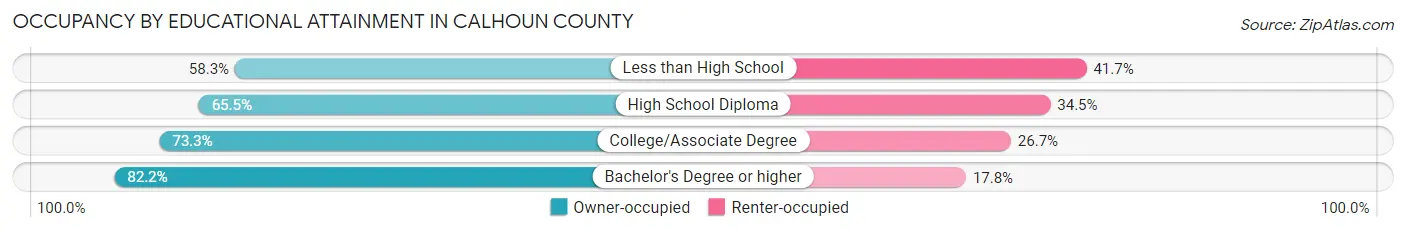
| Household Size | Owner-occupied | Renter-occupied |
| Less than High School | 2,322 (58.3%) | 1,661 (41.7%) |
| High School Diploma | 11,320 (65.5%) | 5,970 (34.5%) |
| College/Associate Degree | 14,345 (73.3%) | 5,229 (26.7%) |
| Bachelor's Degree or higher | 10,031 (82.2%) | 2,172 (17.8%) |
Occupancy by Age of Householder in Calhoun County
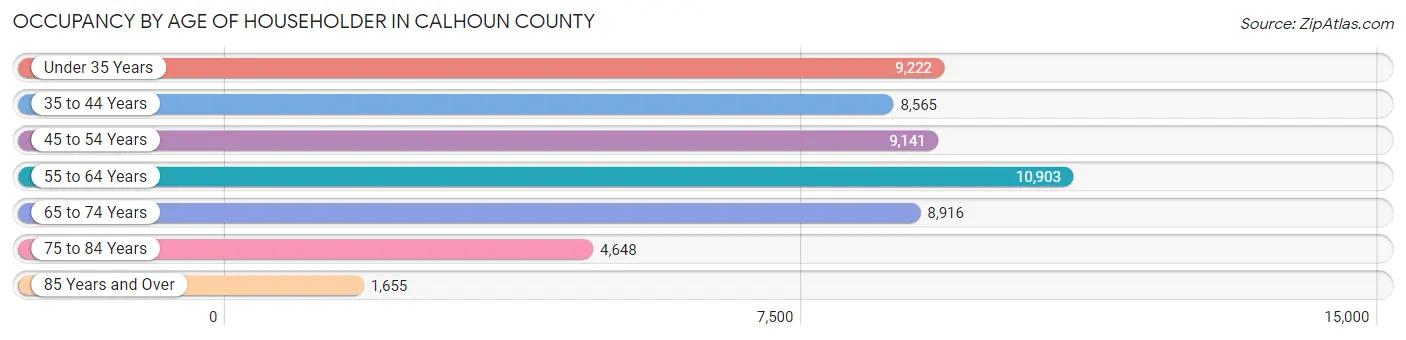
| Age Bracket | # Households | % Households |
| Under 35 Years | 9,222 | 17.4% |
| 35 to 44 Years | 8,565 | 16.2% |
| 45 to 54 Years | 9,141 | 17.2% |
| 55 to 64 Years | 10,903 | 20.5% |
| 65 to 74 Years | 8,916 | 16.8% |
| 75 to 84 Years | 4,648 | 8.8% |
| 85 Years and Over | 1,655 | 3.1% |
| Total | 53,050 | 100.0% |
Housing Finances in Calhoun County
Median Income by Occupancy in Calhoun County
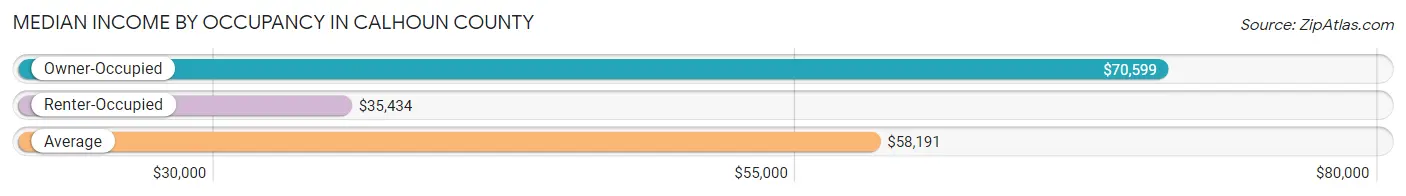
| Occupancy Type | # Households | Median Income |
| Owner-Occupied | 38,018 (71.7%) | $70,599 |
| Renter-Occupied | 15,032 (28.3%) | $35,434 |
| Average | 53,050 (100.0%) | $58,191 |
Occupancy by Householder Income Bracket in Calhoun County
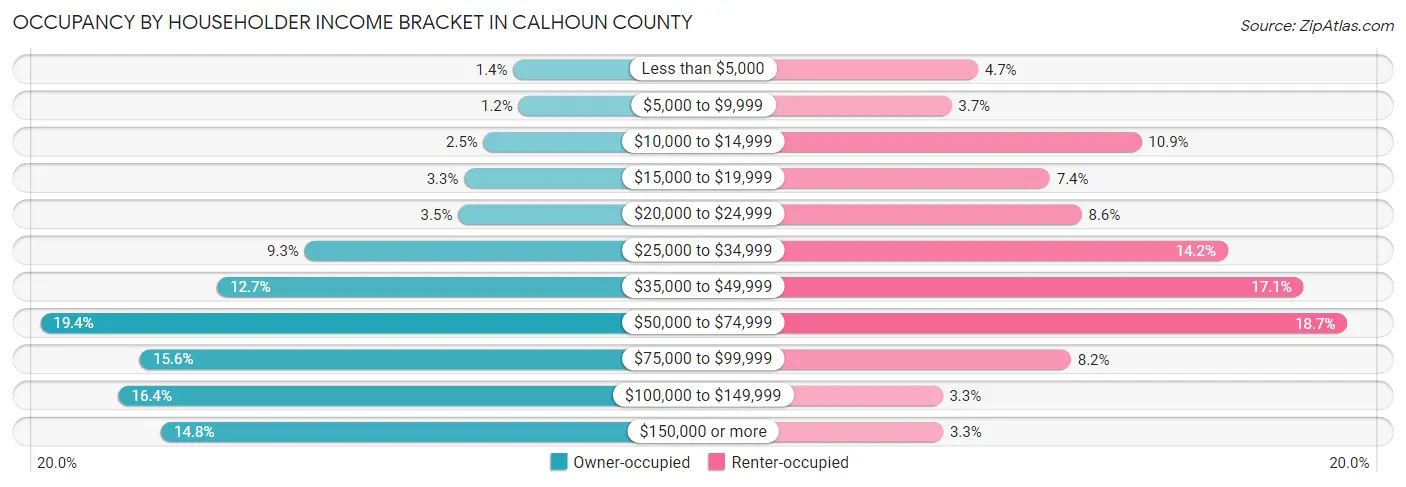
| Income Bracket | Owner-occupied | Renter-occupied |
| Less than $5,000 | 524 (1.4%) | 700 (4.7%) |
| $5,000 to $9,999 | 449 (1.2%) | 548 (3.6%) |
| $10,000 to $14,999 | 955 (2.5%) | 1,637 (10.9%) |
| $15,000 to $19,999 | 1,235 (3.3%) | 1,112 (7.4%) |
| $20,000 to $24,999 | 1,323 (3.5%) | 1,294 (8.6%) |
| $25,000 to $34,999 | 3,546 (9.3%) | 2,131 (14.2%) |
| $35,000 to $49,999 | 4,813 (12.7%) | 2,566 (17.1%) |
| $50,000 to $74,999 | 7,376 (19.4%) | 2,815 (18.7%) |
| $75,000 to $99,999 | 5,929 (15.6%) | 1,232 (8.2%) |
| $100,000 to $149,999 | 6,241 (16.4%) | 497 (3.3%) |
| $150,000 or more | 5,627 (14.8%) | 500 (3.3%) |
| Total | 38,018 (100.0%) | 15,032 (100.0%) |
Monthly Housing Cost Tiers in Calhoun County
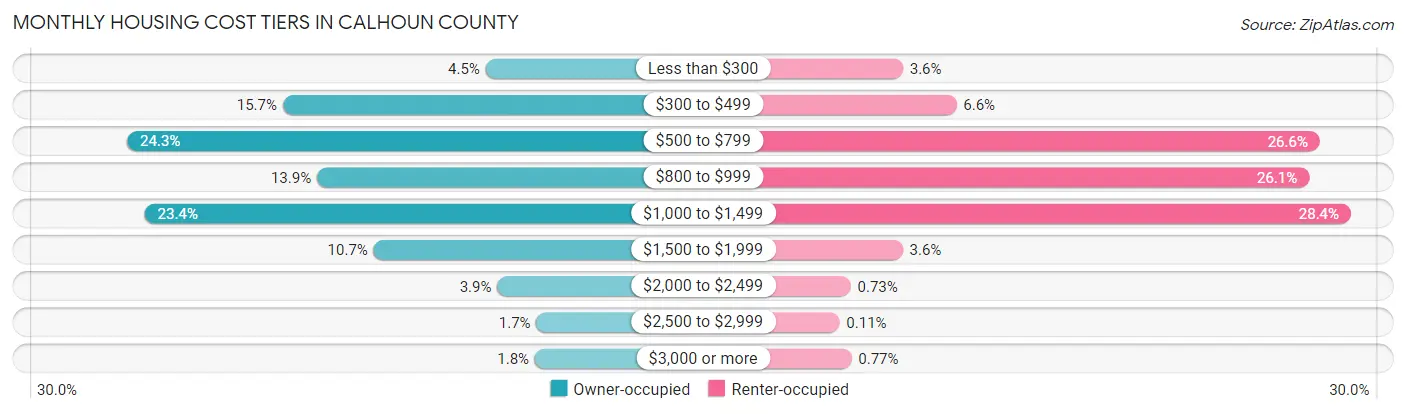
| Monthly Cost | Owner-occupied | Renter-occupied |
| Less than $300 | 1,724 (4.5%) | 542 (3.6%) |
| $300 to $499 | 5,985 (15.7%) | 987 (6.6%) |
| $500 to $799 | 9,255 (24.3%) | 4,005 (26.6%) |
| $800 to $999 | 5,265 (13.9%) | 3,916 (26.1%) |
| $1,000 to $1,499 | 8,885 (23.4%) | 4,263 (28.4%) |
| $1,500 to $1,999 | 4,077 (10.7%) | 541 (3.6%) |
| $2,000 to $2,499 | 1,479 (3.9%) | 109 (0.7%) |
| $2,500 to $2,999 | 659 (1.7%) | 16 (0.1%) |
| $3,000 or more | 689 (1.8%) | 115 (0.8%) |
| Total | 38,018 (100.0%) | 15,032 (100.0%) |
Physical Housing Characteristics in Calhoun County
Housing Structures in Calhoun County
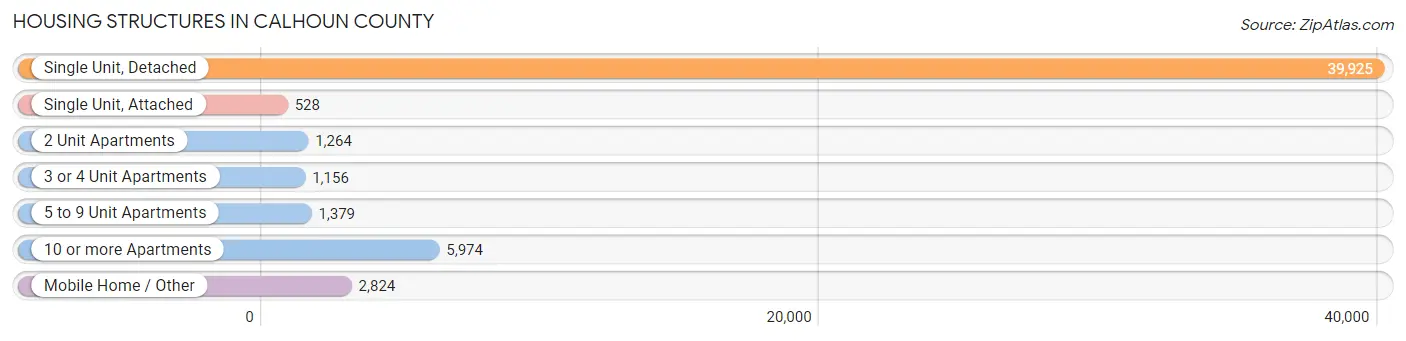
| Structure Type | # Housing Units | % Housing Units |
| Single Unit, Detached | 39,925 | 75.3% |
| Single Unit, Attached | 528 | 1.0% |
| 2 Unit Apartments | 1,264 | 2.4% |
| 3 or 4 Unit Apartments | 1,156 | 2.2% |
| 5 to 9 Unit Apartments | 1,379 | 2.6% |
| 10 or more Apartments | 5,974 | 11.3% |
| Mobile Home / Other | 2,824 | 5.3% |
| Total | 53,050 | 100.0% |
Housing Structures by Occupancy in Calhoun County
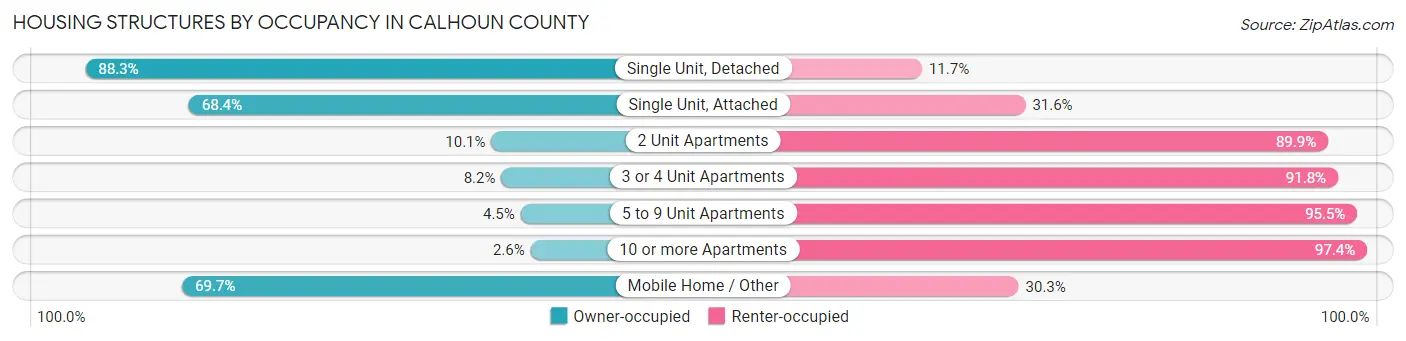
| Structure Type | Owner-occupied | Renter-occupied |
| Single Unit, Detached | 35,249 (88.3%) | 4,676 (11.7%) |
| Single Unit, Attached | 361 (68.4%) | 167 (31.6%) |
| 2 Unit Apartments | 128 (10.1%) | 1,136 (89.9%) |
| 3 or 4 Unit Apartments | 95 (8.2%) | 1,061 (91.8%) |
| 5 to 9 Unit Apartments | 62 (4.5%) | 1,317 (95.5%) |
| 10 or more Apartments | 155 (2.6%) | 5,819 (97.4%) |
| Mobile Home / Other | 1,968 (69.7%) | 856 (30.3%) |
| Total | 38,018 (71.7%) | 15,032 (28.3%) |
Housing Structures by Number of Rooms in Calhoun County
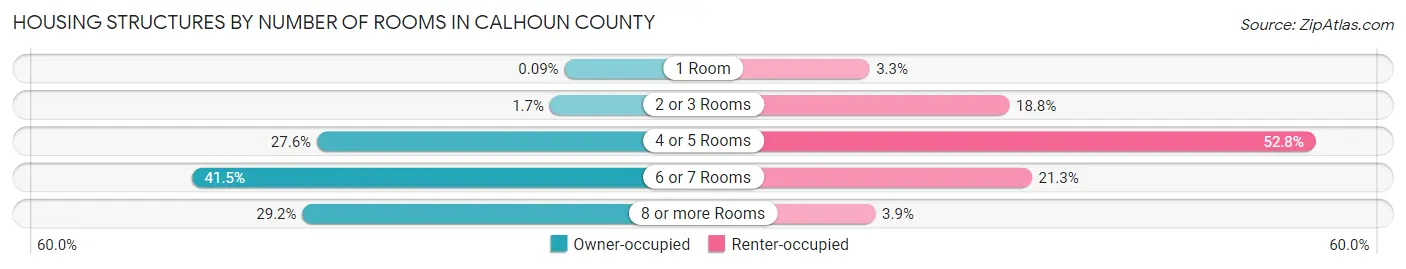
| Number of Rooms | Owner-occupied | Renter-occupied |
| 1 Room | 35 (0.1%) | 489 (3.3%) |
| 2 or 3 Rooms | 652 (1.7%) | 2,822 (18.8%) |
| 4 or 5 Rooms | 10,477 (27.6%) | 7,935 (52.8%) |
| 6 or 7 Rooms | 15,763 (41.5%) | 3,198 (21.3%) |
| 8 or more Rooms | 11,091 (29.2%) | 588 (3.9%) |
| Total | 38,018 (100.0%) | 15,032 (100.0%) |
Housing Structure by Heating Type in Calhoun County
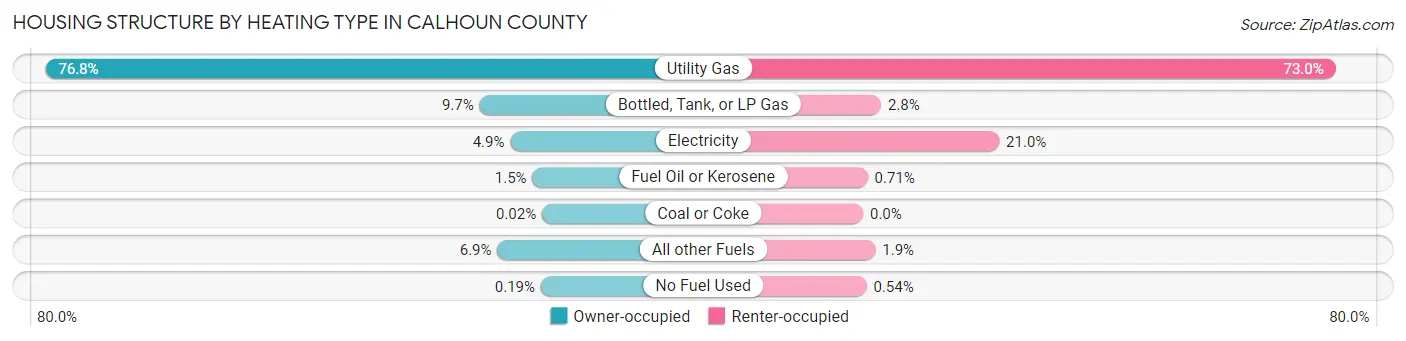
| Heating Type | Owner-occupied | Renter-occupied |
| Utility Gas | 29,193 (76.8%) | 10,979 (73.0%) |
| Bottled, Tank, or LP Gas | 3,678 (9.7%) | 418 (2.8%) |
| Electricity | 1,865 (4.9%) | 3,163 (21.0%) |
| Fuel Oil or Kerosene | 569 (1.5%) | 106 (0.7%) |
| Coal or Coke | 8 (0.0%) | 0 (0.0%) |
| All other Fuels | 2,632 (6.9%) | 285 (1.9%) |
| No Fuel Used | 73 (0.2%) | 81 (0.5%) |
| Total | 38,018 (100.0%) | 15,032 (100.0%) |
Household Vehicle Usage in Calhoun County
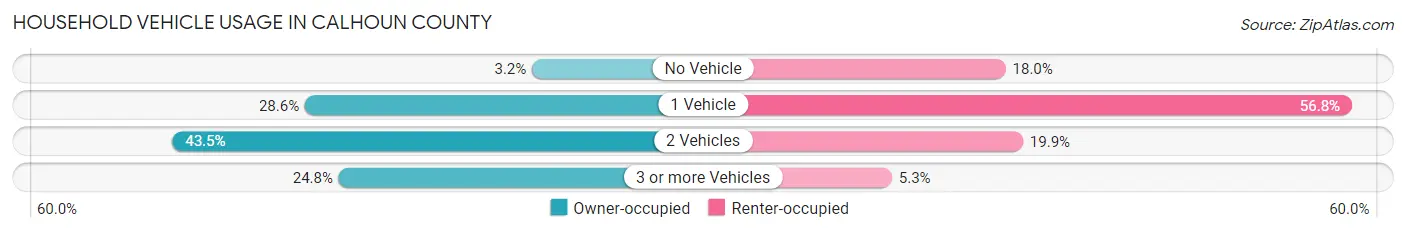
| Vehicles per Household | Owner-occupied | Renter-occupied |
| No Vehicle | 1,199 (3.2%) | 2,706 (18.0%) |
| 1 Vehicle | 10,869 (28.6%) | 8,537 (56.8%) |
| 2 Vehicles | 16,520 (43.4%) | 2,998 (19.9%) |
| 3 or more Vehicles | 9,430 (24.8%) | 791 (5.3%) |
| Total | 38,018 (100.0%) | 15,032 (100.0%) |
Real Estate & Mortgages in Calhoun County
Real Estate and Mortgage Overview in Calhoun County
| Characteristic | Without Mortgage | With Mortgage |
| Housing Units | 15,406 | 22,612 |
| Median Property Value | $117,800 | $149,200 |
| Median Household Income | $56,663 | $4,252 |
| Monthly Housing Costs | $517 | $673 |
| Real Estate Taxes | $1,941 | $648 |
Property Value by Mortgage Status in Calhoun County
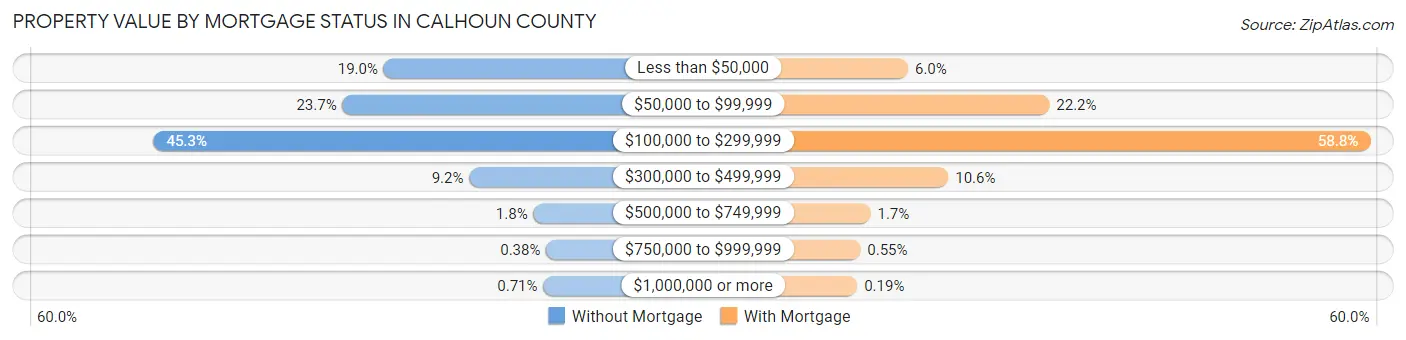
| Property Value | Without Mortgage | With Mortgage |
| Less than $50,000 | 2,920 (19.0%) | 1,356 (6.0%) |
| $50,000 to $99,999 | 3,647 (23.7%) | 5,008 (22.2%) |
| $100,000 to $299,999 | 6,973 (45.3%) | 13,298 (58.8%) |
| $300,000 to $499,999 | 1,415 (9.2%) | 2,397 (10.6%) |
| $500,000 to $749,999 | 283 (1.8%) | 386 (1.7%) |
| $750,000 to $999,999 | 59 (0.4%) | 125 (0.5%) |
| $1,000,000 or more | 109 (0.7%) | 42 (0.2%) |
| Total | 15,406 (100.0%) | 22,612 (100.0%) |
Household Income by Mortgage Status in Calhoun County
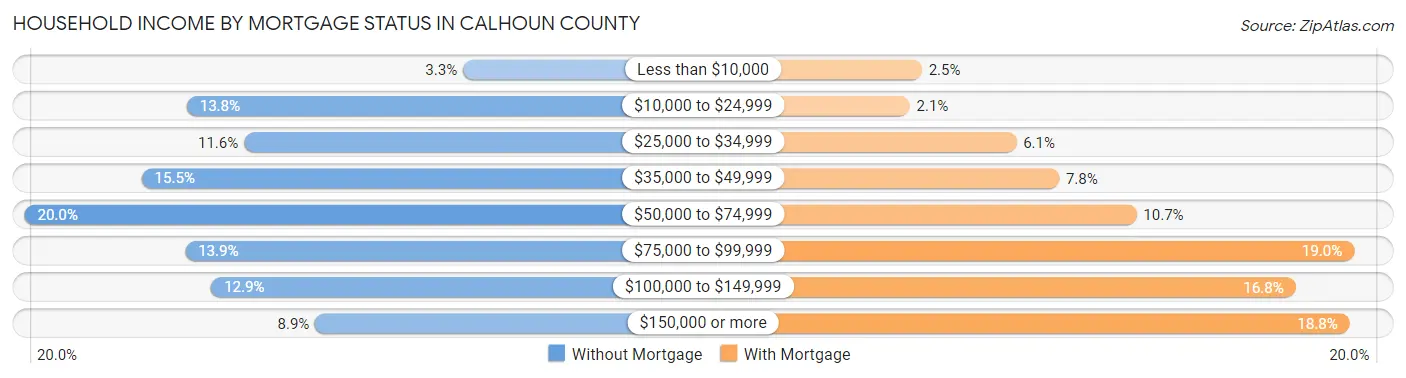
| Household Income | Without Mortgage | With Mortgage |
| Less than $10,000 | 508 (3.3%) | 569 (2.5%) |
| $10,000 to $24,999 | 2,129 (13.8%) | 465 (2.1%) |
| $25,000 to $34,999 | 1,794 (11.6%) | 1,384 (6.1%) |
| $35,000 to $49,999 | 2,394 (15.5%) | 1,752 (7.7%) |
| $50,000 to $74,999 | 3,081 (20.0%) | 2,419 (10.7%) |
| $75,000 to $99,999 | 2,139 (13.9%) | 4,295 (19.0%) |
| $100,000 to $149,999 | 1,986 (12.9%) | 3,790 (16.8%) |
| $150,000 or more | 1,375 (8.9%) | 4,255 (18.8%) |
| Total | 15,406 (100.0%) | 22,612 (100.0%) |
Property Value to Household Income Ratio in Calhoun County
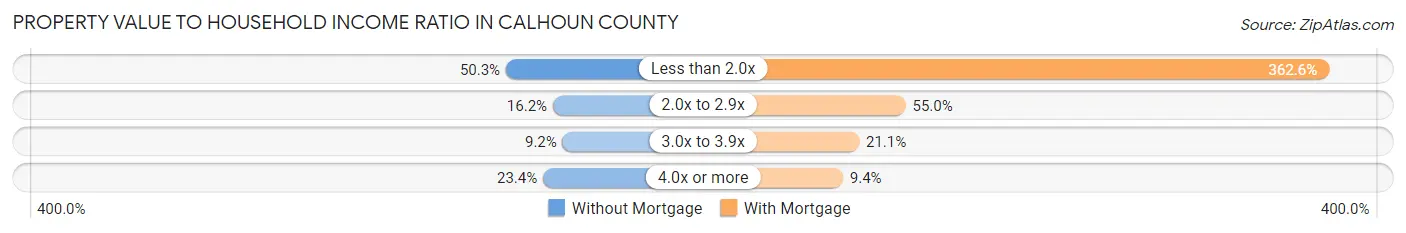
| Value-to-Income Ratio | Without Mortgage | With Mortgage |
| Less than 2.0x | 7,754 (50.3%) | 81,980 (362.6%) |
| 2.0x to 2.9x | 2,498 (16.2%) | 12,427 (55.0%) |
| 3.0x to 3.9x | 1,413 (9.2%) | 4,778 (21.1%) |
| 4.0x or more | 3,603 (23.4%) | 2,119 (9.4%) |
| Total | 15,406 (100.0%) | 22,612 (100.0%) |
Real Estate Taxes by Mortgage Status in Calhoun County
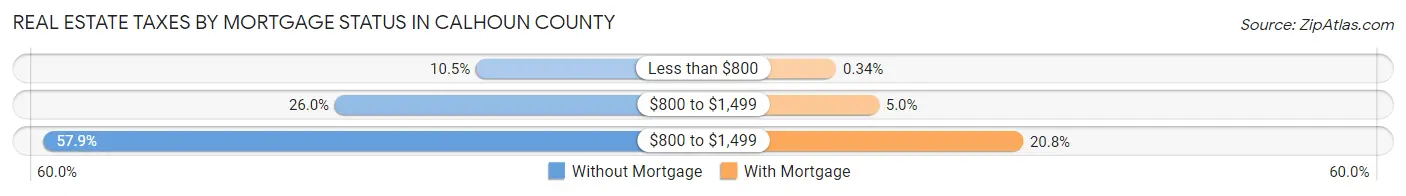
| Property Taxes | Without Mortgage | With Mortgage |
| Less than $800 | 1,620 (10.5%) | 78 (0.3%) |
| $800 to $1,499 | 4,004 (26.0%) | 1,132 (5.0%) |
| $800 to $1,499 | 8,922 (57.9%) | 4,706 (20.8%) |
| Total | 15,406 (100.0%) | 22,612 (100.0%) |
Health & Disability in Calhoun County
Health Insurance Coverage by Age in Calhoun County
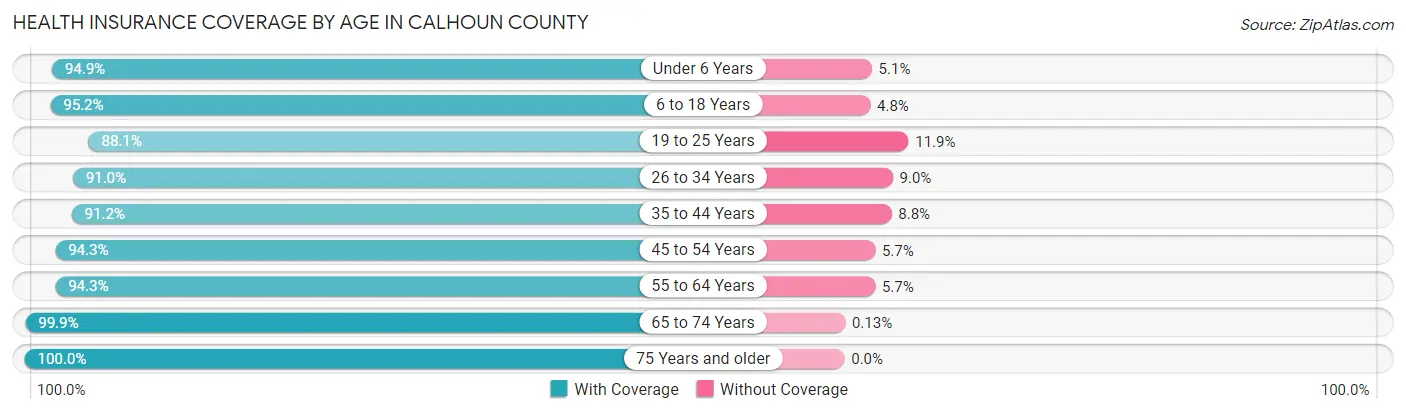
| Age Bracket | With Coverage | Without Coverage |
| Under 6 Years | 9,109 (94.9%) | 490 (5.1%) |
| 6 to 18 Years | 21,618 (95.2%) | 1,093 (4.8%) |
| 19 to 25 Years | 10,401 (88.1%) | 1,409 (11.9%) |
| 26 to 34 Years | 13,173 (91.0%) | 1,303 (9.0%) |
| 35 to 44 Years | 14,473 (91.2%) | 1,393 (8.8%) |
| 45 to 54 Years | 15,333 (94.3%) | 931 (5.7%) |
| 55 to 64 Years | 17,239 (94.3%) | 1,046 (5.7%) |
| 65 to 74 Years | 14,082 (99.9%) | 19 (0.1%) |
| 75 Years and older | 9,304 (100.0%) | 0 (0.0%) |
| Total | 124,732 (94.2%) | 7,684 (5.8%) |
Health Insurance Coverage by Citizenship Status in Calhoun County
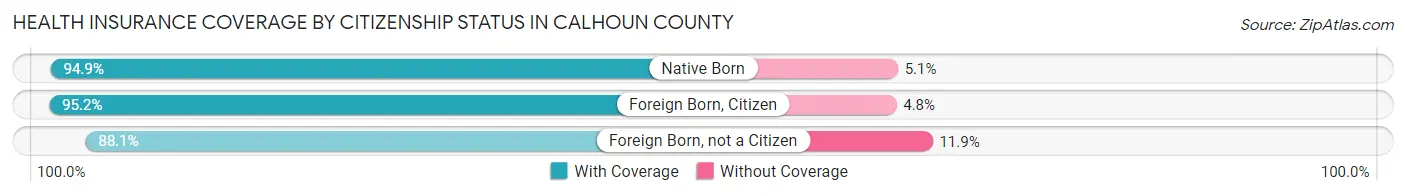
| Citizenship Status | With Coverage | Without Coverage |
| Native Born | 9,109 (94.9%) | 490 (5.1%) |
| Foreign Born, Citizen | 21,618 (95.2%) | 1,093 (4.8%) |
| Foreign Born, not a Citizen | 10,401 (88.1%) | 1,409 (11.9%) |
Health Insurance Coverage by Household Income in Calhoun County
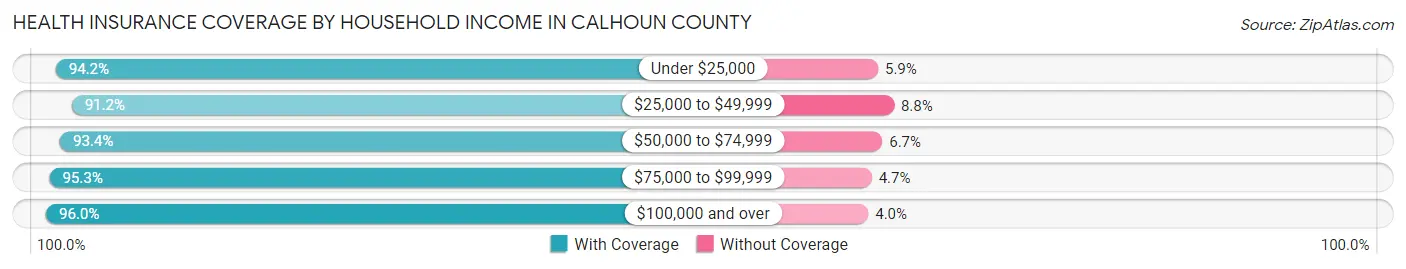
| Household Income | With Coverage | Without Coverage |
| Under $25,000 | 15,875 (94.2%) | 987 (5.9%) |
| $25,000 to $49,999 | 24,650 (91.2%) | 2,388 (8.8%) |
| $50,000 to $74,999 | 23,881 (93.3%) | 1,701 (6.7%) |
| $75,000 to $99,999 | 17,677 (95.3%) | 866 (4.7%) |
| $100,000 and over | 40,224 (96.0%) | 1,690 (4.0%) |
Public vs Private Health Insurance Coverage by Age in Calhoun County
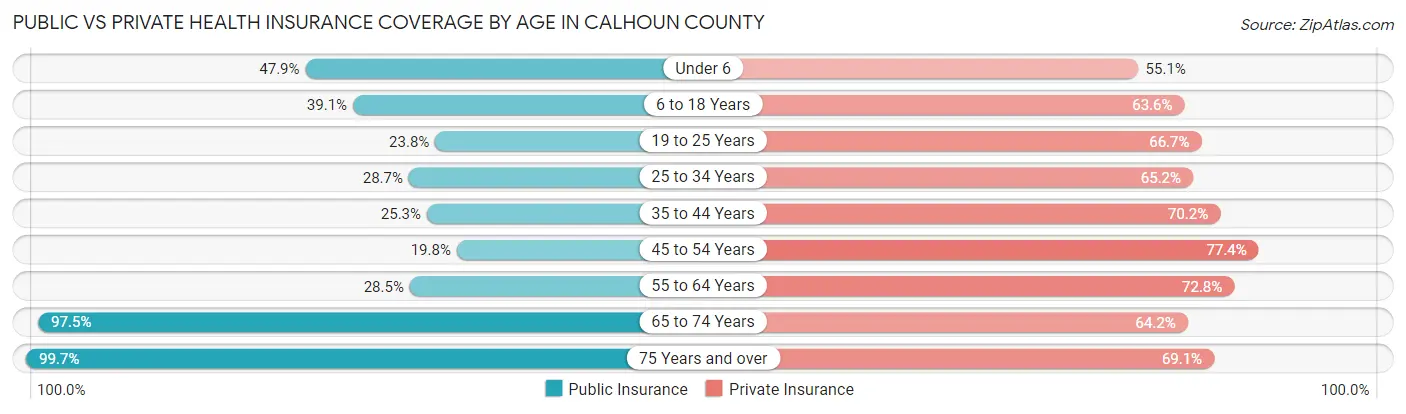
| Age Bracket | Public Insurance | Private Insurance |
| Under 6 | 4,597 (47.9%) | 5,289 (55.1%) |
| 6 to 18 Years | 8,871 (39.1%) | 14,436 (63.6%) |
| 19 to 25 Years | 2,810 (23.8%) | 7,880 (66.7%) |
| 25 to 34 Years | 4,153 (28.7%) | 9,432 (65.2%) |
| 35 to 44 Years | 4,020 (25.3%) | 11,139 (70.2%) |
| 45 to 54 Years | 3,218 (19.8%) | 12,582 (77.4%) |
| 55 to 64 Years | 5,213 (28.5%) | 13,313 (72.8%) |
| 65 to 74 Years | 13,748 (97.5%) | 9,052 (64.2%) |
| 75 Years and over | 9,278 (99.7%) | 6,426 (69.1%) |
| Total | 55,908 (42.2%) | 89,549 (67.6%) |
Disability Status by Sex by Age in Calhoun County
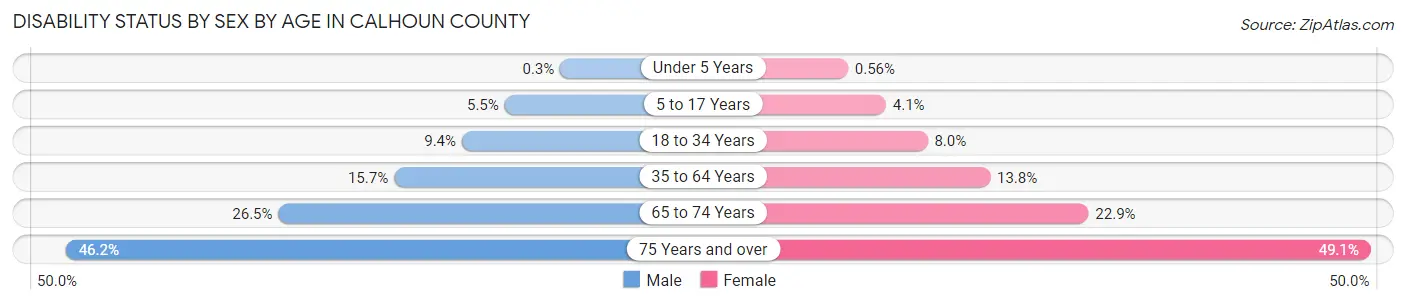
| Age Bracket | Male | Female |
| Under 5 Years | 12 (0.3%) | 21 (0.6%) |
| 5 to 17 Years | 647 (5.4%) | 446 (4.1%) |
| 18 to 34 Years | 1,311 (9.4%) | 1,119 (8.0%) |
| 35 to 64 Years | 3,919 (15.7%) | 3,507 (13.8%) |
| 65 to 74 Years | 1,766 (26.5%) | 1,699 (22.9%) |
| 75 Years and over | 1,765 (46.2%) | 2,691 (49.1%) |
Disability Class by Sex by Age in Calhoun County
Disability Class: Hearing Difficulty
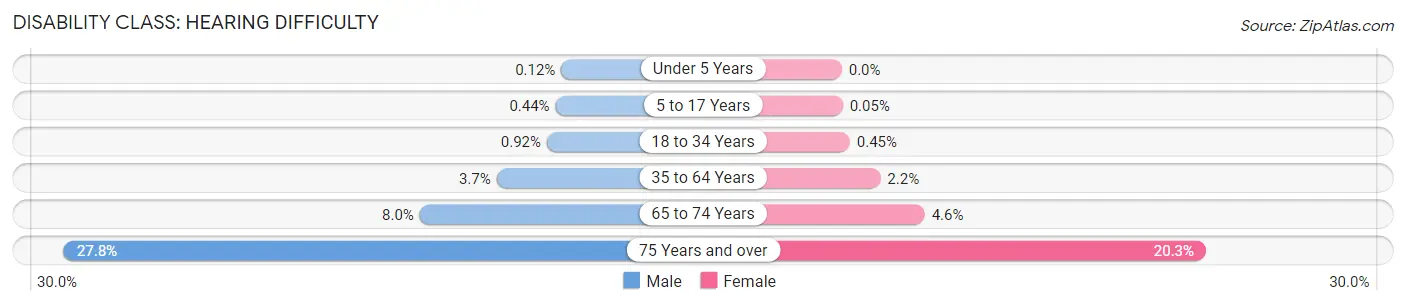
| Age Bracket | Male | Female |
| Under 5 Years | 5 (0.1%) | 0 (0.0%) |
| 5 to 17 Years | 52 (0.4%) | 6 (0.1%) |
| 18 to 34 Years | 128 (0.9%) | 64 (0.4%) |
| 35 to 64 Years | 926 (3.7%) | 548 (2.1%) |
| 65 to 74 Years | 534 (8.0%) | 343 (4.6%) |
| 75 Years and over | 1,063 (27.8%) | 1,111 (20.3%) |
Disability Class: Vision Difficulty
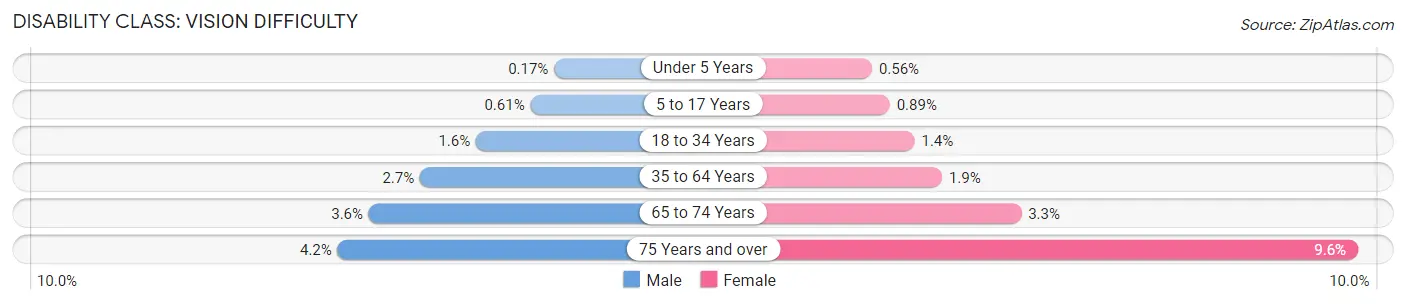
| Age Bracket | Male | Female |
| Under 5 Years | 7 (0.2%) | 21 (0.6%) |
| 5 to 17 Years | 72 (0.6%) | 97 (0.9%) |
| 18 to 34 Years | 225 (1.6%) | 190 (1.3%) |
| 35 to 64 Years | 664 (2.7%) | 475 (1.9%) |
| 65 to 74 Years | 241 (3.6%) | 247 (3.3%) |
| 75 Years and over | 160 (4.2%) | 525 (9.6%) |
Disability Class: Cognitive Difficulty
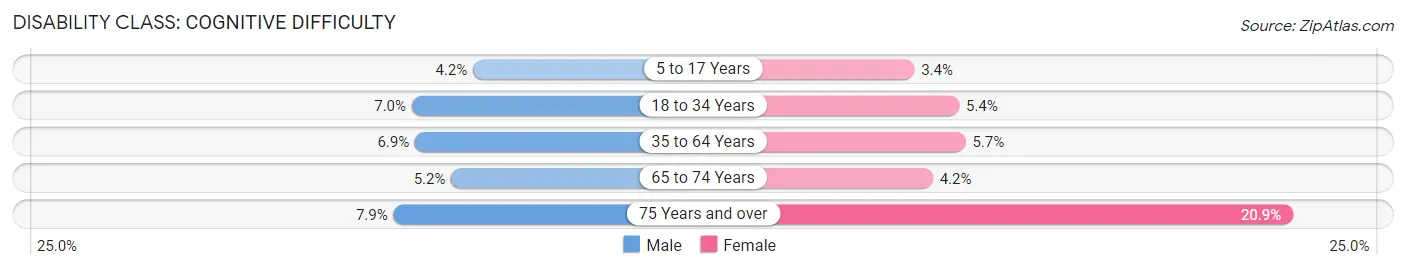
| Age Bracket | Male | Female |
| 5 to 17 Years | 497 (4.2%) | 367 (3.4%) |
| 18 to 34 Years | 978 (7.0%) | 766 (5.4%) |
| 35 to 64 Years | 1,715 (6.9%) | 1,462 (5.7%) |
| 65 to 74 Years | 347 (5.2%) | 313 (4.2%) |
| 75 Years and over | 301 (7.9%) | 1,148 (20.9%) |
Disability Class: Ambulatory Difficulty
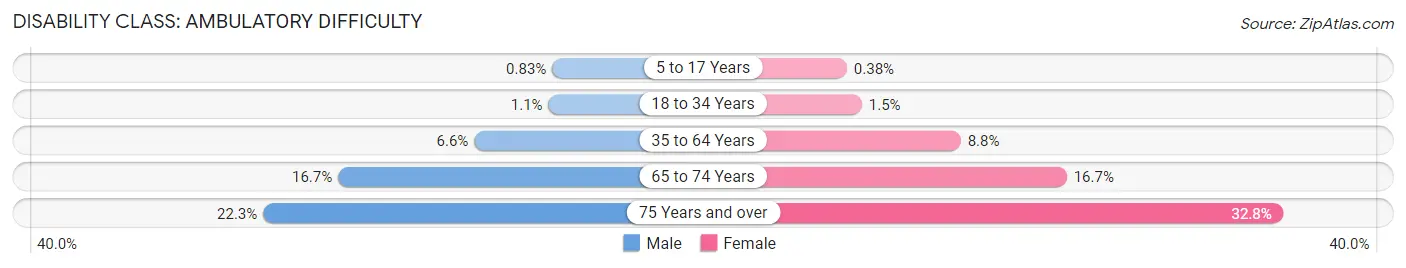
| Age Bracket | Male | Female |
| 5 to 17 Years | 99 (0.8%) | 42 (0.4%) |
| 18 to 34 Years | 155 (1.1%) | 210 (1.5%) |
| 35 to 64 Years | 1,649 (6.6%) | 2,252 (8.8%) |
| 65 to 74 Years | 1,117 (16.7%) | 1,240 (16.7%) |
| 75 Years and over | 852 (22.3%) | 1,798 (32.8%) |
Disability Class: Self-Care Difficulty
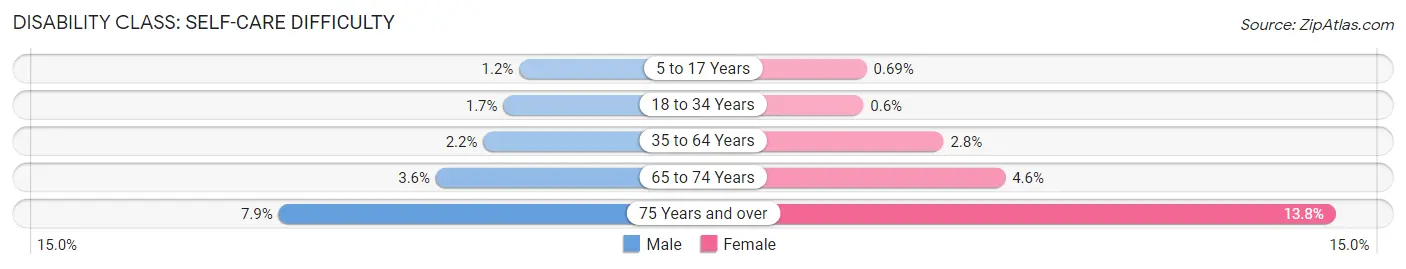
| Age Bracket | Male | Female |
| 5 to 17 Years | 146 (1.2%) | 75 (0.7%) |
| 18 to 34 Years | 232 (1.7%) | 85 (0.6%) |
| 35 to 64 Years | 557 (2.2%) | 721 (2.8%) |
| 65 to 74 Years | 237 (3.5%) | 338 (4.5%) |
| 75 Years and over | 303 (7.9%) | 754 (13.8%) |
Technology Access in Calhoun County
Computing Device Access in Calhoun County
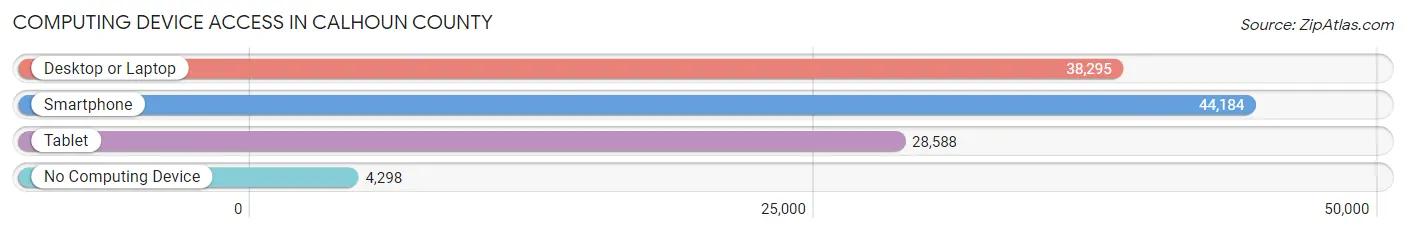
| Device Type | # Households | % Households |
| Desktop or Laptop | 38,295 | 72.2% |
| Smartphone | 44,184 | 83.3% |
| Tablet | 28,588 | 53.9% |
| No Computing Device | 4,298 | 8.1% |
| Total | 53,050 | 100.0% |
Internet Access in Calhoun County
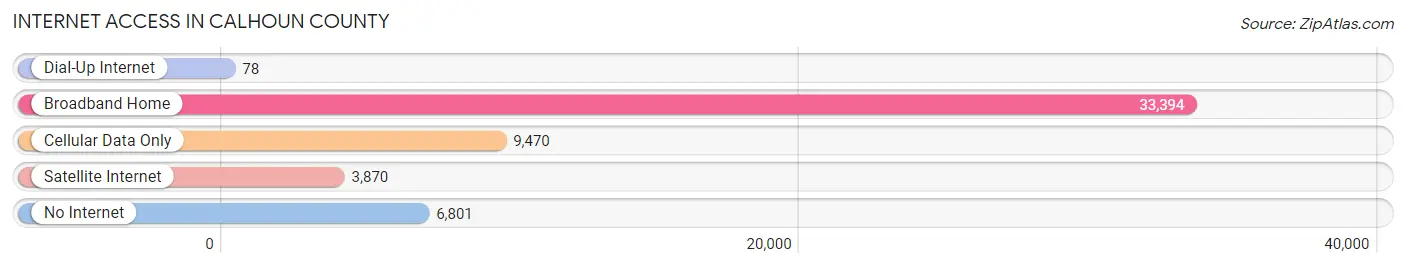
| Internet Type | # Households | % Households |
| Dial-Up Internet | 78 | 0.2% |
| Broadband Home | 33,394 | 62.9% |
| Cellular Data Only | 9,470 | 17.8% |
| Satellite Internet | 3,870 | 7.3% |
| No Internet | 6,801 | 12.8% |
| Total | 53,050 | 100.0% |
Calhoun County Summary
Calhoun County is located in the south-central region of Michigan, and is part of the Battle Creek Metropolitan Statistical Area. The county is bordered by Kalamazoo County to the north, Jackson County to the east, Eaton County to the south, and Barry County to the west. The county seat is Marshall, and the largest city is Battle Creek. As of the 2010 census, the population of Calhoun County was 136,146.
History
Calhoun County was established in 1829 and named after John C. Calhoun, the seventh Vice President of the United States. The county was originally part of Kalamazoo County, but was split off in 1829. The county was initially divided into two townships, Marshall and Emmett. In 1833, the townships of Albion and Newton were added, and in 1839, the townships of Bedford and Pennfield were added.
The county was largely agricultural in the 19th century, with the main crops being wheat, corn, and oats. The county also had a number of sawmills and gristmills, as well as a number of small manufacturing businesses.
In the late 19th century, the county began to industrialize, with the Battle Creek Sanitarium and the Battle Creek Toasted Corn Flake Company (now known as Kellogg's) being established in the county. The county also became a major center for the automotive industry, with the establishment of the King Motor Car Company in Battle Creek in 1908.
Geography
Calhoun County is located in the south-central region of Michigan, and is part of the Battle Creek Metropolitan Statistical Area. The county is bordered by Kalamazoo County to the north, Jackson County to the east, Eaton County to the south, and Barry County to the west. The county has a total area of 576 square miles, of which 573 square miles is land and 3 square miles is water.
The county is mostly flat, with some rolling hills in the northern and eastern parts of the county. The Kalamazoo River runs through the county, and there are several small lakes and ponds scattered throughout the county.
Economy
Calhoun County has a diverse economy, with a mix of manufacturing, agriculture, and service industries. The county is home to several major employers, including Kellogg's, Denso Manufacturing, and the Battle Creek VA Medical Center.
Agriculture is an important part of the county's economy, with the main crops being corn, soybeans, wheat, and hay. The county also has a number of livestock farms, including dairy, beef, and poultry farms.
The county also has a number of manufacturing businesses, including automotive parts, food processing, and medical equipment. The county is also home to a number of service industries, including healthcare, education, and retail.
Demographics
As of the 2010 census, the population of Calhoun County was 136,146. The racial makeup of the county was 87.3% White, 8.2% African American, 0.7% Native American, 1.2% Asian, 0.2% Pacific Islander, 0.7% from other races, and 1.9% from two or more races. Hispanic or Latino of any race were 2.7% of the population.
The median income for a household in the county was $45,945, and the median income for a family was $54,945. The per capita income for the county was $22,945. About 11.2% of the population was below the poverty line.
Common Questions
What is the Total Population of Calhoun County?
Total Population of Calhoun County is 134,011.
What is the Total Male Population of Calhoun County?
Total Male Population of Calhoun County is 66,230.
What is the Total Female Population of Calhoun County?
Total Female Population of Calhoun County is 67,781.
What is the Ratio of Males per 100 Females in Calhoun County?
There are 97.71 Males per 100 Females in Calhoun County.
What is the Ratio of Females per 100 Males in Calhoun County?
There are 102.34 Females per 100 Males in Calhoun County.
What is the Median Population Age in Calhoun County?
Median Population Age in Calhoun County is 40.0 Years.
What is the Average Family Size in Calhoun County
Average Family Size in Calhoun County is 3.1 People.
What is the Average Household Size in Calhoun County
Average Household Size in Calhoun County is 2.5 People.
What is Per Capita Income in Calhoun County?
Per Capita income in Calhoun County is $32,047.
What is the Median Family Income in Calhoun County?
Median Family Income in Calhoun County is $74,187.
What is the Median Household income in Calhoun County?
Median Household Income in Calhoun County is $58,191.
What is Income or Wage Gap in Calhoun County?
Income or Wage Gap in Calhoun County is 24.0%.
Women in Calhoun County earn 76.0 cents for every dollar earned by a man.
What is Family Income Deficit in Calhoun County?
Family Income Deficit in Calhoun County is $10,219.
Families that are below poverty line in Calhoun County earn $10,219 less on average than the poverty threshold level.
What is Inequality or Gini Index in Calhoun County?
Inequality or Gini Index in Calhoun County is 0.44.
How Large is the Labor Force in Calhoun County?
There are 64,009 People in the Labor Forcein in Calhoun County.
What is the Percentage of People in the Labor Force in Calhoun County?
59.7% of People are in the Labor Force in Calhoun County.
What is the Unemployment Rate in Calhoun County?
Unemployment Rate in Calhoun County is 6.8%.