Berrien County, MI
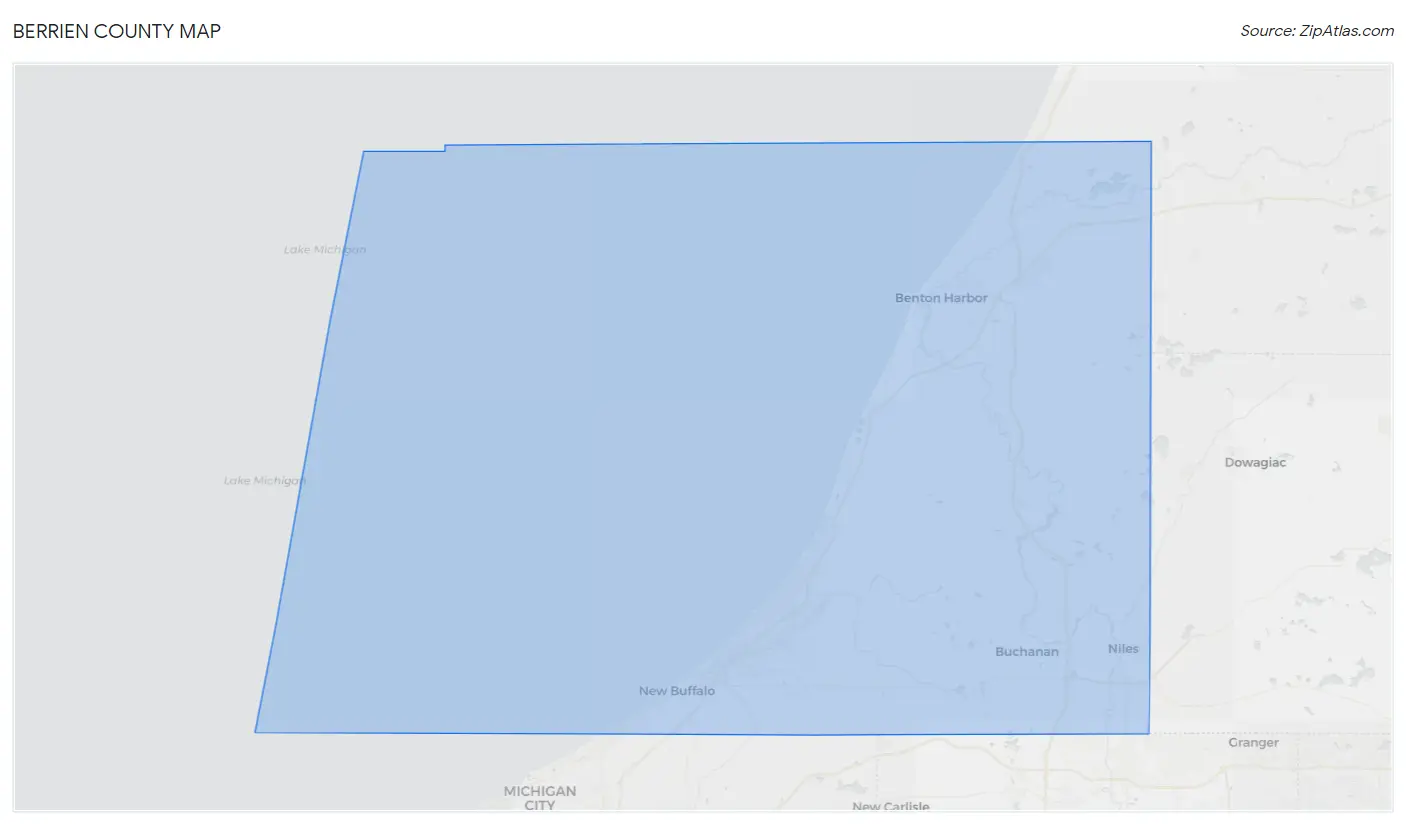
Berrien County Map
Berrien County Overview
153,938
TOTAL POPULATION
75,863
MALE POPULATION
78,075
FEMALE POPULATION
97.17
MALES / 100 FEMALES
102.92
FEMALES / 100 MALES
42.5
MEDIAN AGE
3.0
AVG FAMILY SIZE
2.4
AVG HOUSEHOLD SIZE
$36,764
PER CAPITA INCOME
$79,042
AVG FAMILY INCOME
$60,379
AVG HOUSEHOLD INCOME
37.9%
WAGE / INCOME GAP [ % ]
62.1¢/ $1
WAGE / INCOME GAP [ $ ]
$11,027
FAMILY INCOME DEFICIT
0.48
INEQUALITY / GINI INDEX
76,114
LABOR FORCE [ PEOPLE ]
61.1%
PERCENT IN LABOR FORCE
6.6%
UNEMPLOYMENT RATE
Berrien County Area Codes
Race in Berrien County
The most populous races in Berrien County are White / Caucasian (117,706 | 76.5%), Black / African American (21,616 | 14.0%), and Hispanic or Latino (9,083 | 5.9%).
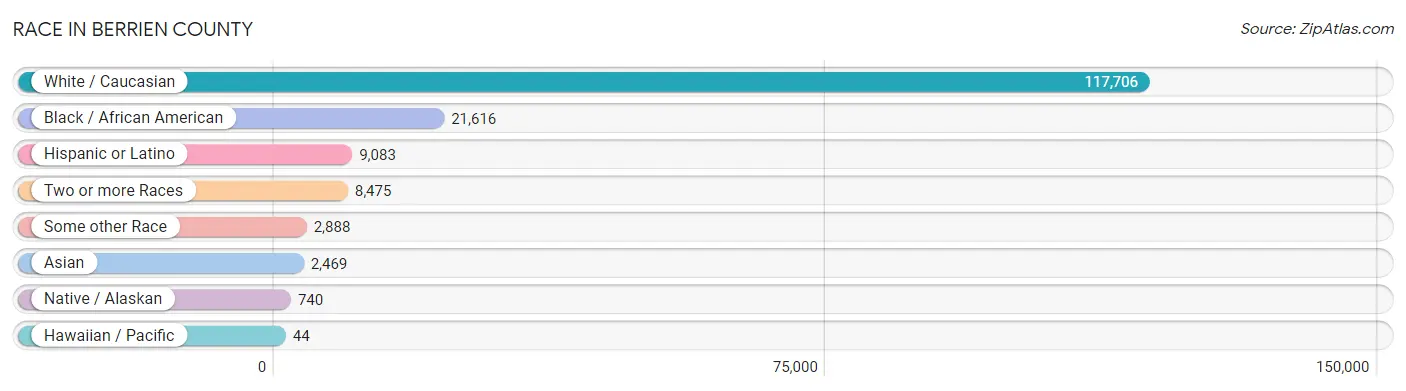
| Race | # Population | % Population |
| Asian | 2,469 | 1.6% |
| Black / African American | 21,616 | 14.0% |
| Hawaiian / Pacific | 44 | 0.0% |
| Hispanic or Latino | 9,083 | 5.9% |
| Native / Alaskan | 740 | 0.5% |
| White / Caucasian | 117,706 | 76.5% |
| Two or more Races | 8,475 | 5.5% |
| Some other Race | 2,888 | 1.9% |
| Total | 153,938 | 100.0% |
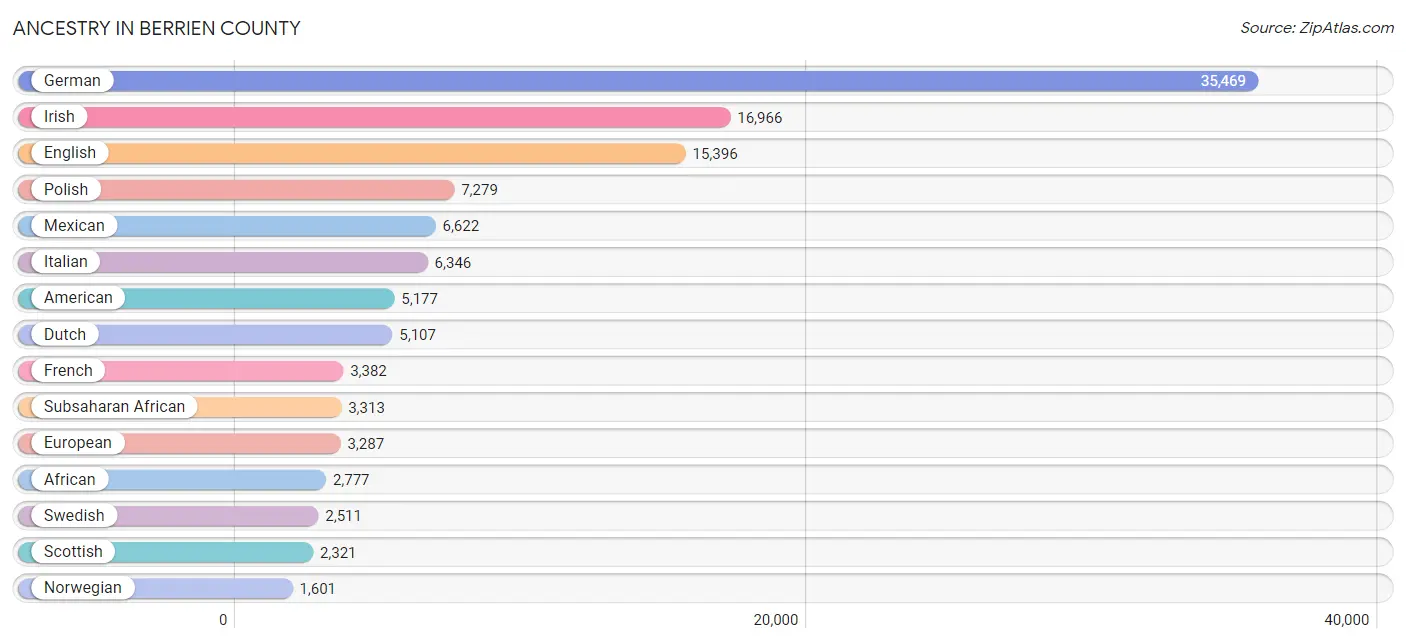
Ancestry in Berrien County
The most populous ancestries reported in Berrien County are German (35,469 | 23.0%), Irish (16,966 | 11.0%), English (15,396 | 10.0%), Polish (7,279 | 4.7%), and Mexican (6,622 | 4.3%), together accounting for 53.1% of all Berrien County residents.
| Ancestry | # Population | % Population |
| African | 2,777 | 1.8% |
| Albanian | 24 | 0.0% |
| American | 5,177 | 3.4% |
| Arab | 235 | 0.2% |
| Argentinean | 123 | 0.1% |
| Armenian | 52 | 0.0% |
| Assyrian / Chaldean / Syriac | 6 | 0.0% |
| Australian | 12 | 0.0% |
| Austrian | 181 | 0.1% |
| Bahamian | 34 | 0.0% |
| Barbadian | 4 | 0.0% |
| Belgian | 270 | 0.2% |
| Belizean | 13 | 0.0% |
| Bhutanese | 172 | 0.1% |
| Blackfeet | 175 | 0.1% |
| Brazilian | 199 | 0.1% |
| British | 714 | 0.5% |
| British West Indian | 47 | 0.0% |
| Burmese | 475 | 0.3% |
| Cajun | 13 | 0.0% |
| Canadian | 366 | 0.2% |
| Celtic | 6 | 0.0% |
| Central American | 156 | 0.1% |
| Central American Indian | 40 | 0.0% |
| Cherokee | 297 | 0.2% |
| Chickasaw | 9 | 0.0% |
| Chippewa | 312 | 0.2% |
| Choctaw | 40 | 0.0% |
| Colombian | 112 | 0.1% |
| Comanche | 37 | 0.0% |
| Costa Rican | 16 | 0.0% |
| Creek | 11 | 0.0% |
| Croatian | 239 | 0.2% |
| Cuban | 333 | 0.2% |
| Czech | 1,154 | 0.7% |
| Czechoslovakian | 84 | 0.1% |
| Danish | 592 | 0.4% |
| Dominican | 112 | 0.1% |
| Dutch | 5,107 | 3.3% |
| Eastern European | 346 | 0.2% |
| Ecuadorian | 4 | 0.0% |
| Egyptian | 4 | 0.0% |
| English | 15,396 | 10.0% |
| Estonian | 4 | 0.0% |
| Ethiopian | 24 | 0.0% |
| European | 3,287 | 2.1% |
| Filipino | 39 | 0.0% |
| Finnish | 369 | 0.2% |
| French | 3,382 | 2.2% |
| French American Indian | 16 | 0.0% |
| French Canadian | 699 | 0.4% |
| German | 35,469 | 23.0% |
| Ghanaian | 80 | 0.1% |
| Greek | 397 | 0.3% |
| Guamanian / Chamorro | 13 | 0.0% |
| Guatemalan | 56 | 0.0% |
| Guyanese | 10 | 0.0% |
| Haitian | 138 | 0.1% |
| Hmong | 2 | 0.0% |
| Honduran | 27 | 0.0% |
| Hungarian | 1,120 | 0.7% |
| Icelander | 15 | 0.0% |
| Indian (Asian) | 469 | 0.3% |
| Indonesian | 59 | 0.0% |
| Inupiat | 9 | 0.0% |
| Iranian | 38 | 0.0% |
| Irish | 16,966 | 11.0% |
| Iroquois | 30 | 0.0% |
| Italian | 6,346 | 4.1% |
| Jamaican | 130 | 0.1% |
| Japanese | 6 | 0.0% |
| Kenyan | 19 | 0.0% |
| Kiowa | 24 | 0.0% |
| Korean | 1,267 | 0.8% |
| Laotian | 277 | 0.2% |
| Latvian | 25 | 0.0% |
| Lebanese | 89 | 0.1% |
| Lithuanian | 492 | 0.3% |
| Luxembourger | 21 | 0.0% |
| Macedonian | 38 | 0.0% |
| Malaysian | 11 | 0.0% |
| Maltese | 41 | 0.0% |
| Mexican | 6,622 | 4.3% |
| Mexican American Indian | 289 | 0.2% |
| Mongolian | 8 | 0.0% |
| Moroccan | 2 | 0.0% |
| Native Hawaiian | 21 | 0.0% |
| Nicaraguan | 20 | 0.0% |
| Nigerian | 18 | 0.0% |
| Northern European | 99 | 0.1% |
| Norwegian | 1,601 | 1.0% |
| Okinawan | 15 | 0.0% |
| Ottawa | 18 | 0.0% |
| Pakistani | 61 | 0.0% |
| Palestinian | 89 | 0.1% |
| Panamanian | 31 | 0.0% |
| Pennsylvania German | 136 | 0.1% |
| Peruvian | 189 | 0.1% |
| Pima | 15 | 0.0% |
| Polish | 7,279 | 4.7% |
| Portuguese | 202 | 0.1% |
| Potawatomi | 292 | 0.2% |
| Pueblo | 1 | 0.0% |
| Puerto Rican | 731 | 0.5% |
| Romanian | 80 | 0.1% |
| Russian | 1,078 | 0.7% |
| Salvadoran | 6 | 0.0% |
| Samoan | 42 | 0.0% |
| Scandinavian | 444 | 0.3% |
| Scotch-Irish | 808 | 0.5% |
| Scottish | 2,321 | 1.5% |
| Seminole | 20 | 0.0% |
| Serbian | 185 | 0.1% |
| Sioux | 16 | 0.0% |
| Slavic | 19 | 0.0% |
| Slovak | 402 | 0.3% |
| Slovene | 20 | 0.0% |
| South African | 81 | 0.1% |
| South American | 660 | 0.4% |
| Spaniard | 104 | 0.1% |
| Spanish | 119 | 0.1% |
| Sri Lankan | 191 | 0.1% |
| Subsaharan African | 3,313 | 2.1% |
| Sudanese | 3 | 0.0% |
| Swedish | 2,511 | 1.6% |
| Swiss | 669 | 0.4% |
| Syrian | 21 | 0.0% |
| Thai | 968 | 0.6% |
| Trinidadian and Tobagonian | 39 | 0.0% |
| Turkish | 5 | 0.0% |
| Ugandan | 33 | 0.0% |
| Ukrainian | 379 | 0.3% |
| Venezuelan | 232 | 0.2% |
| Welsh | 1,071 | 0.7% |
| West Indian | 70 | 0.1% |
| Yugoslavian | 98 | 0.1% | View All 136 Rows |
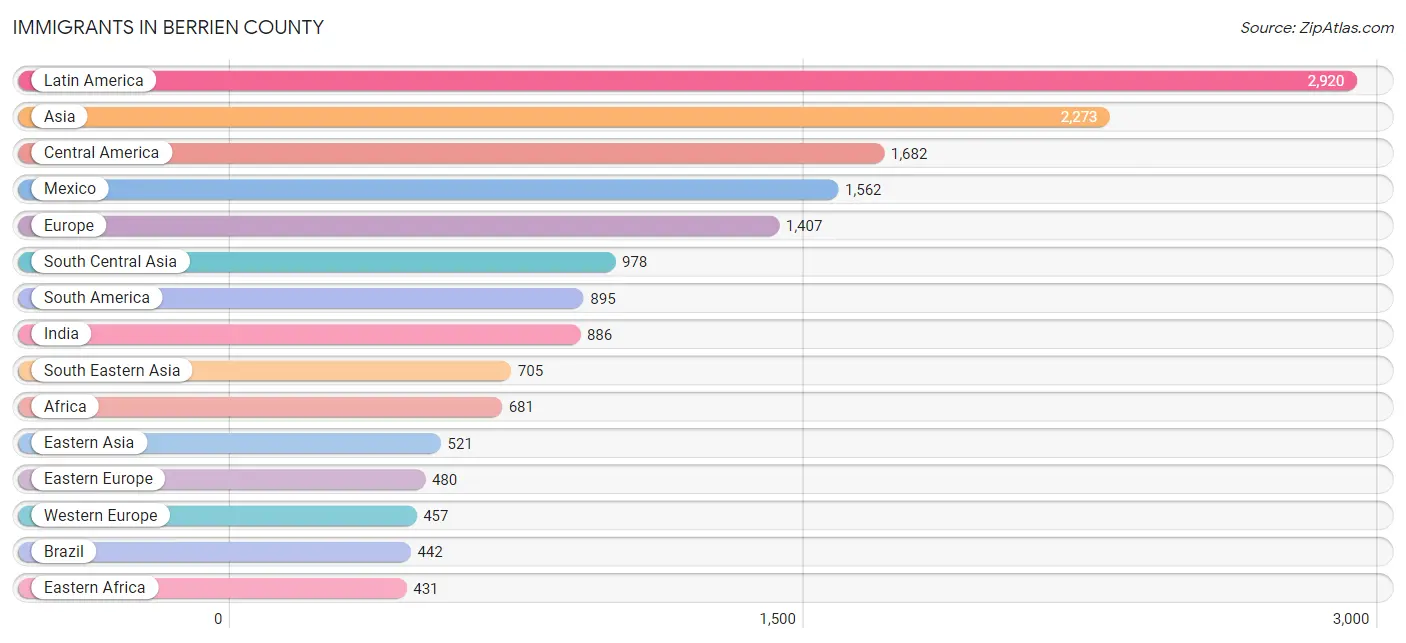
Immigrants in Berrien County
The most numerous immigrant groups reported in Berrien County came from Latin America (2,920 | 1.9%), Asia (2,273 | 1.5%), Central America (1,682 | 1.1%), Mexico (1,562 | 1.0%), and Europe (1,407 | 0.9%), together accounting for 6.4% of all Berrien County residents.
| Immigration Origin | # Population | % Population |
| Africa | 681 | 0.4% |
| Albania | 24 | 0.0% |
| Argentina | 122 | 0.1% |
| Asia | 2,273 | 1.5% |
| Australia | 35 | 0.0% |
| Austria | 11 | 0.0% |
| Bahamas | 23 | 0.0% |
| Bangladesh | 10 | 0.0% |
| Barbados | 4 | 0.0% |
| Belize | 13 | 0.0% |
| Bolivia | 11 | 0.0% |
| Brazil | 442 | 0.3% |
| Cambodia | 6 | 0.0% |
| Cameroon | 27 | 0.0% |
| Canada | 408 | 0.3% |
| Caribbean | 343 | 0.2% |
| Central America | 1,682 | 1.1% |
| China | 243 | 0.2% |
| Colombia | 47 | 0.0% |
| Costa Rica | 48 | 0.0% |
| Croatia | 11 | 0.0% |
| Cuba | 114 | 0.1% |
| Czechoslovakia | 11 | 0.0% |
| Dominican Republic | 76 | 0.1% |
| Eastern Africa | 431 | 0.3% |
| Eastern Asia | 521 | 0.3% |
| Eastern Europe | 480 | 0.3% |
| Egypt | 8 | 0.0% |
| England | 89 | 0.1% |
| Ethiopia | 19 | 0.0% |
| Europe | 1,407 | 0.9% |
| France | 31 | 0.0% |
| Germany | 365 | 0.2% |
| Ghana | 83 | 0.1% |
| Greece | 7 | 0.0% |
| Guatemala | 31 | 0.0% |
| Guyana | 18 | 0.0% |
| Haiti | 23 | 0.0% |
| Honduras | 3 | 0.0% |
| Hong Kong | 6 | 0.0% |
| Hungary | 15 | 0.0% |
| India | 886 | 0.6% |
| Indonesia | 25 | 0.0% |
| Iran | 36 | 0.0% |
| Ireland | 11 | 0.0% |
| Israel | 1 | 0.0% |
| Italy | 116 | 0.1% |
| Jamaica | 42 | 0.0% |
| Japan | 5 | 0.0% |
| Jordan | 9 | 0.0% |
| Kenya | 87 | 0.1% |
| Korea | 273 | 0.2% |
| Laos | 7 | 0.0% |
| Latin America | 2,920 | 1.9% |
| Lebanon | 43 | 0.0% |
| Lithuania | 14 | 0.0% |
| Malaysia | 58 | 0.0% |
| Mexico | 1,562 | 1.0% |
| Middle Africa | 27 | 0.0% |
| Morocco | 12 | 0.0% |
| Netherlands | 50 | 0.0% |
| Nicaragua | 18 | 0.0% |
| Nigeria | 12 | 0.0% |
| Northern Africa | 20 | 0.0% |
| Northern Europe | 314 | 0.2% |
| Norway | 45 | 0.0% |
| Oceania | 89 | 0.1% |
| Pakistan | 25 | 0.0% |
| Panama | 7 | 0.0% |
| Peru | 106 | 0.1% |
| Philippines | 365 | 0.2% |
| Poland | 230 | 0.2% |
| Portugal | 28 | 0.0% |
| Romania | 37 | 0.0% |
| Russia | 76 | 0.1% |
| Scotland | 5 | 0.0% |
| Serbia | 11 | 0.0% |
| Singapore | 12 | 0.0% |
| South Africa | 106 | 0.1% |
| South America | 895 | 0.6% |
| South Central Asia | 978 | 0.6% |
| South Eastern Asia | 705 | 0.5% |
| Southern Europe | 156 | 0.1% |
| Spain | 5 | 0.0% |
| Sri Lanka | 21 | 0.0% |
| St. Vincent and the Grenadines | 6 | 0.0% |
| Sweden | 29 | 0.0% |
| Taiwan | 23 | 0.0% |
| Thailand | 57 | 0.0% |
| Trinidad and Tobago | 31 | 0.0% |
| Turkey | 4 | 0.0% |
| Uganda | 17 | 0.0% |
| Ukraine | 7 | 0.0% |
| Uruguay | 9 | 0.0% |
| Venezuela | 136 | 0.1% |
| Vietnam | 160 | 0.1% |
| Western Africa | 95 | 0.1% |
| Western Asia | 69 | 0.0% |
| Western Europe | 457 | 0.3% | View All 99 Rows |
Sex and Age in Berrien County
Sex and Age in Berrien County
The most populous age groups in Berrien County are 60 to 64 Years (6,049 | 8.0%) for men and 60 to 64 Years (6,065 | 7.8%) for women.
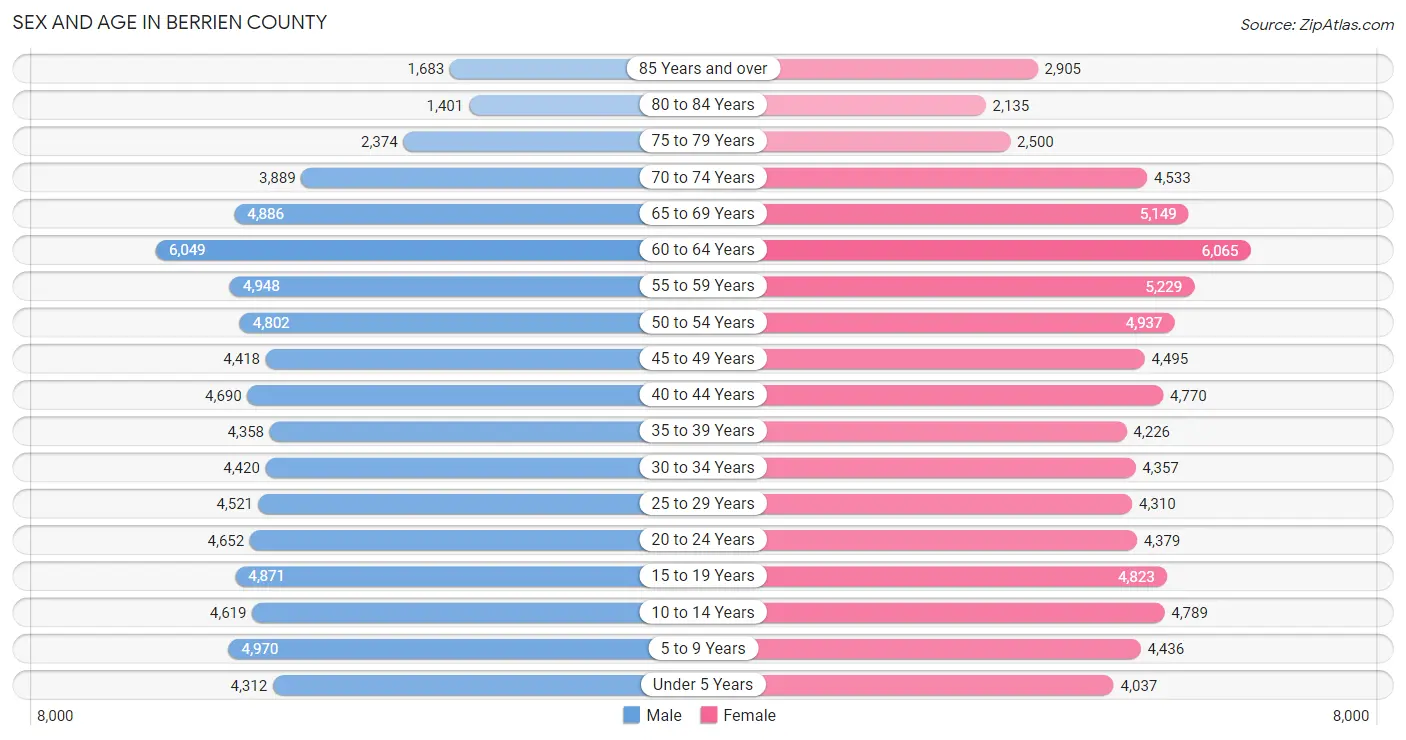
| Age Bracket | Male | Female |
| Under 5 Years | 4,312 (5.7%) | 4,037 (5.2%) |
| 5 to 9 Years | 4,970 (6.6%) | 4,436 (5.7%) |
| 10 to 14 Years | 4,619 (6.1%) | 4,789 (6.1%) |
| 15 to 19 Years | 4,871 (6.4%) | 4,823 (6.2%) |
| 20 to 24 Years | 4,652 (6.1%) | 4,379 (5.6%) |
| 25 to 29 Years | 4,521 (6.0%) | 4,310 (5.5%) |
| 30 to 34 Years | 4,420 (5.8%) | 4,357 (5.6%) |
| 35 to 39 Years | 4,358 (5.7%) | 4,226 (5.4%) |
| 40 to 44 Years | 4,690 (6.2%) | 4,770 (6.1%) |
| 45 to 49 Years | 4,418 (5.8%) | 4,495 (5.8%) |
| 50 to 54 Years | 4,802 (6.3%) | 4,937 (6.3%) |
| 55 to 59 Years | 4,948 (6.5%) | 5,229 (6.7%) |
| 60 to 64 Years | 6,049 (8.0%) | 6,065 (7.8%) |
| 65 to 69 Years | 4,886 (6.4%) | 5,149 (6.6%) |
| 70 to 74 Years | 3,889 (5.1%) | 4,533 (5.8%) |
| 75 to 79 Years | 2,374 (3.1%) | 2,500 (3.2%) |
| 80 to 84 Years | 1,401 (1.8%) | 2,135 (2.7%) |
| 85 Years and over | 1,683 (2.2%) | 2,905 (3.7%) |
| Total | 75,863 (100.0%) | 78,075 (100.0%) |
Families and Households in Berrien County
Median Family Size in Berrien County
The median family size in Berrien County is 2.95 persons per family, with single female/mother families (8,105 | 19.9%) accounting for the largest median family size of 3.09 persons per family. On the other hand, single male/father families (2,985 | 7.3%) represent the smallest median family size with 2.83 persons per family.
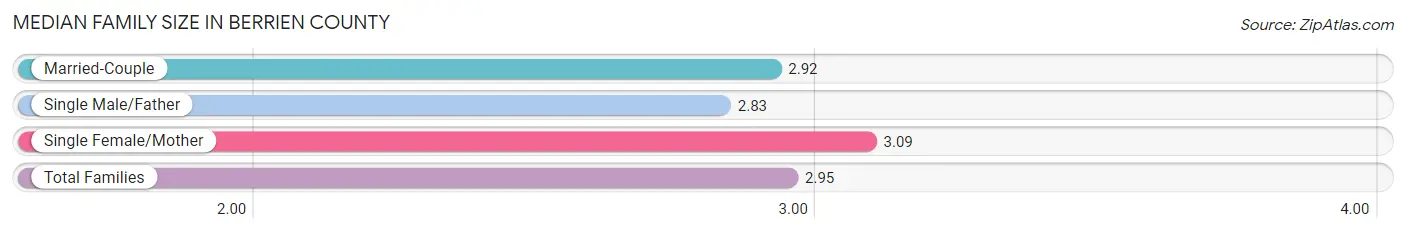
| Family Type | # Families | Family Size |
| Married-Couple | 29,648 (72.8%) | 2.92 |
| Single Male/Father | 2,985 (7.3%) | 2.83 |
| Single Female/Mother | 8,105 (19.9%) | 3.09 |
| Total Families | 40,738 (100.0%) | 2.95 |
Median Household Size in Berrien County
The median household size in Berrien County is 2.38 persons per household, with single female/mother households (8,105 | 12.8%) accounting for the largest median household size of 3.3 persons per household. non-family households (22,774 | 35.9%) represent the smallest median household size with 1.20 persons per household.
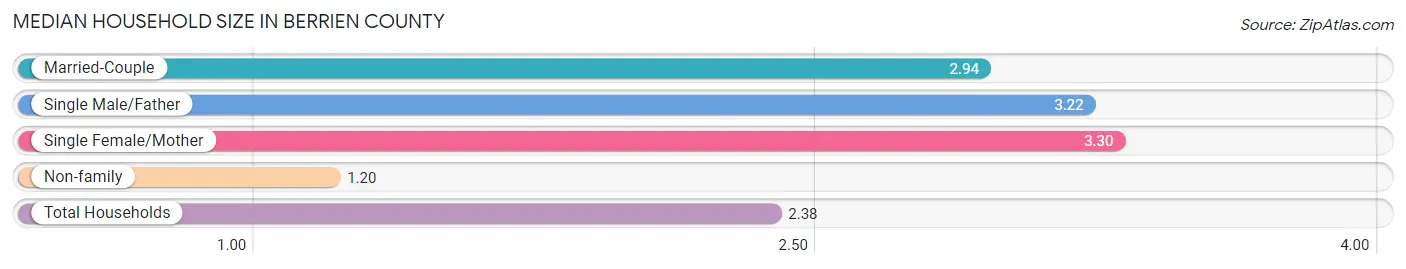
| Household Type | # Households | Household Size |
| Married-Couple | 29,648 (46.7%) | 2.94 |
| Single Male/Father | 2,985 (4.7%) | 3.22 |
| Single Female/Mother | 8,105 (12.8%) | 3.30 |
| Non-family | 22,774 (35.9%) | 1.20 |
| Total Households | 63,512 (100.0%) | 2.38 |
Household Size by Marriage Status in Berrien County
Out of a total of 63,512 households in Berrien County, 40,738 (64.1%) are family households, while 22,774 (35.9%) are nonfamily households. The most numerous type of family households are 2-person households, comprising 21,175, and the most common type of nonfamily households are 1-person households, comprising 19,115.
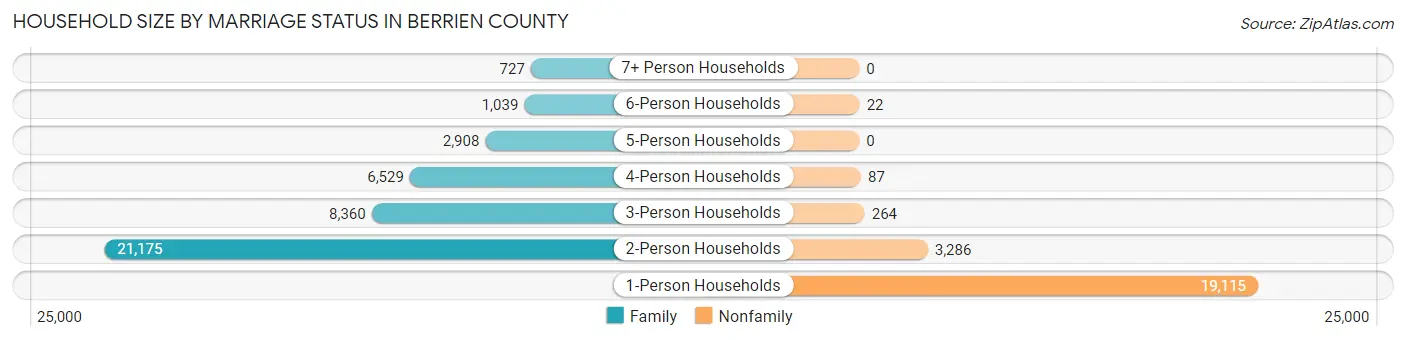
| Household Size | Family Households | Nonfamily Households |
| 1-Person Households | - | 19,115 (30.1%) |
| 2-Person Households | 21,175 (33.3%) | 3,286 (5.2%) |
| 3-Person Households | 8,360 (13.2%) | 264 (0.4%) |
| 4-Person Households | 6,529 (10.3%) | 87 (0.1%) |
| 5-Person Households | 2,908 (4.6%) | 0 (0.0%) |
| 6-Person Households | 1,039 (1.6%) | 22 (0.0%) |
| 7+ Person Households | 727 (1.1%) | 0 (0.0%) |
| Total | 40,738 (64.1%) | 22,774 (35.9%) |
Female Fertility in Berrien County
Fertility by Age in Berrien County
Average fertility rate in Berrien County is 55.0 births per 1,000 women. Women in the age bracket of 20 to 34 years have the highest fertility rate with 107.0 births per 1,000 women. Women in the age bracket of 20 to 34 years acount for 78.9% of all women with births.
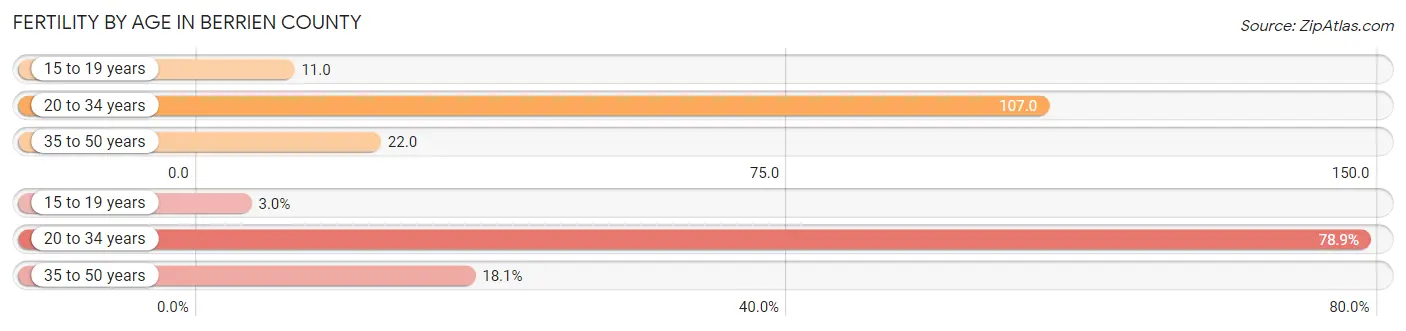
| Age Bracket | Women with Births | Births / 1,000 Women |
| 15 to 19 years | 52 (2.9%) | 11.0 |
| 20 to 34 years | 1,392 (78.9%) | 107.0 |
| 35 to 50 years | 320 (18.1%) | 22.0 |
| Total | 1,764 (100.0%) | 55.0 |
Fertility by Age by Marriage Status in Berrien County
60.8% of women with births (1,764) in Berrien County are married. The highest percentage of unmarried women with births falls into 15 to 19 years age bracket with 100.0% of them unmarried at the time of birth, while the lowest percentage of unmarried women with births belong to 35 to 50 years age bracket with 26.6% of them unmarried.
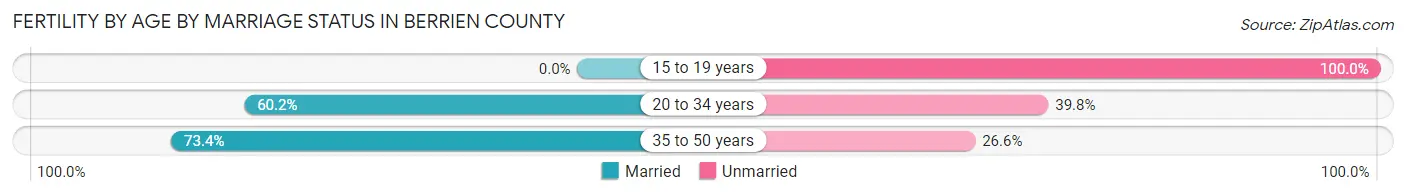
| Age Bracket | Married | Unmarried |
| 15 to 19 years | 0 (0.0%) | 52 (100.0%) |
| 20 to 34 years | 838 (60.2%) | 554 (39.8%) |
| 35 to 50 years | 235 (73.4%) | 85 (26.6%) |
| Total | 1,073 (60.8%) | 691 (39.2%) |
Fertility by Education in Berrien County
Average fertility rate in Berrien County is 55.0 births per 1,000 women. Women with the education attainment of bachelor's degree have the highest fertility rate of 78.0 births per 1,000 women, while women with the education attainment of less than high school have the lowest fertility at 36.0 births per 1,000 women. Women with the education attainment of high school diploma represent 29.0% of all women with births.
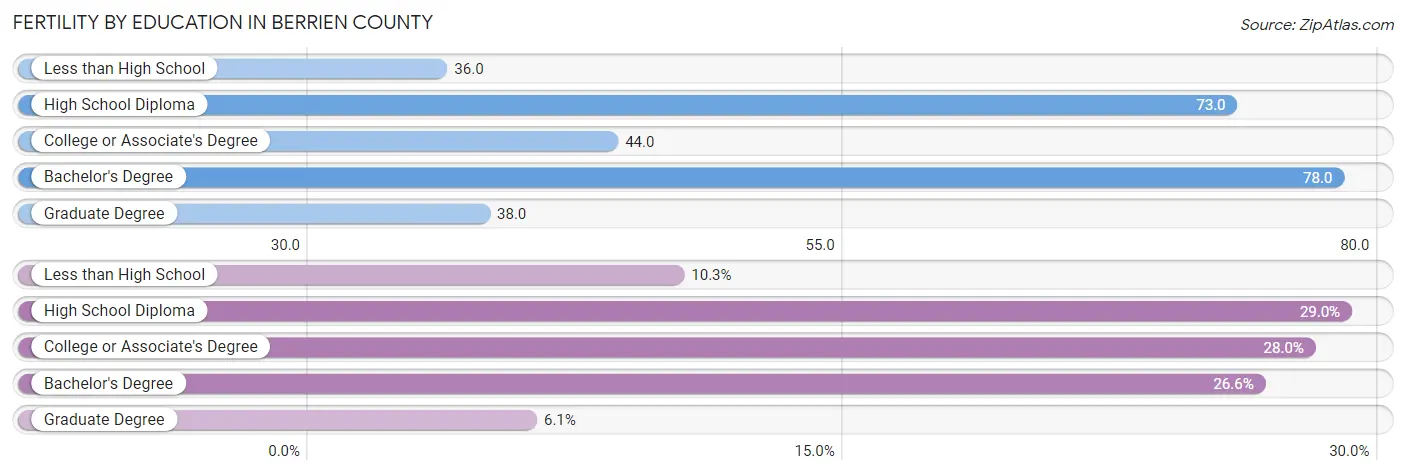
| Educational Attainment | Women with Births | Births / 1,000 Women |
| Less than High School | 181 (10.3%) | 36.0 |
| High School Diploma | 512 (29.0%) | 73.0 |
| College or Associate's Degree | 494 (28.0%) | 44.0 |
| Bachelor's Degree | 469 (26.6%) | 78.0 |
| Graduate Degree | 108 (6.1%) | 38.0 |
| Total | 1,764 (100.0%) | 55.0 |
Fertility by Education by Marriage Status in Berrien County
39.2% of women with births in Berrien County are unmarried. Women with the educational attainment of graduate degree are most likely to be married with 100.0% of them married at childbirth, while women with the educational attainment of less than high school are least likely to be married with 75.1% of them unmarried at childbirth.
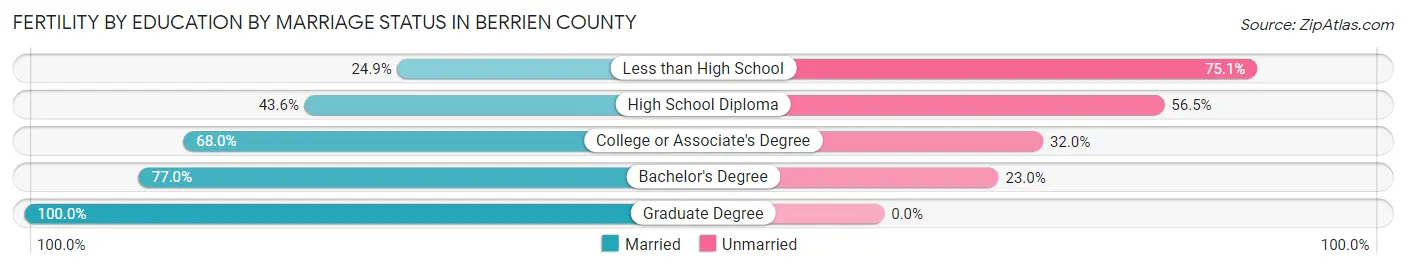
| Educational Attainment | Married | Unmarried |
| Less than High School | 45 (24.9%) | 136 (75.1%) |
| High School Diploma | 223 (43.5%) | 289 (56.5%) |
| College or Associate's Degree | 336 (68.0%) | 158 (32.0%) |
| Bachelor's Degree | 361 (77.0%) | 108 (23.0%) |
| Graduate Degree | 108 (100.0%) | 0 (0.0%) |
| Total | 1,073 (60.8%) | 691 (39.2%) |
Income in Berrien County
Income Overview in Berrien County
Per Capita Income in Berrien County is $36,764, while median incomes of families and households are $79,042 and $60,379 respectively.
| Characteristic | Number | Measure |
| Per Capita Income | 153,938 | $36,764 |
| Median Family Income | 40,738 | $79,042 |
| Mean Family Income | 40,738 | $101,785 |
| Median Household Income | 63,512 | $60,379 |
| Mean Household Income | 63,512 | $86,184 |
| Income Deficit | 40,738 | $11,027 |
| Wage / Income Gap (%) | 153,938 | 37.88% |
| Wage / Income Gap ($) | 153,938 | 62.12¢ per $1 |
| Gini / Inequality Index | 153,938 | 0.48 |
Earnings by Sex in Berrien County
Average Earnings in Berrien County are $35,974, $45,470 for men and $28,246 for women, a difference of 37.9%.
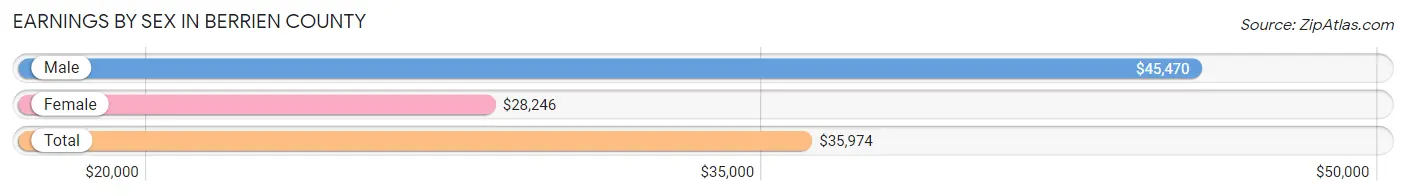
| Sex | Number | Average Earnings |
| Male | 41,646 (52.1%) | $45,470 |
| Female | 38,349 (47.9%) | $28,246 |
| Total | 79,995 (100.0%) | $35,974 |
Earnings by Sex by Income Bracket in Berrien County
The most common earnings brackets in Berrien County are $100,000+ for men (6,390 | 15.3%) and $2,499 or less for women (3,639 | 9.5%).
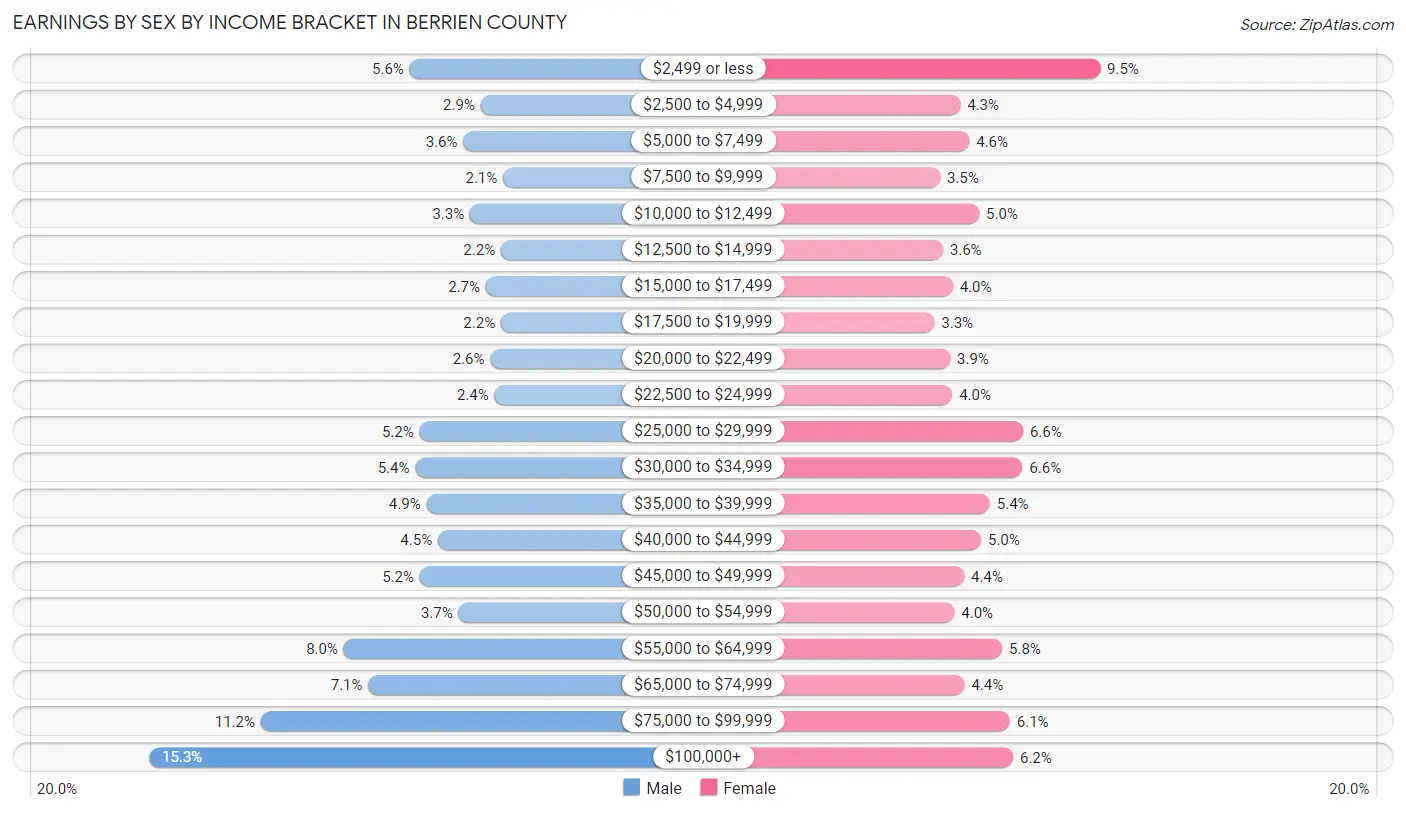
| Income | Male | Female |
| $2,499 or less | 2,319 (5.6%) | 3,639 (9.5%) |
| $2,500 to $4,999 | 1,213 (2.9%) | 1,628 (4.3%) |
| $5,000 to $7,499 | 1,482 (3.6%) | 1,760 (4.6%) |
| $7,500 to $9,999 | 862 (2.1%) | 1,339 (3.5%) |
| $10,000 to $12,499 | 1,379 (3.3%) | 1,904 (5.0%) |
| $12,500 to $14,999 | 896 (2.1%) | 1,379 (3.6%) |
| $15,000 to $17,499 | 1,134 (2.7%) | 1,523 (4.0%) |
| $17,500 to $19,999 | 897 (2.1%) | 1,258 (3.3%) |
| $20,000 to $22,499 | 1,064 (2.5%) | 1,483 (3.9%) |
| $22,500 to $24,999 | 995 (2.4%) | 1,513 (4.0%) |
| $25,000 to $29,999 | 2,167 (5.2%) | 2,530 (6.6%) |
| $30,000 to $34,999 | 2,233 (5.4%) | 2,523 (6.6%) |
| $35,000 to $39,999 | 2,057 (4.9%) | 2,056 (5.4%) |
| $40,000 to $44,999 | 1,879 (4.5%) | 1,928 (5.0%) |
| $45,000 to $49,999 | 2,163 (5.2%) | 1,683 (4.4%) |
| $50,000 to $54,999 | 1,557 (3.7%) | 1,547 (4.0%) |
| $55,000 to $64,999 | 3,350 (8.0%) | 2,230 (5.8%) |
| $65,000 to $74,999 | 2,964 (7.1%) | 1,693 (4.4%) |
| $75,000 to $99,999 | 4,645 (11.2%) | 2,342 (6.1%) |
| $100,000+ | 6,390 (15.3%) | 2,391 (6.2%) |
| Total | 41,646 (100.0%) | 38,349 (100.0%) |
Earnings by Sex by Educational Attainment in Berrien County
Average earnings in Berrien County are $51,302 for men and $33,752 for women, a difference of 34.2%. Men with an educational attainment of graduate degree enjoy the highest average annual earnings of $86,840, while those with less than high school education earn the least with $25,701. Women with an educational attainment of graduate degree earn the most with the average annual earnings of $62,363, while those with less than high school education have the smallest earnings of $20,805.
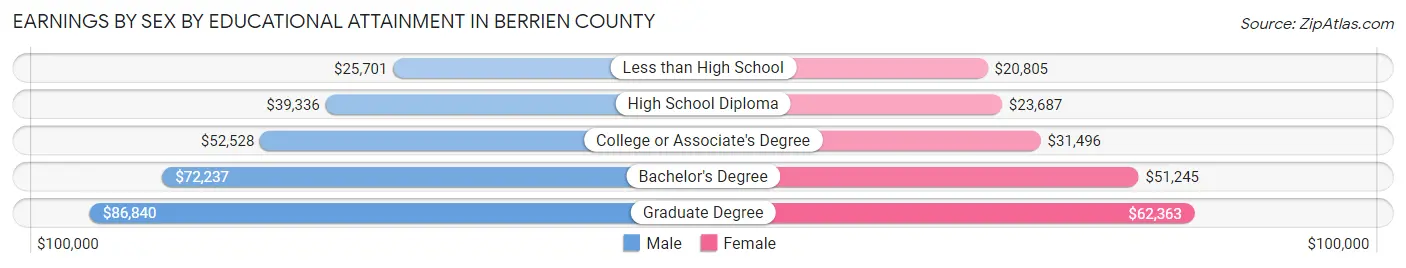
| Educational Attainment | Male Income | Female Income |
| Less than High School | $25,701 | $20,805 |
| High School Diploma | $39,336 | $23,687 |
| College or Associate's Degree | $52,528 | $31,496 |
| Bachelor's Degree | $72,237 | $51,245 |
| Graduate Degree | $86,840 | $62,363 |
| Total | $51,302 | $33,752 |
Family Income in Berrien County
Family Income Brackets in Berrien County
According to the Berrien County family income data, there are 7,903 families falling into the $100,000 to $149,999 income range, which is the most common income bracket and makes up 19.4% of all families. Conversely, the $10,000 to $14,999 income bracket is the least frequent group with only 1,181 families (2.9%) belonging to this category.
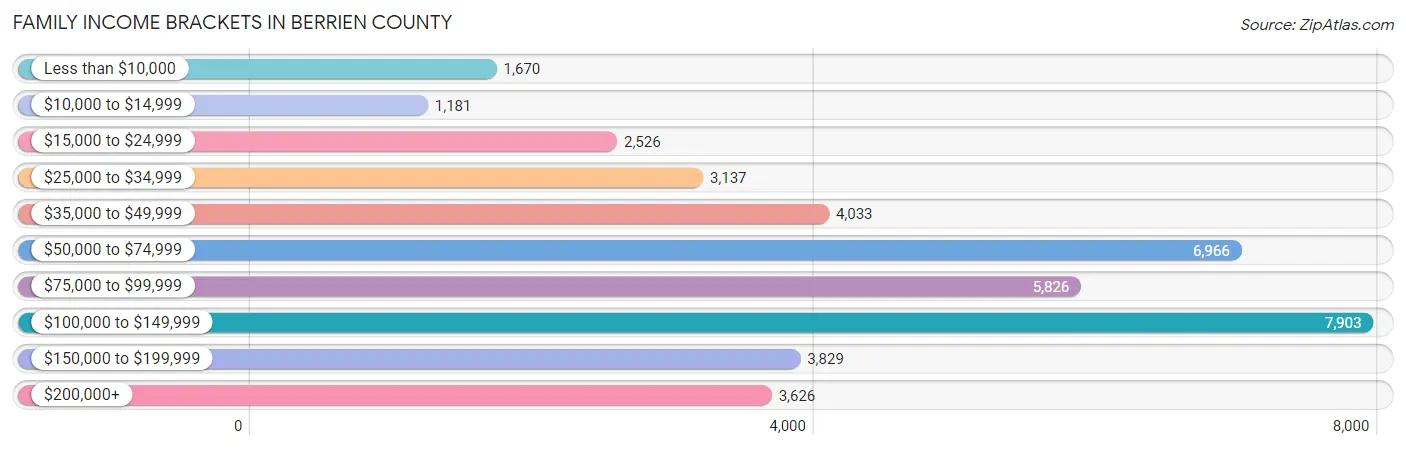
| Income Bracket | # Families | % Families |
| Less than $10,000 | 1,670 | 4.1% |
| $10,000 to $14,999 | 1,181 | 2.9% |
| $15,000 to $24,999 | 2,526 | 6.2% |
| $25,000 to $34,999 | 3,137 | 7.7% |
| $35,000 to $49,999 | 4,033 | 9.9% |
| $50,000 to $74,999 | 6,966 | 17.1% |
| $75,000 to $99,999 | 5,826 | 14.3% |
| $100,000 to $149,999 | 7,903 | 19.4% |
| $150,000 to $199,999 | 3,829 | 9.4% |
| $200,000+ | 3,626 | 8.9% |
Family Income by Famaliy Size in Berrien County
7+ person families (654 | 1.6%) account for the highest median family income in Berrien County with $99,231 per family, while 2-person families (22,450 | 55.1%) have the highest median income of $35,877 per family member.
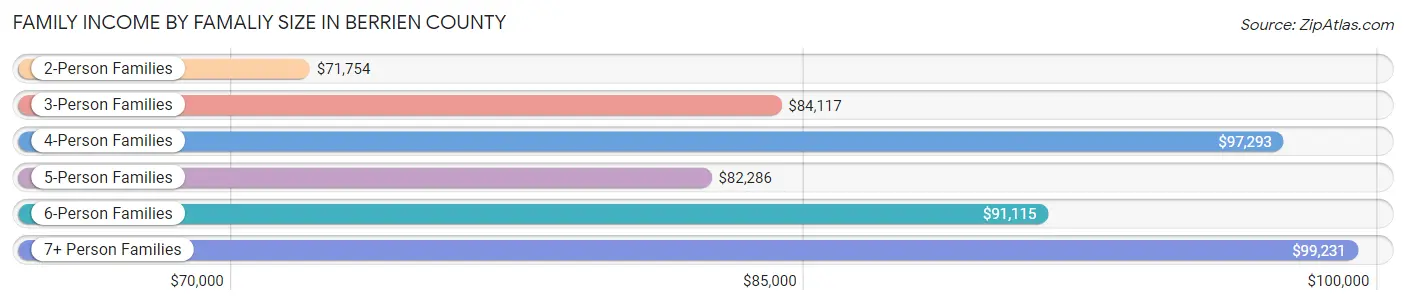
| Income Bracket | # Families | Median Income |
| 2-Person Families | 22,450 (55.1%) | $71,754 |
| 3-Person Families | 8,173 (20.1%) | $84,117 |
| 4-Person Families | 5,897 (14.5%) | $97,293 |
| 5-Person Families | 2,634 (6.5%) | $82,286 |
| 6-Person Families | 930 (2.3%) | $91,115 |
| 7+ Person Families | 654 (1.6%) | $99,231 |
| Total | 40,738 (100.0%) | $79,042 |
Family Income by Number of Earners in Berrien County
The median family income in Berrien County is $79,042, with families comprising 3+ earners (3,847) having the highest median family income of $133,058, while families with no earners (6,902) have the lowest median family income of $47,047, accounting for 9.4% and 16.9% of families, respectively.
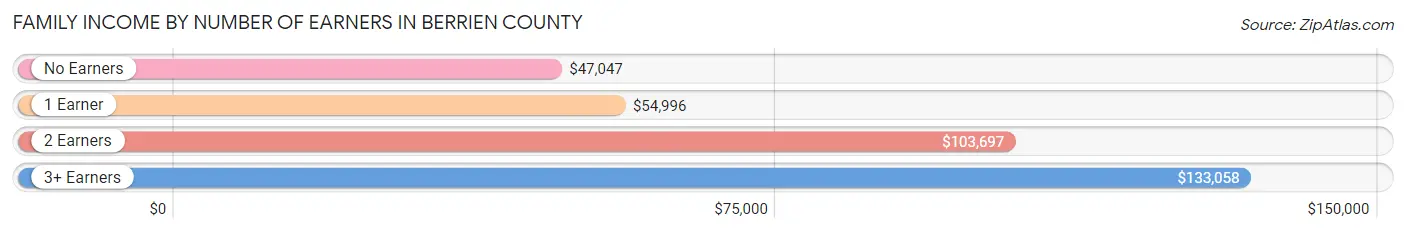
| Number of Earners | # Families | Median Income |
| No Earners | 6,902 (16.9%) | $47,047 |
| 1 Earner | 14,611 (35.9%) | $54,996 |
| 2 Earners | 15,378 (37.8%) | $103,697 |
| 3+ Earners | 3,847 (9.4%) | $133,058 |
| Total | 40,738 (100.0%) | $79,042 |
Household Income in Berrien County
Household Income Brackets in Berrien County
With 11,115 households falling in the category, the $50,000 to $74,999 income range is the most frequent in Berrien County, accounting for 17.5% of all households. In contrast, only 3,239 households (5.1%) fall into the $10,000 to $14,999 income bracket, making it the least populous group.
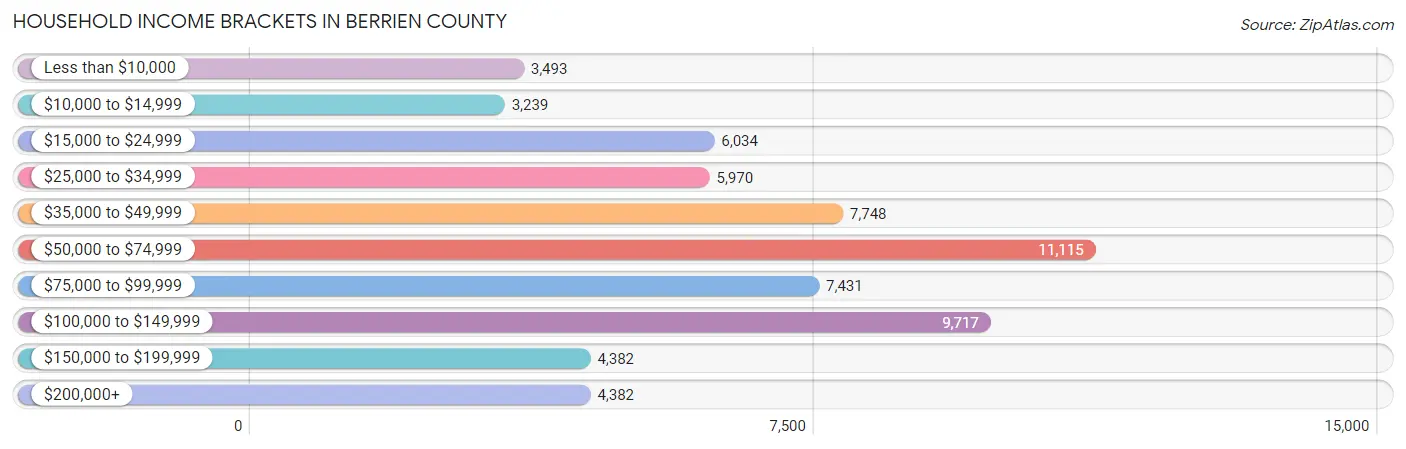
| Income Bracket | # Households | % Households |
| Less than $10,000 | 3,493 | 5.5% |
| $10,000 to $14,999 | 3,239 | 5.1% |
| $15,000 to $24,999 | 6,034 | 9.5% |
| $25,000 to $34,999 | 5,970 | 9.4% |
| $35,000 to $49,999 | 7,748 | 12.2% |
| $50,000 to $74,999 | 11,115 | 17.5% |
| $75,000 to $99,999 | 7,431 | 11.7% |
| $100,000 to $149,999 | 9,717 | 15.3% |
| $150,000 to $199,999 | 4,382 | 6.9% |
| $200,000+ | 4,382 | 6.9% |
Household Income by Householder Age in Berrien County
The median household income in Berrien County is $60,379, with the highest median household income of $74,560 found in the 45 to 64 years age bracket for the primary householder. A total of 23,558 households (37.1%) fall into this category. Meanwhile, the 15 to 24 years age bracket for the primary householder has the lowest median household income of $37,468, with 2,349 households (3.7%) in this group.
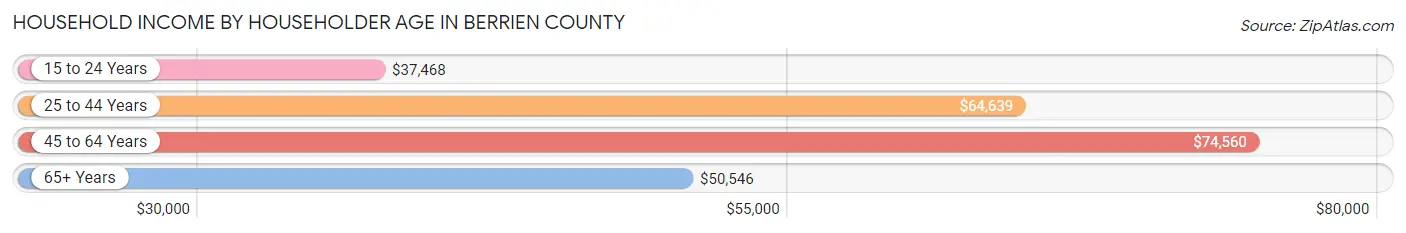
| Income Bracket | # Households | Median Income |
| 15 to 24 Years | 2,349 (3.7%) | $37,468 |
| 25 to 44 Years | 17,627 (27.8%) | $64,639 |
| 45 to 64 Years | 23,558 (37.1%) | $74,560 |
| 65+ Years | 19,978 (31.5%) | $50,546 |
| Total | 63,512 (100.0%) | $60,379 |
Poverty in Berrien County
Income Below Poverty by Sex and Age in Berrien County
With 14.1% poverty level for males and 17.3% for females among the residents of Berrien County, under 5 year old males and 5 year old females are the most vulnerable to poverty, with 1,336 males (32.0%) and 279 females (30.7%) in their respective age groups living below the poverty level.
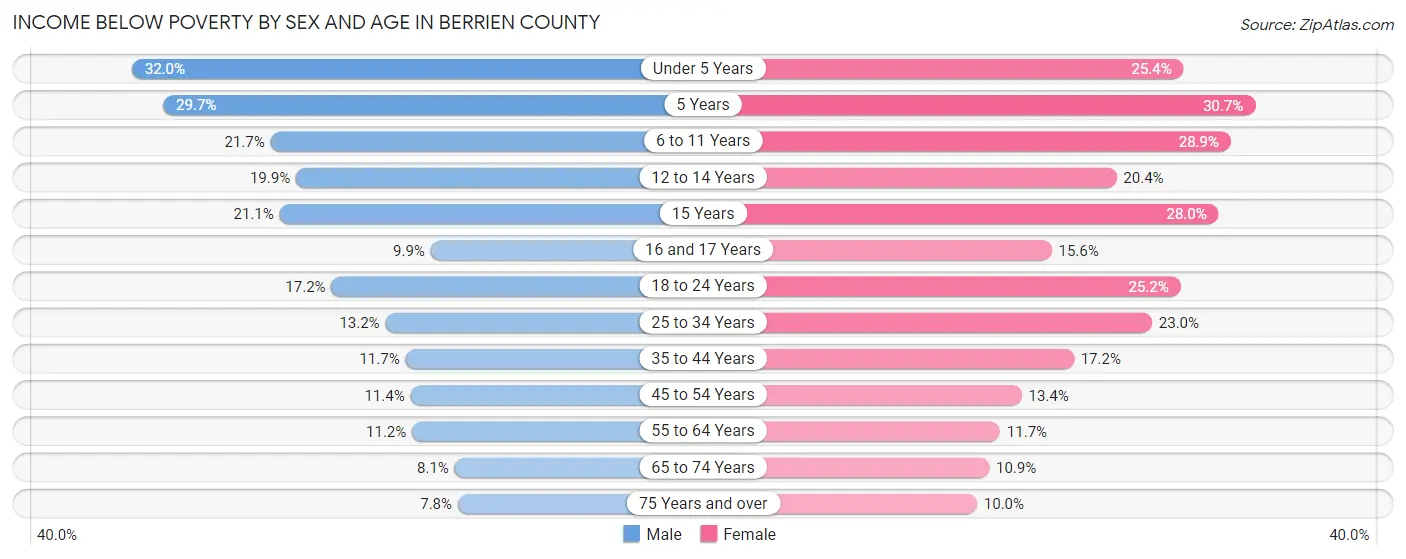
| Age Bracket | Male | Female |
| Under 5 Years | 1,336 (32.0%) | 1,017 (25.4%) |
| 5 Years | 284 (29.7%) | 279 (30.7%) |
| 6 to 11 Years | 1,294 (21.7%) | 1,476 (28.9%) |
| 12 to 14 Years | 480 (19.9%) | 600 (20.4%) |
| 15 Years | 249 (21.1%) | 285 (28.0%) |
| 16 and 17 Years | 185 (9.9%) | 292 (15.6%) |
| 18 to 24 Years | 1,042 (17.2%) | 1,476 (25.2%) |
| 25 to 34 Years | 1,168 (13.2%) | 1,981 (23.0%) |
| 35 to 44 Years | 1,042 (11.7%) | 1,538 (17.2%) |
| 45 to 54 Years | 1,032 (11.4%) | 1,254 (13.4%) |
| 55 to 64 Years | 1,230 (11.2%) | 1,325 (11.7%) |
| 65 to 74 Years | 704 (8.1%) | 1,048 (10.9%) |
| 75 Years and over | 418 (7.8%) | 721 (10.0%) |
| Total | 10,464 (14.1%) | 13,292 (17.3%) |
Income Above Poverty by Sex and Age in Berrien County
According to the poverty statistics in Berrien County, males aged 75 years and over and females aged 75 years and over are the age groups that are most secure financially, with 92.2% of males and 90.0% of females in these age groups living above the poverty line.
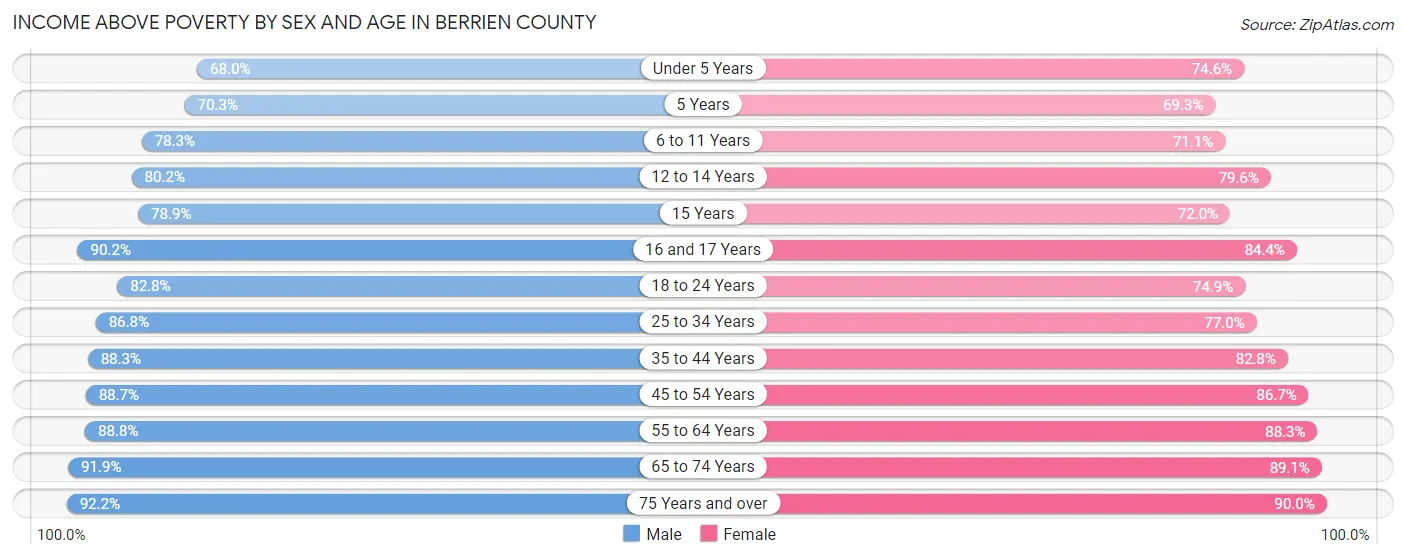
| Age Bracket | Male | Female |
| Under 5 Years | 2,834 (68.0%) | 2,991 (74.6%) |
| 5 Years | 672 (70.3%) | 630 (69.3%) |
| 6 to 11 Years | 4,659 (78.3%) | 3,635 (71.1%) |
| 12 to 14 Years | 1,938 (80.1%) | 2,342 (79.6%) |
| 15 Years | 933 (78.9%) | 734 (72.0%) |
| 16 and 17 Years | 1,694 (90.1%) | 1,583 (84.4%) |
| 18 to 24 Years | 5,008 (82.8%) | 4,392 (74.9%) |
| 25 to 34 Years | 7,674 (86.8%) | 6,625 (77.0%) |
| 35 to 44 Years | 7,850 (88.3%) | 7,396 (82.8%) |
| 45 to 54 Years | 8,058 (88.6%) | 8,138 (86.7%) |
| 55 to 64 Years | 9,726 (88.8%) | 9,960 (88.3%) |
| 65 to 74 Years | 8,023 (91.9%) | 8,539 (89.1%) |
| 75 Years and over | 4,918 (92.2%) | 6,470 (90.0%) |
| Total | 63,987 (86.0%) | 63,435 (82.7%) |
Income Below Poverty Among Married-Couple Families in Berrien County
The poverty statistics for married-couple families in Berrien County show that 5.0% or 1,468 of the total 29,648 families live below the poverty line. Families with 5 or more children have the highest poverty rate of 26.6%, comprising of 81 families. On the other hand, families with no children have the lowest poverty rate of 3.9%, which includes 769 families.
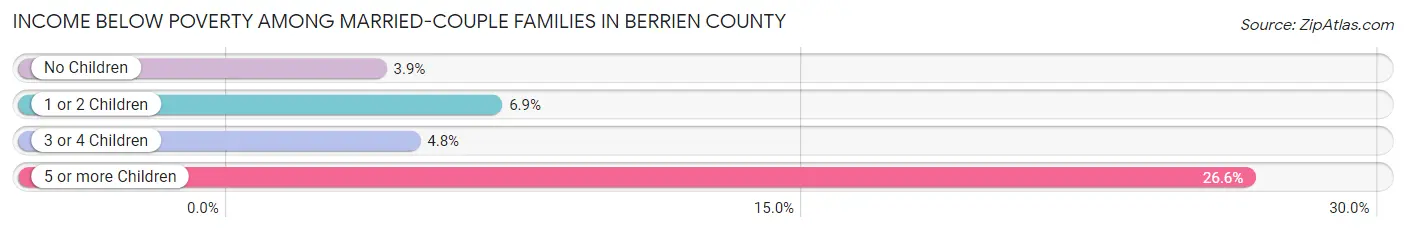
| Children | Above Poverty | Below Poverty |
| No Children | 19,042 (96.1%) | 769 (3.9%) |
| 1 or 2 Children | 7,134 (93.1%) | 529 (6.9%) |
| 3 or 4 Children | 1,780 (95.2%) | 89 (4.8%) |
| 5 or more Children | 224 (73.4%) | 81 (26.6%) |
| Total | 28,180 (95.1%) | 1,468 (5.0%) |
Income Below Poverty Among Single-Parent Households in Berrien County
According to the poverty data in Berrien County, 17.1% or 509 single-father households and 36.4% or 2,953 single-mother households are living below the poverty line. Among single-father households, those with 3 or 4 children have the highest poverty rate, with 84 households (19.9%) experiencing poverty. Likewise, among single-mother households, those with 5 or more children have the highest poverty rate, with 76 households (71.7%) falling below the poverty line.
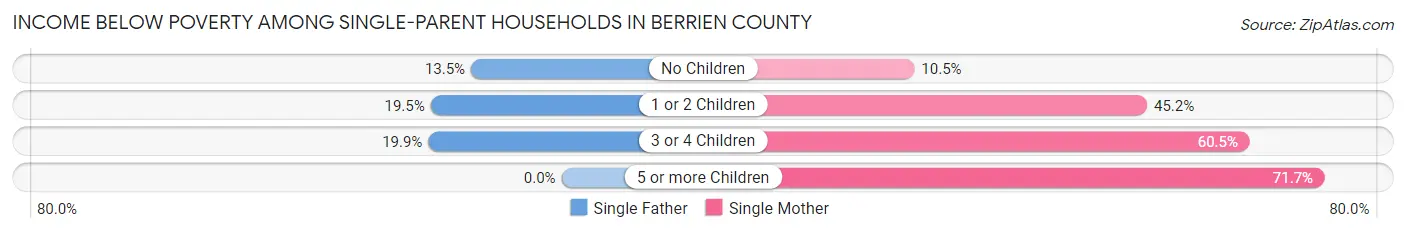
| Children | Single Father | Single Mother |
| No Children | 168 (13.5%) | 281 (10.5%) |
| 1 or 2 Children | 257 (19.5%) | 1,865 (45.2%) |
| 3 or 4 Children | 84 (19.9%) | 731 (60.5%) |
| 5 or more Children | 0 (0.0%) | 76 (71.7%) |
| Total | 509 (17.1%) | 2,953 (36.4%) |
Income Below Poverty Among Married-Couple vs Single-Parent Households in Berrien County
The poverty data for Berrien County shows that 1,468 of the married-couple family households (5.0%) and 3,462 of the single-parent households (31.2%) are living below the poverty level. Within the married-couple family households, those with 5 or more children have the highest poverty rate, with 81 households (26.6%) falling below the poverty line. Among the single-parent households, those with 5 or more children have the highest poverty rate, with 76 household (71.7%) living below poverty.
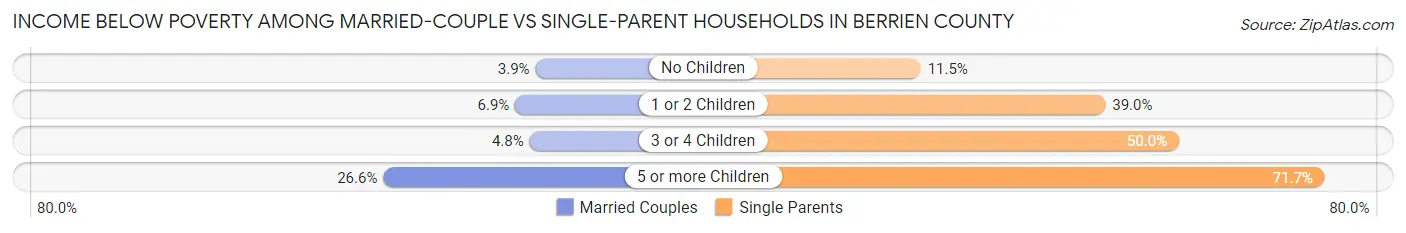
| Children | Married-Couple Families | Single-Parent Households |
| No Children | 769 (3.9%) | 449 (11.5%) |
| 1 or 2 Children | 529 (6.9%) | 2,122 (39.0%) |
| 3 or 4 Children | 89 (4.8%) | 815 (50.0%) |
| 5 or more Children | 81 (26.6%) | 76 (71.7%) |
| Total | 1,468 (5.0%) | 3,462 (31.2%) |
Employment Characteristics in Berrien County
Employment by Class of Employer in Berrien County
Among the 69,571 employed individuals in Berrien County, private company employees (47,932 | 68.9%), not-for-profit organizations (7,874 | 11.3%), and local government employees (4,812 | 6.9%) make up the most common classes of employment.
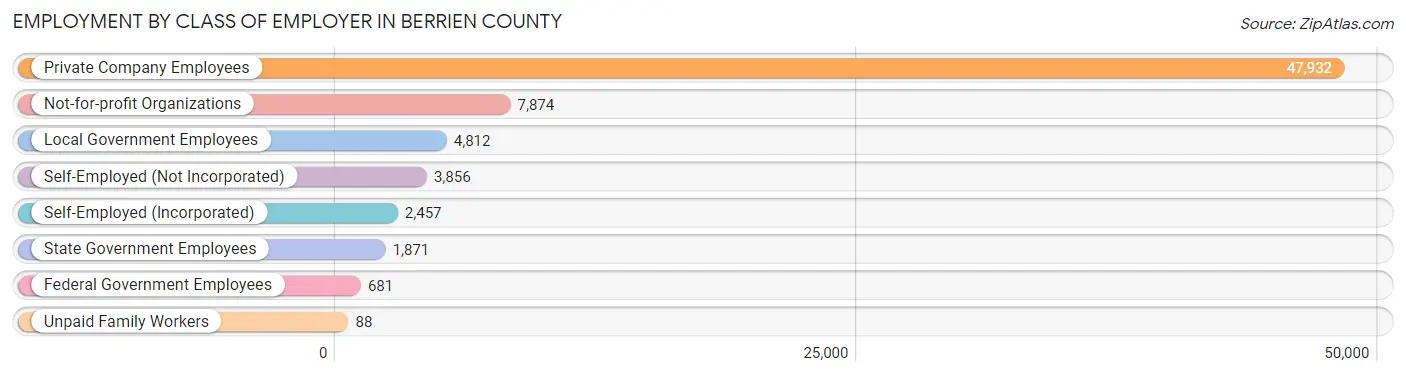
| Employer Class | # Employees | % Employees |
| Private Company Employees | 47,932 | 68.9% |
| Self-Employed (Incorporated) | 2,457 | 3.5% |
| Self-Employed (Not Incorporated) | 3,856 | 5.5% |
| Not-for-profit Organizations | 7,874 | 11.3% |
| Local Government Employees | 4,812 | 6.9% |
| State Government Employees | 1,871 | 2.7% |
| Federal Government Employees | 681 | 1.0% |
| Unpaid Family Workers | 88 | 0.1% |
| Total | 69,571 | 100.0% |
Employment Status by Age in Berrien County
According to the labor force statistics for Berrien County, out of the total population over 16 years of age (124,573), 61.1% or 76,114 individuals are in the labor force, with 6.6% or 5,024 of them unemployed. The age group with the highest labor force participation rate is 25 to 29 years, with 85.4% or 7,542 individuals in the labor force. Within the labor force, the 16 to 19 years age range has the highest percentage of unemployed individuals, with 14.1% or 543 of them being unemployed.
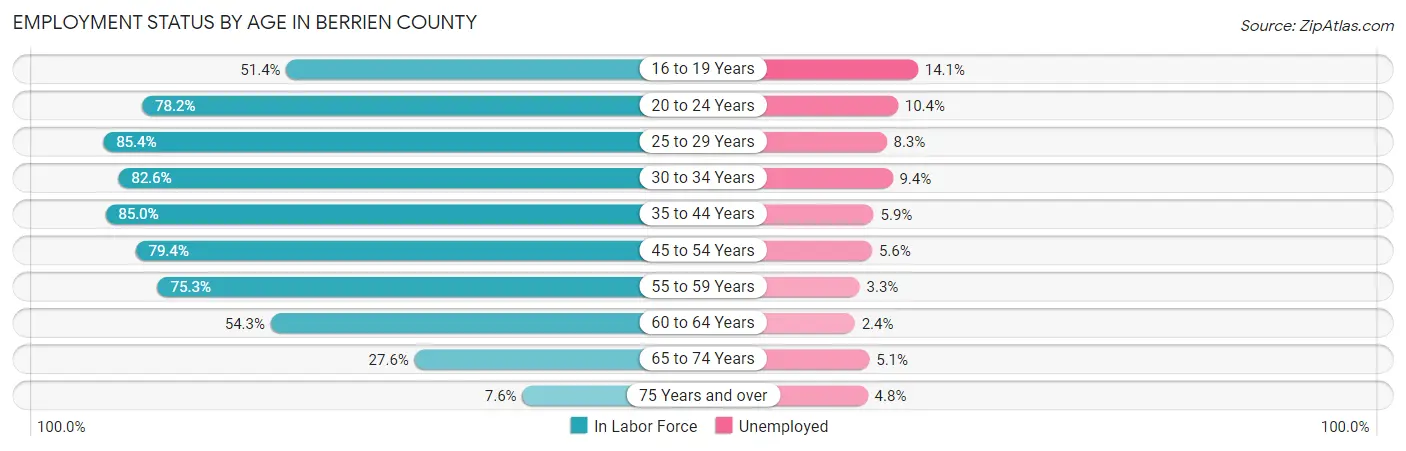
| Age Bracket | In Labor Force | Unemployed |
| 16 to 19 Years | 3,851 (51.4%) | 543 (14.1%) |
| 20 to 24 Years | 7,062 (78.2%) | 734 (10.4%) |
| 25 to 29 Years | 7,542 (85.4%) | 626 (8.3%) |
| 30 to 34 Years | 7,250 (82.6%) | 682 (9.4%) |
| 35 to 44 Years | 15,337 (85.0%) | 905 (5.9%) |
| 45 to 54 Years | 14,810 (79.4%) | 829 (5.6%) |
| 55 to 59 Years | 7,663 (75.3%) | 253 (3.3%) |
| 60 to 64 Years | 6,578 (54.3%) | 158 (2.4%) |
| 65 to 74 Years | 5,094 (27.6%) | 260 (5.1%) |
| 75 Years and over | 988 (7.6%) | 47 (4.8%) |
| Total | 76,114 (61.1%) | 5,024 (6.6%) |
Employment Status by Educational Attainment in Berrien County
According to labor force statistics for Berrien County, 77.3% of individuals (59,208) out of the total population between 25 and 64 years of age (76,595) are in the labor force, with 5.8% or 3,434 of them being unemployed. The group with the highest labor force participation rate are those with the educational attainment of bachelor's degree or higher, with 83.8% or 19,579 individuals in the labor force. Within the labor force, individuals with less than high school education have the highest percentage of unemployment, with 21.9% or 848 of them being unemployed.
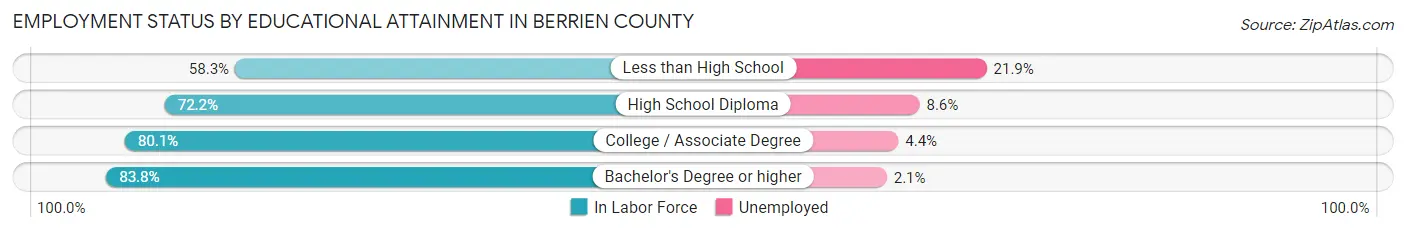
| Educational Attainment | In Labor Force | Unemployed |
| Less than High School | 3,872 (58.3%) | 1,454 (21.9%) |
| High School Diploma | 14,390 (72.2%) | 1,714 (8.6%) |
| College / Associate Degree | 21,354 (80.1%) | 1,173 (4.4%) |
| Bachelor's Degree or higher | 19,579 (83.8%) | 491 (2.1%) |
| Total | 59,208 (77.3%) | 4,443 (5.8%) |
Employment Occupations by Sex in Berrien County
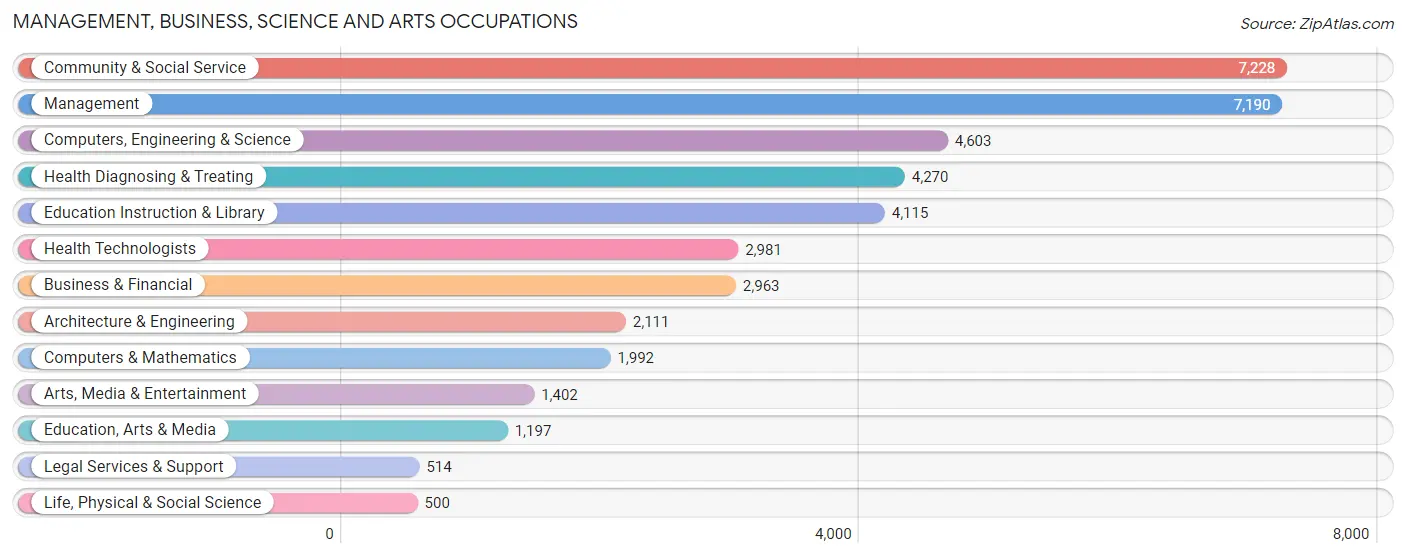
Management, Business, Science and Arts Occupations
The most common Management, Business, Science and Arts occupations in Berrien County are Community & Social Service (7,228 | 10.2%), Management (7,190 | 10.1%), Computers, Engineering & Science (4,603 | 6.5%), Health Diagnosing & Treating (4,270 | 6.0%), and Education Instruction & Library (4,115 | 5.8%).
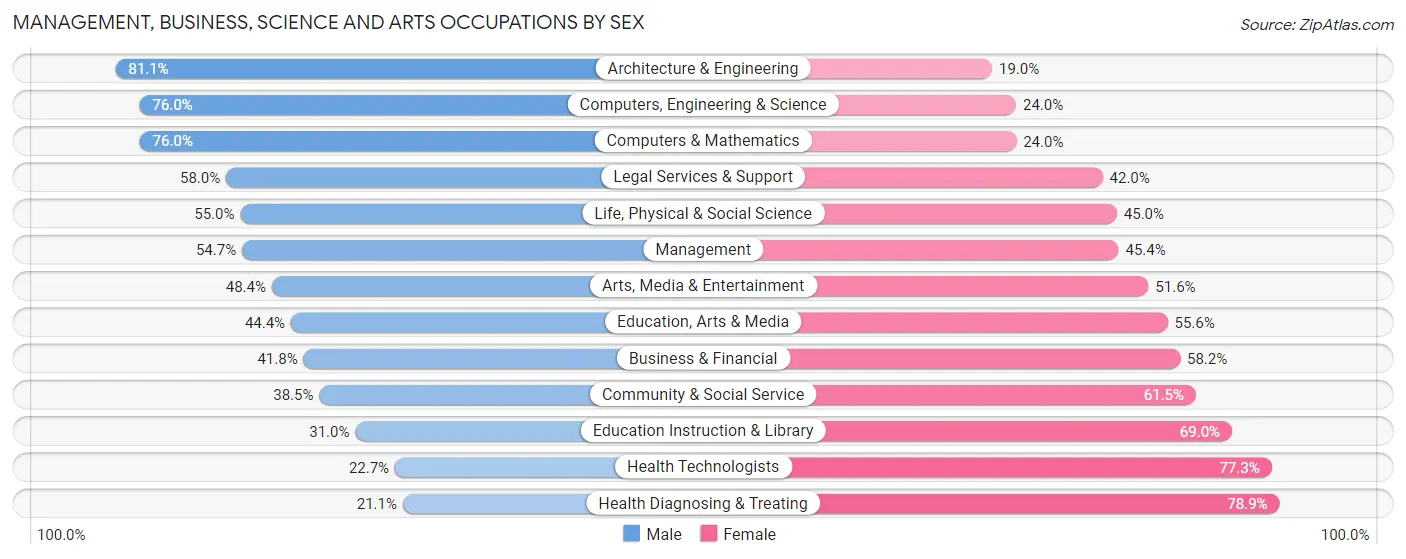
Management, Business, Science and Arts Occupations by Sex
Within the Management, Business, Science and Arts occupations in Berrien County, the most male-oriented occupations are Architecture & Engineering (81.0%), Computers, Engineering & Science (76.0%), and Computers & Mathematics (76.0%), while the most female-oriented occupations are Health Diagnosing & Treating (78.9%), Health Technologists (77.3%), and Education Instruction & Library (69.0%).
| Occupation | Male | Female |
| Management | 3,929 (54.6%) | 3,261 (45.4%) |
| Business & Financial | 1,239 (41.8%) | 1,724 (58.2%) |
| Computers, Engineering & Science | 3,500 (76.0%) | 1,103 (24.0%) |
| Computers & Mathematics | 1,514 (76.0%) | 478 (24.0%) |
| Architecture & Engineering | 1,711 (81.0%) | 400 (19.0%) |
| Life, Physical & Social Science | 275 (55.0%) | 225 (45.0%) |
| Community & Social Service | 2,785 (38.5%) | 4,443 (61.5%) |
| Education, Arts & Media | 532 (44.4%) | 665 (55.6%) |
| Legal Services & Support | 298 (58.0%) | 216 (42.0%) |
| Education Instruction & Library | 1,276 (31.0%) | 2,839 (69.0%) |
| Arts, Media & Entertainment | 679 (48.4%) | 723 (51.6%) |
| Health Diagnosing & Treating | 901 (21.1%) | 3,369 (78.9%) |
| Health Technologists | 678 (22.7%) | 2,303 (77.3%) |
| Total (Category) | 12,354 (47.1%) | 13,900 (52.9%) |
| Total (Overall) | 37,355 (52.5%) | 33,743 (47.5%) |
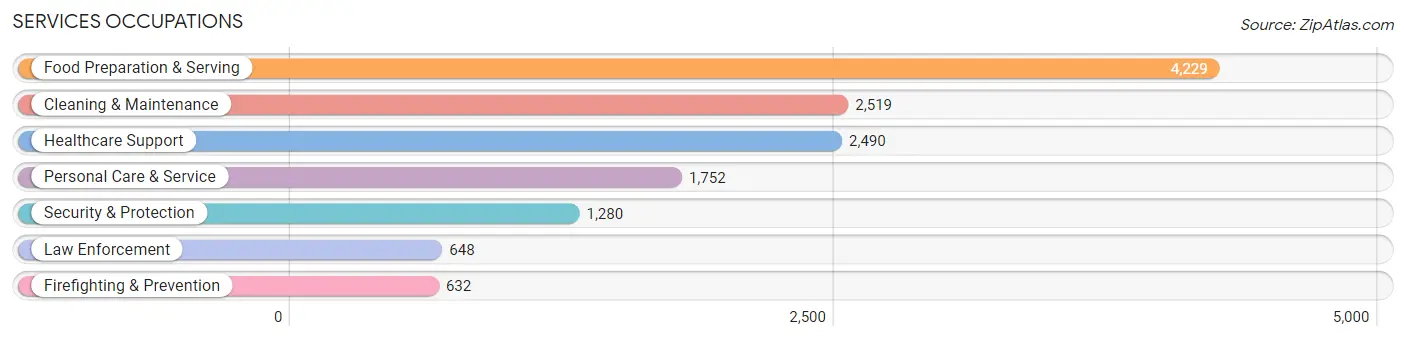
Services Occupations
The most common Services occupations in Berrien County are Food Preparation & Serving (4,229 | 5.9%), Cleaning & Maintenance (2,519 | 3.5%), Healthcare Support (2,490 | 3.5%), Personal Care & Service (1,752 | 2.5%), and Security & Protection (1,280 | 1.8%).
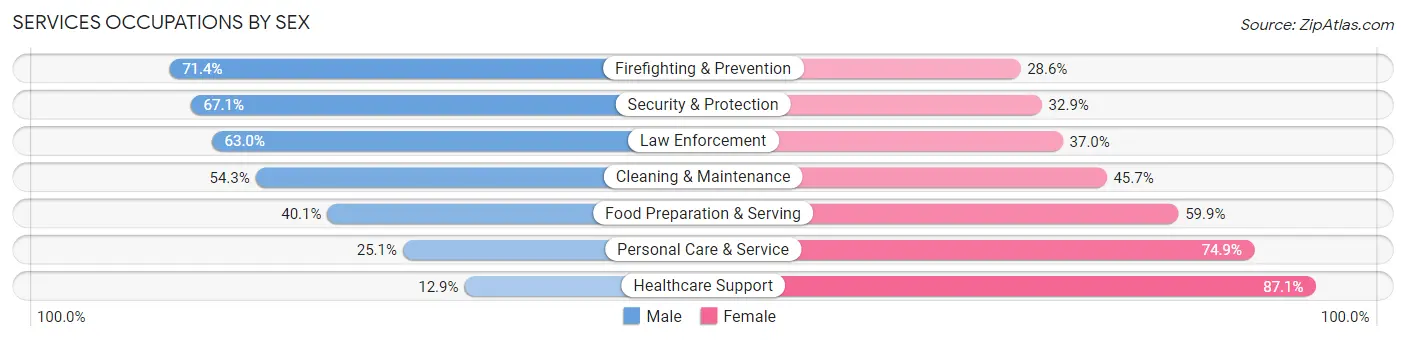
Services Occupations by Sex
Within the Services occupations in Berrien County, the most male-oriented occupations are Firefighting & Prevention (71.4%), Security & Protection (67.1%), and Law Enforcement (63.0%), while the most female-oriented occupations are Healthcare Support (87.1%), Personal Care & Service (74.9%), and Food Preparation & Serving (59.9%).
| Occupation | Male | Female |
| Healthcare Support | 322 (12.9%) | 2,168 (87.1%) |
| Security & Protection | 859 (67.1%) | 421 (32.9%) |
| Firefighting & Prevention | 451 (71.4%) | 181 (28.6%) |
| Law Enforcement | 408 (63.0%) | 240 (37.0%) |
| Food Preparation & Serving | 1,694 (40.1%) | 2,535 (59.9%) |
| Cleaning & Maintenance | 1,367 (54.3%) | 1,152 (45.7%) |
| Personal Care & Service | 440 (25.1%) | 1,312 (74.9%) |
| Total (Category) | 4,682 (38.2%) | 7,588 (61.8%) |
| Total (Overall) | 37,355 (52.5%) | 33,743 (47.5%) |
Sales and Office Occupations
The most common Sales and Office occupations in Berrien County are Office & Administration (7,859 | 11.1%), and Sales & Related (6,529 | 9.2%).
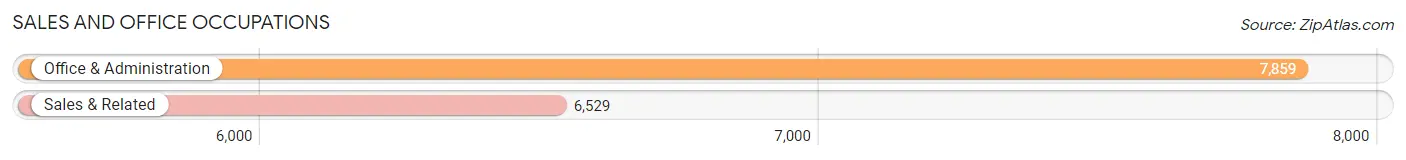
Sales and Office Occupations by Sex
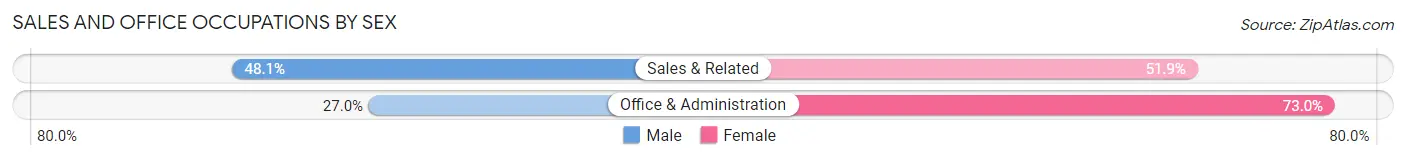
| Occupation | Male | Female |
| Sales & Related | 3,143 (48.1%) | 3,386 (51.9%) |
| Office & Administration | 2,124 (27.0%) | 5,735 (73.0%) |
| Total (Category) | 5,267 (36.6%) | 9,121 (63.4%) |
| Total (Overall) | 37,355 (52.5%) | 33,743 (47.5%) |
Natural Resources, Construction and Maintenance Occupations
The most common Natural Resources, Construction and Maintenance occupations in Berrien County are Construction & Extraction (3,201 | 4.5%), Installation, Maintenance & Repair (2,917 | 4.1%), and Farming, Fishing & Forestry (322 | 0.4%).
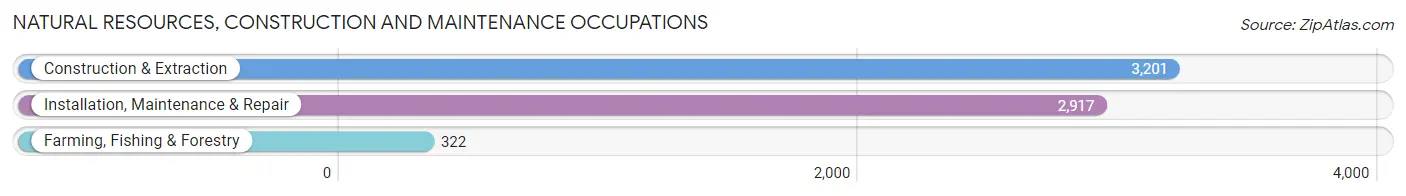
Natural Resources, Construction and Maintenance Occupations by Sex
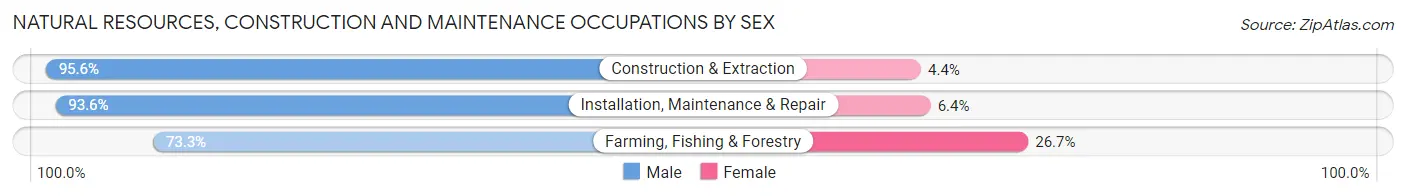
| Occupation | Male | Female |
| Farming, Fishing & Forestry | 236 (73.3%) | 86 (26.7%) |
| Construction & Extraction | 3,060 (95.6%) | 141 (4.4%) |
| Installation, Maintenance & Repair | 2,730 (93.6%) | 187 (6.4%) |
| Total (Category) | 6,026 (93.6%) | 414 (6.4%) |
| Total (Overall) | 37,355 (52.5%) | 33,743 (47.5%) |
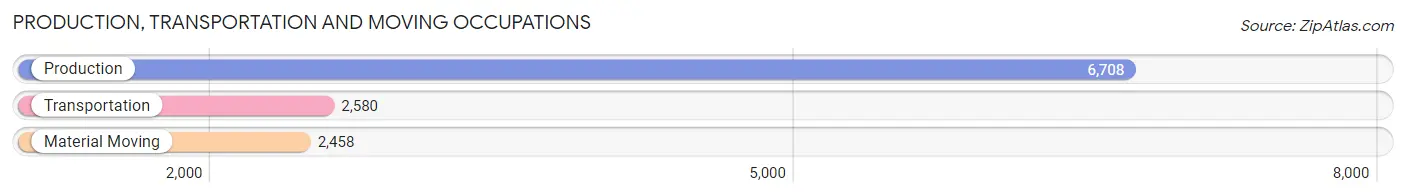
Production, Transportation and Moving Occupations
The most common Production, Transportation and Moving occupations in Berrien County are Production (6,708 | 9.4%), Transportation (2,580 | 3.6%), and Material Moving (2,458 | 3.5%).
Production, Transportation and Moving Occupations by Sex
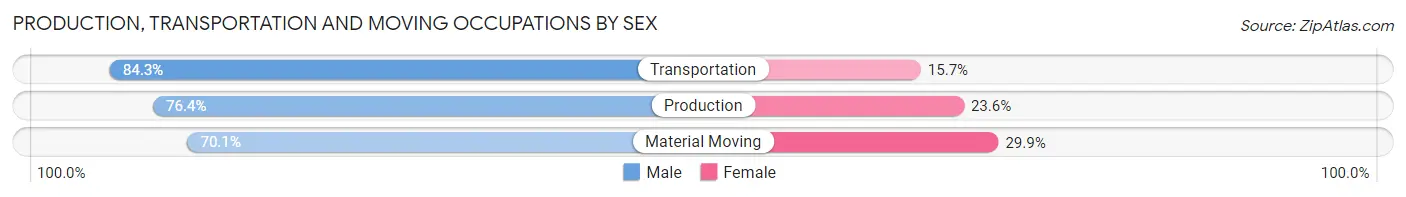
| Occupation | Male | Female |
| Production | 5,127 (76.4%) | 1,581 (23.6%) |
| Transportation | 2,176 (84.3%) | 404 (15.7%) |
| Material Moving | 1,723 (70.1%) | 735 (29.9%) |
| Total (Category) | 9,026 (76.8%) | 2,720 (23.2%) |
| Total (Overall) | 37,355 (52.5%) | 33,743 (47.5%) |
Employment Industries by Sex in Berrien County
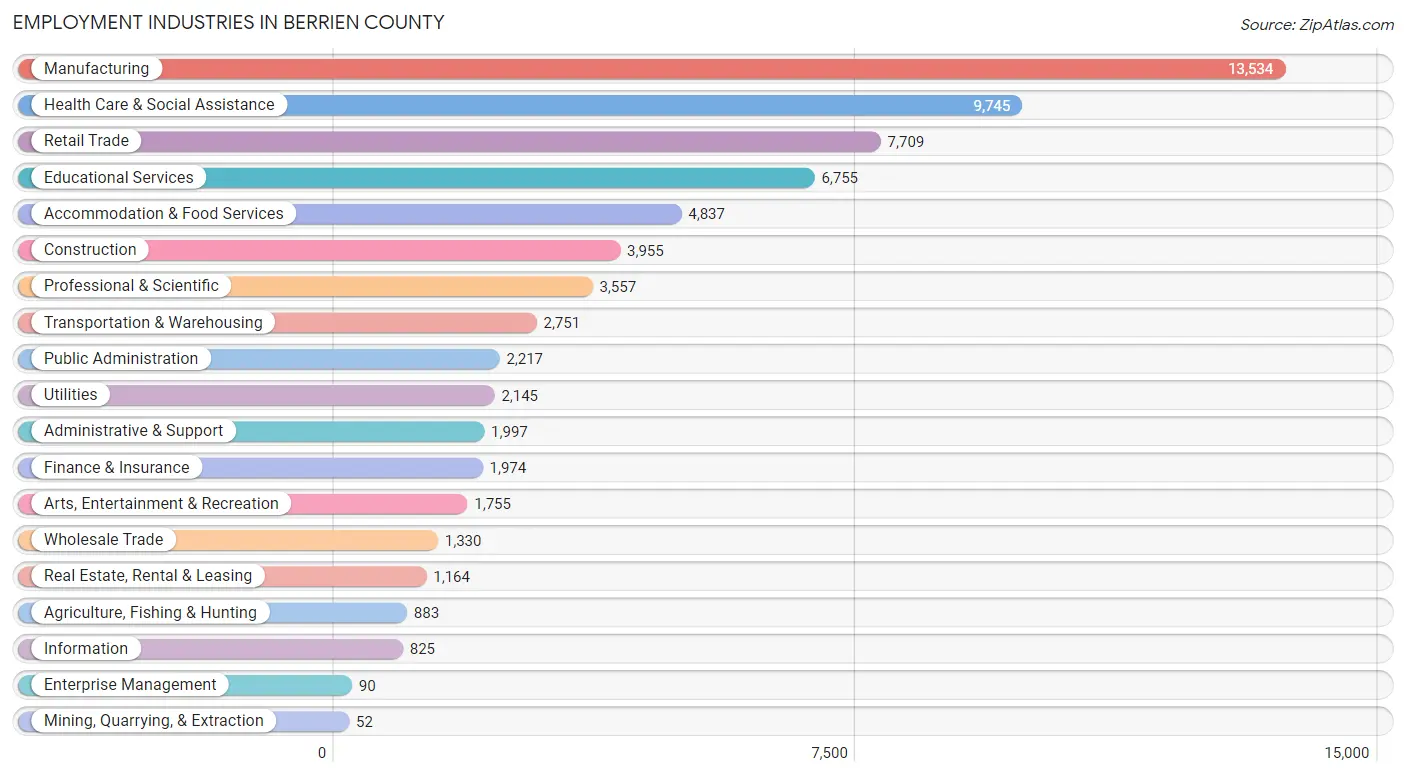
Employment Industries in Berrien County
The major employment industries in Berrien County include Manufacturing (13,534 | 19.0%), Health Care & Social Assistance (9,745 | 13.7%), Retail Trade (7,709 | 10.8%), Educational Services (6,755 | 9.5%), and Accommodation & Food Services (4,837 | 6.8%).
Employment Industries by Sex in Berrien County
The Berrien County industries that see more men than women are Mining, Quarrying, & Extraction (100.0%), Construction (89.9%), and Utilities (82.3%), whereas the industries that tend to have a higher number of women are Health Care & Social Assistance (79.4%), Enterprise Management (70.0%), and Educational Services (67.1%).
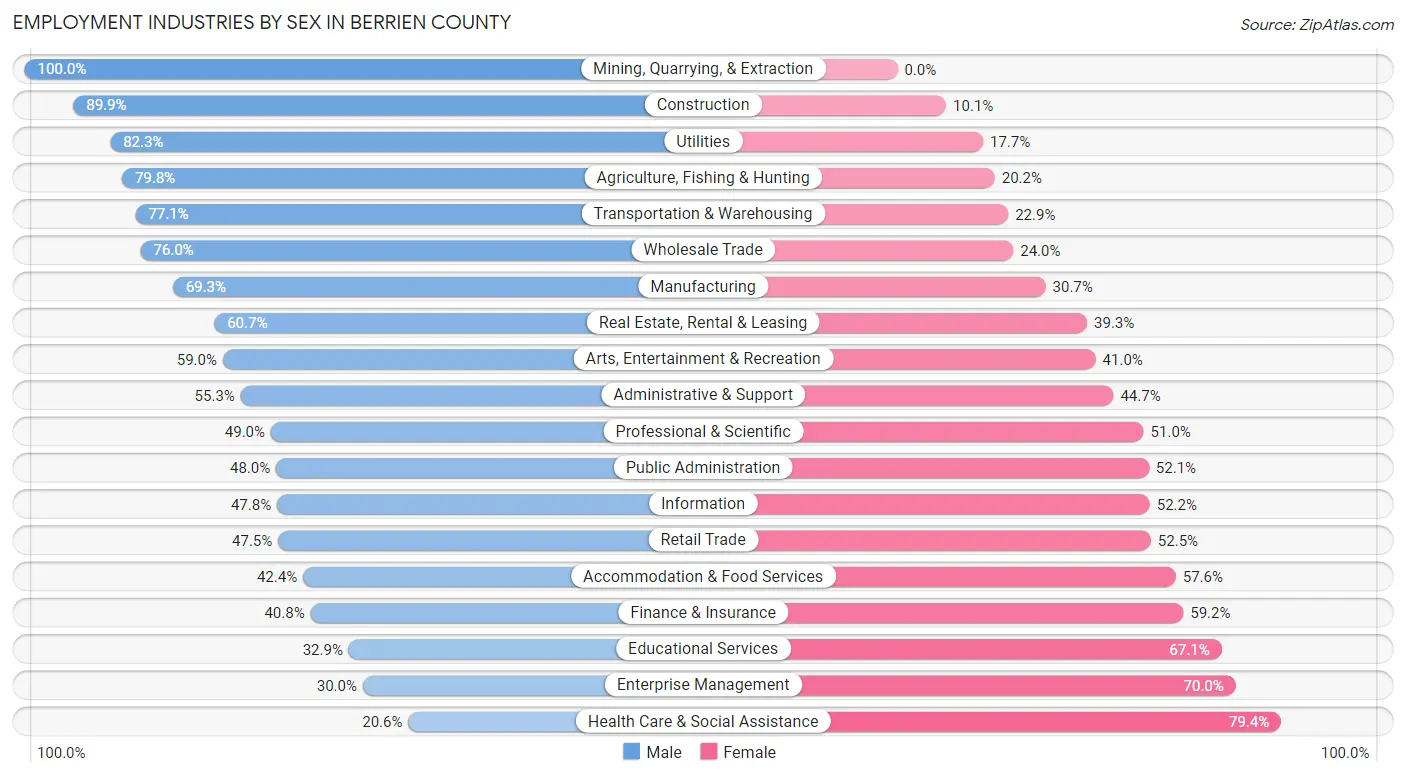
| Industry | Male | Female |
| Agriculture, Fishing & Hunting | 705 (79.8%) | 178 (20.2%) |
| Mining, Quarrying, & Extraction | 52 (100.0%) | 0 (0.0%) |
| Construction | 3,556 (89.9%) | 399 (10.1%) |
| Manufacturing | 9,383 (69.3%) | 4,151 (30.7%) |
| Wholesale Trade | 1,011 (76.0%) | 319 (24.0%) |
| Retail Trade | 3,664 (47.5%) | 4,045 (52.5%) |
| Transportation & Warehousing | 2,120 (77.1%) | 631 (22.9%) |
| Utilities | 1,765 (82.3%) | 380 (17.7%) |
| Information | 394 (47.8%) | 431 (52.2%) |
| Finance & Insurance | 806 (40.8%) | 1,168 (59.2%) |
| Real Estate, Rental & Leasing | 707 (60.7%) | 457 (39.3%) |
| Professional & Scientific | 1,744 (49.0%) | 1,813 (51.0%) |
| Enterprise Management | 27 (30.0%) | 63 (70.0%) |
| Administrative & Support | 1,104 (55.3%) | 893 (44.7%) |
| Educational Services | 2,223 (32.9%) | 4,532 (67.1%) |
| Health Care & Social Assistance | 2,006 (20.6%) | 7,739 (79.4%) |
| Arts, Entertainment & Recreation | 1,035 (59.0%) | 720 (41.0%) |
| Accommodation & Food Services | 2,050 (42.4%) | 2,787 (57.6%) |
| Public Administration | 1,063 (47.9%) | 1,154 (52.0%) |
| Total | 37,355 (52.5%) | 33,743 (47.5%) |
Education in Berrien County
School Enrollment in Berrien County
The most common levels of schooling among the 33,144 students in Berrien County are high school (7,685 | 23.2%), middle school (7,082 | 21.4%), and elementary school (6,879 | 20.7%).
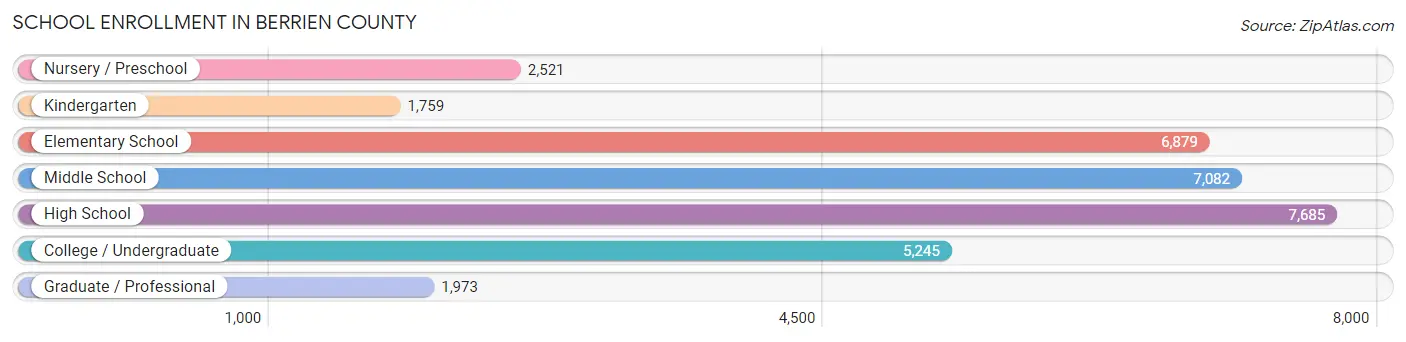
| School Level | # Students | % Students |
| Nursery / Preschool | 2,521 | 7.6% |
| Kindergarten | 1,759 | 5.3% |
| Elementary School | 6,879 | 20.7% |
| Middle School | 7,082 | 21.4% |
| High School | 7,685 | 23.2% |
| College / Undergraduate | 5,245 | 15.8% |
| Graduate / Professional | 1,973 | 5.9% |
| Total | 33,144 | 100.0% |
School Enrollment by Age by Funding Source in Berrien County
Out of a total of 33,144 students who are enrolled in schools in Berrien County, 6,894 (20.8%) attend a private institution, while the remaining 26,250 (79.2%) are enrolled in public schools. The age group of 3 to 4 year olds has the highest likelihood of being enrolled in private schools, with 616 (38.6% in the age bracket) enrolled. Conversely, the age group of 10 to 14 year olds has the lowest likelihood of being enrolled in a private school, with 7,626 (87.2% in the age bracket) attending a public institution.
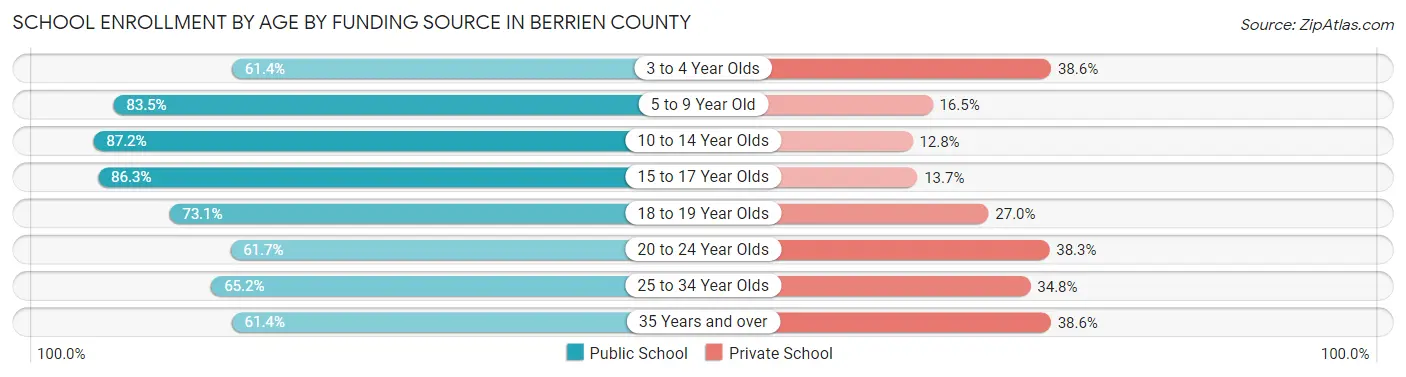
| Age Bracket | Public School | Private School |
| 3 to 4 Year Olds | 979 (61.4%) | 616 (38.6%) |
| 5 to 9 Year Old | 7,031 (83.5%) | 1,393 (16.5%) |
| 10 to 14 Year Olds | 7,626 (87.2%) | 1,120 (12.8%) |
| 15 to 17 Year Olds | 4,850 (86.3%) | 770 (13.7%) |
| 18 to 19 Year Olds | 1,946 (73.1%) | 718 (27.0%) |
| 20 to 24 Year Olds | 1,864 (61.7%) | 1,157 (38.3%) |
| 25 to 34 Year Olds | 970 (65.2%) | 517 (34.8%) |
| 35 Years and over | 975 (61.4%) | 612 (38.6%) |
| Total | 26,250 (79.2%) | 6,894 (20.8%) |
Educational Attainment by Field of Study in Berrien County
Business (7,013 | 19.8%), education (5,167 | 14.6%), science & technology (3,625 | 10.2%), engineering (2,978 | 8.4%), and arts & humanities (2,359 | 6.7%) are the most common fields of study among 35,375 individuals in Berrien County who have obtained a bachelor's degree or higher.
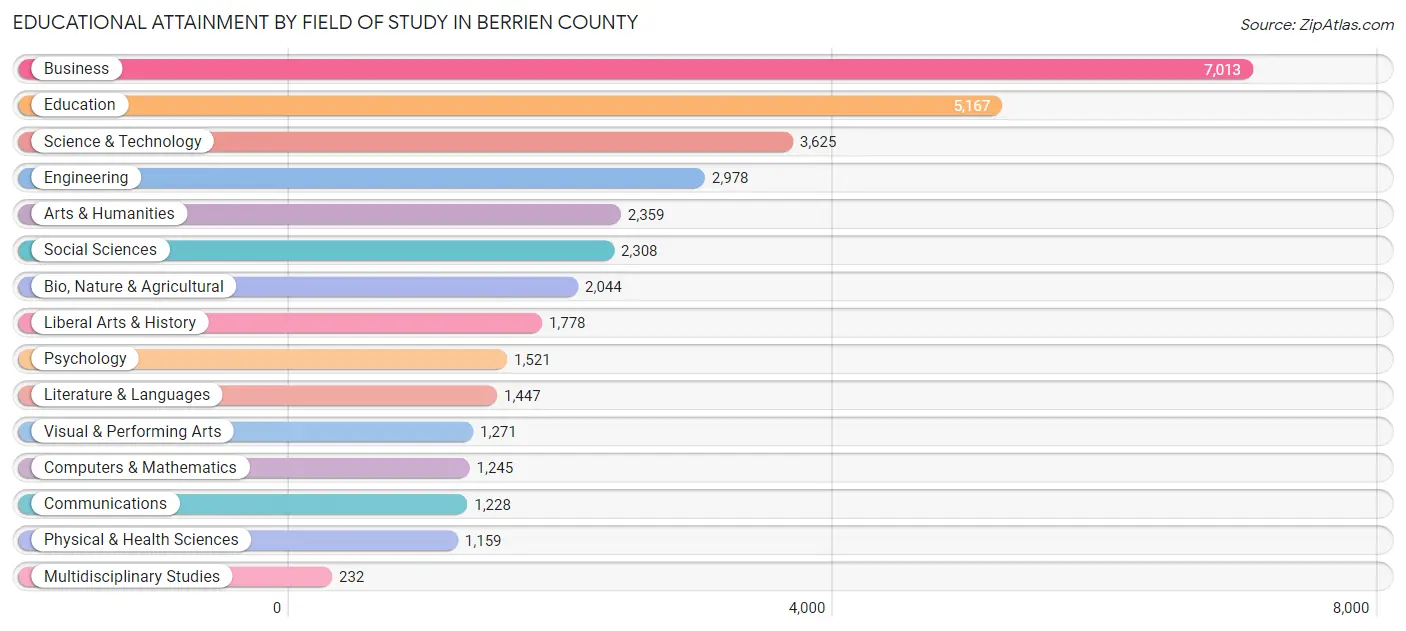
| Field of Study | # Graduates | % Graduates |
| Computers & Mathematics | 1,245 | 3.5% |
| Bio, Nature & Agricultural | 2,044 | 5.8% |
| Physical & Health Sciences | 1,159 | 3.3% |
| Psychology | 1,521 | 4.3% |
| Social Sciences | 2,308 | 6.5% |
| Engineering | 2,978 | 8.4% |
| Multidisciplinary Studies | 232 | 0.7% |
| Science & Technology | 3,625 | 10.2% |
| Business | 7,013 | 19.8% |
| Education | 5,167 | 14.6% |
| Literature & Languages | 1,447 | 4.1% |
| Liberal Arts & History | 1,778 | 5.0% |
| Visual & Performing Arts | 1,271 | 3.6% |
| Communications | 1,228 | 3.5% |
| Arts & Humanities | 2,359 | 6.7% |
| Total | 35,375 | 100.0% |
Transportation & Commute in Berrien County
Vehicle Availability by Sex in Berrien County
The most prevalent vehicle ownership categories in Berrien County are males with 2 vehicles (15,718, accounting for 43.4%) and females with 2 vehicles (13,357, making up 48.4%).
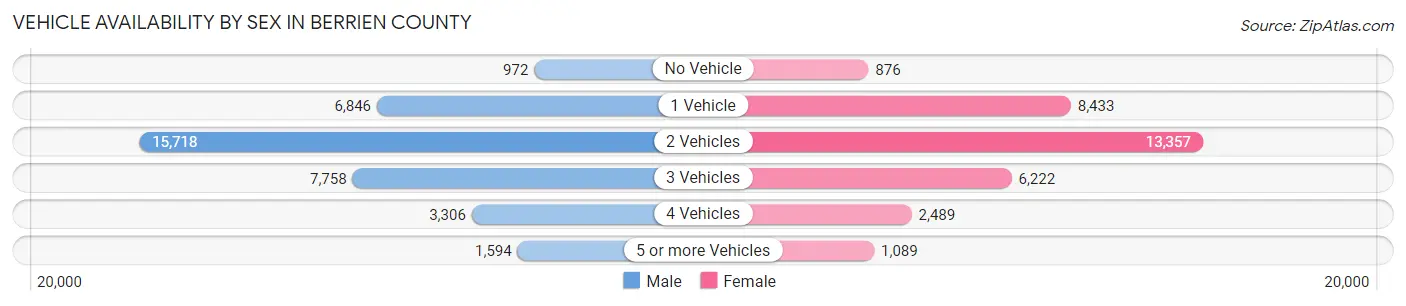
| Vehicles Available | Male | Female |
| No Vehicle | 972 (2.7%) | 876 (2.7%) |
| 1 Vehicle | 6,846 (18.9%) | 8,433 (26.0%) |
| 2 Vehicles | 15,718 (43.4%) | 13,357 (41.1%) |
| 3 Vehicles | 7,758 (21.4%) | 6,222 (19.2%) |
| 4 Vehicles | 3,306 (9.1%) | 2,489 (7.7%) |
| 5 or more Vehicles | 1,594 (4.4%) | 1,089 (3.4%) |
| Total | 36,194 (100.0%) | 32,466 (100.0%) |
Commute Time in Berrien County
The most frequently occuring commute durations in Berrien County are 15 to 19 minutes (11,950 commuters, 18.8%), 10 to 14 minutes (11,593 commuters, 18.2%), and 5 to 9 minutes (9,470 commuters, 14.9%).
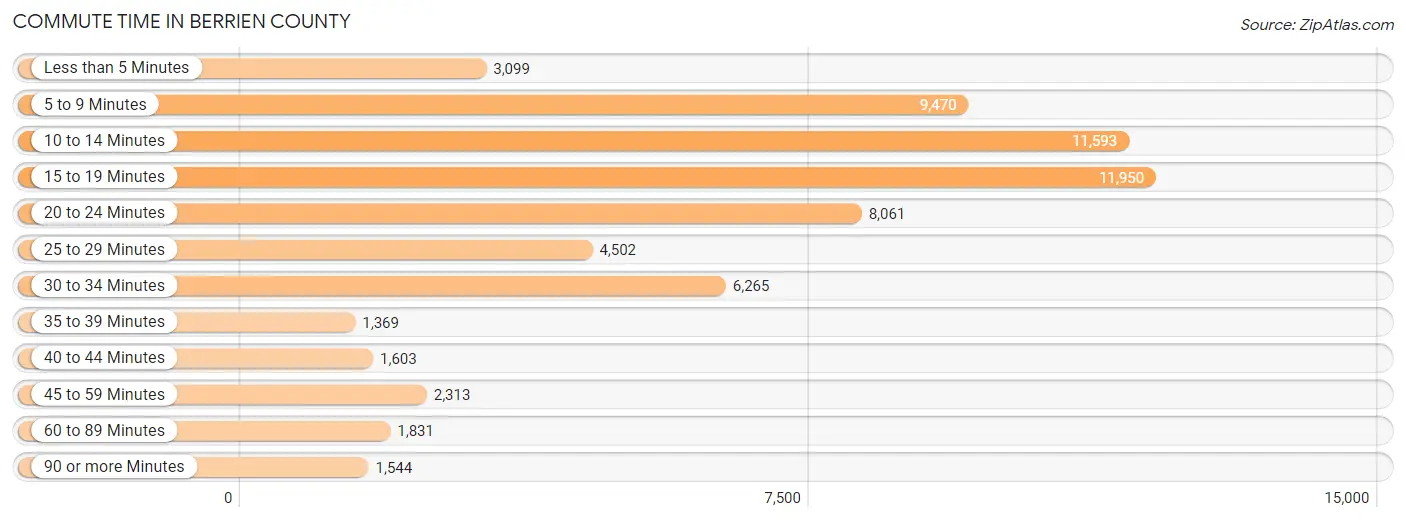
| Commute Time | # Commuters | % Commuters |
| Less than 5 Minutes | 3,099 | 4.9% |
| 5 to 9 Minutes | 9,470 | 14.9% |
| 10 to 14 Minutes | 11,593 | 18.2% |
| 15 to 19 Minutes | 11,950 | 18.8% |
| 20 to 24 Minutes | 8,061 | 12.7% |
| 25 to 29 Minutes | 4,502 | 7.1% |
| 30 to 34 Minutes | 6,265 | 9.9% |
| 35 to 39 Minutes | 1,369 | 2.1% |
| 40 to 44 Minutes | 1,603 | 2.5% |
| 45 to 59 Minutes | 2,313 | 3.6% |
| 60 to 89 Minutes | 1,831 | 2.9% |
| 90 or more Minutes | 1,544 | 2.4% |
Commute Time by Sex in Berrien County
The most common commute times in Berrien County are 15 to 19 minutes (6,404 commuters, 19.0%) for males and 10 to 14 minutes (6,159 commuters, 20.6%) for females.
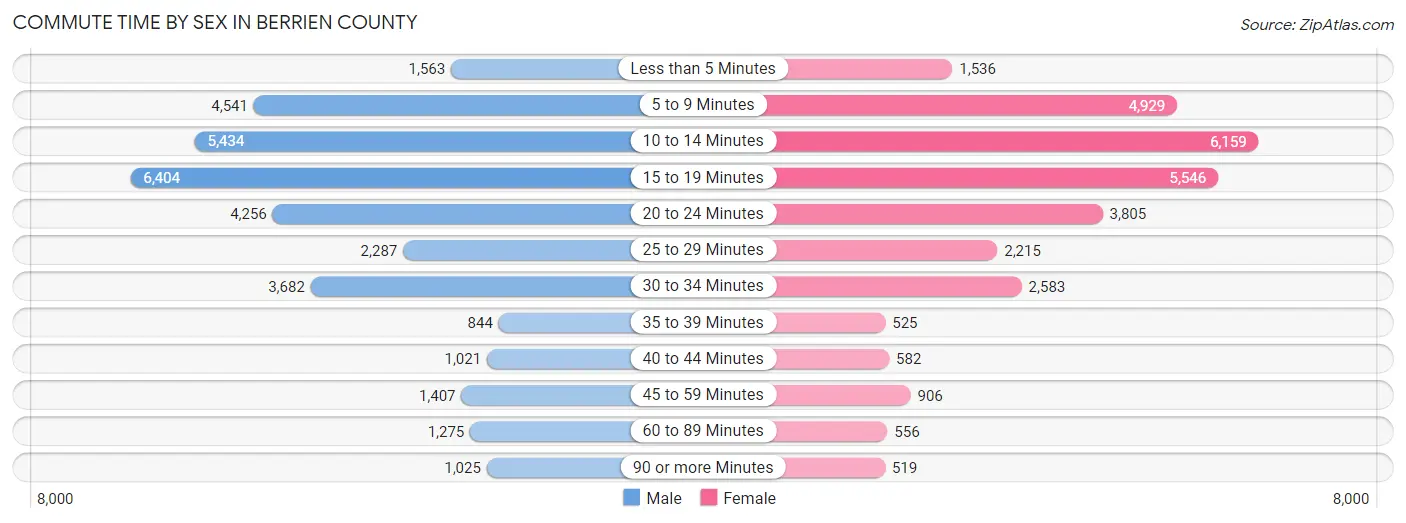
| Commute Time | Male | Female |
| Less than 5 Minutes | 1,563 (4.6%) | 1,536 (5.1%) |
| 5 to 9 Minutes | 4,541 (13.5%) | 4,929 (16.5%) |
| 10 to 14 Minutes | 5,434 (16.1%) | 6,159 (20.6%) |
| 15 to 19 Minutes | 6,404 (19.0%) | 5,546 (18.6%) |
| 20 to 24 Minutes | 4,256 (12.6%) | 3,805 (12.7%) |
| 25 to 29 Minutes | 2,287 (6.8%) | 2,215 (7.4%) |
| 30 to 34 Minutes | 3,682 (10.9%) | 2,583 (8.6%) |
| 35 to 39 Minutes | 844 (2.5%) | 525 (1.8%) |
| 40 to 44 Minutes | 1,021 (3.0%) | 582 (1.9%) |
| 45 to 59 Minutes | 1,407 (4.2%) | 906 (3.0%) |
| 60 to 89 Minutes | 1,275 (3.8%) | 556 (1.9%) |
| 90 or more Minutes | 1,025 (3.0%) | 519 (1.7%) |
Time of Departure to Work by Sex in Berrien County
The most frequent times of departure to work in Berrien County are 7:00 AM to 7:29 AM (4,300, 12.7%) for males and 7:30 AM to 7:59 AM (4,810, 16.1%) for females.
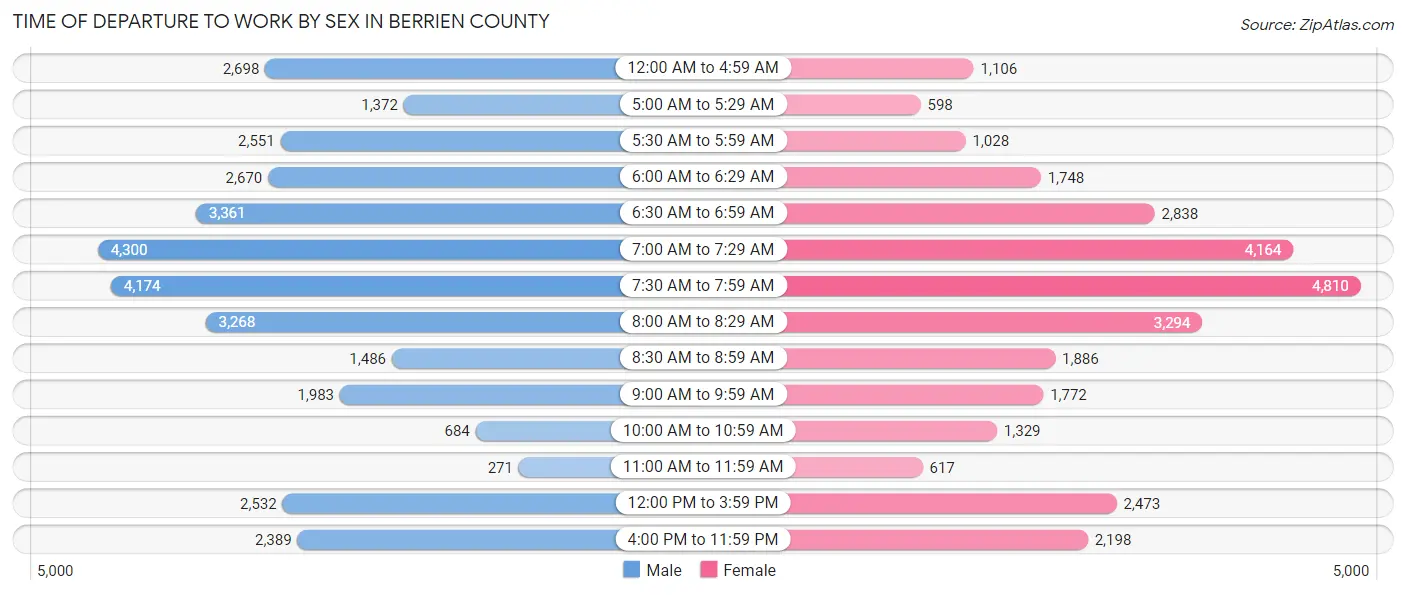
| Time of Departure | Male | Female |
| 12:00 AM to 4:59 AM | 2,698 (8.0%) | 1,106 (3.7%) |
| 5:00 AM to 5:29 AM | 1,372 (4.1%) | 598 (2.0%) |
| 5:30 AM to 5:59 AM | 2,551 (7.6%) | 1,028 (3.4%) |
| 6:00 AM to 6:29 AM | 2,670 (7.9%) | 1,748 (5.9%) |
| 6:30 AM to 6:59 AM | 3,361 (10.0%) | 2,838 (9.5%) |
| 7:00 AM to 7:29 AM | 4,300 (12.7%) | 4,164 (13.9%) |
| 7:30 AM to 7:59 AM | 4,174 (12.4%) | 4,810 (16.1%) |
| 8:00 AM to 8:29 AM | 3,268 (9.7%) | 3,294 (11.0%) |
| 8:30 AM to 8:59 AM | 1,486 (4.4%) | 1,886 (6.3%) |
| 9:00 AM to 9:59 AM | 1,983 (5.9%) | 1,772 (5.9%) |
| 10:00 AM to 10:59 AM | 684 (2.0%) | 1,329 (4.4%) |
| 11:00 AM to 11:59 AM | 271 (0.8%) | 617 (2.1%) |
| 12:00 PM to 3:59 PM | 2,532 (7.5%) | 2,473 (8.3%) |
| 4:00 PM to 11:59 PM | 2,389 (7.1%) | 2,198 (7.4%) |
| Total | 33,739 (100.0%) | 29,861 (100.0%) |
Housing Occupancy in Berrien County
Occupancy by Ownership in Berrien County
Of the total 63,512 dwellings in Berrien County, owner-occupied units account for 46,359 (73.0%), while renter-occupied units make up 17,153 (27.0%).
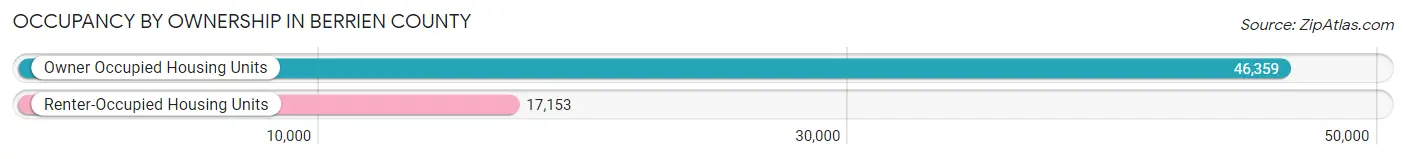
| Occupancy | # Housing Units | % Housing Units |
| Owner Occupied Housing Units | 46,359 | 73.0% |
| Renter-Occupied Housing Units | 17,153 | 27.0% |
| Total Occupied Housing Units | 63,512 | 100.0% |
Occupancy by Household Size in Berrien County
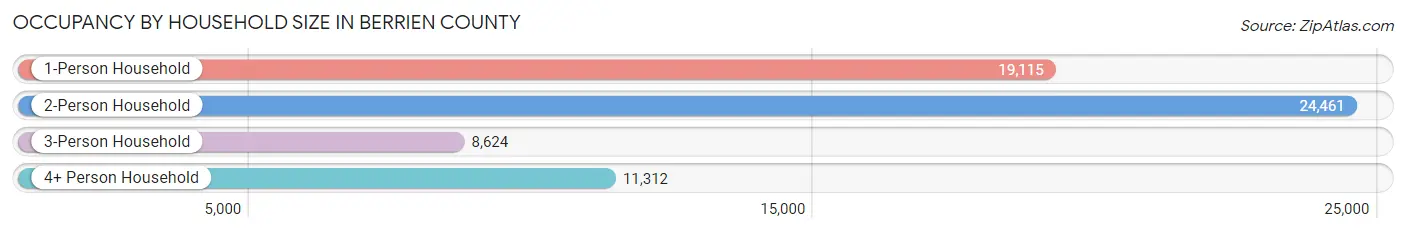
| Household Size | # Housing Units | % Housing Units |
| 1-Person Household | 19,115 | 30.1% |
| 2-Person Household | 24,461 | 38.5% |
| 3-Person Household | 8,624 | 13.6% |
| 4+ Person Household | 11,312 | 17.8% |
| Total Housing Units | 63,512 | 100.0% |
Occupancy by Ownership by Household Size in Berrien County
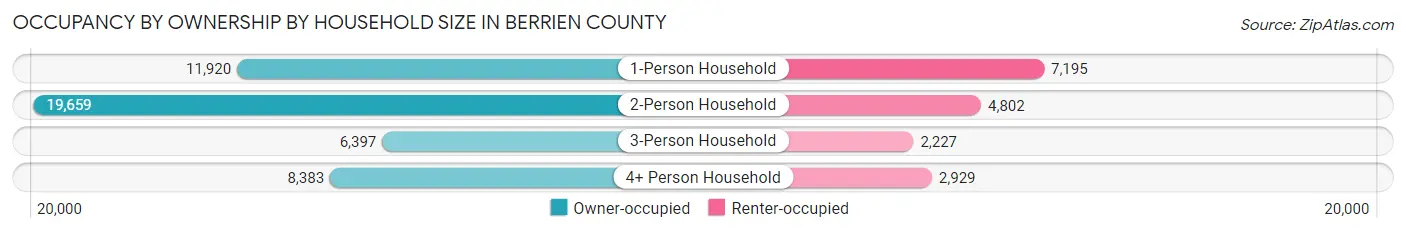
| Household Size | Owner-occupied | Renter-occupied |
| 1-Person Household | 11,920 (62.4%) | 7,195 (37.6%) |
| 2-Person Household | 19,659 (80.4%) | 4,802 (19.6%) |
| 3-Person Household | 6,397 (74.2%) | 2,227 (25.8%) |
| 4+ Person Household | 8,383 (74.1%) | 2,929 (25.9%) |
| Total Housing Units | 46,359 (73.0%) | 17,153 (27.0%) |
Occupancy by Educational Attainment in Berrien County
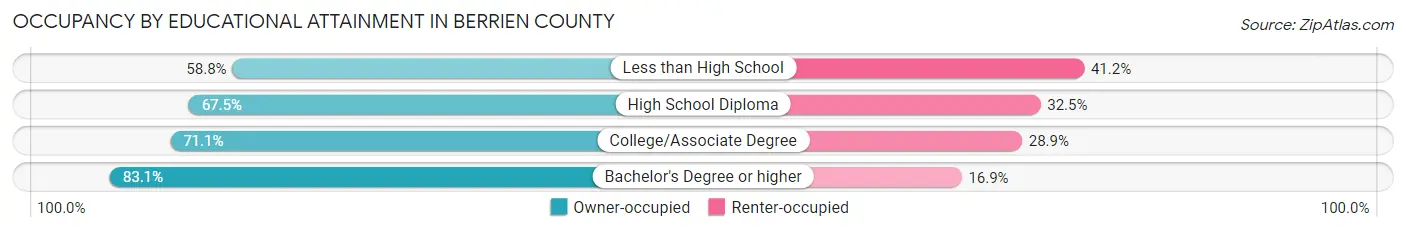
| Household Size | Owner-occupied | Renter-occupied |
| Less than High School | 2,792 (58.8%) | 1,956 (41.2%) |
| High School Diploma | 10,949 (67.5%) | 5,281 (32.5%) |
| College/Associate Degree | 16,176 (71.1%) | 6,569 (28.9%) |
| Bachelor's Degree or higher | 16,442 (83.1%) | 3,347 (16.9%) |
Occupancy by Age of Householder in Berrien County
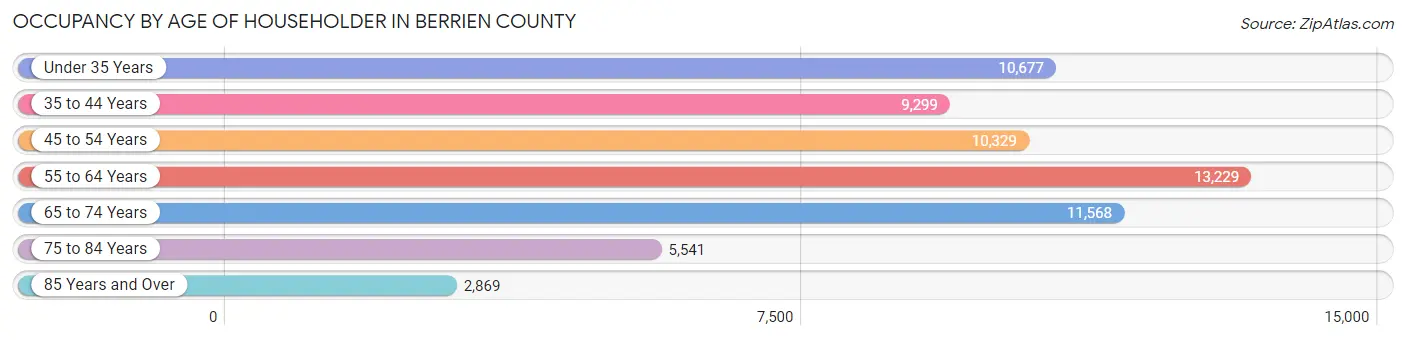
| Age Bracket | # Households | % Households |
| Under 35 Years | 10,677 | 16.8% |
| 35 to 44 Years | 9,299 | 14.6% |
| 45 to 54 Years | 10,329 | 16.3% |
| 55 to 64 Years | 13,229 | 20.8% |
| 65 to 74 Years | 11,568 | 18.2% |
| 75 to 84 Years | 5,541 | 8.7% |
| 85 Years and Over | 2,869 | 4.5% |
| Total | 63,512 | 100.0% |
Housing Finances in Berrien County
Median Income by Occupancy in Berrien County
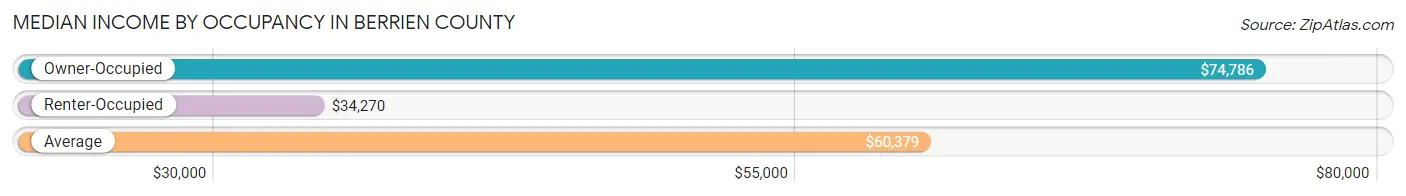
| Occupancy Type | # Households | Median Income |
| Owner-Occupied | 46,359 (73.0%) | $74,786 |
| Renter-Occupied | 17,153 (27.0%) | $34,270 |
| Average | 63,512 (100.0%) | $60,379 |
Occupancy by Householder Income Bracket in Berrien County
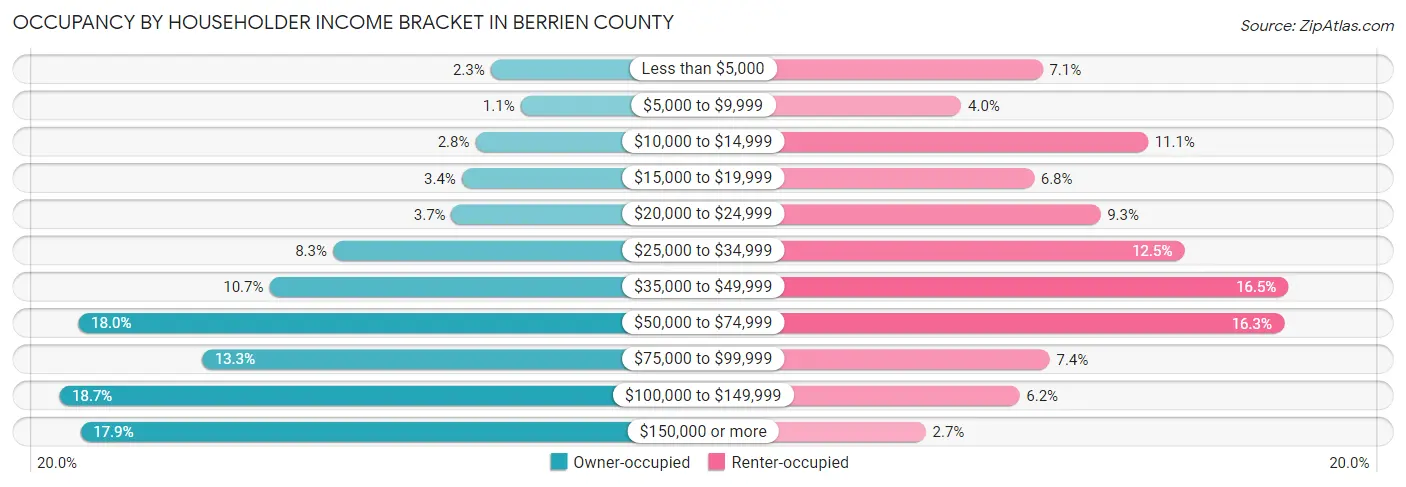
| Income Bracket | Owner-occupied | Renter-occupied |
| Less than $5,000 | 1,044 (2.2%) | 1,222 (7.1%) |
| $5,000 to $9,999 | 514 (1.1%) | 689 (4.0%) |
| $10,000 to $14,999 | 1,312 (2.8%) | 1,909 (11.1%) |
| $15,000 to $19,999 | 1,551 (3.4%) | 1,165 (6.8%) |
| $20,000 to $24,999 | 1,735 (3.7%) | 1,598 (9.3%) |
| $25,000 to $34,999 | 3,830 (8.3%) | 2,148 (12.5%) |
| $35,000 to $49,999 | 4,950 (10.7%) | 2,827 (16.5%) |
| $50,000 to $74,999 | 8,327 (18.0%) | 2,798 (16.3%) |
| $75,000 to $99,999 | 6,143 (13.3%) | 1,268 (7.4%) |
| $100,000 to $149,999 | 8,663 (18.7%) | 1,071 (6.2%) |
| $150,000 or more | 8,290 (17.9%) | 458 (2.7%) |
| Total | 46,359 (100.0%) | 17,153 (100.0%) |
Monthly Housing Cost Tiers in Berrien County
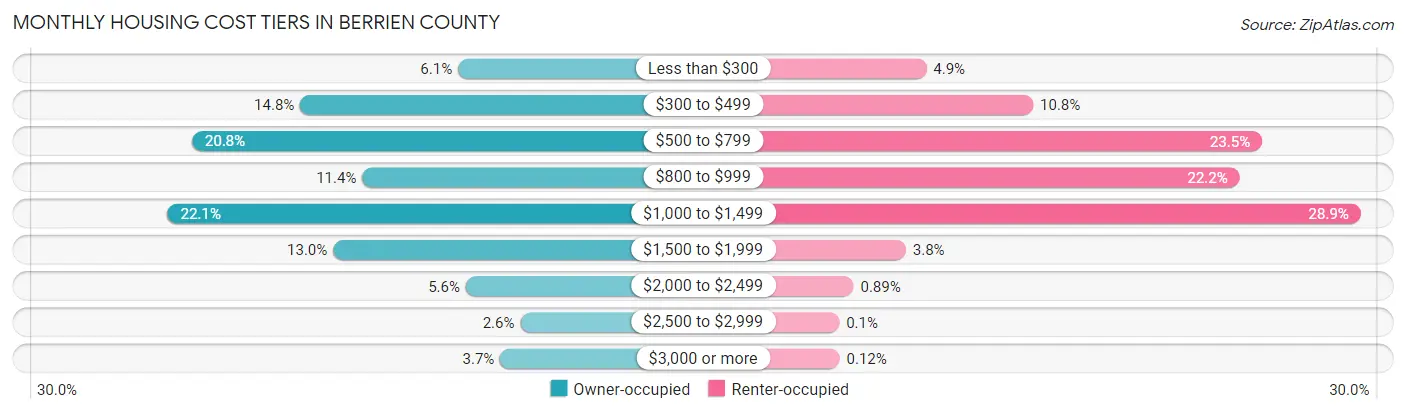
| Monthly Cost | Owner-occupied | Renter-occupied |
| Less than $300 | 2,808 (6.1%) | 843 (4.9%) |
| $300 to $499 | 6,852 (14.8%) | 1,855 (10.8%) |
| $500 to $799 | 9,623 (20.8%) | 4,023 (23.4%) |
| $800 to $999 | 5,263 (11.4%) | 3,810 (22.2%) |
| $1,000 to $1,499 | 10,247 (22.1%) | 4,958 (28.9%) |
| $1,500 to $1,999 | 6,009 (13.0%) | 649 (3.8%) |
| $2,000 to $2,499 | 2,612 (5.6%) | 152 (0.9%) |
| $2,500 to $2,999 | 1,215 (2.6%) | 18 (0.1%) |
| $3,000 or more | 1,730 (3.7%) | 20 (0.1%) |
| Total | 46,359 (100.0%) | 17,153 (100.0%) |
Physical Housing Characteristics in Berrien County
Housing Structures in Berrien County
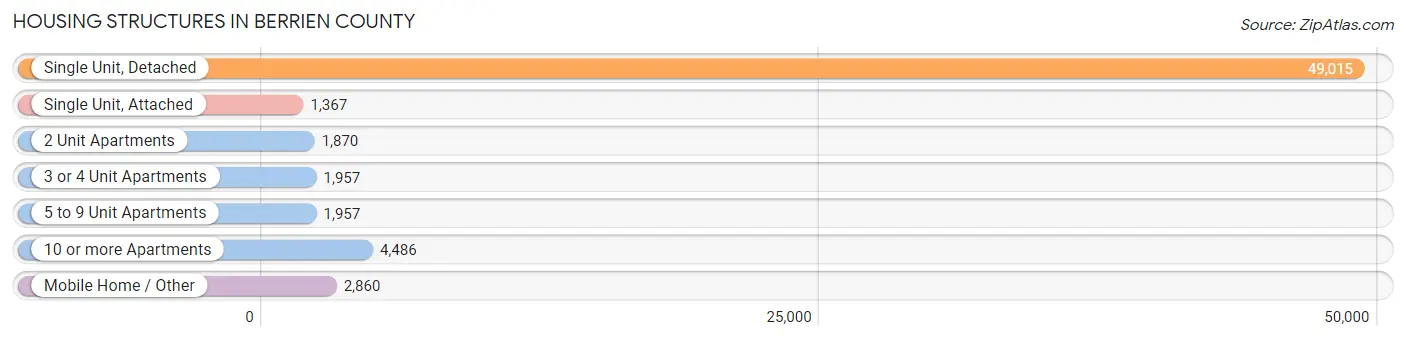
| Structure Type | # Housing Units | % Housing Units |
| Single Unit, Detached | 49,015 | 77.2% |
| Single Unit, Attached | 1,367 | 2.1% |
| 2 Unit Apartments | 1,870 | 2.9% |
| 3 or 4 Unit Apartments | 1,957 | 3.1% |
| 5 to 9 Unit Apartments | 1,957 | 3.1% |
| 10 or more Apartments | 4,486 | 7.1% |
| Mobile Home / Other | 2,860 | 4.5% |
| Total | 63,512 | 100.0% |
Housing Structures by Occupancy in Berrien County
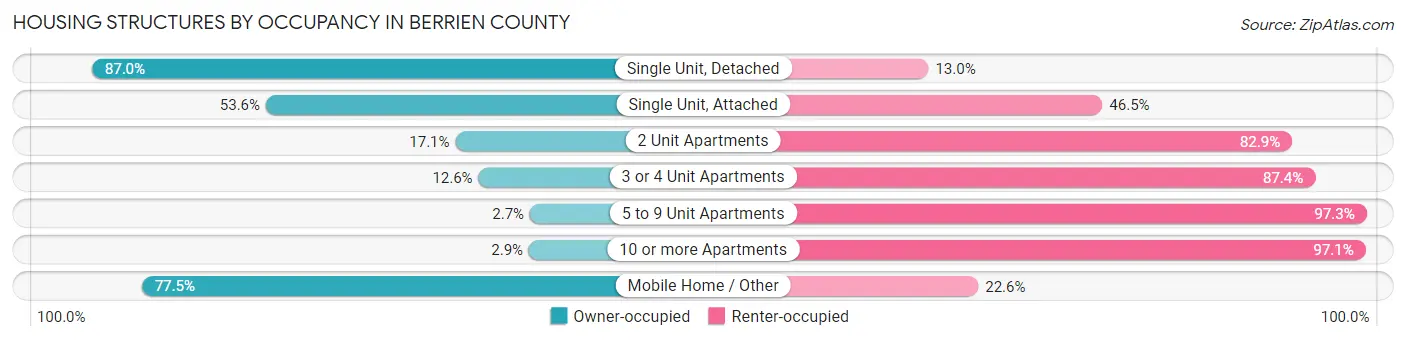
| Structure Type | Owner-occupied | Renter-occupied |
| Single Unit, Detached | 42,663 (87.0%) | 6,352 (13.0%) |
| Single Unit, Attached | 732 (53.5%) | 635 (46.5%) |
| 2 Unit Apartments | 319 (17.1%) | 1,551 (82.9%) |
| 3 or 4 Unit Apartments | 247 (12.6%) | 1,710 (87.4%) |
| 5 to 9 Unit Apartments | 53 (2.7%) | 1,904 (97.3%) |
| 10 or more Apartments | 130 (2.9%) | 4,356 (97.1%) |
| Mobile Home / Other | 2,215 (77.4%) | 645 (22.6%) |
| Total | 46,359 (73.0%) | 17,153 (27.0%) |
Housing Structures by Number of Rooms in Berrien County
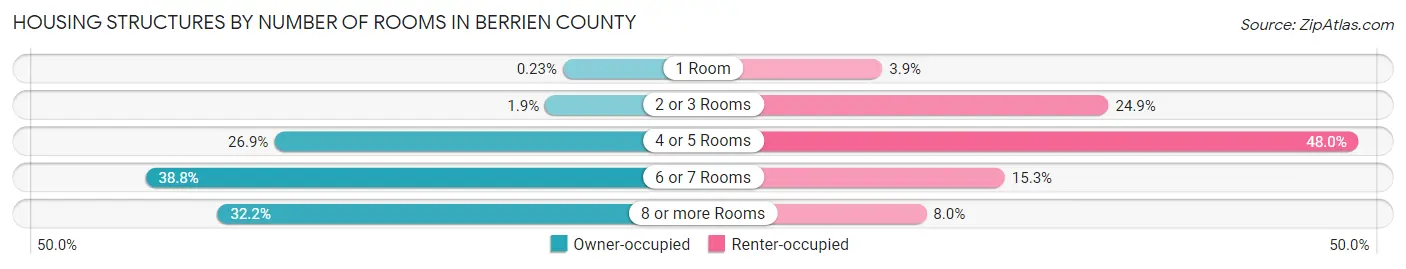
| Number of Rooms | Owner-occupied | Renter-occupied |
| 1 Room | 108 (0.2%) | 673 (3.9%) |
| 2 or 3 Rooms | 866 (1.9%) | 4,263 (24.8%) |
| 4 or 5 Rooms | 12,480 (26.9%) | 8,227 (48.0%) |
| 6 or 7 Rooms | 17,998 (38.8%) | 2,618 (15.3%) |
| 8 or more Rooms | 14,907 (32.2%) | 1,372 (8.0%) |
| Total | 46,359 (100.0%) | 17,153 (100.0%) |
Housing Structure by Heating Type in Berrien County
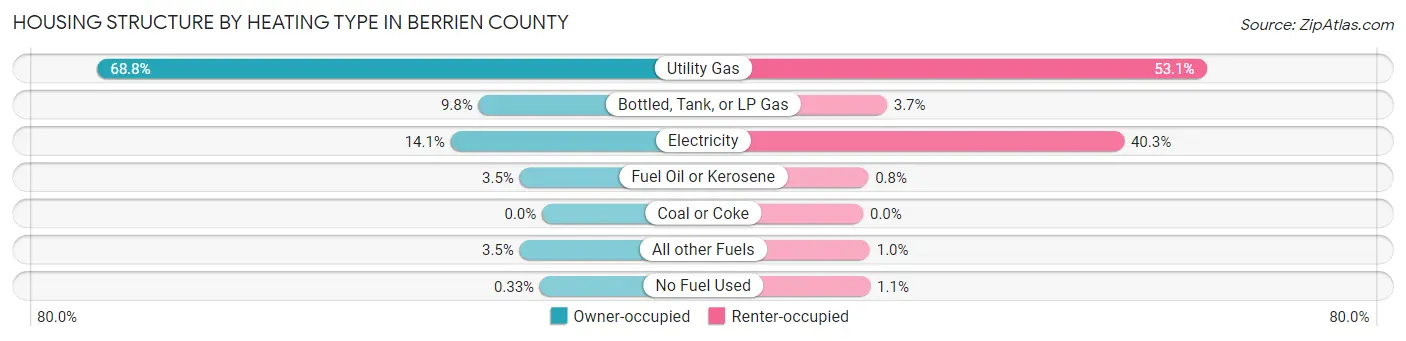
| Heating Type | Owner-occupied | Renter-occupied |
| Utility Gas | 31,878 (68.8%) | 9,101 (53.1%) |
| Bottled, Tank, or LP Gas | 4,555 (9.8%) | 629 (3.7%) |
| Electricity | 6,551 (14.1%) | 6,919 (40.3%) |
| Fuel Oil or Kerosene | 1,610 (3.5%) | 138 (0.8%) |
| Coal or Coke | 0 (0.0%) | 0 (0.0%) |
| All other Fuels | 1,612 (3.5%) | 178 (1.0%) |
| No Fuel Used | 153 (0.3%) | 188 (1.1%) |
| Total | 46,359 (100.0%) | 17,153 (100.0%) |
Household Vehicle Usage in Berrien County
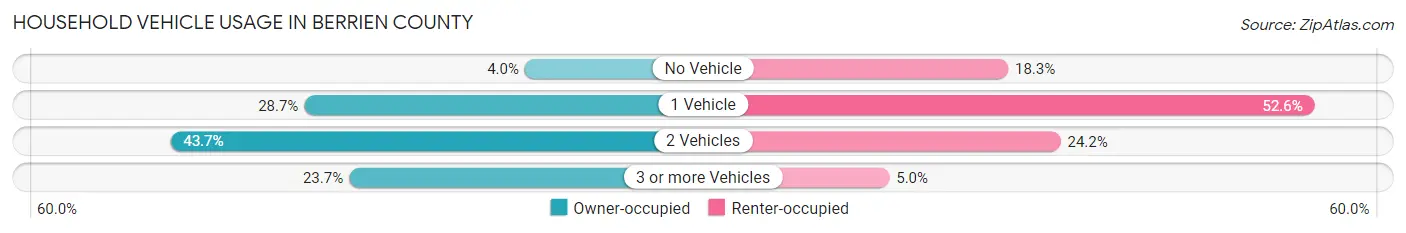
| Vehicles per Household | Owner-occupied | Renter-occupied |
| No Vehicle | 1,842 (4.0%) | 3,134 (18.3%) |
| 1 Vehicle | 13,297 (28.7%) | 9,023 (52.6%) |
| 2 Vehicles | 20,251 (43.7%) | 4,143 (24.1%) |
| 3 or more Vehicles | 10,969 (23.7%) | 853 (5.0%) |
| Total | 46,359 (100.0%) | 17,153 (100.0%) |
Real Estate & Mortgages in Berrien County
Real Estate and Mortgage Overview in Berrien County
| Characteristic | Without Mortgage | With Mortgage |
| Housing Units | 19,860 | 26,499 |
| Median Property Value | $179,400 | $203,700 |
| Median Household Income | $59,185 | $5,834 |
| Monthly Housing Costs | $519 | $1,655 |
| Real Estate Taxes | $2,074 | $881 |
Property Value by Mortgage Status in Berrien County
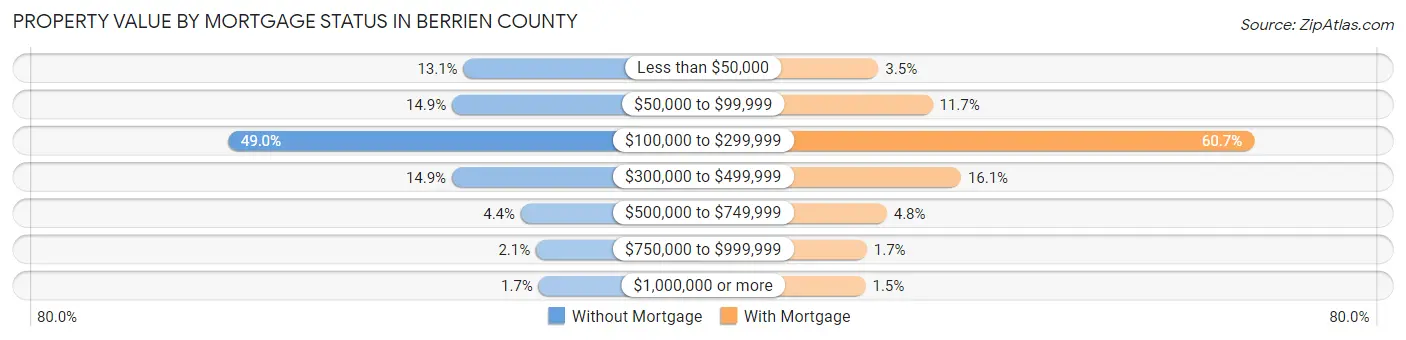
| Property Value | Without Mortgage | With Mortgage |
| Less than $50,000 | 2,608 (13.1%) | 923 (3.5%) |
| $50,000 to $99,999 | 2,953 (14.9%) | 3,108 (11.7%) |
| $100,000 to $299,999 | 9,735 (49.0%) | 16,091 (60.7%) |
| $300,000 to $499,999 | 2,956 (14.9%) | 4,257 (16.1%) |
| $500,000 to $749,999 | 869 (4.4%) | 1,262 (4.8%) |
| $750,000 to $999,999 | 409 (2.1%) | 456 (1.7%) |
| $1,000,000 or more | 330 (1.7%) | 402 (1.5%) |
| Total | 19,860 (100.0%) | 26,499 (100.0%) |
Household Income by Mortgage Status in Berrien County
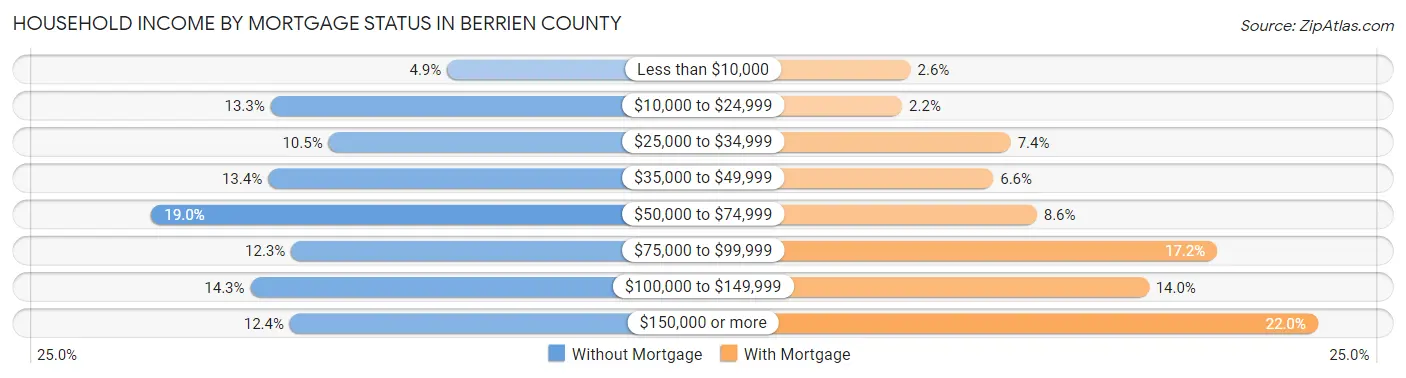
| Household Income | Without Mortgage | With Mortgage |
| Less than $10,000 | 969 (4.9%) | 694 (2.6%) |
| $10,000 to $24,999 | 2,640 (13.3%) | 589 (2.2%) |
| $25,000 to $34,999 | 2,092 (10.5%) | 1,958 (7.4%) |
| $35,000 to $49,999 | 2,663 (13.4%) | 1,738 (6.6%) |
| $50,000 to $74,999 | 3,765 (19.0%) | 2,287 (8.6%) |
| $75,000 to $99,999 | 2,444 (12.3%) | 4,562 (17.2%) |
| $100,000 to $149,999 | 2,831 (14.2%) | 3,699 (14.0%) |
| $150,000 or more | 2,456 (12.4%) | 5,832 (22.0%) |
| Total | 19,860 (100.0%) | 26,499 (100.0%) |
Property Value to Household Income Ratio in Berrien County
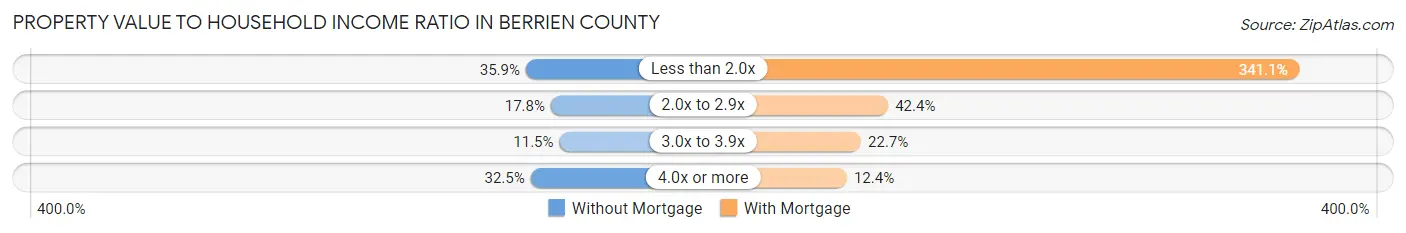
| Value-to-Income Ratio | Without Mortgage | With Mortgage |
| Less than 2.0x | 7,128 (35.9%) | 90,386 (341.1%) |
| 2.0x to 2.9x | 3,525 (17.7%) | 11,227 (42.4%) |
| 3.0x to 3.9x | 2,290 (11.5%) | 6,008 (22.7%) |
| 4.0x or more | 6,444 (32.5%) | 3,288 (12.4%) |
| Total | 19,860 (100.0%) | 26,499 (100.0%) |
Real Estate Taxes by Mortgage Status in Berrien County
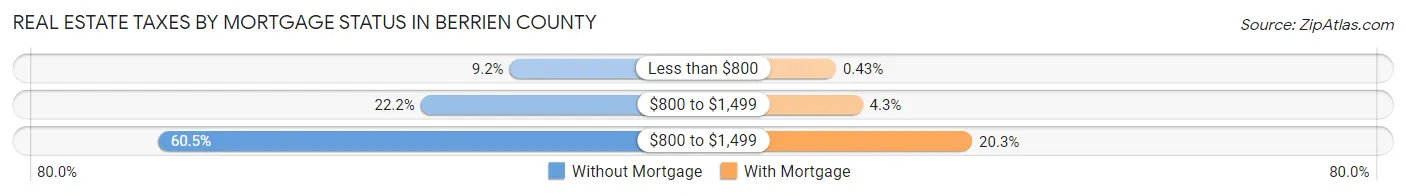
| Property Taxes | Without Mortgage | With Mortgage |
| Less than $800 | 1,819 (9.2%) | 115 (0.4%) |
| $800 to $1,499 | 4,399 (22.2%) | 1,145 (4.3%) |
| $800 to $1,499 | 12,021 (60.5%) | 5,386 (20.3%) |
| Total | 19,860 (100.0%) | 26,499 (100.0%) |
Health & Disability in Berrien County
Health Insurance Coverage by Age in Berrien County
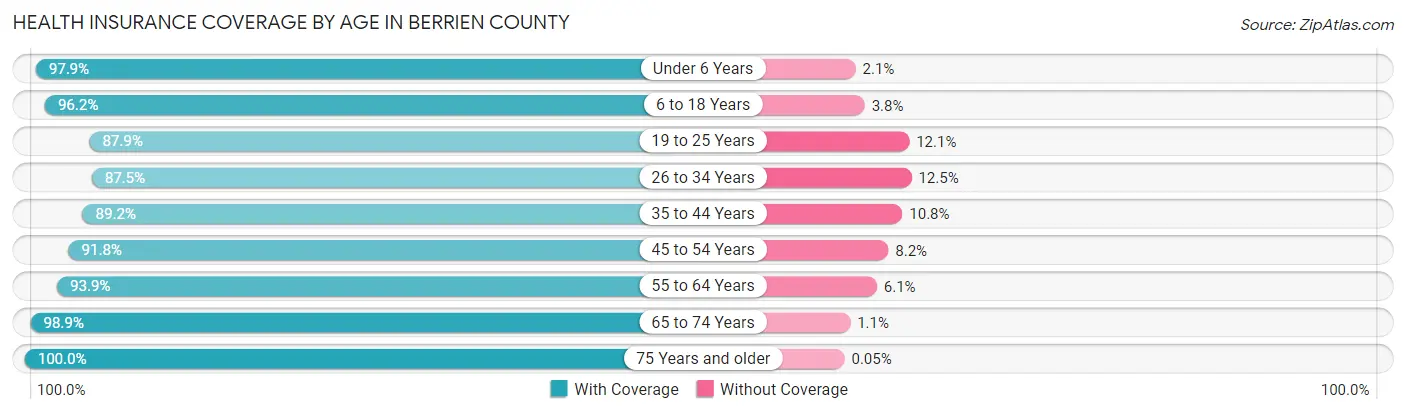
| Age Bracket | With Coverage | Without Coverage |
| Under 6 Years | 10,032 (97.9%) | 216 (2.1%) |
| 6 to 18 Years | 23,905 (96.2%) | 947 (3.8%) |
| 19 to 25 Years | 10,678 (87.9%) | 1,471 (12.1%) |
| 26 to 34 Years | 13,998 (87.5%) | 2,006 (12.5%) |
| 35 to 44 Years | 16,012 (89.2%) | 1,945 (10.8%) |
| 45 to 54 Years | 17,001 (91.8%) | 1,523 (8.2%) |
| 55 to 64 Years | 20,898 (93.9%) | 1,351 (6.1%) |
| 65 to 74 Years | 18,113 (98.9%) | 201 (1.1%) |
| 75 Years and older | 12,521 (100.0%) | 6 (0.1%) |
| Total | 143,158 (93.7%) | 9,666 (6.3%) |
Health Insurance Coverage by Citizenship Status in Berrien County
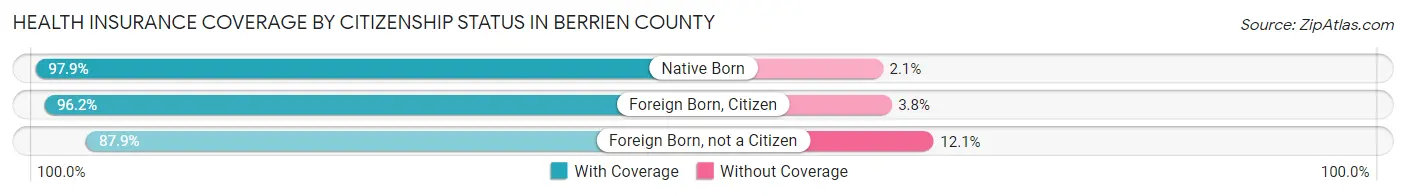
| Citizenship Status | With Coverage | Without Coverage |
| Native Born | 10,032 (97.9%) | 216 (2.1%) |
| Foreign Born, Citizen | 23,905 (96.2%) | 947 (3.8%) |
| Foreign Born, not a Citizen | 10,678 (87.9%) | 1,471 (12.1%) |
Health Insurance Coverage by Household Income in Berrien County
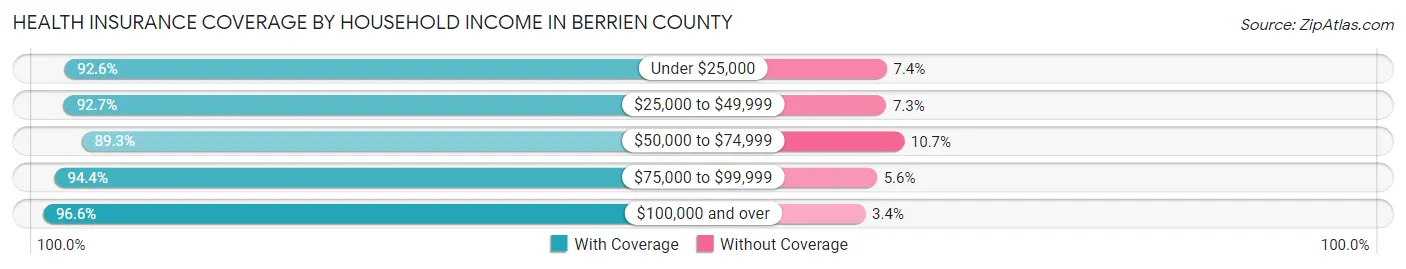
| Household Income | With Coverage | Without Coverage |
| Under $25,000 | 20,617 (92.6%) | 1,658 (7.4%) |
| $25,000 to $49,999 | 26,762 (92.7%) | 2,120 (7.3%) |
| $50,000 to $74,999 | 22,694 (89.3%) | 2,716 (10.7%) |
| $75,000 to $99,999 | 19,131 (94.4%) | 1,138 (5.6%) |
| $100,000 and over | 52,142 (96.6%) | 1,860 (3.4%) |
Public vs Private Health Insurance Coverage by Age in Berrien County
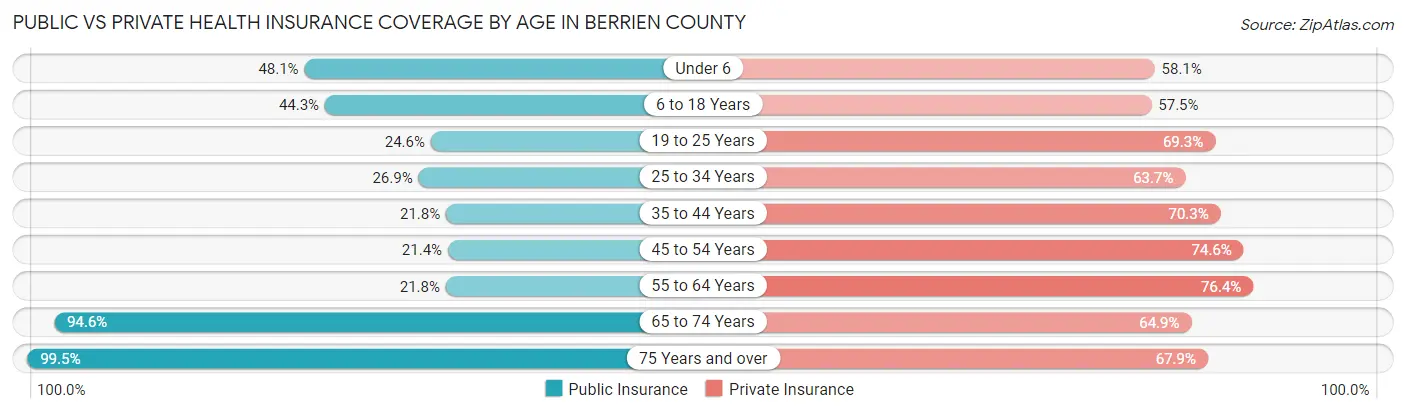
| Age Bracket | Public Insurance | Private Insurance |
| Under 6 | 4,925 (48.1%) | 5,950 (58.1%) |
| 6 to 18 Years | 10,996 (44.3%) | 14,280 (57.5%) |
| 19 to 25 Years | 2,990 (24.6%) | 8,415 (69.3%) |
| 25 to 34 Years | 4,304 (26.9%) | 10,201 (63.7%) |
| 35 to 44 Years | 3,910 (21.8%) | 12,623 (70.3%) |
| 45 to 54 Years | 3,969 (21.4%) | 13,815 (74.6%) |
| 55 to 64 Years | 4,855 (21.8%) | 16,987 (76.3%) |
| 65 to 74 Years | 17,315 (94.6%) | 11,880 (64.9%) |
| 75 Years and over | 12,464 (99.5%) | 8,508 (67.9%) |
| Total | 65,728 (43.0%) | 102,659 (67.2%) |
Disability Status by Sex by Age in Berrien County
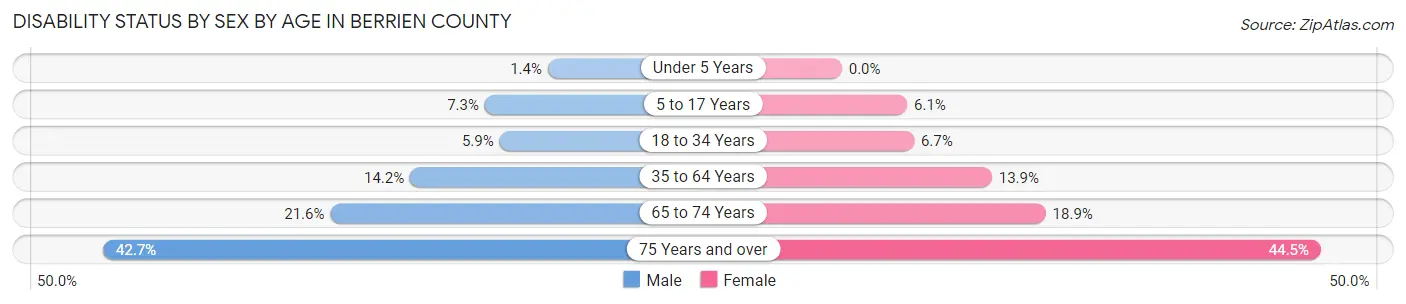
| Age Bracket | Male | Female |
| Under 5 Years | 62 (1.4%) | 0 (0.0%) |
| 5 to 17 Years | 922 (7.3%) | 735 (6.1%) |
| 18 to 34 Years | 899 (5.9%) | 1,001 (6.7%) |
| 35 to 64 Years | 4,135 (14.2%) | 4,131 (13.9%) |
| 65 to 74 Years | 1,888 (21.6%) | 1,814 (18.9%) |
| 75 Years and over | 2,280 (42.7%) | 3,197 (44.5%) |
Disability Class by Sex by Age in Berrien County
Disability Class: Hearing Difficulty
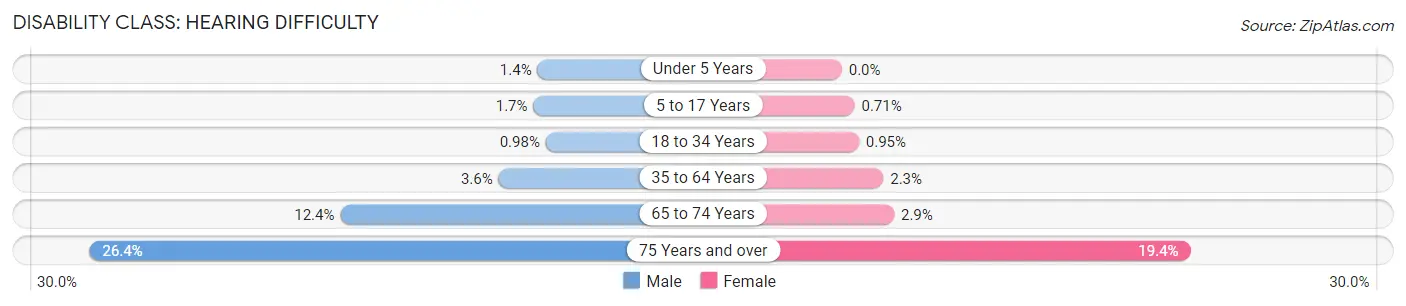
| Age Bracket | Male | Female |
| Under 5 Years | 62 (1.4%) | 0 (0.0%) |
| 5 to 17 Years | 211 (1.7%) | 86 (0.7%) |
| 18 to 34 Years | 149 (1.0%) | 142 (0.9%) |
| 35 to 64 Years | 1,050 (3.6%) | 684 (2.3%) |
| 65 to 74 Years | 1,084 (12.4%) | 279 (2.9%) |
| 75 Years and over | 1,408 (26.4%) | 1,396 (19.4%) |
Disability Class: Vision Difficulty
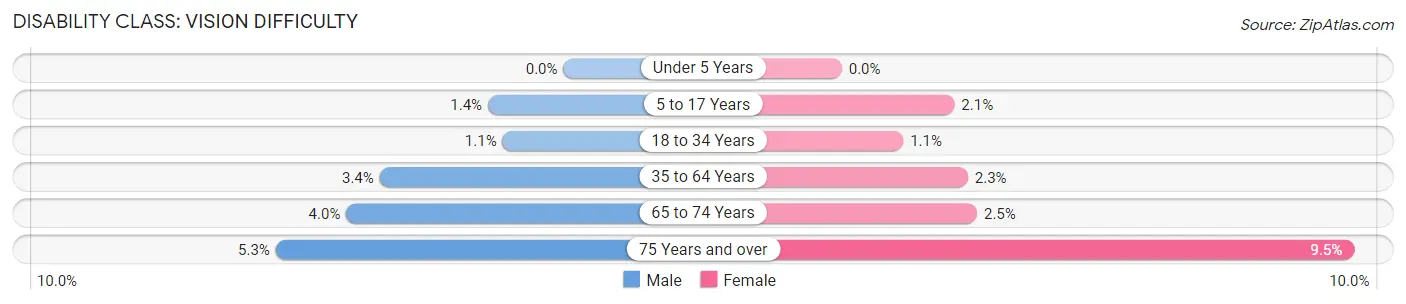
| Age Bracket | Male | Female |
| Under 5 Years | 0 (0.0%) | 0 (0.0%) |
| 5 to 17 Years | 177 (1.4%) | 253 (2.1%) |
| 18 to 34 Years | 171 (1.1%) | 170 (1.1%) |
| 35 to 64 Years | 991 (3.4%) | 694 (2.3%) |
| 65 to 74 Years | 352 (4.0%) | 241 (2.5%) |
| 75 Years and over | 285 (5.3%) | 684 (9.5%) |
Disability Class: Cognitive Difficulty
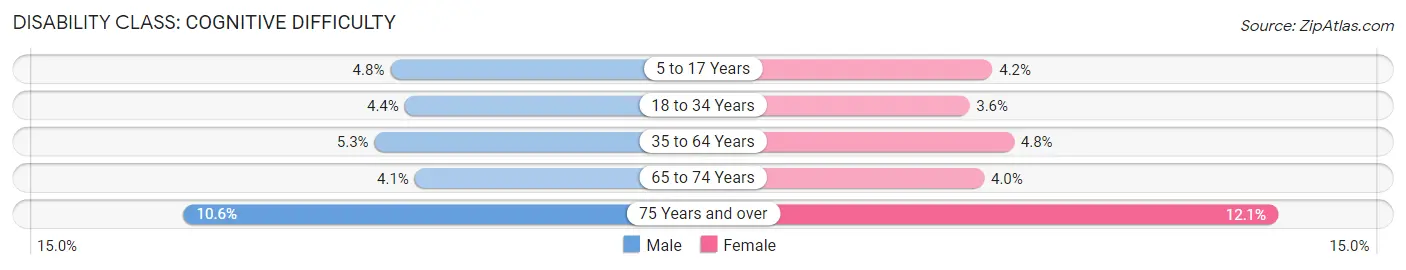
| Age Bracket | Male | Female |
| 5 to 17 Years | 610 (4.8%) | 508 (4.2%) |
| 18 to 34 Years | 671 (4.4%) | 530 (3.5%) |
| 35 to 64 Years | 1,529 (5.3%) | 1,422 (4.8%) |
| 65 to 74 Years | 361 (4.1%) | 380 (4.0%) |
| 75 Years and over | 564 (10.6%) | 873 (12.1%) |
Disability Class: Ambulatory Difficulty
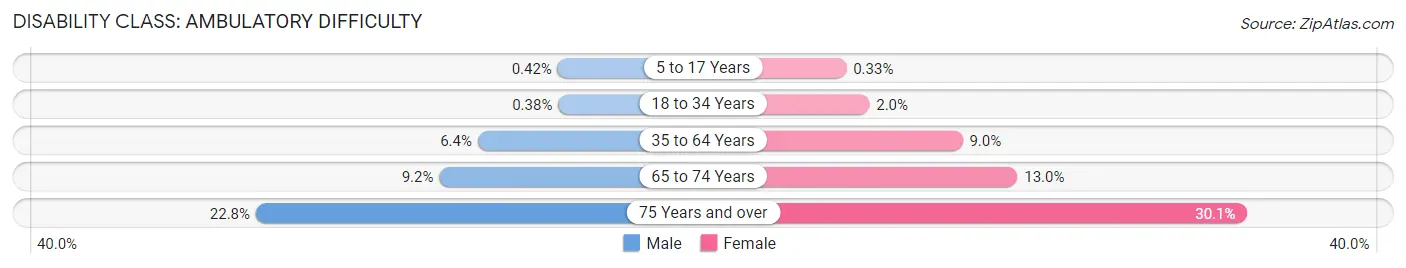
| Age Bracket | Male | Female |
| 5 to 17 Years | 53 (0.4%) | 40 (0.3%) |
| 18 to 34 Years | 58 (0.4%) | 304 (2.0%) |
| 35 to 64 Years | 1,845 (6.4%) | 2,660 (9.0%) |
| 65 to 74 Years | 804 (9.2%) | 1,249 (13.0%) |
| 75 Years and over | 1,218 (22.8%) | 2,165 (30.1%) |
Disability Class: Self-Care Difficulty
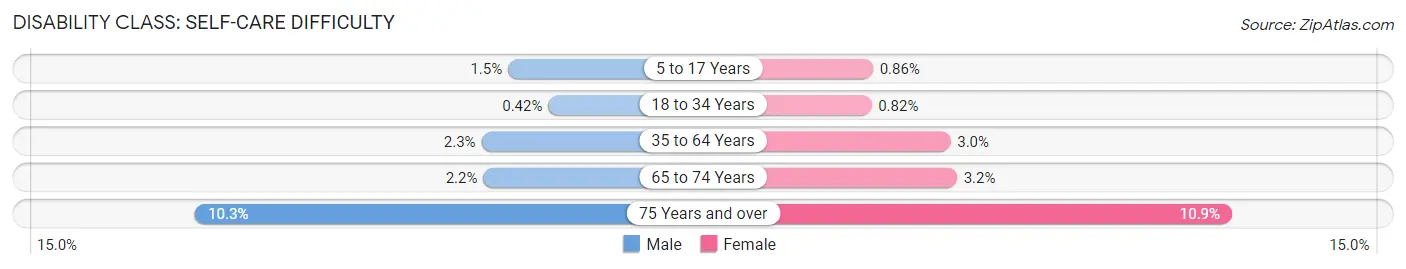
| Age Bracket | Male | Female |
| 5 to 17 Years | 195 (1.5%) | 104 (0.9%) |
| 18 to 34 Years | 64 (0.4%) | 123 (0.8%) |
| 35 to 64 Years | 662 (2.3%) | 896 (3.0%) |
| 65 to 74 Years | 195 (2.2%) | 307 (3.2%) |
| 75 Years and over | 547 (10.2%) | 781 (10.9%) |
Technology Access in Berrien County
Computing Device Access in Berrien County
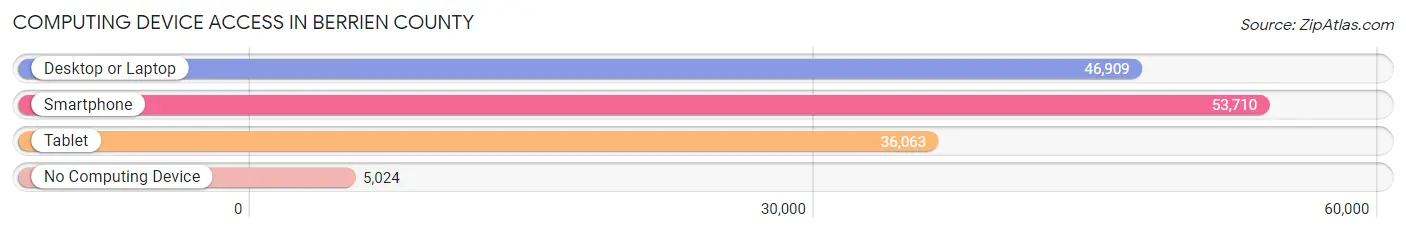
| Device Type | # Households | % Households |
| Desktop or Laptop | 46,909 | 73.9% |
| Smartphone | 53,710 | 84.6% |
| Tablet | 36,063 | 56.8% |
| No Computing Device | 5,024 | 7.9% |
| Total | 63,512 | 100.0% |
Internet Access in Berrien County
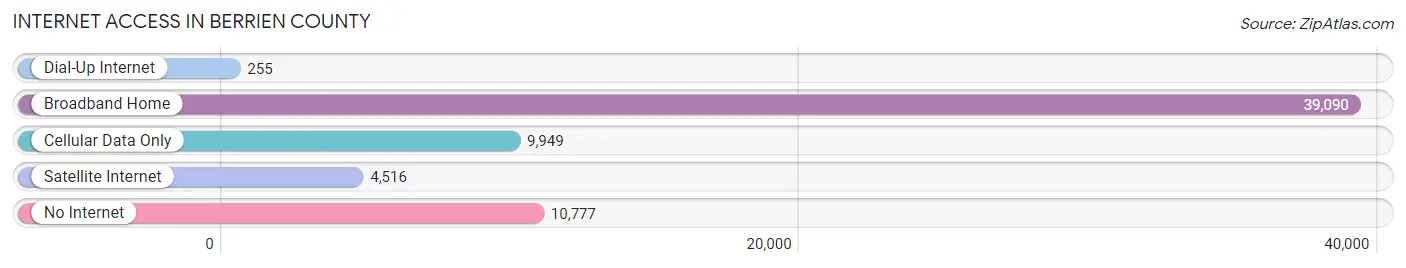
| Internet Type | # Households | % Households |
| Dial-Up Internet | 255 | 0.4% |
| Broadband Home | 39,090 | 61.6% |
| Cellular Data Only | 9,949 | 15.7% |
| Satellite Internet | 4,516 | 7.1% |
| No Internet | 10,777 | 17.0% |
| Total | 63,512 | 100.0% |
Berrien County Summary
Berrien County, Michigan is located in the southwestern corner of the state, along the Michigan-Indiana border. It is bordered by Lake Michigan to the west, LaPorte County, Indiana to the south, Cass County to the east, and Van Buren County to the north. The county seat is St. Joseph, and the largest city is Benton Harbor. The county has a total area of 576 square miles, of which 545 square miles is land and 31 square miles is water.
History
Berrien County was established in 1829 and named after John M. Berrien, a U.S. Senator from Georgia. The county was originally part of the Northwest Territory, and was later part of the Michigan Territory. The county was organized in 1831, and the first county seat was located in Niles. In 1837, the county seat was moved to St. Joseph.
The county was home to several Native American tribes, including the Potawatomi, Ottawa, and Chippewa. The first European settlers arrived in the area in the early 1800s, and the county was quickly developed for agriculture. The county was also home to several industries, including lumber, iron, and shipbuilding.
Geography
Berrien County is located in the southwestern corner of Michigan, along the Michigan-Indiana border. It is bordered by Lake Michigan to the west, LaPorte County, Indiana to the south, Cass County to the east, and Van Buren County to the north. The county has a total area of 576 square miles, of which 545 square miles is land and 31 square miles is water.
The county is mostly flat, with some rolling hills in the northern part of the county. The highest point in the county is located in the northeast corner, at an elevation of 890 feet. The county is home to several rivers, including the St. Joseph River, Paw Paw River, and Galien River.
Economy
Berrien County has a diverse economy, with a mix of manufacturing, agriculture, and tourism. The county is home to several large employers, including Whirlpool Corporation, American Axle & Manufacturing, and the Benton Harbor-St. Joseph Medical Center.
Agriculture is an important part of the county’s economy, with the main crops being corn, soybeans, wheat, and hay. The county is also home to several wineries and vineyards, and is a popular destination for wine tourism.
Tourism is also an important part of the county’s economy, with several popular attractions, including the Silver Beach Carousel, the St. Joseph Lighthouse, and the Krasl Art Center. The county is also home to several state parks, including Warren Dunes State Park and Jean Klock Park.
Demographics
As of the 2010 census, Berrien County had a population of 156,813. The population was spread out, with 33.3% under the age of 18, 9.7% from 18 to 24, 28.2% from 25 to 44, 20.7% from 45 to 64, and 8.1% who were 65 years of age or older. The median age was 34.3 years.
The racial makeup of the county was 79.2% White, 14.2% African American, 0.5% Native American, 1.3% Asian, 0.1% Pacific Islander, 2.2% from other races, and 2.5% from two or more races. Hispanic or Latino of any race were 5.3% of the population.
The median income for a household in the county was $45,945, and the median income for a family was $54,945. The per capita income for the county was $22,945. About 11.2% of families and 14.7% of the population were below the poverty line, including 20.2% of those under age 18 and 8.2% of those age 65 or over.
Common Questions
What is the Total Population of Berrien County?
Total Population of Berrien County is 153,938.
What is the Total Male Population of Berrien County?
Total Male Population of Berrien County is 75,863.
What is the Total Female Population of Berrien County?
Total Female Population of Berrien County is 78,075.
What is the Ratio of Males per 100 Females in Berrien County?
There are 97.17 Males per 100 Females in Berrien County.
What is the Ratio of Females per 100 Males in Berrien County?
There are 102.92 Females per 100 Males in Berrien County.
What is the Median Population Age in Berrien County?
Median Population Age in Berrien County is 42.5 Years.
What is the Average Family Size in Berrien County
Average Family Size in Berrien County is 3.0 People.
What is the Average Household Size in Berrien County
Average Household Size in Berrien County is 2.4 People.
What is Per Capita Income in Berrien County?
Per Capita income in Berrien County is $36,764.
What is the Median Family Income in Berrien County?
Median Family Income in Berrien County is $79,042.
What is the Median Household income in Berrien County?
Median Household Income in Berrien County is $60,379.
What is Income or Wage Gap in Berrien County?
Income or Wage Gap in Berrien County is 37.9%.
Women in Berrien County earn 62.1 cents for every dollar earned by a man.
What is Family Income Deficit in Berrien County?
Family Income Deficit in Berrien County is $11,027.
Families that are below poverty line in Berrien County earn $11,027 less on average than the poverty threshold level.
What is Inequality or Gini Index in Berrien County?
Inequality or Gini Index in Berrien County is 0.48.
How Large is the Labor Force in Berrien County?
There are 76,114 People in the Labor Forcein in Berrien County.
What is the Percentage of People in the Labor Force in Berrien County?
61.1% of People are in the Labor Force in Berrien County.
What is the Unemployment Rate in Berrien County?
Unemployment Rate in Berrien County is 6.6%.