Benzie County, MI
Benzie County Map
Benzie County Overview
18,058
TOTAL POPULATION
9,065
MALE POPULATION
8,993
FEMALE POPULATION
100.80
MALES / 100 FEMALES
99.21
FEMALES / 100 MALES
50.4
MEDIAN AGE
3.0
AVG FAMILY SIZE
2.5
AVG HOUSEHOLD SIZE
$38,875
PER CAPITA INCOME
$85,054
AVG FAMILY INCOME
$71,327
AVG HOUSEHOLD INCOME
17.2%
WAGE / INCOME GAP [ % ]
82.8¢/ $1
WAGE / INCOME GAP [ $ ]
$8,692
FAMILY INCOME DEFICIT
0.45
INEQUALITY / GINI INDEX
8,425
LABOR FORCE [ PEOPLE ]
55.2%
PERCENT IN LABOR FORCE
4.5%
UNEMPLOYMENT RATE
Benzie County Area Codes
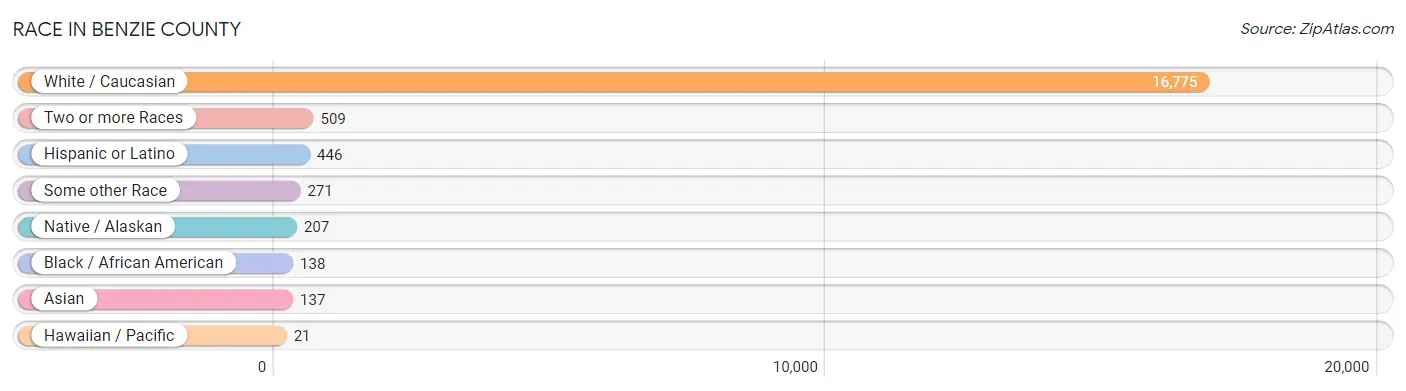
Race in Benzie County
The most populous races in Benzie County are White / Caucasian (16,775 | 92.9%), Two or more Races (509 | 2.8%), and Hispanic or Latino (446 | 2.5%).
| Race | # Population | % Population |
| Asian | 137 | 0.8% |
| Black / African American | 138 | 0.8% |
| Hawaiian / Pacific | 21 | 0.1% |
| Hispanic or Latino | 446 | 2.5% |
| Native / Alaskan | 207 | 1.1% |
| White / Caucasian | 16,775 | 92.9% |
| Two or more Races | 509 | 2.8% |
| Some other Race | 271 | 1.5% |
| Total | 18,058 | 100.0% |
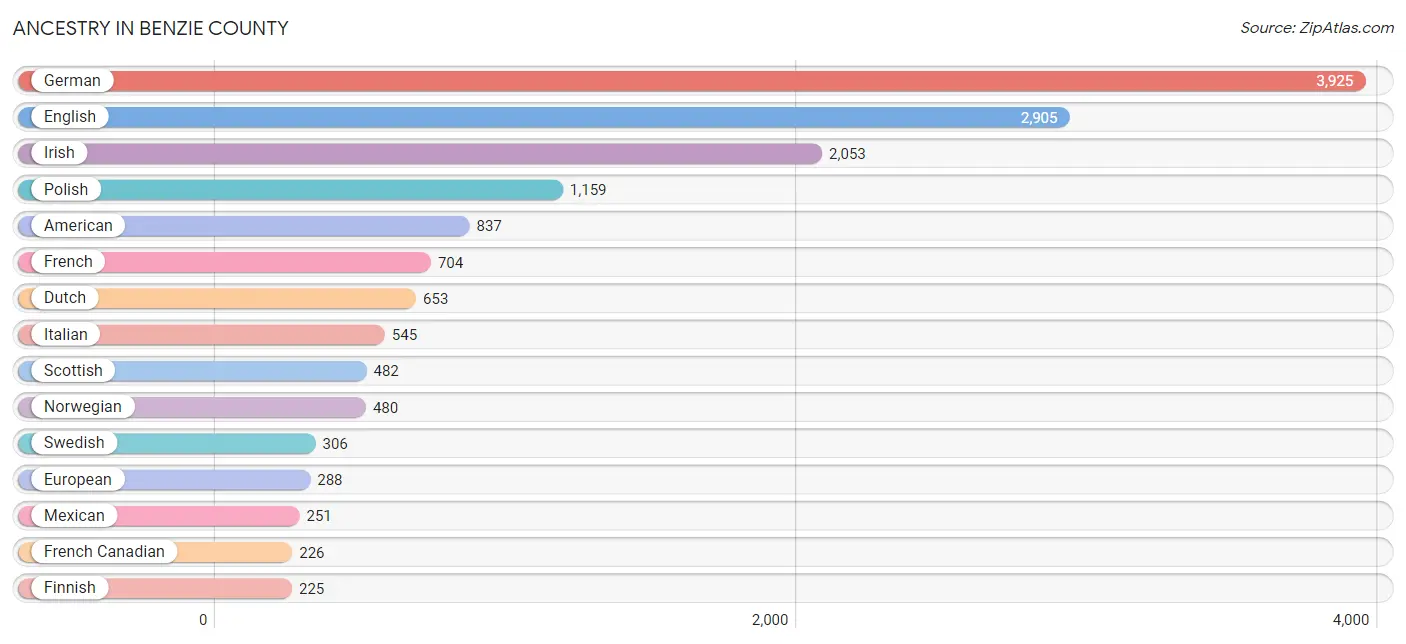
Ancestry in Benzie County
The most populous ancestries reported in Benzie County are German (3,925 | 21.7%), English (2,905 | 16.1%), Irish (2,053 | 11.4%), Polish (1,159 | 6.4%), and American (837 | 4.6%), together accounting for 60.3% of all Benzie County residents.
| Ancestry | # Population | % Population |
| African | 41 | 0.2% |
| Albanian | 43 | 0.2% |
| American | 837 | 4.6% |
| Arab | 71 | 0.4% |
| Armenian | 6 | 0.0% |
| Assyrian / Chaldean / Syriac | 37 | 0.2% |
| Australian | 6 | 0.0% |
| Austrian | 43 | 0.2% |
| Bahamian | 16 | 0.1% |
| Belgian | 23 | 0.1% |
| Bhutanese | 64 | 0.4% |
| Blackfeet | 9 | 0.1% |
| British | 112 | 0.6% |
| Canadian | 46 | 0.3% |
| Central American | 12 | 0.1% |
| Chippewa | 179 | 1.0% |
| Choctaw | 11 | 0.1% |
| Creek | 7 | 0.0% |
| Croatian | 12 | 0.1% |
| Cuban | 37 | 0.2% |
| Czech | 215 | 1.2% |
| Czechoslovakian | 41 | 0.2% |
| Danish | 113 | 0.6% |
| Dutch | 653 | 3.6% |
| Eastern European | 81 | 0.4% |
| English | 2,905 | 16.1% |
| European | 288 | 1.6% |
| Finnish | 225 | 1.3% |
| French | 704 | 3.9% |
| French American Indian | 10 | 0.1% |
| French Canadian | 226 | 1.3% |
| German | 3,925 | 21.7% |
| Greek | 33 | 0.2% |
| Guamanian / Chamorro | 21 | 0.1% |
| Guatemalan | 12 | 0.1% |
| Hungarian | 103 | 0.6% |
| Indian (Asian) | 31 | 0.2% |
| Iranian | 3 | 0.0% |
| Irish | 2,053 | 11.4% |
| Italian | 545 | 3.0% |
| Jamaican | 8 | 0.0% |
| Kenyan | 12 | 0.1% |
| Kiowa | 3 | 0.0% |
| Korean | 59 | 0.3% |
| Latvian | 12 | 0.1% |
| Lebanese | 40 | 0.2% |
| Lithuanian | 7 | 0.0% |
| Maltese | 13 | 0.1% |
| Mexican | 251 | 1.4% |
| Navajo | 13 | 0.1% |
| Northern European | 82 | 0.4% |
| Norwegian | 480 | 2.7% |
| Ottawa | 79 | 0.4% |
| Pennsylvania German | 5 | 0.0% |
| Polish | 1,159 | 6.4% |
| Portuguese | 83 | 0.5% |
| Puerto Rican | 77 | 0.4% |
| Romanian | 6 | 0.0% |
| Russian | 37 | 0.2% |
| Scandinavian | 39 | 0.2% |
| Scotch-Irish | 171 | 0.9% |
| Scottish | 482 | 2.7% |
| Serbian | 37 | 0.2% |
| Sioux | 15 | 0.1% |
| Slavic | 41 | 0.2% |
| Slovak | 34 | 0.2% |
| South American | 5 | 0.0% |
| Spaniard | 8 | 0.0% |
| Spanish | 3 | 0.0% |
| Sri Lankan | 20 | 0.1% |
| Subsaharan African | 53 | 0.3% |
| Swedish | 306 | 1.7% |
| Swiss | 49 | 0.3% |
| Syrian | 4 | 0.0% |
| Thai | 13 | 0.1% |
| Ukrainian | 189 | 1.1% |
| Venezuelan | 5 | 0.0% |
| Welsh | 209 | 1.2% |
| Yup'ik | 43 | 0.2% | View All 79 Rows |
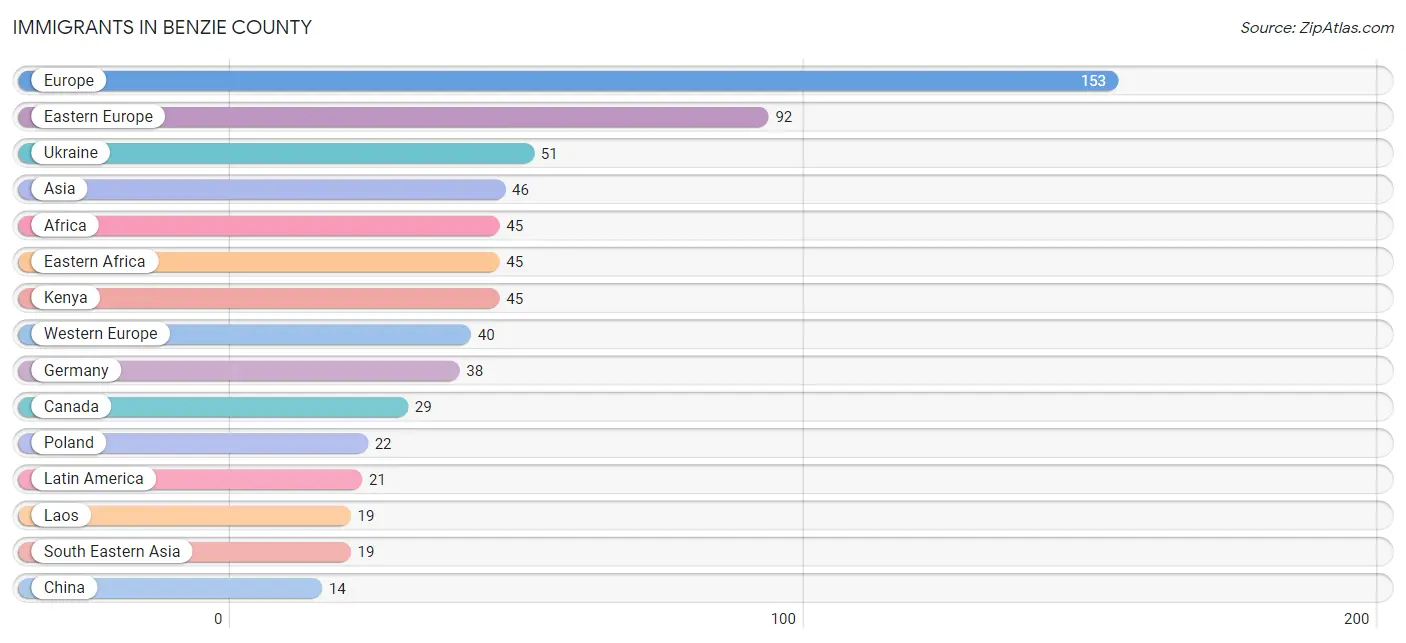
Immigrants in Benzie County
The most numerous immigrant groups reported in Benzie County came from Europe (153 | 0.9%), Eastern Europe (92 | 0.5%), Ukraine (51 | 0.3%), Asia (46 | 0.3%), and Africa (45 | 0.3%), together accounting for 2.1% of all Benzie County residents.
| Immigration Origin | # Population | % Population |
| Africa | 45 | 0.3% |
| Asia | 46 | 0.3% |
| Australia | 5 | 0.0% |
| Bangladesh | 13 | 0.1% |
| Canada | 29 | 0.2% |
| Caribbean | 4 | 0.0% |
| Central America | 12 | 0.1% |
| China | 14 | 0.1% |
| Croatia | 7 | 0.0% |
| Eastern Africa | 45 | 0.3% |
| Eastern Asia | 14 | 0.1% |
| Eastern Europe | 92 | 0.5% |
| England | 13 | 0.1% |
| Europe | 153 | 0.9% |
| Germany | 38 | 0.2% |
| Guatemala | 12 | 0.1% |
| Italy | 5 | 0.0% |
| Jamaica | 4 | 0.0% |
| Kenya | 45 | 0.3% |
| Laos | 19 | 0.1% |
| Latin America | 21 | 0.1% |
| Northern Europe | 14 | 0.1% |
| Oceania | 5 | 0.0% |
| Poland | 22 | 0.1% |
| Russia | 2 | 0.0% |
| South America | 5 | 0.0% |
| South Central Asia | 13 | 0.1% |
| South Eastern Asia | 19 | 0.1% |
| Southern Europe | 7 | 0.0% |
| Switzerland | 2 | 0.0% |
| Ukraine | 51 | 0.3% |
| Venezuela | 5 | 0.0% |
| Western Europe | 40 | 0.2% | View All 33 Rows |
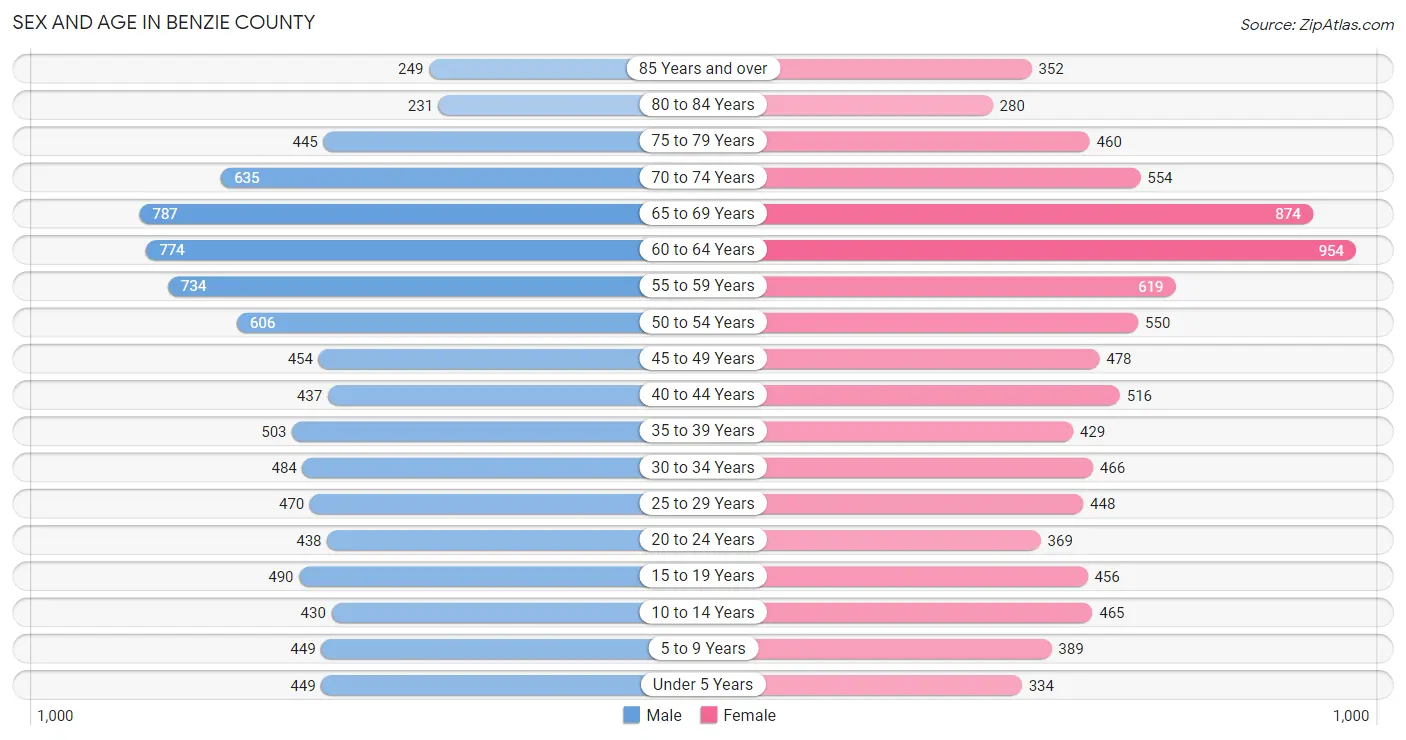
Sex and Age in Benzie County
Sex and Age in Benzie County
The most populous age groups in Benzie County are 65 to 69 Years (787 | 8.7%) for men and 60 to 64 Years (954 | 10.6%) for women.
| Age Bracket | Male | Female |
| Under 5 Years | 449 (5.0%) | 334 (3.7%) |
| 5 to 9 Years | 449 (5.0%) | 389 (4.3%) |
| 10 to 14 Years | 430 (4.7%) | 465 (5.2%) |
| 15 to 19 Years | 490 (5.4%) | 456 (5.1%) |
| 20 to 24 Years | 438 (4.8%) | 369 (4.1%) |
| 25 to 29 Years | 470 (5.2%) | 448 (5.0%) |
| 30 to 34 Years | 484 (5.3%) | 466 (5.2%) |
| 35 to 39 Years | 503 (5.6%) | 429 (4.8%) |
| 40 to 44 Years | 437 (4.8%) | 516 (5.7%) |
| 45 to 49 Years | 454 (5.0%) | 478 (5.3%) |
| 50 to 54 Years | 606 (6.7%) | 550 (6.1%) |
| 55 to 59 Years | 734 (8.1%) | 619 (6.9%) |
| 60 to 64 Years | 774 (8.5%) | 954 (10.6%) |
| 65 to 69 Years | 787 (8.7%) | 874 (9.7%) |
| 70 to 74 Years | 635 (7.0%) | 554 (6.2%) |
| 75 to 79 Years | 445 (4.9%) | 460 (5.1%) |
| 80 to 84 Years | 231 (2.5%) | 280 (3.1%) |
| 85 Years and over | 249 (2.8%) | 352 (3.9%) |
| Total | 9,065 (100.0%) | 8,993 (100.0%) |
Families and Households in Benzie County
Median Family Size in Benzie County
The median family size in Benzie County is 2.95 persons per family, with single male/father families (241 | 5.0%) accounting for the largest median family size of 3.23 persons per family. On the other hand, married-couple families (4,045 | 83.6%) represent the smallest median family size with 2.90 persons per family.

| Family Type | # Families | Family Size |
| Married-Couple | 4,045 (83.6%) | 2.90 |
| Single Male/Father | 241 (5.0%) | 3.23 |
| Single Female/Mother | 553 (11.4%) | 3.18 |
| Total Families | 4,839 (100.0%) | 2.95 |
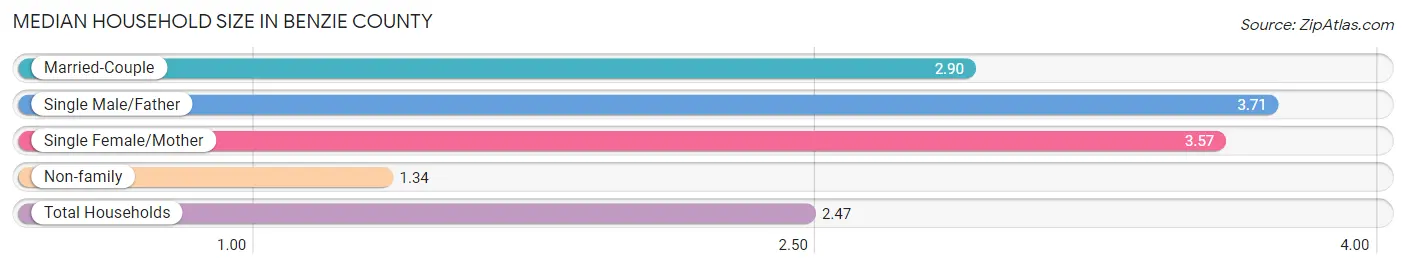
Median Household Size in Benzie County
The median household size in Benzie County is 2.47 persons per household, with single male/father households (241 | 3.4%) accounting for the largest median household size of 3.71 persons per household. non-family households (2,334 | 32.5%) represent the smallest median household size with 1.34 persons per household.
| Household Type | # Households | Household Size |
| Married-Couple | 4,045 (56.4%) | 2.90 |
| Single Male/Father | 241 (3.4%) | 3.71 |
| Single Female/Mother | 553 (7.7%) | 3.57 |
| Non-family | 2,334 (32.5%) | 1.34 |
| Total Households | 7,173 (100.0%) | 2.47 |
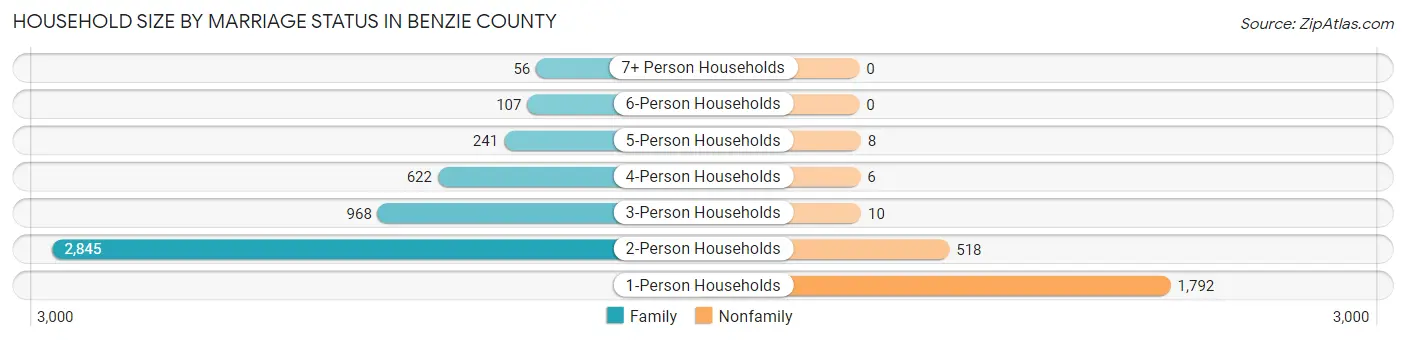
Household Size by Marriage Status in Benzie County
Out of a total of 7,173 households in Benzie County, 4,839 (67.5%) are family households, while 2,334 (32.5%) are nonfamily households. The most numerous type of family households are 2-person households, comprising 2,845, and the most common type of nonfamily households are 1-person households, comprising 1,792.
| Household Size | Family Households | Nonfamily Households |
| 1-Person Households | - | 1,792 (25.0%) |
| 2-Person Households | 2,845 (39.7%) | 518 (7.2%) |
| 3-Person Households | 968 (13.5%) | 10 (0.1%) |
| 4-Person Households | 622 (8.7%) | 6 (0.1%) |
| 5-Person Households | 241 (3.4%) | 8 (0.1%) |
| 6-Person Households | 107 (1.5%) | 0 (0.0%) |
| 7+ Person Households | 56 (0.8%) | 0 (0.0%) |
| Total | 4,839 (67.5%) | 2,334 (32.5%) |
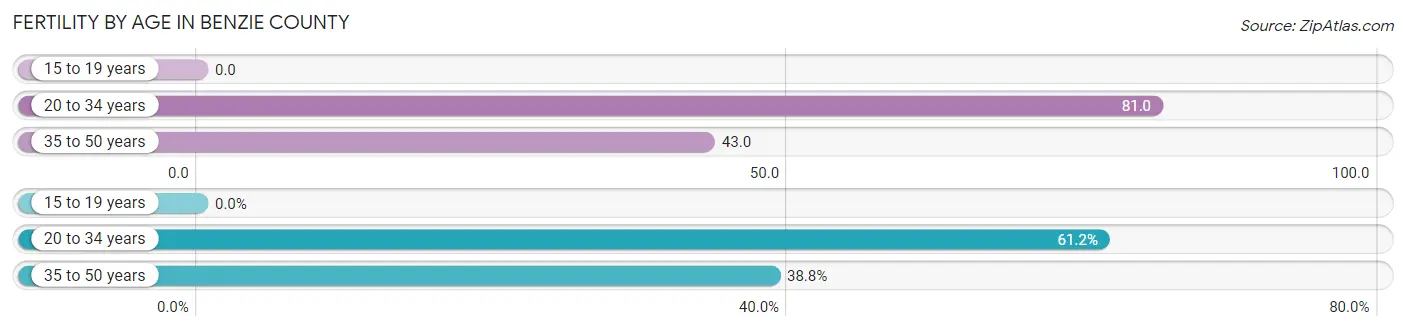
Female Fertility in Benzie County
Fertility by Age in Benzie County
Average fertility rate in Benzie County is 52.0 births per 1,000 women. Women in the age bracket of 20 to 34 years have the highest fertility rate with 81.0 births per 1,000 women. Women in the age bracket of 20 to 34 years acount for 61.2% of all women with births.
| Age Bracket | Women with Births | Births / 1,000 Women |
| 15 to 19 years | 0 (0.0%) | 0.0 |
| 20 to 34 years | 104 (61.2%) | 81.0 |
| 35 to 50 years | 66 (38.8%) | 43.0 |
| Total | 170 (100.0%) | 52.0 |
Fertility by Age by Marriage Status in Benzie County
98.8% of women with births (170) in Benzie County are married. The highest percentage of unmarried women with births falls into 20 to 34 years age bracket with 1.9% of them unmarried at the time of birth, while the lowest percentage of unmarried women with births belong to 35 to 50 years age bracket with 0.0% of them unmarried.

| Age Bracket | Married | Unmarried |
| 15 to 19 years | 0 (0.0%) | 0 (0.0%) |
| 20 to 34 years | 102 (98.1%) | 2 (1.9%) |
| 35 to 50 years | 66 (100.0%) | 0 (0.0%) |
| Total | 168 (98.8%) | 2 (1.2%) |
Fertility by Education in Benzie County
Average fertility rate in Benzie County is 52.0 births per 1,000 women. Women with the education attainment of high school diploma have the highest fertility rate of 114.0 births per 1,000 women, while women with the education attainment of less than high school have the lowest fertility at 8.0 births per 1,000 women. Women with the education attainment of high school diploma represent 48.8% of all women with births.
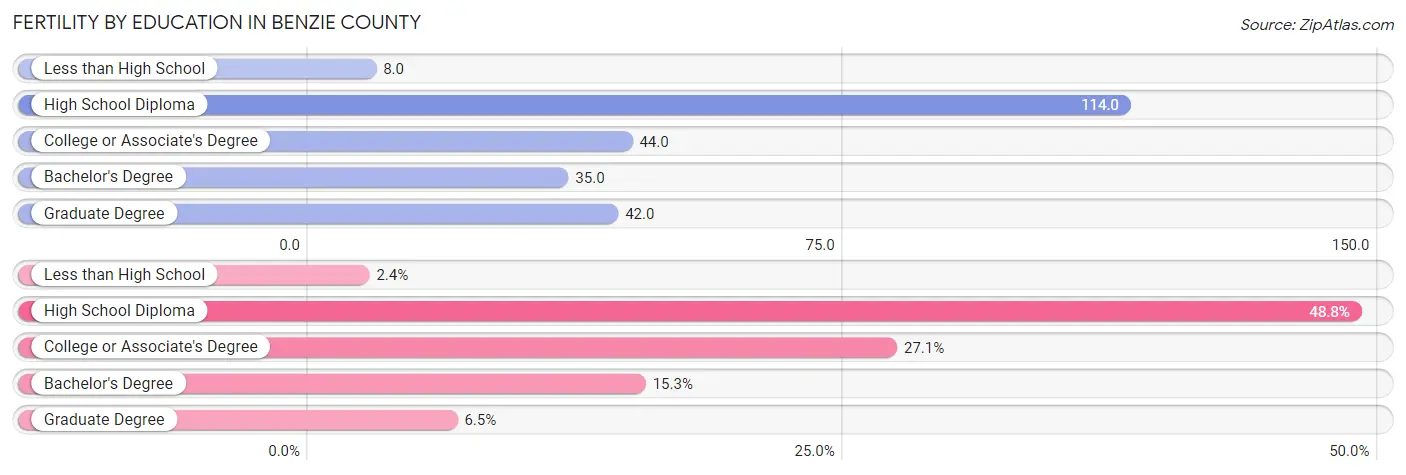
| Educational Attainment | Women with Births | Births / 1,000 Women |
| Less than High School | 4 (2.4%) | 8.0 |
| High School Diploma | 83 (48.8%) | 114.0 |
| College or Associate's Degree | 46 (27.1%) | 44.0 |
| Bachelor's Degree | 26 (15.3%) | 35.0 |
| Graduate Degree | 11 (6.5%) | 42.0 |
| Total | 170 (100.0%) | 52.0 |
Fertility by Education by Marriage Status in Benzie County
1.2% of women with births in Benzie County are unmarried. Women with the educational attainment of less than high school are most likely to be married with 100.0% of them married at childbirth, while women with the educational attainment of college or associate's degree are least likely to be married with 4.3% of them unmarried at childbirth.
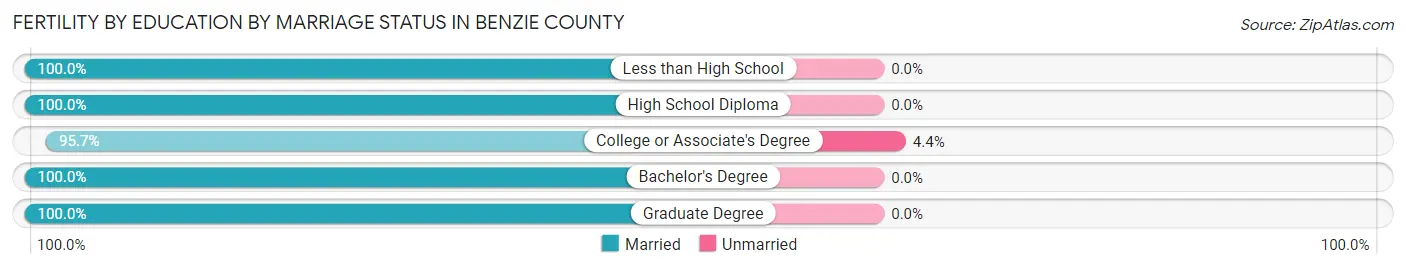
| Educational Attainment | Married | Unmarried |
| Less than High School | 4 (100.0%) | 0 (0.0%) |
| High School Diploma | 83 (100.0%) | 0 (0.0%) |
| College or Associate's Degree | 44 (95.7%) | 2 (4.3%) |
| Bachelor's Degree | 26 (100.0%) | 0 (0.0%) |
| Graduate Degree | 11 (100.0%) | 0 (0.0%) |
| Total | 168 (98.8%) | 2 (1.2%) |
Income in Benzie County
Income Overview in Benzie County
Per Capita Income in Benzie County is $38,875, while median incomes of families and households are $85,054 and $71,327 respectively.
| Characteristic | Number | Measure |
| Per Capita Income | 18,058 | $38,875 |
| Median Family Income | 4,839 | $85,054 |
| Mean Family Income | 4,839 | $108,483 |
| Median Household Income | 7,173 | $71,327 |
| Mean Household Income | 7,173 | $92,315 |
| Income Deficit | 4,839 | $8,692 |
| Wage / Income Gap (%) | 18,058 | 17.16% |
| Wage / Income Gap ($) | 18,058 | 82.84¢ per $1 |
| Gini / Inequality Index | 18,058 | 0.45 |
Earnings by Sex in Benzie County
Average Earnings in Benzie County are $32,365, $35,975 for men and $29,803 for women, a difference of 17.2%.
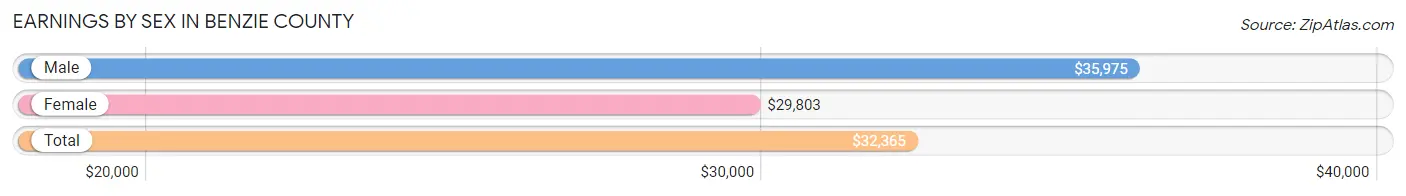
| Sex | Number | Average Earnings |
| Male | 4,750 (50.9%) | $35,975 |
| Female | 4,589 (49.1%) | $29,803 |
| Total | 9,339 (100.0%) | $32,365 |
Earnings by Sex by Income Bracket in Benzie County
The most common earnings brackets in Benzie County are $100,000+ for men (459 | 9.7%) and $25,000 to $29,999 for women (437 | 9.5%).
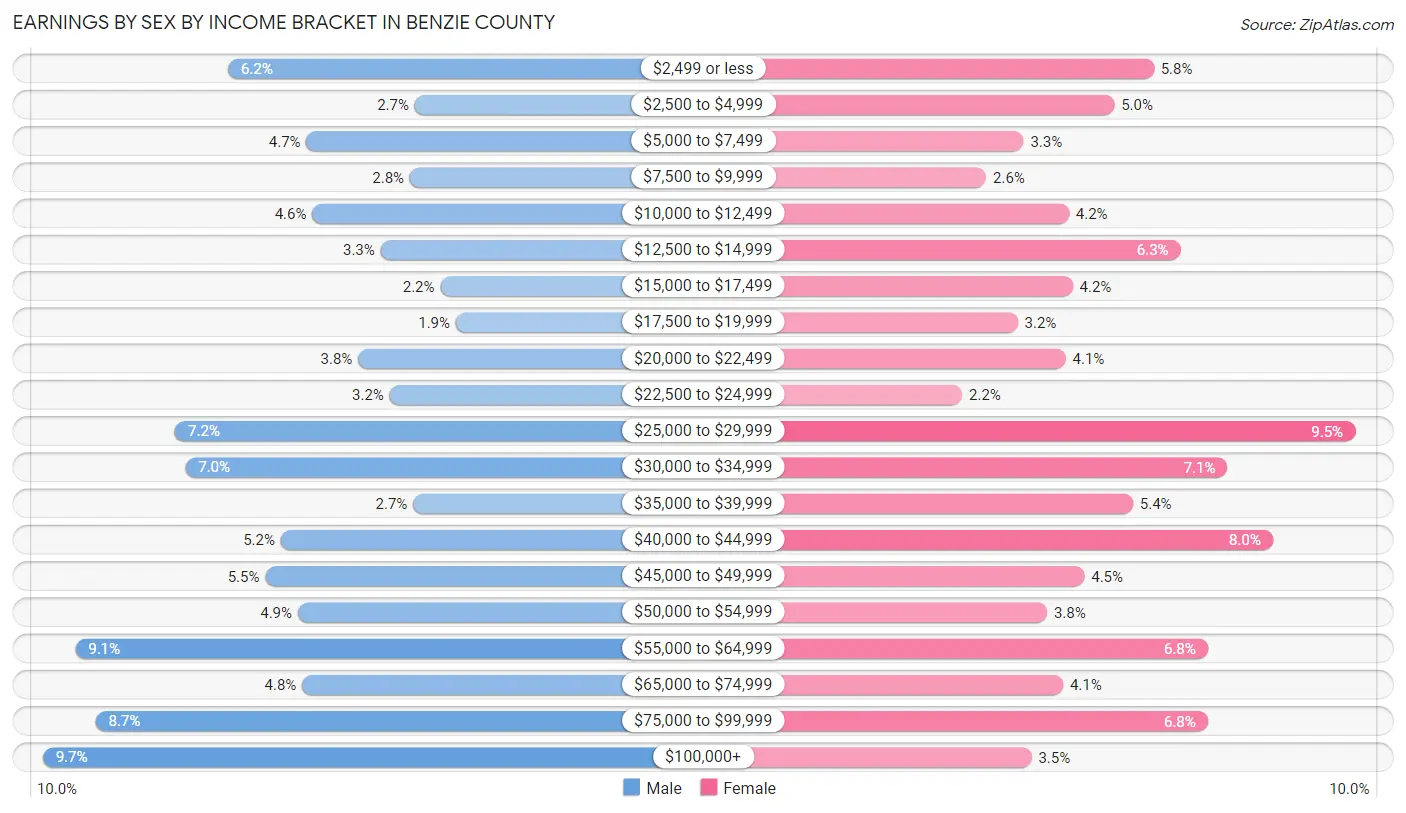
| Income | Male | Female |
| $2,499 or less | 294 (6.2%) | 264 (5.8%) |
| $2,500 to $4,999 | 128 (2.7%) | 230 (5.0%) |
| $5,000 to $7,499 | 224 (4.7%) | 152 (3.3%) |
| $7,500 to $9,999 | 132 (2.8%) | 120 (2.6%) |
| $10,000 to $12,499 | 219 (4.6%) | 191 (4.2%) |
| $12,500 to $14,999 | 158 (3.3%) | 287 (6.2%) |
| $15,000 to $17,499 | 105 (2.2%) | 194 (4.2%) |
| $17,500 to $19,999 | 91 (1.9%) | 147 (3.2%) |
| $20,000 to $22,499 | 178 (3.7%) | 188 (4.1%) |
| $22,500 to $24,999 | 150 (3.2%) | 99 (2.2%) |
| $25,000 to $29,999 | 341 (7.2%) | 437 (9.5%) |
| $30,000 to $34,999 | 332 (7.0%) | 327 (7.1%) |
| $35,000 to $39,999 | 129 (2.7%) | 246 (5.4%) |
| $40,000 to $44,999 | 247 (5.2%) | 366 (8.0%) |
| $45,000 to $49,999 | 261 (5.5%) | 204 (4.4%) |
| $50,000 to $54,999 | 232 (4.9%) | 172 (3.7%) |
| $55,000 to $64,999 | 430 (9.0%) | 310 (6.8%) |
| $65,000 to $74,999 | 228 (4.8%) | 186 (4.1%) |
| $75,000 to $99,999 | 412 (8.7%) | 310 (6.8%) |
| $100,000+ | 459 (9.7%) | 159 (3.5%) |
| Total | 4,750 (100.0%) | 4,589 (100.0%) |
Earnings by Sex by Educational Attainment in Benzie County
Average earnings in Benzie County are $42,500 for men and $34,303 for women, a difference of 19.3%. Men with an educational attainment of bachelor's degree enjoy the highest average annual earnings of $60,972, while those with less than high school education earn the least with $28,750. Women with an educational attainment of graduate degree earn the most with the average annual earnings of $68,125, while those with high school diploma education have the smallest earnings of $25,720.

| Educational Attainment | Male Income | Female Income |
| Less than High School | $28,750 | $30,875 |
| High School Diploma | $38,438 | $25,720 |
| College or Associate's Degree | $42,301 | $37,406 |
| Bachelor's Degree | $60,972 | $38,750 |
| Graduate Degree | $39,583 | $68,125 |
| Total | $42,500 | $34,303 |
Family Income in Benzie County
Family Income Brackets in Benzie County
According to the Benzie County family income data, there are 1,224 families falling into the $100,000 to $149,999 income range, which is the most common income bracket and makes up 25.3% of all families. Conversely, the less than $10,000 income bracket is the least frequent group with only 73 families (1.5%) belonging to this category.

| Income Bracket | # Families | % Families |
| Less than $10,000 | 73 | 1.5% |
| $10,000 to $14,999 | 116 | 2.4% |
| $15,000 to $24,999 | 203 | 4.2% |
| $25,000 to $34,999 | 261 | 5.4% |
| $35,000 to $49,999 | 527 | 10.9% |
| $50,000 to $74,999 | 832 | 17.2% |
| $75,000 to $99,999 | 803 | 16.6% |
| $100,000 to $149,999 | 1,224 | 25.3% |
| $150,000 to $199,999 | 436 | 9.0% |
| $200,000+ | 358 | 7.4% |
Family Income by Famaliy Size in Benzie County
6-person families (98 | 2.0%) account for the highest median family income in Benzie County with $119,333 per family, while 2-person families (2,986 | 61.7%) have the highest median income of $38,765 per family member.
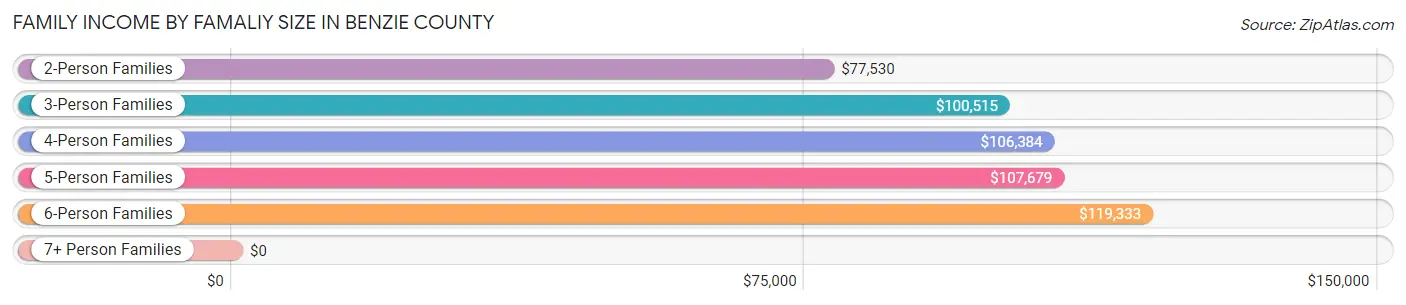
| Income Bracket | # Families | Median Income |
| 2-Person Families | 2,986 (61.7%) | $77,530 |
| 3-Person Families | 905 (18.7%) | $100,515 |
| 4-Person Families | 569 (11.8%) | $106,384 |
| 5-Person Families | 232 (4.8%) | $107,679 |
| 6-Person Families | 98 (2.0%) | $119,333 |
| 7+ Person Families | 49 (1.0%) | $0 |
| Total | 4,839 (100.0%) | $85,054 |
Family Income by Number of Earners in Benzie County
The median family income in Benzie County is $85,054, with families comprising 3+ earners (508) having the highest median family income of $113,750, while families with no earners (1,169) have the lowest median family income of $63,774, accounting for 10.5% and 24.2% of families, respectively.

| Number of Earners | # Families | Median Income |
| No Earners | 1,169 (24.2%) | $63,774 |
| 1 Earner | 1,368 (28.3%) | $66,071 |
| 2 Earners | 1,794 (37.1%) | $103,262 |
| 3+ Earners | 508 (10.5%) | $113,750 |
| Total | 4,839 (100.0%) | $85,054 |
Household Income in Benzie County
Household Income Brackets in Benzie County
With 1,463 households falling in the category, the $100,000 to $149,999 income range is the most frequent in Benzie County, accounting for 20.4% of all households. In contrast, only 208 households (2.9%) fall into the less than $10,000 income bracket, making it the least populous group.
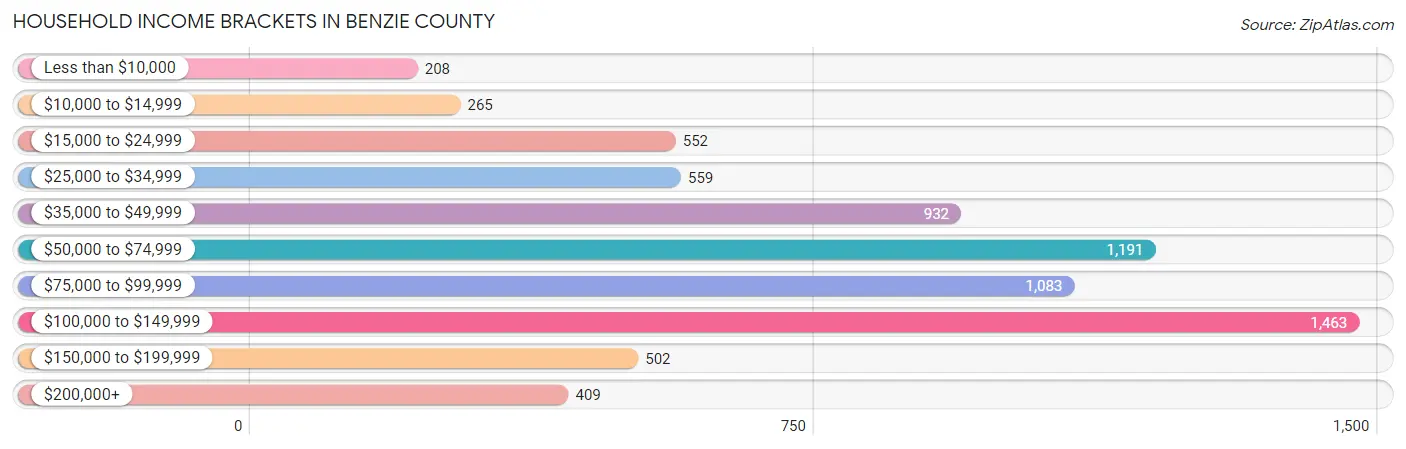
| Income Bracket | # Households | % Households |
| Less than $10,000 | 208 | 2.9% |
| $10,000 to $14,999 | 265 | 3.7% |
| $15,000 to $24,999 | 552 | 7.7% |
| $25,000 to $34,999 | 559 | 7.8% |
| $35,000 to $49,999 | 932 | 13.0% |
| $50,000 to $74,999 | 1,191 | 16.6% |
| $75,000 to $99,999 | 1,083 | 15.1% |
| $100,000 to $149,999 | 1,463 | 20.4% |
| $150,000 to $199,999 | 502 | 7.0% |
| $200,000+ | 409 | 5.7% |
Household Income by Householder Age in Benzie County
The median household income in Benzie County is $71,327, with the highest median household income of $84,943 found in the 25 to 44 years age bracket for the primary householder. A total of 1,511 households (21.1%) fall into this category. Meanwhile, the 15 to 24 years age bracket for the primary householder has the lowest median household income of $49,643, with 130 households (1.8%) in this group.
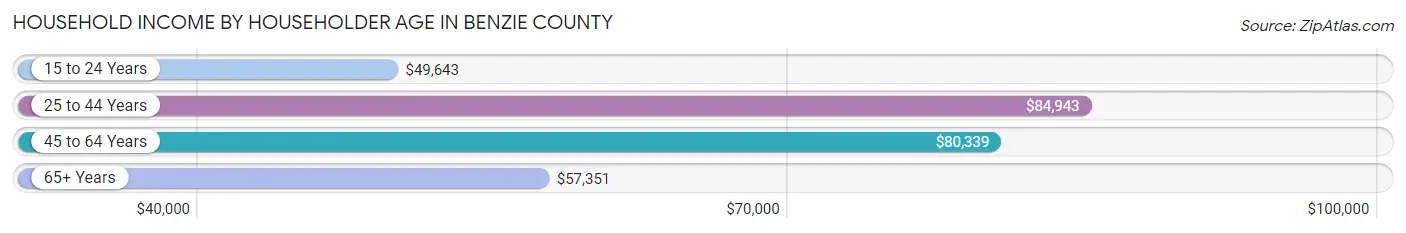
| Income Bracket | # Households | Median Income |
| 15 to 24 Years | 130 (1.8%) | $49,643 |
| 25 to 44 Years | 1,511 (21.1%) | $84,943 |
| 45 to 64 Years | 2,684 (37.4%) | $80,339 |
| 65+ Years | 2,848 (39.7%) | $57,351 |
| Total | 7,173 (100.0%) | $71,327 |
Poverty in Benzie County
Income Below Poverty by Sex and Age in Benzie County
With 10.6% poverty level for males and 10.3% for females among the residents of Benzie County, under 5 year old males and 5 year old females are the most vulnerable to poverty, with 122 males (27.2%) and 10 females (20.4%) in their respective age groups living below the poverty level.
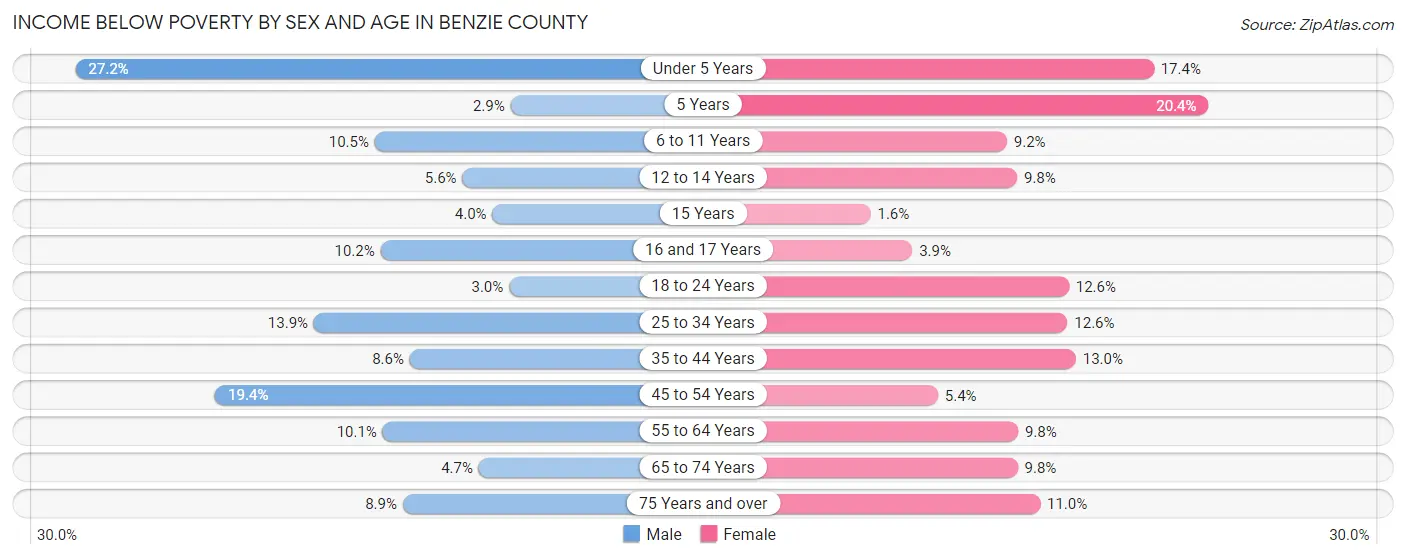
| Age Bracket | Male | Female |
| Under 5 Years | 122 (27.2%) | 58 (17.4%) |
| 5 Years | 2 (2.9%) | 10 (20.4%) |
| 6 to 11 Years | 59 (10.5%) | 51 (9.2%) |
| 12 to 14 Years | 14 (5.6%) | 20 (9.8%) |
| 15 Years | 6 (4.0%) | 2 (1.6%) |
| 16 and 17 Years | 17 (10.2%) | 6 (3.9%) |
| 18 to 24 Years | 18 (3.0%) | 68 (12.6%) |
| 25 to 34 Years | 131 (13.9%) | 114 (12.6%) |
| 35 to 44 Years | 80 (8.6%) | 122 (13.0%) |
| 45 to 54 Years | 204 (19.4%) | 55 (5.3%) |
| 55 to 64 Years | 151 (10.1%) | 154 (9.8%) |
| 65 to 74 Years | 67 (4.7%) | 137 (9.8%) |
| 75 Years and over | 80 (8.9%) | 114 (11.0%) |
| Total | 951 (10.6%) | 911 (10.3%) |
Income Above Poverty by Sex and Age in Benzie County
According to the poverty statistics in Benzie County, males aged 5 years and females aged 15 years are the age groups that are most secure financially, with 97.1% of males and 98.4% of females in these age groups living above the poverty line.
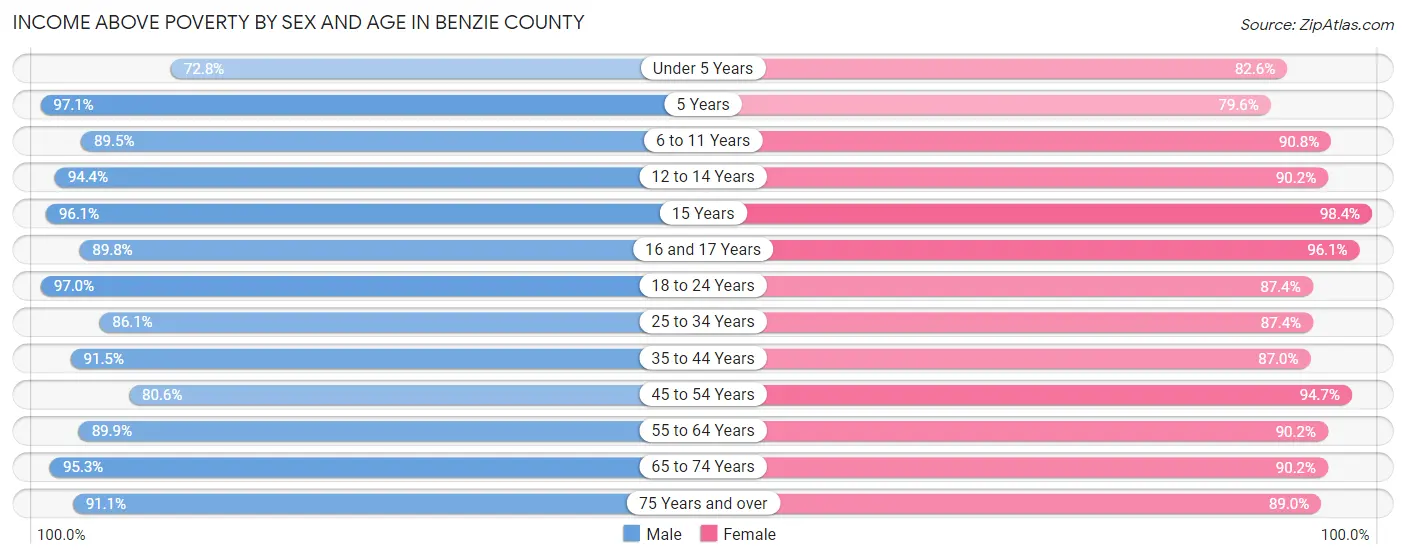
| Age Bracket | Male | Female |
| Under 5 Years | 327 (72.8%) | 276 (82.6%) |
| 5 Years | 66 (97.1%) | 39 (79.6%) |
| 6 to 11 Years | 503 (89.5%) | 504 (90.8%) |
| 12 to 14 Years | 235 (94.4%) | 185 (90.2%) |
| 15 Years | 146 (96.1%) | 123 (98.4%) |
| 16 and 17 Years | 150 (89.8%) | 147 (96.1%) |
| 18 to 24 Years | 579 (97.0%) | 470 (87.4%) |
| 25 to 34 Years | 812 (86.1%) | 794 (87.4%) |
| 35 to 44 Years | 856 (91.4%) | 814 (87.0%) |
| 45 to 54 Years | 848 (80.6%) | 973 (94.7%) |
| 55 to 64 Years | 1,350 (89.9%) | 1,416 (90.2%) |
| 65 to 74 Years | 1,355 (95.3%) | 1,262 (90.2%) |
| 75 Years and over | 815 (91.1%) | 919 (89.0%) |
| Total | 8,042 (89.4%) | 7,922 (89.7%) |
Income Below Poverty Among Married-Couple Families in Benzie County
The poverty statistics for married-couple families in Benzie County show that 5.0% or 204 of the total 4,045 families live below the poverty line. Families with 5 or more children have the highest poverty rate of 28.6%, comprising of 10 families. On the other hand, families with 1 or 2 children have the lowest poverty rate of 2.9%, which includes 25 families.
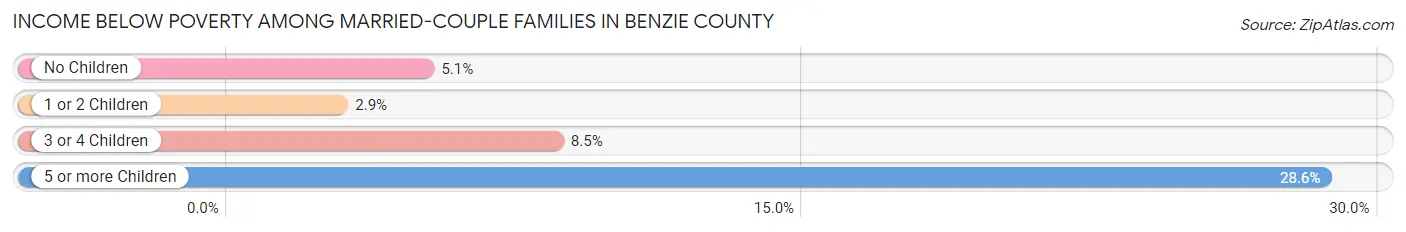
| Children | Above Poverty | Below Poverty |
| No Children | 2,757 (94.9%) | 149 (5.1%) |
| 1 or 2 Children | 844 (97.1%) | 25 (2.9%) |
| 3 or 4 Children | 215 (91.5%) | 20 (8.5%) |
| 5 or more Children | 25 (71.4%) | 10 (28.6%) |
| Total | 3,841 (95.0%) | 204 (5.0%) |
Income Below Poverty Among Single-Parent Households in Benzie County
According to the poverty data in Benzie County, 5.0% or 12 single-father households and 19.2% or 106 single-mother households are living below the poverty line. Among single-father households, those with 1 or 2 children have the highest poverty rate, with 6 households (6.2%) experiencing poverty. Likewise, among single-mother households, those with 3 or 4 children have the highest poverty rate, with 10 households (100.0%) falling below the poverty line.
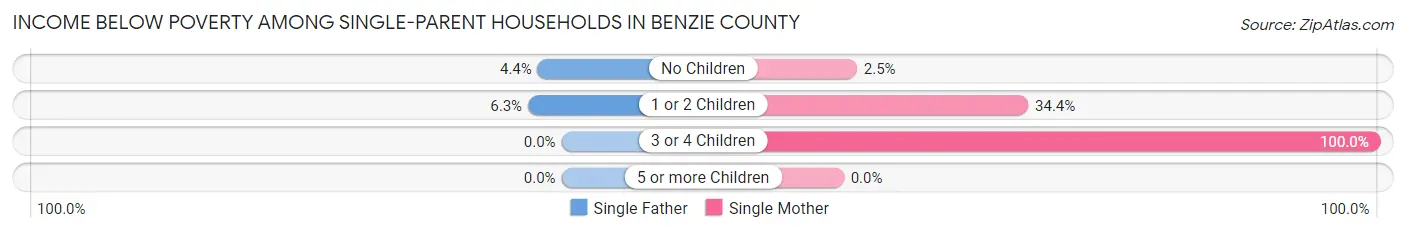
| Children | Single Father | Single Mother |
| No Children | 6 (4.4%) | 7 (2.5%) |
| 1 or 2 Children | 6 (6.2%) | 89 (34.4%) |
| 3 or 4 Children | 0 (0.0%) | 10 (100.0%) |
| 5 or more Children | 0 (0.0%) | 0 (0.0%) |
| Total | 12 (5.0%) | 106 (19.2%) |
Income Below Poverty Among Married-Couple vs Single-Parent Households in Benzie County
The poverty data for Benzie County shows that 204 of the married-couple family households (5.0%) and 118 of the single-parent households (14.9%) are living below the poverty level. Within the married-couple family households, those with 5 or more children have the highest poverty rate, with 10 households (28.6%) falling below the poverty line. Among the single-parent households, those with 3 or 4 children have the highest poverty rate, with 10 household (50.0%) living below poverty.
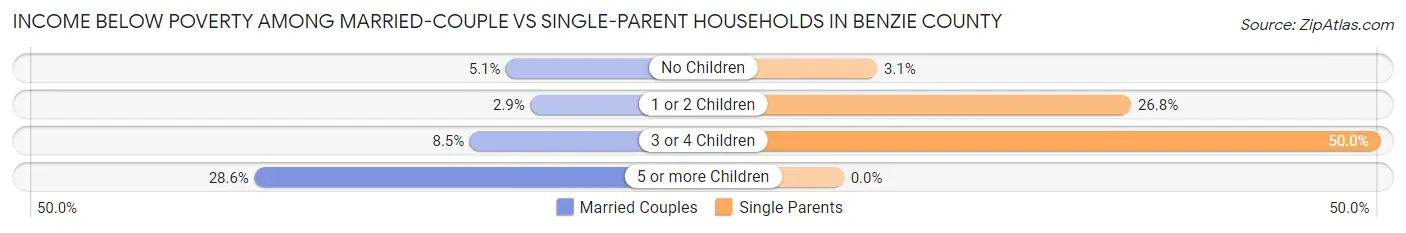
| Children | Married-Couple Families | Single-Parent Households |
| No Children | 149 (5.1%) | 13 (3.1%) |
| 1 or 2 Children | 25 (2.9%) | 95 (26.8%) |
| 3 or 4 Children | 20 (8.5%) | 10 (50.0%) |
| 5 or more Children | 10 (28.6%) | 0 (0.0%) |
| Total | 204 (5.0%) | 118 (14.9%) |
Employment Characteristics in Benzie County
Employment by Class of Employer in Benzie County
Among the 7,895 employed individuals in Benzie County, private company employees (4,700 | 59.5%), not-for-profit organizations (1,005 | 12.7%), and local government employees (752 | 9.5%) make up the most common classes of employment.
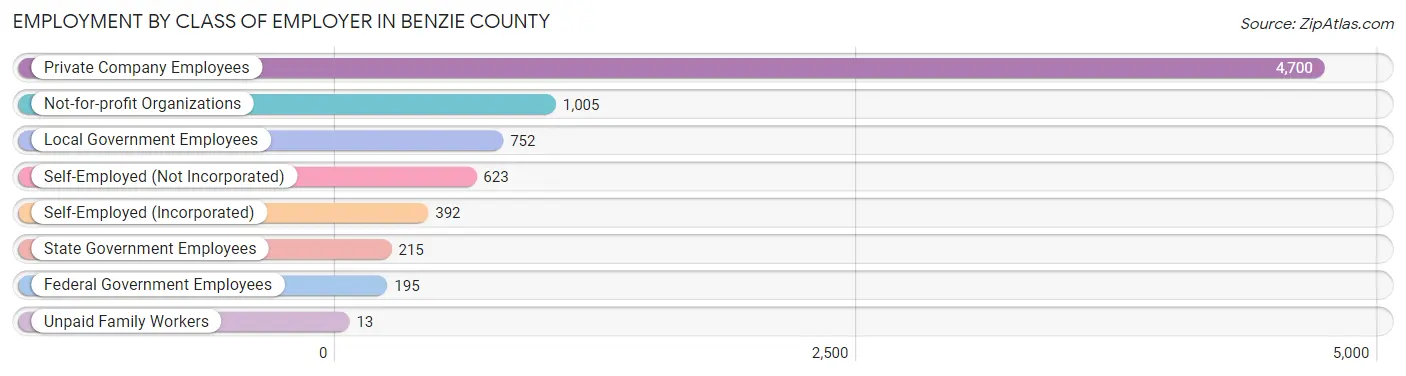
| Employer Class | # Employees | % Employees |
| Private Company Employees | 4,700 | 59.5% |
| Self-Employed (Incorporated) | 392 | 5.0% |
| Self-Employed (Not Incorporated) | 623 | 7.9% |
| Not-for-profit Organizations | 1,005 | 12.7% |
| Local Government Employees | 752 | 9.5% |
| State Government Employees | 215 | 2.7% |
| Federal Government Employees | 195 | 2.5% |
| Unpaid Family Workers | 13 | 0.2% |
| Total | 7,895 | 100.0% |
Employment Status by Age in Benzie County
According to the labor force statistics for Benzie County, out of the total population over 16 years of age (15,263), 55.2% or 8,425 individuals are in the labor force, with 4.5% or 379 of them unemployed. The age group with the highest labor force participation rate is 20 to 24 years, with 89.1% or 719 individuals in the labor force. Within the labor force, the 16 to 19 years age range has the highest percentage of unemployed individuals, with 20.6% or 83 of them being unemployed.
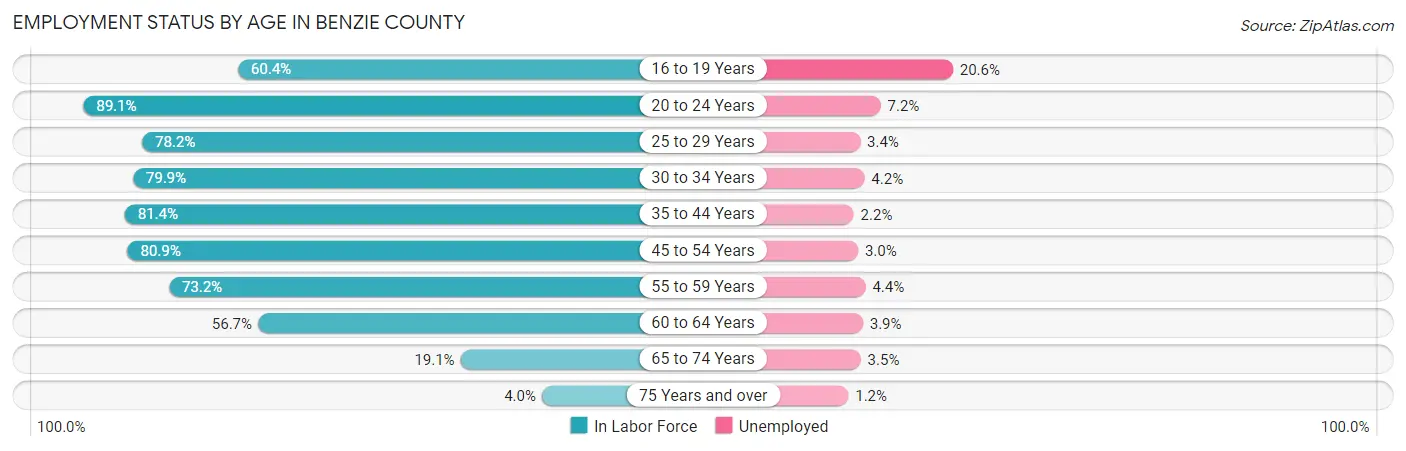
| Age Bracket | In Labor Force | Unemployed |
| 16 to 19 Years | 403 (60.4%) | 83 (20.6%) |
| 20 to 24 Years | 719 (89.1%) | 52 (7.2%) |
| 25 to 29 Years | 718 (78.2%) | 24 (3.4%) |
| 30 to 34 Years | 759 (79.9%) | 32 (4.2%) |
| 35 to 44 Years | 1,534 (81.4%) | 34 (2.2%) |
| 45 to 54 Years | 1,689 (80.9%) | 51 (3.0%) |
| 55 to 59 Years | 990 (73.2%) | 44 (4.4%) |
| 60 to 64 Years | 980 (56.7%) | 38 (3.9%) |
| 65 to 74 Years | 544 (19.1%) | 19 (3.5%) |
| 75 Years and over | 81 (4.0%) | 1 (1.2%) |
| Total | 8,425 (55.2%) | 379 (4.5%) |
Employment Status by Educational Attainment in Benzie County
According to labor force statistics for Benzie County, 74.8% of individuals (6,674) out of the total population between 25 and 64 years of age (8,922) are in the labor force, with 3.3% or 220 of them being unemployed. The group with the highest labor force participation rate are those with the educational attainment of bachelor's degree or higher, with 83.3% or 2,202 individuals in the labor force. Within the labor force, individuals with less than high school education have the highest percentage of unemployment, with 4.4% or 9 of them being unemployed.

| Educational Attainment | In Labor Force | Unemployed |
| Less than High School | 203 (39.3%) | 23 (4.4%) |
| High School Diploma | 1,876 (70.0%) | 115 (4.3%) |
| College / Associate Degree | 2,389 (77.5%) | 74 (2.4%) |
| Bachelor's Degree or higher | 2,202 (83.3%) | 90 (3.4%) |
| Total | 6,674 (74.8%) | 294 (3.3%) |
Employment Occupations by Sex in Benzie County
Management, Business, Science and Arts Occupations
The most common Management, Business, Science and Arts occupations in Benzie County are Management (863 | 10.7%), Community & Social Service (797 | 9.9%), Health Diagnosing & Treating (562 | 7.0%), Education Instruction & Library (418 | 5.2%), and Health Technologists (365 | 4.5%).

Management, Business, Science and Arts Occupations by Sex
Within the Management, Business, Science and Arts occupations in Benzie County, the most male-oriented occupations are Architecture & Engineering (95.6%), Computers & Mathematics (74.7%), and Legal Services & Support (74.1%), while the most female-oriented occupations are Health Technologists (79.4%), Health Diagnosing & Treating (76.0%), and Education, Arts & Media (75.9%).
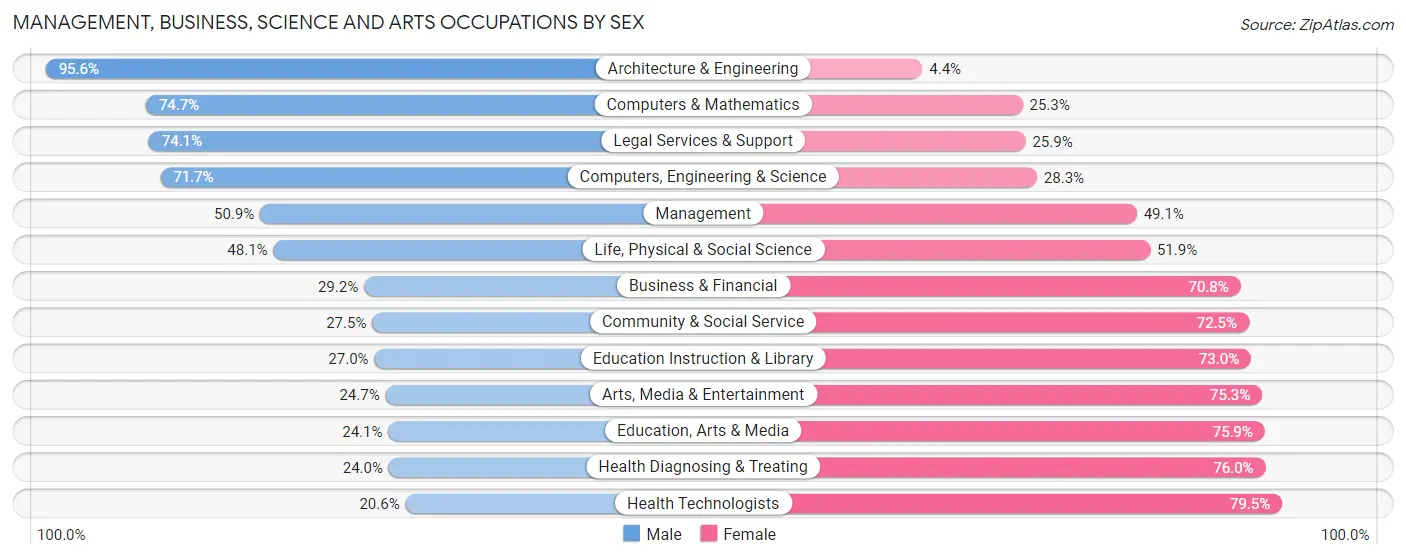
| Occupation | Male | Female |
| Management | 439 (50.9%) | 424 (49.1%) |
| Business & Financial | 106 (29.2%) | 257 (70.8%) |
| Computers, Engineering & Science | 162 (71.7%) | 64 (28.3%) |
| Computers & Mathematics | 59 (74.7%) | 20 (25.3%) |
| Architecture & Engineering | 65 (95.6%) | 3 (4.4%) |
| Life, Physical & Social Science | 38 (48.1%) | 41 (51.9%) |
| Community & Social Service | 219 (27.5%) | 578 (72.5%) |
| Education, Arts & Media | 42 (24.1%) | 132 (75.9%) |
| Legal Services & Support | 20 (74.1%) | 7 (25.9%) |
| Education Instruction & Library | 113 (27.0%) | 305 (73.0%) |
| Arts, Media & Entertainment | 44 (24.7%) | 134 (75.3%) |
| Health Diagnosing & Treating | 135 (24.0%) | 427 (76.0%) |
| Health Technologists | 75 (20.5%) | 290 (79.4%) |
| Total (Category) | 1,061 (37.7%) | 1,750 (62.3%) |
| Total (Overall) | 3,993 (49.7%) | 4,036 (50.3%) |
Services Occupations
The most common Services occupations in Benzie County are Food Preparation & Serving (563 | 7.0%), Healthcare Support (410 | 5.1%), Cleaning & Maintenance (299 | 3.7%), Personal Care & Service (210 | 2.6%), and Security & Protection (148 | 1.8%).
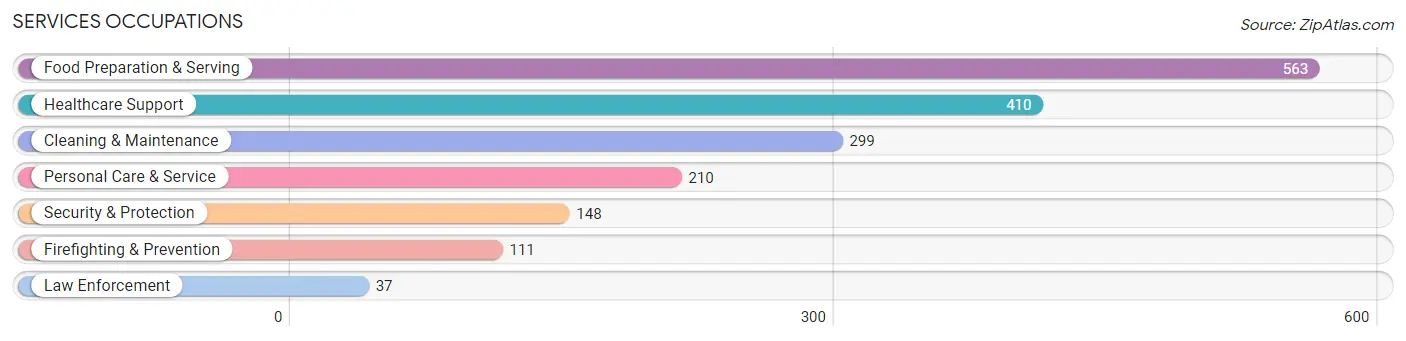
Services Occupations by Sex
Within the Services occupations in Benzie County, the most male-oriented occupations are Law Enforcement (94.6%), Security & Protection (85.1%), and Firefighting & Prevention (82.0%), while the most female-oriented occupations are Personal Care & Service (84.8%), Healthcare Support (84.6%), and Food Preparation & Serving (54.0%).
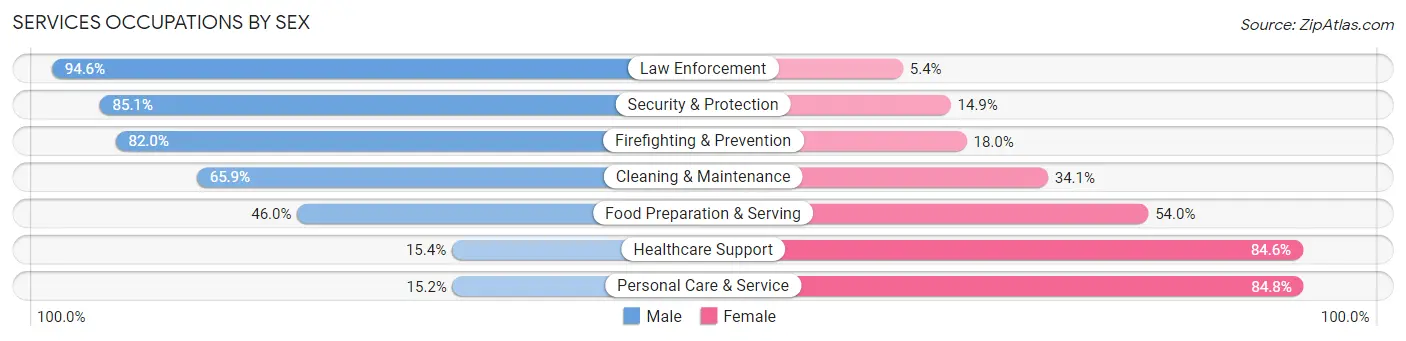
| Occupation | Male | Female |
| Healthcare Support | 63 (15.4%) | 347 (84.6%) |
| Security & Protection | 126 (85.1%) | 22 (14.9%) |
| Firefighting & Prevention | 91 (82.0%) | 20 (18.0%) |
| Law Enforcement | 35 (94.6%) | 2 (5.4%) |
| Food Preparation & Serving | 259 (46.0%) | 304 (54.0%) |
| Cleaning & Maintenance | 197 (65.9%) | 102 (34.1%) |
| Personal Care & Service | 32 (15.2%) | 178 (84.8%) |
| Total (Category) | 677 (41.5%) | 953 (58.5%) |
| Total (Overall) | 3,993 (49.7%) | 4,036 (50.3%) |
Sales and Office Occupations
The most common Sales and Office occupations in Benzie County are Office & Administration (896 | 11.2%), and Sales & Related (737 | 9.2%).

Sales and Office Occupations by Sex

| Occupation | Male | Female |
| Sales & Related | 355 (48.2%) | 382 (51.8%) |
| Office & Administration | 102 (11.4%) | 794 (88.6%) |
| Total (Category) | 457 (28.0%) | 1,176 (72.0%) |
| Total (Overall) | 3,993 (49.7%) | 4,036 (50.3%) |
Natural Resources, Construction and Maintenance Occupations
The most common Natural Resources, Construction and Maintenance occupations in Benzie County are Construction & Extraction (460 | 5.7%), Installation, Maintenance & Repair (256 | 3.2%), and Farming, Fishing & Forestry (24 | 0.3%).
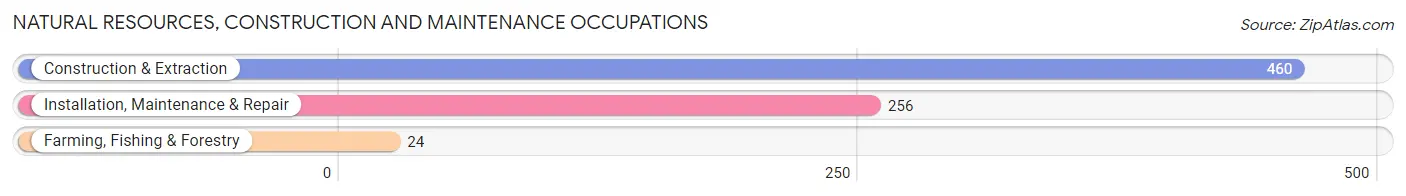
Natural Resources, Construction and Maintenance Occupations by Sex

| Occupation | Male | Female |
| Farming, Fishing & Forestry | 22 (91.7%) | 2 (8.3%) |
| Construction & Extraction | 460 (100.0%) | 0 (0.0%) |
| Installation, Maintenance & Repair | 253 (98.8%) | 3 (1.2%) |
| Total (Category) | 735 (99.3%) | 5 (0.7%) |
| Total (Overall) | 3,993 (49.7%) | 4,036 (50.3%) |
Production, Transportation and Moving Occupations
The most common Production, Transportation and Moving occupations in Benzie County are Production (432 | 5.4%), Transportation (432 | 5.4%), and Material Moving (351 | 4.4%).
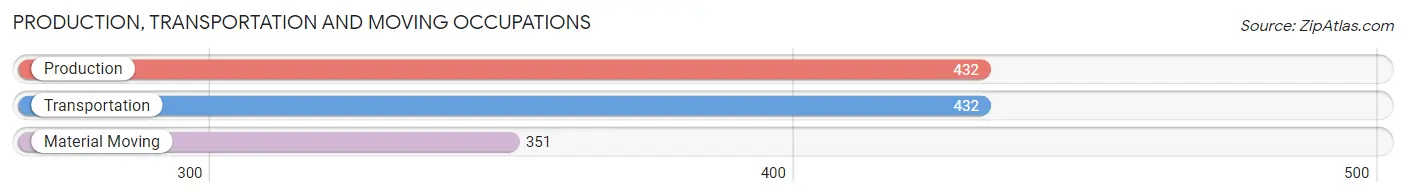
Production, Transportation and Moving Occupations by Sex
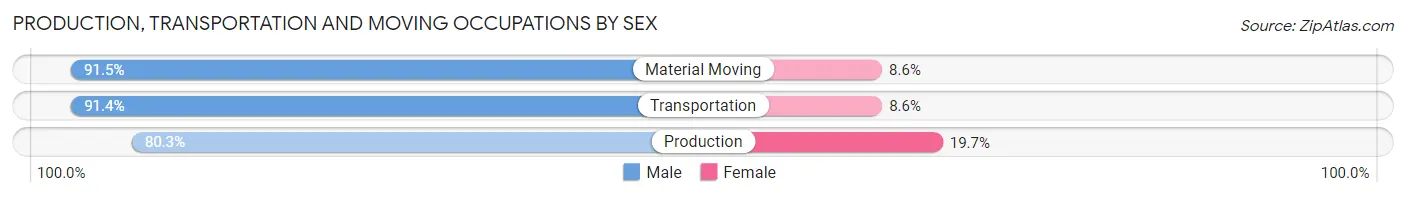
| Occupation | Male | Female |
| Production | 347 (80.3%) | 85 (19.7%) |
| Transportation | 395 (91.4%) | 37 (8.6%) |
| Material Moving | 321 (91.4%) | 30 (8.6%) |
| Total (Category) | 1,063 (87.5%) | 152 (12.5%) |
| Total (Overall) | 3,993 (49.7%) | 4,036 (50.3%) |
Employment Industries by Sex in Benzie County
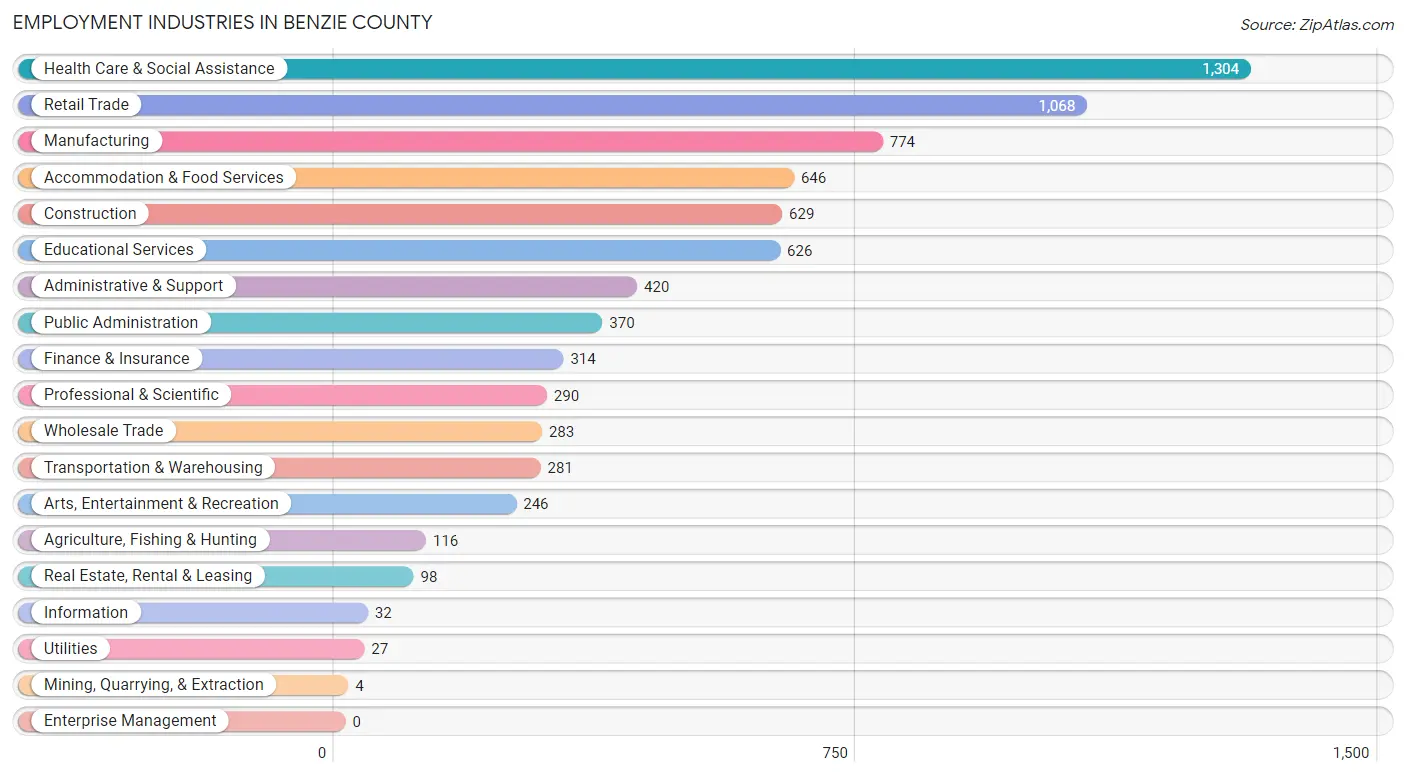
Employment Industries in Benzie County
The major employment industries in Benzie County include Health Care & Social Assistance (1,304 | 16.2%), Retail Trade (1,068 | 13.3%), Manufacturing (774 | 9.6%), Accommodation & Food Services (646 | 8.1%), and Construction (629 | 7.8%).
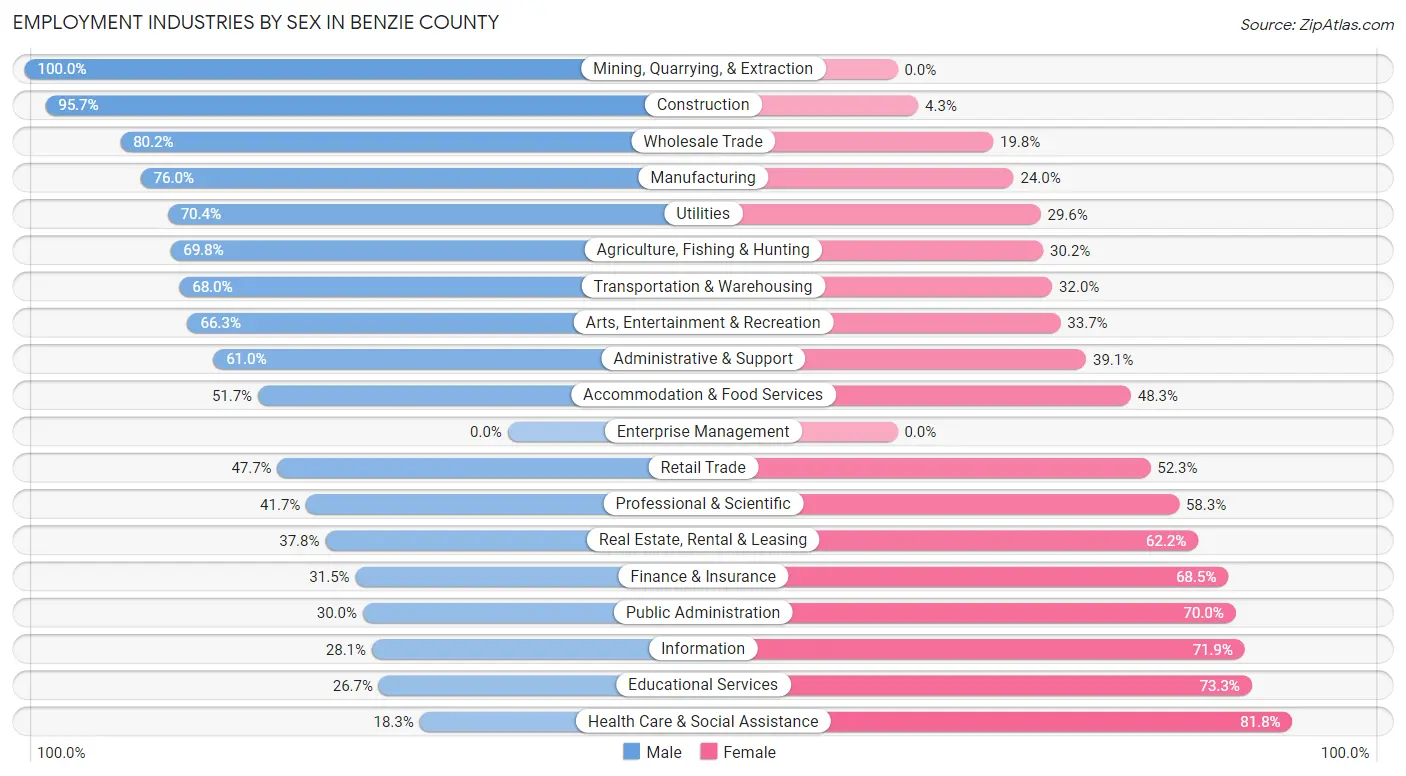
Employment Industries by Sex in Benzie County
The Benzie County industries that see more men than women are Mining, Quarrying, & Extraction (100.0%), Construction (95.7%), and Wholesale Trade (80.2%), whereas the industries that tend to have a higher number of women are Health Care & Social Assistance (81.8%), Educational Services (73.3%), and Information (71.9%).
| Industry | Male | Female |
| Agriculture, Fishing & Hunting | 81 (69.8%) | 35 (30.2%) |
| Mining, Quarrying, & Extraction | 4 (100.0%) | 0 (0.0%) |
| Construction | 602 (95.7%) | 27 (4.3%) |
| Manufacturing | 588 (76.0%) | 186 (24.0%) |
| Wholesale Trade | 227 (80.2%) | 56 (19.8%) |
| Retail Trade | 509 (47.7%) | 559 (52.3%) |
| Transportation & Warehousing | 191 (68.0%) | 90 (32.0%) |
| Utilities | 19 (70.4%) | 8 (29.6%) |
| Information | 9 (28.1%) | 23 (71.9%) |
| Finance & Insurance | 99 (31.5%) | 215 (68.5%) |
| Real Estate, Rental & Leasing | 37 (37.8%) | 61 (62.2%) |
| Professional & Scientific | 121 (41.7%) | 169 (58.3%) |
| Enterprise Management | 0 (0.0%) | 0 (0.0%) |
| Administrative & Support | 256 (61.0%) | 164 (39.1%) |
| Educational Services | 167 (26.7%) | 459 (73.3%) |
| Health Care & Social Assistance | 238 (18.2%) | 1,066 (81.8%) |
| Arts, Entertainment & Recreation | 163 (66.3%) | 83 (33.7%) |
| Accommodation & Food Services | 334 (51.7%) | 312 (48.3%) |
| Public Administration | 111 (30.0%) | 259 (70.0%) |
| Total | 3,993 (49.7%) | 4,036 (50.3%) |
Education in Benzie County
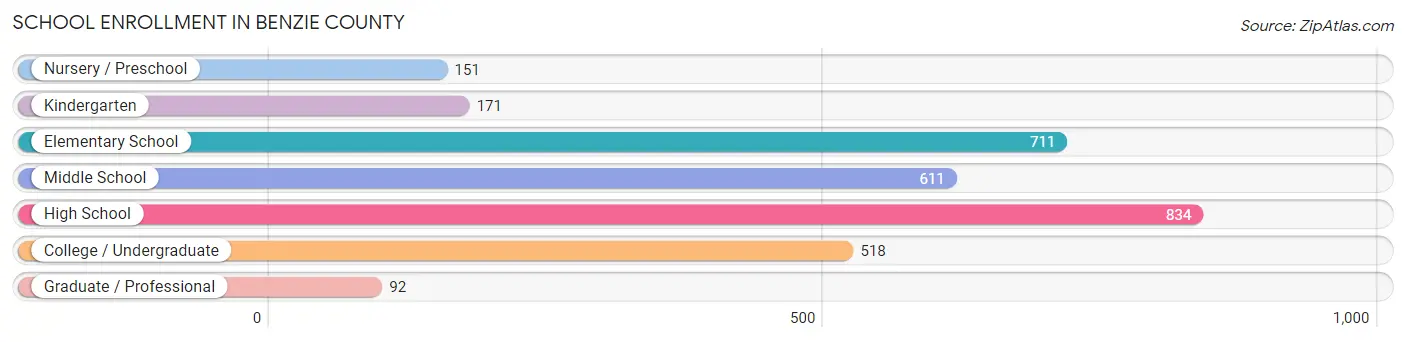
School Enrollment in Benzie County
The most common levels of schooling among the 3,088 students in Benzie County are high school (834 | 27.0%), elementary school (711 | 23.0%), and middle school (611 | 19.8%).
| School Level | # Students | % Students |
| Nursery / Preschool | 151 | 4.9% |
| Kindergarten | 171 | 5.5% |
| Elementary School | 711 | 23.0% |
| Middle School | 611 | 19.8% |
| High School | 834 | 27.0% |
| College / Undergraduate | 518 | 16.8% |
| Graduate / Professional | 92 | 3.0% |
| Total | 3,088 | 100.0% |
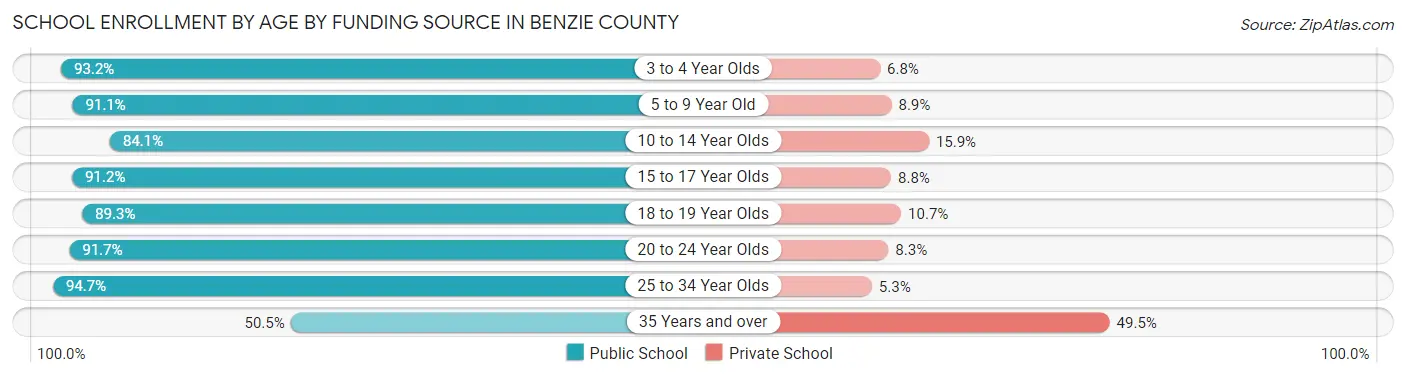
School Enrollment by Age by Funding Source in Benzie County
Out of a total of 3,088 students who are enrolled in schools in Benzie County, 374 (12.1%) attend a private institution, while the remaining 2,714 (87.9%) are enrolled in public schools. The age group of 35 years and over has the highest likelihood of being enrolled in private schools, with 54 (49.5% in the age bracket) enrolled. Conversely, the age group of 25 to 34 year olds has the lowest likelihood of being enrolled in a private school, with 126 (94.7% in the age bracket) attending a public institution.
| Age Bracket | Public School | Private School |
| 3 to 4 Year Olds | 110 (93.2%) | 8 (6.8%) |
| 5 to 9 Year Old | 725 (91.1%) | 71 (8.9%) |
| 10 to 14 Year Olds | 710 (84.1%) | 134 (15.9%) |
| 15 to 17 Year Olds | 547 (91.2%) | 53 (8.8%) |
| 18 to 19 Year Olds | 200 (89.3%) | 24 (10.7%) |
| 20 to 24 Year Olds | 242 (91.7%) | 22 (8.3%) |
| 25 to 34 Year Olds | 126 (94.7%) | 7 (5.3%) |
| 35 Years and over | 55 (50.5%) | 54 (49.5%) |
| Total | 2,714 (87.9%) | 374 (12.1%) |
Educational Attainment by Field of Study in Benzie County
Business (873 | 17.7%), education (866 | 17.6%), science & technology (641 | 13.0%), bio, nature & agricultural (343 | 7.0%), and arts & humanities (281 | 5.7%) are the most common fields of study among 4,917 individuals in Benzie County who have obtained a bachelor's degree or higher.
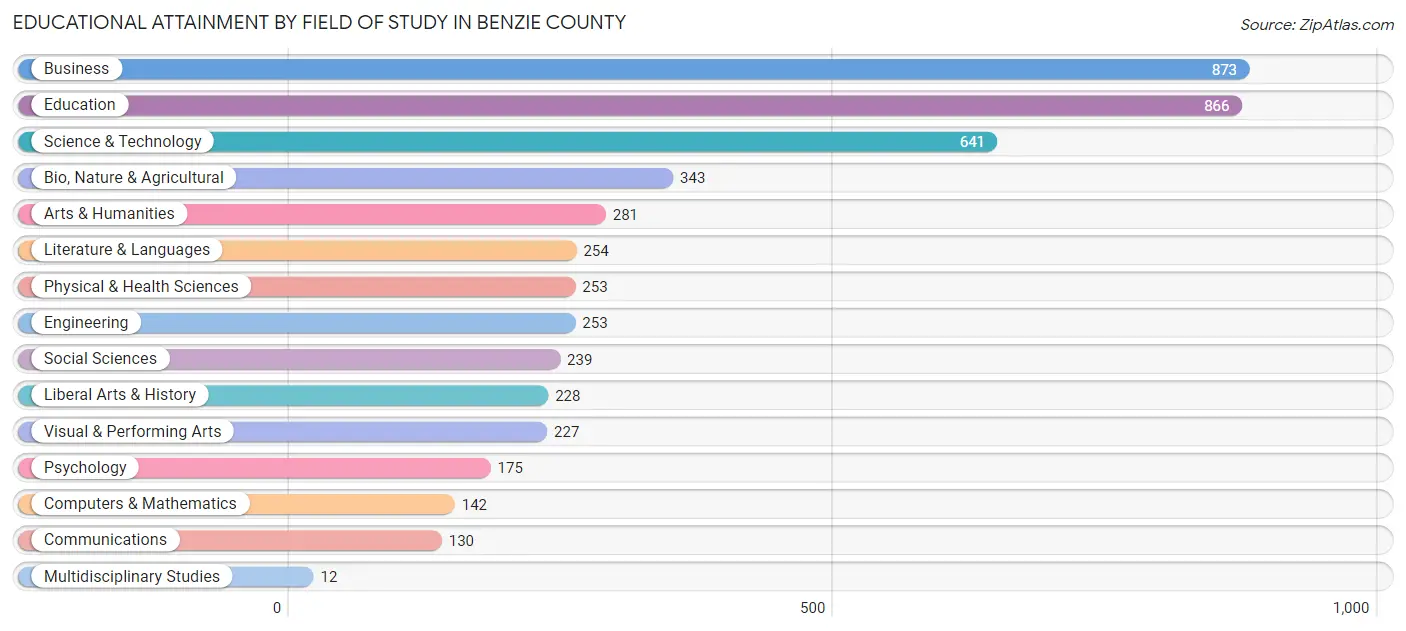
| Field of Study | # Graduates | % Graduates |
| Computers & Mathematics | 142 | 2.9% |
| Bio, Nature & Agricultural | 343 | 7.0% |
| Physical & Health Sciences | 253 | 5.1% |
| Psychology | 175 | 3.6% |
| Social Sciences | 239 | 4.9% |
| Engineering | 253 | 5.1% |
| Multidisciplinary Studies | 12 | 0.2% |
| Science & Technology | 641 | 13.0% |
| Business | 873 | 17.7% |
| Education | 866 | 17.6% |
| Literature & Languages | 254 | 5.2% |
| Liberal Arts & History | 228 | 4.6% |
| Visual & Performing Arts | 227 | 4.6% |
| Communications | 130 | 2.6% |
| Arts & Humanities | 281 | 5.7% |
| Total | 4,917 | 100.0% |
Transportation & Commute in Benzie County
Vehicle Availability by Sex in Benzie County
The most prevalent vehicle ownership categories in Benzie County are males with 2 vehicles (1,634, accounting for 41.5%) and females with 2 vehicles (1,913, making up 41.6%).
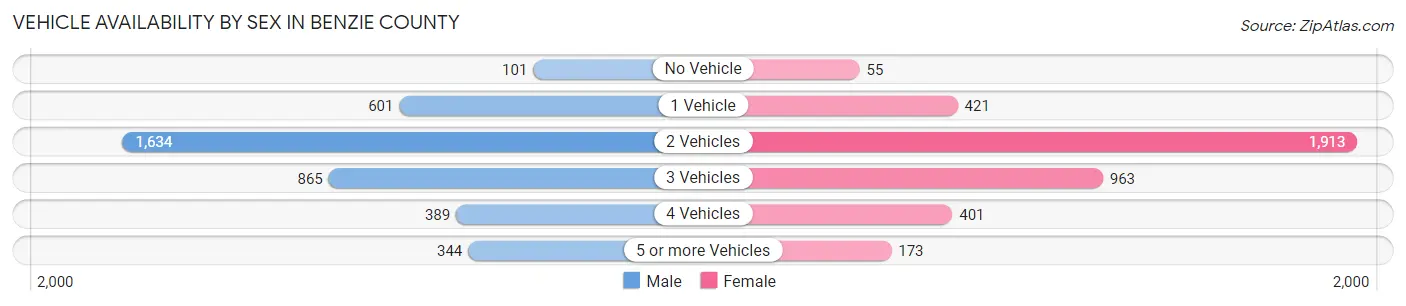
| Vehicles Available | Male | Female |
| No Vehicle | 101 (2.6%) | 55 (1.4%) |
| 1 Vehicle | 601 (15.3%) | 421 (10.7%) |
| 2 Vehicles | 1,634 (41.5%) | 1,913 (48.7%) |
| 3 Vehicles | 865 (22.0%) | 963 (24.5%) |
| 4 Vehicles | 389 (9.9%) | 401 (10.2%) |
| 5 or more Vehicles | 344 (8.7%) | 173 (4.4%) |
| Total | 3,934 (100.0%) | 3,926 (100.0%) |
Commute Time in Benzie County
The most frequently occuring commute durations in Benzie County are 20 to 24 minutes (1,238 commuters, 17.3%), 30 to 34 minutes (1,182 commuters, 16.5%), and 15 to 19 minutes (810 commuters, 11.3%).

| Commute Time | # Commuters | % Commuters |
| Less than 5 Minutes | 301 | 4.2% |
| 5 to 9 Minutes | 784 | 10.9% |
| 10 to 14 Minutes | 735 | 10.3% |
| 15 to 19 Minutes | 810 | 11.3% |
| 20 to 24 Minutes | 1,238 | 17.3% |
| 25 to 29 Minutes | 517 | 7.2% |
| 30 to 34 Minutes | 1,182 | 16.5% |
| 35 to 39 Minutes | 284 | 4.0% |
| 40 to 44 Minutes | 417 | 5.8% |
| 45 to 59 Minutes | 626 | 8.7% |
| 60 to 89 Minutes | 124 | 1.7% |
| 90 or more Minutes | 146 | 2.0% |
Commute Time by Sex in Benzie County
The most common commute times in Benzie County are 20 to 24 minutes (696 commuters, 19.0%) for males and 30 to 34 minutes (633 commuters, 18.1%) for females.
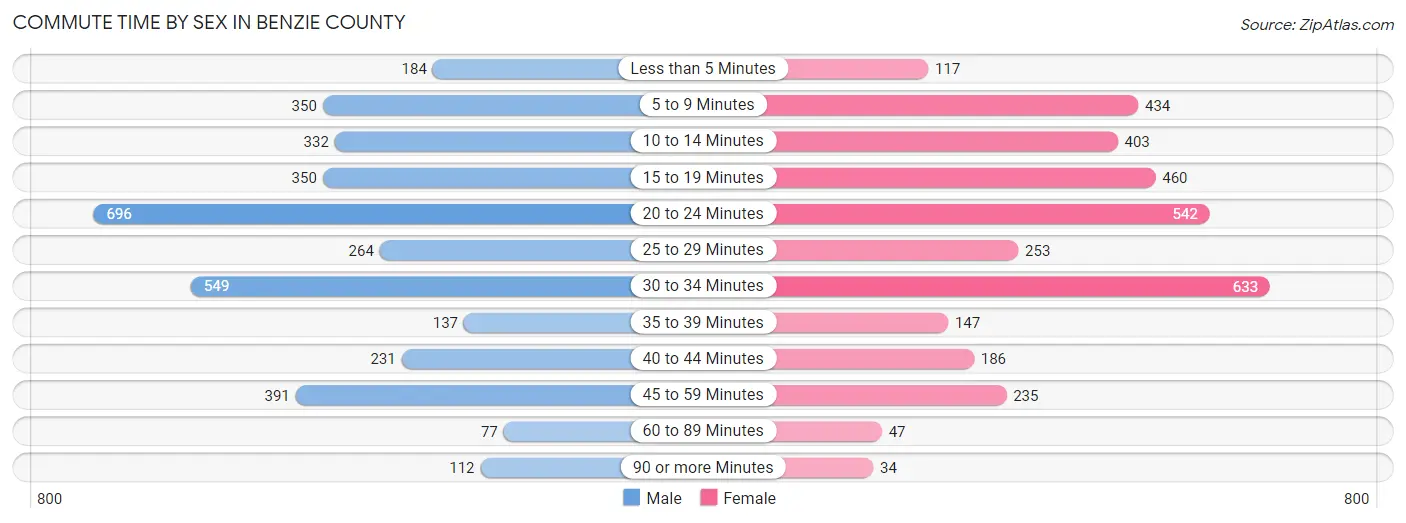
| Commute Time | Male | Female |
| Less than 5 Minutes | 184 (5.0%) | 117 (3.4%) |
| 5 to 9 Minutes | 350 (9.5%) | 434 (12.4%) |
| 10 to 14 Minutes | 332 (9.0%) | 403 (11.5%) |
| 15 to 19 Minutes | 350 (9.5%) | 460 (13.2%) |
| 20 to 24 Minutes | 696 (19.0%) | 542 (15.5%) |
| 25 to 29 Minutes | 264 (7.2%) | 253 (7.2%) |
| 30 to 34 Minutes | 549 (14.9%) | 633 (18.1%) |
| 35 to 39 Minutes | 137 (3.7%) | 147 (4.2%) |
| 40 to 44 Minutes | 231 (6.3%) | 186 (5.3%) |
| 45 to 59 Minutes | 391 (10.6%) | 235 (6.7%) |
| 60 to 89 Minutes | 77 (2.1%) | 47 (1.3%) |
| 90 or more Minutes | 112 (3.0%) | 34 (1.0%) |
Time of Departure to Work by Sex in Benzie County
The most frequent times of departure to work in Benzie County are 7:00 AM to 7:29 AM (482, 13.1%) for males and 7:30 AM to 7:59 AM (571, 16.4%) for females.
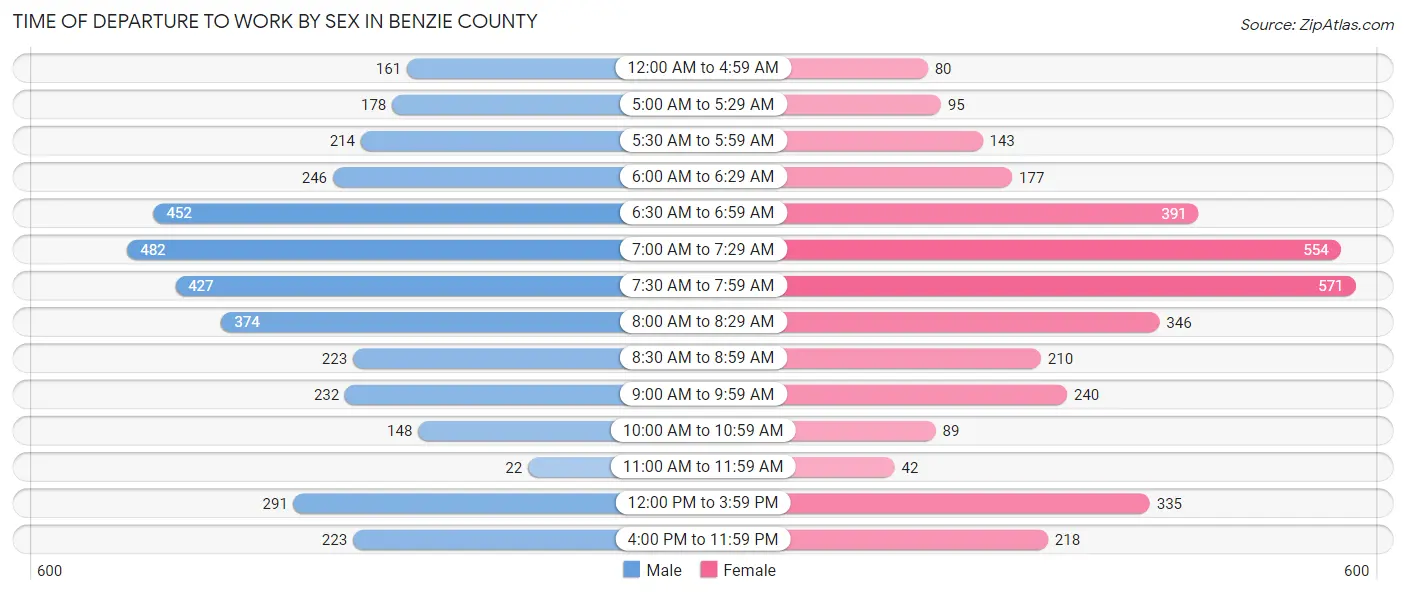
| Time of Departure | Male | Female |
| 12:00 AM to 4:59 AM | 161 (4.4%) | 80 (2.3%) |
| 5:00 AM to 5:29 AM | 178 (4.9%) | 95 (2.7%) |
| 5:30 AM to 5:59 AM | 214 (5.8%) | 143 (4.1%) |
| 6:00 AM to 6:29 AM | 246 (6.7%) | 177 (5.1%) |
| 6:30 AM to 6:59 AM | 452 (12.3%) | 391 (11.2%) |
| 7:00 AM to 7:29 AM | 482 (13.1%) | 554 (15.9%) |
| 7:30 AM to 7:59 AM | 427 (11.6%) | 571 (16.4%) |
| 8:00 AM to 8:29 AM | 374 (10.2%) | 346 (9.9%) |
| 8:30 AM to 8:59 AM | 223 (6.1%) | 210 (6.0%) |
| 9:00 AM to 9:59 AM | 232 (6.3%) | 240 (6.9%) |
| 10:00 AM to 10:59 AM | 148 (4.0%) | 89 (2.5%) |
| 11:00 AM to 11:59 AM | 22 (0.6%) | 42 (1.2%) |
| 12:00 PM to 3:59 PM | 291 (7.9%) | 335 (9.6%) |
| 4:00 PM to 11:59 PM | 223 (6.1%) | 218 (6.2%) |
| Total | 3,673 (100.0%) | 3,491 (100.0%) |
Housing Occupancy in Benzie County
Occupancy by Ownership in Benzie County
Of the total 7,173 dwellings in Benzie County, owner-occupied units account for 6,317 (88.1%), while renter-occupied units make up 856 (11.9%).
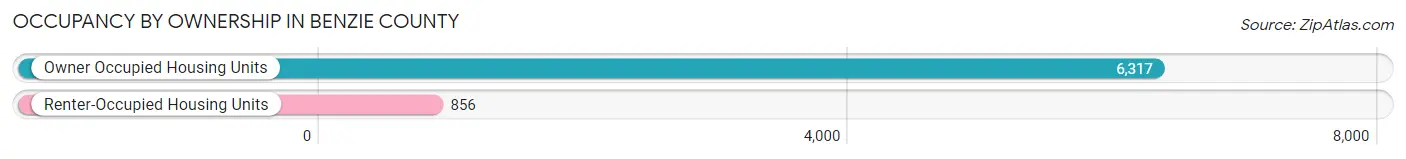
| Occupancy | # Housing Units | % Housing Units |
| Owner Occupied Housing Units | 6,317 | 88.1% |
| Renter-Occupied Housing Units | 856 | 11.9% |
| Total Occupied Housing Units | 7,173 | 100.0% |
Occupancy by Household Size in Benzie County
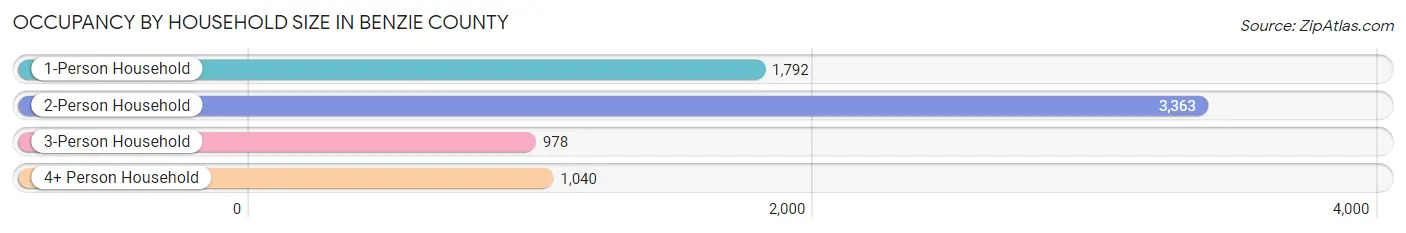
| Household Size | # Housing Units | % Housing Units |
| 1-Person Household | 1,792 | 25.0% |
| 2-Person Household | 3,363 | 46.9% |
| 3-Person Household | 978 | 13.6% |
| 4+ Person Household | 1,040 | 14.5% |
| Total Housing Units | 7,173 | 100.0% |
Occupancy by Ownership by Household Size in Benzie County
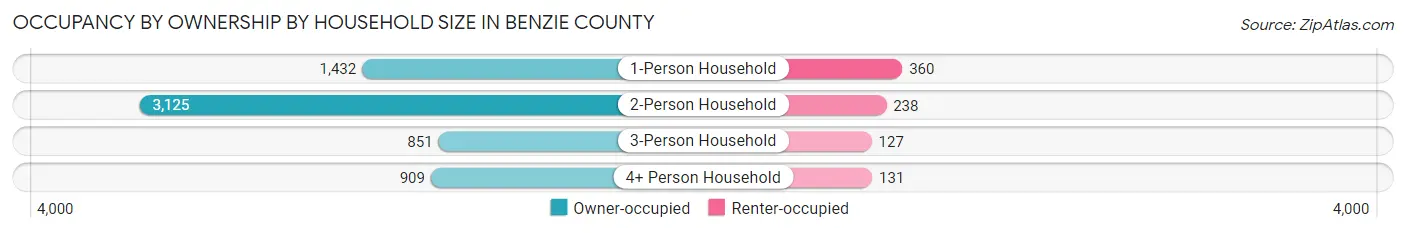
| Household Size | Owner-occupied | Renter-occupied |
| 1-Person Household | 1,432 (79.9%) | 360 (20.1%) |
| 2-Person Household | 3,125 (92.9%) | 238 (7.1%) |
| 3-Person Household | 851 (87.0%) | 127 (13.0%) |
| 4+ Person Household | 909 (87.4%) | 131 (12.6%) |
| Total Housing Units | 6,317 (88.1%) | 856 (11.9%) |
Occupancy by Educational Attainment in Benzie County
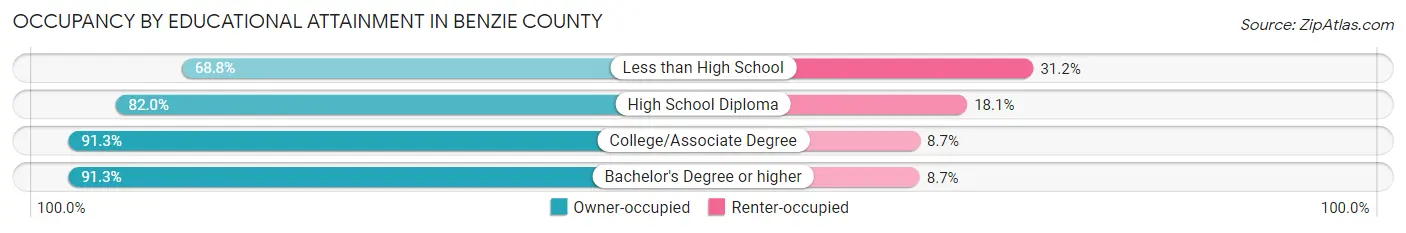
| Household Size | Owner-occupied | Renter-occupied |
| Less than High School | 214 (68.8%) | 97 (31.2%) |
| High School Diploma | 1,426 (82.0%) | 314 (18.0%) |
| College/Associate Degree | 2,135 (91.3%) | 204 (8.7%) |
| Bachelor's Degree or higher | 2,542 (91.3%) | 241 (8.7%) |
Occupancy by Age of Householder in Benzie County

| Age Bracket | # Households | % Households |
| Under 35 Years | 733 | 10.2% |
| 35 to 44 Years | 908 | 12.7% |
| 45 to 54 Years | 1,112 | 15.5% |
| 55 to 64 Years | 1,572 | 21.9% |
| 65 to 74 Years | 1,699 | 23.7% |
| 75 to 84 Years | 810 | 11.3% |
| 85 Years and Over | 339 | 4.7% |
| Total | 7,173 | 100.0% |
Housing Finances in Benzie County
Median Income by Occupancy in Benzie County

| Occupancy Type | # Households | Median Income |
| Owner-Occupied | 6,317 (88.1%) | $76,859 |
| Renter-Occupied | 856 (11.9%) | $39,722 |
| Average | 7,173 (100.0%) | $71,327 |
Occupancy by Householder Income Bracket in Benzie County
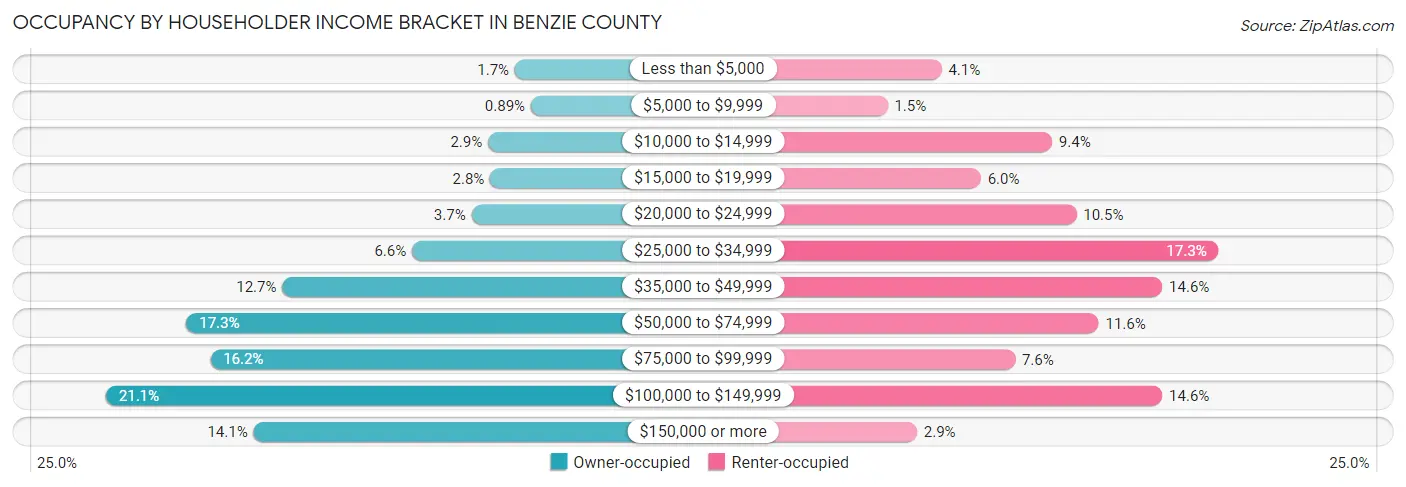
| Income Bracket | Owner-occupied | Renter-occupied |
| Less than $5,000 | 104 (1.7%) | 35 (4.1%) |
| $5,000 to $9,999 | 56 (0.9%) | 13 (1.5%) |
| $10,000 to $14,999 | 185 (2.9%) | 80 (9.3%) |
| $15,000 to $19,999 | 179 (2.8%) | 51 (6.0%) |
| $20,000 to $24,999 | 235 (3.7%) | 90 (10.5%) |
| $25,000 to $34,999 | 414 (6.6%) | 148 (17.3%) |
| $35,000 to $49,999 | 804 (12.7%) | 125 (14.6%) |
| $50,000 to $74,999 | 1,093 (17.3%) | 99 (11.6%) |
| $75,000 to $99,999 | 1,021 (16.2%) | 65 (7.6%) |
| $100,000 to $149,999 | 1,335 (21.1%) | 125 (14.6%) |
| $150,000 or more | 891 (14.1%) | 25 (2.9%) |
| Total | 6,317 (100.0%) | 856 (100.0%) |
Monthly Housing Cost Tiers in Benzie County

| Monthly Cost | Owner-occupied | Renter-occupied |
| Less than $300 | 292 (4.6%) | 45 (5.3%) |
| $300 to $499 | 960 (15.2%) | 48 (5.6%) |
| $500 to $799 | 1,205 (19.1%) | 130 (15.2%) |
| $800 to $999 | 622 (9.9%) | 119 (13.9%) |
| $1,000 to $1,499 | 1,746 (27.6%) | 230 (26.9%) |
| $1,500 to $1,999 | 886 (14.0%) | 54 (6.3%) |
| $2,000 to $2,499 | 291 (4.6%) | 0 (0.0%) |
| $2,500 to $2,999 | 230 (3.6%) | 0 (0.0%) |
| $3,000 or more | 85 (1.3%) | 22 (2.6%) |
| Total | 6,317 (100.0%) | 856 (100.0%) |
Physical Housing Characteristics in Benzie County
Housing Structures in Benzie County
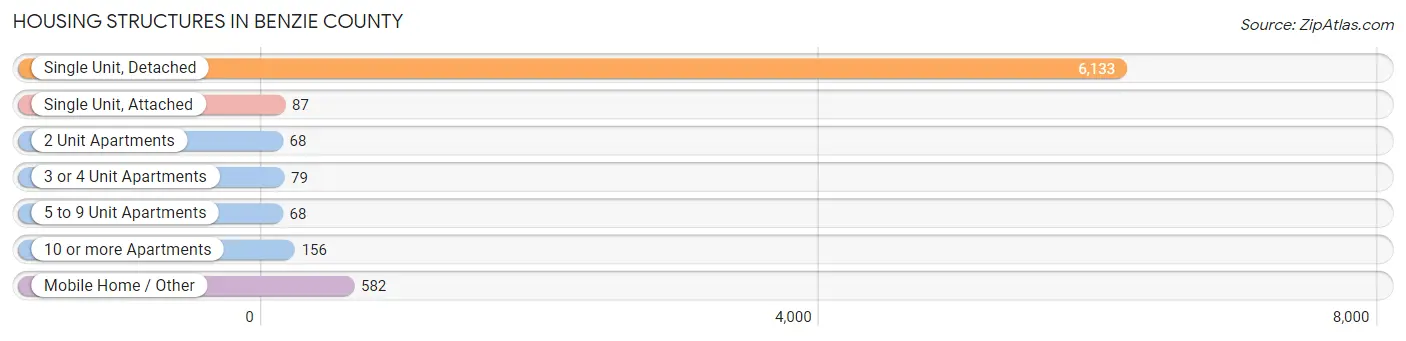
| Structure Type | # Housing Units | % Housing Units |
| Single Unit, Detached | 6,133 | 85.5% |
| Single Unit, Attached | 87 | 1.2% |
| 2 Unit Apartments | 68 | 0.9% |
| 3 or 4 Unit Apartments | 79 | 1.1% |
| 5 to 9 Unit Apartments | 68 | 0.9% |
| 10 or more Apartments | 156 | 2.2% |
| Mobile Home / Other | 582 | 8.1% |
| Total | 7,173 | 100.0% |
Housing Structures by Occupancy in Benzie County
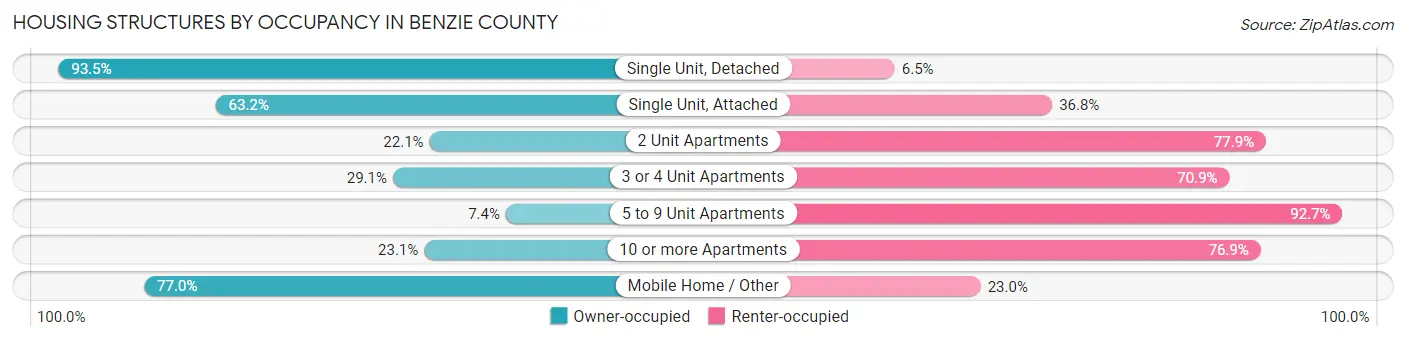
| Structure Type | Owner-occupied | Renter-occupied |
| Single Unit, Detached | 5,735 (93.5%) | 398 (6.5%) |
| Single Unit, Attached | 55 (63.2%) | 32 (36.8%) |
| 2 Unit Apartments | 15 (22.1%) | 53 (77.9%) |
| 3 or 4 Unit Apartments | 23 (29.1%) | 56 (70.9%) |
| 5 to 9 Unit Apartments | 5 (7.3%) | 63 (92.6%) |
| 10 or more Apartments | 36 (23.1%) | 120 (76.9%) |
| Mobile Home / Other | 448 (77.0%) | 134 (23.0%) |
| Total | 6,317 (88.1%) | 856 (11.9%) |
Housing Structures by Number of Rooms in Benzie County

| Number of Rooms | Owner-occupied | Renter-occupied |
| 1 Room | 22 (0.4%) | 24 (2.8%) |
| 2 or 3 Rooms | 241 (3.8%) | 183 (21.4%) |
| 4 or 5 Rooms | 1,927 (30.5%) | 377 (44.0%) |
| 6 or 7 Rooms | 2,062 (32.6%) | 210 (24.5%) |
| 8 or more Rooms | 2,065 (32.7%) | 62 (7.2%) |
| Total | 6,317 (100.0%) | 856 (100.0%) |
Housing Structure by Heating Type in Benzie County

| Heating Type | Owner-occupied | Renter-occupied |
| Utility Gas | 2,502 (39.6%) | 387 (45.2%) |
| Bottled, Tank, or LP Gas | 2,382 (37.7%) | 217 (25.4%) |
| Electricity | 450 (7.1%) | 184 (21.5%) |
| Fuel Oil or Kerosene | 75 (1.2%) | 10 (1.2%) |
| Coal or Coke | 0 (0.0%) | 0 (0.0%) |
| All other Fuels | 882 (14.0%) | 36 (4.2%) |
| No Fuel Used | 26 (0.4%) | 22 (2.6%) |
| Total | 6,317 (100.0%) | 856 (100.0%) |
Household Vehicle Usage in Benzie County

| Vehicles per Household | Owner-occupied | Renter-occupied |
| No Vehicle | 117 (1.8%) | 92 (10.7%) |
| 1 Vehicle | 1,617 (25.6%) | 428 (50.0%) |
| 2 Vehicles | 2,885 (45.7%) | 274 (32.0%) |
| 3 or more Vehicles | 1,698 (26.9%) | 62 (7.2%) |
| Total | 6,317 (100.0%) | 856 (100.0%) |
Real Estate & Mortgages in Benzie County
Real Estate and Mortgage Overview in Benzie County
| Characteristic | Without Mortgage | With Mortgage |
| Housing Units | 2,608 | 3,709 |
| Median Property Value | $253,500 | $237,900 |
| Median Household Income | $57,321 | $648 |
| Monthly Housing Costs | $513 | $78 |
| Real Estate Taxes | $2,291 | $137 |
Property Value by Mortgage Status in Benzie County
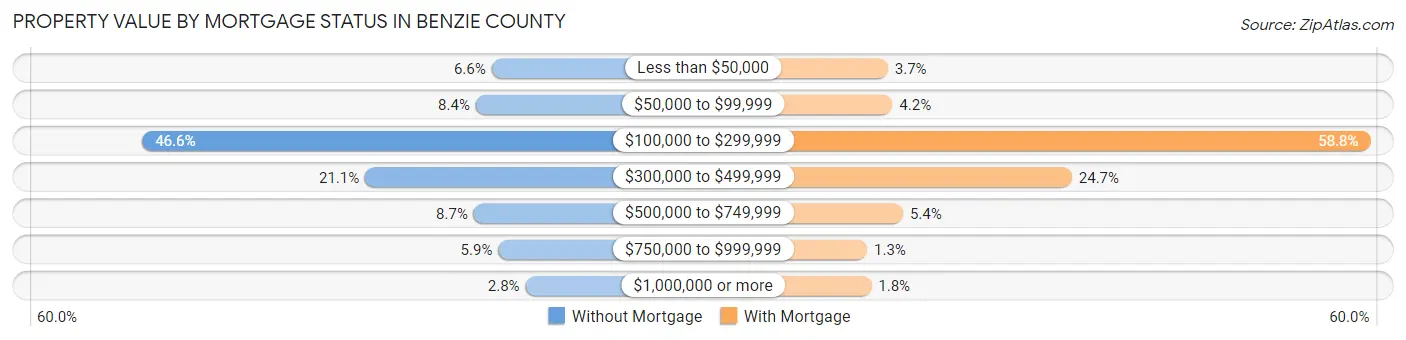
| Property Value | Without Mortgage | With Mortgage |
| Less than $50,000 | 173 (6.6%) | 137 (3.7%) |
| $50,000 to $99,999 | 220 (8.4%) | 156 (4.2%) |
| $100,000 to $299,999 | 1,214 (46.6%) | 2,182 (58.8%) |
| $300,000 to $499,999 | 550 (21.1%) | 917 (24.7%) |
| $500,000 to $749,999 | 226 (8.7%) | 201 (5.4%) |
| $750,000 to $999,999 | 153 (5.9%) | 49 (1.3%) |
| $1,000,000 or more | 72 (2.8%) | 67 (1.8%) |
| Total | 2,608 (100.0%) | 3,709 (100.0%) |
Household Income by Mortgage Status in Benzie County
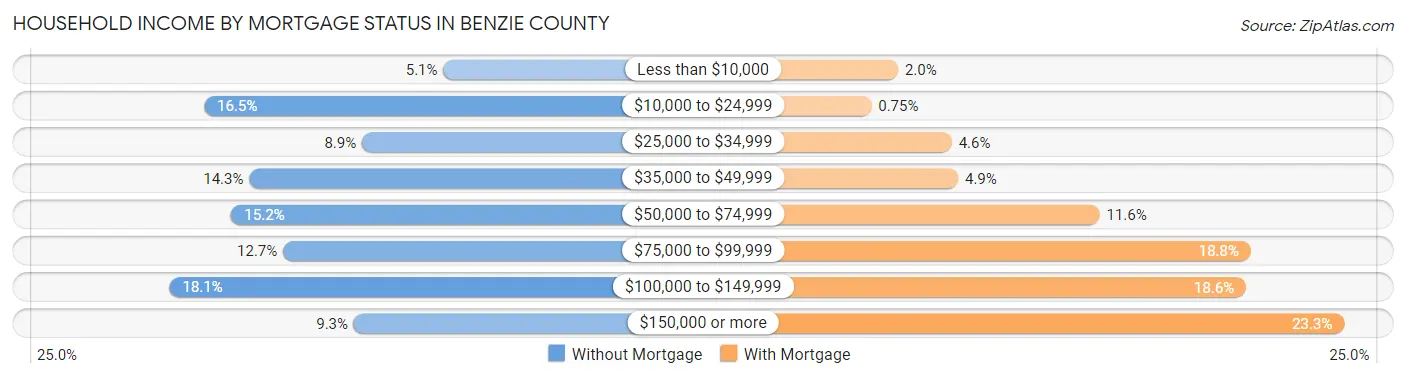
| Household Income | Without Mortgage | With Mortgage |
| Less than $10,000 | 132 (5.1%) | 75 (2.0%) |
| $10,000 to $24,999 | 429 (16.5%) | 28 (0.7%) |
| $25,000 to $34,999 | 233 (8.9%) | 170 (4.6%) |
| $35,000 to $49,999 | 373 (14.3%) | 181 (4.9%) |
| $50,000 to $74,999 | 395 (15.1%) | 431 (11.6%) |
| $75,000 to $99,999 | 331 (12.7%) | 698 (18.8%) |
| $100,000 to $149,999 | 472 (18.1%) | 690 (18.6%) |
| $150,000 or more | 243 (9.3%) | 863 (23.3%) |
| Total | 2,608 (100.0%) | 3,709 (100.0%) |
Property Value to Household Income Ratio in Benzie County

| Value-to-Income Ratio | Without Mortgage | With Mortgage |
| Less than 2.0x | 467 (17.9%) | 84,148 (2,268.8%) |
| 2.0x to 2.9x | 382 (14.6%) | 1,165 (31.4%) |
| 3.0x to 3.9x | 401 (15.4%) | 867 (23.4%) |
| 4.0x or more | 1,303 (50.0%) | 522 (14.1%) |
| Total | 2,608 (100.0%) | 3,709 (100.0%) |
Real Estate Taxes by Mortgage Status in Benzie County
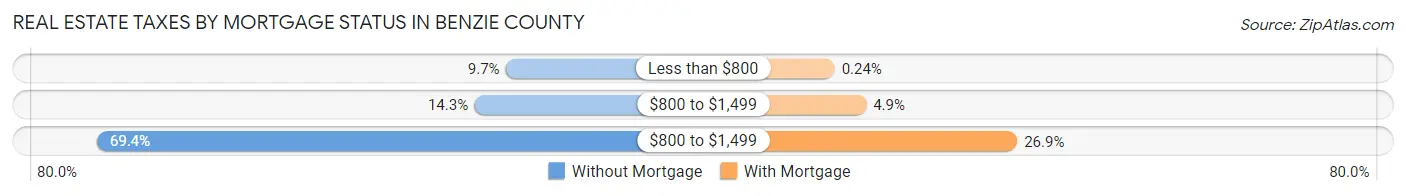
| Property Taxes | Without Mortgage | With Mortgage |
| Less than $800 | 254 (9.7%) | 9 (0.2%) |
| $800 to $1,499 | 374 (14.3%) | 180 (4.9%) |
| $800 to $1,499 | 1,811 (69.4%) | 998 (26.9%) |
| Total | 2,608 (100.0%) | 3,709 (100.0%) |
Health & Disability in Benzie County
Health Insurance Coverage by Age in Benzie County
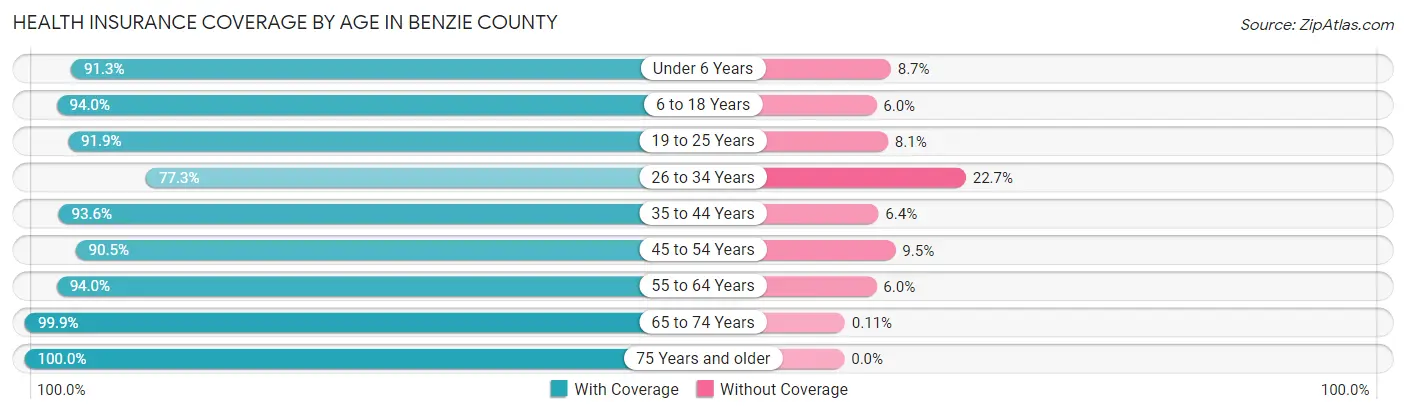
| Age Bracket | With Coverage | Without Coverage |
| Under 6 Years | 822 (91.3%) | 78 (8.7%) |
| 6 to 18 Years | 2,235 (94.0%) | 142 (6.0%) |
| 19 to 25 Years | 1,062 (91.9%) | 94 (8.1%) |
| 26 to 34 Years | 1,287 (77.3%) | 377 (22.7%) |
| 35 to 44 Years | 1,753 (93.6%) | 119 (6.4%) |
| 45 to 54 Years | 1,879 (90.5%) | 198 (9.5%) |
| 55 to 64 Years | 2,887 (94.0%) | 184 (6.0%) |
| 65 to 74 Years | 2,818 (99.9%) | 3 (0.1%) |
| 75 Years and older | 1,928 (100.0%) | 0 (0.0%) |
| Total | 16,671 (93.3%) | 1,195 (6.7%) |
Health Insurance Coverage by Citizenship Status in Benzie County
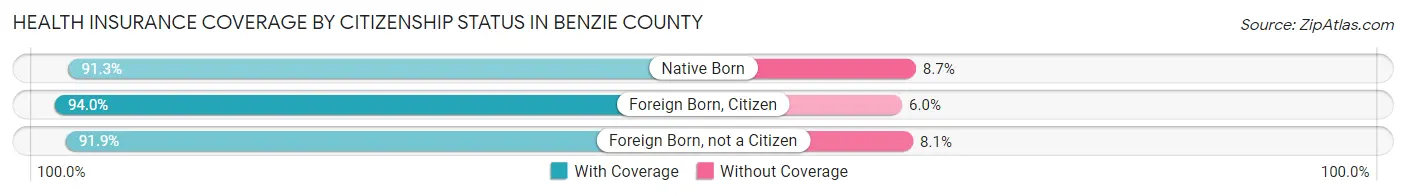
| Citizenship Status | With Coverage | Without Coverage |
| Native Born | 822 (91.3%) | 78 (8.7%) |
| Foreign Born, Citizen | 2,235 (94.0%) | 142 (6.0%) |
| Foreign Born, not a Citizen | 1,062 (91.9%) | 94 (8.1%) |
Health Insurance Coverage by Household Income in Benzie County

| Household Income | With Coverage | Without Coverage |
| Under $25,000 | 1,483 (92.8%) | 115 (7.2%) |
| $25,000 to $49,999 | 2,859 (91.5%) | 265 (8.5%) |
| $50,000 to $74,999 | 2,794 (95.2%) | 142 (4.8%) |
| $75,000 to $99,999 | 2,453 (91.0%) | 243 (9.0%) |
| $100,000 and over | 6,952 (94.2%) | 426 (5.8%) |
Public vs Private Health Insurance Coverage by Age in Benzie County
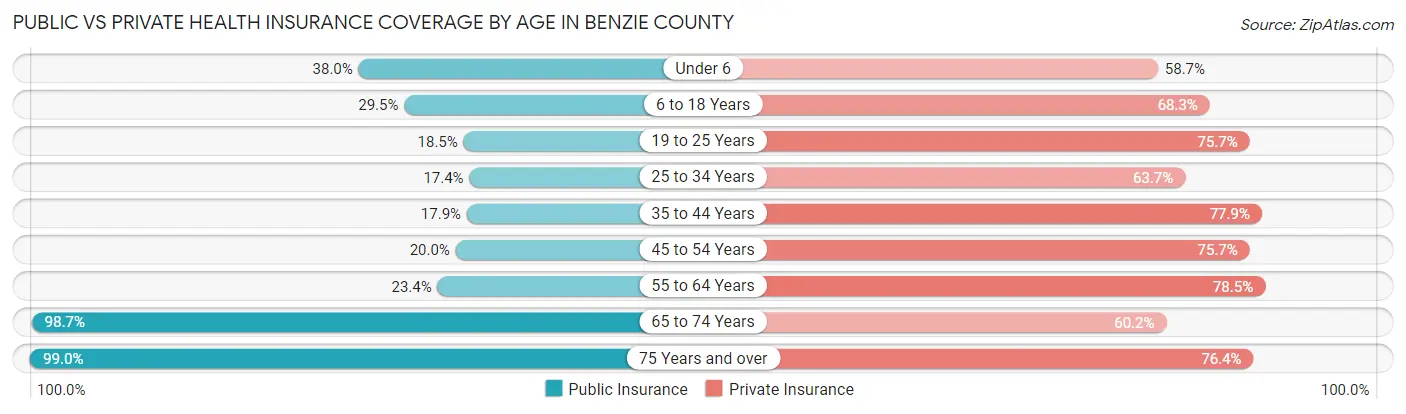
| Age Bracket | Public Insurance | Private Insurance |
| Under 6 | 342 (38.0%) | 528 (58.7%) |
| 6 to 18 Years | 702 (29.5%) | 1,623 (68.3%) |
| 19 to 25 Years | 214 (18.5%) | 875 (75.7%) |
| 25 to 34 Years | 290 (17.4%) | 1,060 (63.7%) |
| 35 to 44 Years | 335 (17.9%) | 1,459 (77.9%) |
| 45 to 54 Years | 415 (20.0%) | 1,572 (75.7%) |
| 55 to 64 Years | 717 (23.4%) | 2,412 (78.5%) |
| 65 to 74 Years | 2,784 (98.7%) | 1,699 (60.2%) |
| 75 Years and over | 1,908 (99.0%) | 1,473 (76.4%) |
| Total | 7,707 (43.1%) | 12,701 (71.1%) |
Disability Status by Sex by Age in Benzie County
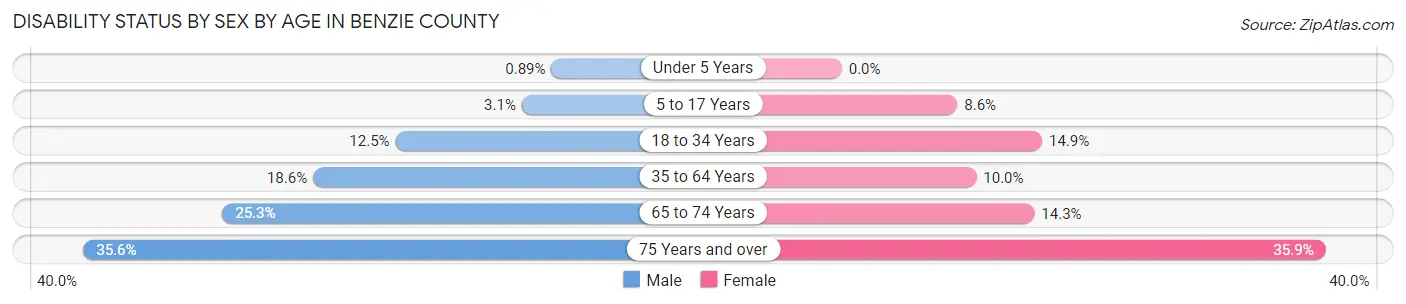
| Age Bracket | Male | Female |
| Under 5 Years | 4 (0.9%) | 0 (0.0%) |
| 5 to 17 Years | 37 (3.1%) | 97 (8.6%) |
| 18 to 34 Years | 192 (12.5%) | 215 (14.9%) |
| 35 to 64 Years | 648 (18.6%) | 353 (10.0%) |
| 65 to 74 Years | 360 (25.3%) | 200 (14.3%) |
| 75 Years and over | 319 (35.6%) | 371 (35.9%) |
Disability Class by Sex by Age in Benzie County
Disability Class: Hearing Difficulty

| Age Bracket | Male | Female |
| Under 5 Years | 4 (0.9%) | 0 (0.0%) |
| 5 to 17 Years | 3 (0.3%) | 0 (0.0%) |
| 18 to 34 Years | 27 (1.8%) | 11 (0.8%) |
| 35 to 64 Years | 149 (4.3%) | 67 (1.9%) |
| 65 to 74 Years | 213 (15.0%) | 53 (3.8%) |
| 75 Years and over | 227 (25.4%) | 190 (18.4%) |
Disability Class: Vision Difficulty
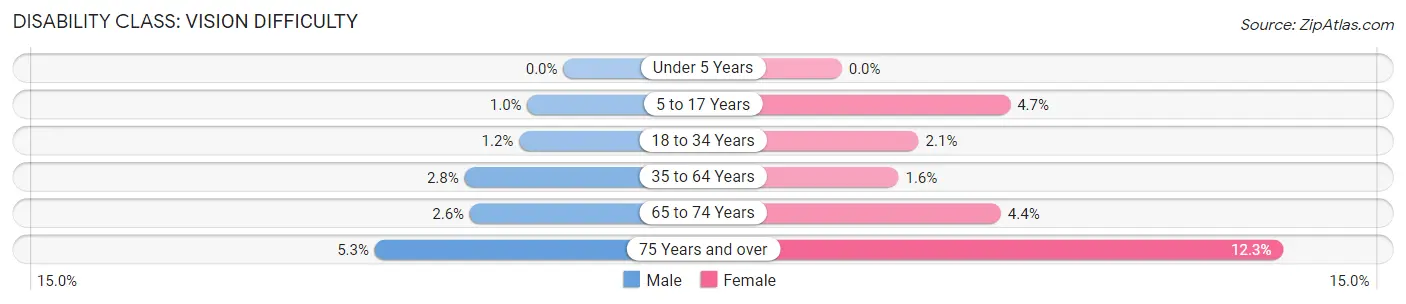
| Age Bracket | Male | Female |
| Under 5 Years | 0 (0.0%) | 0 (0.0%) |
| 5 to 17 Years | 12 (1.0%) | 53 (4.7%) |
| 18 to 34 Years | 19 (1.2%) | 31 (2.1%) |
| 35 to 64 Years | 96 (2.8%) | 56 (1.6%) |
| 65 to 74 Years | 37 (2.6%) | 62 (4.4%) |
| 75 Years and over | 47 (5.2%) | 127 (12.3%) |
Disability Class: Cognitive Difficulty
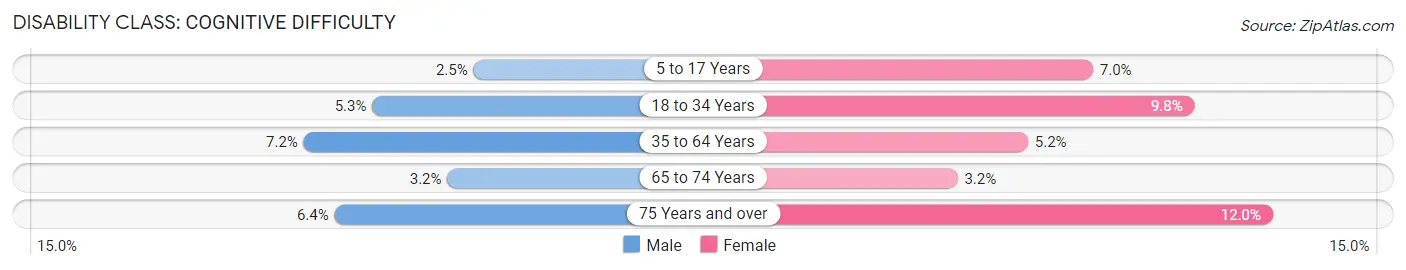
| Age Bracket | Male | Female |
| 5 to 17 Years | 30 (2.5%) | 79 (7.0%) |
| 18 to 34 Years | 82 (5.3%) | 142 (9.8%) |
| 35 to 64 Years | 252 (7.2%) | 183 (5.2%) |
| 65 to 74 Years | 46 (3.2%) | 45 (3.2%) |
| 75 Years and over | 57 (6.4%) | 124 (12.0%) |
Disability Class: Ambulatory Difficulty

| Age Bracket | Male | Female |
| 5 to 17 Years | 0 (0.0%) | 0 (0.0%) |
| 18 to 34 Years | 28 (1.8%) | 63 (4.4%) |
| 35 to 64 Years | 273 (7.8%) | 179 (5.1%) |
| 65 to 74 Years | 132 (9.3%) | 86 (6.1%) |
| 75 Years and over | 142 (15.9%) | 288 (27.9%) |
Disability Class: Self-Care Difficulty
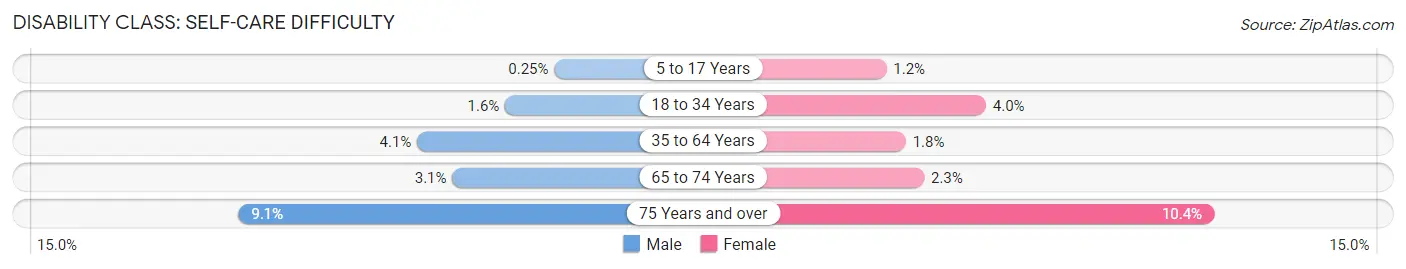
| Age Bracket | Male | Female |
| 5 to 17 Years | 3 (0.3%) | 14 (1.2%) |
| 18 to 34 Years | 25 (1.6%) | 58 (4.0%) |
| 35 to 64 Years | 142 (4.1%) | 63 (1.8%) |
| 65 to 74 Years | 44 (3.1%) | 32 (2.3%) |
| 75 Years and over | 81 (9.0%) | 107 (10.4%) |
Technology Access in Benzie County
Computing Device Access in Benzie County
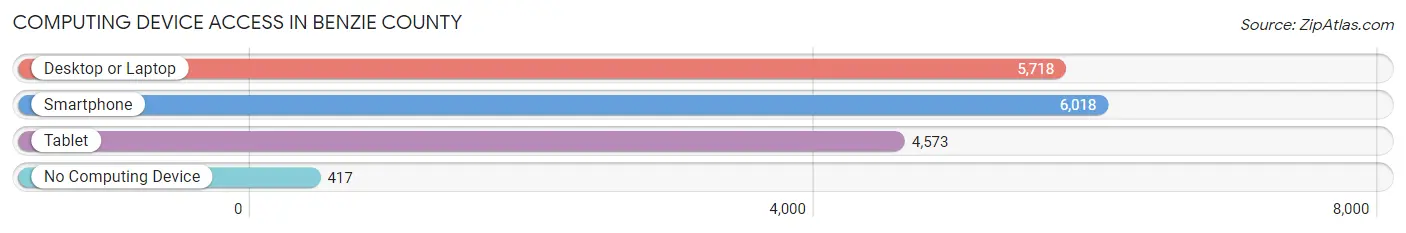
| Device Type | # Households | % Households |
| Desktop or Laptop | 5,718 | 79.7% |
| Smartphone | 6,018 | 83.9% |
| Tablet | 4,573 | 63.7% |
| No Computing Device | 417 | 5.8% |
| Total | 7,173 | 100.0% |
Internet Access in Benzie County
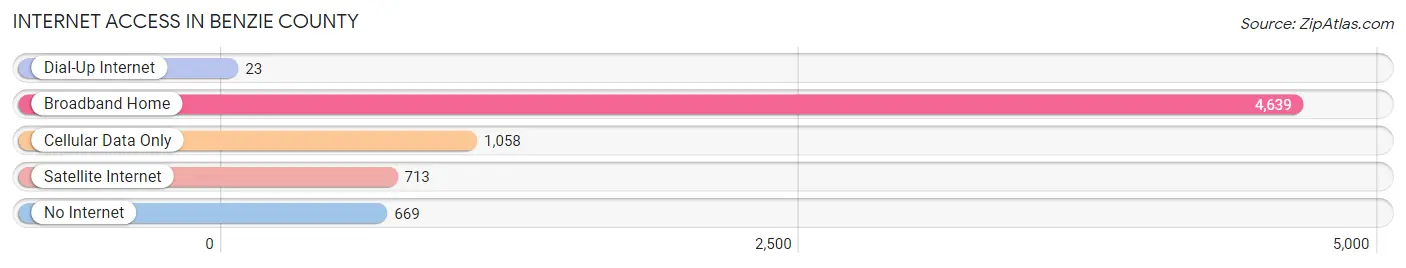
| Internet Type | # Households | % Households |
| Dial-Up Internet | 23 | 0.3% |
| Broadband Home | 4,639 | 64.7% |
| Cellular Data Only | 1,058 | 14.7% |
| Satellite Internet | 713 | 9.9% |
| No Internet | 669 | 9.3% |
| Total | 7,173 | 100.0% |
Benzie County Summary
Benzie County, Michigan is located in the northwest corner of the Lower Peninsula of Michigan. It is bordered by Lake Michigan to the west, Grand Traverse Bay to the north, Manistee County to the east, and Leelanau County to the south. The county seat is Beulah, and the largest city is Frankfort. The county was established in 1863 and is named after the Benzie River, which flows through the county.
History
The area that is now Benzie County was originally inhabited by the Anishinaabe people, including the Ojibwe, Ottawa, and Potawatomi. The first European settlers arrived in the area in the early 1800s, and the county was officially established in 1863. The county was originally part of Leelanau County, but was split off in 1869.
The county was largely agricultural in the 19th century, with the main crops being wheat, oats, and potatoes. The lumber industry was also important, and the county was home to several sawmills. In the early 20th century, the county began to develop a tourism industry, with resorts and hotels being built along the lakeshore.
Geography
Benzie County is located in the northwest corner of the Lower Peninsula of Michigan. It is bordered by Lake Michigan to the west, Grand Traverse Bay to the north, Manistee County to the east, and Leelanau County to the south. The county has a total area of 517 square miles, of which 486 square miles is land and 31 square miles is water.
The county is mostly flat, with rolling hills in the northern and eastern parts. The highest point in the county is the summit of Mount Baldhead, which has an elevation of 1,068 feet. The county is home to several rivers, including the Platte, Betsie, and Benzie Rivers.
Economy
The economy of Benzie County is largely based on tourism and agriculture. The county is home to several resorts and hotels, as well as several wineries and breweries. The county is also home to several farms, which produce a variety of crops, including wheat, oats, and potatoes.
The county is also home to several manufacturing companies, including a furniture manufacturer, a boat manufacturer, and a plastics manufacturer. The county is also home to several retail stores, including several antique stores.
Demographics
As of the 2010 census, the population of Benzie County was 17,525. The population density was 36 people per square mile. The racial makeup of the county was 95.3% White, 0.7% African American, 0.7% Native American, 0.5% Asian, 0.1% Pacific Islander, 0.7% from other races, and 1.8% from two or more races. Hispanic or Latino of any race were 2.3% of the population.
The median income for a household in the county was $41,945, and the median income for a family was $50,945. The per capita income for the county was $22,845. About 11.2% of the population was below the poverty line.
Common Questions
What is the Total Population of Benzie County?
Total Population of Benzie County is 18,058.
What is the Total Male Population of Benzie County?
Total Male Population of Benzie County is 9,065.
What is the Total Female Population of Benzie County?
Total Female Population of Benzie County is 8,993.
What is the Ratio of Males per 100 Females in Benzie County?
There are 100.80 Males per 100 Females in Benzie County.
What is the Ratio of Females per 100 Males in Benzie County?
There are 99.21 Females per 100 Males in Benzie County.
What is the Median Population Age in Benzie County?
Median Population Age in Benzie County is 50.4 Years.
What is the Average Family Size in Benzie County
Average Family Size in Benzie County is 3.0 People.
What is the Average Household Size in Benzie County
Average Household Size in Benzie County is 2.5 People.
What is Per Capita Income in Benzie County?
Per Capita income in Benzie County is $38,875.
What is the Median Family Income in Benzie County?
Median Family Income in Benzie County is $85,054.
What is the Median Household income in Benzie County?
Median Household Income in Benzie County is $71,327.
What is Income or Wage Gap in Benzie County?
Income or Wage Gap in Benzie County is 17.2%.
Women in Benzie County earn 82.8 cents for every dollar earned by a man.
What is Family Income Deficit in Benzie County?
Family Income Deficit in Benzie County is $8,692.
Families that are below poverty line in Benzie County earn $8,692 less on average than the poverty threshold level.
What is Inequality or Gini Index in Benzie County?
Inequality or Gini Index in Benzie County is 0.45.
How Large is the Labor Force in Benzie County?
There are 8,425 People in the Labor Forcein in Benzie County.
What is the Percentage of People in the Labor Force in Benzie County?
55.2% of People are in the Labor Force in Benzie County.
What is the Unemployment Rate in Benzie County?
Unemployment Rate in Benzie County is 4.5%.