Baraga County, MI
Baraga County Map
Baraga County Overview
8,245
TOTAL POPULATION
4,572
MALE POPULATION
3,673
FEMALE POPULATION
124.48
MALES / 100 FEMALES
80.34
FEMALES / 100 MALES
46.5
MEDIAN AGE
2.8
AVG FAMILY SIZE
2.2
AVG HOUSEHOLD SIZE
$28,665
PER CAPITA INCOME
$65,123
AVG FAMILY INCOME
$51,911
AVG HOUSEHOLD INCOME
39.7%
WAGE / INCOME GAP [ % ]
60.3¢/ $1
WAGE / INCOME GAP [ $ ]
0.46
INEQUALITY / GINI INDEX
3,148
LABOR FORCE [ PEOPLE ]
44.8%
PERCENT IN LABOR FORCE
4.9%
UNEMPLOYMENT RATE
Baraga County Area Codes
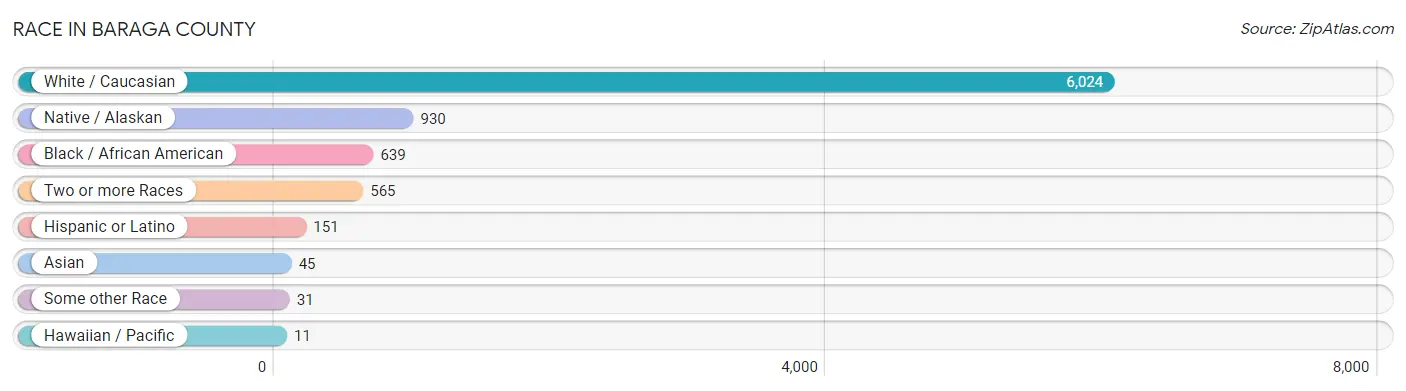
Race in Baraga County
The most populous races in Baraga County are White / Caucasian (6,024 | 73.1%), Native / Alaskan (930 | 11.3%), and Black / African American (639 | 7.7%).
| Race | # Population | % Population |
| Asian | 45 | 0.5% |
| Black / African American | 639 | 7.7% |
| Hawaiian / Pacific | 11 | 0.1% |
| Hispanic or Latino | 151 | 1.8% |
| Native / Alaskan | 930 | 11.3% |
| White / Caucasian | 6,024 | 73.1% |
| Two or more Races | 565 | 6.9% |
| Some other Race | 31 | 0.4% |
| Total | 8,245 | 100.0% |
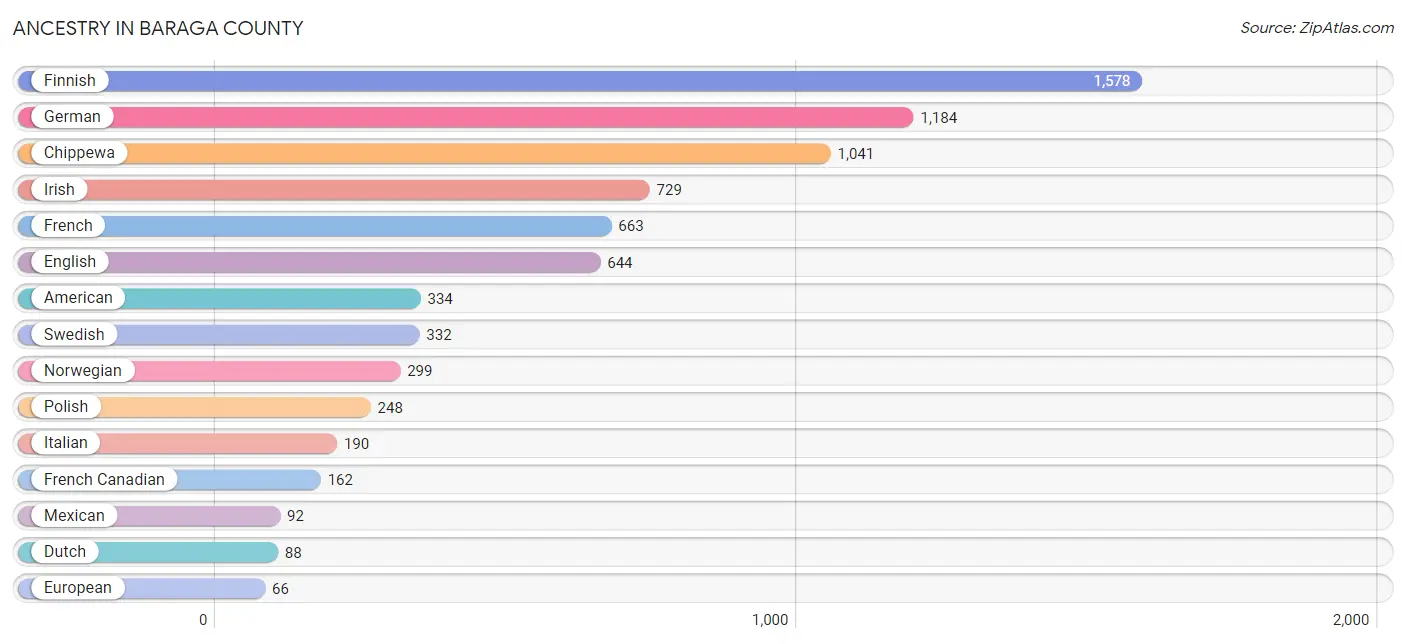
Ancestry in Baraga County
The most populous ancestries reported in Baraga County are Finnish (1,578 | 19.1%), German (1,184 | 14.4%), Chippewa (1,041 | 12.6%), Irish (729 | 8.8%), and French (663 | 8.0%), together accounting for 63.0% of all Baraga County residents.
| Ancestry | # Population | % Population |
| African | 14 | 0.2% |
| American | 334 | 4.1% |
| Austrian | 26 | 0.3% |
| Bangladeshi | 2 | 0.0% |
| Belgian | 2 | 0.0% |
| Bhutanese | 1 | 0.0% |
| Blackfeet | 6 | 0.1% |
| Burmese | 26 | 0.3% |
| Canadian | 28 | 0.3% |
| Central American | 2 | 0.0% |
| Cherokee | 59 | 0.7% |
| Chickasaw | 14 | 0.2% |
| Chippewa | 1,041 | 12.6% |
| Choctaw | 11 | 0.1% |
| Croatian | 33 | 0.4% |
| Cuban | 10 | 0.1% |
| Czech | 23 | 0.3% |
| Czechoslovakian | 9 | 0.1% |
| Danish | 8 | 0.1% |
| Dutch | 88 | 1.1% |
| Eastern European | 15 | 0.2% |
| English | 644 | 7.8% |
| European | 66 | 0.8% |
| Finnish | 1,578 | 19.1% |
| French | 663 | 8.0% |
| French Canadian | 162 | 2.0% |
| German | 1,184 | 14.4% |
| Greek | 4 | 0.1% |
| Hungarian | 22 | 0.3% |
| Indian (Asian) | 21 | 0.3% |
| Iranian | 2 | 0.0% |
| Irish | 729 | 8.8% |
| Iroquois | 13 | 0.2% |
| Italian | 190 | 2.3% |
| Korean | 3 | 0.0% |
| Lithuanian | 4 | 0.1% |
| Lumbee | 3 | 0.0% |
| Mexican | 92 | 1.1% |
| Native Hawaiian | 11 | 0.1% |
| Navajo | 13 | 0.2% |
| Northern European | 31 | 0.4% |
| Norwegian | 299 | 3.6% |
| Ottawa | 44 | 0.5% |
| Polish | 248 | 3.0% |
| Potawatomi | 4 | 0.1% |
| Puerto Rican | 27 | 0.3% |
| Romanian | 3 | 0.0% |
| Salvadoran | 2 | 0.0% |
| Samoan | 14 | 0.2% |
| Scandinavian | 36 | 0.4% |
| Scotch-Irish | 24 | 0.3% |
| Scottish | 55 | 0.7% |
| Sioux | 6 | 0.1% |
| Slovak | 2 | 0.0% |
| Slovene | 6 | 0.1% |
| Subsaharan African | 14 | 0.2% |
| Swedish | 332 | 4.0% |
| Swiss | 3 | 0.0% |
| Ukrainian | 18 | 0.2% |
| Welsh | 13 | 0.2% |
| Yugoslavian | 2 | 0.0% |
| Yuman | 4 | 0.1% | View All 62 Rows |
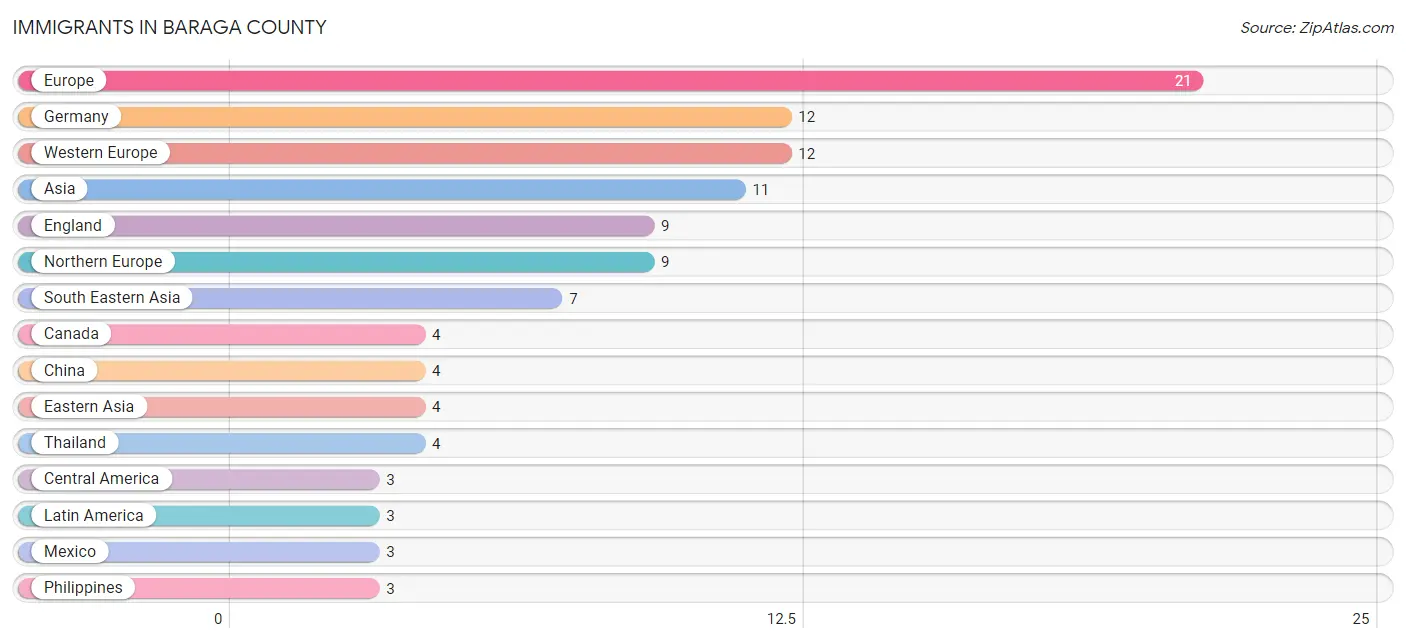
Immigrants in Baraga County
The most numerous immigrant groups reported in Baraga County came from Europe (21 | 0.3%), Germany (12 | 0.2%), Western Europe (12 | 0.2%), Asia (11 | 0.1%), and England (9 | 0.1%), together accounting for 0.8% of all Baraga County residents.
| Immigration Origin | # Population | % Population |
| Asia | 11 | 0.1% |
| Canada | 4 | 0.1% |
| Central America | 3 | 0.0% |
| China | 4 | 0.1% |
| Eastern Asia | 4 | 0.1% |
| England | 9 | 0.1% |
| Europe | 21 | 0.3% |
| Germany | 12 | 0.2% |
| Latin America | 3 | 0.0% |
| Mexico | 3 | 0.0% |
| Northern Europe | 9 | 0.1% |
| Philippines | 3 | 0.0% |
| South Eastern Asia | 7 | 0.1% |
| Thailand | 4 | 0.1% |
| Western Europe | 12 | 0.2% | View All 15 Rows |
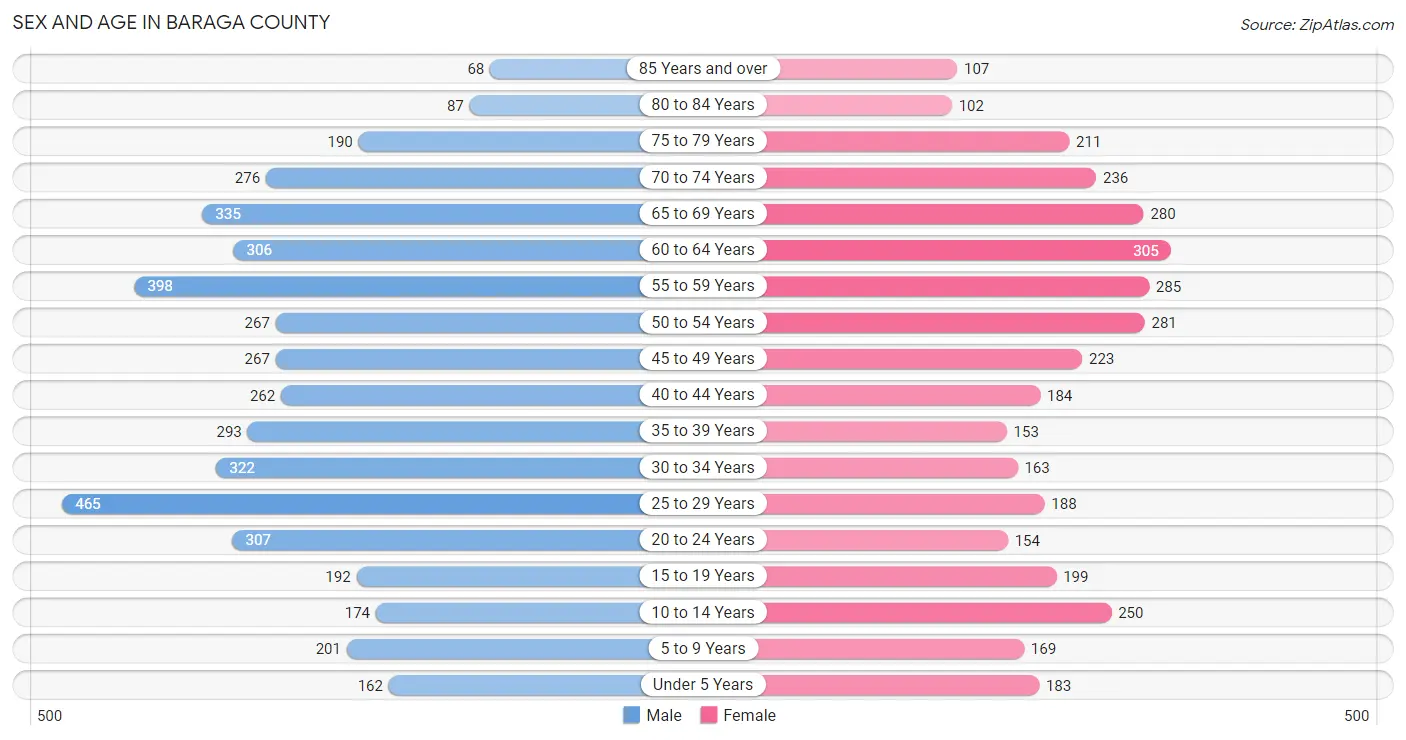
Sex and Age in Baraga County
Sex and Age in Baraga County
The most populous age groups in Baraga County are 25 to 29 Years (465 | 10.2%) for men and 60 to 64 Years (305 | 8.3%) for women.
| Age Bracket | Male | Female |
| Under 5 Years | 162 (3.5%) | 183 (5.0%) |
| 5 to 9 Years | 201 (4.4%) | 169 (4.6%) |
| 10 to 14 Years | 174 (3.8%) | 250 (6.8%) |
| 15 to 19 Years | 192 (4.2%) | 199 (5.4%) |
| 20 to 24 Years | 307 (6.7%) | 154 (4.2%) |
| 25 to 29 Years | 465 (10.2%) | 188 (5.1%) |
| 30 to 34 Years | 322 (7.0%) | 163 (4.4%) |
| 35 to 39 Years | 293 (6.4%) | 153 (4.2%) |
| 40 to 44 Years | 262 (5.7%) | 184 (5.0%) |
| 45 to 49 Years | 267 (5.8%) | 223 (6.1%) |
| 50 to 54 Years | 267 (5.8%) | 281 (7.6%) |
| 55 to 59 Years | 398 (8.7%) | 285 (7.8%) |
| 60 to 64 Years | 306 (6.7%) | 305 (8.3%) |
| 65 to 69 Years | 335 (7.3%) | 280 (7.6%) |
| 70 to 74 Years | 276 (6.0%) | 236 (6.4%) |
| 75 to 79 Years | 190 (4.2%) | 211 (5.7%) |
| 80 to 84 Years | 87 (1.9%) | 102 (2.8%) |
| 85 Years and over | 68 (1.5%) | 107 (2.9%) |
| Total | 4,572 (100.0%) | 3,673 (100.0%) |
Families and Households in Baraga County
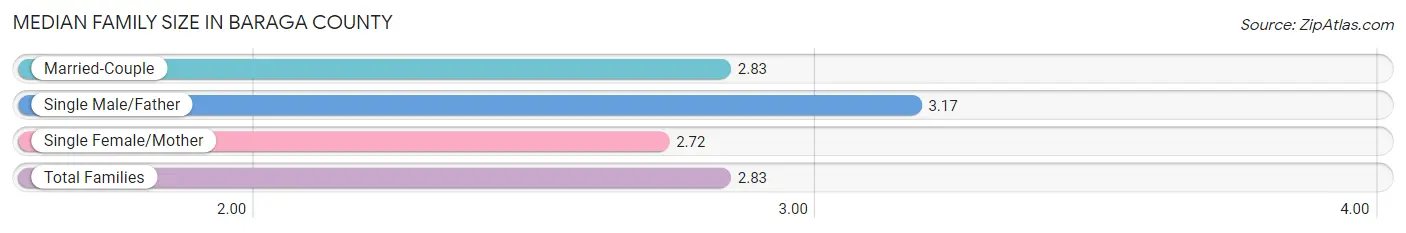
Median Family Size in Baraga County
The median family size in Baraga County is 2.83 persons per family, with single male/father families (96 | 4.8%) accounting for the largest median family size of 3.17 persons per family. On the other hand, single female/mother families (283 | 14.3%) represent the smallest median family size with 2.72 persons per family.
| Family Type | # Families | Family Size |
| Married-Couple | 1,606 (80.9%) | 2.83 |
| Single Male/Father | 96 (4.8%) | 3.17 |
| Single Female/Mother | 283 (14.3%) | 2.72 |
| Total Families | 1,985 (100.0%) | 2.83 |
Median Household Size in Baraga County
The median household size in Baraga County is 2.22 persons per household, with single male/father households (96 | 3.0%) accounting for the largest median household size of 3.7 persons per household. non-family households (1,256 | 38.8%) represent the smallest median household size with 1.13 persons per household.

| Household Type | # Households | Household Size |
| Married-Couple | 1,606 (49.5%) | 2.85 |
| Single Male/Father | 96 (3.0%) | 3.70 |
| Single Female/Mother | 283 (8.7%) | 2.99 |
| Non-family | 1,256 (38.8%) | 1.13 |
| Total Households | 3,241 (100.0%) | 2.22 |
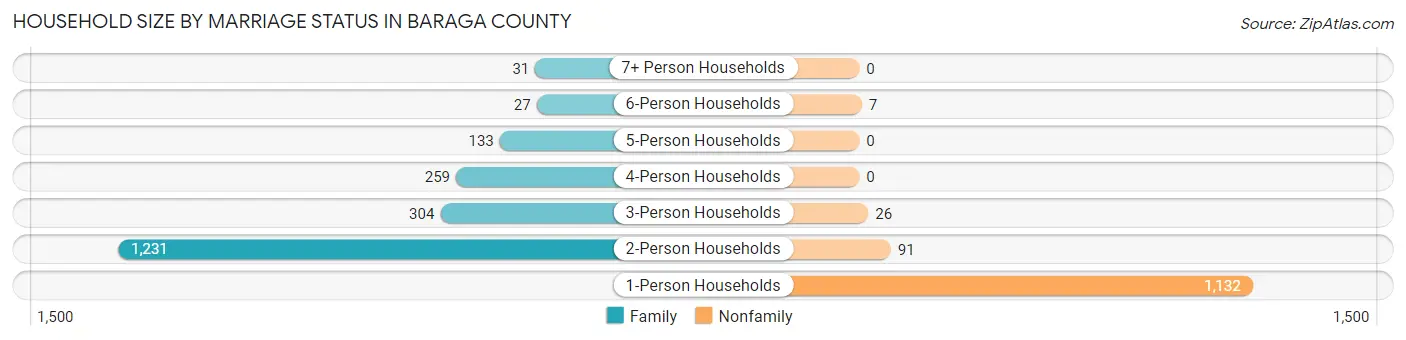
Household Size by Marriage Status in Baraga County
Out of a total of 3,241 households in Baraga County, 1,985 (61.3%) are family households, while 1,256 (38.8%) are nonfamily households. The most numerous type of family households are 2-person households, comprising 1,231, and the most common type of nonfamily households are 1-person households, comprising 1,132.
| Household Size | Family Households | Nonfamily Households |
| 1-Person Households | - | 1,132 (34.9%) |
| 2-Person Households | 1,231 (38.0%) | 91 (2.8%) |
| 3-Person Households | 304 (9.4%) | 26 (0.8%) |
| 4-Person Households | 259 (8.0%) | 0 (0.0%) |
| 5-Person Households | 133 (4.1%) | 0 (0.0%) |
| 6-Person Households | 27 (0.8%) | 7 (0.2%) |
| 7+ Person Households | 31 (1.0%) | 0 (0.0%) |
| Total | 1,985 (61.3%) | 1,256 (38.8%) |
Female Fertility in Baraga County
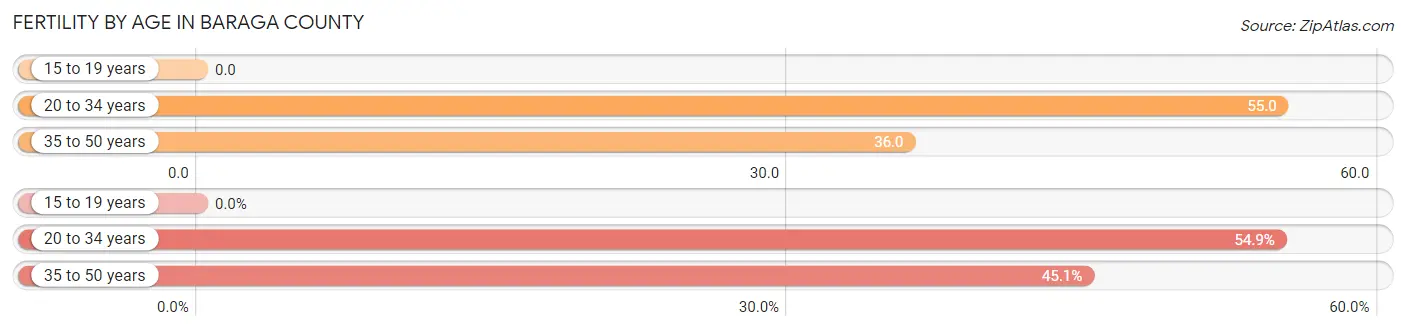
Fertility by Age in Baraga County
Average fertility rate in Baraga County is 38.0 births per 1,000 women. Women in the age bracket of 20 to 34 years have the highest fertility rate with 55.0 births per 1,000 women. Women in the age bracket of 20 to 34 years acount for 54.9% of all women with births.
| Age Bracket | Women with Births | Births / 1,000 Women |
| 15 to 19 years | 0 (0.0%) | 0.0 |
| 20 to 34 years | 28 (54.9%) | 55.0 |
| 35 to 50 years | 23 (45.1%) | 36.0 |
| Total | 51 (100.0%) | 38.0 |
Fertility by Age by Marriage Status in Baraga County
45.1% of women with births (51) in Baraga County are married. The highest percentage of unmarried women with births falls into 35 to 50 years age bracket with 78.3% of them unmarried at the time of birth, while the lowest percentage of unmarried women with births belong to 20 to 34 years age bracket with 35.7% of them unmarried.

| Age Bracket | Married | Unmarried |
| 15 to 19 years | 0 (0.0%) | 0 (0.0%) |
| 20 to 34 years | 18 (64.3%) | 10 (35.7%) |
| 35 to 50 years | 5 (21.7%) | 18 (78.3%) |
| Total | 23 (45.1%) | 28 (54.9%) |
Fertility by Education in Baraga County
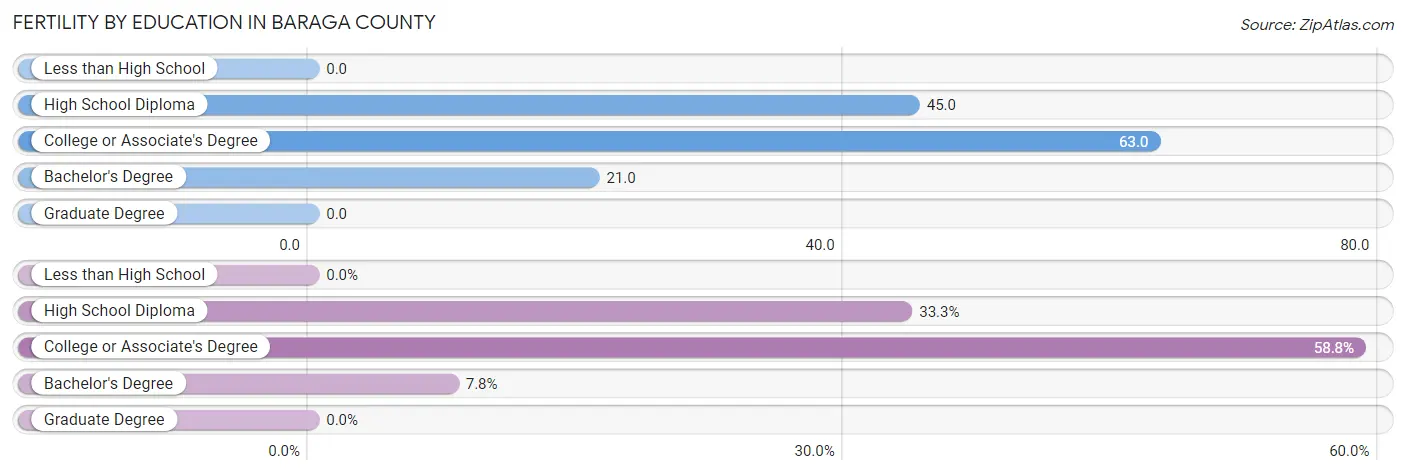
| Educational Attainment | Women with Births | Births / 1,000 Women |
| Less than High School | 0 (0.0%) | 0.0 |
| High School Diploma | 17 (33.3%) | 45.0 |
| College or Associate's Degree | 30 (58.8%) | 63.0 |
| Bachelor's Degree | 4 (7.8%) | 21.0 |
| Graduate Degree | 0 (0.0%) | 0.0 |
| Total | 51 (100.0%) | 38.0 |
Fertility by Education by Marriage Status in Baraga County
54.9% of women with births in Baraga County are unmarried. Women with the educational attainment of bachelor's degree are most likely to be married with 100.0% of them married at childbirth, while women with the educational attainment of college or associate's degree are least likely to be married with 80.0% of them unmarried at childbirth.

| Educational Attainment | Married | Unmarried |
| Less than High School | 0 (0.0%) | 0 (0.0%) |
| High School Diploma | 13 (76.5%) | 4 (23.5%) |
| College or Associate's Degree | 6 (20.0%) | 24 (80.0%) |
| Bachelor's Degree | 4 (100.0%) | 0 (0.0%) |
| Graduate Degree | 0 (0.0%) | 0 (0.0%) |
| Total | 23 (45.1%) | 28 (54.9%) |
Income in Baraga County
Income Overview in Baraga County
Per Capita Income in Baraga County is $28,665, while median incomes of families and households are $65,123 and $51,911 respectively.
| Characteristic | Number | Measure |
| Per Capita Income | 8,245 | $28,665 |
| Median Family Income | 1,985 | $65,123 |
| Mean Family Income | 1,985 | $84,227 |
| Median Household Income | 3,241 | $51,911 |
| Mean Household Income | 3,241 | $70,068 |
| Income Deficit | 1,985 | $0 |
| Wage / Income Gap (%) | 8,245 | 39.72% |
| Wage / Income Gap ($) | 8,245 | 60.28¢ per $1 |
| Gini / Inequality Index | 8,245 | 0.46 |
Earnings by Sex in Baraga County
Average Earnings in Baraga County are $37,879, $48,265 for men and $29,092 for women, a difference of 39.7%.
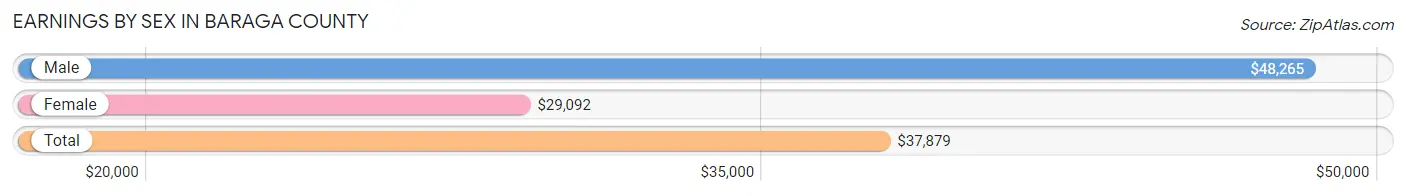
| Sex | Number | Average Earnings |
| Male | 1,722 (51.7%) | $48,265 |
| Female | 1,609 (48.3%) | $29,092 |
| Total | 3,331 (100.0%) | $37,879 |
Earnings by Sex by Income Bracket in Baraga County
The most common earnings brackets in Baraga County are $55,000 to $64,999 for men (281 | 16.3%) and $25,000 to $29,999 for women (184 | 11.4%).
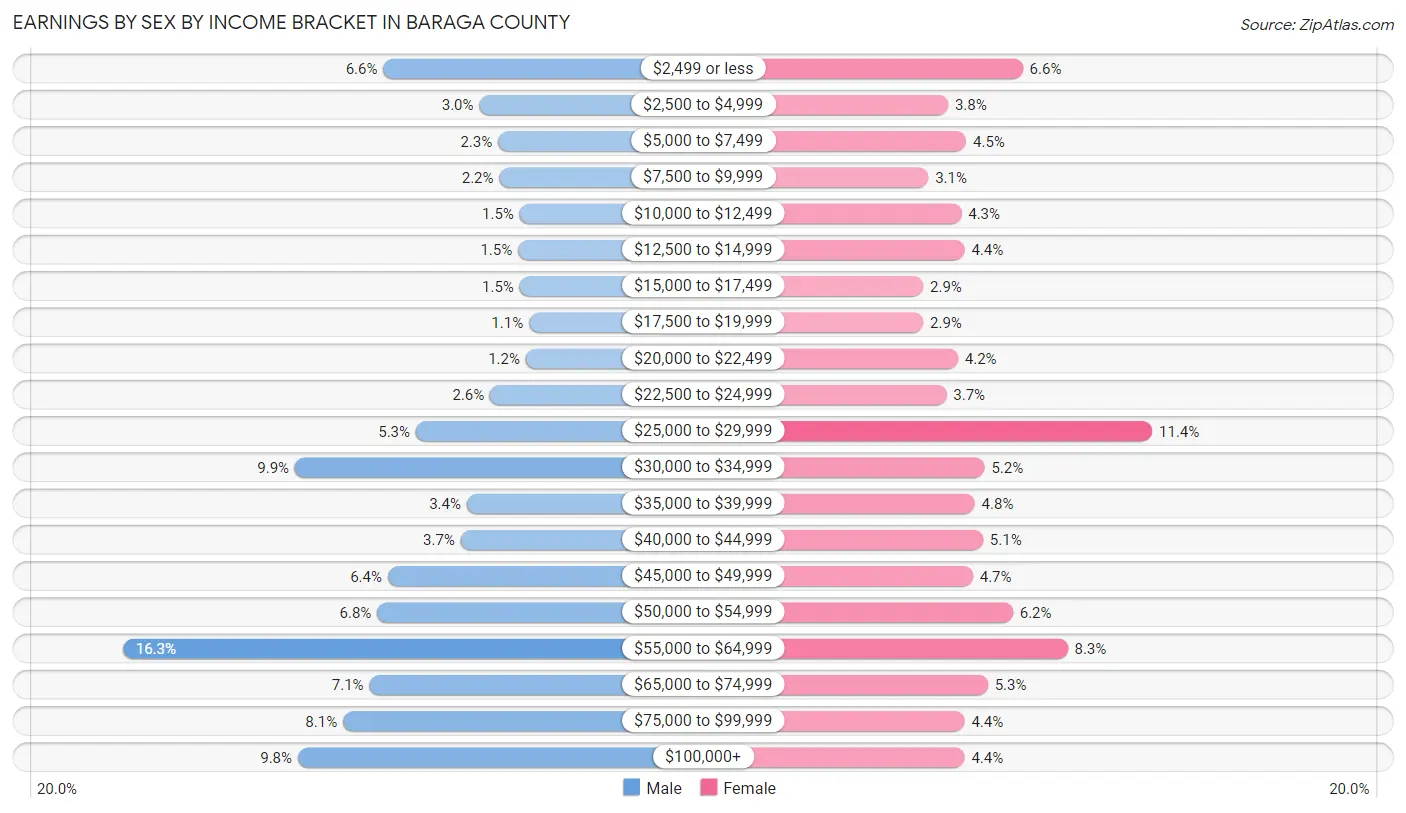
| Income | Male | Female |
| $2,499 or less | 113 (6.6%) | 106 (6.6%) |
| $2,500 to $4,999 | 51 (3.0%) | 61 (3.8%) |
| $5,000 to $7,499 | 39 (2.3%) | 72 (4.5%) |
| $7,500 to $9,999 | 38 (2.2%) | 49 (3.0%) |
| $10,000 to $12,499 | 25 (1.5%) | 69 (4.3%) |
| $12,500 to $14,999 | 26 (1.5%) | 71 (4.4%) |
| $15,000 to $17,499 | 25 (1.5%) | 46 (2.9%) |
| $17,500 to $19,999 | 19 (1.1%) | 46 (2.9%) |
| $20,000 to $22,499 | 21 (1.2%) | 67 (4.2%) |
| $22,500 to $24,999 | 44 (2.6%) | 60 (3.7%) |
| $25,000 to $29,999 | 92 (5.3%) | 184 (11.4%) |
| $30,000 to $34,999 | 170 (9.9%) | 83 (5.2%) |
| $35,000 to $39,999 | 59 (3.4%) | 77 (4.8%) |
| $40,000 to $44,999 | 63 (3.7%) | 82 (5.1%) |
| $45,000 to $49,999 | 110 (6.4%) | 76 (4.7%) |
| $50,000 to $54,999 | 117 (6.8%) | 100 (6.2%) |
| $55,000 to $64,999 | 281 (16.3%) | 133 (8.3%) |
| $65,000 to $74,999 | 122 (7.1%) | 85 (5.3%) |
| $75,000 to $99,999 | 139 (8.1%) | 71 (4.4%) |
| $100,000+ | 168 (9.8%) | 71 (4.4%) |
| Total | 1,722 (100.0%) | 1,609 (100.0%) |
Earnings by Sex by Educational Attainment in Baraga County
Average earnings in Baraga County are $53,594 for men and $32,868 for women, a difference of 38.7%. Men with an educational attainment of bachelor's degree enjoy the highest average annual earnings of $71,806, while those with high school diploma education earn the least with $37,208. Women with an educational attainment of bachelor's degree earn the most with the average annual earnings of $54,784, while those with less than high school education have the smallest earnings of $24,375.
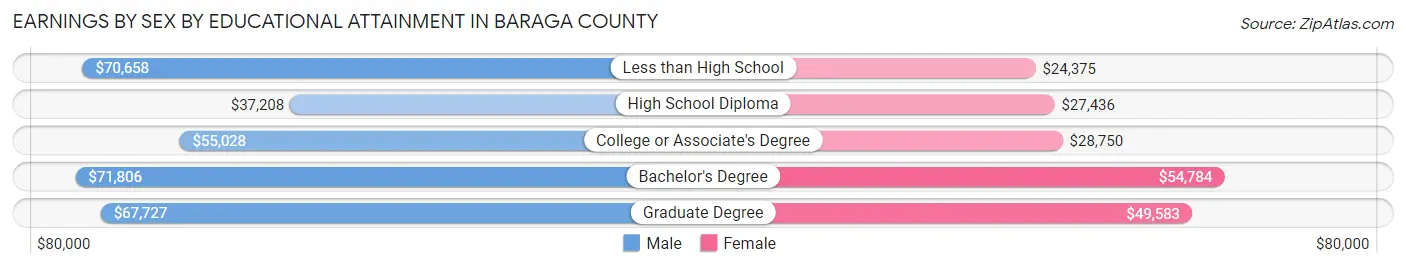
| Educational Attainment | Male Income | Female Income |
| Less than High School | $70,658 | $24,375 |
| High School Diploma | $37,208 | $27,436 |
| College or Associate's Degree | $55,028 | $28,750 |
| Bachelor's Degree | $71,806 | $54,784 |
| Graduate Degree | $67,727 | $49,583 |
| Total | $53,594 | $32,868 |
Family Income in Baraga County
Family Income Brackets in Baraga County
According to the Baraga County family income data, there are 381 families falling into the $50,000 to $74,999 income range, which is the most common income bracket and makes up 19.2% of all families. Conversely, the $10,000 to $14,999 income bracket is the least frequent group with only 38 families (1.9%) belonging to this category.
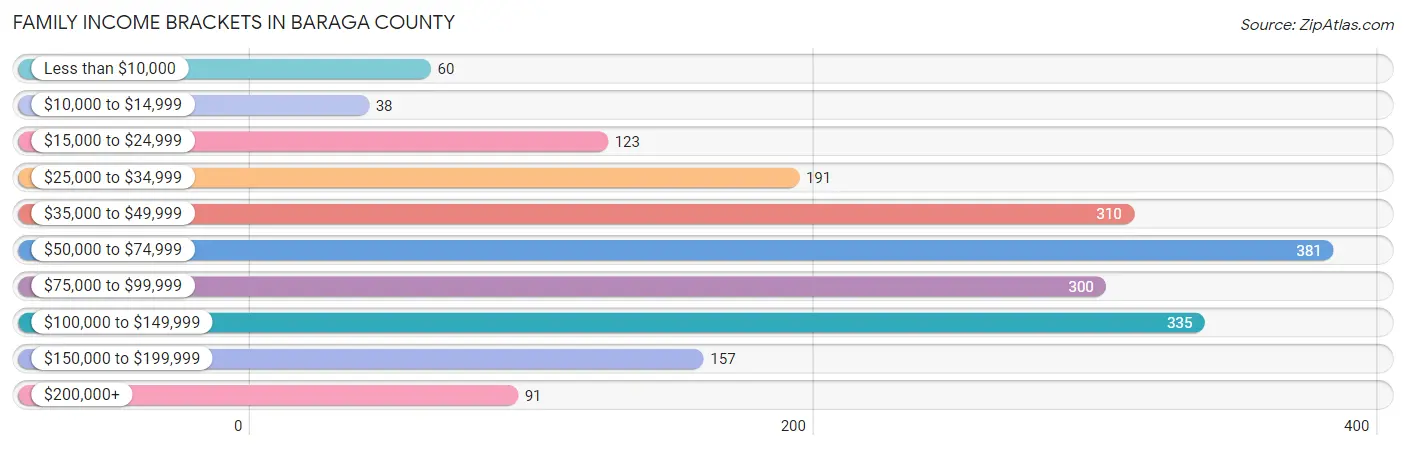
| Income Bracket | # Families | % Families |
| Less than $10,000 | 60 | 3.0% |
| $10,000 to $14,999 | 38 | 1.9% |
| $15,000 to $24,999 | 123 | 6.2% |
| $25,000 to $34,999 | 191 | 9.6% |
| $35,000 to $49,999 | 310 | 15.6% |
| $50,000 to $74,999 | 381 | 19.2% |
| $75,000 to $99,999 | 300 | 15.1% |
| $100,000 to $149,999 | 335 | 16.9% |
| $150,000 to $199,999 | 157 | 7.9% |
| $200,000+ | 91 | 4.6% |
Family Income by Famaliy Size in Baraga County
6-person families (23 | 1.2%) account for the highest median family income in Baraga County with $171,750 per family, while 2-person families (1,314 | 66.2%) have the highest median income of $30,666 per family member.
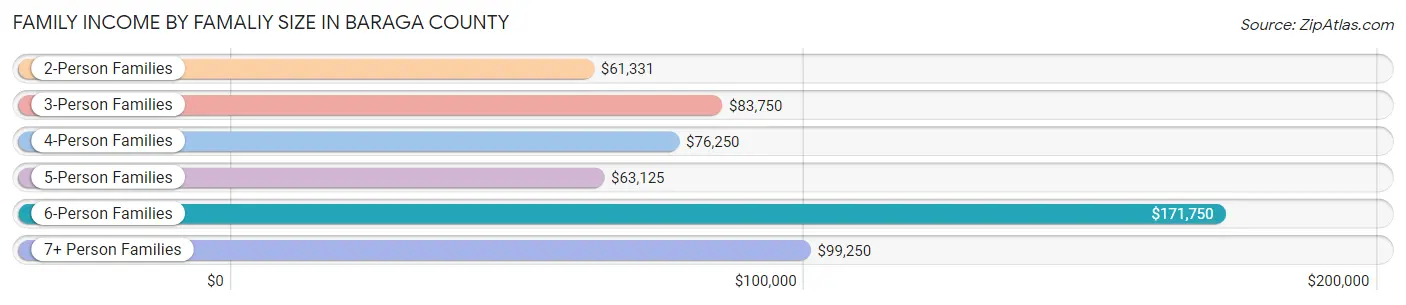
| Income Bracket | # Families | Median Income |
| 2-Person Families | 1,314 (66.2%) | $61,331 |
| 3-Person Families | 261 (13.2%) | $83,750 |
| 4-Person Families | 247 (12.4%) | $76,250 |
| 5-Person Families | 109 (5.5%) | $63,125 |
| 6-Person Families | 23 (1.2%) | $171,750 |
| 7+ Person Families | 31 (1.6%) | $99,250 |
| Total | 1,985 (100.0%) | $65,123 |
Family Income by Number of Earners in Baraga County
The median family income in Baraga County is $65,123, with families comprising 3+ earners (112) having the highest median family income of $130,625, while families with no earners (543) have the lowest median family income of $47,039, accounting for 5.6% and 27.4% of families, respectively.

| Number of Earners | # Families | Median Income |
| No Earners | 543 (27.4%) | $47,039 |
| 1 Earner | 654 (33.0%) | $51,477 |
| 2 Earners | 676 (34.1%) | $107,969 |
| 3+ Earners | 112 (5.6%) | $130,625 |
| Total | 1,985 (100.0%) | $65,123 |
Household Income in Baraga County
Household Income Brackets in Baraga County
With 609 households falling in the category, the $50,000 to $74,999 income range is the most frequent in Baraga County, accounting for 18.8% of all households. In contrast, only 113 households (3.5%) fall into the $200,000+ income bracket, making it the least populous group.
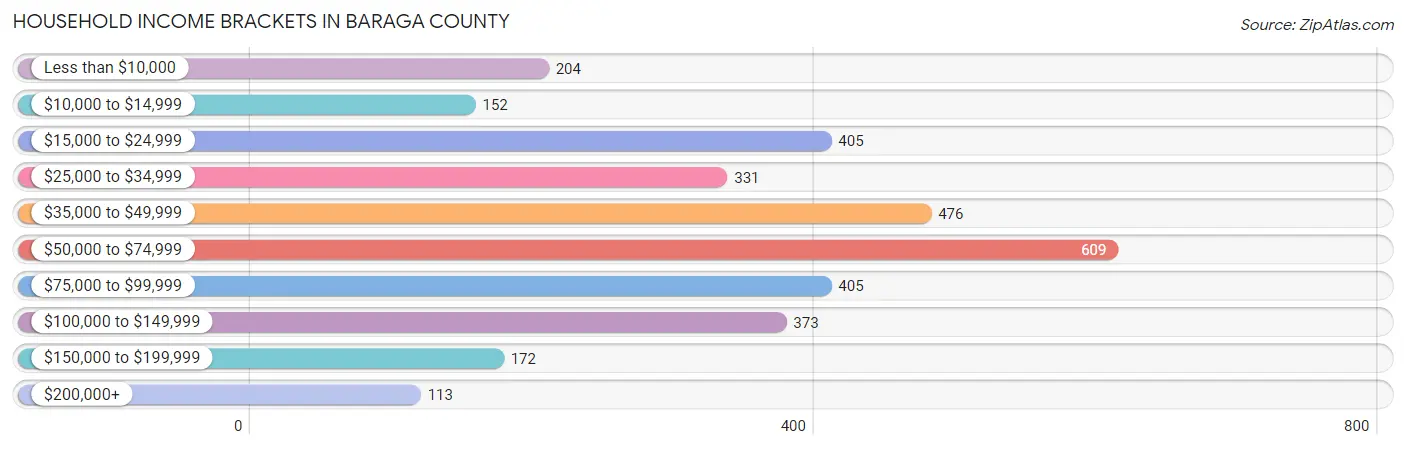
| Income Bracket | # Households | % Households |
| Less than $10,000 | 204 | 6.3% |
| $10,000 to $14,999 | 152 | 4.7% |
| $15,000 to $24,999 | 405 | 12.5% |
| $25,000 to $34,999 | 331 | 10.2% |
| $35,000 to $49,999 | 476 | 14.7% |
| $50,000 to $74,999 | 609 | 18.8% |
| $75,000 to $99,999 | 405 | 12.5% |
| $100,000 to $149,999 | 373 | 11.5% |
| $150,000 to $199,999 | 172 | 5.3% |
| $200,000+ | 113 | 3.5% |
Household Income by Householder Age in Baraga County
The median household income in Baraga County is $51,911, with the highest median household income of $63,621 found in the 45 to 64 years age bracket for the primary householder. A total of 1,258 households (38.8%) fall into this category. Meanwhile, the 65+ years age bracket for the primary householder has the lowest median household income of $38,913, with 1,208 households (37.3%) in this group.
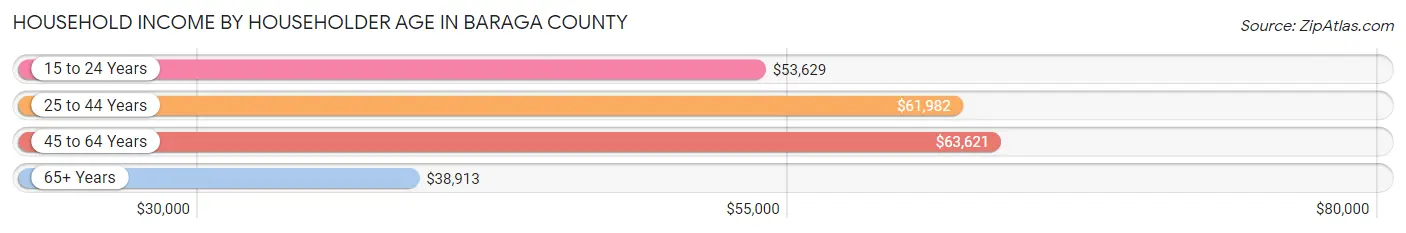
| Income Bracket | # Households | Median Income |
| 15 to 24 Years | 64 (2.0%) | $53,629 |
| 25 to 44 Years | 711 (21.9%) | $61,982 |
| 45 to 64 Years | 1,258 (38.8%) | $63,621 |
| 65+ Years | 1,208 (37.3%) | $38,913 |
| Total | 3,241 (100.0%) | $51,911 |
Poverty in Baraga County
Income Below Poverty by Sex and Age in Baraga County
With 11.2% poverty level for males and 13.1% for females among the residents of Baraga County, 16 and 17 year old males and 6 to 11 year old females are the most vulnerable to poverty, with 36 males (34.0%) and 63 females (25.9%) in their respective age groups living below the poverty level.

| Age Bracket | Male | Female |
| Under 5 Years | 54 (33.3%) | 24 (13.1%) |
| 5 Years | 0 (0.0%) | 3 (7.5%) |
| 6 to 11 Years | 6 (2.7%) | 63 (25.9%) |
| 12 to 14 Years | 6 (5.6%) | 11 (8.1%) |
| 15 Years | 0 (0.0%) | 4 (8.9%) |
| 16 and 17 Years | 36 (34.0%) | 0 (0.0%) |
| 18 to 24 Years | 16 (7.0%) | 22 (9.7%) |
| 25 to 34 Years | 29 (6.9%) | 65 (18.5%) |
| 35 to 44 Years | 52 (16.5%) | 66 (19.6%) |
| 45 to 54 Years | 32 (7.3%) | 43 (8.6%) |
| 55 to 64 Years | 107 (17.6%) | 76 (12.9%) |
| 65 to 74 Years | 46 (7.8%) | 46 (8.9%) |
| 75 Years and over | 18 (5.6%) | 52 (13.9%) |
| Total | 402 (11.2%) | 475 (13.1%) |
Income Above Poverty by Sex and Age in Baraga County
According to the poverty statistics in Baraga County, males aged 5 years and females aged 16 and 17 years are the age groups that are most secure financially, with 100.0% of males and 100.0% of females in these age groups living above the poverty line.

| Age Bracket | Male | Female |
| Under 5 Years | 108 (66.7%) | 159 (86.9%) |
| 5 Years | 33 (100.0%) | 37 (92.5%) |
| 6 to 11 Years | 214 (97.3%) | 180 (74.1%) |
| 12 to 14 Years | 101 (94.4%) | 125 (91.9%) |
| 15 Years | 34 (100.0%) | 41 (91.1%) |
| 16 and 17 Years | 70 (66.0%) | 81 (100.0%) |
| 18 to 24 Years | 212 (93.0%) | 205 (90.3%) |
| 25 to 34 Years | 390 (93.1%) | 286 (81.5%) |
| 35 to 44 Years | 263 (83.5%) | 271 (80.4%) |
| 45 to 54 Years | 408 (92.7%) | 455 (91.4%) |
| 55 to 64 Years | 501 (82.4%) | 514 (87.1%) |
| 65 to 74 Years | 541 (92.2%) | 470 (91.1%) |
| 75 Years and over | 306 (94.4%) | 322 (86.1%) |
| Total | 3,181 (88.8%) | 3,146 (86.9%) |
Income Below Poverty Among Married-Couple Families in Baraga County
The poverty statistics for married-couple families in Baraga County show that 5.9% or 95 of the total 1,606 families live below the poverty line. Families with 3 or 4 children have the highest poverty rate of 26.5%, comprising of 22 families. On the other hand, families with 5 or more children have the lowest poverty rate of 0.0%, which includes 0 families.
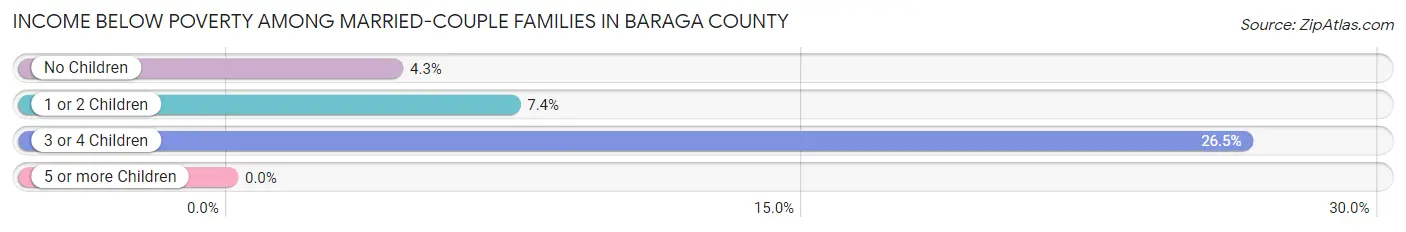
| Children | Above Poverty | Below Poverty |
| No Children | 1,155 (95.7%) | 52 (4.3%) |
| 1 or 2 Children | 264 (92.6%) | 21 (7.4%) |
| 3 or 4 Children | 61 (73.5%) | 22 (26.5%) |
| 5 or more Children | 31 (100.0%) | 0 (0.0%) |
| Total | 1,511 (94.1%) | 95 (5.9%) |
Income Below Poverty Among Single-Parent Households in Baraga County
According to the poverty data in Baraga County, 4.2% or 4 single-father households and 23.0% or 65 single-mother households are living below the poverty line. Among single-father households, those with 1 or 2 children have the highest poverty rate, with 4 households (15.4%) experiencing poverty. Likewise, among single-mother households, those with 3 or 4 children have the highest poverty rate, with 9 households (39.1%) falling below the poverty line.

| Children | Single Father | Single Mother |
| No Children | 0 (0.0%) | 6 (4.9%) |
| 1 or 2 Children | 4 (15.4%) | 50 (36.5%) |
| 3 or 4 Children | 0 (0.0%) | 9 (39.1%) |
| 5 or more Children | 0 (0.0%) | 0 (0.0%) |
| Total | 4 (4.2%) | 65 (23.0%) |
Income Below Poverty Among Married-Couple vs Single-Parent Households in Baraga County
The poverty data for Baraga County shows that 95 of the married-couple family households (5.9%) and 69 of the single-parent households (18.2%) are living below the poverty level. Within the married-couple family households, those with 3 or 4 children have the highest poverty rate, with 22 households (26.5%) falling below the poverty line. Among the single-parent households, those with 1 or 2 children have the highest poverty rate, with 54 household (33.1%) living below poverty.

| Children | Married-Couple Families | Single-Parent Households |
| No Children | 52 (4.3%) | 6 (3.4%) |
| 1 or 2 Children | 21 (7.4%) | 54 (33.1%) |
| 3 or 4 Children | 22 (26.5%) | 9 (22.0%) |
| 5 or more Children | 0 (0.0%) | 0 (0.0%) |
| Total | 95 (5.9%) | 69 (18.2%) |
Employment Characteristics in Baraga County
Employment by Class of Employer in Baraga County
Among the 2,935 employed individuals in Baraga County, private company employees (1,803 | 61.4%), local government employees (366 | 12.5%), and not-for-profit organizations (240 | 8.2%) make up the most common classes of employment.
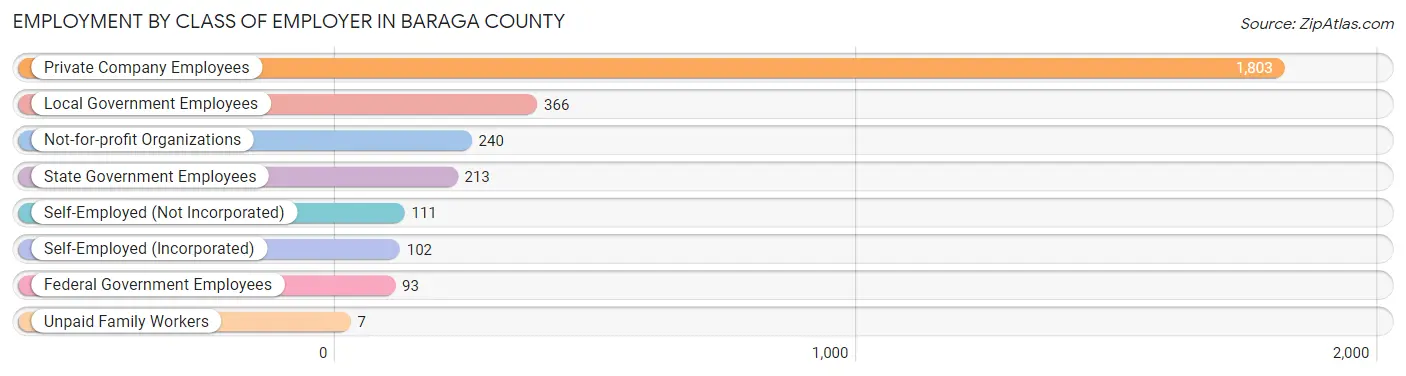
| Employer Class | # Employees | % Employees |
| Private Company Employees | 1,803 | 61.4% |
| Self-Employed (Incorporated) | 102 | 3.5% |
| Self-Employed (Not Incorporated) | 111 | 3.8% |
| Not-for-profit Organizations | 240 | 8.2% |
| Local Government Employees | 366 | 12.5% |
| State Government Employees | 213 | 7.3% |
| Federal Government Employees | 93 | 3.2% |
| Unpaid Family Workers | 7 | 0.2% |
| Total | 2,935 | 100.0% |
Employment Status by Age in Baraga County
According to the labor force statistics for Baraga County, out of the total population over 16 years of age (7,027), 44.8% or 3,148 individuals are in the labor force, with 4.9% or 154 of them unemployed. The age group with the highest labor force participation rate is 45 to 54 years, with 70.8% or 735 individuals in the labor force. Within the labor force, the 16 to 19 years age range has the highest percentage of unemployed individuals, with 16.5% or 20 of them being unemployed.
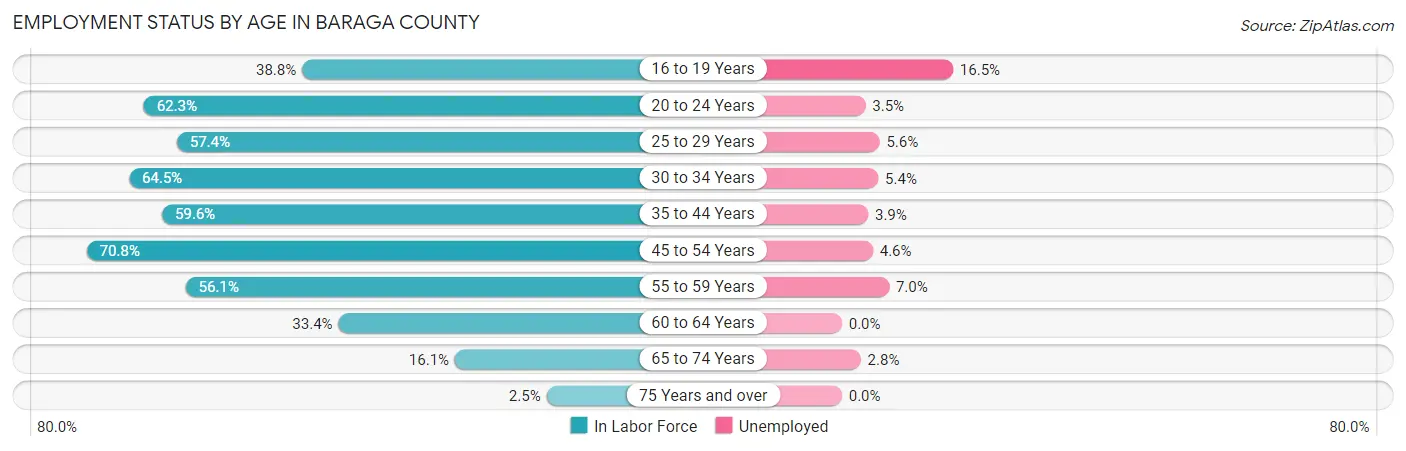
| Age Bracket | In Labor Force | Unemployed |
| 16 to 19 Years | 121 (38.8%) | 20 (16.5%) |
| 20 to 24 Years | 287 (62.3%) | 10 (3.5%) |
| 25 to 29 Years | 375 (57.4%) | 21 (5.6%) |
| 30 to 34 Years | 313 (64.5%) | 17 (5.4%) |
| 35 to 44 Years | 532 (59.6%) | 21 (3.9%) |
| 45 to 54 Years | 735 (70.8%) | 34 (4.6%) |
| 55 to 59 Years | 383 (56.1%) | 27 (7.0%) |
| 60 to 64 Years | 204 (33.4%) | 0 (0.0%) |
| 65 to 74 Years | 181 (16.1%) | 5 (2.8%) |
| 75 Years and over | 19 (2.5%) | 0 (0.0%) |
| Total | 3,148 (44.8%) | 154 (4.9%) |
Employment Status by Educational Attainment in Baraga County
According to labor force statistics for Baraga County, 58.3% of individuals (2,543) out of the total population between 25 and 64 years of age (4,362) are in the labor force, with 4.7% or 120 of them being unemployed. The group with the highest labor force participation rate are those with the educational attainment of bachelor's degree or higher, with 77.7% or 518 individuals in the labor force. Within the labor force, individuals with less than high school education have the highest percentage of unemployment, with 23.4% or 26 of them being unemployed.

| Educational Attainment | In Labor Force | Unemployed |
| Less than High School | 111 (26.2%) | 99 (23.4%) |
| High School Diploma | 753 (46.0%) | 108 (6.6%) |
| College / Associate Degree | 1,159 (71.0%) | 36 (2.2%) |
| Bachelor's Degree or higher | 518 (77.7%) | 23 (3.5%) |
| Total | 2,543 (58.3%) | 205 (4.7%) |
Employment Occupations by Sex in Baraga County
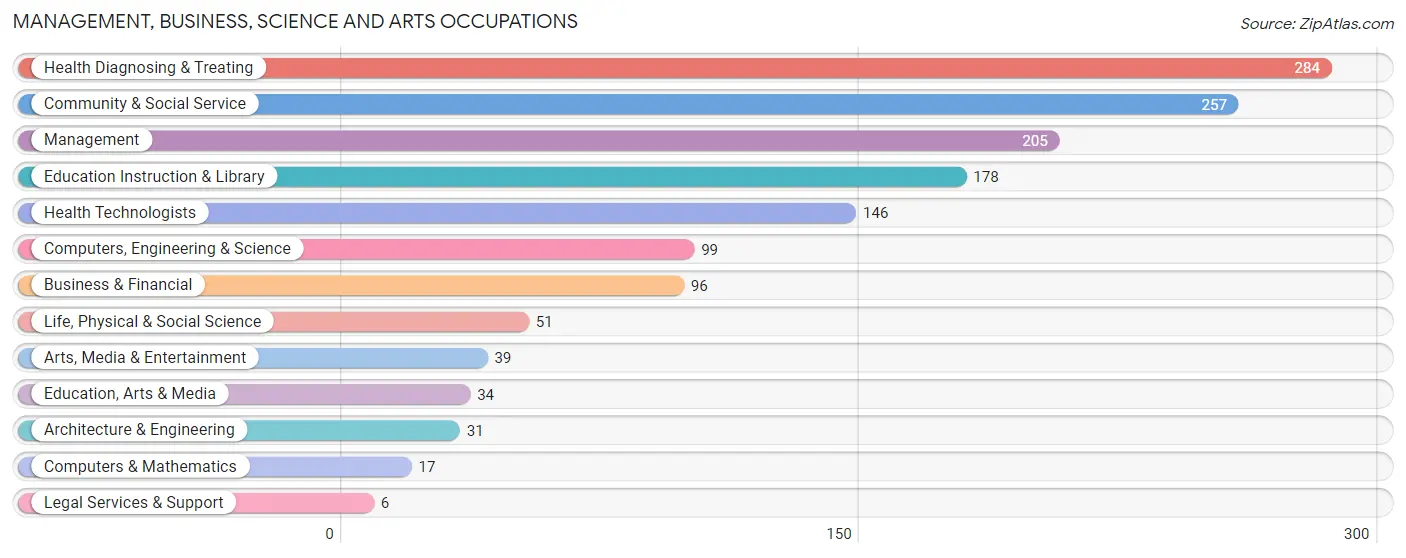
Management, Business, Science and Arts Occupations
The most common Management, Business, Science and Arts occupations in Baraga County are Health Diagnosing & Treating (284 | 9.5%), Community & Social Service (257 | 8.6%), Management (205 | 6.8%), Education Instruction & Library (178 | 5.9%), and Health Technologists (146 | 4.9%).
Management, Business, Science and Arts Occupations by Sex
Within the Management, Business, Science and Arts occupations in Baraga County, the most male-oriented occupations are Architecture & Engineering (100.0%), Life, Physical & Social Science (92.2%), and Computers, Engineering & Science (84.9%), while the most female-oriented occupations are Education Instruction & Library (84.8%), Community & Social Service (74.3%), and Education, Arts & Media (67.6%).
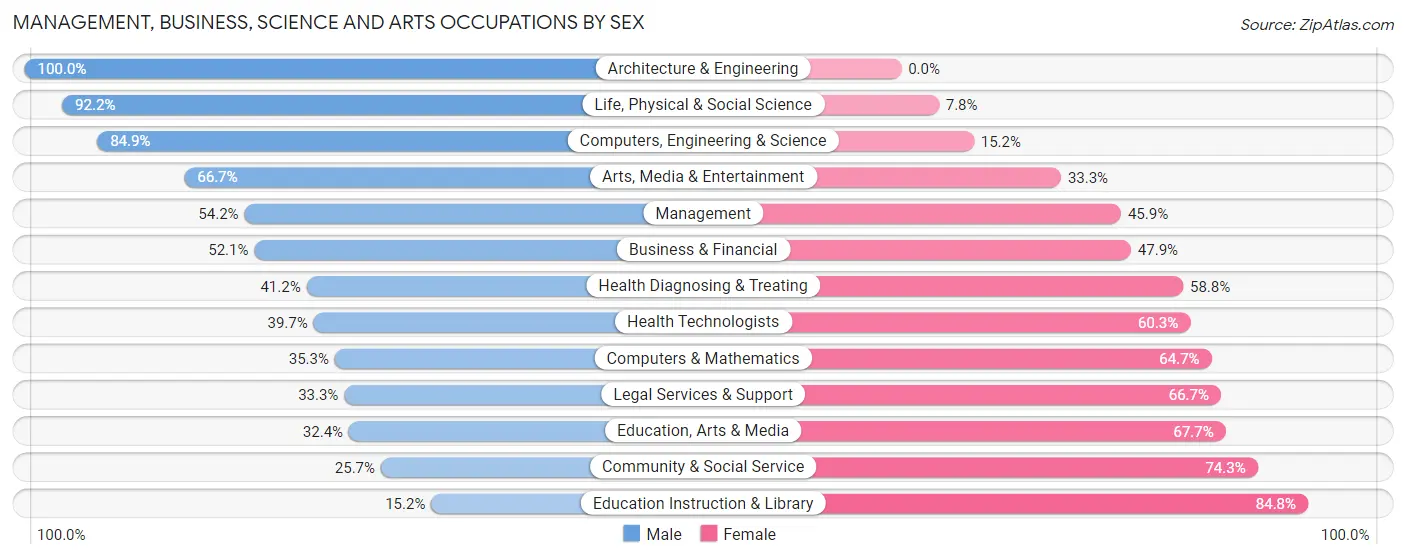
| Occupation | Male | Female |
| Management | 111 (54.1%) | 94 (45.9%) |
| Business & Financial | 50 (52.1%) | 46 (47.9%) |
| Computers, Engineering & Science | 84 (84.9%) | 15 (15.1%) |
| Computers & Mathematics | 6 (35.3%) | 11 (64.7%) |
| Architecture & Engineering | 31 (100.0%) | 0 (0.0%) |
| Life, Physical & Social Science | 47 (92.2%) | 4 (7.8%) |
| Community & Social Service | 66 (25.7%) | 191 (74.3%) |
| Education, Arts & Media | 11 (32.4%) | 23 (67.6%) |
| Legal Services & Support | 2 (33.3%) | 4 (66.7%) |
| Education Instruction & Library | 27 (15.2%) | 151 (84.8%) |
| Arts, Media & Entertainment | 26 (66.7%) | 13 (33.3%) |
| Health Diagnosing & Treating | 117 (41.2%) | 167 (58.8%) |
| Health Technologists | 58 (39.7%) | 88 (60.3%) |
| Total (Category) | 428 (45.5%) | 513 (54.5%) |
| Total (Overall) | 1,548 (51.7%) | 1,447 (48.3%) |
Services Occupations
The most common Services occupations in Baraga County are Food Preparation & Serving (186 | 6.2%), Security & Protection (152 | 5.1%), Healthcare Support (114 | 3.8%), Law Enforcement (109 | 3.6%), and Cleaning & Maintenance (88 | 2.9%).

Services Occupations by Sex
Within the Services occupations in Baraga County, the most male-oriented occupations are Law Enforcement (81.7%), Security & Protection (79.6%), and Firefighting & Prevention (74.4%), while the most female-oriented occupations are Healthcare Support (97.4%), Personal Care & Service (89.7%), and Food Preparation & Serving (62.4%).

| Occupation | Male | Female |
| Healthcare Support | 3 (2.6%) | 111 (97.4%) |
| Security & Protection | 121 (79.6%) | 31 (20.4%) |
| Firefighting & Prevention | 32 (74.4%) | 11 (25.6%) |
| Law Enforcement | 89 (81.7%) | 20 (18.3%) |
| Food Preparation & Serving | 70 (37.6%) | 116 (62.4%) |
| Cleaning & Maintenance | 46 (52.3%) | 42 (47.7%) |
| Personal Care & Service | 6 (10.3%) | 52 (89.7%) |
| Total (Category) | 246 (41.1%) | 352 (58.9%) |
| Total (Overall) | 1,548 (51.7%) | 1,447 (48.3%) |
Sales and Office Occupations
The most common Sales and Office occupations in Baraga County are Office & Administration (283 | 9.5%), and Sales & Related (281 | 9.4%).

Sales and Office Occupations by Sex
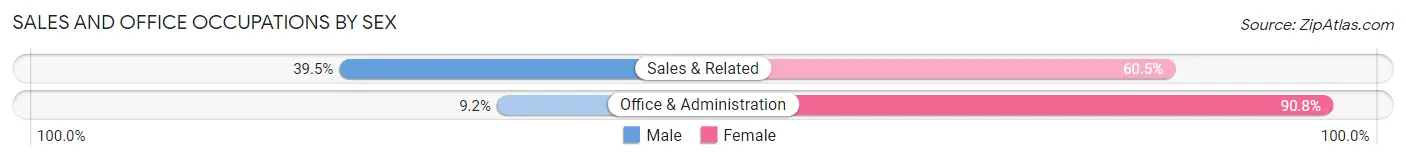
| Occupation | Male | Female |
| Sales & Related | 111 (39.5%) | 170 (60.5%) |
| Office & Administration | 26 (9.2%) | 257 (90.8%) |
| Total (Category) | 137 (24.3%) | 427 (75.7%) |
| Total (Overall) | 1,548 (51.7%) | 1,447 (48.3%) |
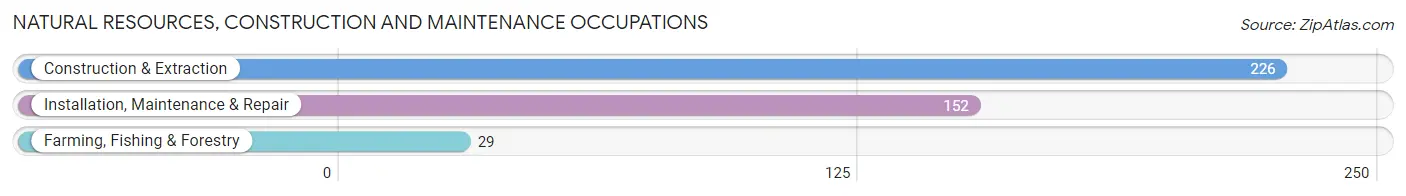
Natural Resources, Construction and Maintenance Occupations
The most common Natural Resources, Construction and Maintenance occupations in Baraga County are Construction & Extraction (226 | 7.5%), Installation, Maintenance & Repair (152 | 5.1%), and Farming, Fishing & Forestry (29 | 1.0%).
Natural Resources, Construction and Maintenance Occupations by Sex
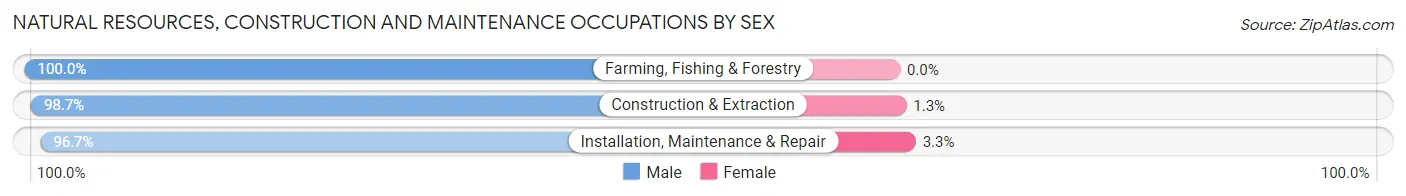
| Occupation | Male | Female |
| Farming, Fishing & Forestry | 29 (100.0%) | 0 (0.0%) |
| Construction & Extraction | 223 (98.7%) | 3 (1.3%) |
| Installation, Maintenance & Repair | 147 (96.7%) | 5 (3.3%) |
| Total (Category) | 399 (98.0%) | 8 (2.0%) |
| Total (Overall) | 1,548 (51.7%) | 1,447 (48.3%) |
Production, Transportation and Moving Occupations
The most common Production, Transportation and Moving occupations in Baraga County are Production (275 | 9.2%), Transportation (112 | 3.7%), and Material Moving (98 | 3.3%).

Production, Transportation and Moving Occupations by Sex
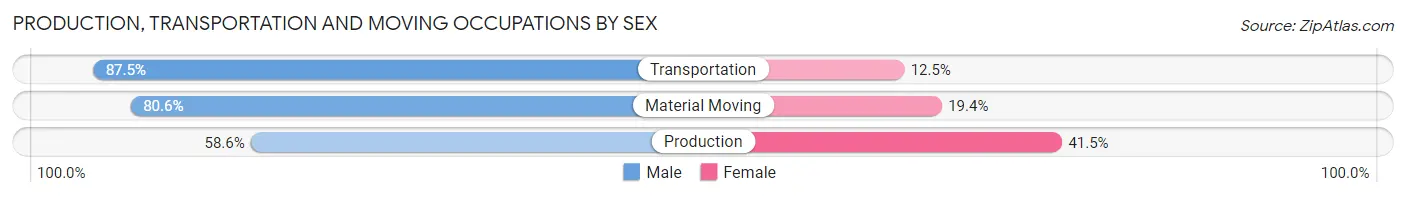
| Occupation | Male | Female |
| Production | 161 (58.6%) | 114 (41.4%) |
| Transportation | 98 (87.5%) | 14 (12.5%) |
| Material Moving | 79 (80.6%) | 19 (19.4%) |
| Total (Category) | 338 (69.7%) | 147 (30.3%) |
| Total (Overall) | 1,548 (51.7%) | 1,447 (48.3%) |
Employment Industries by Sex in Baraga County
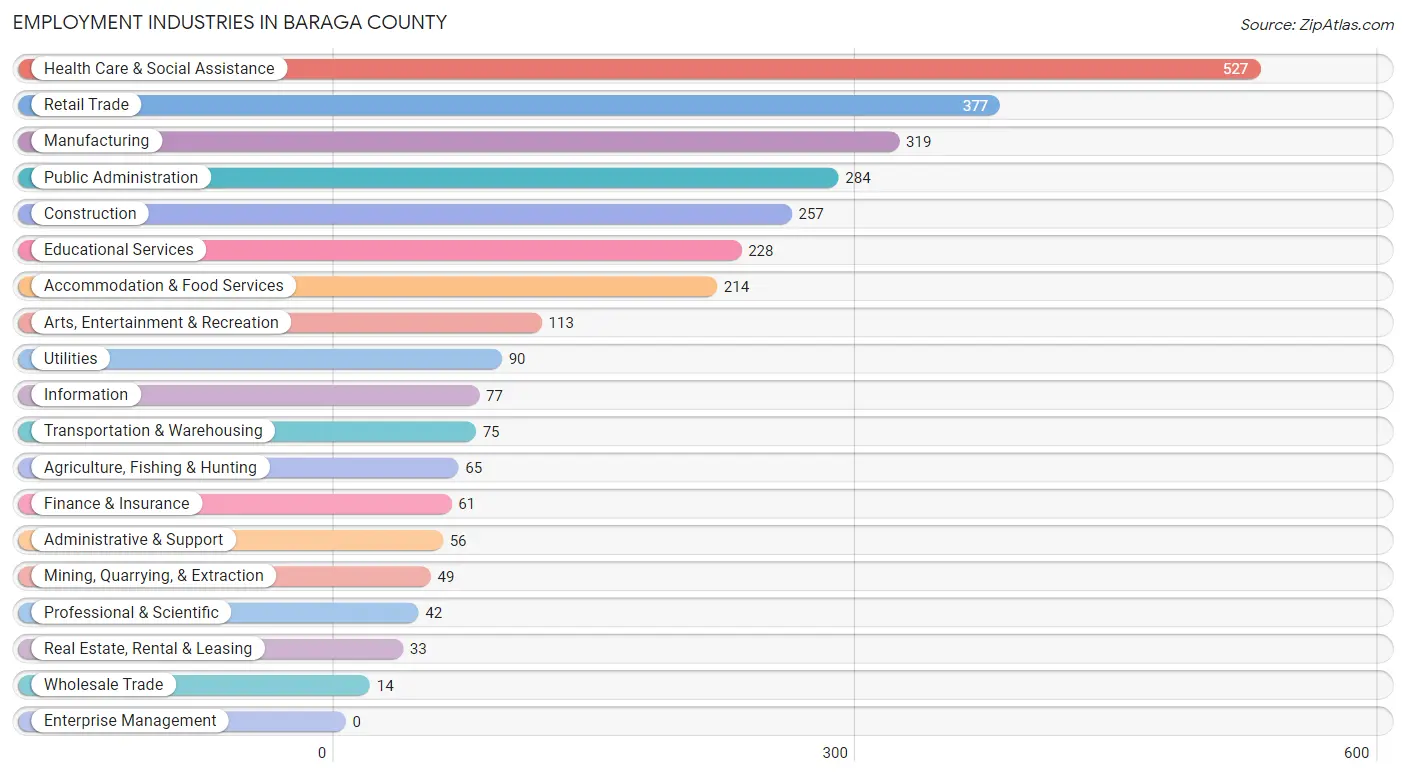
Employment Industries in Baraga County
The major employment industries in Baraga County include Health Care & Social Assistance (527 | 17.6%), Retail Trade (377 | 12.6%), Manufacturing (319 | 10.6%), Public Administration (284 | 9.5%), and Construction (257 | 8.6%).
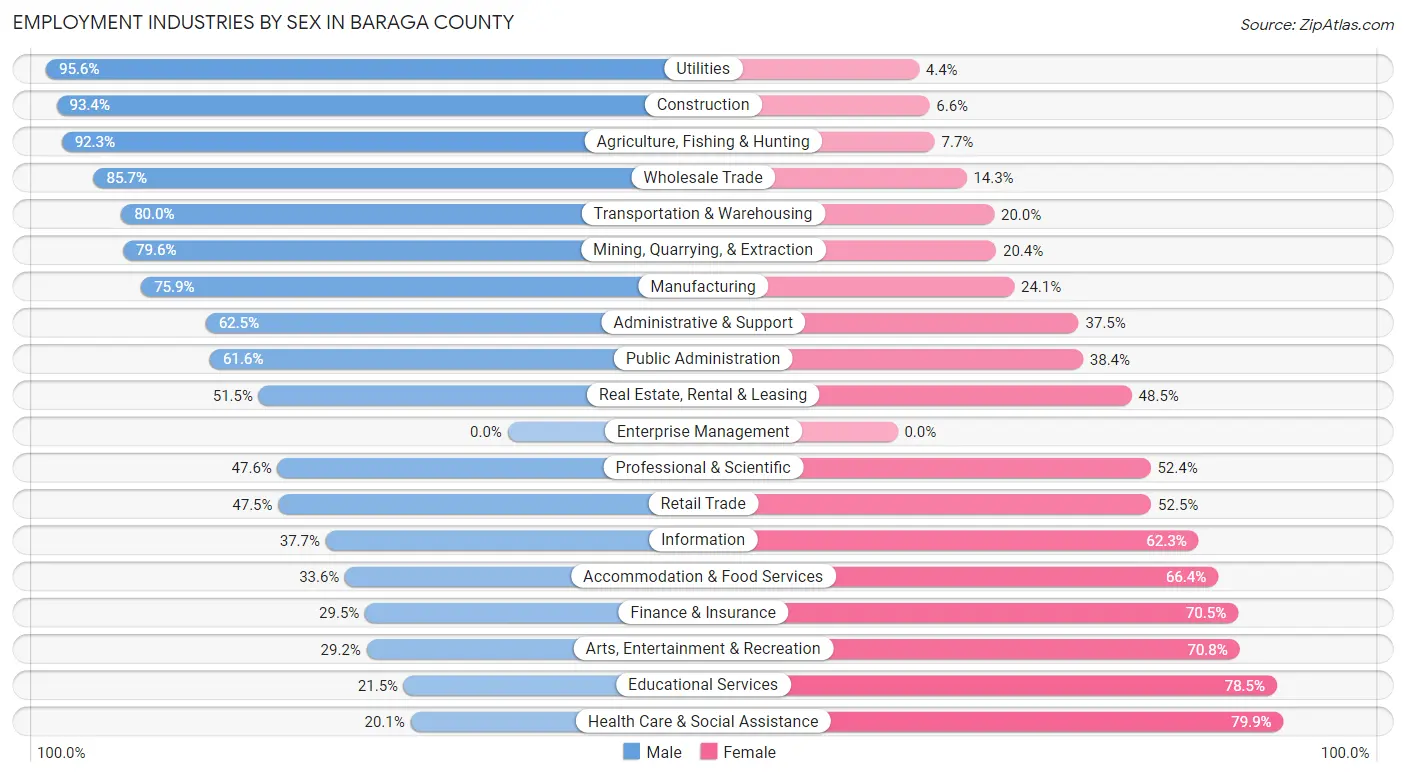
Employment Industries by Sex in Baraga County
The Baraga County industries that see more men than women are Utilities (95.6%), Construction (93.4%), and Agriculture, Fishing & Hunting (92.3%), whereas the industries that tend to have a higher number of women are Health Care & Social Assistance (79.9%), Educational Services (78.5%), and Arts, Entertainment & Recreation (70.8%).
| Industry | Male | Female |
| Agriculture, Fishing & Hunting | 60 (92.3%) | 5 (7.7%) |
| Mining, Quarrying, & Extraction | 39 (79.6%) | 10 (20.4%) |
| Construction | 240 (93.4%) | 17 (6.6%) |
| Manufacturing | 242 (75.9%) | 77 (24.1%) |
| Wholesale Trade | 12 (85.7%) | 2 (14.3%) |
| Retail Trade | 179 (47.5%) | 198 (52.5%) |
| Transportation & Warehousing | 60 (80.0%) | 15 (20.0%) |
| Utilities | 86 (95.6%) | 4 (4.4%) |
| Information | 29 (37.7%) | 48 (62.3%) |
| Finance & Insurance | 18 (29.5%) | 43 (70.5%) |
| Real Estate, Rental & Leasing | 17 (51.5%) | 16 (48.5%) |
| Professional & Scientific | 20 (47.6%) | 22 (52.4%) |
| Enterprise Management | 0 (0.0%) | 0 (0.0%) |
| Administrative & Support | 35 (62.5%) | 21 (37.5%) |
| Educational Services | 49 (21.5%) | 179 (78.5%) |
| Health Care & Social Assistance | 106 (20.1%) | 421 (79.9%) |
| Arts, Entertainment & Recreation | 33 (29.2%) | 80 (70.8%) |
| Accommodation & Food Services | 72 (33.6%) | 142 (66.4%) |
| Public Administration | 175 (61.6%) | 109 (38.4%) |
| Total | 1,548 (51.7%) | 1,447 (48.3%) |
Education in Baraga County
School Enrollment in Baraga County
The most common levels of schooling among the 1,363 students in Baraga County are middle school (338 | 24.8%), high school (338 | 24.8%), and elementary school (322 | 23.6%).

| School Level | # Students | % Students |
| Nursery / Preschool | 136 | 10.0% |
| Kindergarten | 58 | 4.3% |
| Elementary School | 322 | 23.6% |
| Middle School | 338 | 24.8% |
| High School | 338 | 24.8% |
| College / Undergraduate | 147 | 10.8% |
| Graduate / Professional | 24 | 1.8% |
| Total | 1,363 | 100.0% |
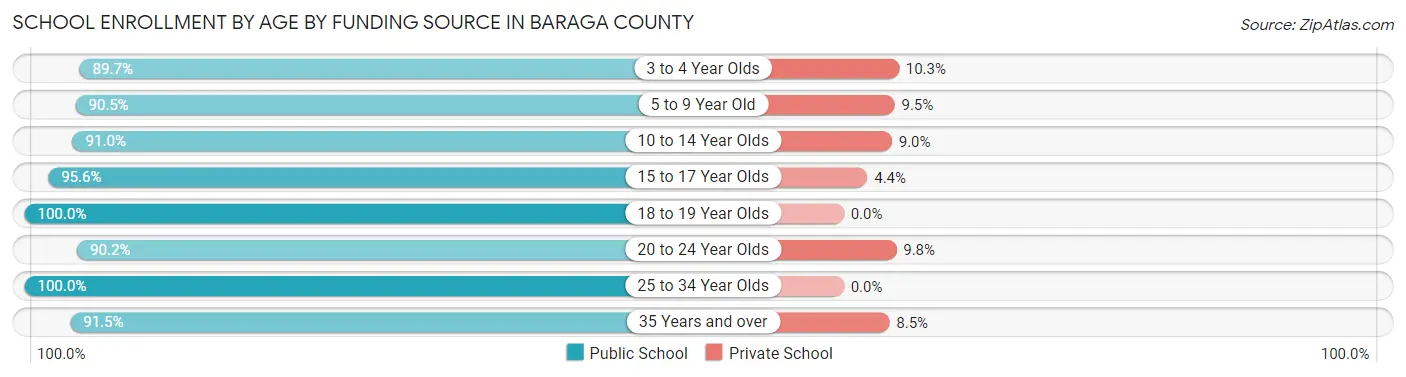
School Enrollment by Age by Funding Source in Baraga County
Out of a total of 1,363 students who are enrolled in schools in Baraga County, 108 (7.9%) attend a private institution, while the remaining 1,255 (92.1%) are enrolled in public schools. The age group of 3 to 4 year olds has the highest likelihood of being enrolled in private schools, with 12 (10.3% in the age bracket) enrolled. Conversely, the age group of 18 to 19 year olds has the lowest likelihood of being enrolled in a private school, with 58 (100.0% in the age bracket) attending a public institution.
| Age Bracket | Public School | Private School |
| 3 to 4 Year Olds | 105 (89.7%) | 12 (10.3%) |
| 5 to 9 Year Old | 315 (90.5%) | 33 (9.5%) |
| 10 to 14 Year Olds | 386 (91.0%) | 38 (9.0%) |
| 15 to 17 Year Olds | 239 (95.6%) | 11 (4.4%) |
| 18 to 19 Year Olds | 58 (100.0%) | 0 (0.0%) |
| 20 to 24 Year Olds | 46 (90.2%) | 5 (9.8%) |
| 25 to 34 Year Olds | 21 (100.0%) | 0 (0.0%) |
| 35 Years and over | 86 (91.5%) | 8 (8.5%) |
| Total | 1,255 (92.1%) | 108 (7.9%) |
Educational Attainment by Field of Study in Baraga County
Business (201 | 18.5%), science & technology (186 | 17.2%), education (153 | 14.1%), bio, nature & agricultural (98 | 9.0%), and arts & humanities (84 | 7.7%) are the most common fields of study among 1,084 individuals in Baraga County who have obtained a bachelor's degree or higher.
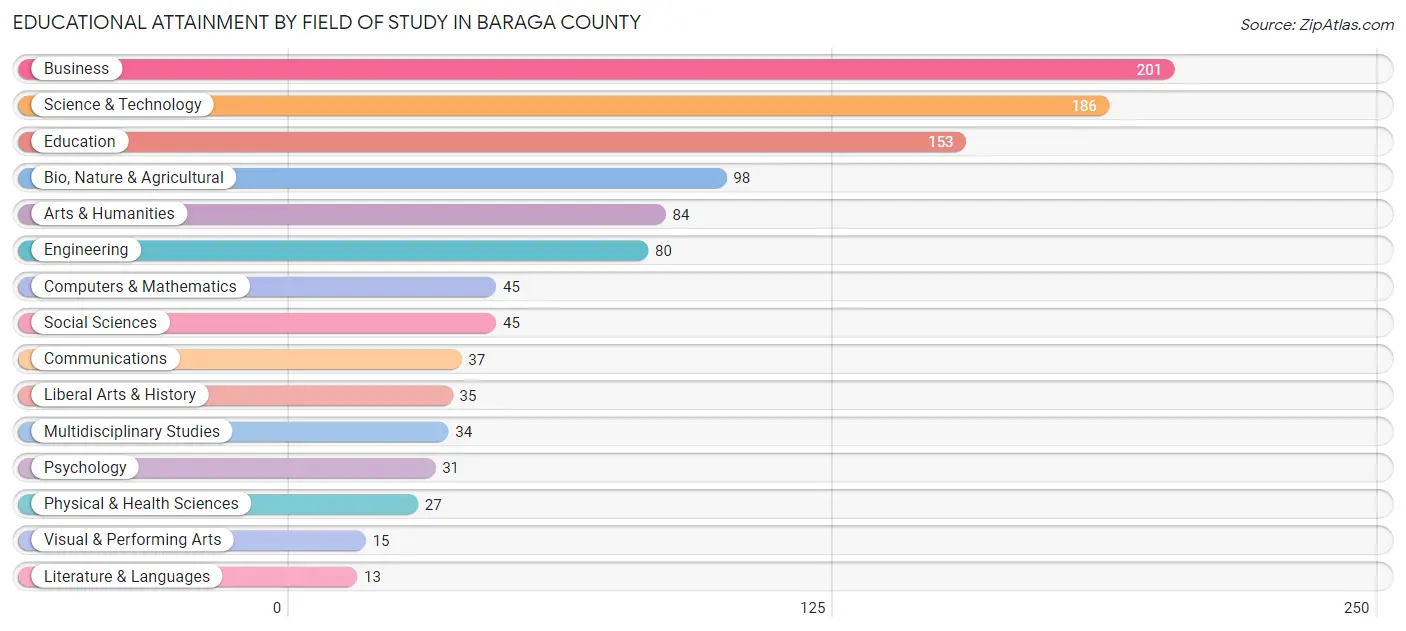
| Field of Study | # Graduates | % Graduates |
| Computers & Mathematics | 45 | 4.2% |
| Bio, Nature & Agricultural | 98 | 9.0% |
| Physical & Health Sciences | 27 | 2.5% |
| Psychology | 31 | 2.9% |
| Social Sciences | 45 | 4.2% |
| Engineering | 80 | 7.4% |
| Multidisciplinary Studies | 34 | 3.1% |
| Science & Technology | 186 | 17.2% |
| Business | 201 | 18.5% |
| Education | 153 | 14.1% |
| Literature & Languages | 13 | 1.2% |
| Liberal Arts & History | 35 | 3.2% |
| Visual & Performing Arts | 15 | 1.4% |
| Communications | 37 | 3.4% |
| Arts & Humanities | 84 | 7.7% |
| Total | 1,084 | 100.0% |
Transportation & Commute in Baraga County
Vehicle Availability by Sex in Baraga County
The most prevalent vehicle ownership categories in Baraga County are males with 2 vehicles (635, accounting for 41.8%) and females with 2 vehicles (627, making up 44.9%).
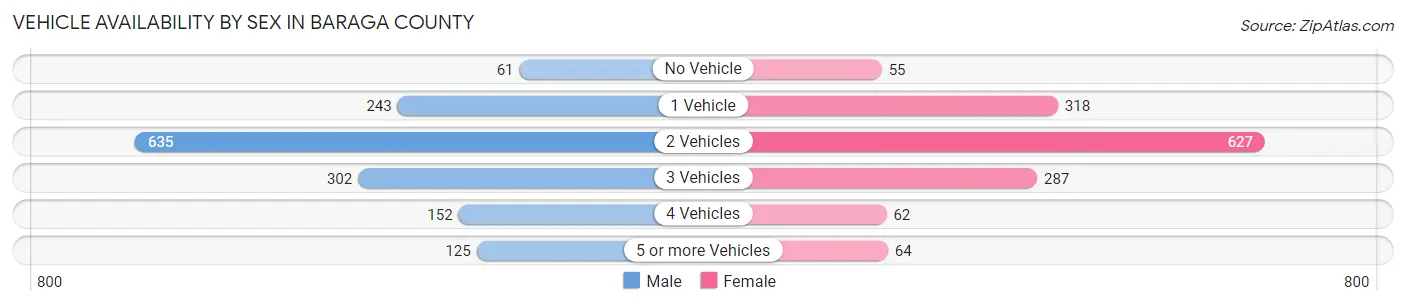
| Vehicles Available | Male | Female |
| No Vehicle | 61 (4.0%) | 55 (3.9%) |
| 1 Vehicle | 243 (16.0%) | 318 (22.5%) |
| 2 Vehicles | 635 (41.8%) | 627 (44.4%) |
| 3 Vehicles | 302 (19.9%) | 287 (20.3%) |
| 4 Vehicles | 152 (10.0%) | 62 (4.4%) |
| 5 or more Vehicles | 125 (8.2%) | 64 (4.5%) |
| Total | 1,518 (100.0%) | 1,413 (100.0%) |
Commute Time in Baraga County
The most frequently occuring commute durations in Baraga County are 10 to 14 minutes (645 commuters, 23.0%), 5 to 9 minutes (467 commuters, 16.6%), and 15 to 19 minutes (447 commuters, 15.9%).
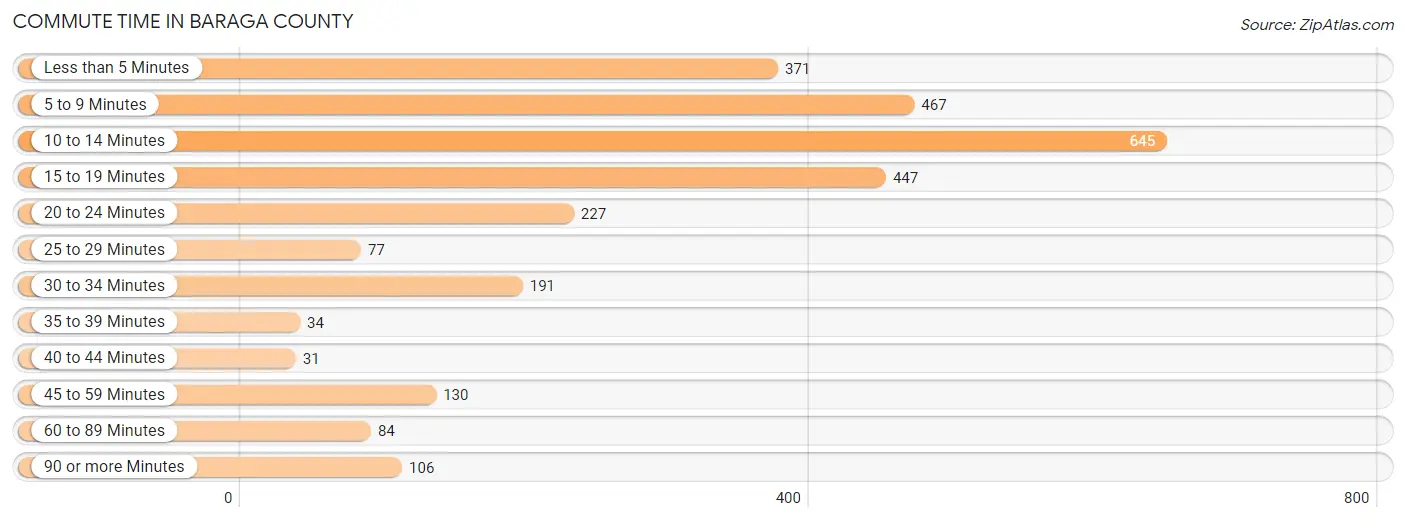
| Commute Time | # Commuters | % Commuters |
| Less than 5 Minutes | 371 | 13.2% |
| 5 to 9 Minutes | 467 | 16.6% |
| 10 to 14 Minutes | 645 | 23.0% |
| 15 to 19 Minutes | 447 | 15.9% |
| 20 to 24 Minutes | 227 | 8.1% |
| 25 to 29 Minutes | 77 | 2.7% |
| 30 to 34 Minutes | 191 | 6.8% |
| 35 to 39 Minutes | 34 | 1.2% |
| 40 to 44 Minutes | 31 | 1.1% |
| 45 to 59 Minutes | 130 | 4.6% |
| 60 to 89 Minutes | 84 | 3.0% |
| 90 or more Minutes | 106 | 3.8% |
Commute Time by Sex in Baraga County
The most common commute times in Baraga County are 10 to 14 minutes (379 commuters, 26.1%) for males and 10 to 14 minutes (266 commuters, 19.6%) for females.

| Commute Time | Male | Female |
| Less than 5 Minutes | 143 (9.9%) | 228 (16.8%) |
| 5 to 9 Minutes | 218 (15.0%) | 249 (18.3%) |
| 10 to 14 Minutes | 379 (26.1%) | 266 (19.6%) |
| 15 to 19 Minutes | 210 (14.5%) | 237 (17.4%) |
| 20 to 24 Minutes | 135 (9.3%) | 92 (6.8%) |
| 25 to 29 Minutes | 41 (2.8%) | 36 (2.6%) |
| 30 to 34 Minutes | 118 (8.1%) | 73 (5.4%) |
| 35 to 39 Minutes | 11 (0.8%) | 23 (1.7%) |
| 40 to 44 Minutes | 17 (1.2%) | 14 (1.0%) |
| 45 to 59 Minutes | 30 (2.1%) | 100 (7.4%) |
| 60 to 89 Minutes | 65 (4.5%) | 19 (1.4%) |
| 90 or more Minutes | 84 (5.8%) | 22 (1.6%) |
Time of Departure to Work by Sex in Baraga County
The most frequent times of departure to work in Baraga County are 6:30 AM to 6:59 AM (200, 13.8%) for males and 7:30 AM to 7:59 AM (333, 24.5%) for females.

| Time of Departure | Male | Female |
| 12:00 AM to 4:59 AM | 79 (5.4%) | 23 (1.7%) |
| 5:00 AM to 5:29 AM | 37 (2.5%) | 36 (2.6%) |
| 5:30 AM to 5:59 AM | 118 (8.1%) | 41 (3.0%) |
| 6:00 AM to 6:29 AM | 157 (10.8%) | 48 (3.5%) |
| 6:30 AM to 6:59 AM | 200 (13.8%) | 124 (9.1%) |
| 7:00 AM to 7:29 AM | 129 (8.9%) | 206 (15.2%) |
| 7:30 AM to 7:59 AM | 193 (13.3%) | 333 (24.5%) |
| 8:00 AM to 8:29 AM | 79 (5.4%) | 132 (9.7%) |
| 8:30 AM to 8:59 AM | 52 (3.6%) | 45 (3.3%) |
| 9:00 AM to 9:59 AM | 37 (2.5%) | 95 (7.0%) |
| 10:00 AM to 10:59 AM | 98 (6.8%) | 87 (6.4%) |
| 11:00 AM to 11:59 AM | 12 (0.8%) | 0 (0.0%) |
| 12:00 PM to 3:59 PM | 144 (9.9%) | 58 (4.3%) |
| 4:00 PM to 11:59 PM | 116 (8.0%) | 131 (9.6%) |
| Total | 1,451 (100.0%) | 1,359 (100.0%) |
Housing Occupancy in Baraga County
Occupancy by Ownership in Baraga County
Of the total 3,241 dwellings in Baraga County, owner-occupied units account for 2,491 (76.9%), while renter-occupied units make up 750 (23.1%).

| Occupancy | # Housing Units | % Housing Units |
| Owner Occupied Housing Units | 2,491 | 76.9% |
| Renter-Occupied Housing Units | 750 | 23.1% |
| Total Occupied Housing Units | 3,241 | 100.0% |
Occupancy by Household Size in Baraga County
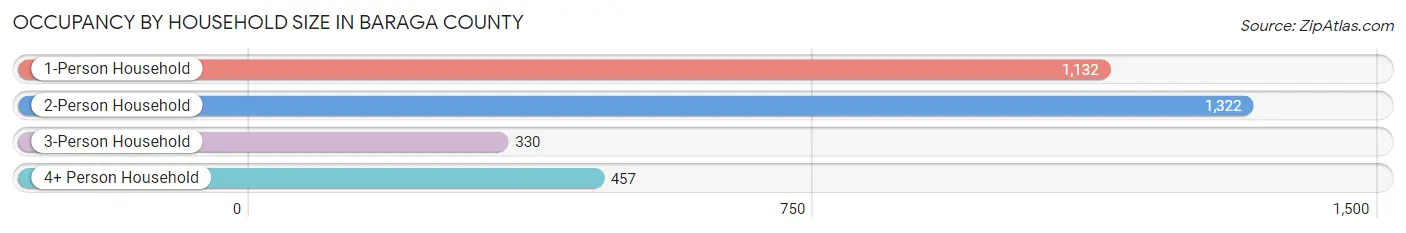
| Household Size | # Housing Units | % Housing Units |
| 1-Person Household | 1,132 | 34.9% |
| 2-Person Household | 1,322 | 40.8% |
| 3-Person Household | 330 | 10.2% |
| 4+ Person Household | 457 | 14.1% |
| Total Housing Units | 3,241 | 100.0% |
Occupancy by Ownership by Household Size in Baraga County
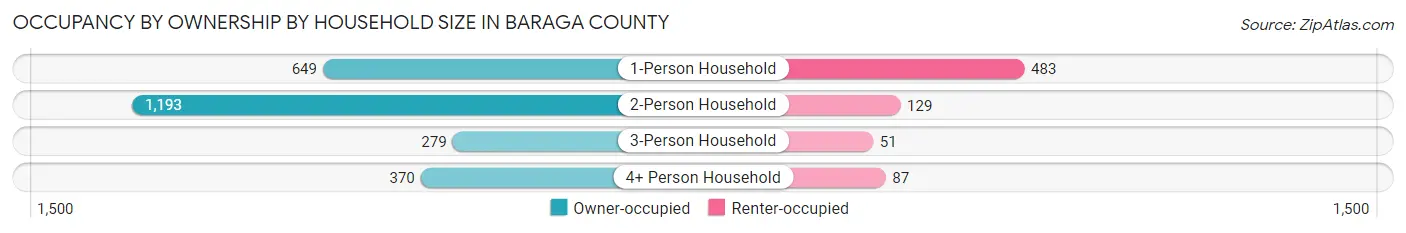
| Household Size | Owner-occupied | Renter-occupied |
| 1-Person Household | 649 (57.3%) | 483 (42.7%) |
| 2-Person Household | 1,193 (90.2%) | 129 (9.8%) |
| 3-Person Household | 279 (84.6%) | 51 (15.4%) |
| 4+ Person Household | 370 (81.0%) | 87 (19.0%) |
| Total Housing Units | 2,491 (76.9%) | 750 (23.1%) |
Occupancy by Educational Attainment in Baraga County
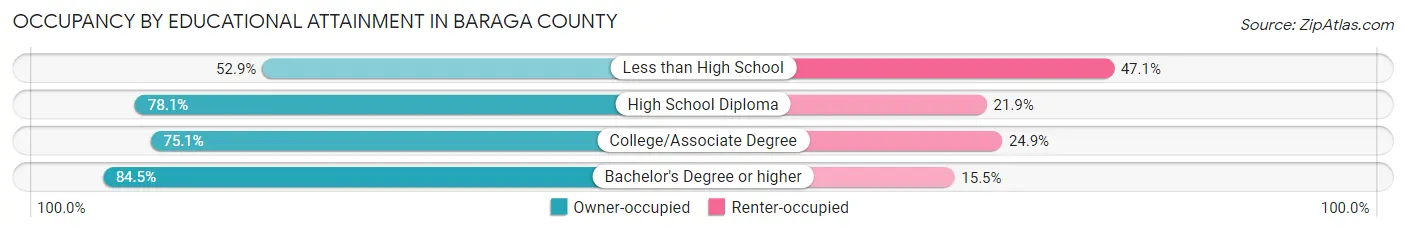
| Household Size | Owner-occupied | Renter-occupied |
| Less than High School | 82 (52.9%) | 73 (47.1%) |
| High School Diploma | 857 (78.1%) | 240 (21.9%) |
| College/Associate Degree | 1,023 (75.1%) | 340 (24.9%) |
| Bachelor's Degree or higher | 529 (84.5%) | 97 (15.5%) |
Occupancy by Age of Householder in Baraga County
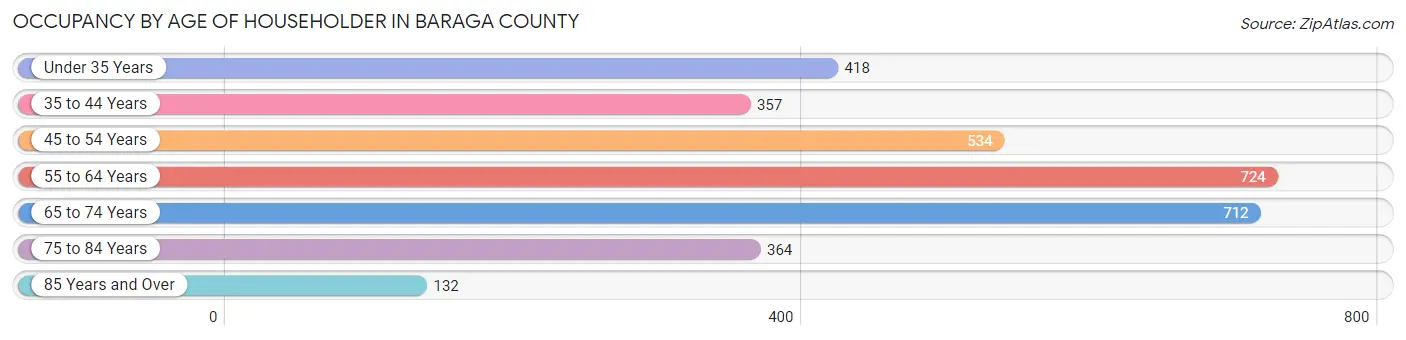
| Age Bracket | # Households | % Households |
| Under 35 Years | 418 | 12.9% |
| 35 to 44 Years | 357 | 11.0% |
| 45 to 54 Years | 534 | 16.5% |
| 55 to 64 Years | 724 | 22.3% |
| 65 to 74 Years | 712 | 22.0% |
| 75 to 84 Years | 364 | 11.2% |
| 85 Years and Over | 132 | 4.1% |
| Total | 3,241 | 100.0% |
Housing Finances in Baraga County
Median Income by Occupancy in Baraga County
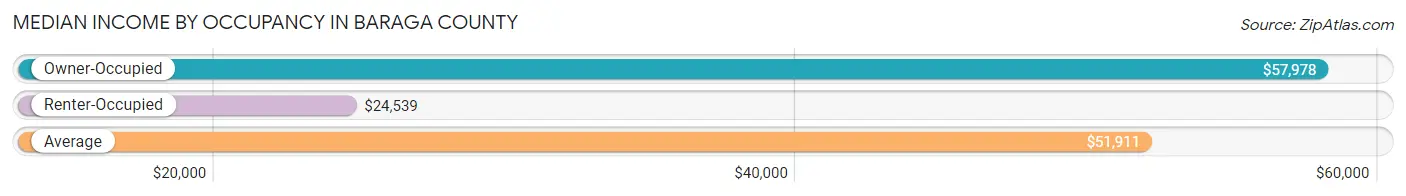
| Occupancy Type | # Households | Median Income |
| Owner-Occupied | 2,491 (76.9%) | $57,978 |
| Renter-Occupied | 750 (23.1%) | $24,539 |
| Average | 3,241 (100.0%) | $51,911 |
Occupancy by Householder Income Bracket in Baraga County
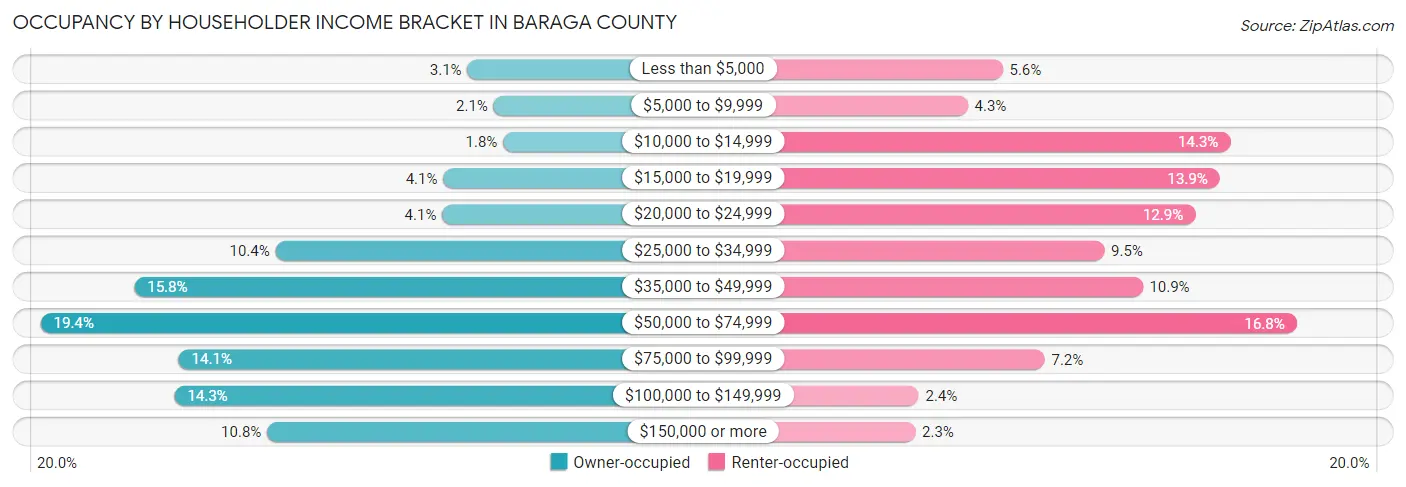
| Income Bracket | Owner-occupied | Renter-occupied |
| Less than $5,000 | 78 (3.1%) | 42 (5.6%) |
| $5,000 to $9,999 | 53 (2.1%) | 32 (4.3%) |
| $10,000 to $14,999 | 44 (1.8%) | 107 (14.3%) |
| $15,000 to $19,999 | 101 (4.1%) | 104 (13.9%) |
| $20,000 to $24,999 | 102 (4.1%) | 97 (12.9%) |
| $25,000 to $34,999 | 260 (10.4%) | 71 (9.5%) |
| $35,000 to $49,999 | 394 (15.8%) | 82 (10.9%) |
| $50,000 to $74,999 | 483 (19.4%) | 126 (16.8%) |
| $75,000 to $99,999 | 352 (14.1%) | 54 (7.2%) |
| $100,000 to $149,999 | 356 (14.3%) | 18 (2.4%) |
| $150,000 or more | 268 (10.8%) | 17 (2.3%) |
| Total | 2,491 (100.0%) | 750 (100.0%) |
Monthly Housing Cost Tiers in Baraga County
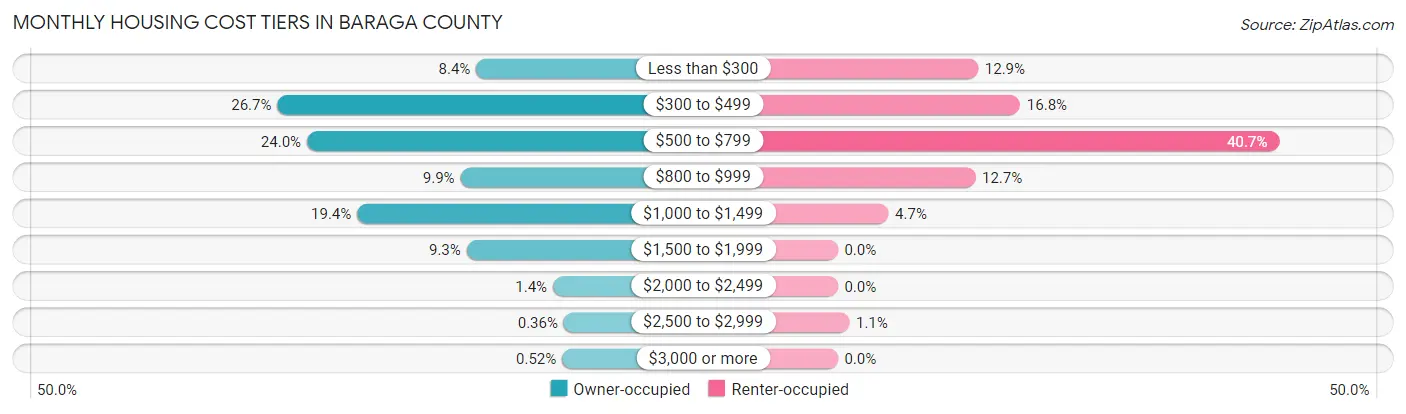
| Monthly Cost | Owner-occupied | Renter-occupied |
| Less than $300 | 210 (8.4%) | 97 (12.9%) |
| $300 to $499 | 666 (26.7%) | 126 (16.8%) |
| $500 to $799 | 598 (24.0%) | 305 (40.7%) |
| $800 to $999 | 246 (9.9%) | 95 (12.7%) |
| $1,000 to $1,499 | 483 (19.4%) | 35 (4.7%) |
| $1,500 to $1,999 | 232 (9.3%) | 0 (0.0%) |
| $2,000 to $2,499 | 34 (1.4%) | 0 (0.0%) |
| $2,500 to $2,999 | 9 (0.4%) | 8 (1.1%) |
| $3,000 or more | 13 (0.5%) | 0 (0.0%) |
| Total | 2,491 (100.0%) | 750 (100.0%) |
Physical Housing Characteristics in Baraga County
Housing Structures in Baraga County
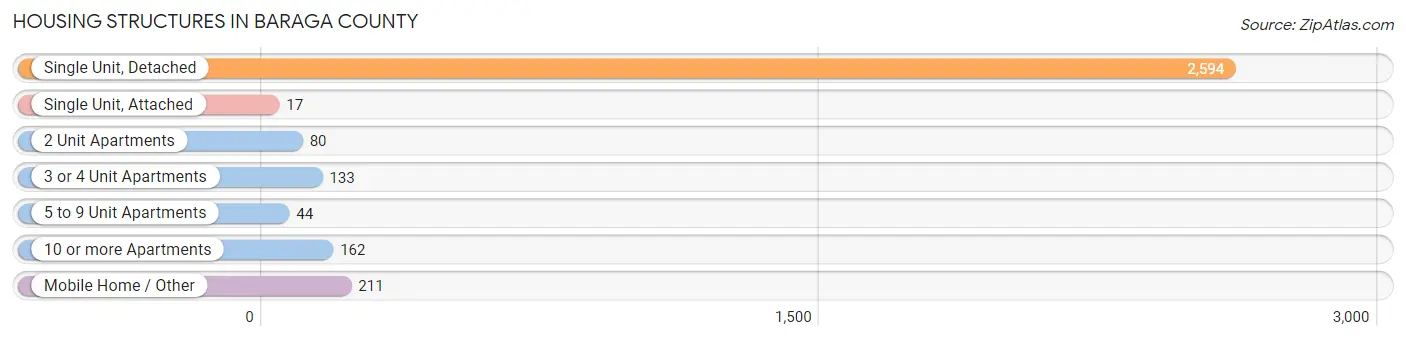
| Structure Type | # Housing Units | % Housing Units |
| Single Unit, Detached | 2,594 | 80.0% |
| Single Unit, Attached | 17 | 0.5% |
| 2 Unit Apartments | 80 | 2.5% |
| 3 or 4 Unit Apartments | 133 | 4.1% |
| 5 to 9 Unit Apartments | 44 | 1.4% |
| 10 or more Apartments | 162 | 5.0% |
| Mobile Home / Other | 211 | 6.5% |
| Total | 3,241 | 100.0% |
Housing Structures by Occupancy in Baraga County

| Structure Type | Owner-occupied | Renter-occupied |
| Single Unit, Detached | 2,283 (88.0%) | 311 (12.0%) |
| Single Unit, Attached | 5 (29.4%) | 12 (70.6%) |
| 2 Unit Apartments | 8 (10.0%) | 72 (90.0%) |
| 3 or 4 Unit Apartments | 0 (0.0%) | 133 (100.0%) |
| 5 to 9 Unit Apartments | 3 (6.8%) | 41 (93.2%) |
| 10 or more Apartments | 6 (3.7%) | 156 (96.3%) |
| Mobile Home / Other | 186 (88.1%) | 25 (11.8%) |
| Total | 2,491 (76.9%) | 750 (23.1%) |
Housing Structures by Number of Rooms in Baraga County

| Number of Rooms | Owner-occupied | Renter-occupied |
| 1 Room | 9 (0.4%) | 29 (3.9%) |
| 2 or 3 Rooms | 136 (5.5%) | 210 (28.0%) |
| 4 or 5 Rooms | 896 (36.0%) | 298 (39.7%) |
| 6 or 7 Rooms | 939 (37.7%) | 174 (23.2%) |
| 8 or more Rooms | 511 (20.5%) | 39 (5.2%) |
| Total | 2,491 (100.0%) | 750 (100.0%) |
Housing Structure by Heating Type in Baraga County

| Heating Type | Owner-occupied | Renter-occupied |
| Utility Gas | 1,127 (45.2%) | 526 (70.1%) |
| Bottled, Tank, or LP Gas | 755 (30.3%) | 67 (8.9%) |
| Electricity | 39 (1.6%) | 118 (15.7%) |
| Fuel Oil or Kerosene | 138 (5.5%) | 16 (2.1%) |
| Coal or Coke | 9 (0.4%) | 0 (0.0%) |
| All other Fuels | 408 (16.4%) | 23 (3.1%) |
| No Fuel Used | 15 (0.6%) | 0 (0.0%) |
| Total | 2,491 (100.0%) | 750 (100.0%) |
Household Vehicle Usage in Baraga County
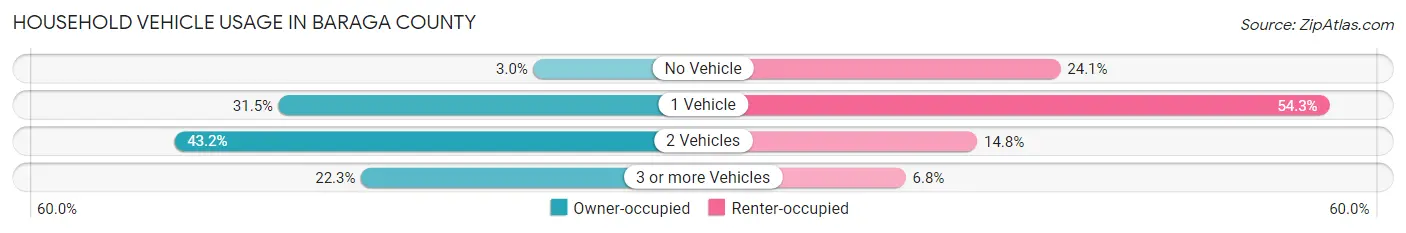
| Vehicles per Household | Owner-occupied | Renter-occupied |
| No Vehicle | 74 (3.0%) | 181 (24.1%) |
| 1 Vehicle | 785 (31.5%) | 407 (54.3%) |
| 2 Vehicles | 1,077 (43.2%) | 111 (14.8%) |
| 3 or more Vehicles | 555 (22.3%) | 51 (6.8%) |
| Total | 2,491 (100.0%) | 750 (100.0%) |
Real Estate & Mortgages in Baraga County
Real Estate and Mortgage Overview in Baraga County
| Characteristic | Without Mortgage | With Mortgage |
| Housing Units | 1,324 | 1,167 |
| Median Property Value | $108,700 | $135,100 |
| Median Household Income | $48,967 | $183 |
| Monthly Housing Costs | $443 | $9 |
| Real Estate Taxes | $1,669 | $191 |
Property Value by Mortgage Status in Baraga County

| Property Value | Without Mortgage | With Mortgage |
| Less than $50,000 | 252 (19.0%) | 85 (7.3%) |
| $50,000 to $99,999 | 359 (27.1%) | 304 (26.1%) |
| $100,000 to $299,999 | 593 (44.8%) | 659 (56.5%) |
| $300,000 to $499,999 | 68 (5.1%) | 83 (7.1%) |
| $500,000 to $749,999 | 39 (2.9%) | 36 (3.1%) |
| $750,000 to $999,999 | 0 (0.0%) | 0 (0.0%) |
| $1,000,000 or more | 13 (1.0%) | 0 (0.0%) |
| Total | 1,324 (100.0%) | 1,167 (100.0%) |
Household Income by Mortgage Status in Baraga County

| Household Income | Without Mortgage | With Mortgage |
| Less than $10,000 | 84 (6.3%) | 11 (0.9%) |
| $10,000 to $24,999 | 164 (12.4%) | 47 (4.0%) |
| $25,000 to $34,999 | 165 (12.5%) | 83 (7.1%) |
| $35,000 to $49,999 | 287 (21.7%) | 95 (8.1%) |
| $50,000 to $74,999 | 216 (16.3%) | 107 (9.2%) |
| $75,000 to $99,999 | 170 (12.8%) | 267 (22.9%) |
| $100,000 to $149,999 | 153 (11.6%) | 182 (15.6%) |
| $150,000 or more | 85 (6.4%) | 203 (17.4%) |
| Total | 1,324 (100.0%) | 1,167 (100.0%) |
Property Value to Household Income Ratio in Baraga County
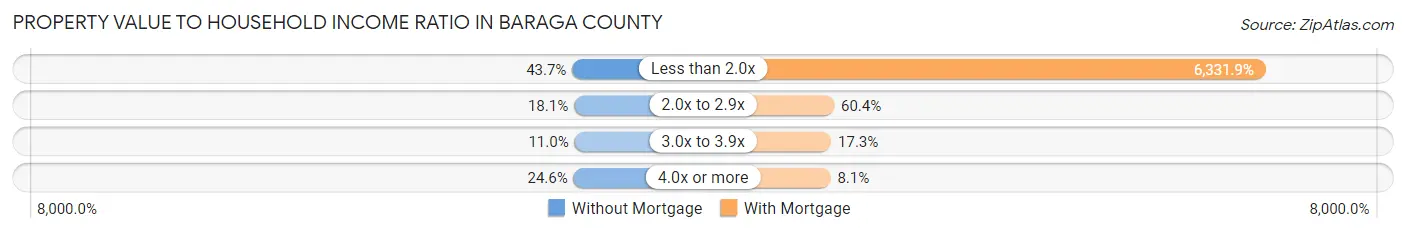
| Value-to-Income Ratio | Without Mortgage | With Mortgage |
| Less than 2.0x | 579 (43.7%) | 73,893 (6,331.9%) |
| 2.0x to 2.9x | 240 (18.1%) | 705 (60.4%) |
| 3.0x to 3.9x | 145 (11.0%) | 202 (17.3%) |
| 4.0x or more | 326 (24.6%) | 94 (8.1%) |
| Total | 1,324 (100.0%) | 1,167 (100.0%) |
Real Estate Taxes by Mortgage Status in Baraga County
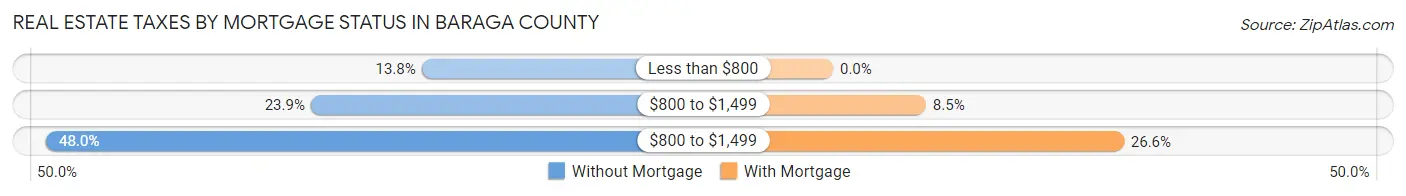
| Property Taxes | Without Mortgage | With Mortgage |
| Less than $800 | 182 (13.8%) | 0 (0.0%) |
| $800 to $1,499 | 316 (23.9%) | 99 (8.5%) |
| $800 to $1,499 | 636 (48.0%) | 310 (26.6%) |
| Total | 1,324 (100.0%) | 1,167 (100.0%) |
Health & Disability in Baraga County
Health Insurance Coverage by Age in Baraga County
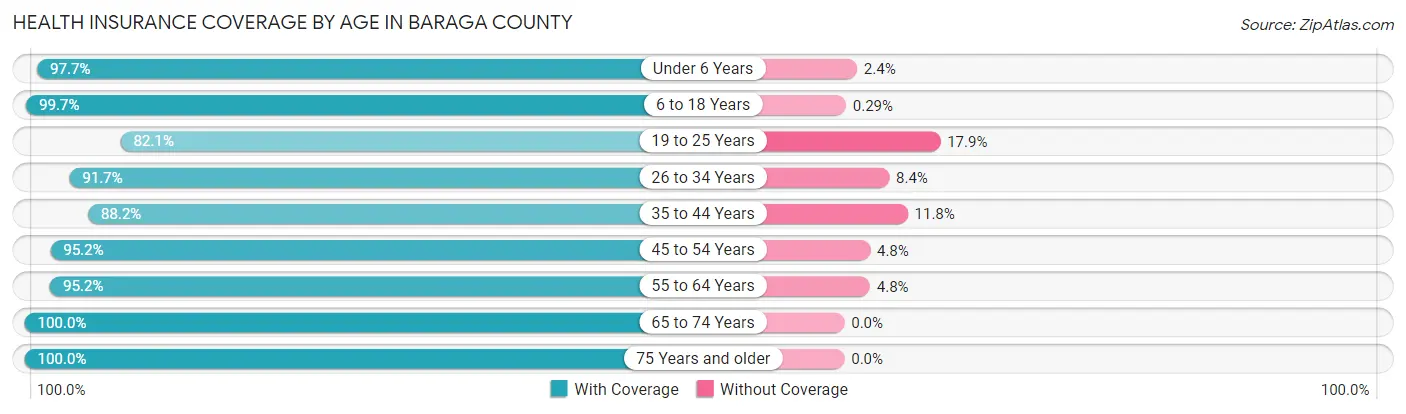
| Age Bracket | With Coverage | Without Coverage |
| Under 6 Years | 416 (97.7%) | 10 (2.4%) |
| 6 to 18 Years | 1,019 (99.7%) | 3 (0.3%) |
| 19 to 25 Years | 390 (82.1%) | 85 (17.9%) |
| 26 to 34 Years | 648 (91.6%) | 59 (8.4%) |
| 35 to 44 Years | 575 (88.2%) | 77 (11.8%) |
| 45 to 54 Years | 893 (95.2%) | 45 (4.8%) |
| 55 to 64 Years | 1,141 (95.2%) | 57 (4.8%) |
| 65 to 74 Years | 1,103 (100.0%) | 0 (0.0%) |
| 75 Years and older | 698 (100.0%) | 0 (0.0%) |
| Total | 6,883 (95.4%) | 336 (4.6%) |
Health Insurance Coverage by Citizenship Status in Baraga County
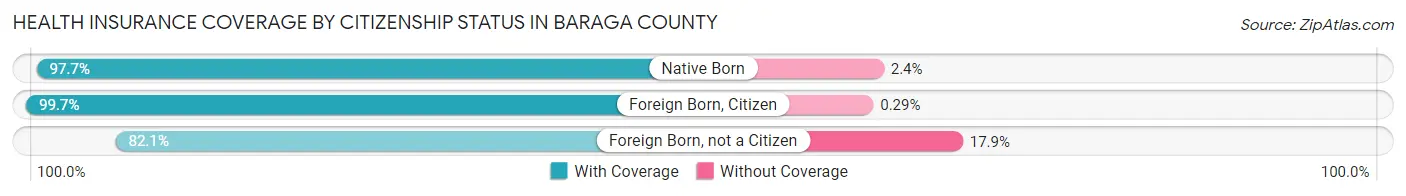
| Citizenship Status | With Coverage | Without Coverage |
| Native Born | 416 (97.7%) | 10 (2.4%) |
| Foreign Born, Citizen | 1,019 (99.7%) | 3 (0.3%) |
| Foreign Born, not a Citizen | 390 (82.1%) | 85 (17.9%) |
Health Insurance Coverage by Household Income in Baraga County
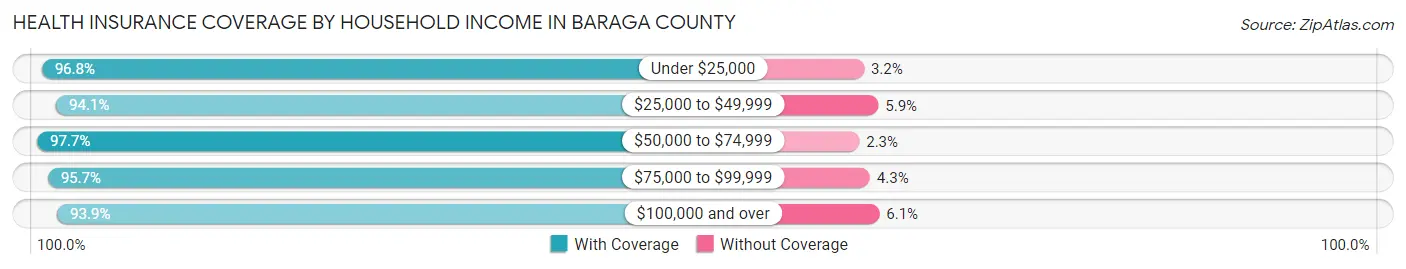
| Household Income | With Coverage | Without Coverage |
| Under $25,000 | 964 (96.8%) | 32 (3.2%) |
| $25,000 to $49,999 | 1,543 (94.1%) | 97 (5.9%) |
| $50,000 to $74,999 | 1,296 (97.7%) | 31 (2.3%) |
| $75,000 to $99,999 | 1,148 (95.7%) | 52 (4.3%) |
| $100,000 and over | 1,909 (93.9%) | 124 (6.1%) |
Public vs Private Health Insurance Coverage by Age in Baraga County

| Age Bracket | Public Insurance | Private Insurance |
| Under 6 | 200 (46.9%) | 301 (70.7%) |
| 6 to 18 Years | 499 (48.8%) | 661 (64.7%) |
| 19 to 25 Years | 152 (32.0%) | 267 (56.2%) |
| 25 to 34 Years | 137 (19.4%) | 525 (74.3%) |
| 35 to 44 Years | 183 (28.1%) | 456 (69.9%) |
| 45 to 54 Years | 200 (21.3%) | 751 (80.1%) |
| 55 to 64 Years | 393 (32.8%) | 822 (68.6%) |
| 65 to 74 Years | 1,087 (98.6%) | 675 (61.2%) |
| 75 Years and over | 694 (99.4%) | 449 (64.3%) |
| Total | 3,545 (49.1%) | 4,907 (68.0%) |
Disability Status by Sex by Age in Baraga County

| Age Bracket | Male | Female |
| Under 5 Years | 0 (0.0%) | 15 (8.2%) |
| 5 to 17 Years | 43 (8.4%) | 52 (9.5%) |
| 18 to 34 Years | 68 (10.5%) | 35 (6.1%) |
| 35 to 64 Years | 289 (21.2%) | 237 (16.6%) |
| 65 to 74 Years | 185 (31.5%) | 138 (26.7%) |
| 75 Years and over | 156 (48.1%) | 203 (54.3%) |
Disability Class by Sex by Age in Baraga County
Disability Class: Hearing Difficulty
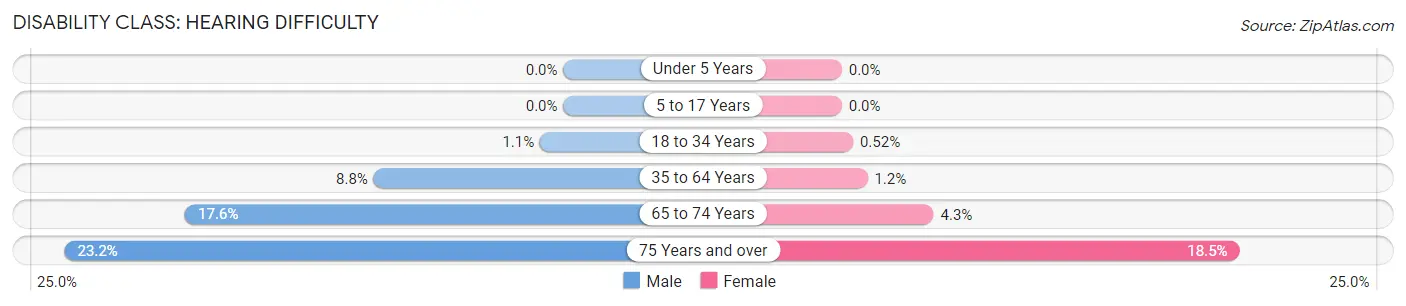
| Age Bracket | Male | Female |
| Under 5 Years | 0 (0.0%) | 0 (0.0%) |
| 5 to 17 Years | 0 (0.0%) | 0 (0.0%) |
| 18 to 34 Years | 7 (1.1%) | 3 (0.5%) |
| 35 to 64 Years | 120 (8.8%) | 17 (1.2%) |
| 65 to 74 Years | 103 (17.5%) | 22 (4.3%) |
| 75 Years and over | 75 (23.2%) | 69 (18.4%) |
Disability Class: Vision Difficulty
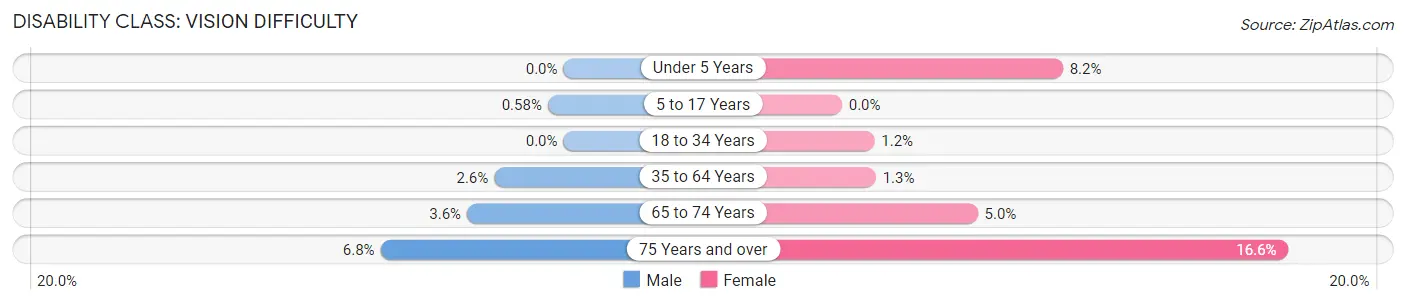
| Age Bracket | Male | Female |
| Under 5 Years | 0 (0.0%) | 15 (8.2%) |
| 5 to 17 Years | 3 (0.6%) | 0 (0.0%) |
| 18 to 34 Years | 0 (0.0%) | 7 (1.2%) |
| 35 to 64 Years | 35 (2.6%) | 18 (1.3%) |
| 65 to 74 Years | 21 (3.6%) | 26 (5.0%) |
| 75 Years and over | 22 (6.8%) | 62 (16.6%) |
Disability Class: Cognitive Difficulty

| Age Bracket | Male | Female |
| 5 to 17 Years | 30 (5.8%) | 52 (9.5%) |
| 18 to 34 Years | 64 (9.9%) | 25 (4.3%) |
| 35 to 64 Years | 106 (7.8%) | 83 (5.8%) |
| 65 to 74 Years | 12 (2.0%) | 23 (4.5%) |
| 75 Years and over | 42 (13.0%) | 32 (8.6%) |
Disability Class: Ambulatory Difficulty
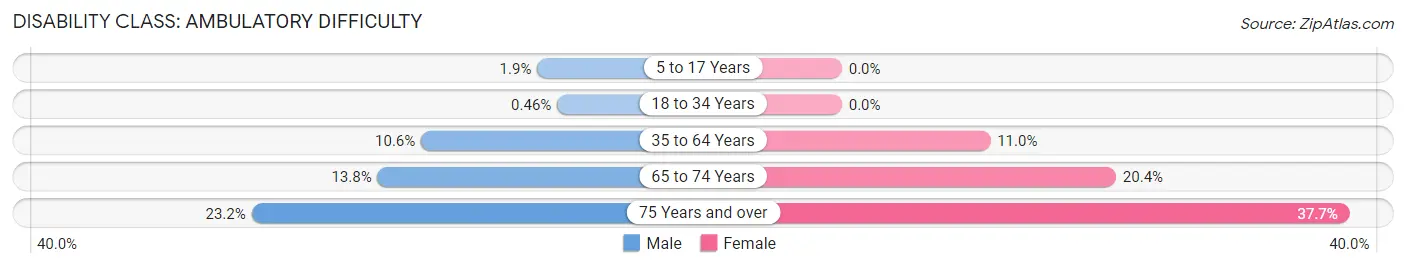
| Age Bracket | Male | Female |
| 5 to 17 Years | 10 (1.9%) | 0 (0.0%) |
| 18 to 34 Years | 3 (0.5%) | 0 (0.0%) |
| 35 to 64 Years | 144 (10.6%) | 157 (11.0%) |
| 65 to 74 Years | 81 (13.8%) | 105 (20.3%) |
| 75 Years and over | 75 (23.2%) | 141 (37.7%) |
Disability Class: Self-Care Difficulty

| Age Bracket | Male | Female |
| 5 to 17 Years | 8 (1.5%) | 0 (0.0%) |
| 18 to 34 Years | 3 (0.5%) | 0 (0.0%) |
| 35 to 64 Years | 68 (5.0%) | 70 (4.9%) |
| 65 to 74 Years | 5 (0.9%) | 59 (11.4%) |
| 75 Years and over | 45 (13.9%) | 21 (5.6%) |
Technology Access in Baraga County
Computing Device Access in Baraga County

| Device Type | # Households | % Households |
| Desktop or Laptop | 2,302 | 71.0% |
| Smartphone | 2,269 | 70.0% |
| Tablet | 1,756 | 54.2% |
| No Computing Device | 407 | 12.6% |
| Total | 3,241 | 100.0% |
Internet Access in Baraga County
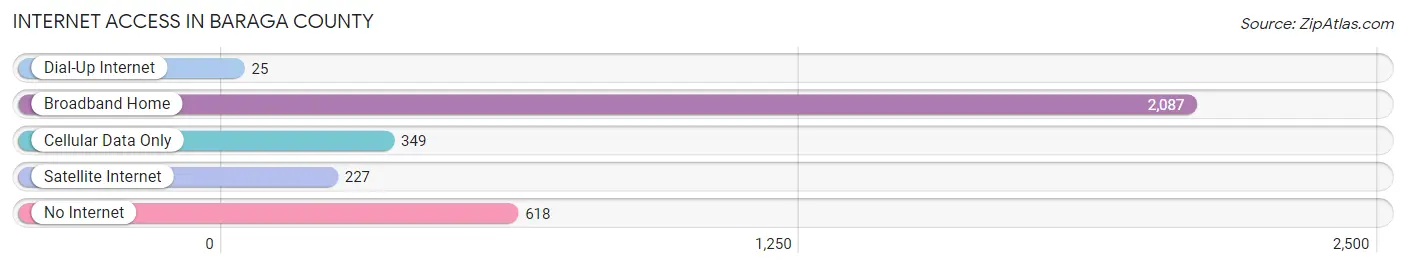
| Internet Type | # Households | % Households |
| Dial-Up Internet | 25 | 0.8% |
| Broadband Home | 2,087 | 64.4% |
| Cellular Data Only | 349 | 10.8% |
| Satellite Internet | 227 | 7.0% |
| No Internet | 618 | 19.1% |
| Total | 3,241 | 100.0% |
Baraga County Summary
Baraga County is located in the Upper Peninsula of Michigan, and is bordered by Houghton County to the east, Iron County to the south, and Ontonagon County to the west. The county seat is L'Anse, and the county has a total area of 1,072 square miles. As of the 2010 census, the population was 8,860.
History
Baraga County was established in 1875, and was named after Bishop Frederic Baraga, a Slovenian missionary who worked with the Native Americans in the area. The county was originally part of Houghton County, and was split off in 1875. The first settlers in the area were mostly Finnish and Swedish immigrants, who were attracted to the area by the abundance of natural resources.
Geography
Baraga County is located in the Upper Peninsula of Michigan, and is bordered by Houghton County to the east, Iron County to the south, and Ontonagon County to the west. The county has a total area of 1,072 square miles, and is mostly covered by forests and lakes. The county is home to the Huron Mountains, which are part of the Porcupine Mountains State Park. The county also contains the Keweenaw Bay, which is part of Lake Superior.
Economy
The economy of Baraga County is largely based on tourism and natural resources. The county is home to several state parks, including the Porcupine Mountains State Park, which attracts visitors from all over the country. The county is also home to several ski resorts, which attract visitors during the winter months. The county is also home to several logging and mining operations, which provide jobs for many of the county's residents.
Demographics
As of the 2010 census, the population of Baraga County was 8,860. The population is largely white, with 92.3% of the population identifying as white, and 4.3% identifying as Native American. The median household income in the county is $37,845, and the median age is 44.7 years. The county has a higher-than-average poverty rate, with 17.2% of the population living below the poverty line.
Conclusion
Baraga County is a rural county located in the Upper Peninsula of Michigan. The county is home to several state parks and ski resorts, and is largely dependent on tourism and natural resources for its economy. The population of the county is largely white, with a median household income of $37,845 and a median age of 44.7 years. The county has a higher-than-average poverty rate, with 17.2% of the population living below the poverty line.
Common Questions
What is the Total Population of Baraga County?
Total Population of Baraga County is 8,245.
What is the Total Male Population of Baraga County?
Total Male Population of Baraga County is 4,572.
What is the Total Female Population of Baraga County?
Total Female Population of Baraga County is 3,673.
What is the Ratio of Males per 100 Females in Baraga County?
There are 124.48 Males per 100 Females in Baraga County.
What is the Ratio of Females per 100 Males in Baraga County?
There are 80.34 Females per 100 Males in Baraga County.
What is the Median Population Age in Baraga County?
Median Population Age in Baraga County is 46.5 Years.
What is the Average Family Size in Baraga County
Average Family Size in Baraga County is 2.8 People.
What is the Average Household Size in Baraga County
Average Household Size in Baraga County is 2.2 People.
What is Per Capita Income in Baraga County?
Per Capita income in Baraga County is $28,665.
What is the Median Family Income in Baraga County?
Median Family Income in Baraga County is $65,123.
What is the Median Household income in Baraga County?
Median Household Income in Baraga County is $51,911.
What is Income or Wage Gap in Baraga County?
Income or Wage Gap in Baraga County is 39.7%.
Women in Baraga County earn 60.3 cents for every dollar earned by a man.
What is Inequality or Gini Index in Baraga County?
Inequality or Gini Index in Baraga County is 0.46.
How Large is the Labor Force in Baraga County?
There are 3,148 People in the Labor Forcein in Baraga County.
What is the Percentage of People in the Labor Force in Baraga County?
44.8% of People are in the Labor Force in Baraga County.
What is the Unemployment Rate in Baraga County?
Unemployment Rate in Baraga County is 4.9%.